Abstract
Disruptions in multimodal transportation networks can lead to significant damage and loss, affecting not only the networks’ efficiency but also their sustainability. Given the size, dynamics, and complex nature of these networks, it is essential to understand and enhance their resilience against disruptions. This not only ensures their functionality and performance but also supports sustainable development by maintaining equitable service across various communities and economic sectors. Therefore, developing efficient techniques to increase the robustness and resilience of transportation networks is crucial for both operational success and sustainability. This research introduces a multicriteria mixed integer linear programming (MCMILP) model aimed at enhancing the resilience and performance of multimodal–multi-commodity transportation networks. By ensuring effective distribution of commodities, alongside a cost-efficient distribution strategy in the wake of disruptive events, our model contributes significantly to sustainable transportation practices. The proposed MCMILP model demonstrates that integrating equality considerations while seeking a cost-efficient distribution strategy significantly mitigates the impact of disruptions, thereby bolstering the resilience of multimodal transportation networks. To illustrate the capabilities of the proposed modeling approach, we present a case study based on the multimodal transportation network in Colombia. The results show a significant improvement in the number of nodes that satisfy their demand requirements with respect to other approaches based on reducing total unsatisfied demand and transportation costs.
1. Introduction
In this paper, we delve into the study of disruptions in multimodal commodity supply chain networks, focusing on the reductions in the supply chains’ capacity due to disruptions impacting the multimodal transportation networks. There has been a marked increase in interest over the last decade in managing risk and disruptions within infrastructure networks, especially transportation networks. Scholars have highlighted the importance of understanding how disruptive events influence the performance and functionality of transportation systems, particularly considering their multimodal and multi-commodity nature [1]. In the face of growing demands on global and national transportation systems, our study acknowledges the pivotal role of these networks in driving socio-economic development and enhancing quality of life. As disruptions become increasingly common, the resilience of these networks is paramount in sustaining economic growth and ensuring equitable access to essential services [2]. A key part of this understanding involves operating in a cost-efficient manner while meeting customer demands and maintaining the required service levels [3], which aligns with the principles of the sustainable development goals (SDGs), particularly those focusing on industry, innovation, and infrastructure (Goal 9) [4].
To further contextualize the significance of multimodal transportation networks within the global supply chain, it is essential to consider the legal frameworks that govern them. One of the cornerstone legal regulations is the United Nations Convention on International Multimodal Transport of Goods. This convention establishes a universal legal basis for the uniform operation of multimodal transport contracts, facilitating the efficient movement of goods across international borders by various transportation modes under a single contract. The adoption of United Nations standards and the utilization of modern information tools play a pivotal role in enhancing the efficiency of these transportation networks [5]. These standards are designed to ensure a high level of interoperability between different transportation modes and among the various stakeholders in the supply chain, from shippers to carriers and customs authorities. The main goal of leveraging such standards and technologies is to enable a continuous and highly efficient exchange of data with minimal human interaction, thereby reducing the potential for errors and delays in the transport of goods. This approach not only streamlines operational processes but also contributes significantly to the resilience and sustainability of supply chains, aligning with the broader objectives of reducing environmental impact and promoting economic growth.
Multimodal transportation networks are highly vulnerable to disruptions, whether from natural hazards or human actions, which can significantly affect their performance and operations. Disruptions can range from impacting the flow capacity of roads, railroads, and other modes, to depleting the supply and operational capacities of key logistics nodes such as plants, warehouses, ports, and distribution centers. Notable examples include the 2000 fire at the Philips microchip plant in New Mexico [6], the 2011 Japan earthquake and tsunami, the 2020 COVID-19 pandemic, and the 2021 Suez Canal blockage. These events have had significant global impacts, affecting major companies and causing substantial losses in business reputations and revenues [7,8,9,10], underscoring the need for resilient supply chains that ensure sustainable economic growth and help reduce inequalities (Goal 10) [4].
Transportation makes up a significant portion of supply chain costs, often exceeding half of the total expenditure [11,12,13]. As a result, unplanned disruptions pose considerable operational and financial risks. Organizations are increasingly adopting multimodal transportation systems for their versatility in integrating various transit modes and expanding network capacity. These systems can be optimized using mixed integer linear programming (MILP) models to minimize total transportation and inventory costs, which is essential given the global trade trend towards diverse transit modes [14,15], contributing to more sustainable and efficient supply chains. Moreover, for supply chain managers and policymakers, maintaining efficient and resilient supply chains amid increasing disruptions is a significant challenge. Thus, developing versatile mathematical models to understand and mitigate the effects of disruptive events is crucial for devising cost-efficient strategies in multi-commodity transportation networks. Disruptions affect commodity demand satisfaction, leading to substantial unsatisfied demand and thereby impacting profits, market share, and company stock values. The costs of unsatisfied demand are considerable, including lost orders, penalties, cancellation costs, and the risk of losing customers.
This research addresses this issue by introducing a new strategy for multimodal–multi-commodity supply chain networks, filling a gap in the literature on transportation and supply chain performance post-disruption. We employ an effective distribution strategy across multiple transportation modes, aiming to democratize supply chain performance and increase output (customer satisfaction). We consider that equality in this context allows for more effective resource allocation during disruptions, aligning with SDG targets by ensuring equitable access to resources and services, thus contributing to reduced inequalities (Goal 10) and fostering innovation in supply chain resilience strategies.
In this study, we explore how a strategy that combines minimizing unsatisfied demand and transportation costs, while procuring equal flow of commodities to demand nodes that do not reach a minimum threshold of expected demand satisfaction, influences the performance of multimodal–multi-commodity supply chain and transportation networks following disruptions. This strategy was inspired by the principles of max–min fairness proposed in [16,17,18,19], with some key distinctions. On one hand, the proposed formulation seeks to maintain equal flow of commodities to nodes that do not reach their minimum demand satisfaction threshold, independently of their overall demands. Additionally, the proposed formulation incorporates transportation costs and penalty factors that enable the exploration of variations in the solutions. We present a detailed implementation of this formulation, considering limited link capacities, different service levels for customers, and the complexities of multimodal transportation network requirements. We focus on disruptions caused by reduced flow capacities and develop a novel mathematical model to mitigate their immediate impact.
This research significantly advances the field by developing a mathematical model aimed at enhancing distribution performance and reducing total transportation costs. Our model introduces an innovative perspective on handling supply chain and transportation vulnerabilities, particularly in multimodal–multi-commodity transportation settings. Our model, which consists of a mixed integer linear programming (MILP) framework, navigates beyond conventional MMF constraints. It is designed to address complexities such as connections’ (arc/link) capacity constraints in multimodal transportation networks, ensuring that customer service levels are maintained even in the face of disruptions that reduce these capacities. This research core contribution lies in presenting a novel, multicriteria mathematical model that not only strives to alleviate the immediate effects of disruptions on MCMMTN performance but also seeks to incorporate a fairness-oriented distribution strategy.
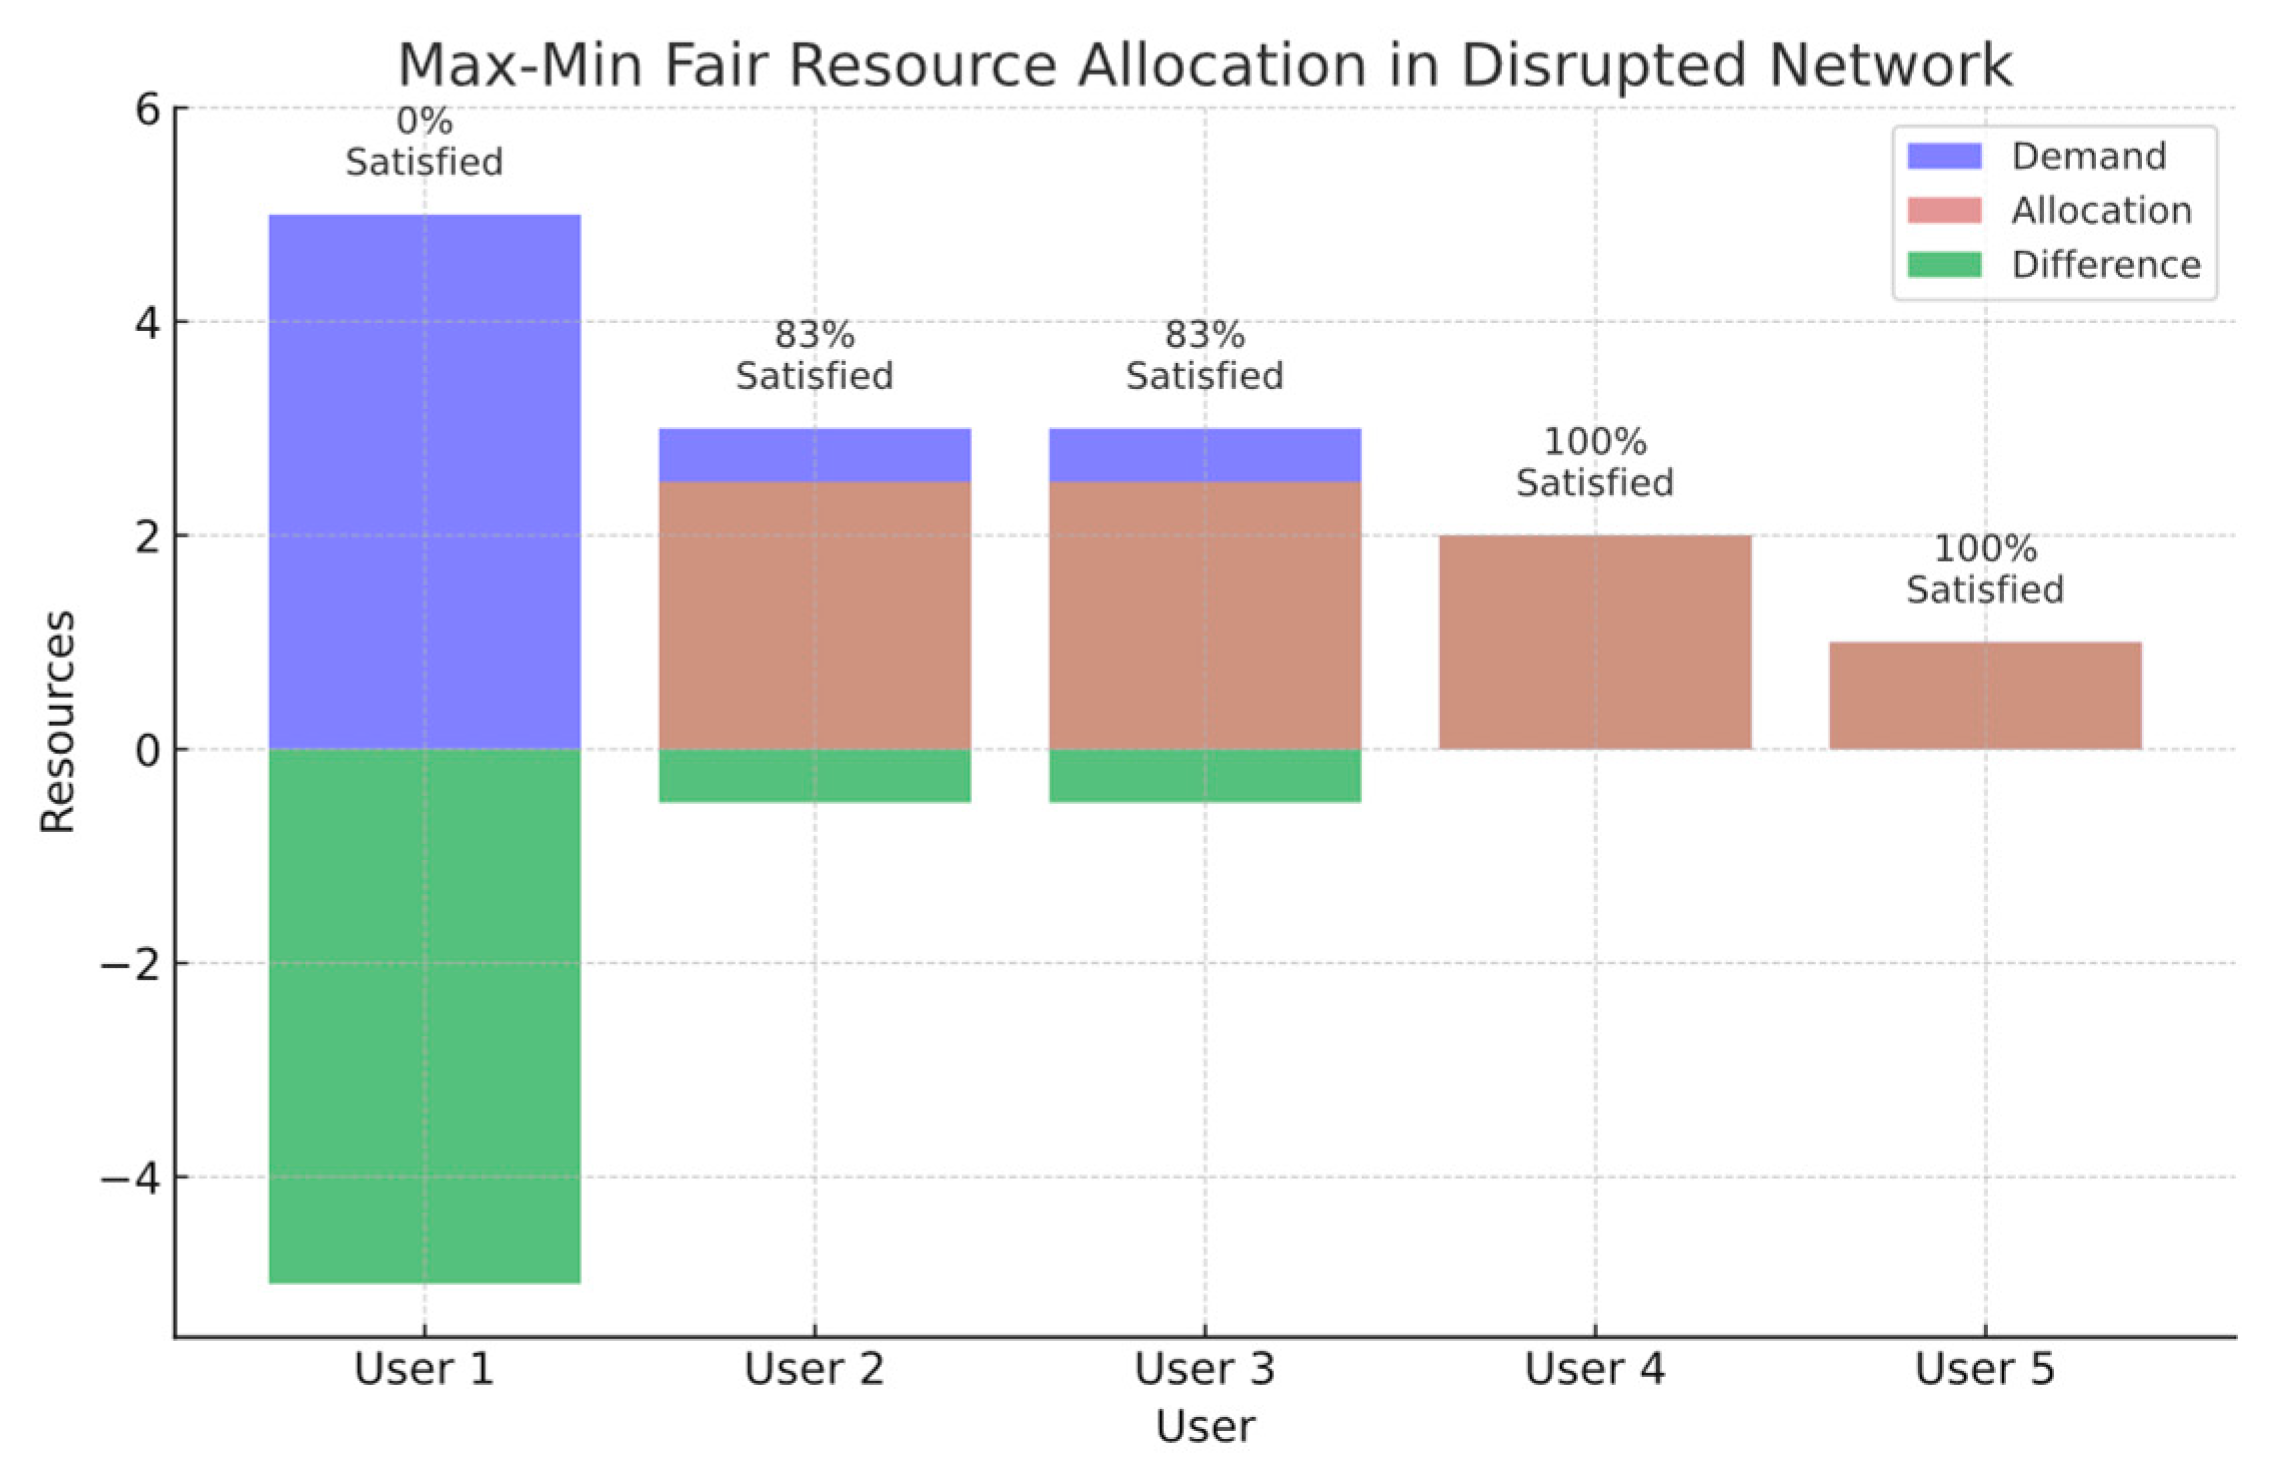
Figure 1 illustrates the max–min fairness strategy for allocating resources in disrupted multimodal transportation networks. ‘Demand nodes’ represent the locations where resources are required, and their size is proportional to their demand-to-capacity ratios. In Figure 1, the workings of the max–min fairness strategy within a specific disruption scenario are presented. This scenario impacts the network’s highest demand node, User 1, rendering it inaccessible. Figure 1 is designed to visually articulate how the max–min fairness strategy dynamically responds to such disruptions by ensuring an equitable redistribution of resources across the network.

Figure 1.
Max–min fairness-based distribution in a disrupted transportation network with unreachable demand node.
The figure is structured to present a comparative analysis of demand, allocation, and the resulting differences in resource distribution among users. Here we provide a breakdown of each element’s role in the scenario:
- Demand refers to the original resource aspirations of each user within the network, showcasing the initial distribution plan before the disruption.
- Allocation highlights how resources are redistributed following the disruption. Specifically, it shows the adjusted resource allocation intended to meet the minimum needs of the remaining users, following the principles of max–min fairness. This reallocation process prioritizes equitable access over the original demand hierarchy, ensuring resources diverted from the unreachable User 1 are judiciously redistributed.
- Difference captures the deviation between the original demand and the new allocation, providing a quantitative measure of the strategy’s impact on resource distribution. This component illustrates the shift towards a more equitable distribution model, ensuring that the disruption’s effects are mitigated by maximizing minimum satisfaction across the network.
The ‘user’ axis, ranging from one to four, maps out the network’s participants, illustrating the redistribution’s scope and impact. The upper part of the figure, delineating various satisfaction levels, is complemented by these three elements, offering a comprehensive view of the max–min fairness strategy’s application in managing and adapting to disruptions. This method contrasts sharply with demand-centric allocations, prioritizing a balanced and fair distribution seeking that no user is left without support, thereby showcasing its utility in managing resources efficiently and equitably in constrained or disrupted environments [20,21,22,23].
However, one of the most significant differences between a traditional max–min fairness approach and our model lies in how our model addresses nodes with unmet demand. Even though in many instances our approach may return a max–min fair solution, in some circumstances a max–min fairness approach would result in distributing different amounts of commodities to different nodes, even if they are not satisfying their minimum requirements. In contrast, our model adopts a strategy of distributing an equal or average amount of resources to demand nodes that do not reach their minimum requirements. Moreover, through the inclusion of transportation costs and considerations related to relaxing some of its constraints, the proposed model allows for a more nuanced allocation of resources that may be preferable to supply chain managers and other stakeholders. Additionally, this approach may enable the network to respond to disruptions more effectively without being constrained by the limitations of max–min fairness. This may also help to mitigate the risk of over allocating resources to certain nodes at the expense of others, which could result in perceived unfairness among nodes that did not have their requirements satisfied.
To address the challenges posed by disruptions in multimodal transportation networks, our research extends existing work by introducing a new strategy tailored for multimodal and multi-commodity transportation scenarios. Ref. [24] examined fairness to improve supply chain performance post-disruption. However, their study was limited to single-mode transportation and focused solely on unmet demand deviations as a measure of fairness. Our work aims to fill this gap by employing a distribution strategy that, while inspired by max–min fairness, is adapted to multiple modes of transportation. This strategy seeks to ensure effective distribution by first satisfying the aspirations across various metrics, such as link capacities at the demand nodes and their demand service levels, for a subsequent equal distribution of potential remaining resources among nodes not fully satisfied. We hope that this adapted approach in a multimodal–multi-commodity context enables decision-makers to more effectively allocate resources during disruptions, potentially leading to improved customer satisfaction. Unlike traditional approaches that relied on iterative methods such as subgradient optimization or Lagrangian relaxation, this model provides a direct path to achieving a balanced distribution, optimizing both the equitable allocation of resources among nodes with unsatisfied requirements and the cost-effectiveness of the transportation network. It adeptly handles intricate commodity flow networks, involving multiple suppliers, a range of demanders, and diverse commodities, all within a multimodal transportation framework.
This paper contributes significantly to the field by exploring how the principles of distribution strategies can enhance the resilience and efficiency of multimodal transportation networks within the constraints of these international regulations and standards. Our work is directly related to the operational and strategic facets underscored by the United Nations Convention on International Multimodal Transport of Goods [5]. By developing a novel multicriteria mixed integer linear programming (MCMILP) model, we aim to optimize the distribution of commodities across multimodal transportation networks, ensuring that these systems can operate smoothly across borders in compliance with the established legal framework.
The rest of this paper is organized as follows: Section 2 presents a detailed literature review, focusing on the following: The impact of disruptions and the explored mitigation strategies to improve the performance of multimodal–multi-commodity transportation networks. Section 3 details the proposed multimodal–multi-commodity transportation network model (MCMMSCN), including associated assumptions and mathematical formulations. Section 4 presents an illustrative case study of Colombia’s multimodal transportation (road, rails) and multi-commodity flow networks. Section 5 explains the Conclusion and the possible future work.
2. Literature Review
Commodity flow networks are traditionally engineered to function under regular operational conditions, typically not accounting for decisions that could alleviate the impact of disruptions on underlying infrastructure. However, unanticipated disruptions in the physical structures of multimodal transportation networks can significantly degrade the performance of commodity flow systems. While these systems are generally resilient to routine stressors—which could be categorized as ‘internal loads,’ such as daily fluctuations in demand, or ‘external loads,’ such as minor weather events—their capacity can be overwhelmed by more severe, large-scale disruptions often described as ‘extreme external loads,’ like natural disasters or major geopolitical events [25]. Given the potential for these extreme circumstances to exceed system capacities and lead to catastrophic failures, it is imperative for decision-makers to employ immediate mitigation strategies during such disruptive events.
In the exploration of mitigation strategies for disruptions in multimodal transportation networks, our study employs a mixed integer linear programming (MILP) model, leveraging the structured and deterministic nature of linear programming (LP) to accurately represent and optimize the complex relationships and constraints within these networks. LP models are chosen for their precision in defining variable relationships and their adaptability to encompass a wide range of real-world logistical and operational challenges, including capacity limits and service level requirements.
Our methodology distinguishes itself by not following a sequential optimization of objectives aimed at achieving max–min fairness. Instead, it focuses on equally distributing resources among nodes that do not satisfy their minimum requirement thresholds, after considering each node’s capacity and demand. This approach departs from prioritizing nodes based on the least allocation (max–min fairness) and instead aims to minimize the total transportation costs while striving to meet as much demand as possible under given constraints. By doing so, it ensures a balanced resource distribution, enhancing the network’s resilience to disruptions. This method reflects a strategic decision-making process within supply chain management, emphasizing the efficient allocation of resources to maintain service levels across the network.
This methodology underscores the complexity of decision-making in supply chain management and contributes a novel perspective to the literature on optimizing multimodal transportation networks. By detailing our approach, we aim to offer a clearer understanding of how integrating a fairness-inspired strategy with the goal of unbiased resource distribution can enhance both the resilience and efficiency of these networks, thus enriching the field of transportation and supply chain management.
Impact of Disruptions and Mitigation Strategies
Researchers have recently widely explored the impact of disruptions on commodity flow networks caused by human actions or natural disasters. For instance, Ref. [1] evaluated the impact of over 3500 disasters on more than 100,000 firm-year observations over 15 years. The study results demonstrate that disruptions have a significant negative correlation with operating cash flow (OCF) for businesses, clearly explaining the adverse financial effect of disruptions on commodity flow networks. Ref. [26] emphasize the enormous influence of Superstorm Sandy (2012) on several infrastructure networks involving power, road transportation network, and the gasoline supply chain. Even though Sandy was not a highly severe storm event regarding wind speed and rainfall volume, the impact was massive, especially in the US, where fuel shortages affected a wide area of the East Coast for several days. Furthermore, the transportation networks were nearly destroyed, and water levels covered the metro tunnels completely. Total direct repairs and restoration losses were reported at around USD 32.8 billion in New York. Other significant instances include the 2000 fires at the Philips microchip facility in New Mexico, the 2011 earthquake and tsunami in Japan, the COVID-19 pandemic in 2020, and the blockage of the Suez Canal in 2021, which had profoundly influenced the global stage, leading to major disruptions in leading corporations and resulting in considerable damage to business reputations and financial returns. These occurrences highlight the critical importance of building robust supply chains to mitigate such impacts [7,8,9].
Mitigation strategies are cornerstones to prevent significant losses due to disruptions that can occur in commodity flow networks. For instance, in some studies, mitigation strategies are oriented to predict the disruption effects in the commodity transportation network as integrated sourcing decisions that require pre-disruption plans. Ref. [27] established a methodology to assist in finding the optimal number of providers in a network to mitigate the impact of disruptions in the supply chain network. Ref. [28] have developed a mixed integer nonlinear programming model that determines the order allocation by considering different capacities, failure probabilities, and quantity discounts for each supplier. Also, the backup supplier is a strategy that researchers have explored as a pre-disruption mitigation plan. Ref. [29] have highlighted the importance of this mitigation strategy by studying a contract between a backup supplier and buyer if the primary supplier is experiencing a disruptive event. The effective decisions of the contract participants are calculated by a consecutive optimization procedure using an expected profit function.
Moreover, diverse scholars have worked on evaluating the resilience of commodity transportation networks under uncertainty during and after disruptions. Ref. [30] proposed an interpretive structural modeling technique used to create a model based on graph theory that considers all of the primary drivers of resilience and their interdependencies that quantify resilience. Quantifying resilience after disruptions will assist firms in determining the efficacy of various risk mitigation approaches. Ref. [31] studied the impact of disruptions in the commodity transportation network under the uncertainty of demand and supply while applying embedded mitigation strategies. The authors have integrated all the plans of manufacturing and procurement to design an effective commodity flow network model. Ref. [32] developed a supply chain network with multiple products flowing in the network. The authors considered different cases of disruption, including disruptions in demand, supplied resources, and the limited capacity for the transportation method. The model was designed to minimize the operational cost and the total investment as a mitigation strategy to improve the supply chain performance. Ref. [33] proposed a simulation-based study to assess commodity-based transportation’s resiliency during disruptive events. The significant findings indicated that enhancing resources that facilitate better coordination and collaboration may lead to a more resilient network. Additionally, Ref. [34] explored the impact of fluctuations in demand and supply due to disruptions on the performance of the commodity flow network. The results of their study underscore the critical role of resilience in supply chain transportation networks. Specifically, a resilient network positively influences supplier capacity, thereby optimizing the performance of the commodity flow network. This resilience is not only crucial for operational efficiency but also has implications for the network’s environmental and social performance. The necessity for such mitigation strategies becomes even more pronounced given that disruptive events can occur either within the commodity flow network or in the broader multimodal transportation networks.
Multimodal transportation systems are designed to operate in predictable conditions. The high dependency on the different modes of transportation makes other dependent supply chain networks vulnerable to any disruptive event in the transportation network. Therefore, developing strategies to mitigate disruptions in multimodal transportation networks becomes more vital to prevent the failure of all the dependent systems. In this context, Ref. [35] proposed a novel large-scale multimodal transportation recommendation system, which employs feature engineering and graph-embedding techniques to improve route planning and optimization in various scenarios. This system could potentially offer more resilient alternatives in case of disruptions. Ref. [36] investigated the multimodal network design problem (MMNDP), aiming to optimize the auto network expansion scheme and bus network design scheme in an integrated manner. The authors formulated the problem as a single-level mathematical program with complementarity constraints (MPCC) and used an active-set algorithm to deal with the MPCC. Their approach addresses the congestion interaction among different travel modes and contributes to the development of a well-designed multimodal network.
Similarly, Ref. [37] analyzed the impact of disruptions on multimodal transportation networks using a micro-simulation model. The outcomes provide crucial decision assistance for transportation network planners and operators to reduce the infrastructure vulnerability and, thus, become more financially sustainable by allocating the most critical links in the networks. Ref. [38] explored the effects of transportation network disruptions on the commodity flow network performance and described alternative mitigating methods. The authors evaluated four mitigation methods: risk acceptance strategy, route flexibility, redundancy in the inventory level, and the combination between route flexibility and redundant inventory strategies [38]. To examine the effectiveness of the proposed model, the findings of the evaluated mitigation methods are compared in terms of service level and total costs. The increasing volume of research in this domain underscores the significance of addressing disruptions in multimodal transportation networks and presents diverse mitigation strategies. In the following paragraph, we examine the various ways in which disruptions have been characterized in different studies, as well as the consequences they have on network performance. Several studies that address disruption in multimodal transportation networks have clearly described the type of disruption, given that each disruption has a different effect on the network’s performance. Some researchers described disruption as an incident involving a transportation mode’s unavailability in a link between a pair of nodes that lead to a series of network failures that can decrease the performance of a network e.g., [37,39,40,41,42]. Also, disruption is explained as a disaster caused by natural events (hurricanes, landslides, storms, and earthquakes) or human-made events that occur in one or more components of the multimodal chain and may cause a disruption in previously planned transportation activities (e.g., [43,44]). Some studies specified disruption as an unexpected disturbance that occurs either during the production process/capacity or during delivery [45]. However, in our study, we design a MCMILP model formulated to effectively handle disruptions impacting the capacity of links, ensuring operational resilience in the face of such challenges. This model is highly flexible in dealing with the nature of disruptions. Additionally, in the proposed MCMILP model, the term ‘transportation modes for a commodity’ is not merely a list but refers to the set of all feasible transportation options—such as road, rail, air, and sea—that can be employed for moving a specific commodity. This nuance further enhances the robustness and flexibility of the supply chain in the face of disruptions.
Despite the extensive research on improving resilience and mitigating disruptions in commodity flow networks, there remains a critical gap in models that holistically address the efficiency, robustness, and adaptability of multimodal transport networks. This observation underscores the need for innovative approaches that not only mitigate the immediate impacts of disruptions but also ensure the long-term sustainability and fairness of the transportation network. This gap motivates our development of MCMILP model, uniquely tailored to enhance network resilience while ensuring equitable and cost-effective distribution of commodities. Our model seeks to bridge this gap by providing a comprehensive solution that accounts for the complexities of multimodal–multi-commodity transportation networks, offering a novel approach to tackling the challenges posed by disruptions.
This research explains our approach designed to mitigate the adverse effects of disruptions within multimodal–multi-commodity transportation networks, aiming to enhance the resilience and efficiency of the supply chain network. Our strategy involves optimizing commodity distribution while accounting for constraints such as link capacities, demand requirements, and service level targets. These factors serve as key decision variables in our formulation, guiding the equitable and effective allocation of resources across the network.
To summarize our contribution, this work significantly advances the domain of multimodal–multi-commodity transportation networks through the formulation of a model that emphasizes aspects of cost-efficiency and resource allocation performance. Our methodology is tailored to address the intricate needs of various economic sectors and communities, particularly in the aftermath of diverse disruptions. Unlike conventional models that prioritize either cost or reliability, our approach uniquely balances these considerations within a framework that does not aim to provide an exact solution for max–min fairness but rather ensures practical resource distribution through an average flow strategy to nodes not fully satisfied. This adaptation significantly enriches the fields of supply chain management and transportation planning, offering a robust solution to supply chain and transportation disruptions and addressing the complexities of modern supply chains networks.
3. Max–Min Fairness-Inspired Model
This section introduces the (max–min fairness-inspired) approach in a multimodal–multi-commodity transportation networks model, a framework developed to manage resource distribution within multimodal and multi-commodity transportation networks after disruptions. The model strategically navigates between cost-efficiency and a fairness-inspired approach, aiming for an adaptable and pragmatic solution to resource allocation challenges. It acknowledges the trade-offs inherent in not seeking Pareto optimality, focusing instead on a practical balance that ensures operational continuity and satisfies a broad range of demand nodes to the extent possible under given constraints. The detailed formulation of the proposed model is presented below.
3.1. Model Definition
We assume a multimodal–multi-commodity transportation network with a set of nodes and arcs that contains a set of transportation modes to deliver a set of different commodities through a network with a set of supply nodes , set of demand nodes , and set of transshipment nodes . This study aims to design a model that ensures the fair distribution of resources among demand nodes to mitigate the impact of disruptions. The following model is structured to deal with disruptions affecting the capacity of multimodal transportation, mainly affecting the multi-commodity flow through the supply chain network. The associated sets, parameters, and decision variables utilized in the proposed model are detailed below.
3.1.1. Sets
| The set of all nodes in the network. | |
| The set of all arcs in the network, where (i, j, ) ∈ A. | |
| The set of all commodities. | |
| M | The set of transportation modes utilized for commodity delivery in the network. |
| The set of all supply nodes for commodity . | |
| The set of all demand nodes for commodity . | |
| The set of all transshipment nodes for commodity . |
3.1.2. Parameters
| The upper capacity of the arc (i, j, ) ∈ A for commodity l ∈ L. | |
| The available supply of commodity l ∈ L at the supply node i ∈ . | |
| The demand for commodity l ∈ L at node j ∈ . | |
| Flow cost per mile of using the arc (i, j, ) ∈ A for commodity l ∈ L. | |
| Cost of excess supply at node i ∈. | |
| Cost of unmet demand at node j ∈. | |
| Closure status of the link (i, j, ) ∈ A otherwise). | |
| Penalizes uneven distribution between fully satisfied and unsatisfied demand nodes to promote equitable allocation. | |
| Minimum service level percentage at demand node j ∈ for commodity . | |
| Captures the minimum between the required service level value, the added capacity of incoming arcs, and the demand of the node j ∈. |
3.1.3. Decision Variables
| Amount of flow going through the arc (i, j, ) ∈ A for commodity . | |
| The total flow of commodity arriving at demand node j ∈ . | |
| A binary variable, if demand node j ∈ has all its minimum requirements satisfied; . | |
| Excess supply at node i ∈ for commodity . | |
| Unmet demand at node j ∈. | |
| Allocation disparity for commodity between fully served and underserved nodes. | |
| Linearization of . | |
| Linearization of . | |
| . | |
| . | |
| . | |
| ; = 0. | |
| . | |
| . | |
| . |
3.2. Objective Functions
Objective Function (2) is strategically designed to fulfill two primary objectives. Firstly, it targets the minimization of excess supply across all commodities to guarantee efficient resource allocation. Furthermore, it integrates a penalty term aimed at narrowing the allocation gap between nodes that have satisfied their demand and those that remain partially served. This penalty term is specifically engineered to mitigate situations where some nodes achieve full demand satisfaction at the expense of others, thereby promoting a more balanced and equitable distribution of resources across the network.
The second objective (3) is to minimize the associated costs, including the flow cost of each commodity through modes of transportation (first term), the cost of unmet demand at each demand node for each commodity (second term), and the cost of excess supply at the supply node for each commodity (third term).
3.3. Constraints
The designed model considers multiple constraints related to disruptions’ impact, including (1) adaptive commodity allocation constraints (2) network flow constraints, (3) link capacities, (4) service level constraints, and (5) linearization constraints. Constraints (4), (5), and (6) represent the network flow balance constraints that calculate the flow leaving each node subtracted from the flow entering each node. The summation of these values should be equal to the amount of demand value if the node is a demand node, as presented in demand nodes , or equal to the available supply value if the nodes is a supply node . These constraints consider any possible unmet demand and excess supply by balancing the equations, respectively, with variables . Moreover, constraint (5) ensures the flow is balanced and equal to zero if the node is a transshipment node. Constraints (7) and (8) represent the upper and lower arc capacity that shows how much commodity flow can be delivered through the multimodal transportation network. The flow of each commodity using transportation modes must be less than or equal to the arc capacity. Note that the arc functionality is represented by the parameter () that is equal to one if the arc is functional and zero if not.
Constraint (9) connects commodity flow through the network and equality as it captures the flow distribution at each demand node with the decision variable .
Constraints (10)–(39) represent the core constraints of our MMFI model. Constraint (10) shows that the highest met demand cannot be greater than the average distribution of the value of the unmet demand, but it can be relaxed with () in case of reachability problems that prevent commodity flow from reaching the demand nodes. Constraint (11) captures the average of unmet demand values. Constraint (12) indicates if at least one demand node is not satisfied for every commodity, in which case ( takes the value of one.
Constraint (13) ensures that the flow of commodities to the demand nodes is no more than what is available at the supply nodes. Constraint (14) captures the highest demand node value that has been met, represented by (. Constraint (15) indicates that the variable capturing the met demand must be 0 unless the resources allocated are equal to the minimum. Constraint (16) enforces that the unmet demand node allocation of resources must be at least the average of the unmet demand allocation.
Constraint (17) represents the case where we do not satisfy the demand nodes with their minimum requirement; an equal number of resources is sent to the demand nodes whose minimum requirement is not satisfied.
Nonetheless, to establish this equitable distribution of resources on the constraint (17), multiple non-linearities arise due to the multiplicative interaction between variables. To linearize these interactions, we defined variables (product of . ), (product of ), (product of . ), (product of . ), (product of ), and (product of , whose respective linearization constraints are given from (18)–(40).
Constraints (41)–(54) represent the domain of the model decision variables:
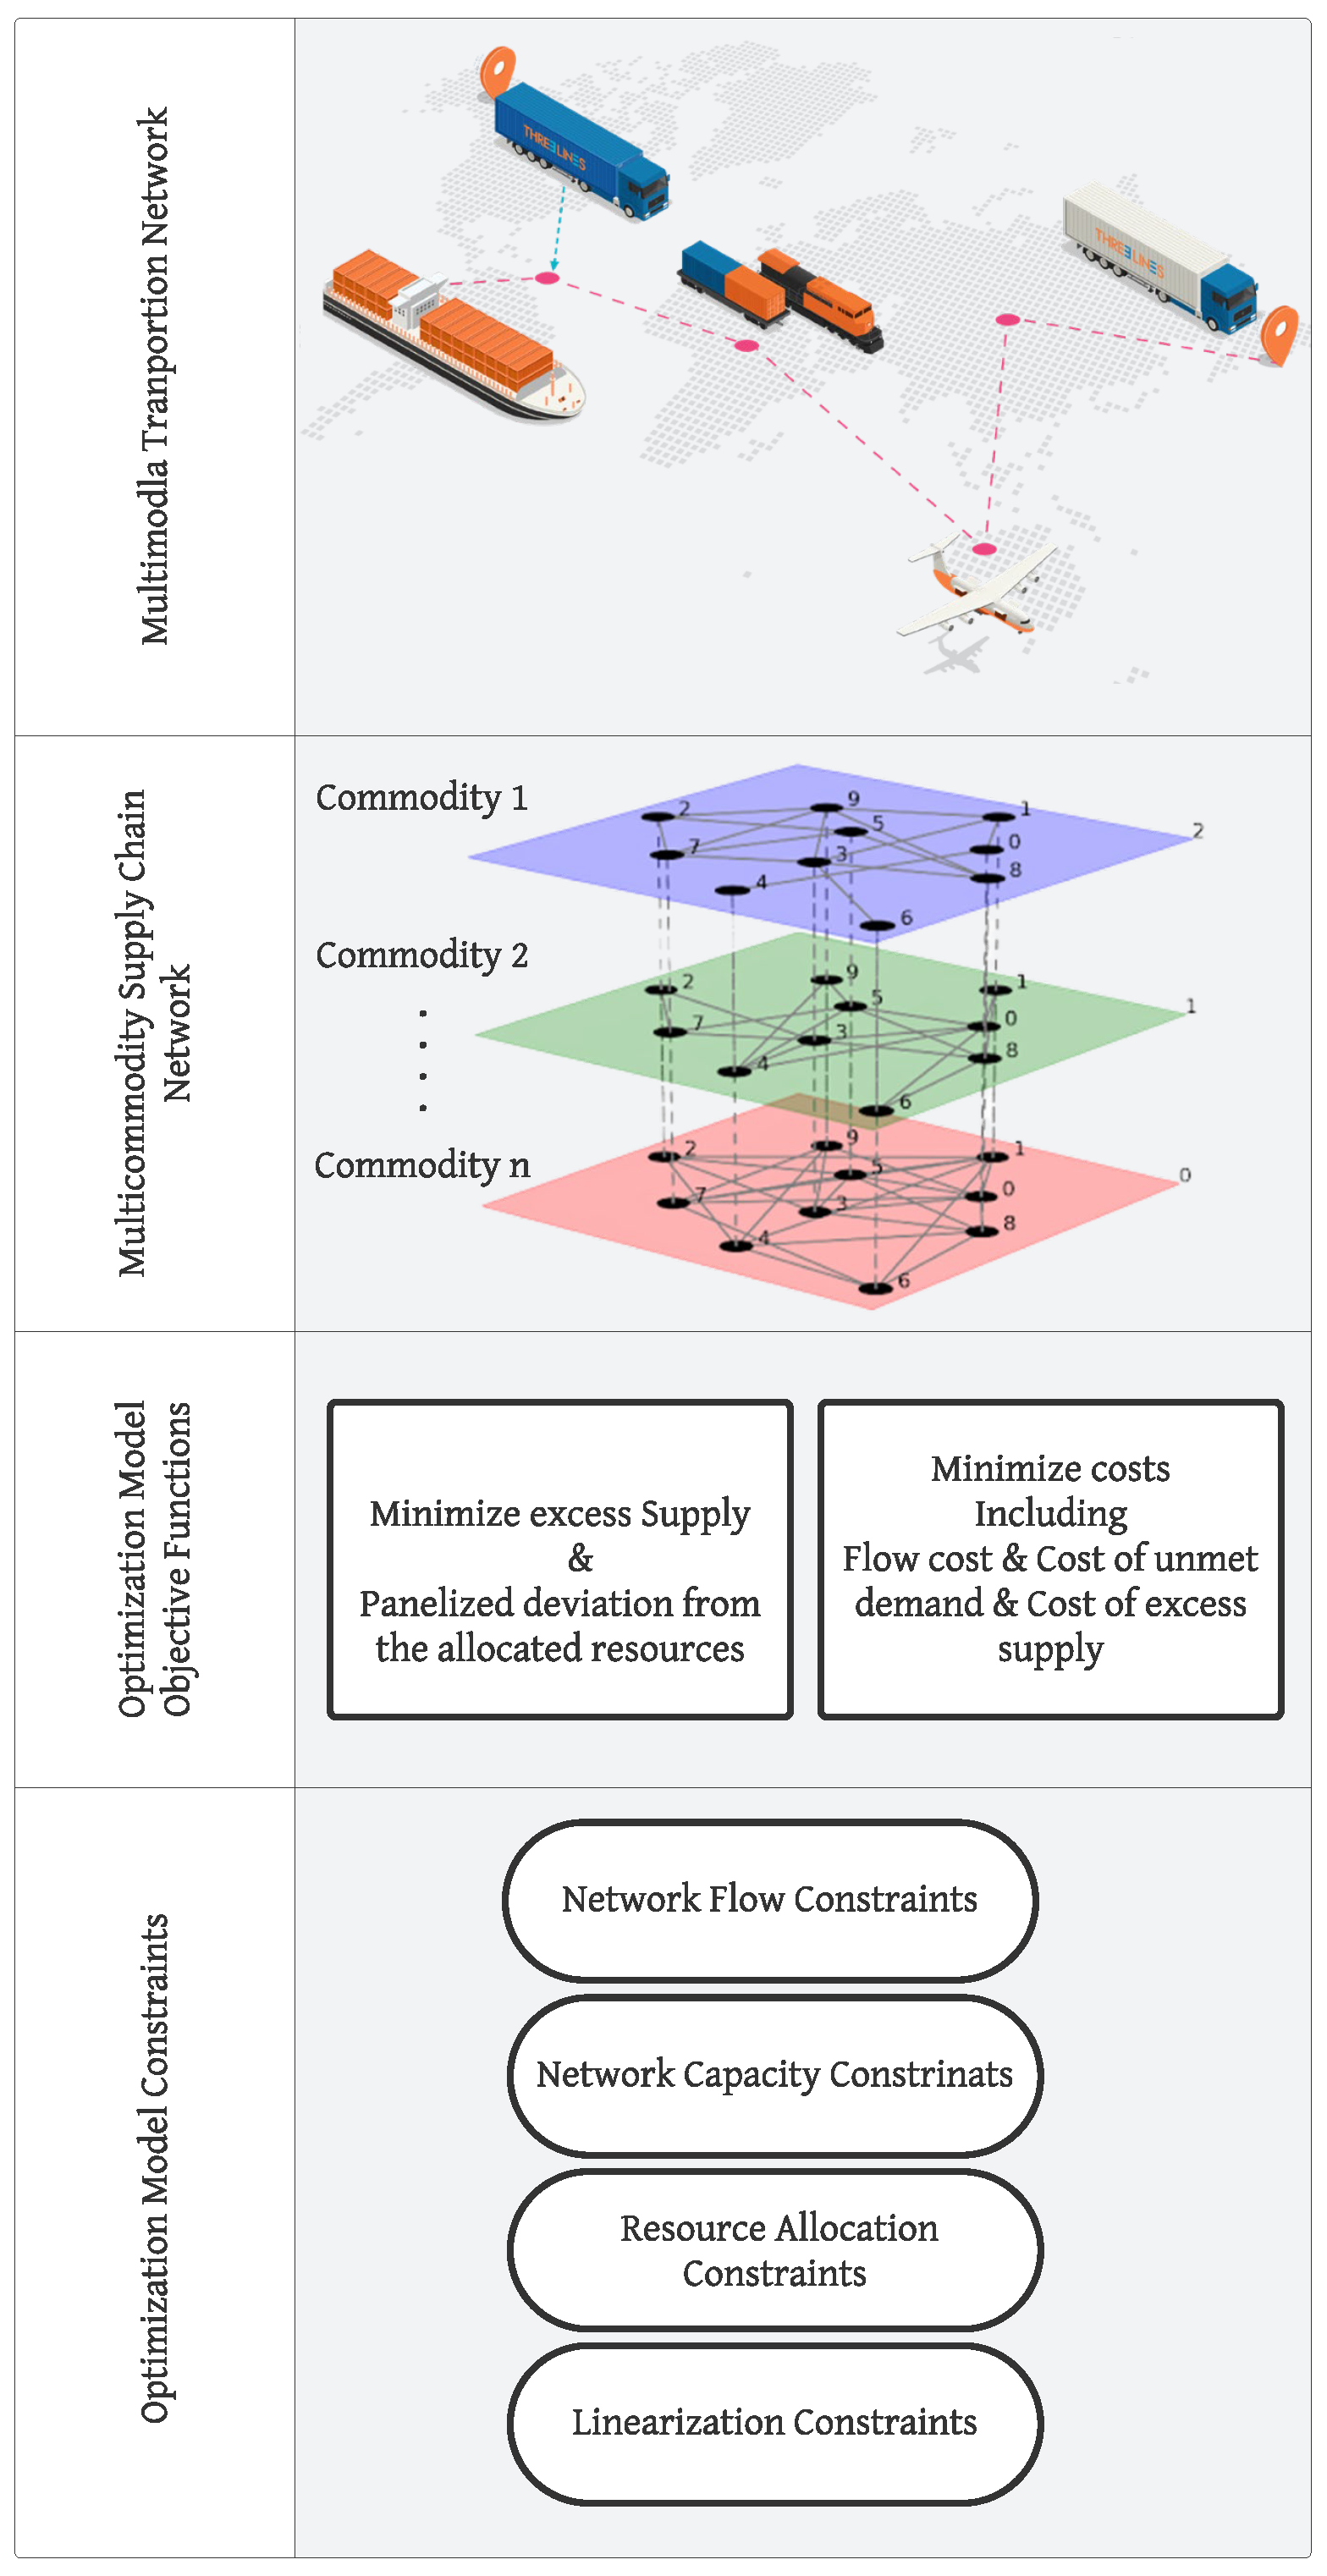
Figure 2 systematically highlights each step of the model, from its definition through to the setting of objective functions and constraints, and its application within. For each step, the schematic outlines the purpose, thereby offering a clear and concise visual summary of the model’s workflow and its key components.
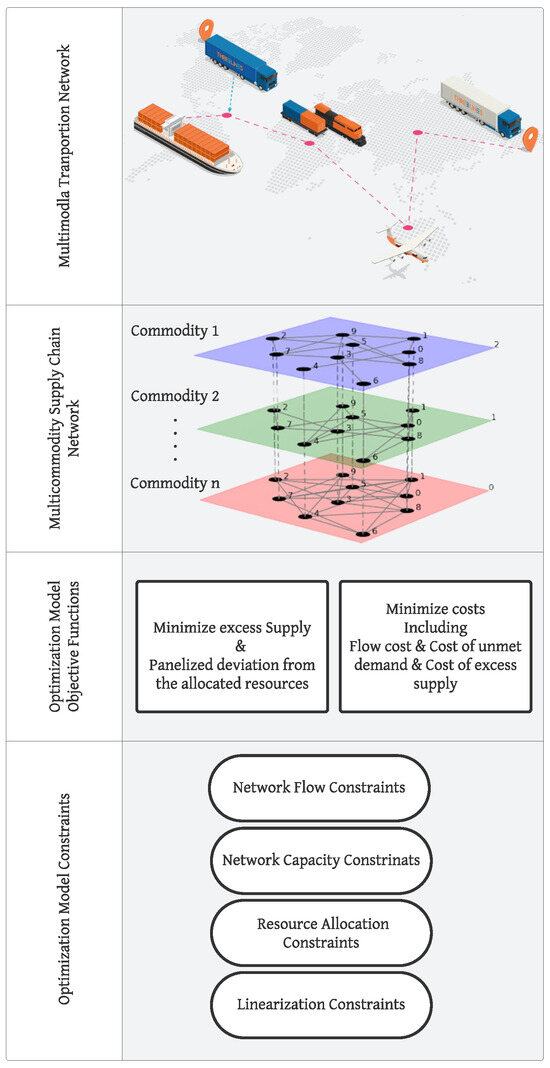
Figure 2.
Schematic overview of the MMFI Strategy model implementation steps in multimodal–multi-commodity transportation networks.
4. Illustrative Case Study
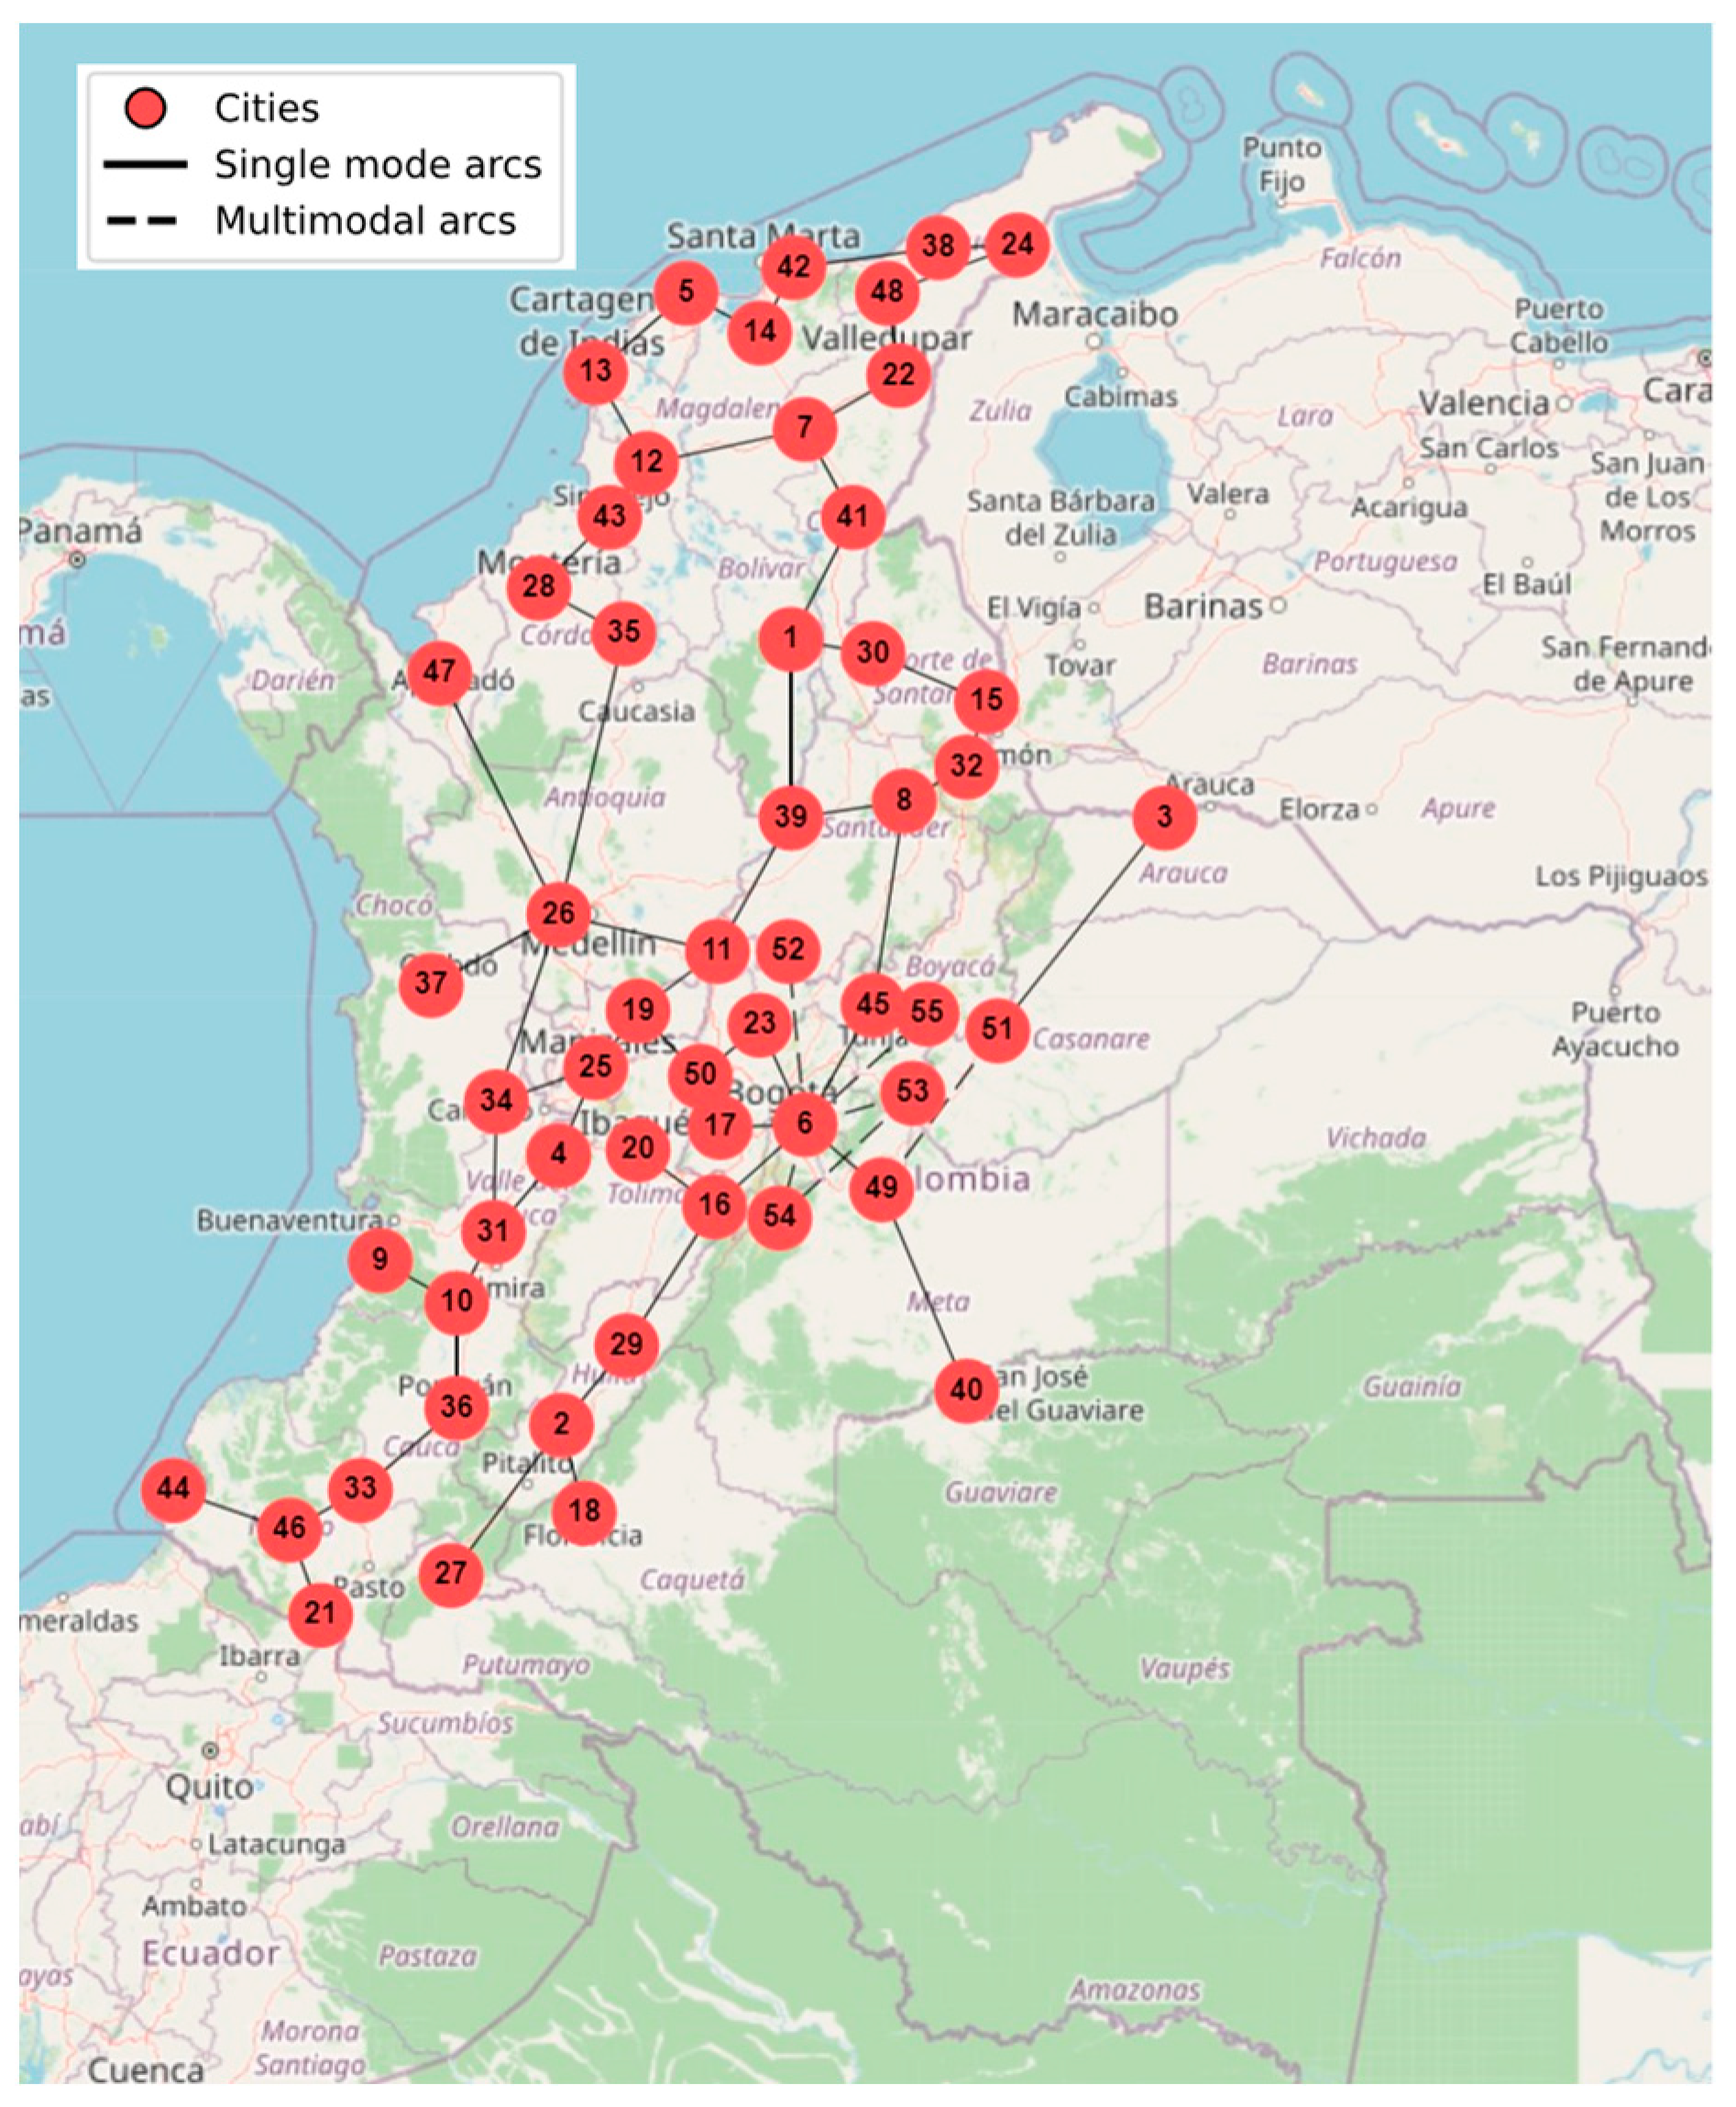
The network addressed in our case study is the Colombia freight flow and transportation infrastructure network. We consider two modes of transportation to distribute commodities throughout the network: trucks (roadways) and rails (railways). Most of the cities in Colombia tend to have few railways and highways connecting each other, increasing the isolation impact in case of disruptions. Colombia’s transportation infrastructure is particularly sensitive to weather-related disturbances, notably floods and landslides, which often disrupt transportation services and affect infrastructure utilization and performance.
The node representation of the Colombian transportation network used in this case study depicts the largest cities in the country. The network used consists of 55 nodes and 62 undirected arcs (124 directed arcs). The arcs reflect the multimodal transportation highways and railways that connect them. Figure 3 illustrates the multimodal transportation network of Colombia for the modeled network, showing the cities and the type of arcs connecting them.
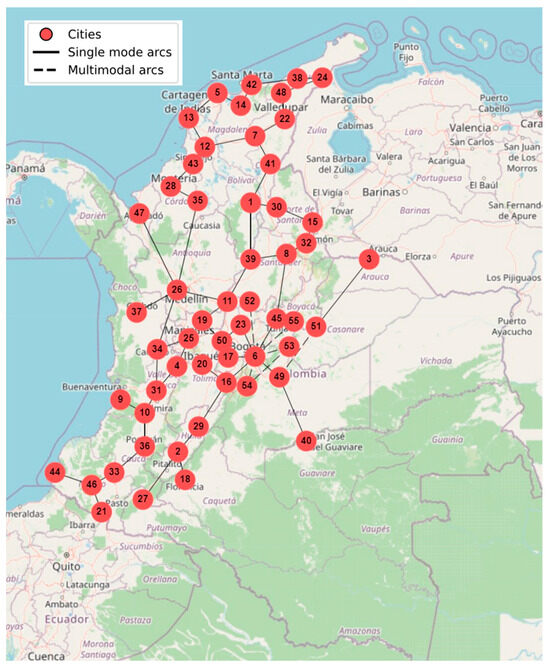
Figure 3.
The transportation network of Colombia.
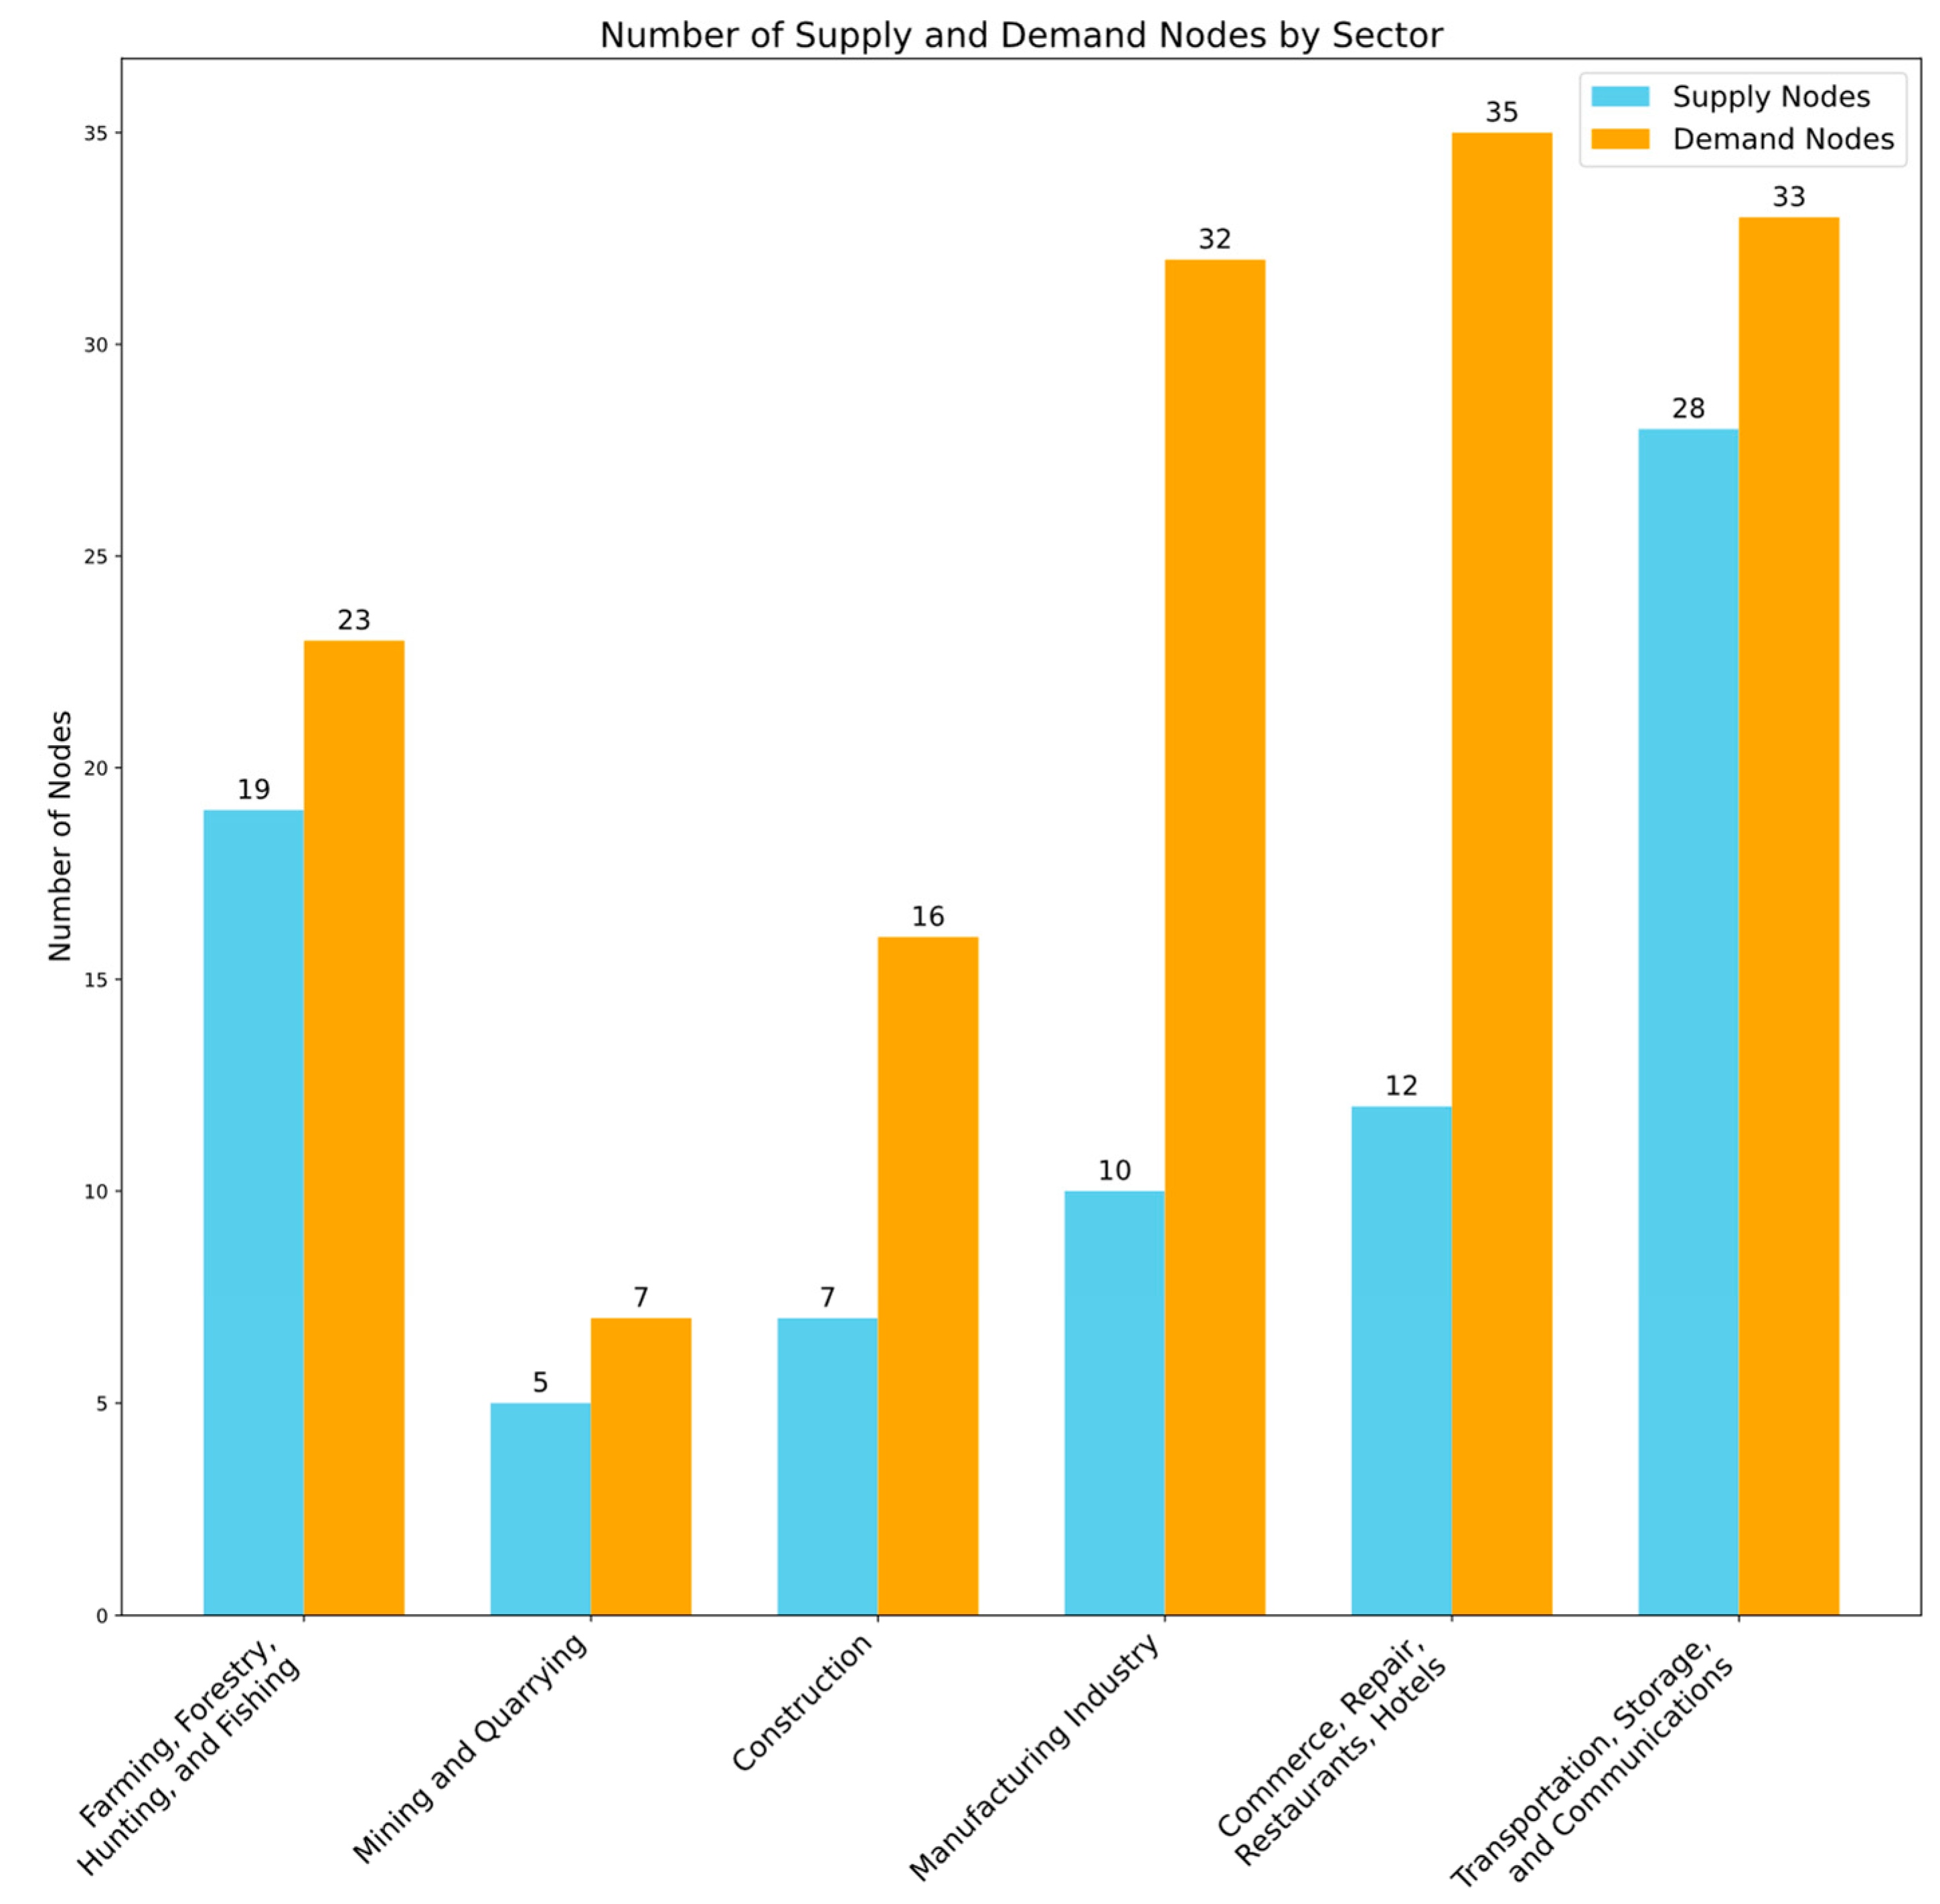
The product transportation data used represents the primary commodities consumed in Colombia by different economic sectors. The flow of commodities considers a total of 258 products going through the supply chain network, aggregated into six main economic sectors. Figure 4 illustrates the associated main sectors and the total number of supply and demand nodes for each sector in the network.
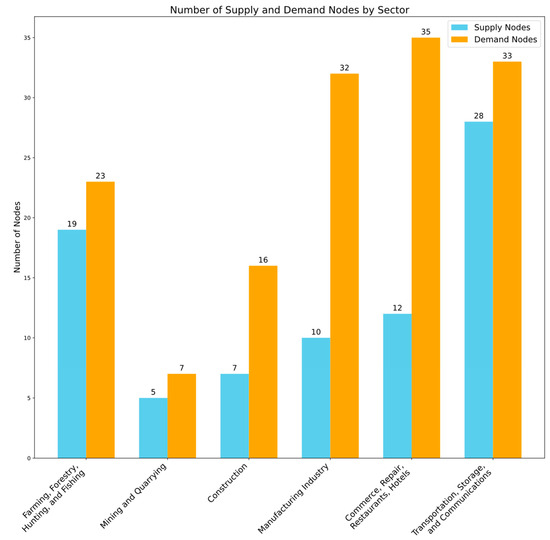
Figure 4.
The total number of supply and demand nodes for each sector in Colombia’s supply chain network.
In this illustrative case study, we analyze the impact of different disruption scenarios that affect the performance of the arcs in the Colombian multimodal transportation network while considering the multi-commodity flow through the network. The proposed model considers an MMFI strategy to ensure efficient distribution after disruptive events and simultaneously considers the limitation and requirements of the network, such as the link capacity, the amount of demand required, and the service level percentage. Moreover, we considered the variation of service levels at the demand nodes in each disruption scenario. Also, we measured the costs associated with the proposed model, including the flow cost, the cost of excess supply, and the cost of unmet demands.
To better understand the context of our study and the implications for multimodal transportation and equitable distribution, we detail the commodities represented within our study. These commodities, crucial to both our analytical framework and the broader economic landscape of Colombia, are as follows:
- Commodity 1 (Farming, Forestry, Hunting, and Fishing): This sector is vital for the Colombian economy, necessitating transportation solutions that are both timely and sensitive to the perishable nature of the goods. Efficient and reliable transportation modes are essential to maintain the quality of these products from their source to the end consumer.
- Commodity 2 (Mining and Quarrying): Characterized by the extraction of heavy and bulky materials, this sector highlights the need for transportation that prioritizes cost-efficiency and capacity. The strategic selection between trucks and trains is crucial to optimize costs and ensure the timely delivery of materials.
- Commodity 3 (Construction): The movement of construction materials requires the handling of heavy and bulky goods. This sector benefits from the network’s ability to accommodate such loads, often preferring road transport for its flexibility and direct access to construction sites.
- Commodity 4 (Manufacturing Industry): As a key component of industrial growth, this sector relies on a multimodal transportation network to facilitate the movement of a wide range of materials—from raw inputs to finished products. This underscores the need for a network that can adapt to diverse transportation requirements.
- Commodity 5 (Commerce, Repair, Restaurants, Hotels): This sector, encompassing services, necessitates the swift and reliable delivery of goods and supplies. The performance of the transportation network directly impacts service quality and business operations, emphasizing the importance of efficient logistical solutions.
- Commodity 6 (Transportation, Storage, Communication): Representing the infrastructure for economic activities, this sector underscores the importance of a continuous flow and storage of goods, alongside robust communication services. The efficiency of this sector is foundational to the functioning of the entire supply chain network.
4.1. Results
This study examined an MMFI model using multiple link disruption scenarios. Also, we explored disruption scenarios at four different disruption percentages, including the case of no disruption (0%, 5%, 10%, and 20%), to study the effects of varying disruption levels on the network (minor, moderate, and significant disruptions). The disrupted links were simulated for three hundred randomly generated scenarios at each disruption level.
To demonstrate the application of the developed model, we have considered the flow of the different commodities in the Colombian network while having two modes (trucks and trains) to transport commodities through the network. After generating the disruption scenarios, we studied the impact of disruption on the network performance at the different levels of disturbance. The satisfaction of the demand nodes is decided based on meeting the minimum value between the requirements at each demand node. The demand node could be considered satisfied if it received at least the minimum amount between the total incoming capacity, service level, or the required demand at that demand node. The first objective function contributes to the MMFI model by minimizing the excess supply for all commodities and the allocation gap between nodes that have satisfied their demand and those that remain partially served.
On the other hand, the model considers a cost-efficient strategy while ensuring efficient distribution among demand nodes. To illustrate the performance of our model and improve the distribution with our MMFI model after disruptive events, we have solved the problem of minimum cost flow for the Colombian network without considering MMFI when distributing commodities. Then we run our model considering the MMFI objective functions and constraints to show improvement in satisfying the demand nodes for each sector in the model considering both cases (with and without the MMFI strategy) and different disruption levels.
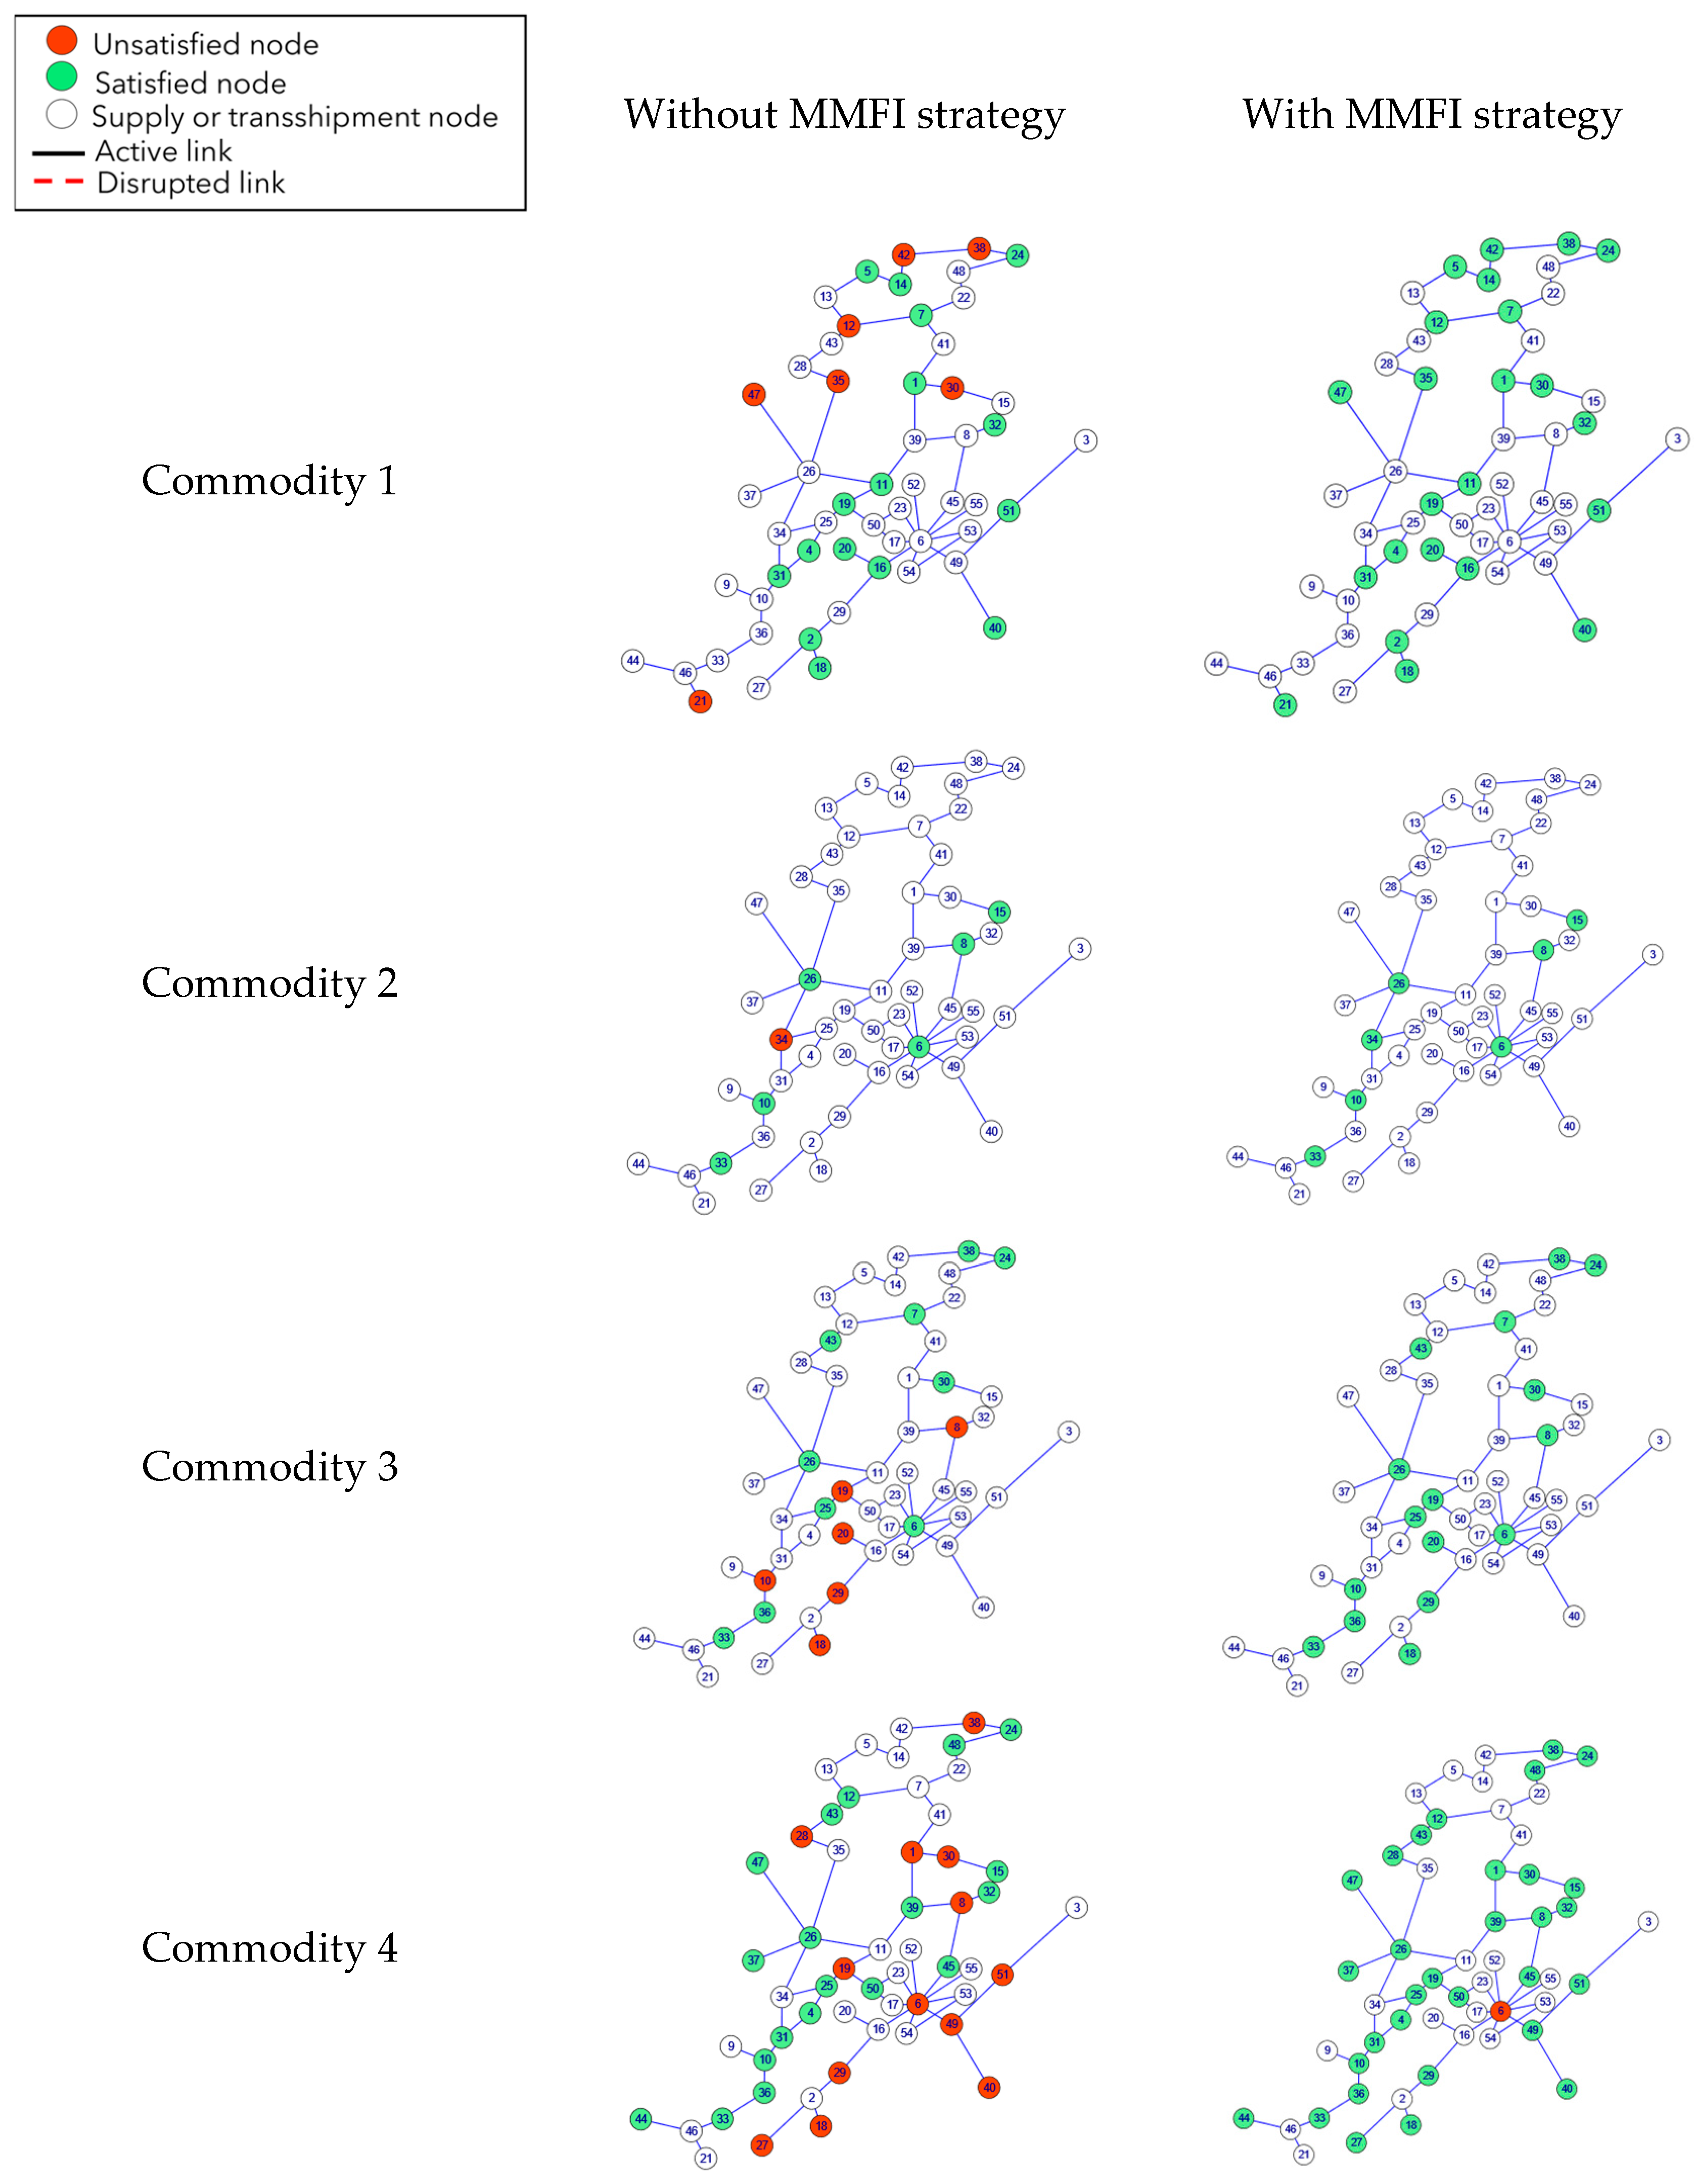
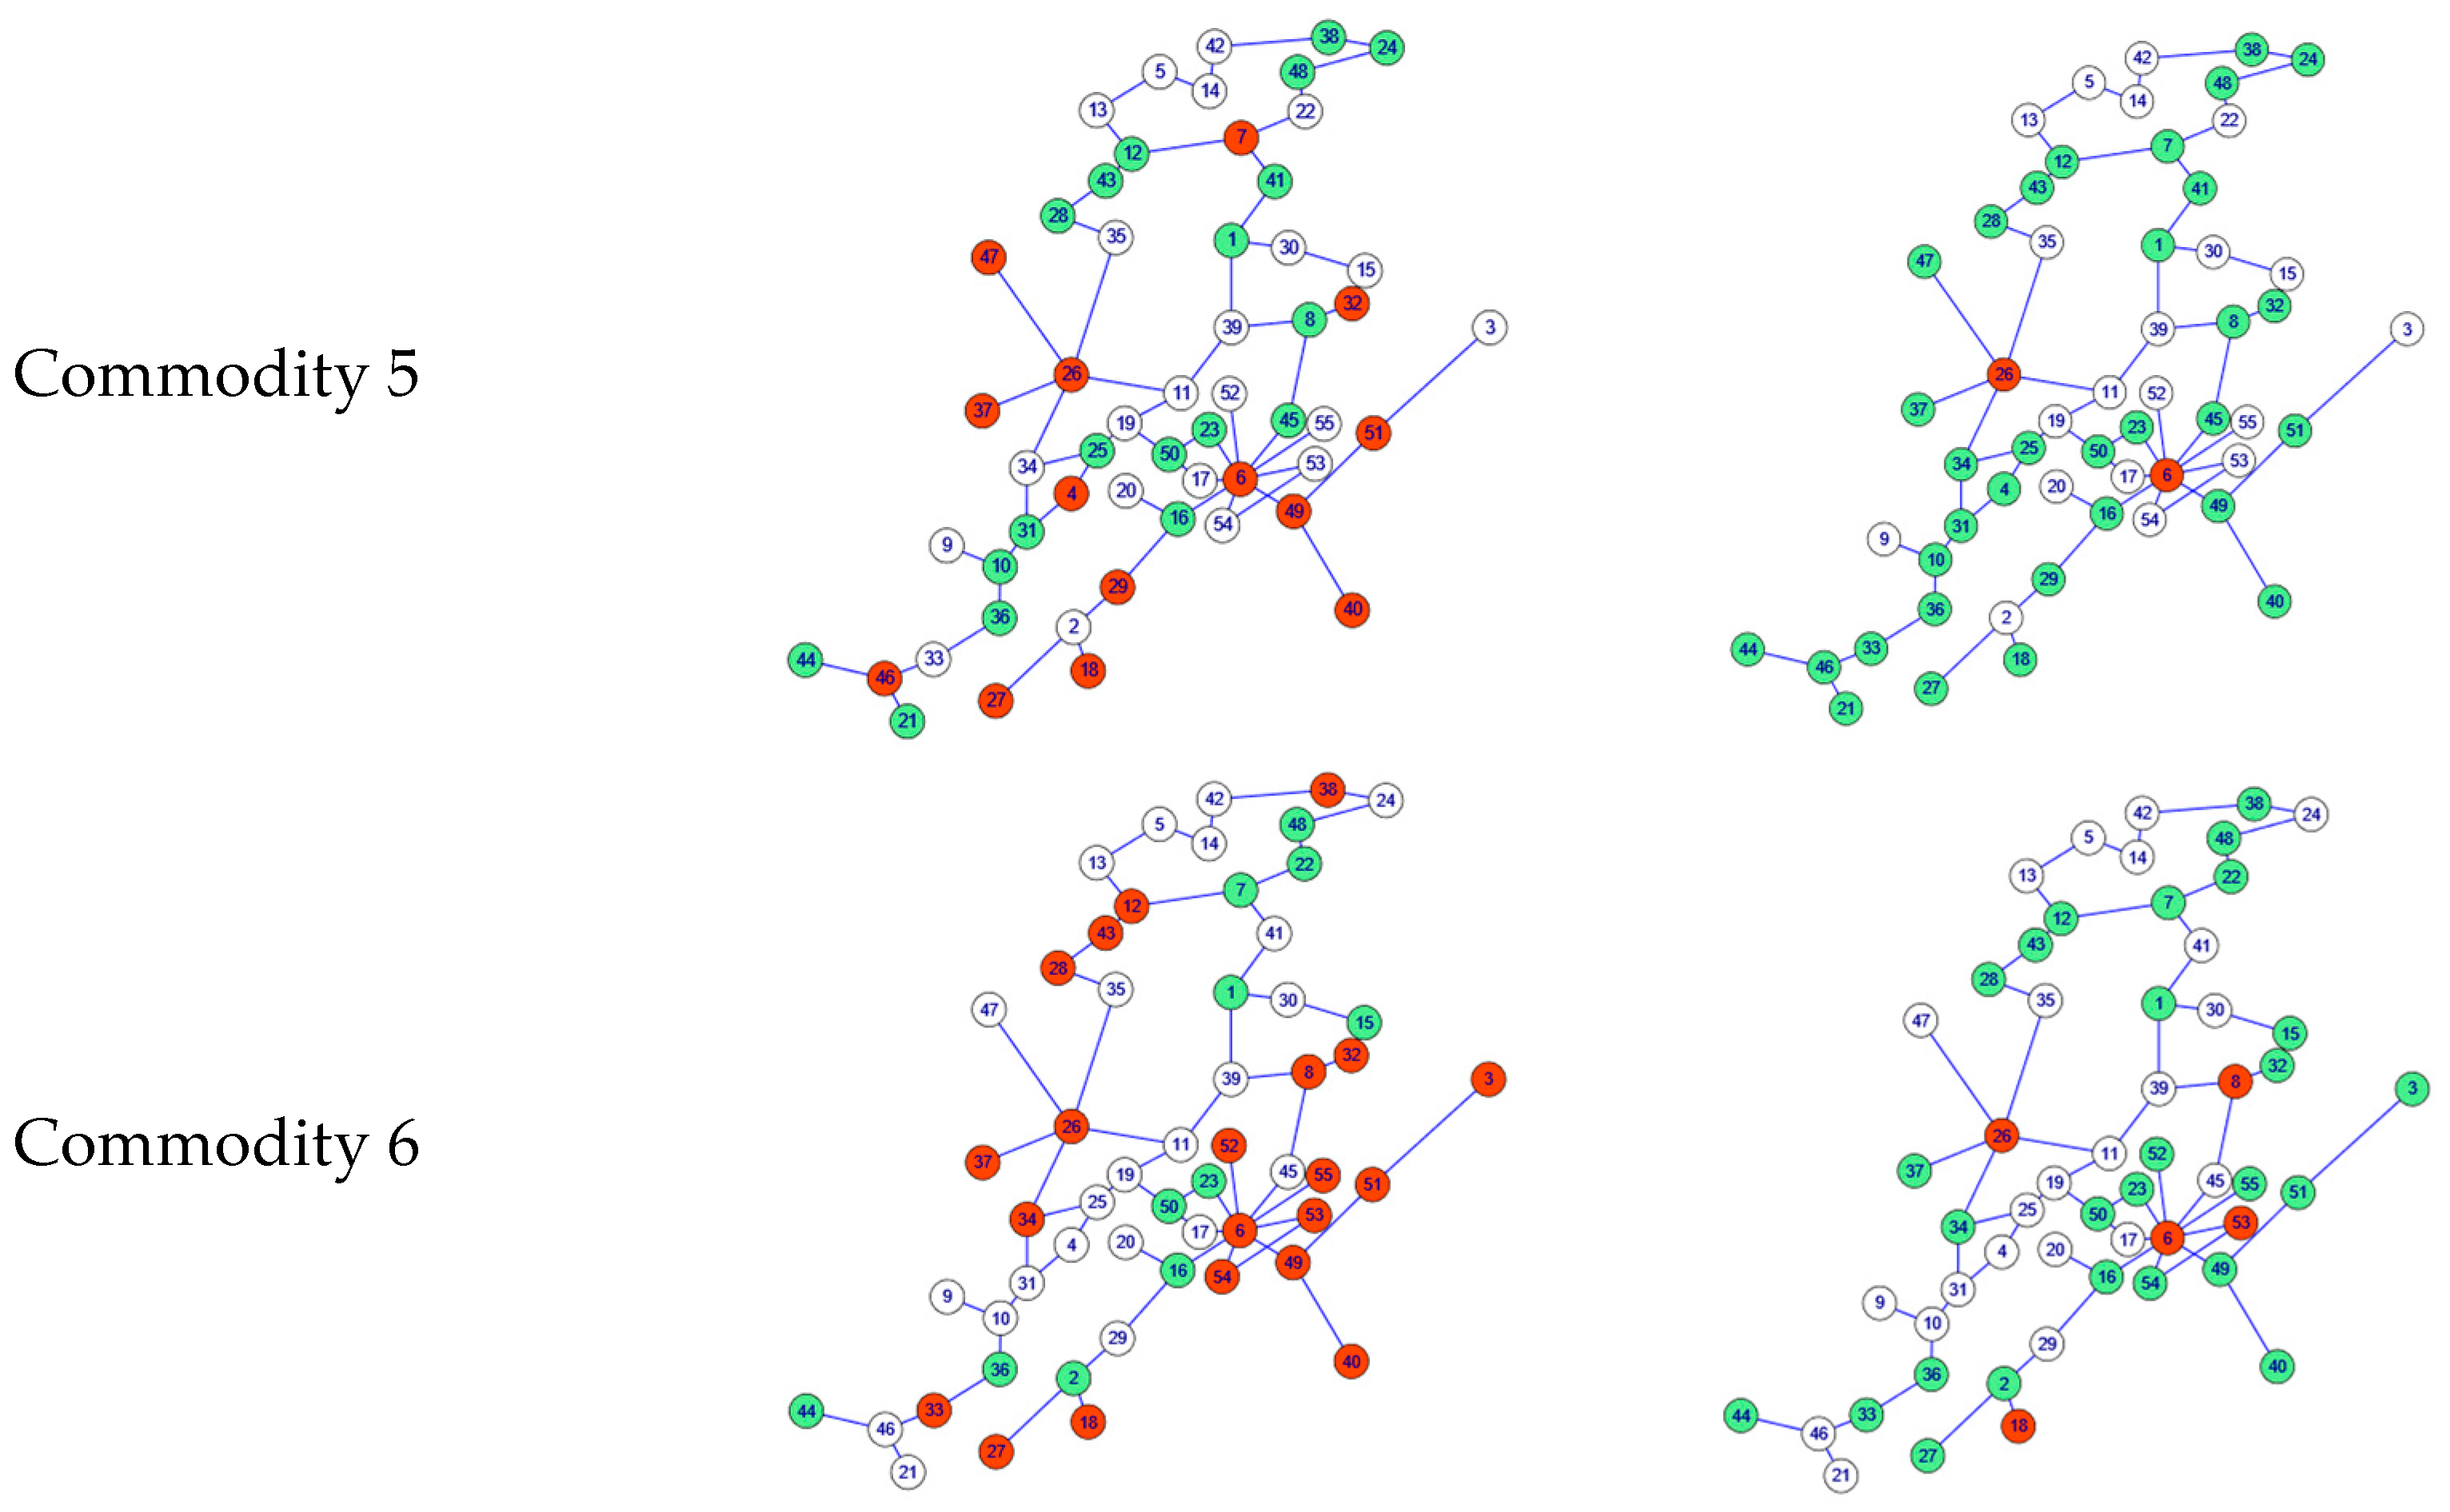
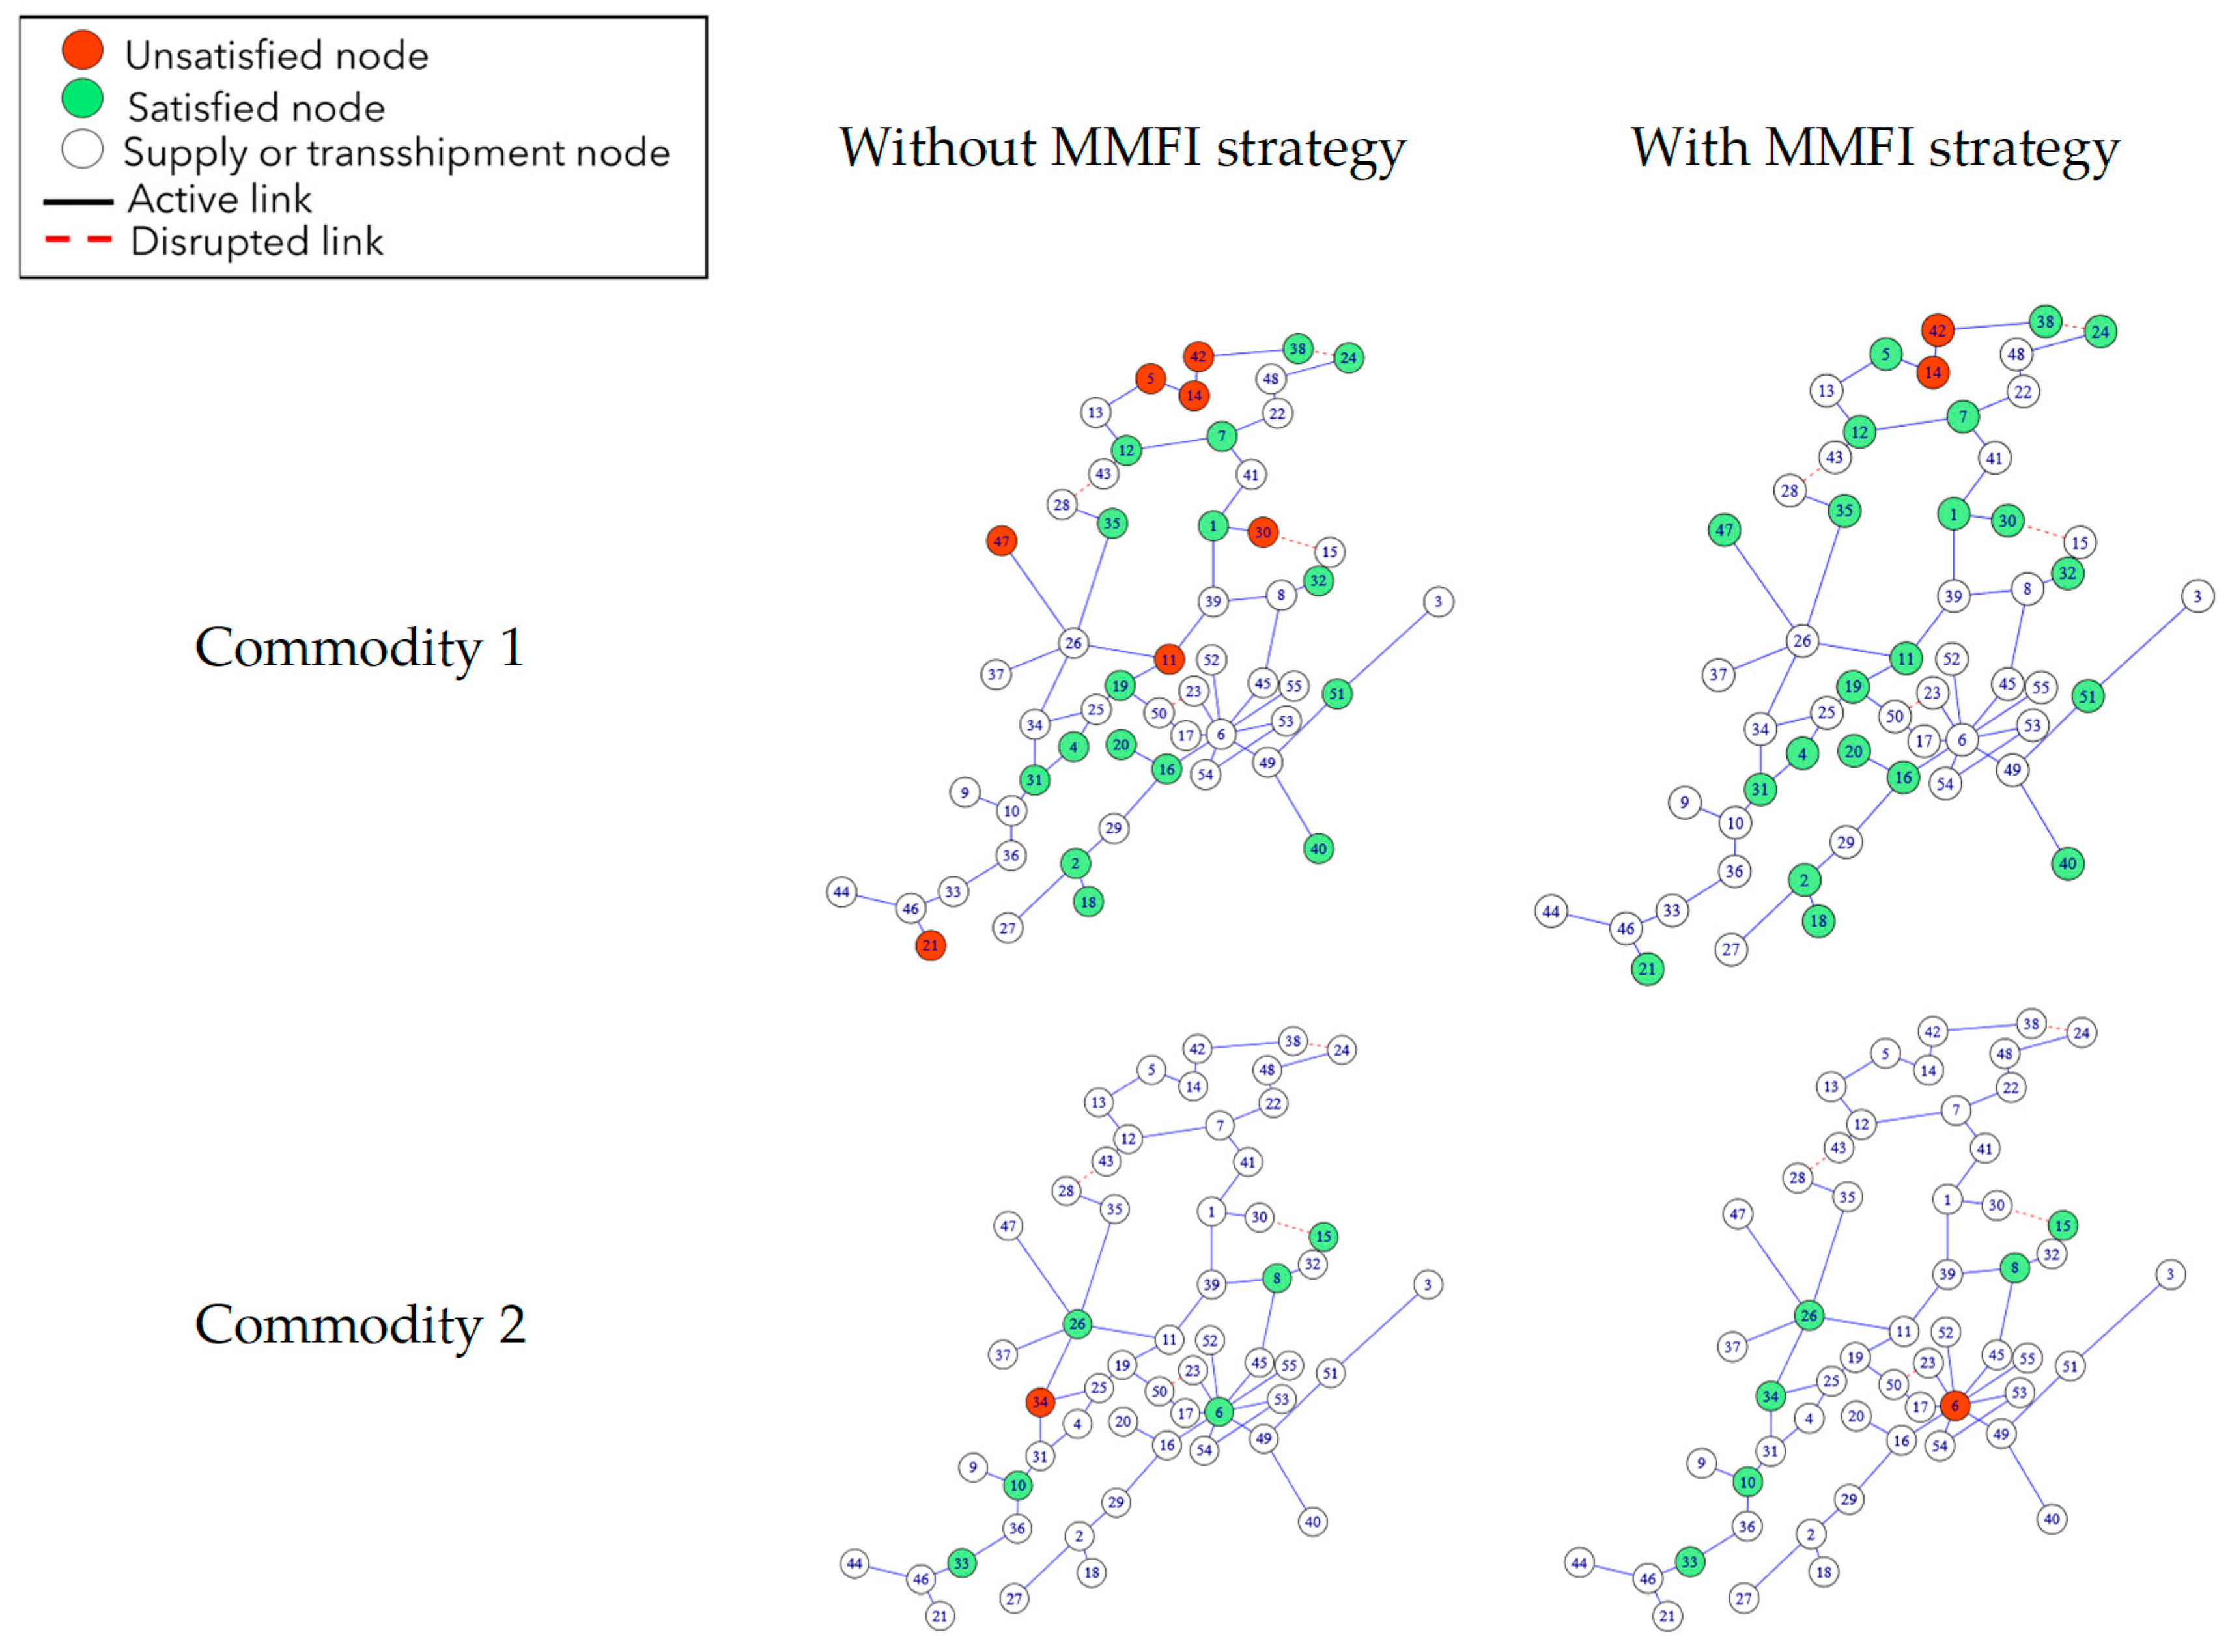
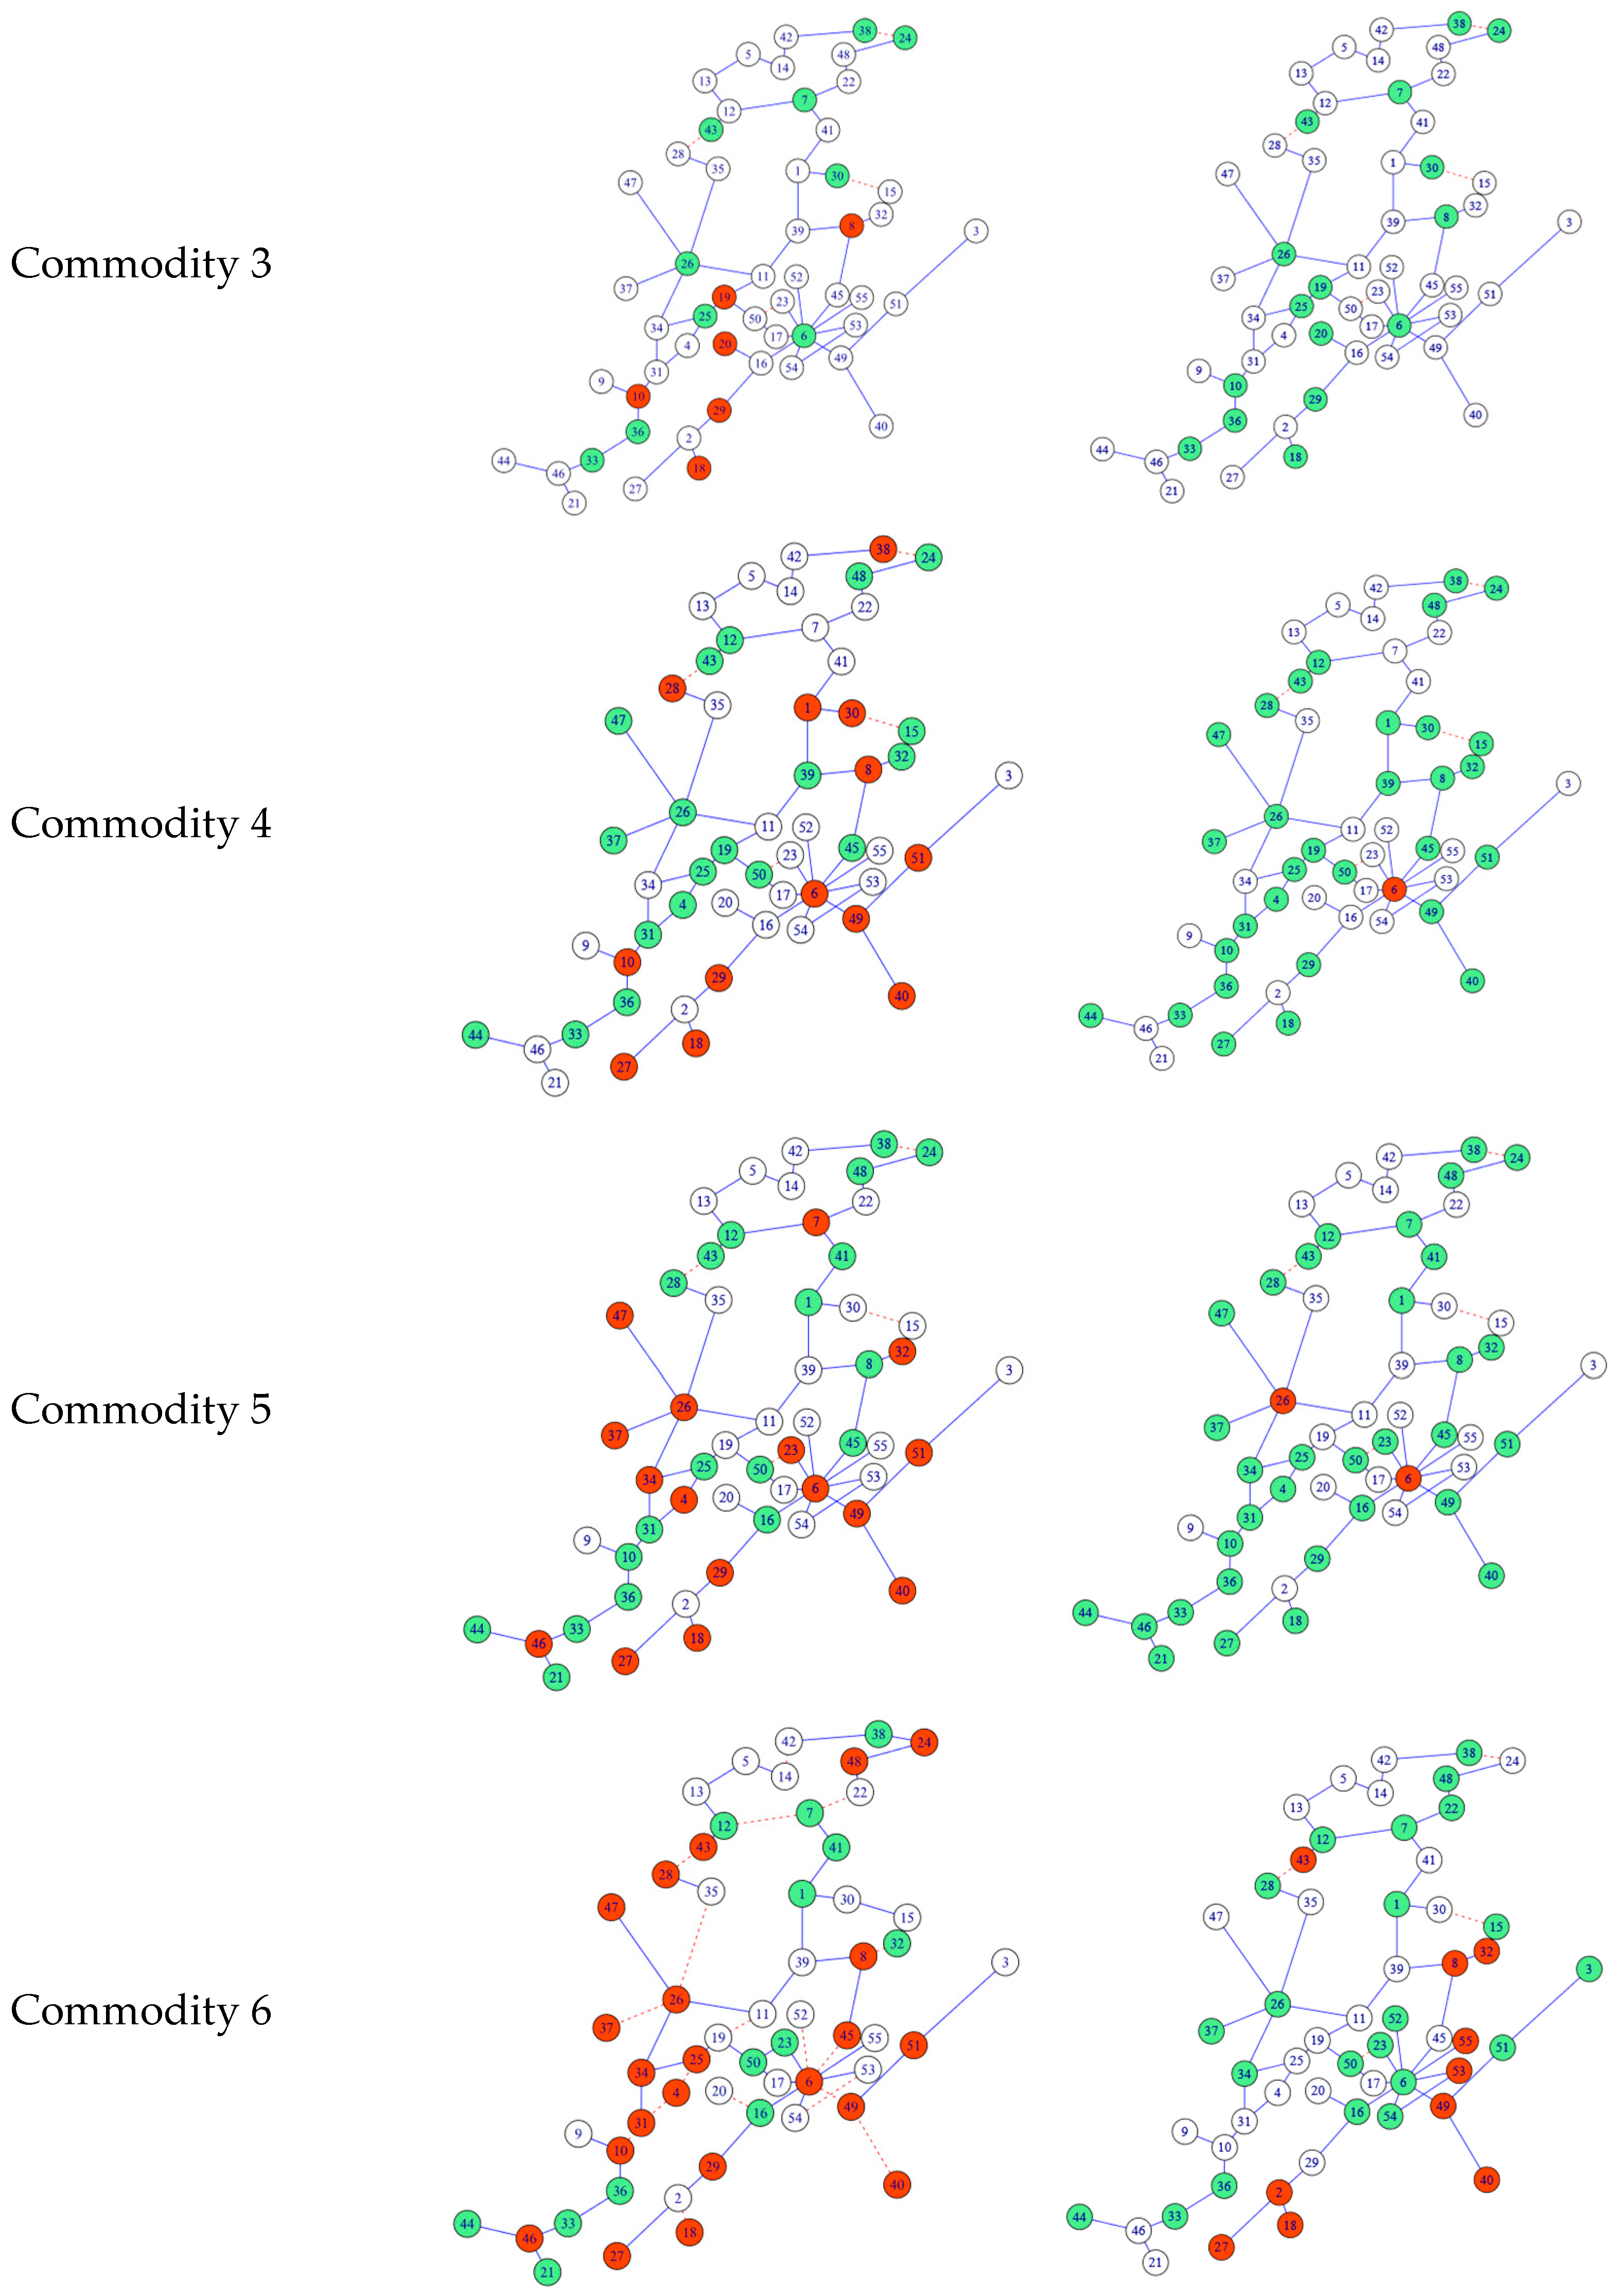
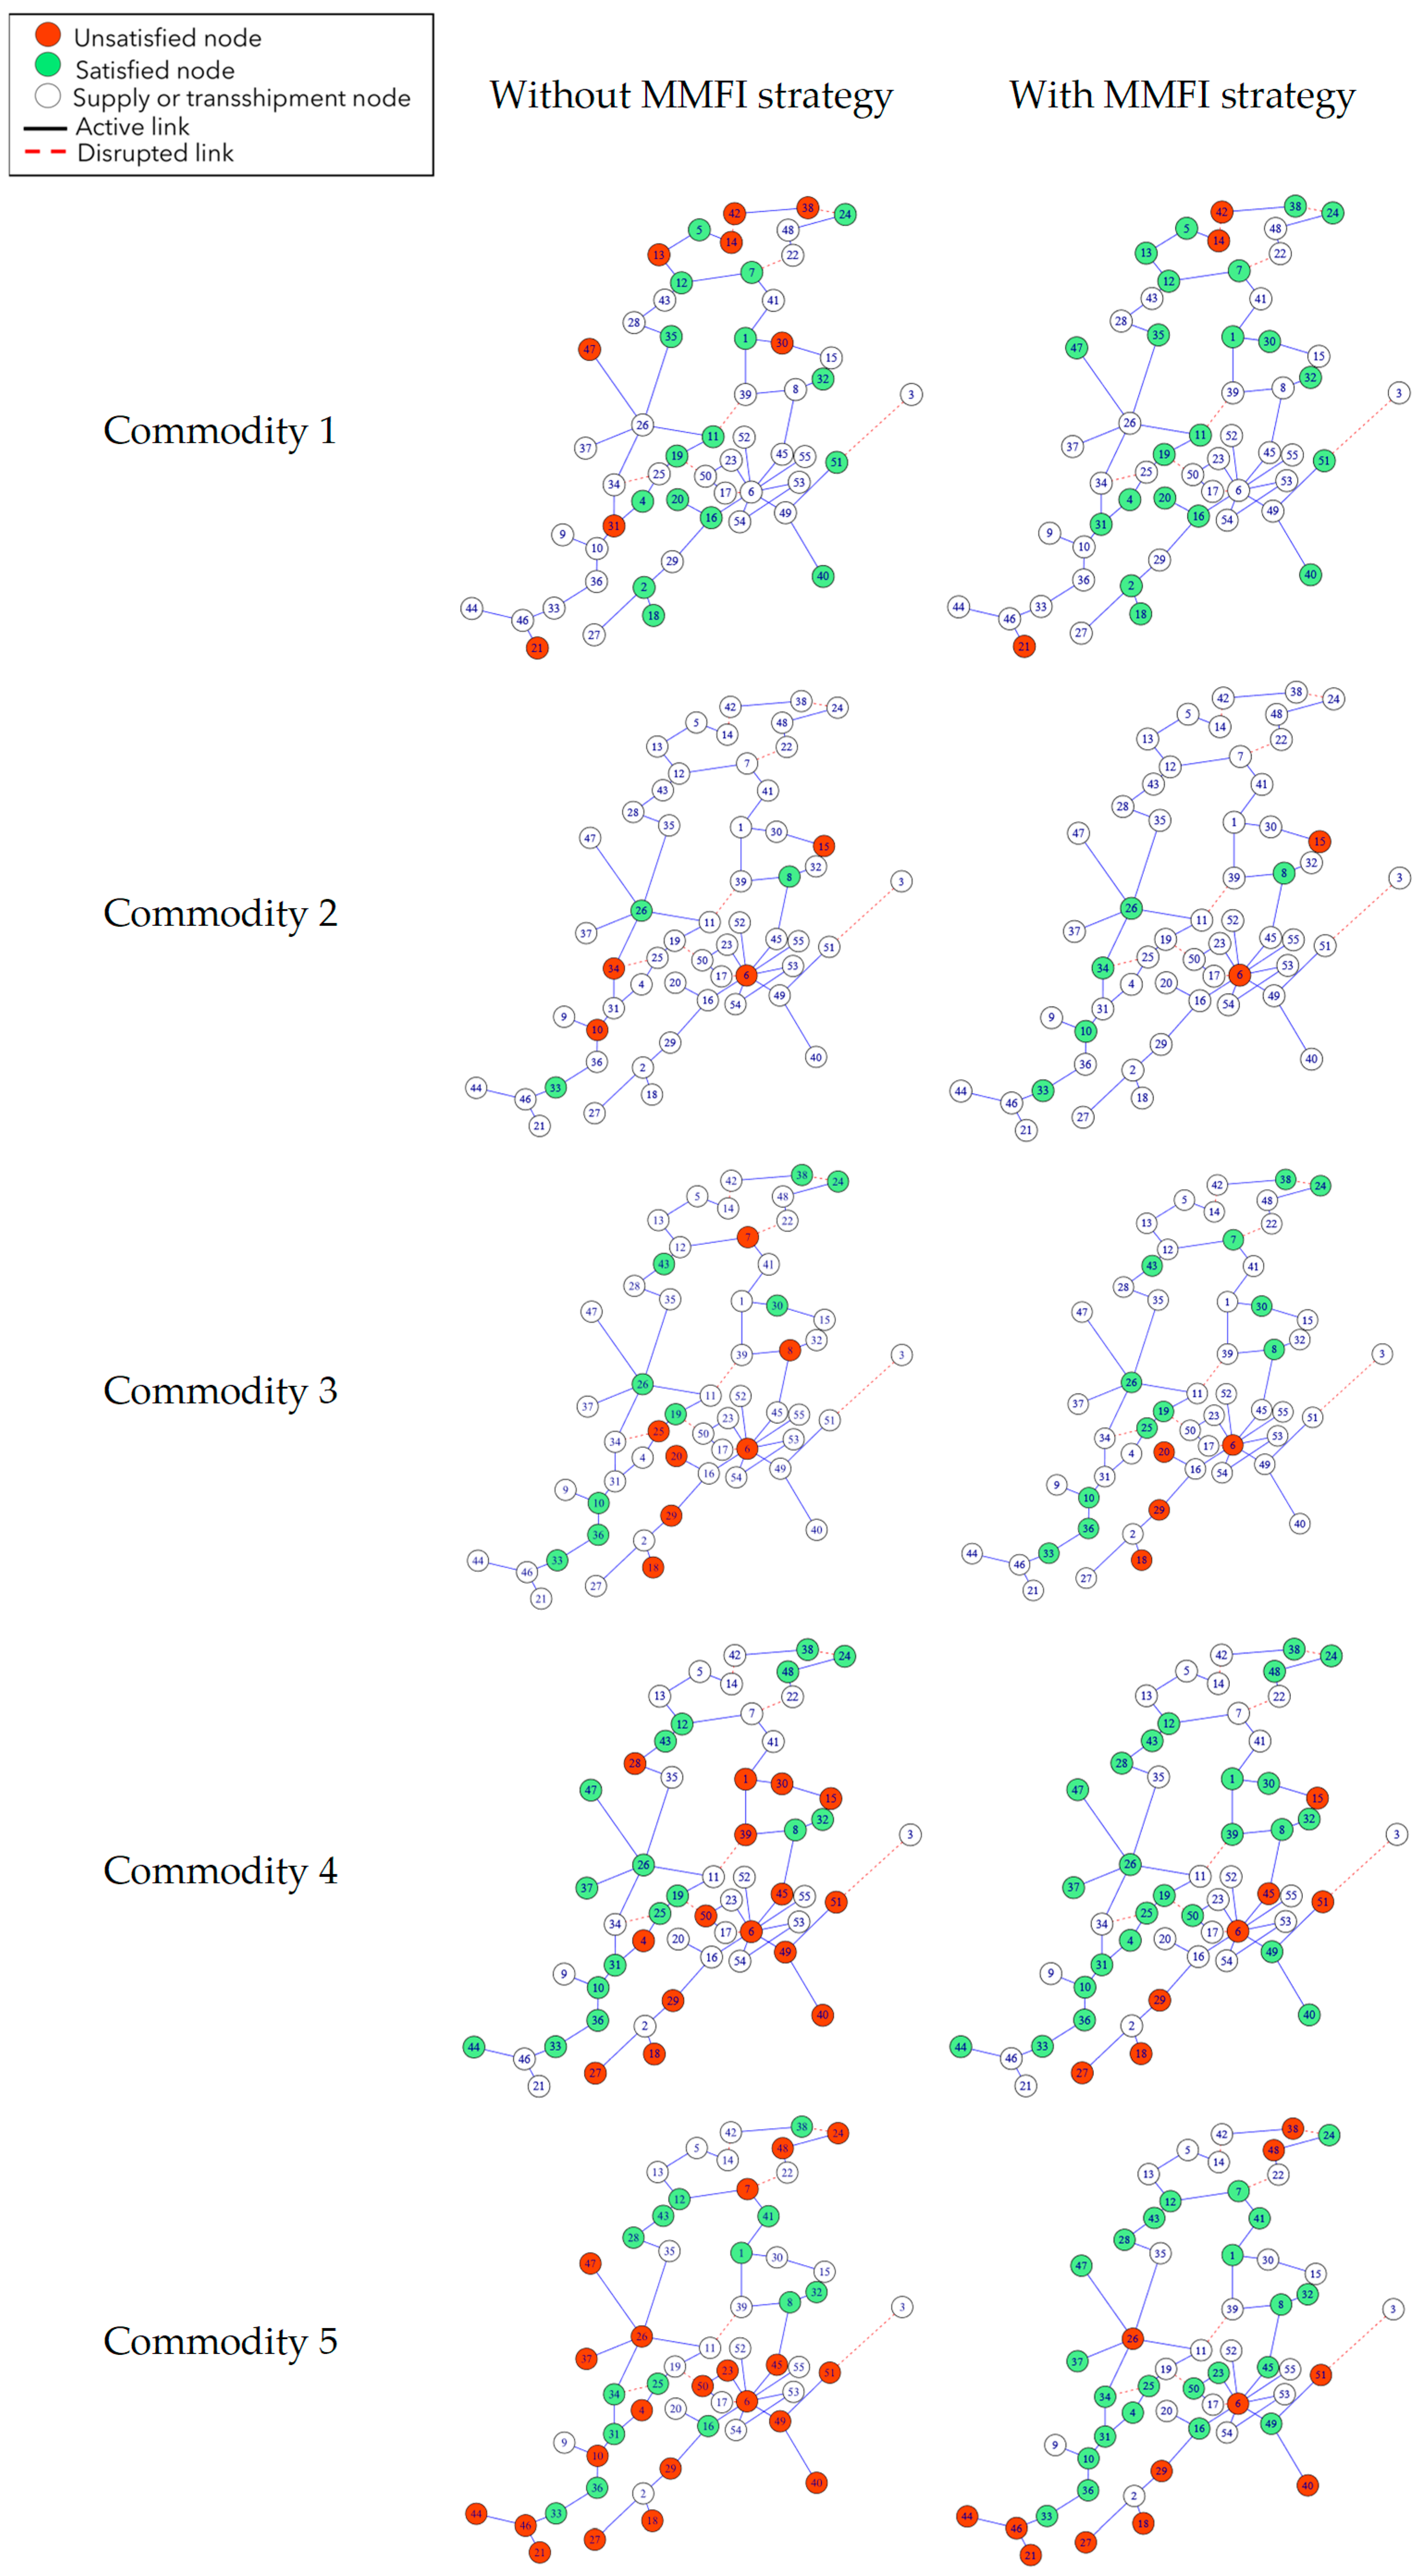
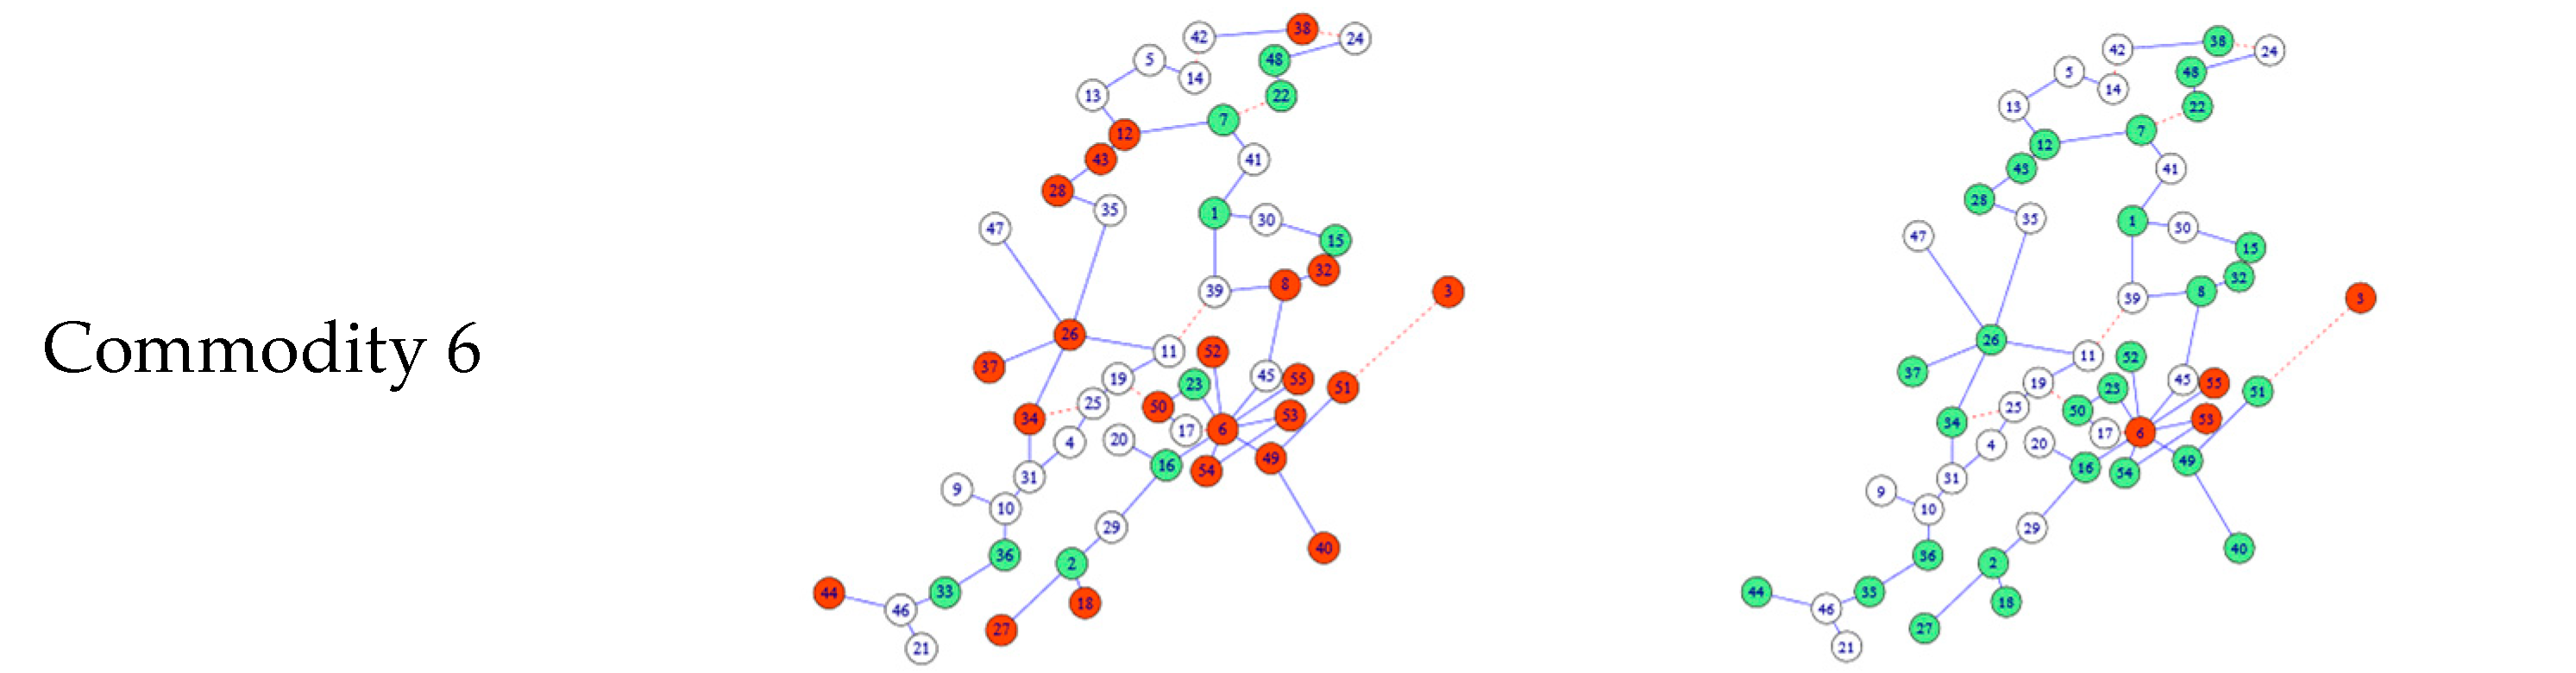
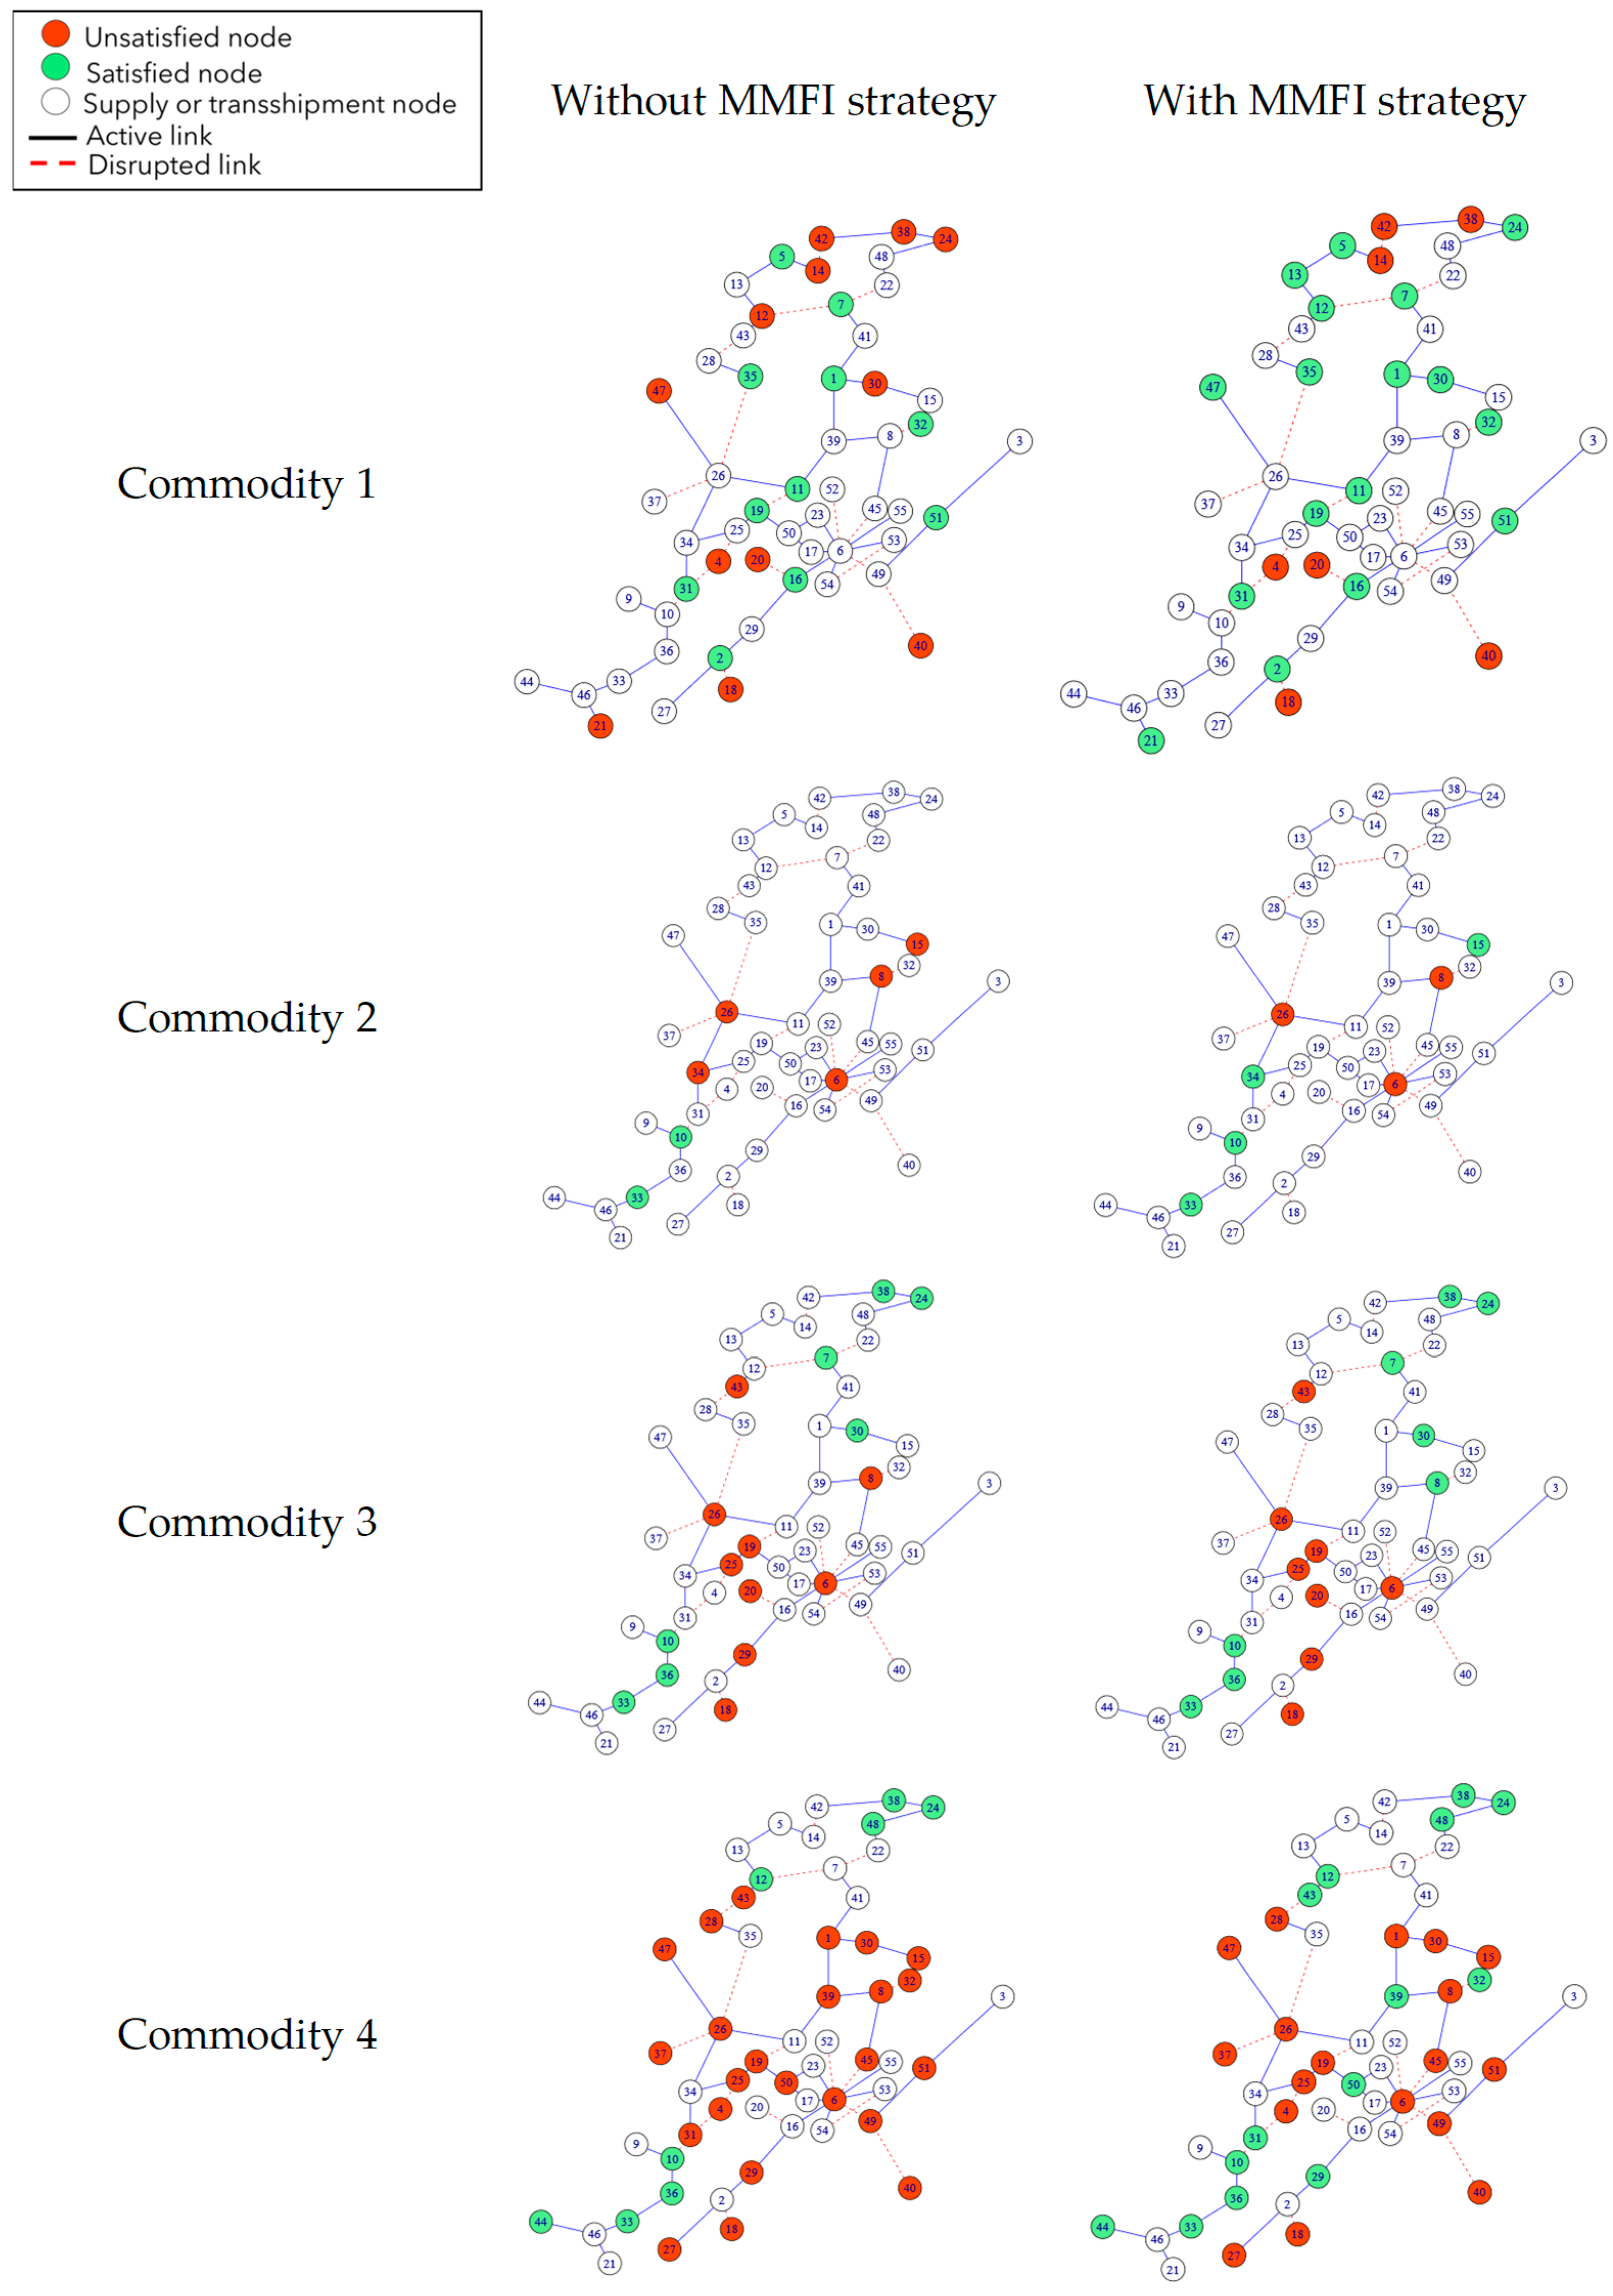
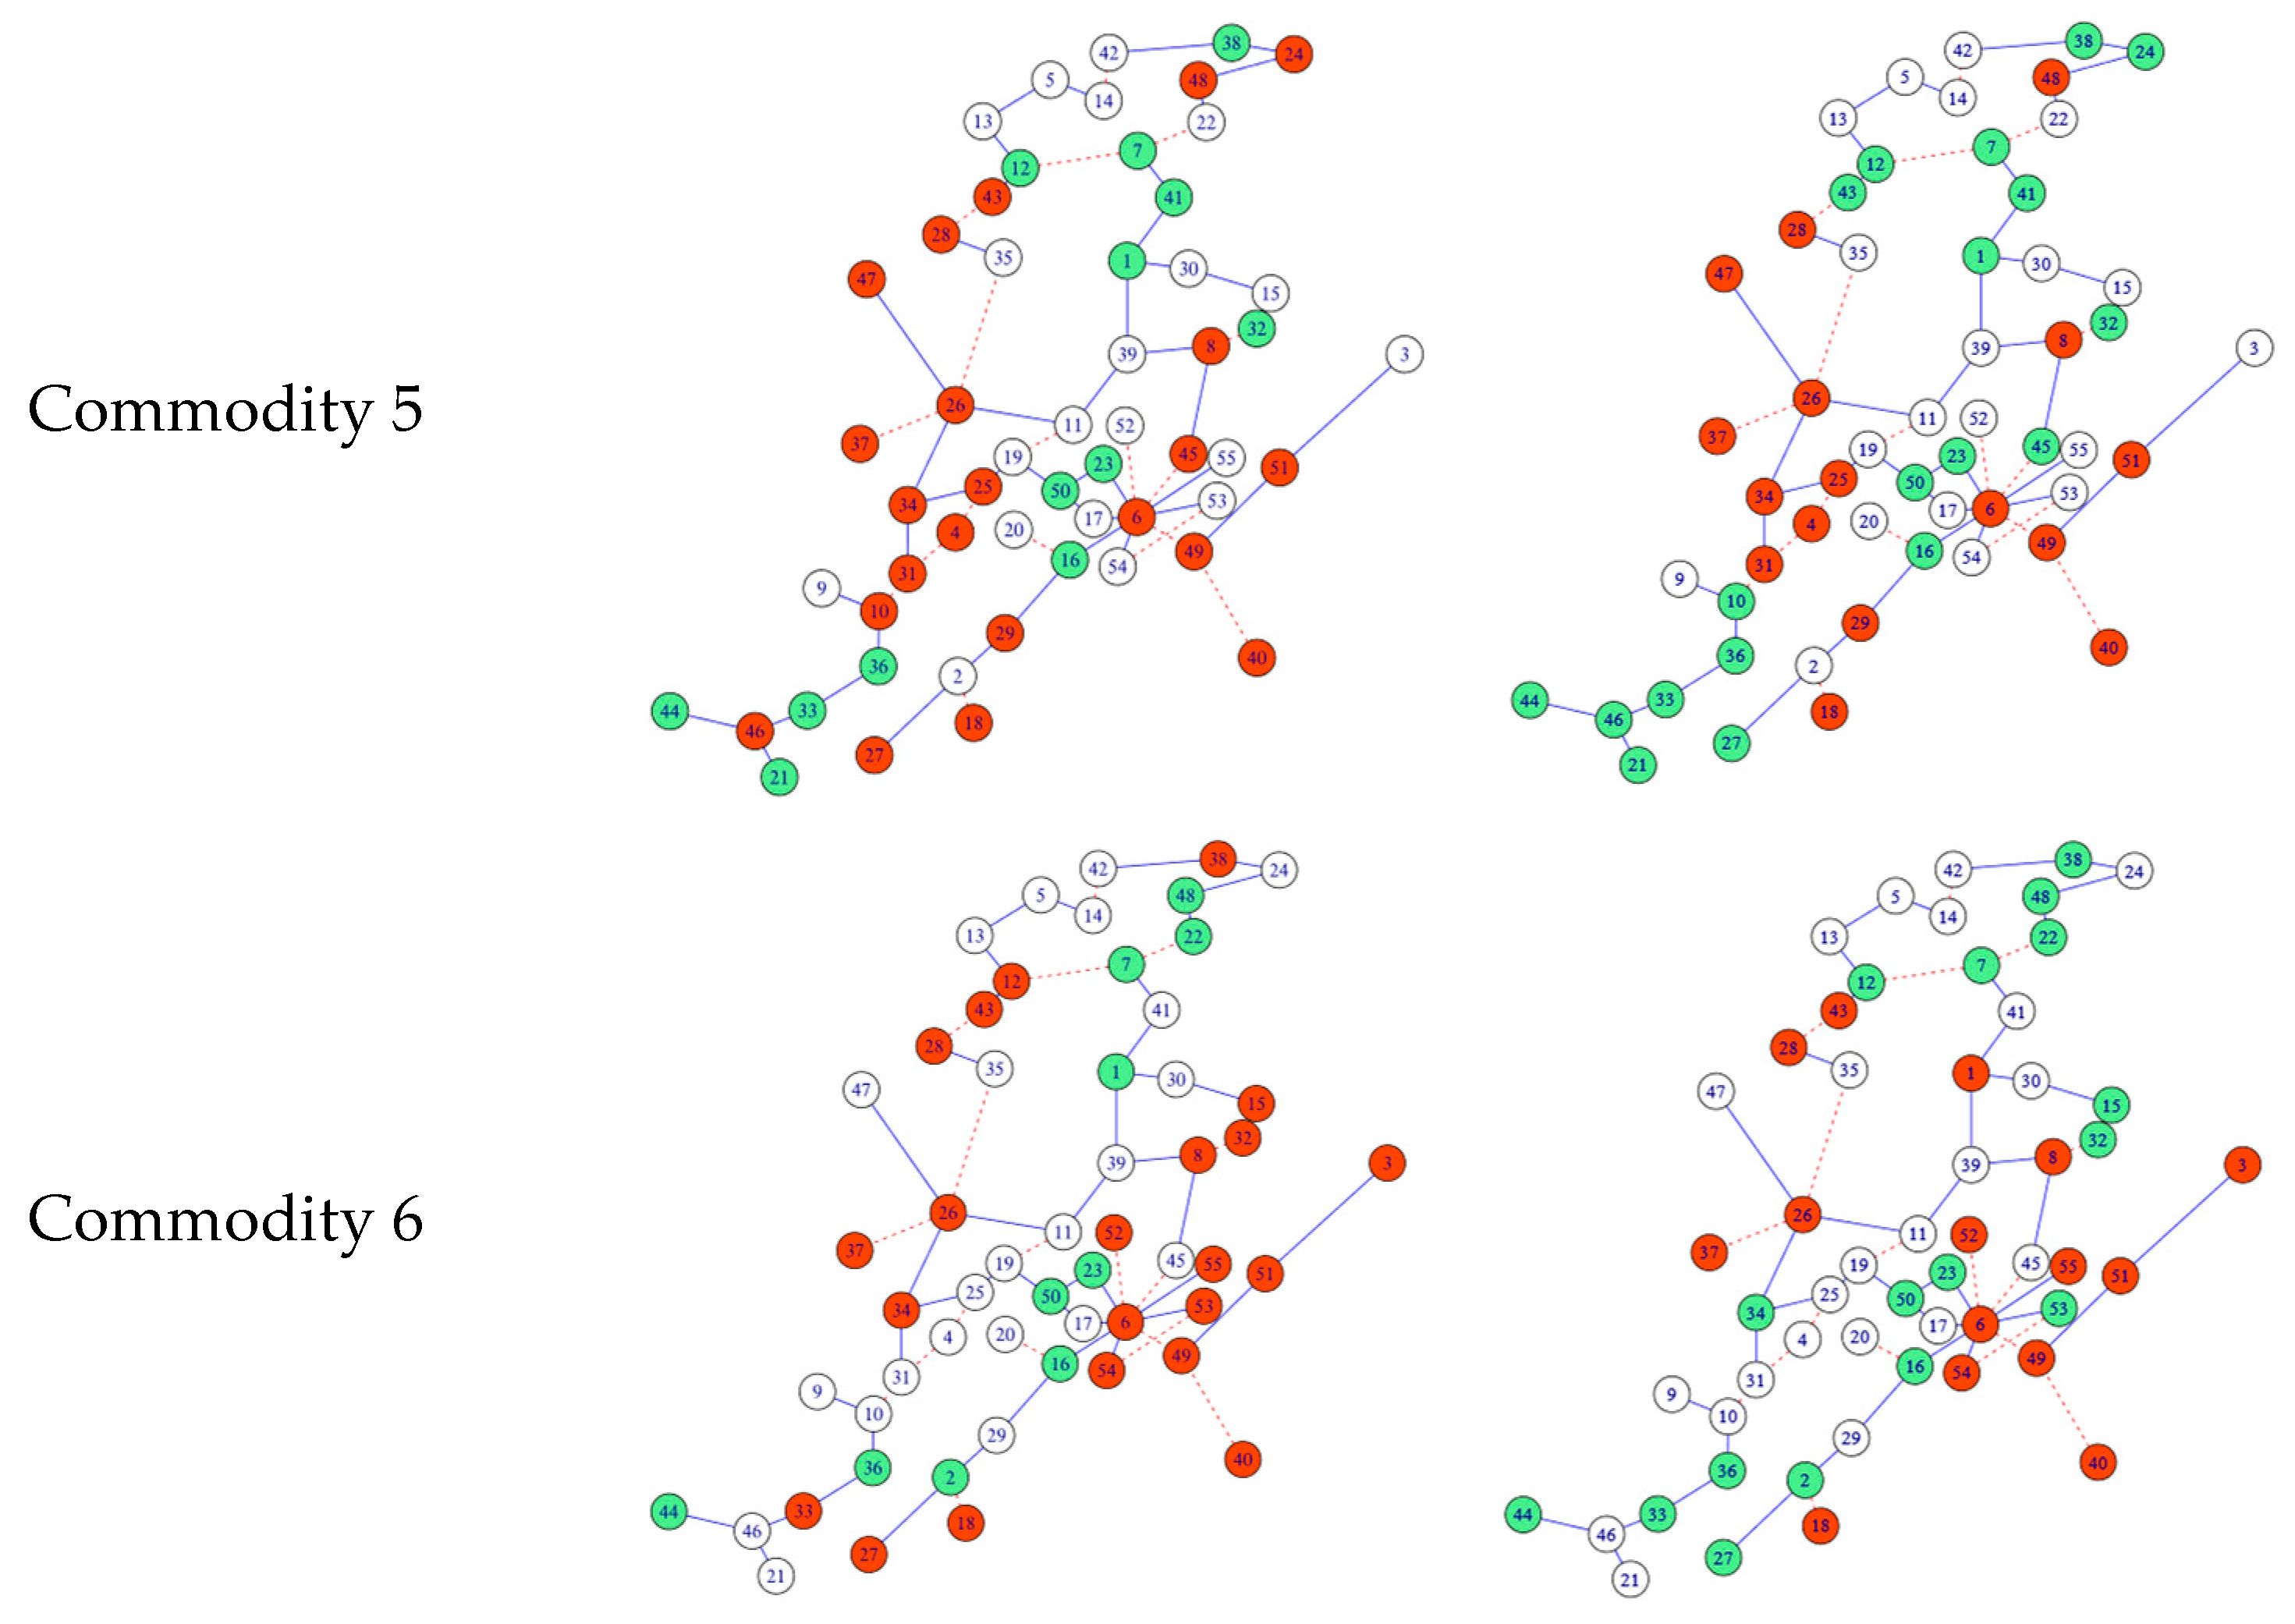
To demonstrate the improvement in the distribution performance through the multi-commodity and multimodal supply chain network, Figure 5, Figure 6, Figure 7 and Figure 8 illustrate the distribution of commodities and the satisfaction status of demand nodes for each commodity (with and without the MMFI strategy) while considering different disruption levels (minor: 5%, moderate: 10%, and significant: 20%). The illustration of the network also shows the distribution performance when the network has no disruptions affecting the network to demonstrate the efficiency of the MMFI strategy under normal conditions in the network. Figure 5, Figure 6, Figure 7 and Figure 8 demonstrated that the MMFI strategy model significantly improved the distribution performance for all disruption levels than when the model did not consider the MMFI strategy. Moreover, the MMFI strategy shows a high number of satisfied demand nodes under the normal condition of the network (0% disruption level), which indicates that an MMFI strategy is a vital distribution strategy when decisions consider efficient distribution and satisfaction status. It is essential to mention that some commodities are sensitive to the disruption level, as can be noticed in the satisfaction status of the demand nodes in the state of significant disruptive events because most cities are in the mountains, making the network less redundant.
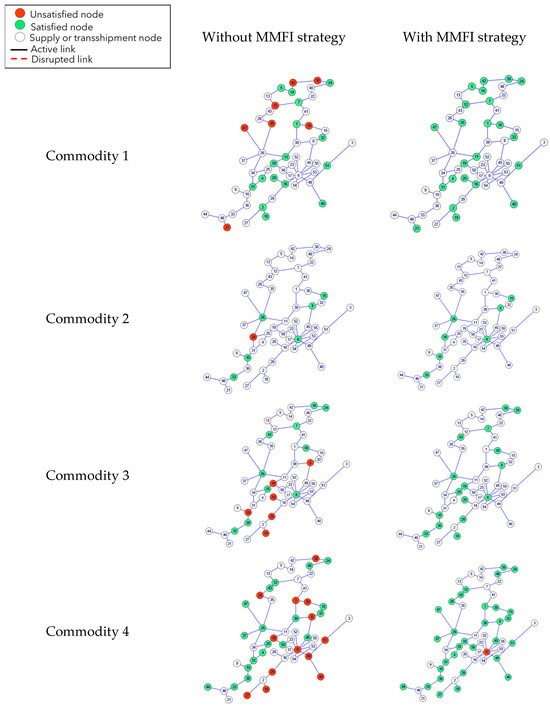

Figure 5.
Illustration of flows commodity’s demand node (with and without the MMFI strategy) among each commodity when the disruption level is 0% (no disruption).
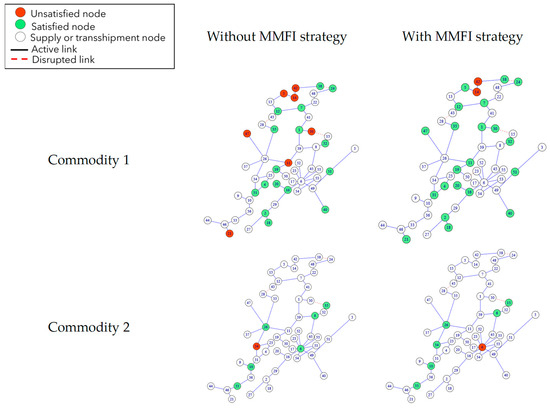
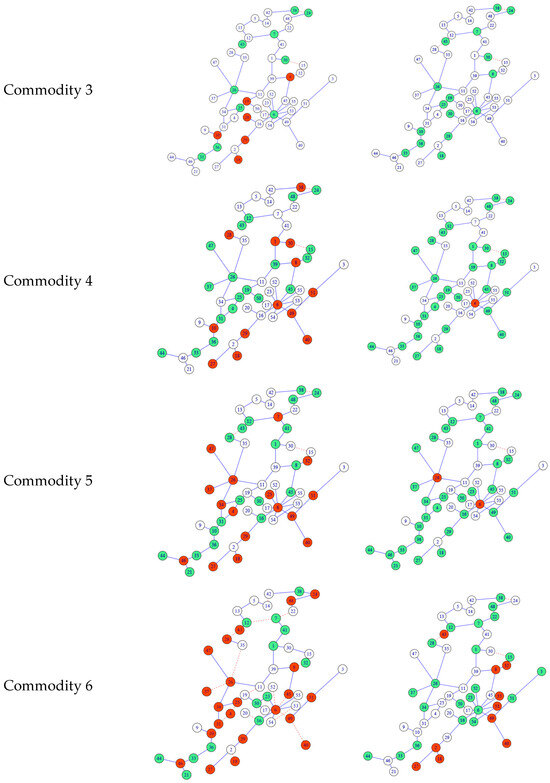
Figure 6.
Illustration of flows commodity’s demand node (with and without the MMFI strategy) of each commodity when the disruption level is 5%.
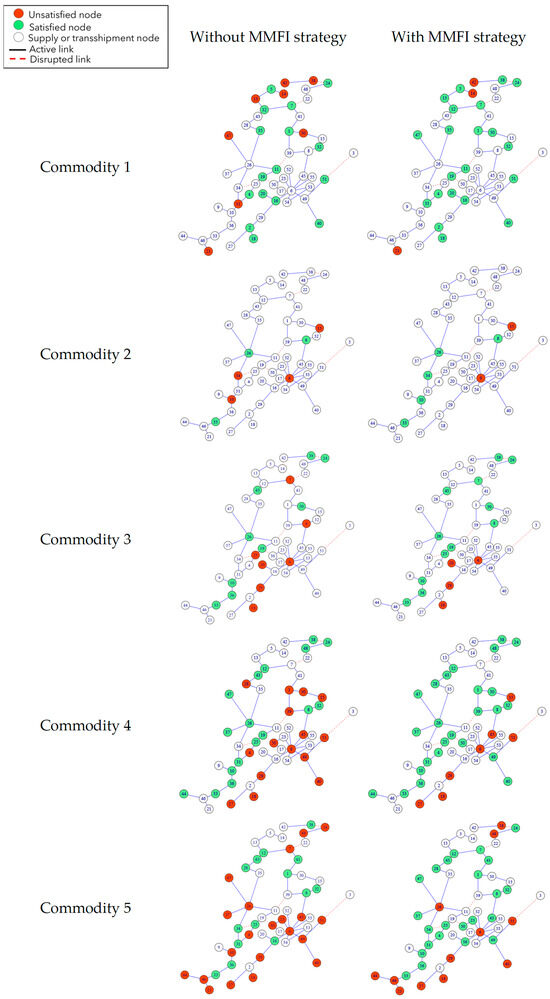

Figure 7.
Illustration of flows commodity’s demand node (with and without the MMFI strategy) of each commodity when the disruption level is 10%.
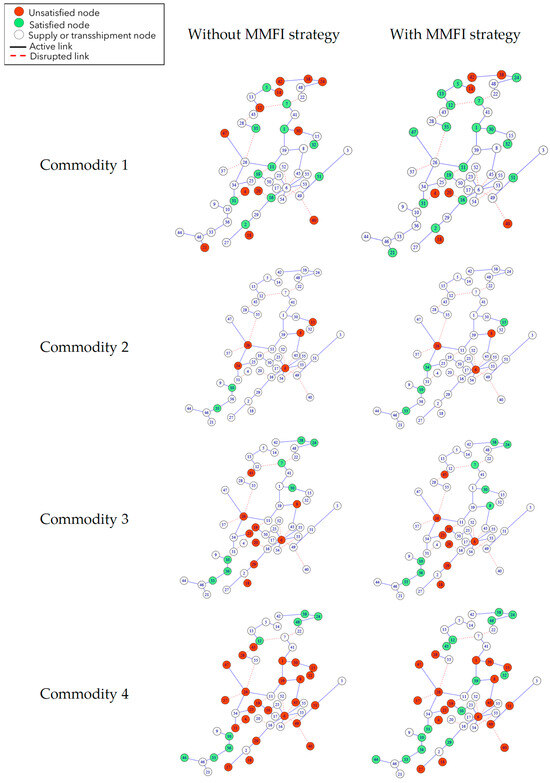
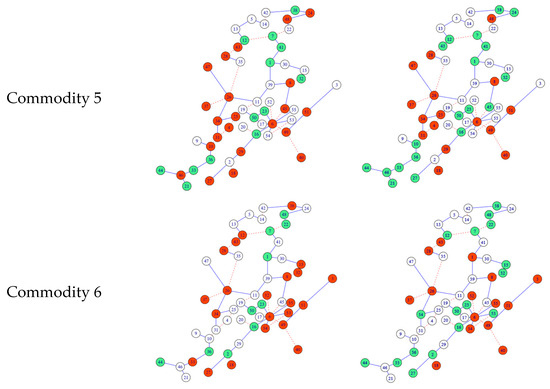
Figure 8.
Illustration of flows commodity’s demand node (with and without the MMFI strategy) of each commodity when the disruption level is 20%.
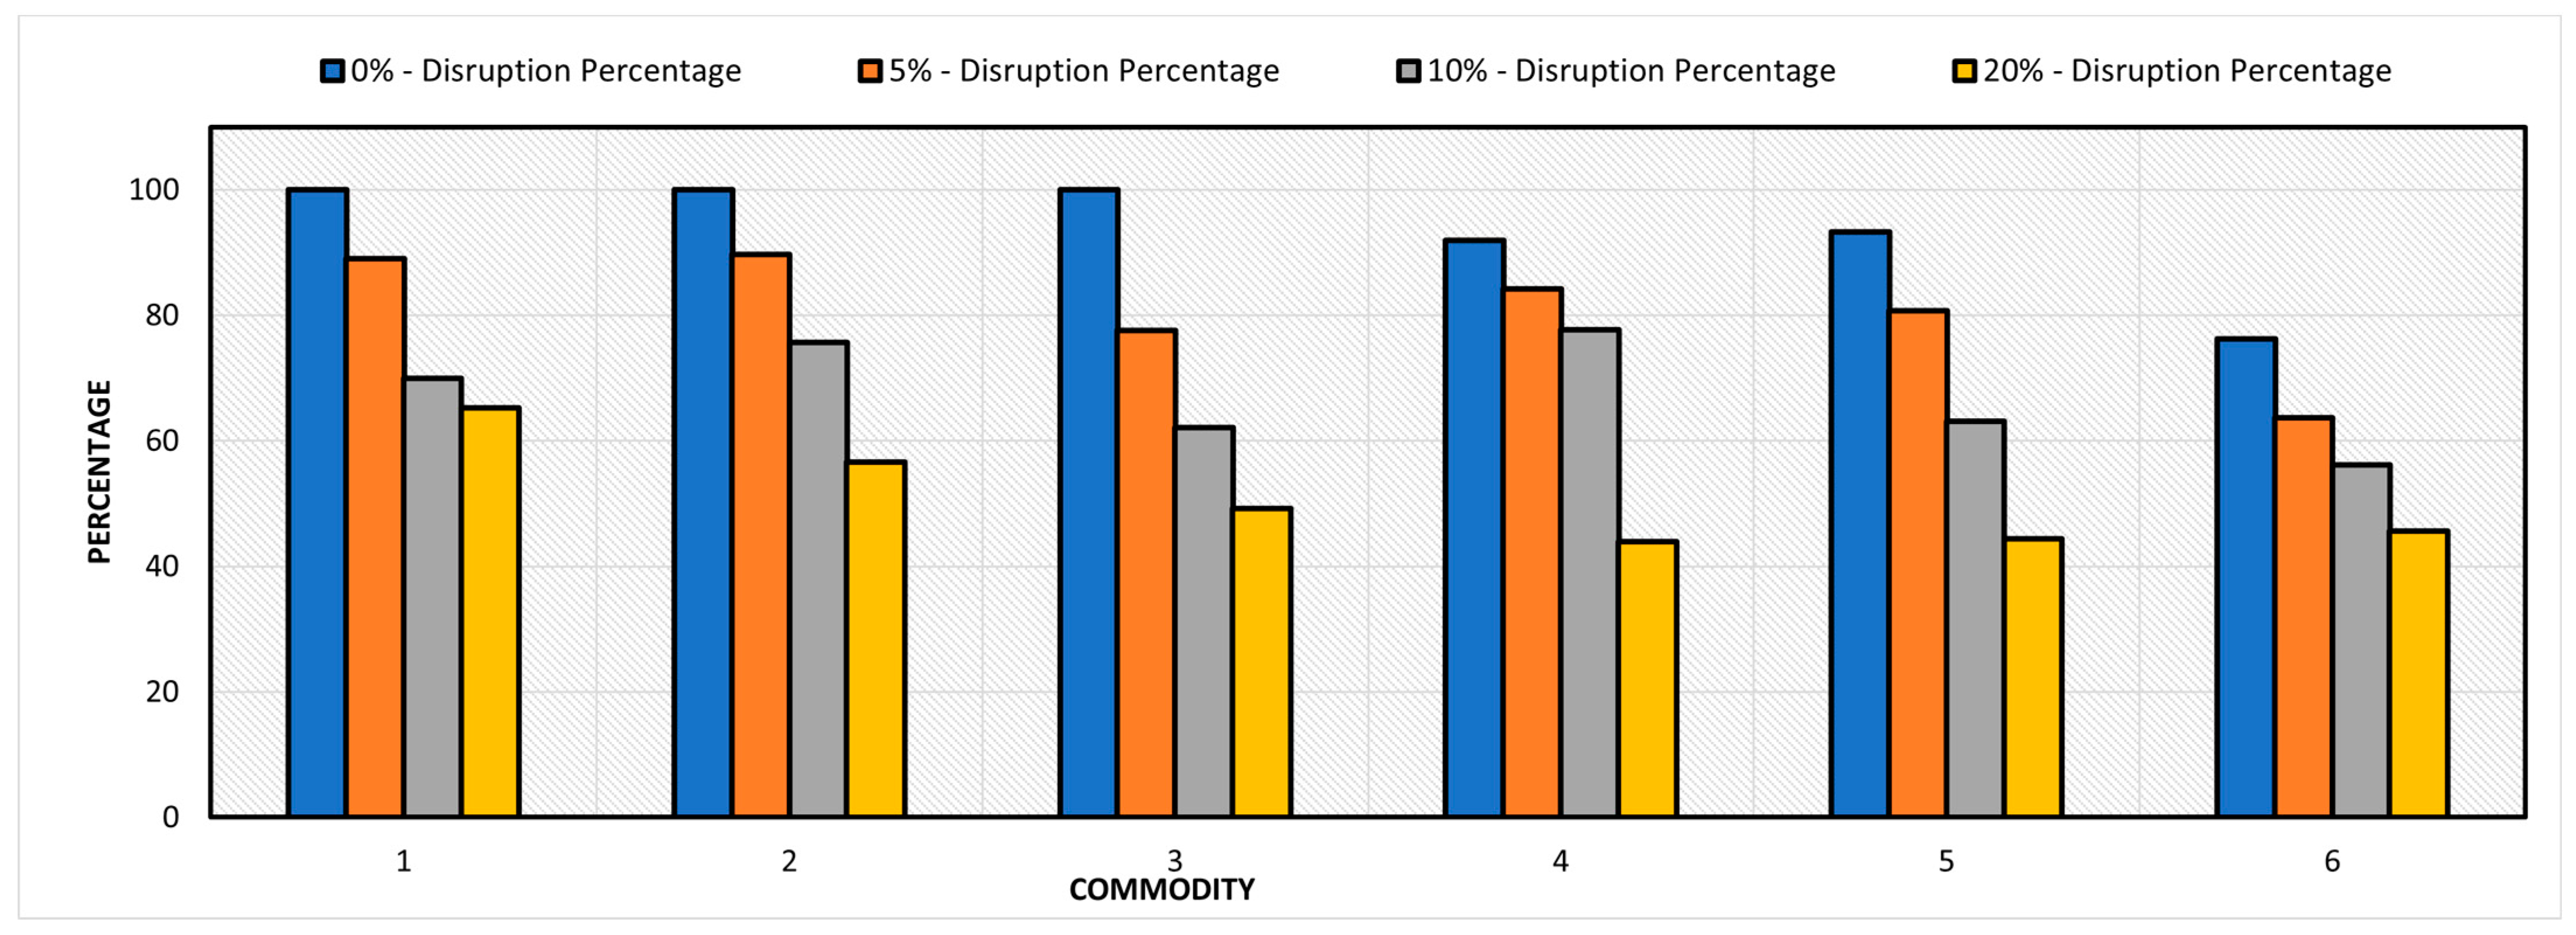
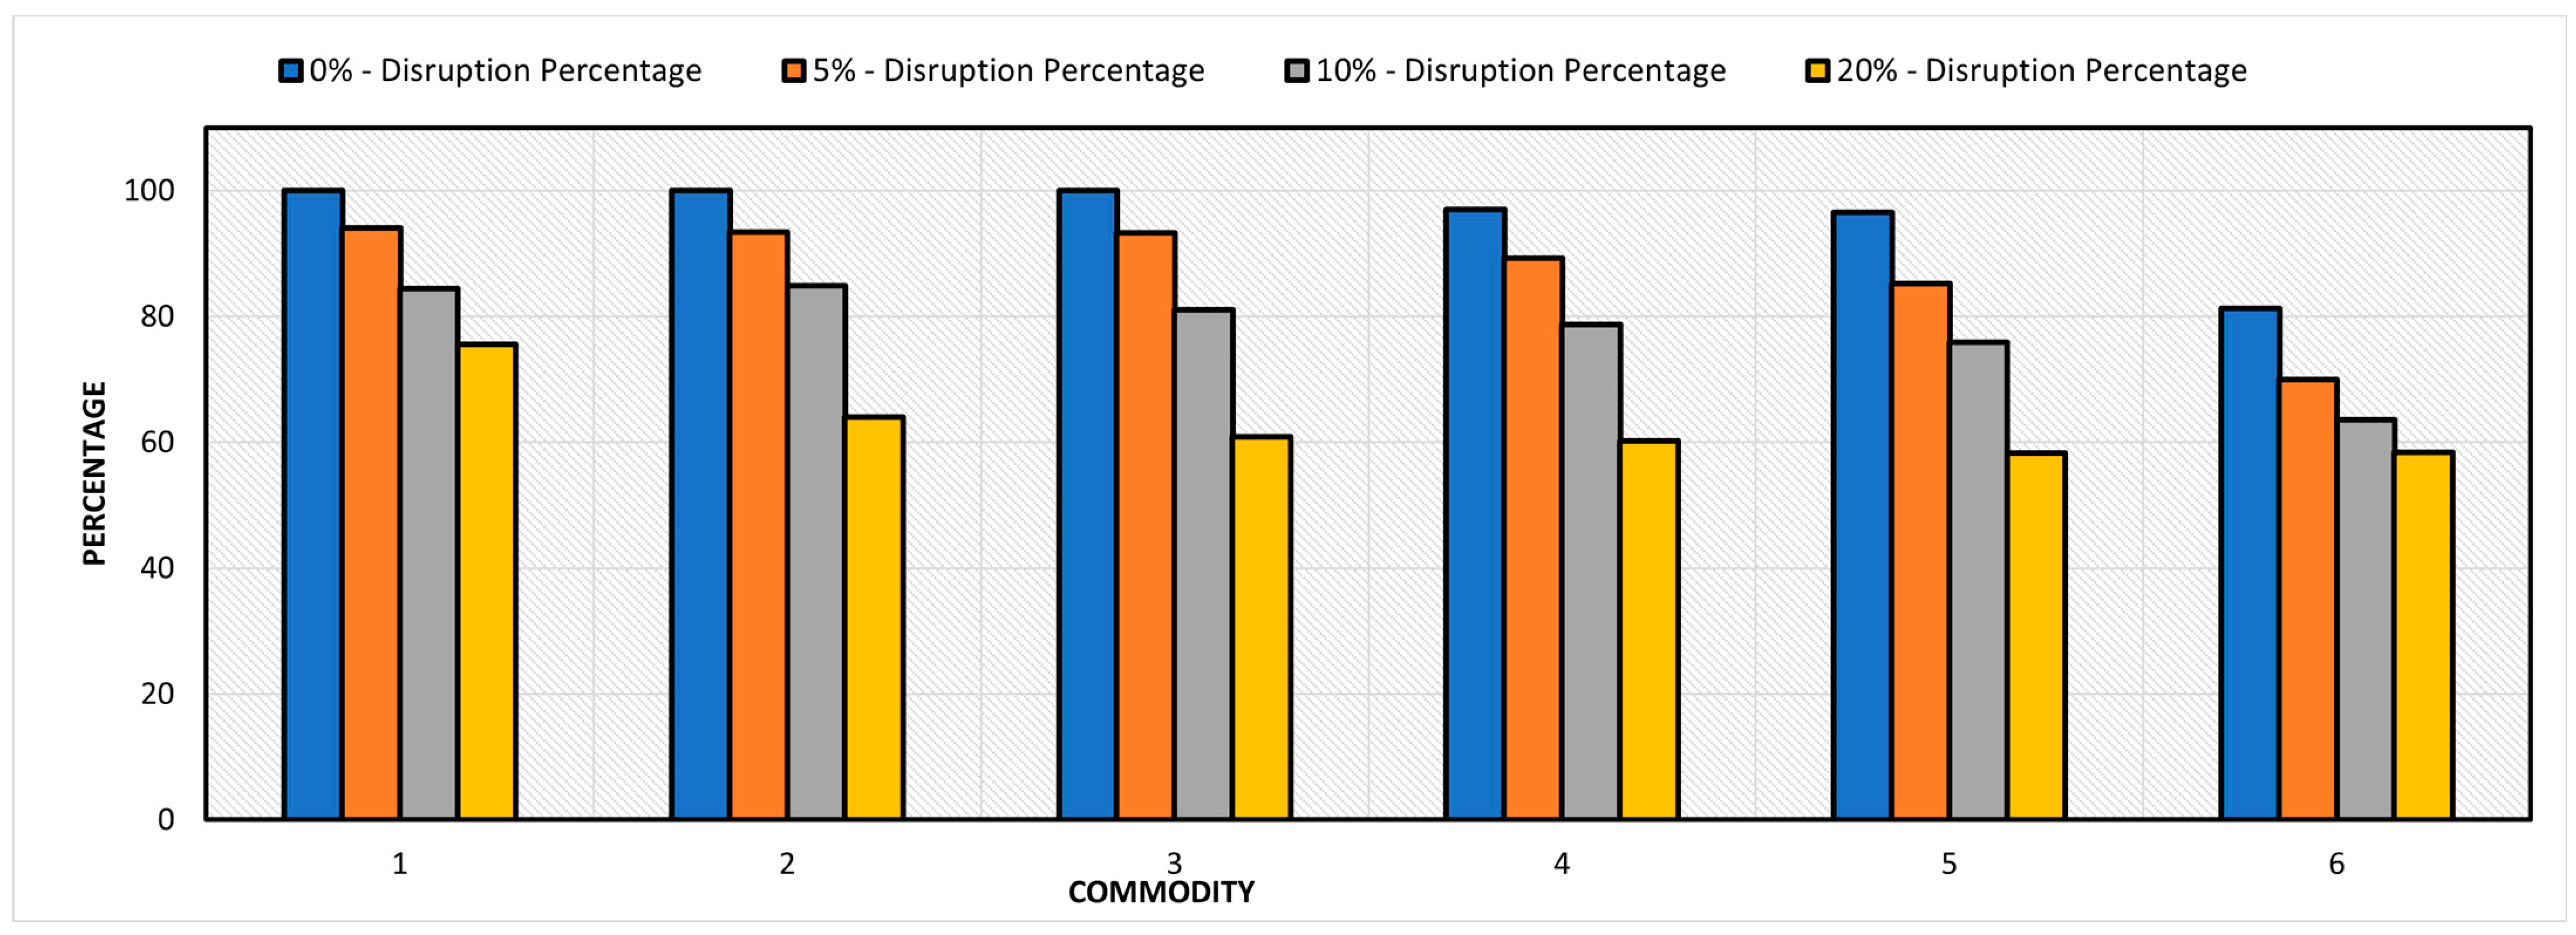
The proposed model emphasizes MMFI while considering the associated costs, fulfilling the demands with its minimum network requirement to guarantee MMFI in case of different disruptions events (considering multiple scenarios for each disruption level). Figure 9 and Figure 10 show the percentage of satisfied demand nodes of each commodity at each level of disruption compared to the original state of the network before the disruptive event. The model in both objective functions was able to fairly satisfy a high percentage of the demand nodes for each commodity in all disruption levels when compared to the original state of the model without disruption. Also, the model in both objective functions maintained more than 55% of the demand nodes satisfied even in the worst-case scenario, where the network was 20% disrupted.
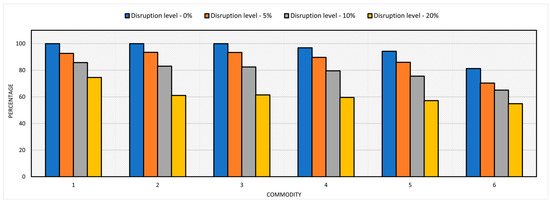
Figure 9.
The satisfaction percentage of demand nodes at different disruption levels for the supply optimization and disparity reduction objective.
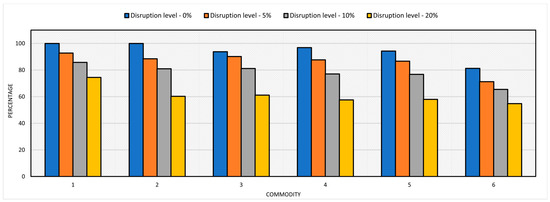
Figure 10.
The satisfaction percentage of demand nodes at different disruption levels for the cost objective function.
4.2. Performance Measure
In this section, we present a performance measure to determine variability in the distributed commodities among the demand nodes whose minimum requirements were not satisfied. To measure the improvement in the multimodal–multi-commodity transportation network associated with performance in our model, we considered the statistical measures discussed in [46]: maximum of absolute deviations (MAD). Note that is the commodity resource allocation on demand node j, given that the number of demand nodes whose minimum requirements were met is n, and is the average number of commodities of that demand node.
We defined the value of MAD for each commodity at each disruption level for the Resource Allocation Efficiency and the cost objective functions, as shown in Table 1.

Table 1.
Maximum of absolute deviations (MAD) results.
Table 1 provides a multifaceted evaluation of the maximum of absolute deviations (MAD) for an array of commodities under two distinct objective functions: minimizing excess supply and minimizing cost. Serving as a measure of performance, the MAD aims to capture the resource allocation efficiency of commodities among demand nodes where full satisfaction of minimum requirements may not be feasible. The table is structured to encompass varying levels of system disruption, thereby offering a comprehensive snapshot of the model’s performance and adaptability.
Within the data presented in Table 1, several key observations can be made. First and foremost, the MAD values tend to escalate with the level of network disruption, indicating the model’s challenges in sustaining equitable distribution as the system faces increased stress. This upward trend is consistent across all commodities and both objectives but is notably more pronounced when the focus is on minimizing cost. This highlights a nuanced trade-off between the objectives of minimizing cost and excess supply, both crucial factors in achieving distributional equality in commodity allocation. Secondly, Table 1 exposes that the sensitivity to disruption and objectives is not uniform across all commodities. For instance, Commodity 3 manifests a particularly high MAD when the system is significantly disrupted and the goal is to minimize cost.
In summary, Table 1 functions as an indispensable analytical tool for evaluating the multidimensional performance metrics of the optimization model under study. It illuminates the model’s strengths in upholding a degree of equality under minimal disruptions, while also identifying commodities and conditions that may benefit from further analysis and potential model refinement, especially as the level of disruption rises to moderate or significant levels. In addition to serving as a diagnostic tool, Table 1 also serves as a robust indicator of the model’s high performance and significant contribution to the field. One remarkable feature of these results is the model’s ability to maintain relatively low MAD values across multiple commodities and objectives even as the level of disruption increases. This is a particularly noteworthy accomplishment, given that equality in commodity distribution is often compromised in real-world scenarios, especially under disruptions. The low MAD values signify that the model is exceptionally effective in achieving its dual objectives. Thus, Table 1 does more than diagnose the model’s performance; it effectively validates the model’s excellence in achieving challenging objectives under varying conditions, serving as compelling evidence of the research work’s high quality and its meaningful contribution to advancing the science of supply chain and transportation resilience.
4.3. Discussion
Our investigation into the MMFI Allocation strategy model across a spectrum of disruption scenarios has underscored its efficacy in promoting equitable distribution of commodities and enhancing overall network resilience. The model’s robust performance, particularly in maintaining high satisfaction levels among demand nodes during disruptions, underscores its viability for application in diverse logistical environments. This adaptability is crucial, given the varying nature of disruptions that transportation networks face, from natural disasters to systemic failures. Our findings highlight the model’s potential as a strategic asset in enhancing the resilience and equality of supply chain operations.
4.3.1. Mean Absolute Deviations Fairness vs. MMFI Strategy
To compare the performance of MMFI with existing research that addresses fairness in supply chain networks, we have tested the performance of our model and compared it with the fairness model proposed by [24]. The two optimization models were tested under the condition of multiple modes of transportation, which was not considered in the proposed model by [24]. The multimodal network was disrupted, considering different percentages of disruption, with 50 different scenarios for each disruption. The two models were tested on the Colombian freight flow and transportation systems. Figure 11 and Figure 12 show the satisfaction percentage of demand nodes for both optimization models. The result indicates that the MMFI strategy model significantly improved the satisfaction percentage of demand nodes for all sectors compared to the stratification percentage of the mean absolute deviation fairness model proposed by [24].
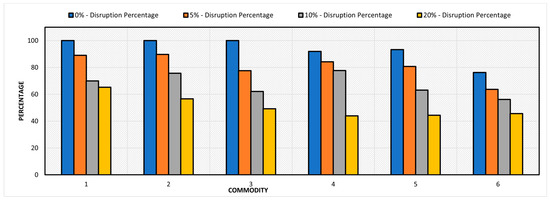
Figure 11.
The satisfaction percentage of demand nodes at different disruption levels for the mean absolute deviations fairness proposed by [24].

Figure 12.
The satisfaction percentage of demand nodes at different disruption levels for MMFI strategy.
Our findings reveal that the MCMILP model significantly enhances the resilience of transport networks, demonstrating a potent strategy for sustaining economic activities and providing equitable service access during disruptions. This resilience directly contributes to the strategic development goals of the transport industry, aligning with efforts to increase capacity, reduce operational times and costs, and improve service quality across global and national systems. This outcome underscores the model’s role in not only addressing the immediate challenges posed by disruptions but also contributing to the long-term strategic development and sustainability of multimodal transportation networks.
4.3.2. Comparative Analysis
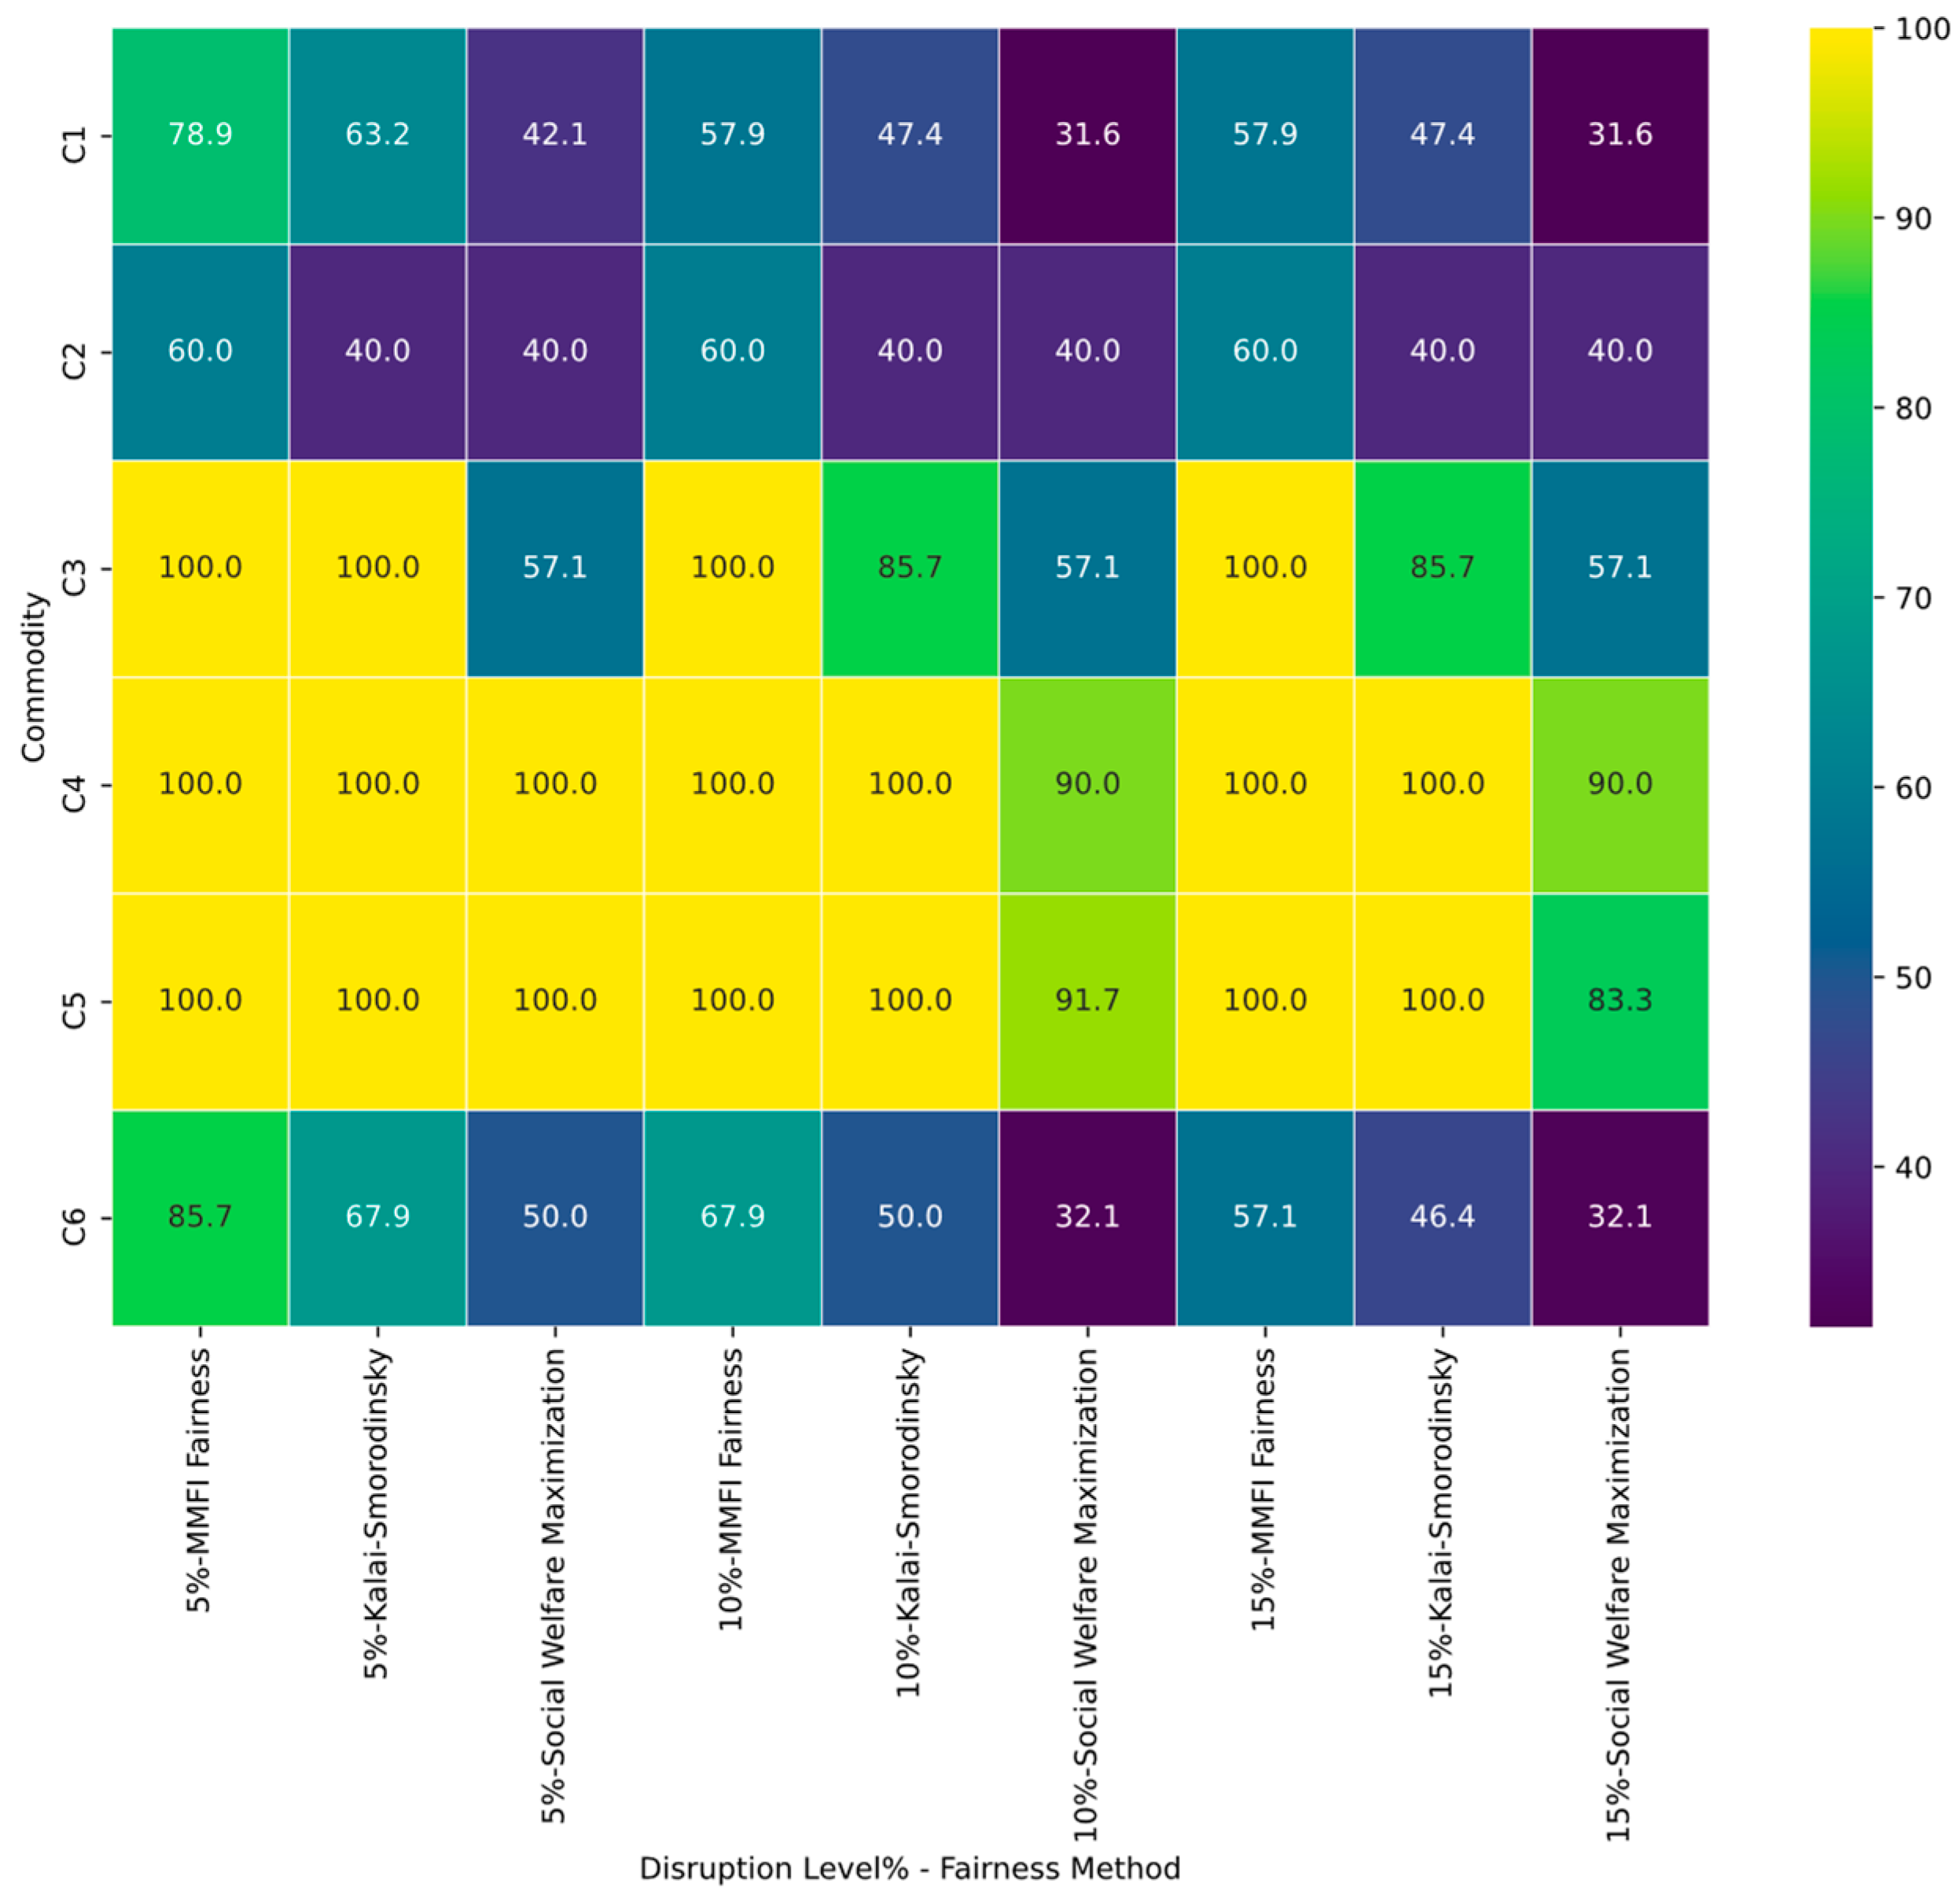
In order to provide additional insights into how our proposed MMFI methodology compares to other fairness-based schemes, Figure 13 presents a comparison between the MMFI approach and the two fairness-based allocation schemes commonly used in the literature: Kalai–Smorodinsky and social welfare maximization. This comparative analysis shows the percentage of nodes that reach their desired service levels for each commodity, under 5%, 10%, and 15% disruptions.
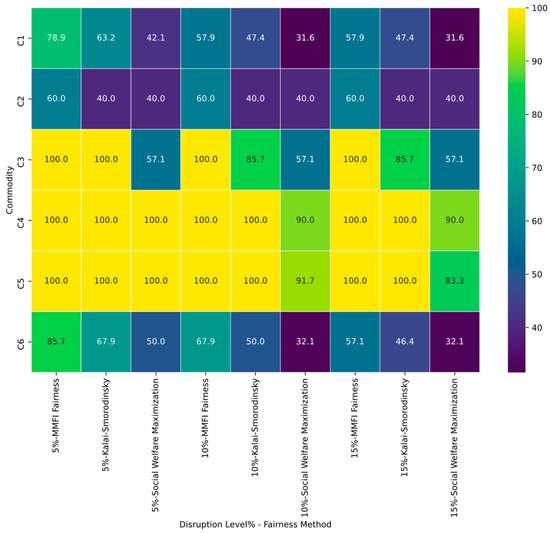
Figure 13.
Heatmap of node satisfaction percentages by resource allocation strategy, across disruption levels for each commodity.
Social Welfare. This method aims to maximize the aggregate utility across all nodes, thus optimizing the overall satisfaction within the system. The mathematical expression for this approach is as follows:
where represents the utility for each individual. While this strategy seeks to maximize the total benefit, it can sometimes lead to unequal distributions among the nodes, as it focuses on the collective outcome rather than individual fairness [47]. For our study, each utility represents the demand of each type of commodity being satisfied in each node.
Kalai–Smorodinsky. This approach is designed to maintain proportional equity among negotiating parties, ensuring that the gains from cooperation are divided in such a way that respects each party’s relative utility scale. Mathematically, if we consider a feasible set of and a disagreement point of d = , the solution adheres to the proportionality equation:
This model ensures that outcomes are scaled proportionally across the involved parties, facilitating a fair division of resources [48]. For our study, and are assumed to be the minimum possible utilities, i.e., where no demand is satisfied.
Moving from these theoretical underpinnings to practical outcomes, we examine the heatmap in Figure 13, which visually summarizes the performance of each resource allocation method in terms of satisfaction percentages for each commodity and different scenarios in the Colombian multimodal supply chain network. This visual representation helps to clearly delineate the effectiveness of each method under varying conditions of disruption.
MMFI, the methodology developed within this research, consistently excels in satisfying a large number of demand nodes across a spectrum of disruption levels. Particularly in high disruption scenarios, MMFI stands out for its ability to maintain high satisfaction levels, suggesting that its adaptive and dynamic allocation strategy effectively mitigates the challenges posed by increased supply chain disturbances.
In contrast, the Kalai–Smorodinsky method shows commendable performance under milder disruptions but appears to struggle as these conditions intensify. While it ensures proportional equity under normal circumstances, its ability to scale up in response to greater disruptions is somewhat limited, indicating that while suitable for stable environments, it may require supplementary strategies or adjustments to cope with higher levels of uncertainty.
Social welfare maximization takes a different approach, focusing less on individual node satisfaction and more on optimizing the overall system’s efficiency. Although this method may not achieve as high satisfaction percentages at the node level, it is remarkably effective in addressing the aggregate demands of the network. This characteristic is particularly valuable in scenarios where the primary goal is to maximize throughput and meet extensive system-wide requirements, even if this means some individual nodes are not fully satisfied. These observations suggest inherent trade-offs in choosing a fairness-based method: While MMFI promotes widespread node satisfaction, it may not always align with maximizing total system efficiency. On the other hand, social welfare maximization, despite lower individual satisfaction scores, excels in meeting broader system demands, highlighting its utility in large-scale operational contexts.
4.3.3. Implications for Strategic Development
The integration of equality and resilience, as demonstrated by the MMFI strategy model, is pivotal for the strategic enhancement of transportation networks worldwide. The model’s contribution goes beyond academic novelty; it offers practical insights for policymakers and industry practitioners grappling with the complexities of managing and optimizing transportation systems in the face of unforeseen disruptions. By foregrounding the principles of equitable resource distribution and network resilience, our study advocates for a recalibration of strategic priorities within the transportation sector, emphasizing the need for models that are not only efficient but also inherently fair.
Our findings suggest that the MMFI strategy model represents a paradigm shift in how transportation networks can be designed and managed to withstand and adapt to disruptions. Its application could lead to more resilient infrastructure, capable of maintaining high levels of service and efficiency, even under adverse conditions. This approach aligns with broader objectives within the field of transportation logistics and supply chain management, aiming to create systems that are not only robust but also just and efficient.
4.3.4. Broader Applicability of the MMFI Strategy Model
The inherent flexibility of the MMFI strategy multimodal–multi-commodity transportation network model positions it as a versatile tool capable of addressing the universal challenge of efficient resource distribution across diverse transportation and supply chain scenarios. Designed with flexibility at its core, the model can be tailored to various geographical landscapes, infrastructure complexities, and types of disruptions, making it broadly applicable in different global contexts.
Whether applied to densely connected urban networks or to areas with sparse transportation links, the model’s principles of the MMFI strategy ensure its relevance and effectiveness. Its robust framework can accommodate a wide range of network configurations, commodities, and transportation modes, thus offering a strategic asset for regions with varying logistical challenges.
The model’s efficacy in managing disruptions, from minor disturbances to major crises, further exemplifies its utility for disaster preparedness and resilience planning. It provides stakeholders with a powerful tool for simulating diverse disruption scenarios, thereby enhancing transportation networks’ resilience against unpredictable challenges.
4.3.5. Validation and Future Directions
The validation of our model through the case study of Colombia’s transportation network underscores its practical applicability and robustness. This successful application in a complex setting demonstrates the model’s capability and provides a foundation for its deployment in other contexts. Future research could focus on comparative studies across different settings to explore the model’s versatility and effectiveness further. Such studies could illuminate how the model adapts to unique challenges presented by various countries or regions, each with distinct transportation infrastructure and disruption risks.
5. Conclusions and Future Work
In this paper, we introduced an MMFI strategy approach designed for multimodal transportation networks that are susceptible to disruptive events. This model is pivotal in optimizing resources allocation, while considering the costs associated with disruptions impacting supply chain network performance. Our approach prioritizes efficient resource allocation and seeks to ensure that the distribution of commodities remains efficient and cost-efficient under various levels of network disruptions, which are classified as minor, moderate, and significant for the study.
Through our multicriteria optimization with an MMFI strategy approach, we address a multi-objective problem to achieve optimality, thereby reducing the impact of disruptive events on transportation networks. The model was meticulously developed to meet the minimum network requirements at demand nodes, factoring in the limited capacity of network links, required service levels, and the quantum of commodity demand. An illustrative case study leveraging Colombia’s multimodal cargo transportation networks exemplifies our approach’s practical application.
The results from our research underscore the model’s effectiveness in facilitating an efficient commodity distribution among demand nodes. This approach not only aligns with Sustainable Development Goal 9, by fostering innovation and building resilient infrastructure within the industry, but also directly contributes to Goal 10 [4] by mitigating inequalities. By ensuring that even the least-served nodes receive efficient access to resources, our model plays a critical role in promoting inclusive and sustainable economic growth. This is particularly pertinent in the context of global supply chains, where resilience is paramount to withstand and quickly recover from disruptions.
Additionally, the outcomes demonstrate a high satisfaction rate among demand nodes across different disruption scenarios, highlighting the robustness of our model. The analysis of the maximum absolute deviations (MAD) reveals our approach’s substantial impact in minimizing disparities in commodity distribution, thereby enhancing supply chain resilience.
In conclusion, our study contributes a critical piece to the puzzle of creating sustainable, efficient, and resilient transportation networks. By addressing key strategic objectives through the lens of our MCMILP model, we offer a pathway toward transforming the transport industry to better meet the needs of today’s economy and society. By embedding an MMFI strategy into the planning and operation of multimodal transportation networks, our work lays a foundational step towards achieving a more sustainable and equitable future. It emphasizes the critical need for resilient supply chains that not only support sustainable economic growth but also contribute significantly to reducing inequalities. In doing so, our research directly addresses the core objectives of Sustainable Development Goals 9 and 10 (United Nations, n.d.), underscoring the interconnectedness of industry, innovation, infrastructure, and social equity in crafting sustainable, resilient, and inclusive supply networks.
Future Work and Limitations
The proposed model is designed to provide a mitigation strategy when dealing with disruptions immediately after a disruptive event in a multimodal–multi-commodity transportation network and does not consider long-term recovery plans. The developed model can be extended by including restoration planning for the transportation network while considering efficient commodity distribution. Future research will explore the extension of this model to diverse transportation contexts and the integration of innovative technologies and practices to further enhance network resilience and sustainability. Moreover, the proposed model could be further improved by enabling the study of multiple subsequent disruptive events. Also, the model was designed to deal specifically with the downstream supply chain networks but could be extended to deal with multiple stages that incorporate how commodities are transformed within the multiple echelons of the supply chain network, from raw materials to finalized products.
Author Contributions
Conceptualization, O.Y.M., S.R.-G. and A.D.G.; Data curation, O.Y.M. and A.D.G.; Formal analysis, O.Y.M. and S.R.-G.; Funding acquisition, A.D.G.; Investigation, O.Y.M., A.D.G., S.R.-G.; Methodology, O.Y.M., S.R.-G. and A.D.G.; Resources, A.D.G.; Software, O.Y.M. and S.R.-G.; Supervision, A.D.G.; Validation, O.Y.M. and S.R.-G.; Writing—original draft, O.Y.M.; Writing review & editing, O.Y.M., S.R.-G. and A.D.G. All authors have read and agreed to the published version of the manuscript.
Funding
This research was partially funded by the National Institute of Standards and Technology (NIST) Center of Excellence for Risk-Based Community Resilience Planning through a cooperative agreement with Colorado State University [70NANB20H008 and 70NANB15H044]. This research was also partially funded by the National Science Foundation (NSF) through award 2052930. Article processing charge was partially provided by the University of Oklahoma Libraries’ Open Access Fund.
Institutional Review Board Statement
Not applicable.
Informed Consent Statement
Not applicable.
Data Availability Statement
The data presented in this study are available on request from the corresponding author.
Acknowledgments
The contents expressed in this paper are the views of the authors and do not necessarily represent the opinions or views of the National Institute of Standards and Technology (NIST) or the National Science Foundation (NSF), University of Oklahoma (OU) or King Khalid University (Saudi Arabia).
Conflicts of Interest
The authors declare no conflict of interest.
References
- Altay, N.; Ramirez, A. Impact of disasters on firms in different sectors: Implications for supply chains. J. Supply Chain Manag. 2010, 46, 59–80. Available online: https://ssrn.com/abstract=1786842 (accessed on 13 May 2021). [CrossRef]
- Amaldi, E.; Coniglio, S.; Taccari, L. Maximum throughput network routing subject to fair flow allocation. In Lecture Notes in Computer Science (Including Subseries Lecture Notes in Artificial Intelligence and Lecture Notes in Bioinformatics); Springer: Cham, Switzerland, 2014; Volume 8596, pp. 1–12. [Google Scholar] [CrossRef]
- Ho, W.; Zheng, T.; Yildiz, H.; Talluri, S. Supply chain risk management: A literature review. Int. J. Prod. Res. 2015, 53, 5031–5069. [Google Scholar] [CrossRef]
- United Nations. (n.d.). The 17 Goals. Department of Economic and Social Affairs, Sustainable Development. Available online: https://sdgs.un.org/goals (accessed on 21 January 2024).
- United Nations Conference on Trade and Development. United Nations Convention on International Multimodal Transport of Goods. 1980. Available online: https://unctad.org/system/files/official-document/tdmtconf17_en.pdf (accessed on 21 January 2024).
- Huang, M.; Hu, X.; Zhang, L. A decision method for disruption management problems in intermodal freight transport. In Smart Innovation, Systems and Technologies, 10th ed.; Springer: Berlin/Heidelberg, Germany, 2011; Volume 10, pp. 13–21. [Google Scholar] [CrossRef]
- Aday, S.; Aday, M.S. Impact of COVID-19 on the food supply chain. Food Qual. Saf. 2020, 4, 167–180. [Google Scholar] [CrossRef]
- Thangavelu, S.; Chongvilaivan, A. Managing Global Supply Chain Disruptions: Experience from Thailand’s 2011 Flooding. In Globalization, Outsourcing and Labour Development in ASEAN; Routledge: London, UK, 2011. [Google Scholar] [CrossRef]
- Kersten, W.; Ringle, C.M.; Blecker, T. Adapting to the Future: How Digitalization Shapes Sustainable Logistics and Resilient Supply Chain Management; Hamburg University of Technology (TUHH), Institute of Business Logistics and General Management. 2021, Volume 31. Available online: https://econpapers.repec.org/bookchap/zbwhiclpr/31.htm (accessed on 3 August 2021).
- Ni, N.; Howell, B.J.; Sharkey, T.C. Modeling the impact of unmet demand in supply chain resiliency planning. Omega 2018, 81, 1–16. [Google Scholar] [CrossRef]
- Craighead, C.W.; Blackhurst, J.; Rungtusanatham, M.J.; Handfield, R.B. The severity of supply chain disruptions: Design characteristics and mitigation capabilities. Decis. Sci. 2007, 38, 131–156. [Google Scholar] [CrossRef]
- Daehy, Y.H.; Krishnan, K.K.; Alsaadi, A.K.; Alghamdi, S.Y. Effective cos minimization strategy and an optimization model of a reliable global supply chain system. Uncertain Supply Chain Manag. 2019, 7, 381–398. [Google Scholar] [CrossRef]
- Katsaliaki, K.; Galetsi, P.; Kumar, S. Supply chain disruptions and resilience: A major review and future research agenda. Ann. Oper. Res. 2021, 319, 965–1002. [Google Scholar] [CrossRef]
- Bhattacharya, A.; Kumar, S.A.; Tiwari, M.K.; Talluri, S. An intermodal freight transport system for optimal supply chain logistics. Transp. Res. Part C Emerg. Technol. 2014, 38, 73–84. [Google Scholar] [CrossRef]
- SteadieSeifi, M.; Dellaert, N.; Nuijten, W.; Van Woensel, T.; Raoufi, R. Multi-modal freight transportation planning: A literature review. Eur. J. Oper. Res. 2014, 233, 1–15. [Google Scholar] [CrossRef]
- Cohen, E.; Megiddo, N. Algorithms and complexity analysis for some flow problems. Algorithmica 1994, 11, 320–340. [Google Scholar] [CrossRef]
- Hayden, H.P. Voice Flow Control in Integrated Packet Networks. Ph.D. Thesis, Defense Technical Information Center, Fort Belvoir, VA, USA, 1981. Tech. Rep.. Available online: https://dspace.mit.edu/handle/1721.1/15891 (accessed on 13 May 2021).
- Jaffe, J.M. Bottleneck flow control. IEEE Trans. Commun. 1981, 29, 954–962. [Google Scholar] [CrossRef]
- Retvari, G.; Biro, J.J.; Cinkler, T. Fairness in capacitated networks: A polyhedral approach. In Proceedings of the IEEE INFOCOM 2007—26th IEEE International Conference on Computer Communications, Anchorage, AK, USA, 6–12 May 2007. [Google Scholar]
- Bin Obaid, H.S.; Trafalis, T.B. An approximation to max min fairness in multi commodity networks. Comput. Manag. Sci. 2020, 17, 65–77. [Google Scholar] [CrossRef]
- Du, B.; Pan, C.; Zhang, W.; Chen, M. Distributed energy-efficient power optimization for comp systems with max-min fairness. IEEE Commun. Lett. 2014, 18, 999–1002. [Google Scholar] [CrossRef]
- Kleinberg, J.; Rabani, Y.; Tardos, E. Fairness in routing and load balancing. In Proceedings of the 40th Annual Symposium on Foundations of Computer Science, New York, NY, USA, 17–19 October 1999; pp. 568–578. [Google Scholar]
- Liu, S.; Papageorgiou, L.G. Fair profit distribution in multi-echelon supply chains via transfer prices. Omega 2018, 80, 77–94. [Google Scholar] [CrossRef]
- Abushaega, M. The Role of Fairness-Based Distribution to Enhance the Resilience of Downstream Supply Chain Networks. Ph.D. Thesis, The University of Oklahoma, Norman, OK, USA, 2021. [Google Scholar]
- Eshghi, K.; Larson, R.C. Disasters: Lessons from the past 105 years. Disaster Prev. Manag. Int. J. 2008, 17, 62–82. [Google Scholar] [CrossRef]
- Kunz, M.; Mühr, B.; Kunz-Plapp, T.; Daniell, J.E.; Khazai, B.; Wenzel, F.; Vannieuwenhuyse, M.; Comes, T.; Elmer, F.; Schröter, K.; et al. Investigation of superstorm sandy 2012 in a multi-disciplinary approach. Nat. Hazards Earth Syst. Sci. 2013, 13, 2579–2598. [Google Scholar] [CrossRef]
- Berger, P.D.; Gerstenfeld, A.; Zeng, A.Z. How many suppliers are best? A decision-analysis approach. Omega 2004, 32, 9–15. [Google Scholar] [CrossRef]
- Meena, P.; Sarmah, S. Multiple sourcing under supplier failure risk and quantity discount: A genetic algorithm approach. Transp. Res. Part E Logist. Transp. Rev. 2013, 50, 84–97. [Google Scholar] [CrossRef]
- Hou, J.; Zeng, A.Z.; Zhao, L. Coordination with a backup supplier through buy-back contract under supply disruptio. Transp. Res. Part E Logist. Transp. Rev. 2010, 46, 881–895. [Google Scholar] [CrossRef]
- Soni, U.; Jain, V.; Kumar, S. Measuring supply chain resilience using a deterministic modeling approach. Comput. Ind. Eng. 2014, 74, 11–25. [Google Scholar] [CrossRef]
- Lin, C.-C.; Wang, T.-H. Build-to-order supply chain network design under supply and demand uncertainties. Transp. Res. Part B Methodol. 2011, 45, 1162–1176. [Google Scholar] [CrossRef]
- Santoso, T.; Ahmed, S.; Goetschalckx, M.; Shapiro, A. A stochastic programming approach for supply chain network design under uncertainty. Eur. J. Oper. Res. 2005, 167, 96–115. [Google Scholar] [CrossRef]
- Smith, A.; Vidal, J.M. A Practical Multiagent Model for Resilience in Commercial Supply Networks. 2010. Available online: http://www.sics.se/tac/page.php?Id=13 (accessed on 13 May 2021).
- Fahimnia, B.; Jabbarzadeh, A. Marrying supply chain sustainability and resilience: A match made in heaven. Transp. Res. Part E Logist. Transp. Rev. 2016, 91, 306–324. [Google Scholar] [CrossRef]
- Liu, Y.; Lyu, C.; Liu, Z.; Cao, J. Exploring a large-scale multi-modal transportation recommendation system. Transp. Res. Part C Emerg. Technol. 2021, 126, 103070. [Google Scholar] [CrossRef]
- Zhang, L.; Yang, H.; Wu, D.; Wang, D. Solving a discrete multi-modal transportation network design problem. Transp. Res. Part C Emerg. Technol. 2014, 49, 73–86. [Google Scholar] [CrossRef]
- Burgholzer, W.; Bauer, G.; Posset, M.; Jammernegg, W. Analysing the impact of disruptions in intermodal transport networks: A micro simulation-based model. Decis. Support Syst. 2013, 54, 1580–1586. [Google Scholar] [CrossRef]
- Albertzeth, G.; Pujawan, I.N.; Hilletofth, P.; Tjahjono, B. Mitigating transportation disruptions in a supply chain: A cost-effective strategy. Int. J. Logist. Res. Appl. 2020, 23, 139–158. [Google Scholar] [CrossRef]
- Fialkoff, M.R.; Omitaomu, O.A.; Peterson, S.K.; Tuttle, M.A. Using geographic information science to evaluate legal restrictions on freight transportation routing in disruptive scenarios. Int. J. Crit. Infrastruct. Prot. 2017, 17, 60–74. [Google Scholar] [CrossRef]
- Ishfaq, R. Resilience through flexibility in transportation operations. Int. J. Logist. Res. Appl. 2012, 15, 215–229. [Google Scholar] [CrossRef]
- Narayanaswami, S.; Rangaraj, N. Modelling disruptions and resolving conflicts optimally in a railway schedule. Comput. Ind. Eng. 2013, 64, 469–481. [Google Scholar] [CrossRef]
- Zilko, A.A.; Kurowicka, D.; Goverde, R.M.P. Modeling railway disruption lengths with copula bayesian networks. ransp. Res. Part C Emerg. Technol. 2016, 68, 350–368. [Google Scholar] [CrossRef]
- Chen, L.; Miller-Hooks, E. Resilience: An indicator of recovery capability in intermodal freight transport. Transp. Sci. 2012, 46, 109–123. [Google Scholar] [CrossRef]
- Huang, Y.; Wang, Z. Dual-recycling channel decision in a closed-loop supply chain with cost disruptions. Sustainability 2017, 9, 2004. [Google Scholar] [CrossRef]
- Ahmadi-Javid, A.; Seddighi, A.H. A location-routing problem with disruption risk. Transp. Res. Part E Logist. Transp. Rev. 2013, 53, 63–82. [Google Scholar] [CrossRef]
- Leclerc, P.D.; Mclay, L.A.; Mayorga, M.E. Modeling equity for allocating public resources. In Community-Based Operations Research; Springer: Berlin/Heidelberg, Germany, 2012; pp. 97–118. [Google Scholar] [CrossRef]
- Sheng, C. Maximization of Utility and the Objective Function. In A New Approach to Utilitarianism; Springer: Dordrecht, The Netherlands, 1991; pp. 355–400. [Google Scholar] [CrossRef]
- Kalai, E.; Smorodinsky, M. Other Solutions to Nash’s Bargaining Problem. Econometrica 1975, 43, 513–518. [Google Scholar] [CrossRef]


Disclaimer/Publisher’s Note: The statements, opinions and data contained in all publications are solely those of the individual author(s) and contributor(s) and not of MDPI and/or the editor(s). MDPI and/or the editor(s) disclaim responsibility for any injury to people or property resulting from any ideas, methods, instructions or products referred to in the content. |
© 2024 by the authors. Licensee MDPI, Basel, Switzerland. This article is an open access article distributed under the terms and conditions of the Creative Commons Attribution (CC BY) license (https://creativecommons.org/licenses/by/4.0/).