Article

Study on the Spatial Layout and Influencing Factors of Campsites in the Yellow River Basin

School of Physical Sciences, Qufu Normal University, Qufu 273165, China
*
Author to whom correspondence should be addressed.
Sustainability 2024, 16(12), 4944; https://doi.org/10.3390/su16124944
Submission received: 22 April 2024 / Revised: 29 May 2024 / Accepted: 4 June 2024 / Published: 9 June 2024
(This article belongs to the Special Issue Green Tourism Consumption and Sustainable Development)

Abstract

:
Based on the camping sites in the Yellow River Basin published by Amap, this study examines the spatial distribution pattern of camping sites using various indices, including the average nearest neighbor index, geographical concentration index, disequilibrium index, and kernel density estimation. The research findings are as follows: (1) Camping sites exhibit a highly significant agglomeration distribution, and the spatial scale presents a non-equilibrium characteristic of “east dense west sparse”. The distribution density of camping sites shows clear hot and cold spots, forming a general pattern of “one belt, one mass, two points”. The locations of these camping sites commonly follow the rule of “backing mountains, along roads, and accompanied by scenery”. (2) The spatial distribution of camping sites is influenced by both natural factors, such as elevation and air quality, and social factors, such as highway mileage and the number of high-level scenic spots. The impact of social factors is found to be more substantial than that of natural environmental factors.

1. Introduction

1.1. Background

As the most important ecological barrier and economic belt in the north of China, the high-quality development of the Yellow River Basin plays an important role in promoting the upgrading and transformation of the industrial structure in the north and even in the whole country [1]. However, because the Yellow River Basin is dominated by the chemical energy industry, it has caused huge ecological problems and is in urgent need of new green industry transformation. Camping, as a new type of industry combining sports and tourism, is a kind of tourism resource that can coexist harmoniously with the ecological environment [2]. It is expected that the core market size of China’s camping economy will rise to CNY 248.32 billion in 2025, and the driven market size will reach CNY 1440.28 billion [3]; however, most of China’s camping industry is resource-dependent and shows rough growth, leading to the disorderly expansion of the whole capital market [4]. Exploring the spatial distribution characteristics of campsites in the Yellow River Basin and the influencing factors is conducive to optimizing the layout of campsites, promoting the sustained and long-lasting development of the camping economy, and boosting the high-quality development of the Yellow River Basin industry.

1.2. Literature Review

1.2.1. Campground Operation Management Research

KC Gibbs conducted an analysis of the facilities, operational maintenance, and opportunity costs of campgrounds in Region 6 of the United States Forest Service (USFS). The study revealed that the facility costs are the most significant [5]. Consequently, numerous scholars have actively explored various strategies to improve campground operations to reduce facility costs. For instance, Milohni’s research provides insights into the selection of campground facilities, emphasizing that urbanization and an aging population are critical factors in campground development. This necessitates the offering of high-quality products, innovative camping forms, and outdoor activities [6]. Joungkoo Park investigated campgrounds from the perspectives of social equity and fee levels, examining camping activities and related products [7]. Additionally, Edward Brooker explored the experiential needs of campgrounds through market segmentation [8].

1.2.2. Research on Sustainable Development of Campgrounds

Visitor satisfaction is a critical factor in the development of campgrounds. Connelly A.N. conducted a survey of 800 visitors at campgrounds within the Adirondack Park, revealing that solitude/rejuvenation, nature, and facility characteristics are key factors influencing visitor satisfaction [9]. Similarly, R.J. Foster explored visitor satisfaction from a different perspective. He surveyed 438 visitors at seven Alberta Provincial Park campgrounds, concluding that satisfaction was higher in structured (non-random) campgrounds compared to unstructured (random) ones, and higher among campers with prior experience at the campground [10]. Camping symbolizes a harmonious relationship between humans and nature, and maintaining this relationship is essential for the sustainable development of camping. S.T. Mallikage and P. Perera examined the biophysical impacts of human camping activities in Sri Lankan national parks [11,12]. Additionally, Kyungsik Kim conducted a survey of 400 campers in Yunnan Province, China, finding that ecotourism motivations positively influenced satisfaction, place attachment, and environmental responsibility behaviors [13]. These studies contribute significantly to the sustainable development of campground ecology.

1.2.3. Campsite Planning Study

Yan-Ning Luo utilized the planning and design process of the automobile campsite at the Nanjing Dashihu Ecological Tourism Resort as a case study. Starting from an examination of planning and design methods, this research integrates successful campsite construction experiences from Europe and the United States to provide methods for the development of campsites in China [14]. Gaładyk P conducted a study on RV campsites in Australia, employing the point bonitation method to analyze the most and least attractive areas. Pearson correlation analysis demonstrated a significant relationship between the attractiveness of tourist areas and the distribution of campsites in Western Australia [15]. Additionally, Francisca Jesús Sánchez-Sánchez explored camping in Spain using multiple variable analysis techniques. The study concluded that the geographical location of a tourist destination is a decisive factor in the siting of new campsites [16].
This study aims to identify a more intuitive method for optimizing campsite construction patterns through a comprehensive review and analysis of the existing research by numerous scholars. While there have been studies on campsite location selection, few have utilized geographical research methods. The advantage of using geographical methods lies in their ability to provide a holistic view of campsite distribution in a given region, addressing the limitations of isolated micro-level studies. Additionally, geographical methods allow for a thorough analysis of various factors—geographical, social, and others—beyond the subjective perspectives of tourists. This provides a more objective basis for campsite location decisions. Consequently, this paper seeks to explore and establish a comprehensive and objective index system of influencing factors. This system aims to offer guidance for the regional layout adjustments of campsites in the Yellow River Basin, enhance the quality of tourism, facilitate industrial structure transformation, and contribute to the sustainable economic development of the region.

2. Data Sources and Study Area

2.1. Data Sources

To gather data for this study, we established a spatial database containing the basic information of camping sites within the Yellow River Basin. All data were sourced from the latest authoritative sources published by provincial and national authorities. The data can be categorized into geospatial and socio-economic data:
(1)
Map data, DEM elevation, and natural environment indicators were obtained from the Data Center for Resources and Environmental Sciences of the Chinese Academy of Sciences (https://www.resdc.cn/, accessed on 28 May 2024), websites of provincial water conservancy departments, and the 2023 Provincial Environmental and Ecological Status Bulletin.
(2)
Social development and economic statistics were sourced from the 2023 China Statistical Yearbook and Provincial Statistical Yearbooks.
The campsite POI data were acquired using the Python 3.10 tool, which captured information based on the POI classification code table released by AmAP 10.8. Specifically, the “Campsite” subcategory under the “Leisure Place” category within the “Sports and Leisure Services” category was selected as the “POI type”.

2.2. Basic Overview of the Study Area

Currently, there is no consensus on a unified definition for the Yellow River Basin among academics. We drew from policy documents, such as the “Outline of the Development Plan for the Yangtze River Economic Belt” and the “Outline of the 14th Five-Year Plan for the Revitalization of Northeast China”, and synthesized the related literature.
Sichuan Province and the four eastern municipalities of Inner Mongolia (Chifeng, Tongliao, Xing’anmeng, and He’renbeier) are classified into the Yangtze River Economic Belt and the Northeast Region, respectively [17,18,19]. Therefore, the study area of the Yellow River Basin in this paper is defined as follows (Figure 1): Qinghai Province, Gansu Province, Ningxia Hui Autonomous Region, Inner Mongolia Autonomous Region (Ulaanchab, Hohhot, Baotou, Bayannur, Ordos, Alashan League, and Wuhai City), Shanxi Province, Shaanxi Province, Henan Province, and Shandong Province. Meanwhile, for research convenience and in accordance with the relevant literature [20], we further classify the regions within the Yellow River Basin as follows: Upper reaches of the Yellow River: Qinghai Province, Gansu Province, Ningxia Hui Autonomous Region, and Inner Mongolia Autonomous Region. Middle reaches of the Yellow River: Shanxi Province and Shaanxi Province. Lower reaches of the Yellow River: Henan Province and Shandong Province.

3. Research Methods

3.1. Nearest Neighbor Index

The Nearest Neighbor Index (NNI) effectively reflects the spatial distribution characteristics of point-like elements [22,23,24]. To analyze campsites at the Yellow River basin level, we approximate them as point-like targets and evaluate their spatial distribution using the NNI. The NNI is calculated as the ratio of the actual nearest neighbor distance to the theoretical nearest neighbor distance using the following formula:
R = r 1 ¯ r E ¯ = 2 D = 2 m A
where:
R represents the NNI.
If R = 1, it indicates a random distribution of campsites.
If R < 1, it signifies a clustered distribution of campsites.
If R > 1, it denotes an even distribution of campsites.
In the formula, r 1 ¯ represents the actual nearest neighbor distance, r E ¯ represents the theoretical nearest neighbor distance, D represents the density of camping sites, m represents the number of camping sites, and A represents the area of the study region.

3.2. Geographical Concentration Index

The Geographical Concentration Index (GCI) assesses the concentration of point elements within a geographical space [25]. In this study, we utilized the GCI to investigate the distribution concentration of campgrounds in the Yellow River Basin. The GCI is calculated using the following formula:
G = 100 × i = 1 n P i Q 2
where:
G denotes the Geographic Concentration Index.
Pi denotes the number of campsites in the ith province.
n denotes the number of provinces and autonomous regions.
Q denotes the total number of campsites in the Yellow River Basin.
The G value ranges from 0 to 100, where a higher value indicates a higher concentration of campsites, while a lower value signifies a more dispersed distribution of campsites within the region.

3.3. Imbalance Index

The Disequilibrium Index is utilized to assess the distributional equilibrium of point elements in the study region and is calculated using the Lorenz curve with the following formula:
S = i = 1 n Y i 50 n + 1 100 × n 50 n + 1
where:
S denotes the Imbalance Index.
n   represents the number of provinces and autonomous regions.
Y denotes the cumulative percentage of campsites in each province or autonomous region, sorted from the highest to lowest proportion of campsites in the entire Yellow River Basin. The S value ranges from 0 to 1, where a higher value indicates a greater imbalance in the distribution of campsites across provinces and autonomous regions. If S = 0, it signifies an even distribution of campsites across provinces or autonomous regions. On the other hand, if S = 1, it implies that campsites are concentrated entirely within a single province or autonomous region.

3.4. Kernel Density Estimation

Kernel Density Estimation (KDE) is a nonparametric method for estimating spatial density using a data density function clustering algorithm. The KDE process assigns different weights to various distances from the sample center point of an event using a kernel function, resulting in a smoother density map that can reveal density attributes in unknown regions of the study area [26]. KDE is calculated as follows:
f h x = 1 n h i = 1 n K x i x h
f h x denotes the estimated density for the location x.
n signifies the total count of data points in the dataset.
h denotes the search radius or bandwidth.
K (x) represents the kernel function.
x i   indicates the location of the ith point in the dataset. The kernel function K (x) determines the weight assigned to each point within the bandwidth. The KDE results reveal geographic allocation and density patterns for data points within the study area.

4. Spatial Layout Analysis of Campgrounds in the Yellow River Basin

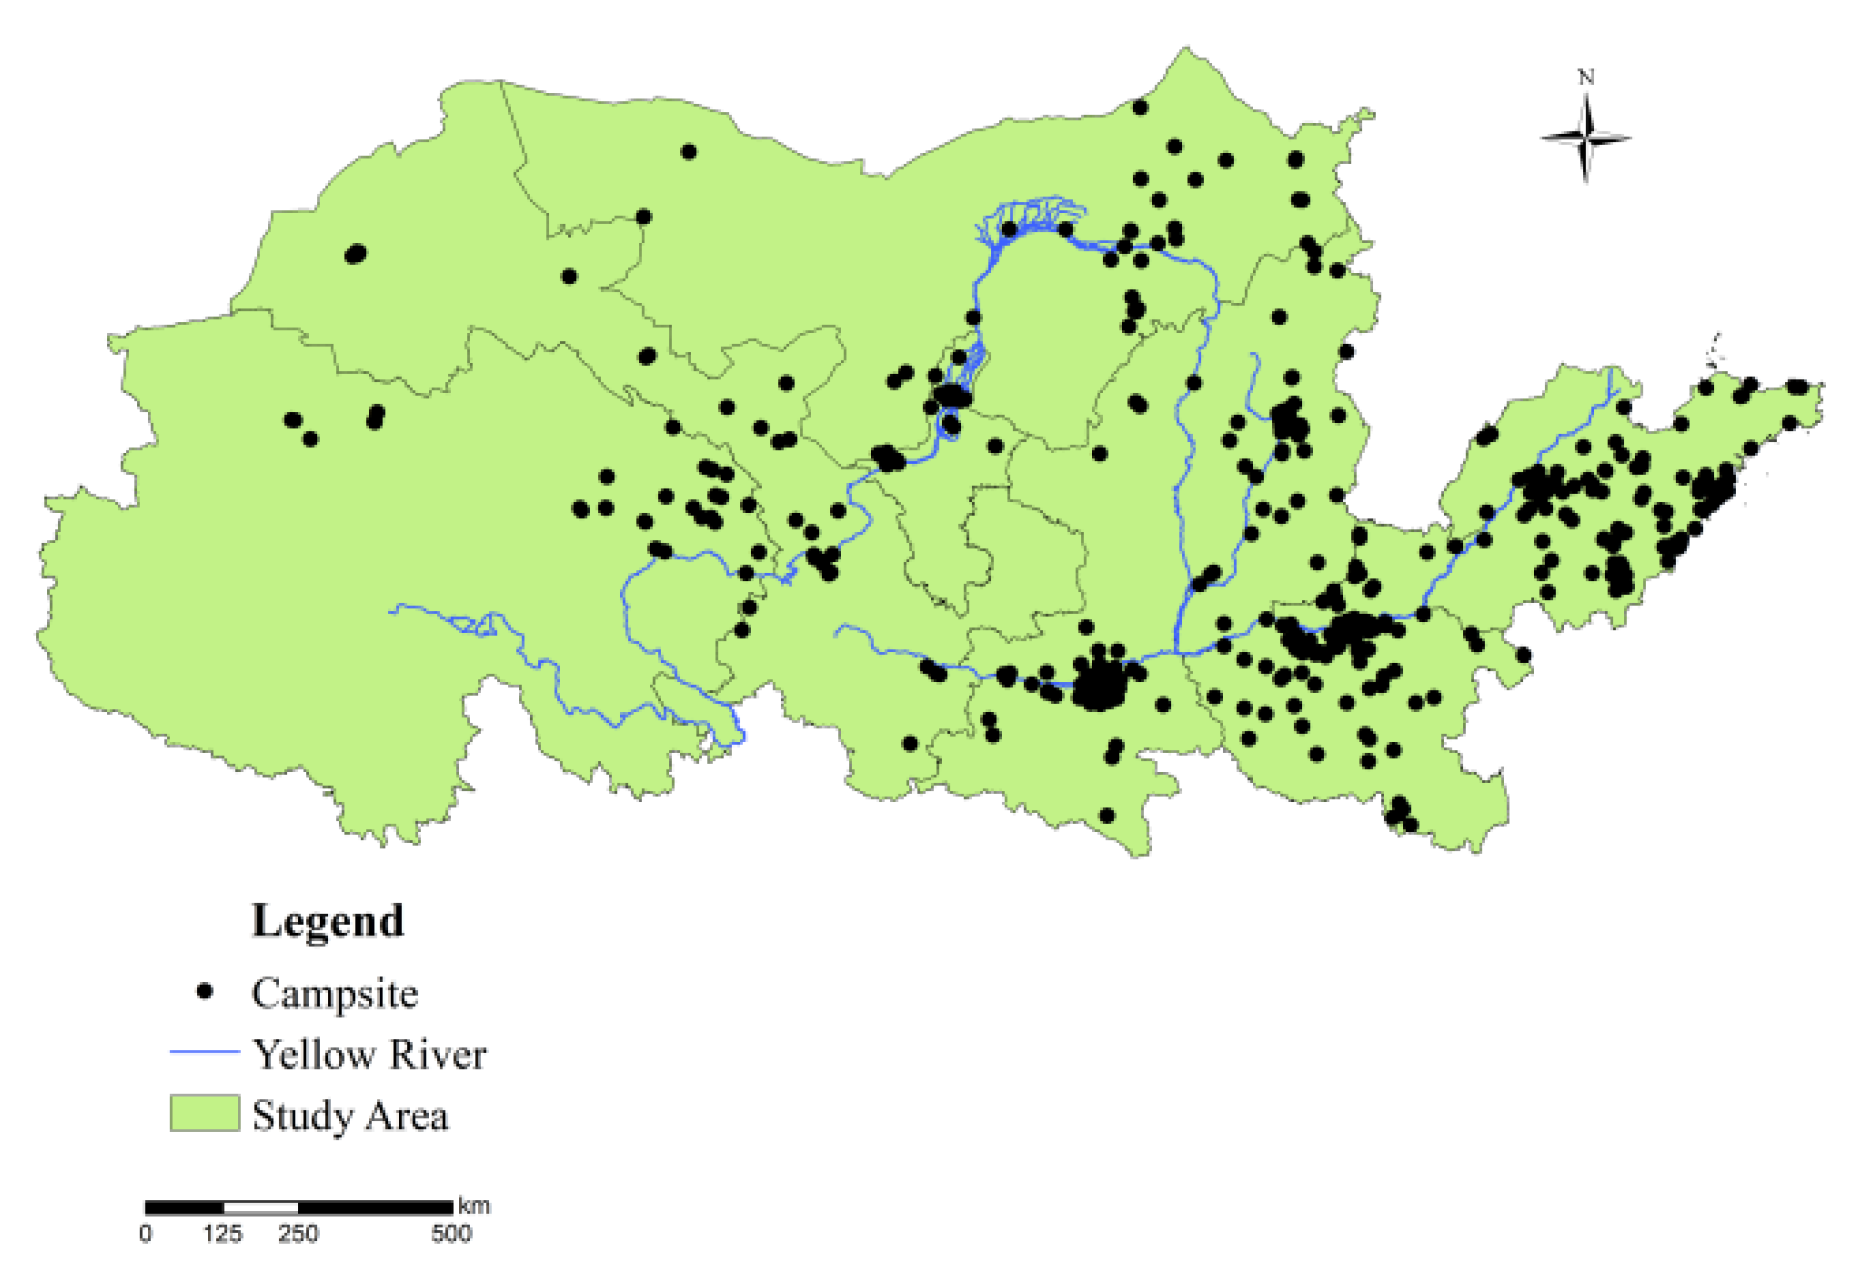
4.1. General Characteristics of Spatial Distribution

Campgrounds within the study area display a clustered arrangement, with higher densities observed toward the east and reduced densities toward the west (Figure 2). By calculating the Nearest Neighbor Index (NNI), it is understood that the actual nearest neighbor distance for the campsites is 16,747 m, while the calculated distance to the nearest theoretical neighbor measures 44,318 m. The resulting NNI of 0.379 is significantly less than 1, indicating that the campsites in the Yellow River Basin exhibit a clustered distribution.
The distribution of campgrounds in the Yellow River Basin exhibits two distinct characteristics: they are primarily situated along the river and concentrated in downstream regions. Specifically, Henan Province and Shandong Province have the highest number of campgrounds, accounting for 42.5% of the total in the Yellow River Basin. In contrast, Qinghai Province and the Ningxia Hui Autonomous Region have the fewest campgrounds, comprising only 12.4% of the total. The distribution characteristics of campgrounds correspond to the development priorities in different regions of the Yellow River: the upper and middle reaches of the Yellow River are designated as prohibited or restricted development zones due to the fragile ecological environment of the basin, with a primary focus on ecological protection. Conversely, the middle and lower reaches are classified as optimized and key development zones, emphasizing commercial development.

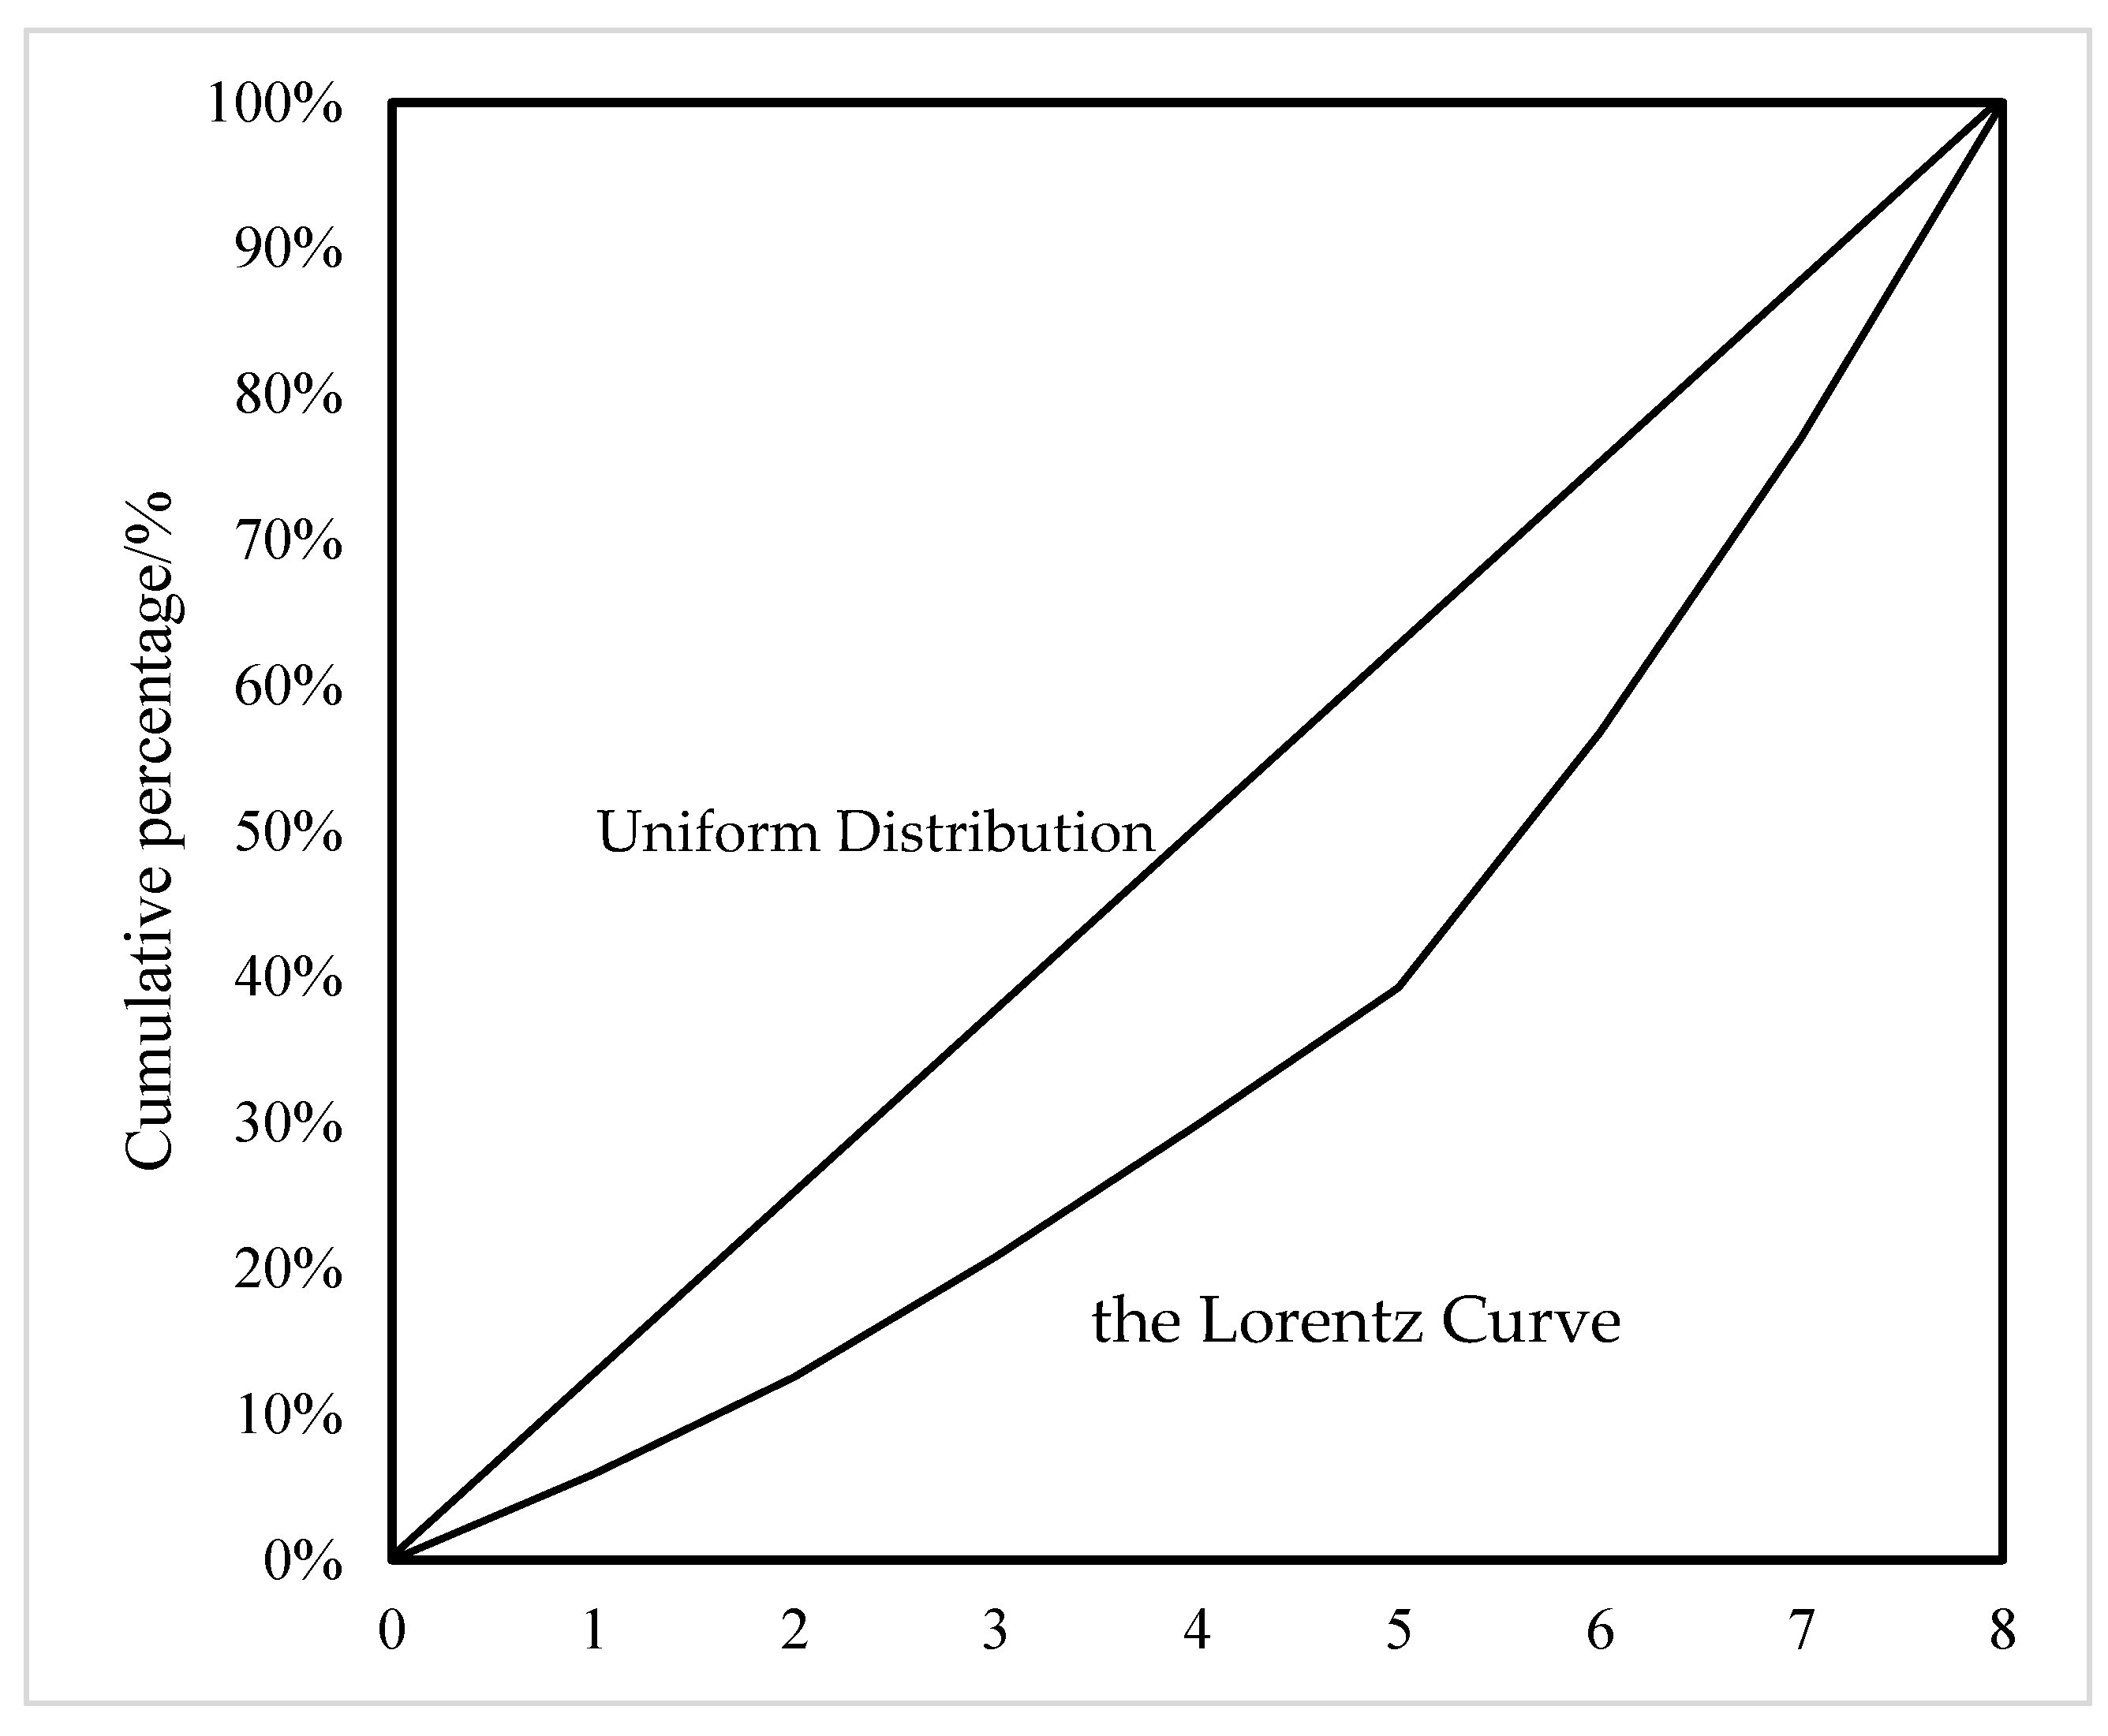
4.2. Analysis of Spatial Distribution Equilibrium

Campsites in the Yellow River Basin exhibit a non-equilibrium, concentrated distribution. By inputting the campsite data obtained through Python into the Geographic Concentration Index ( G ) formula, we found that G = 7.71. If 518 campsites were evenly distributed among eight administrative divisions within the study area, each province would have approximately 64.75 campsites, resulting in a theoretical G 0 of 6.25. As G > G 0, this indicates a more concentrated distribution of campsites within the study area.
Utilizing the cumulative weights presented in Table 1, at the provincial scale, the Imbalance Index S for the distribution of campgrounds within the study area can be computed. With S = 0.304 < 1, this suggests an unbalanced distribution, further corroborating the previously established unevenness.
A closer examination of the Lorenz curve reveals a notable upward convex trend, highlighting that the total number of campgrounds in Shandong, Henan, and Shaanxi provinces constitutes 59.65% of the entire Yellow River Basin’s campgrounds. These distribution patterns align with China’s demographic and economic development trends (Figure 3):
(1)
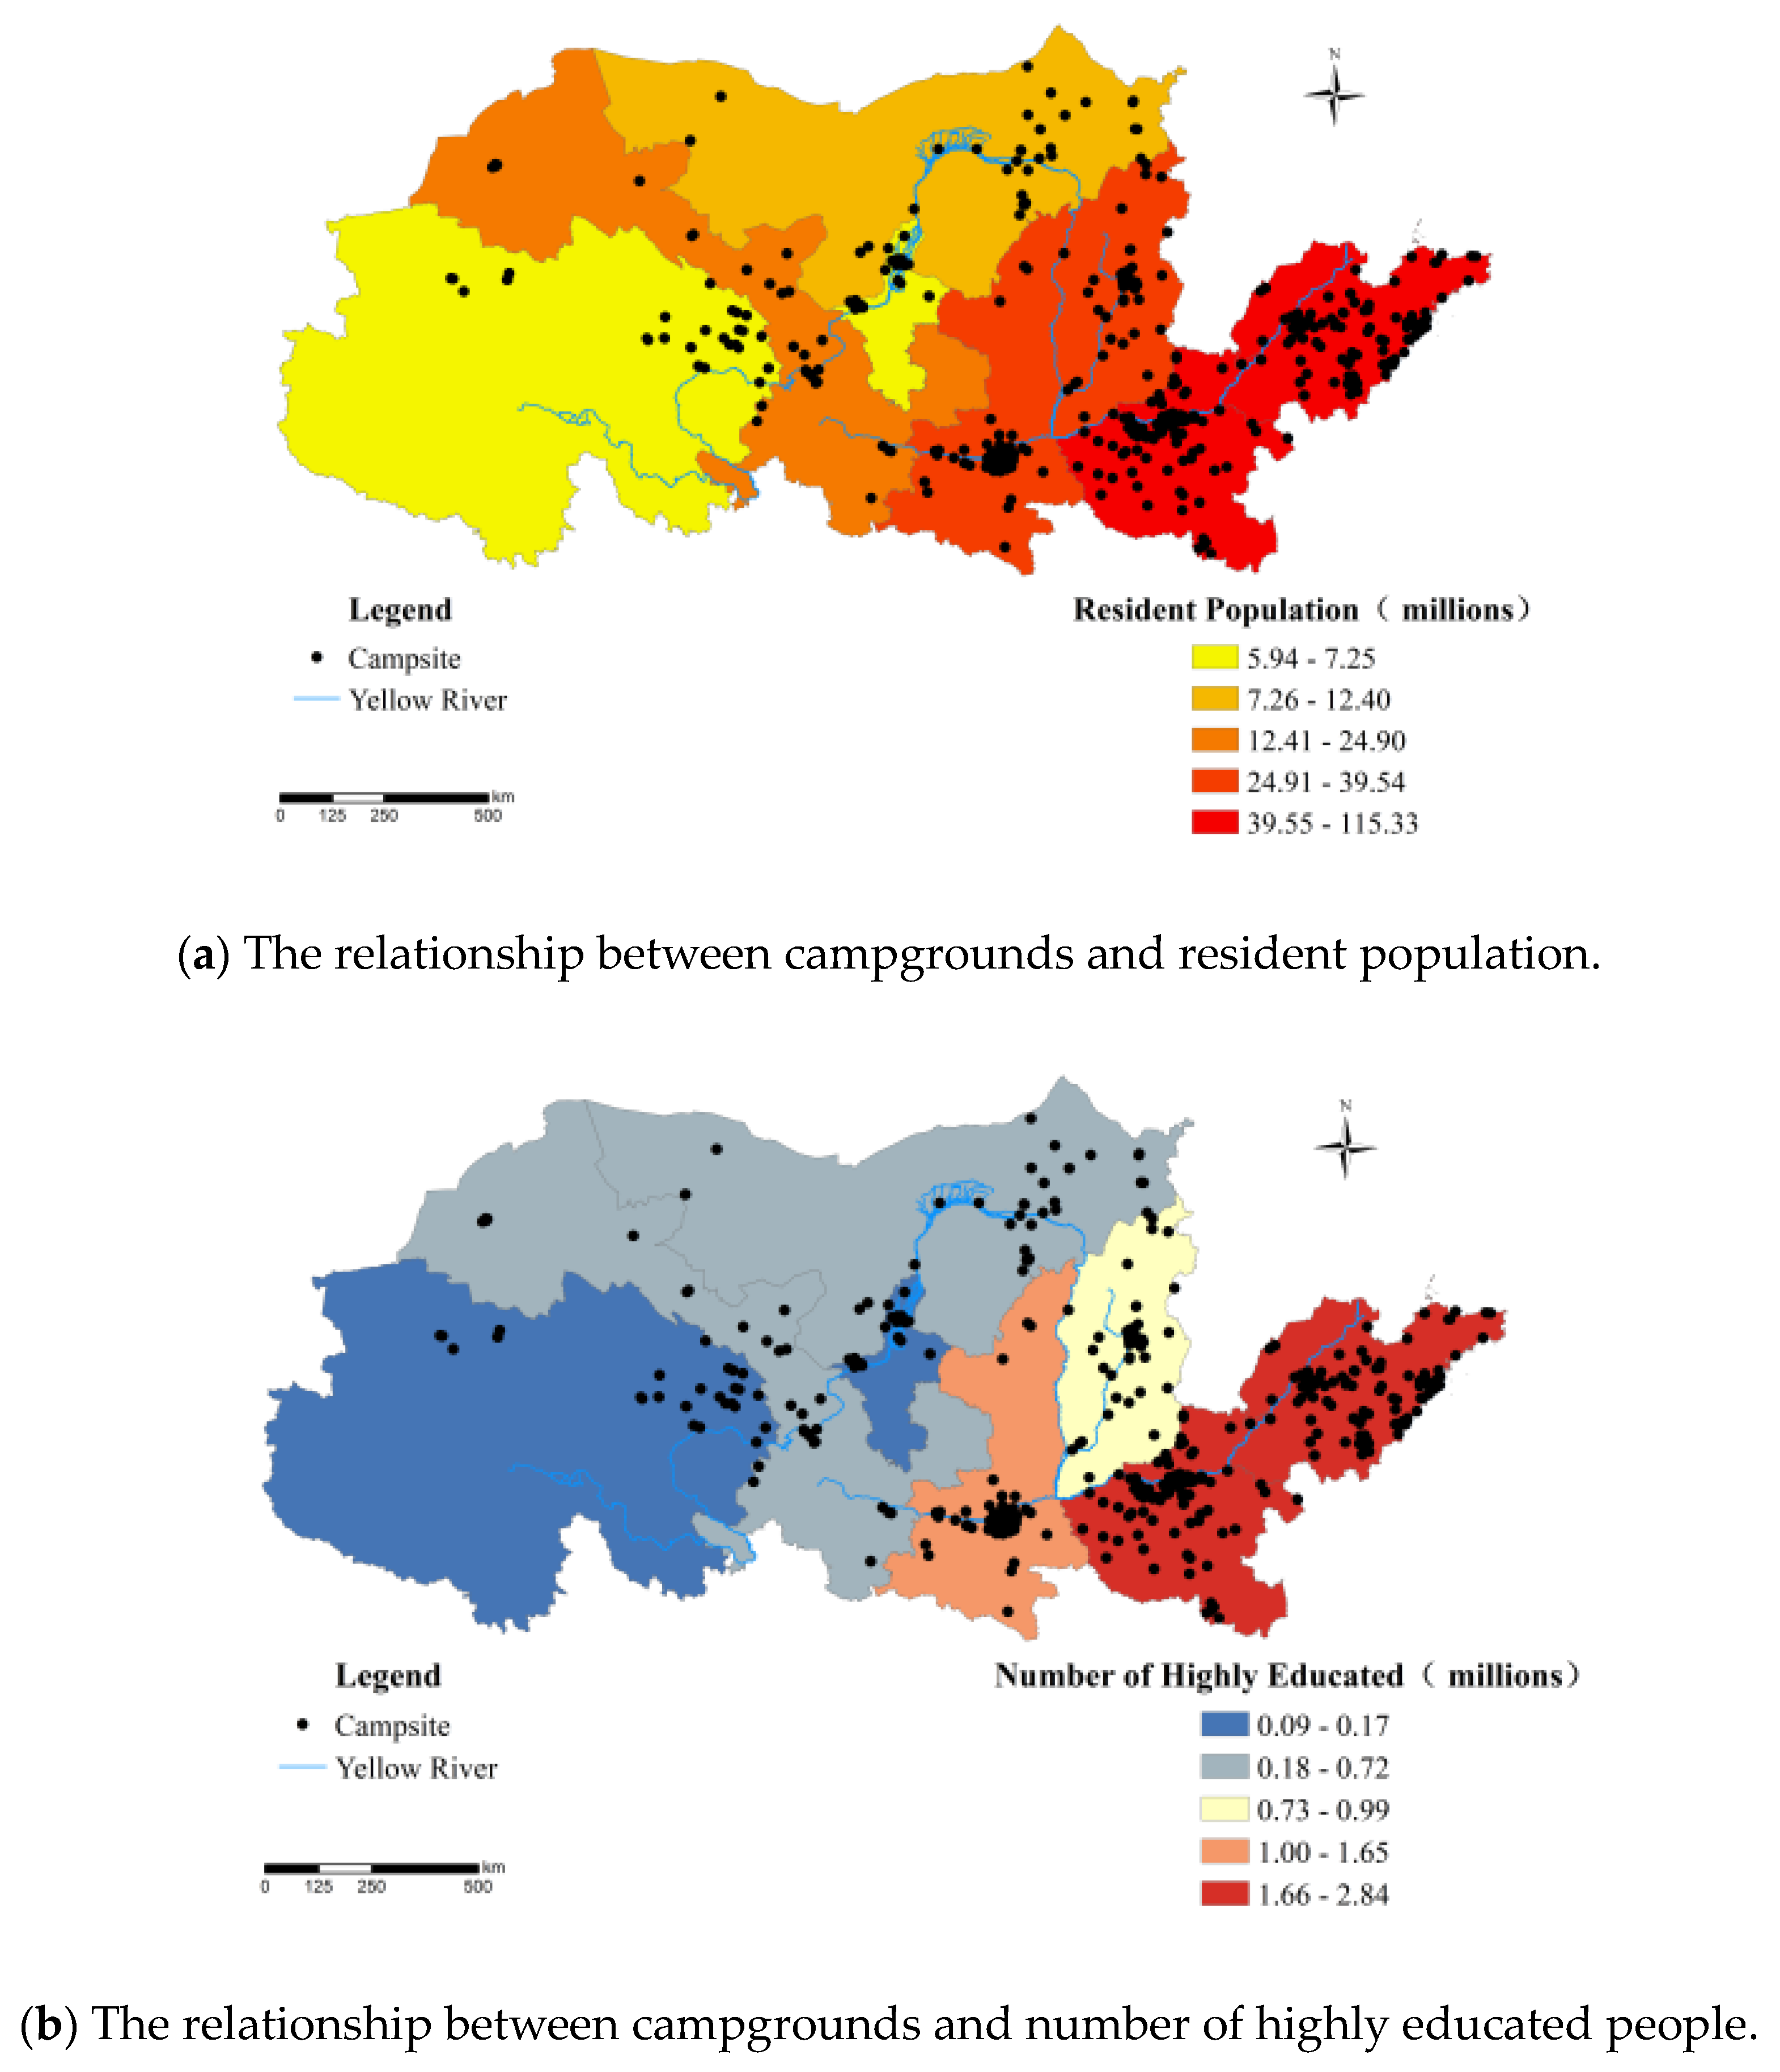
Population imbalance: Approximately 96% of the country’s population resides in 36% of the southeastern region, demarcated by the Hu Huanyong Line, while the remaining 4% resides in the northwestern 64% of the country [27]. As campsites in the study area are predominantly commercial enterprises aiming for profitability, they tend to be established in more populous regions, such as the middle and lower segments of the study area.
(2)
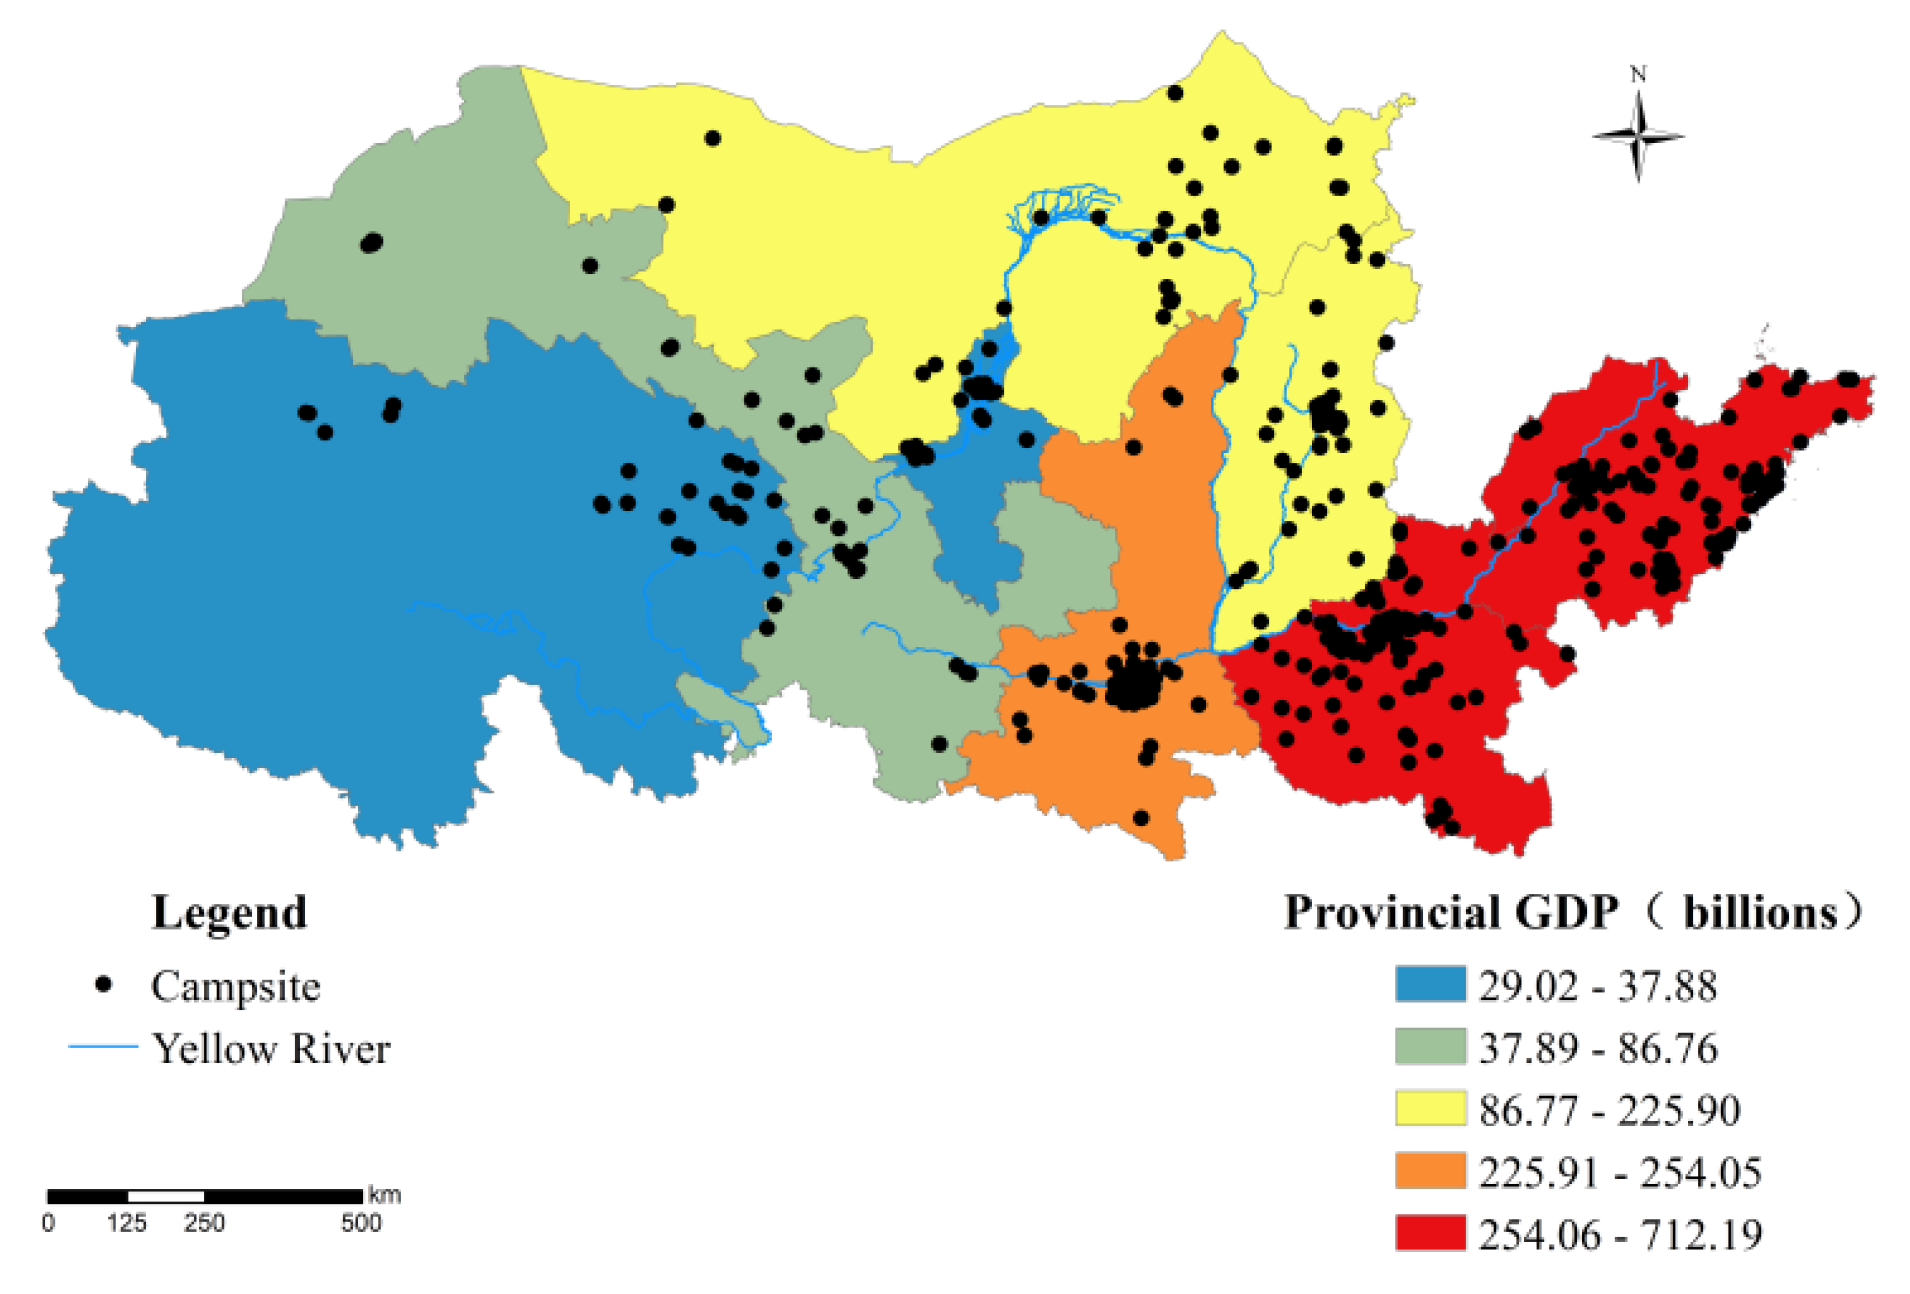
Uneven economic development across regions: China’s total economic output demonstrates a distinct bias towards the southeastern coastal areas, whereas the western and northeastern regions contribute less to national GDP growth [28]. Since camping tourism is influenced by economic levels [29], campgrounds tend to be concentrated in the relatively more developed middle and lower segments of the study area.

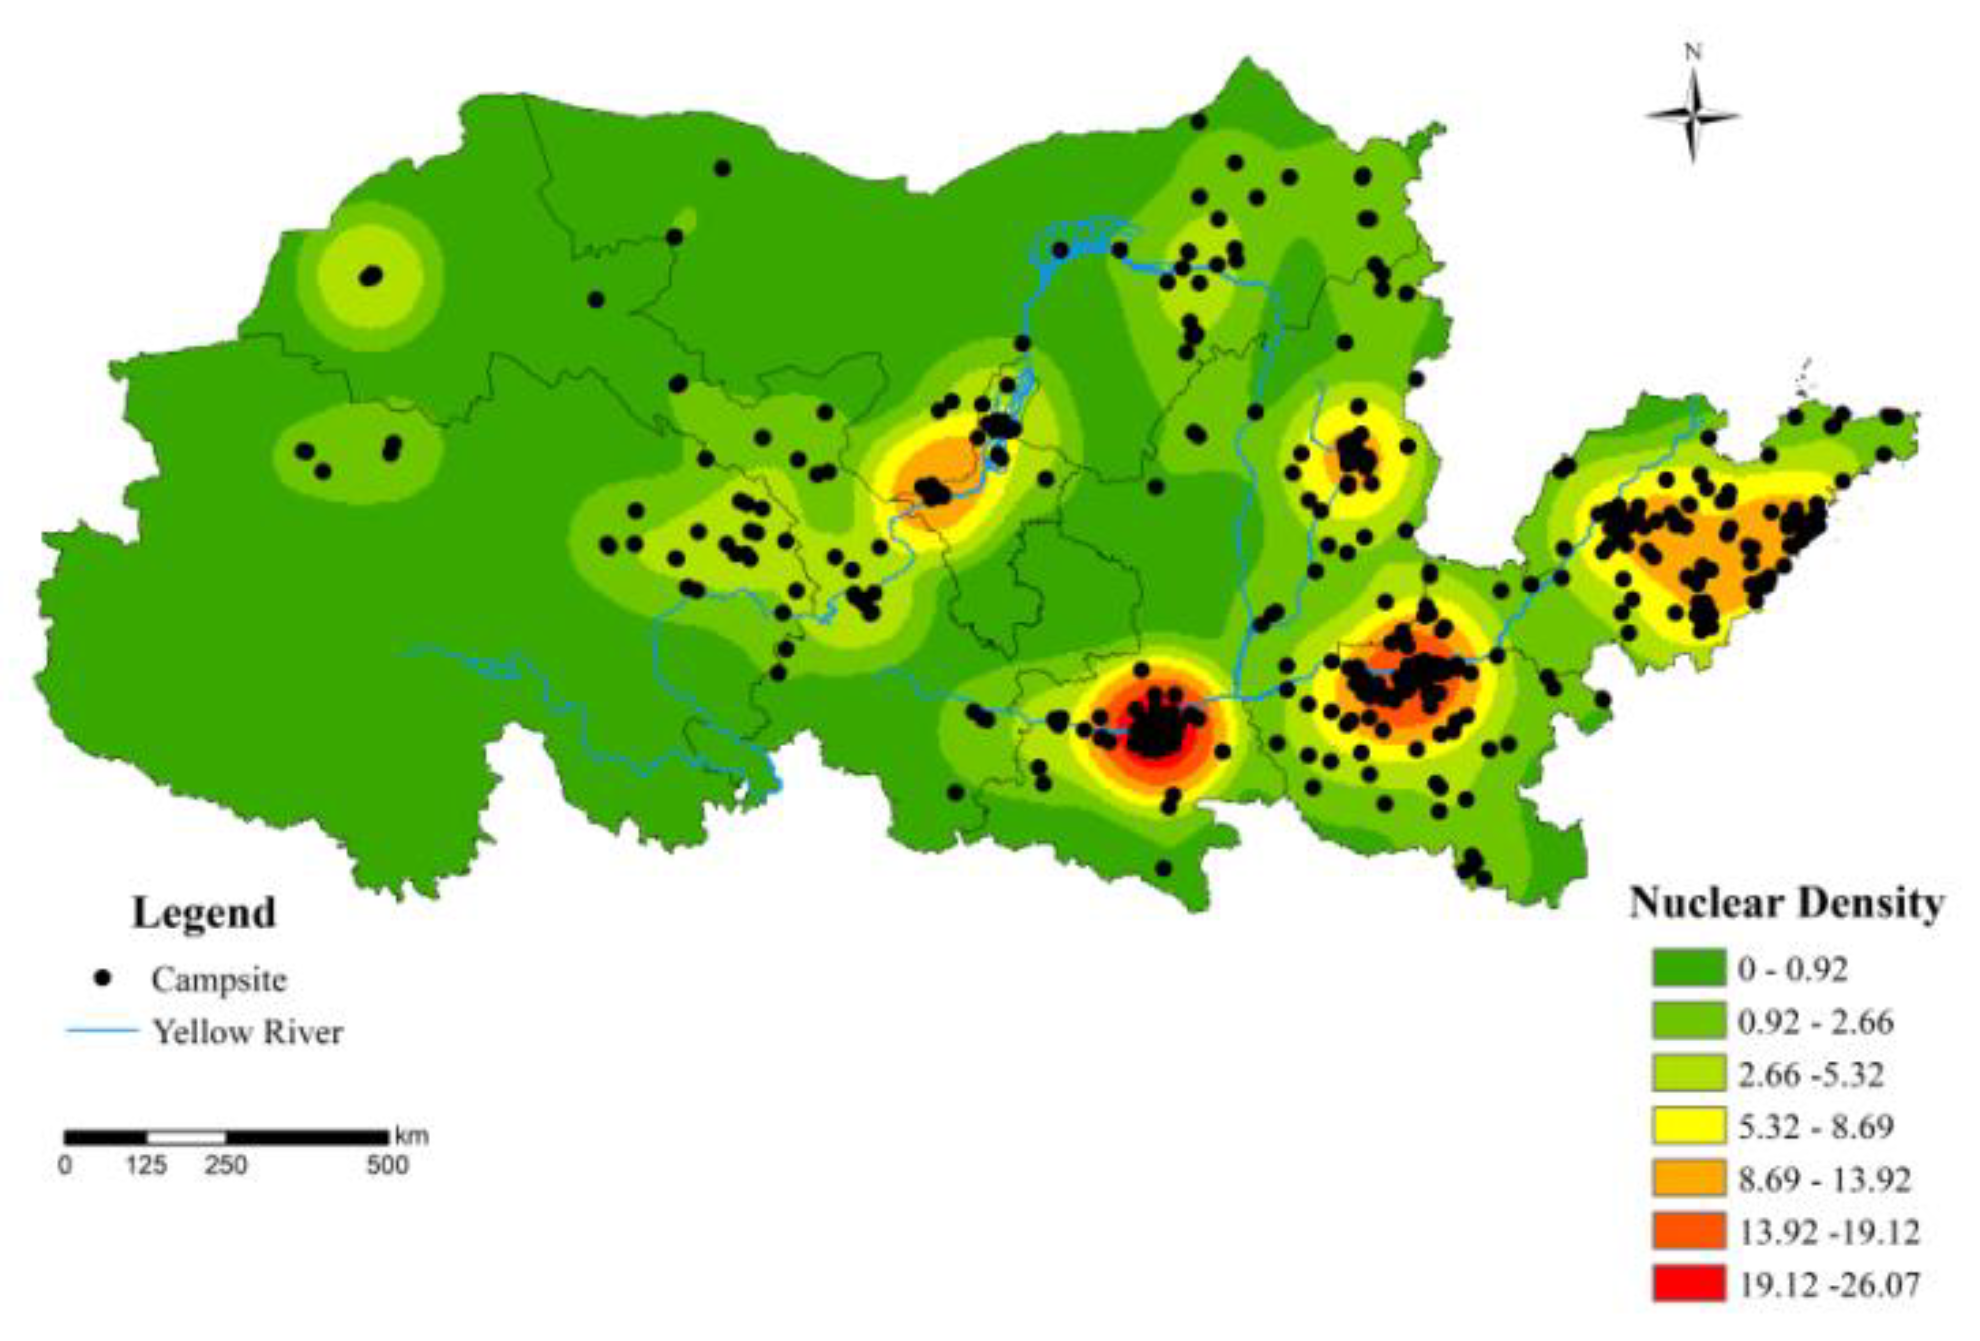
4.3. Spatial Density Analysis

The municipal-level data on the number of campsites were imported into ArcGIS 10.8 software for the kernel density analysis. By employing the natural breaks, the density values were categorized into seven classes (Figure 4). This method offers a clearer depiction of how campsites are spatially distributed. The results demonstrate significant disparities in the distribution of campsites throughout the basin.
The study area features several high-density regions for campgrounds, primarily concentrated in the midstream and downstream of the river. Notably, the midstream exhibits the highest density, while the upstream shows the lowest density. As depicted in Figure 4, Xi’an, Shaanxi, emerges as the area with the highest concentration of campsites within the basin. The distribution pattern shows Xi’an, Shaanxi, as the central hub and Zhengzhou, Henan, as a secondary hub. Additionally, distribution cores have started to develop in the eastern region of Shandong, at the junction of Taiyuan and Jinzhong in Shanxi, and around the junction of Alashan League in Inner Mongolia and Zhongwei City in Ningxia.
Spatially, campground distribution across the study area is characterized by “one belt, one cluster, and two points”. The eastern “inverted T” camping belt comprises Xi’an in Shaanxi, Zhengzhou in Henan, the east–central part of Shandong, and the junction of Taiyuan and Jinzhong in Shanxi. In the middle, a camping cluster is centered around the junction of Alashan League in Inner Mongolia and Zhongwei City in Ningxia. Lastly, Jiuquan City in Gansu and Haixi Mongol and Tibetan Autonomous Prefecture in Qinghai form two points in the west.

5. Refinement of Index Establishment and Analysis of Influential Factors

5.1. Screening and Establishment of the Indicator System

Collecting data from the “Code of Construction and Service of Leisure Campgrounds” and the related literature [30,31,32,33,34], this study identifies relevant indicators while considering the specific context of the study area as per data availability. Influencing factors are categorized into five dimensions: geographic factors, natural environmental conditions, transportation conditions, tourism resources, and socioeconomic conditions. The dimensions encompass the following indicators (Table 2).
To further validate the reliability of the influencing factors, a Pearson correlation test was performed, examining campground quantities across the study area for each identified factor (Table 3). The results are presented in the following table.
Based on Table 3, the following observations can be made:
(1)
Average annual temperature, highway mileage, the number of high-level scenic spots, the number of tourists, provincial GDP, total resident population, and the number of students in colleges and universities exhibit a significant correlation with the distribution of campgrounds at the 0.01 level. This suggests that the enhancement of these seven factors positively influences the formation of campgrounds in the Yellow River Basin.
(2)
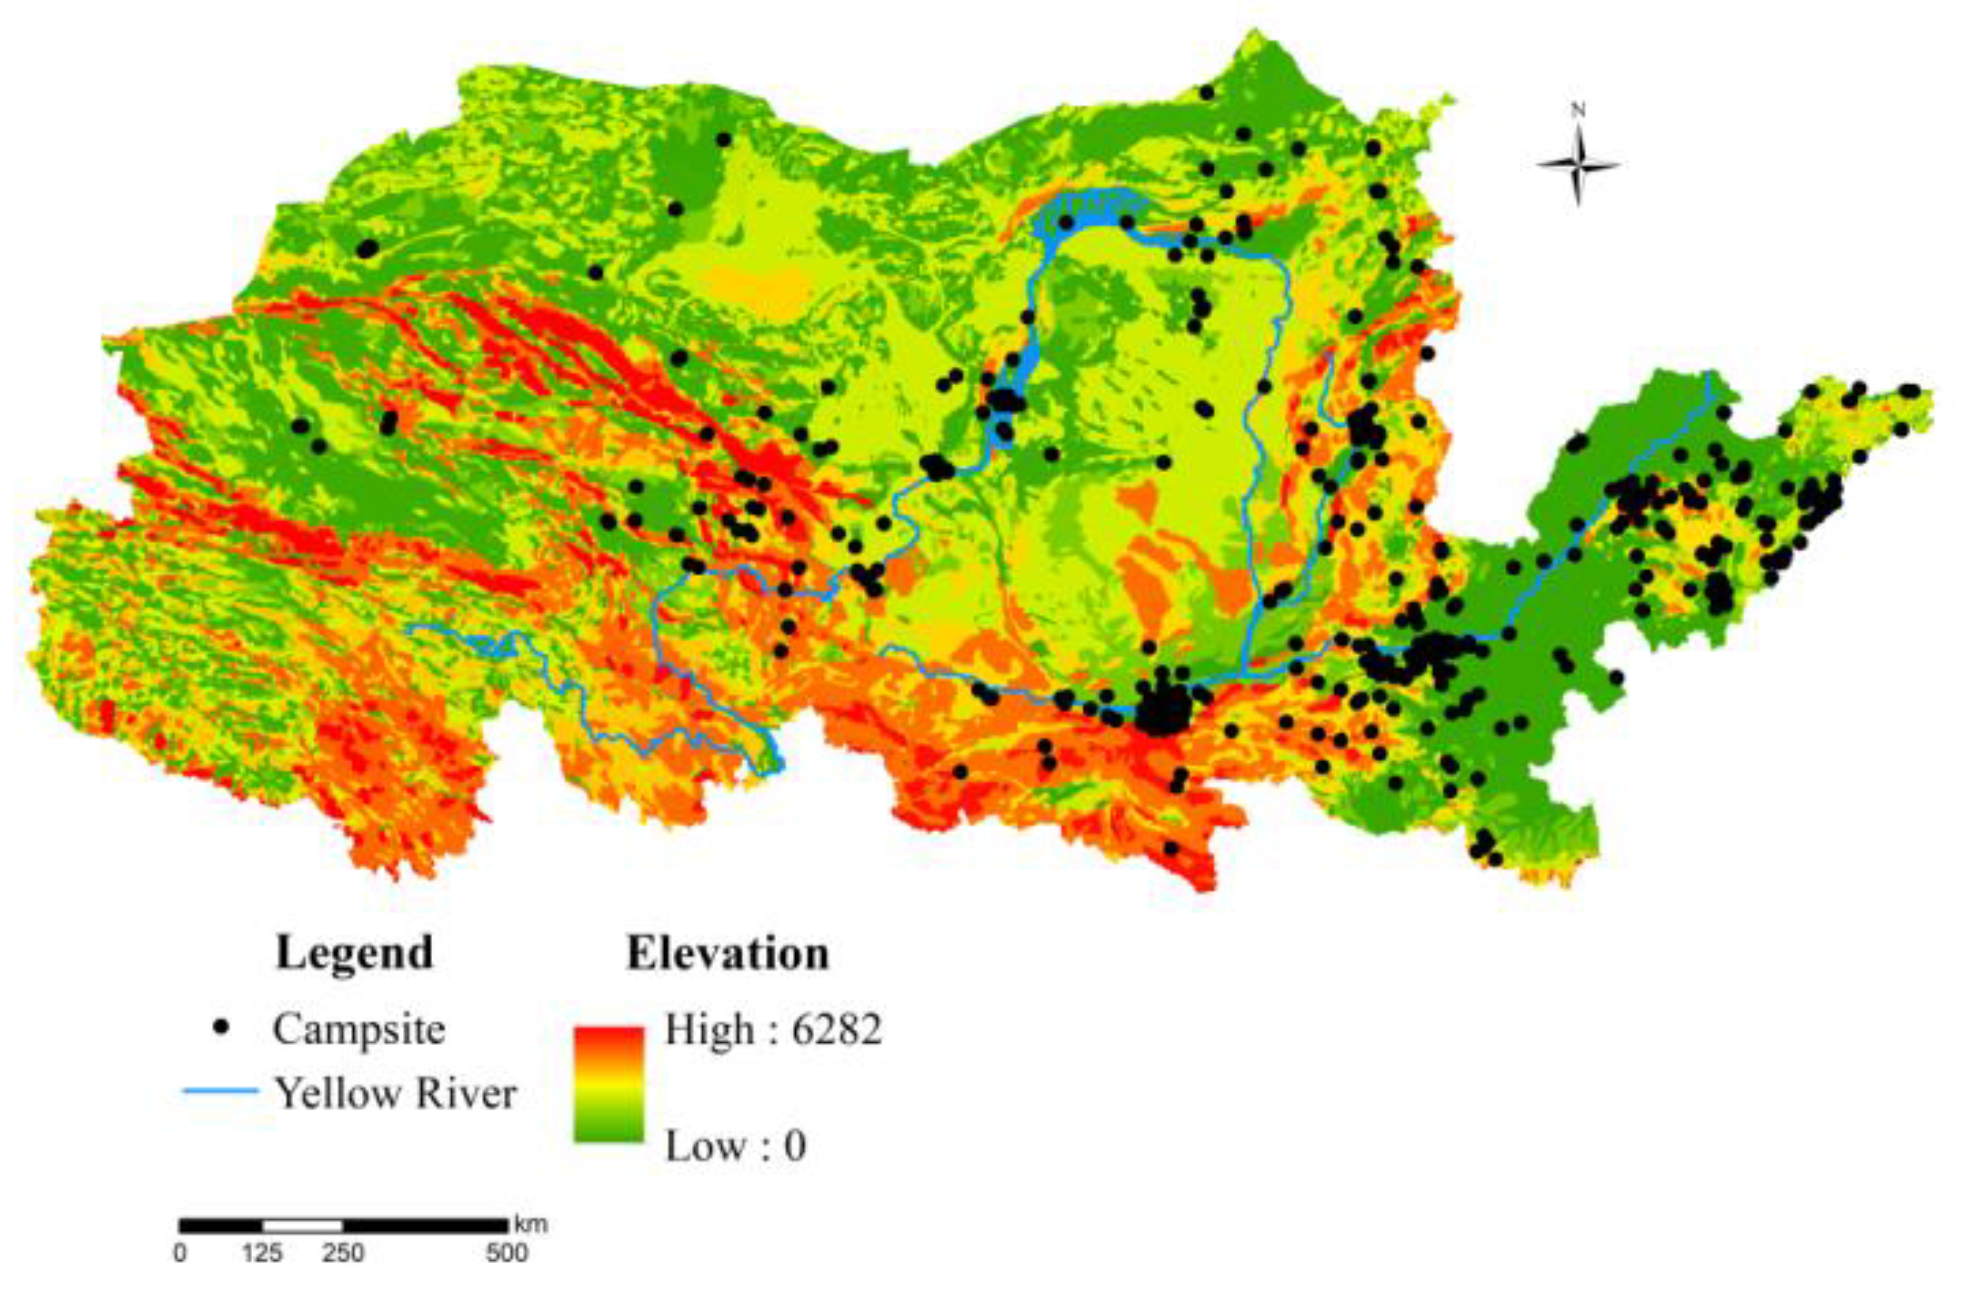
Elevation and air quality show a significant correlation with the distribution of campgrounds across this region at the 0.05 level. This indicates that these are important factors affecting the formation of campgrounds in the region and should be considered during site selection. Notably, elevation shows a negative value, implying that the number of campgrounds in the Yellow River Basin decreases as elevation increases, presenting an inverse effect on campground formation.
(3)
River network density, slope, the number of geological disasters, average annual precipitation, road passenger traffic, distance to the nearest administrative center, GDP per capita, and per capita consumption expenditure display weak correlations and do not pass the correlation test. This indicates a lack of significant correlation with the distribution of campgrounds throughout this region.

5.2. Analysis of Specific Impact Factors

5.2.1. Geographical Factors

Camping is significantly influenced by geographical factors, with previous studies concluding that camping typically requires a flat terrain [35]. The topography of the study area reflects China’s overall terrain distribution, generally featuring elevated regions in the west and lower regions towards the east. The upper and middle reaches of the basin are dominated by plateaus and mountains, while the lower reaches are primarily composed of plains. These geographical features contribute to the observed distribution pattern of campgrounds in the study area.
Figure 5 illustrates that the distribution of campgrounds generally follows a pattern consistent with the mountain ranges. However, there are some variations observed at each level of campground distribution.
At the first level, fewer campgrounds are found along the first and second steps, while the distribution of campgrounds in Gansu Province mirrors the symmetrical distribution along the Qilian Mountains. At the second level, the campground distribution exhibits a “large dispersion—small aggregation” trend, mainly centered around the four provincial capitals: Taiyuan, Xi’an, Yinchuan, and Hohhot. This pattern arises because the second level consists primarily of plateaus and mountains. These provincial capitals are situated near mountain ranges, with Taiyuan near the Taihang Mountains, Xi’an near the Qinling Mountains, Yinchuan in the Helan Mountain range, and Hohhot near the Yinshan Mountains.
The third level displays a similar distribution to Gansu Province, with an apparent “two-center” pattern. Campgrounds are concentrated around the provincial capitals of Jinan and Zhengzhou. The center around Jinan is formed near the Taishan Mountain Range, while the center around Zhengzhou is formed around the mountain range represented by Mt. Song.
In summary, campgrounds throughout the Yellow River Basin are mainly situated in plains adjacent to mountain ranges, with a notable concentration in the plains surrounding the Taihang and Qinling Mountains.

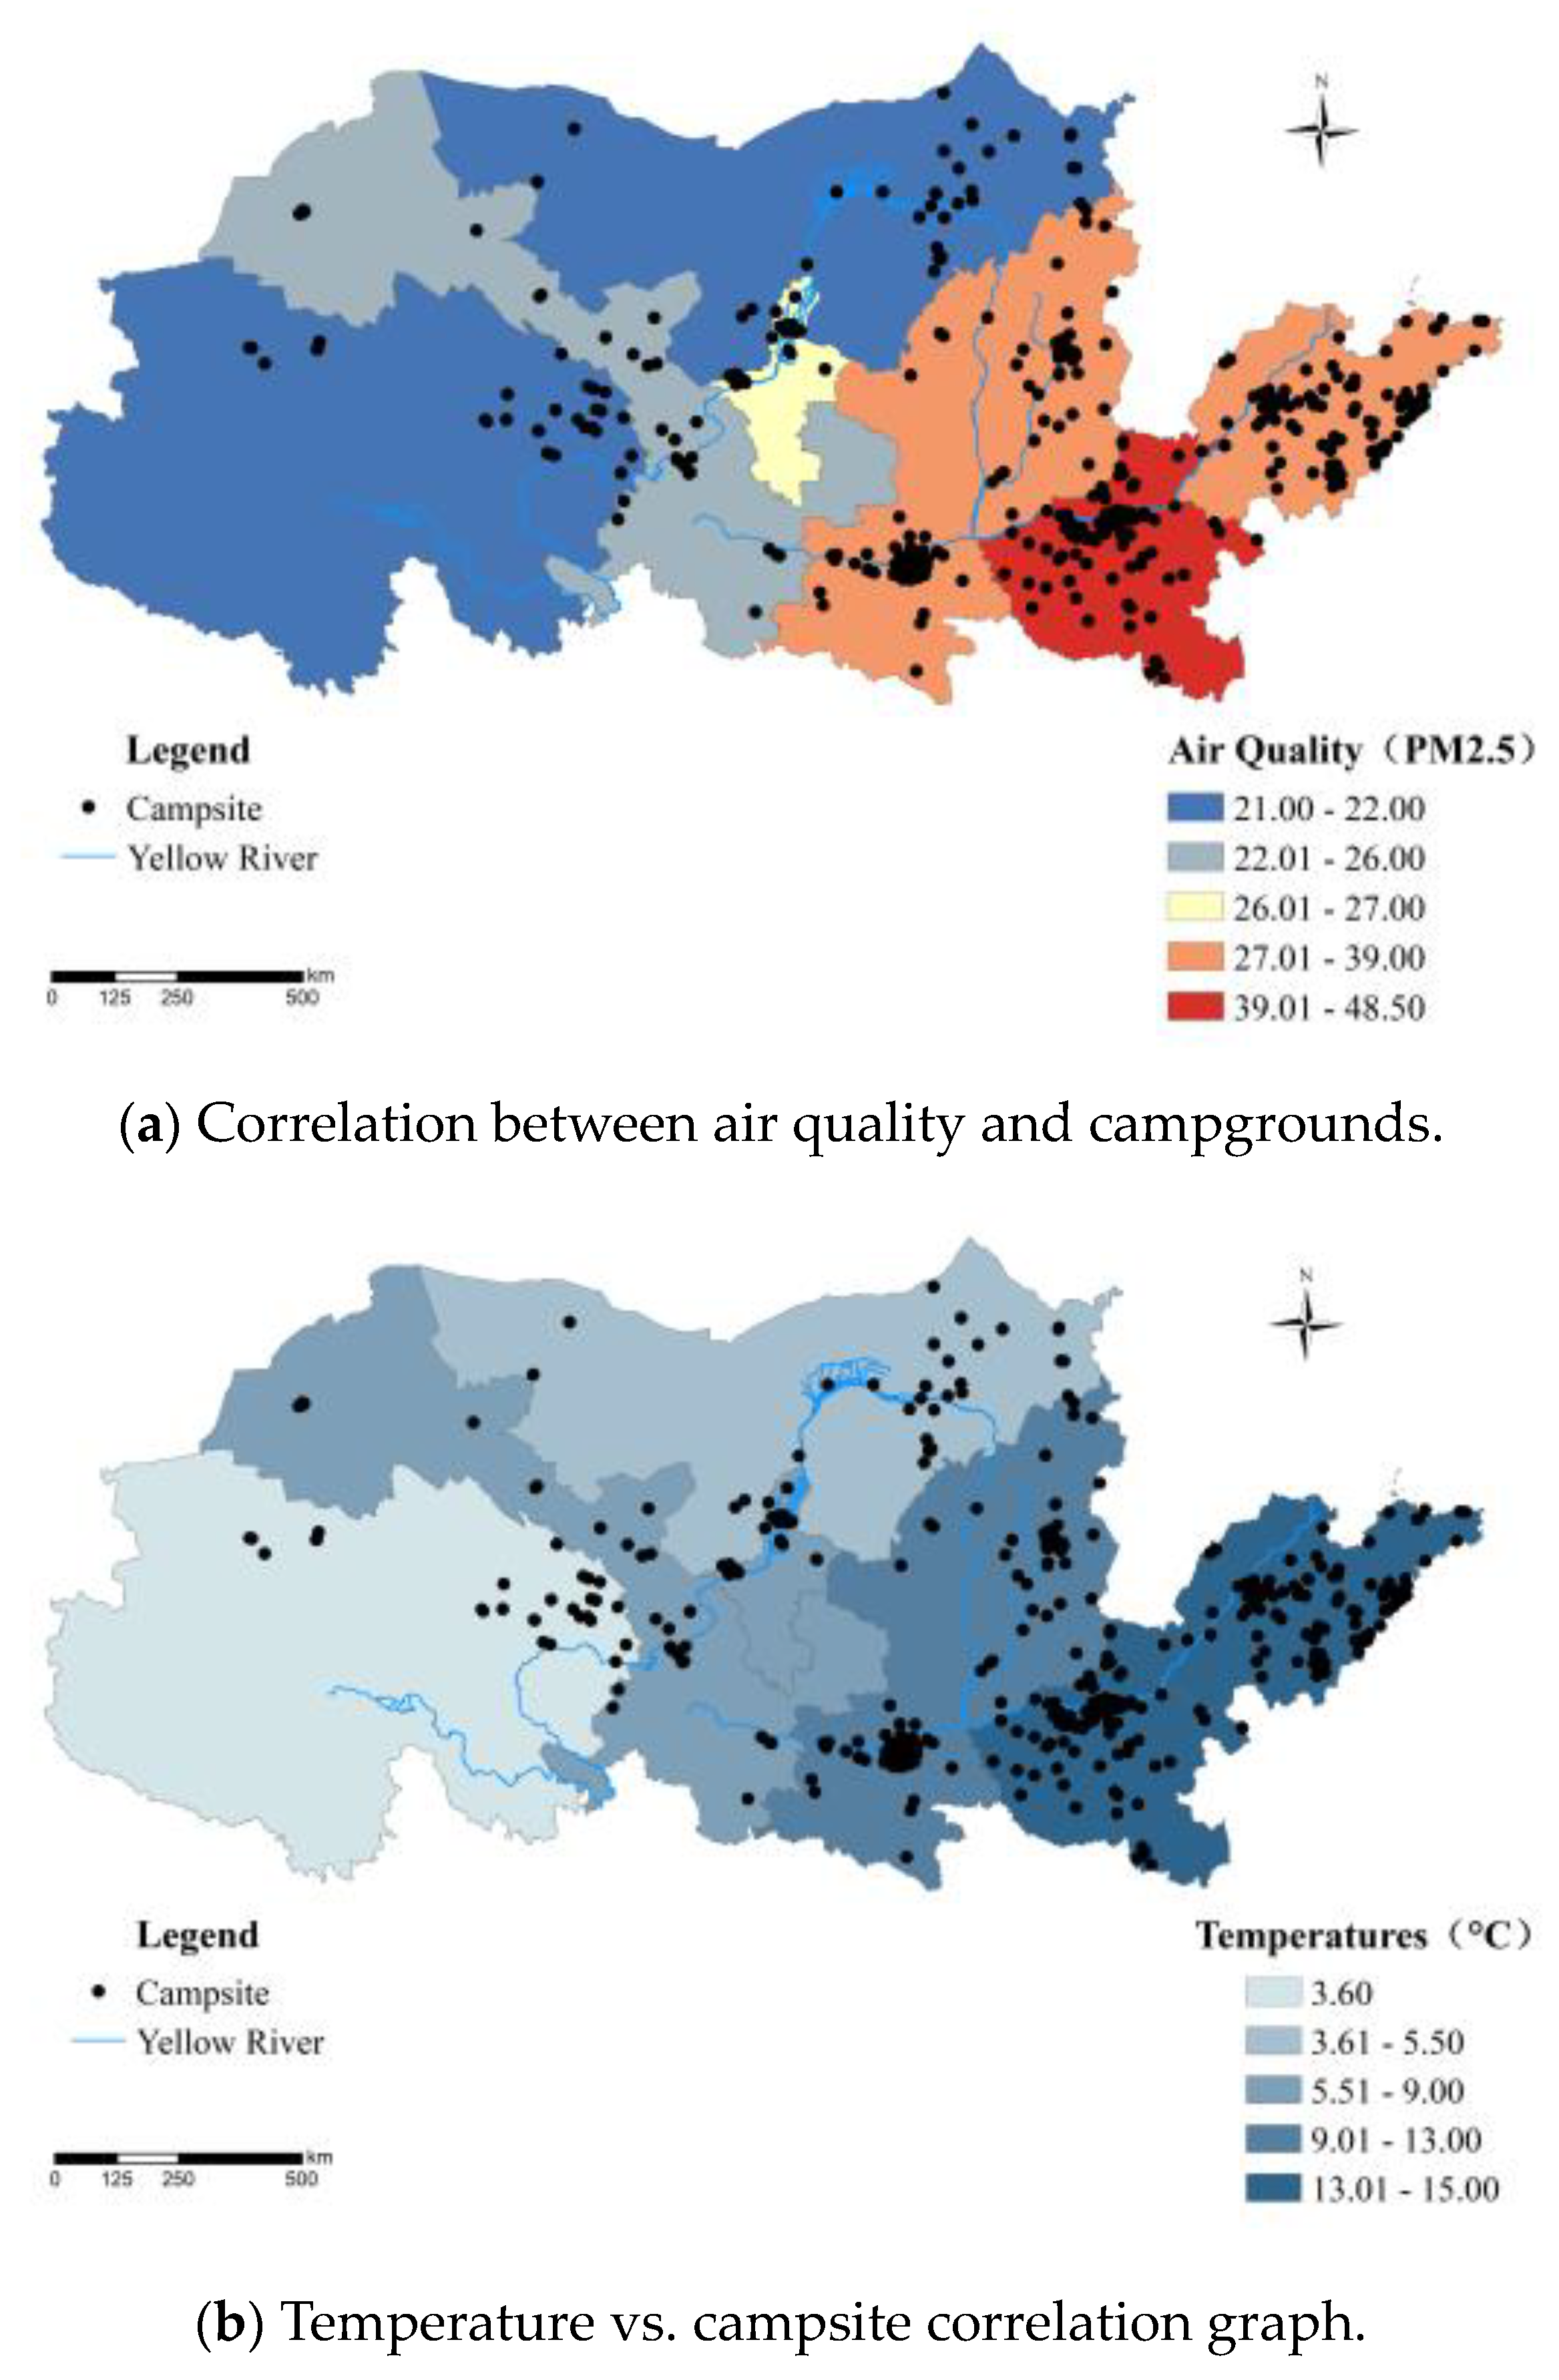
5.2.2. Environmental Conditions

By examining the Ecological and Environmental Status Bulletins of each province and overlaying the average PM2.5 concentration and temperature values with the distribution of campgrounds over the past five years (Figure 6a,b), we can observe that air quality upstream and midstream in the Yellow River Basin is generally better than that downstream. This can be attributed to multiple factors. However, it is notable that 68.9% of the campgrounds across the entire Yellow River Basin are situated in regions with the lowest PM2.5 levels, whereas only 16.4% are found in areas exhibiting the highest PM2.5 concentrations. This indicates that, as a form of tourism, camping prioritizes factors like population and economy over natural factors for the spatial layout of campgrounds. This finding aligns with previous research suggesting that air quality affects the selection of tourist destinations [36], influencing campground distribution.
Figure 6b reveals a correlation between the number of campgrounds and temperature, with 42.5% of campgrounds located in the eastern region, which has the highest average sub-temperature in the Yellow River Basin. Conversely, only 5.8% of campgrounds are found in the western region, which experiences the lowest average temperatures. This distribution pattern is likely a result of temperature being an important factor affecting travel [37], compounded by the influence of social and environmental factors. Consequently, campgrounds throughout the study area exhibit a distribution pattern characterized by high density toward the east and lower density toward the west.

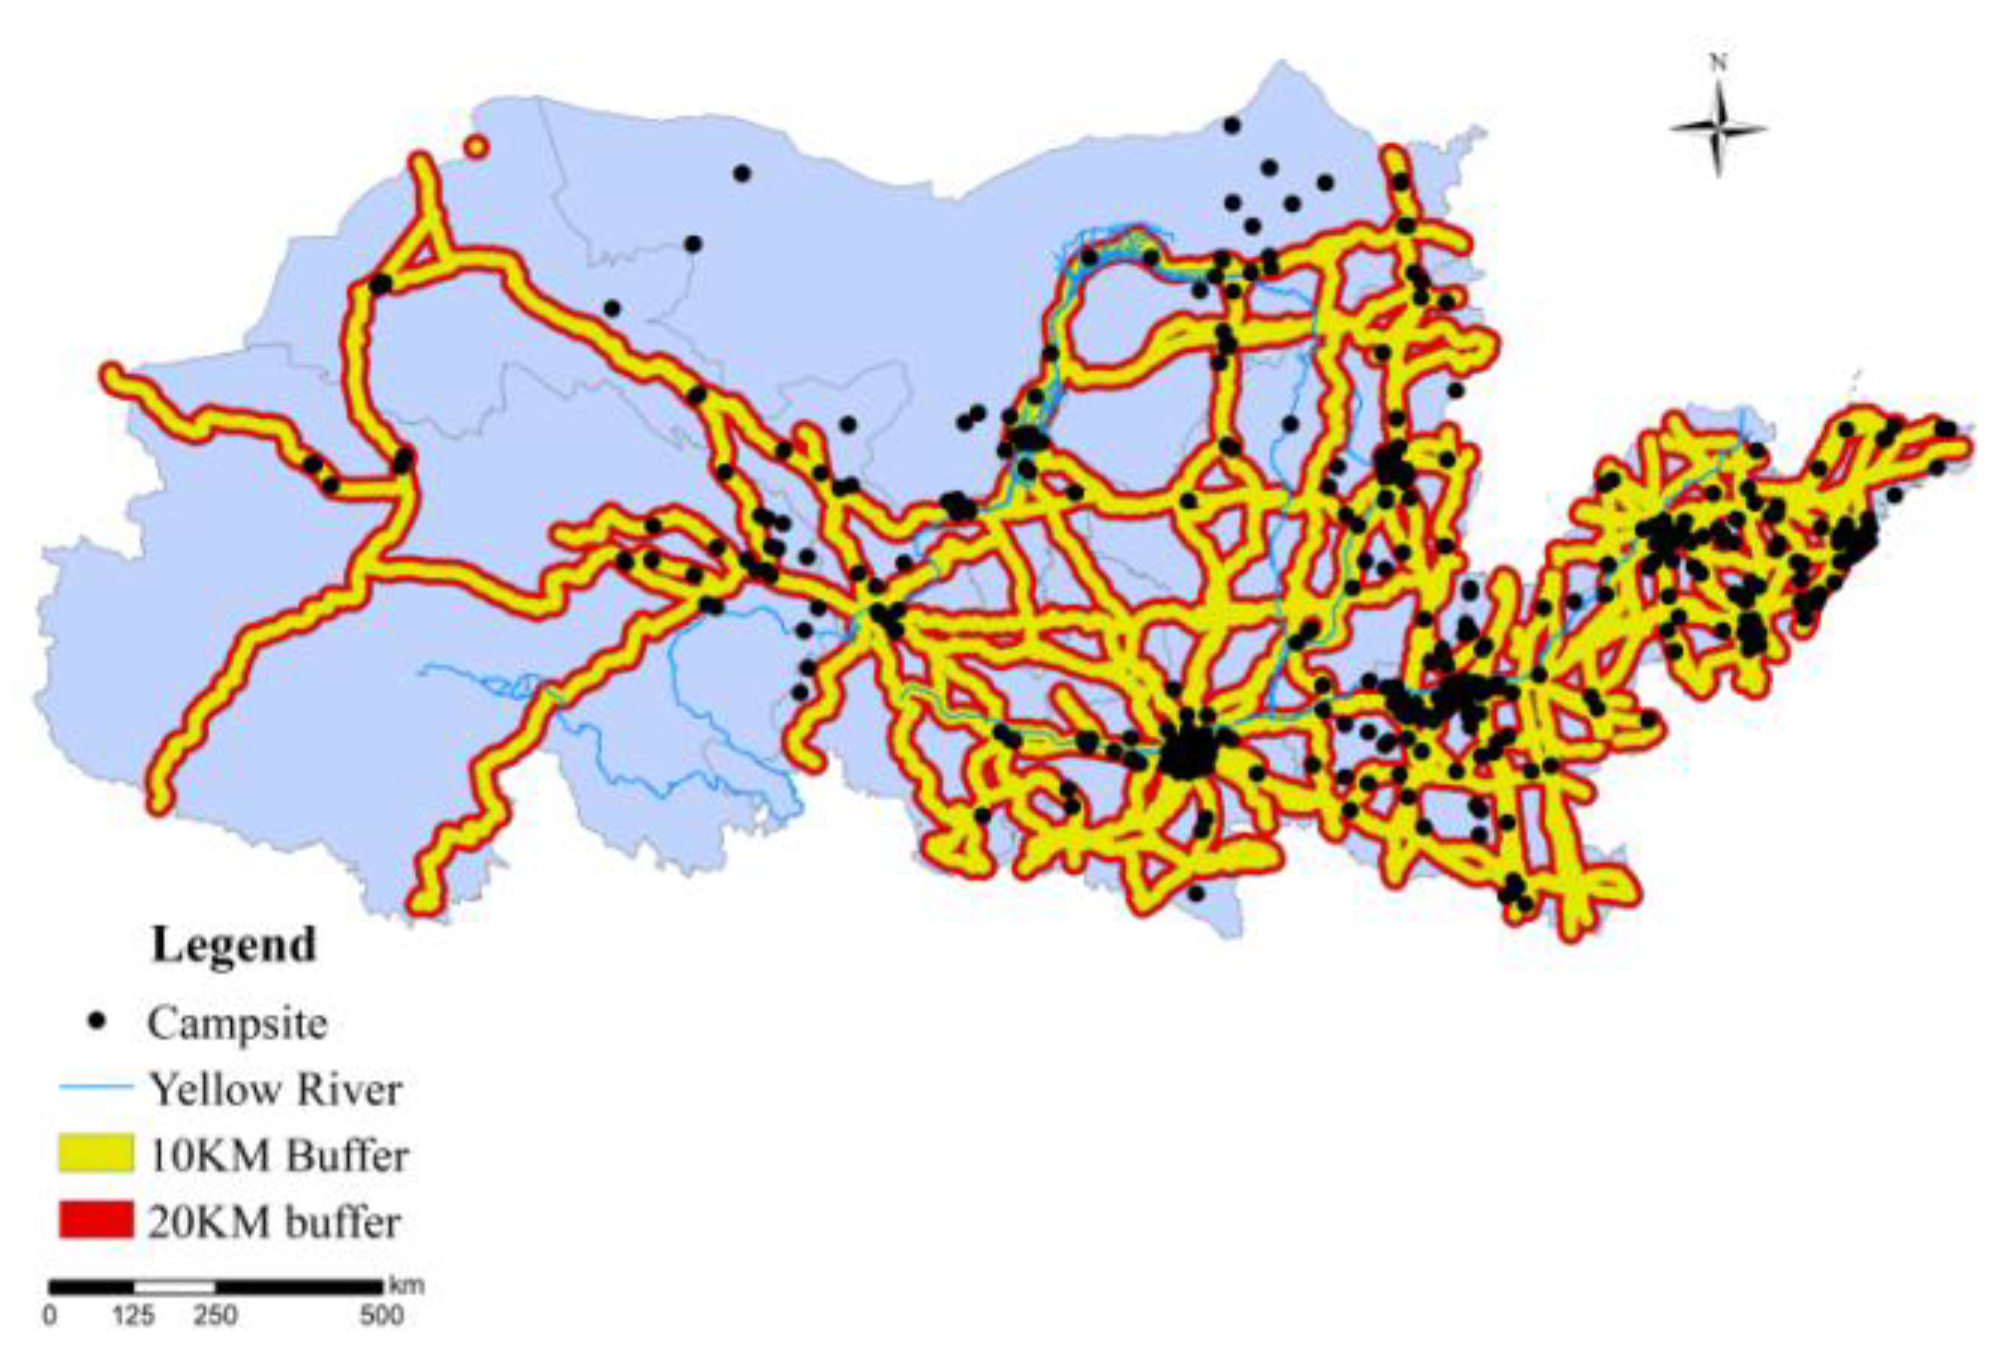
5.2.3. Transport Condition

Transportation conditions significantly influence regional tourism, primarily shaping and modifying the spatial structure of tourist destinations [38]. In the context of camping, campers often prefer sites with convenient transportation options [39]. As short-distance leisure tourism typically relies on road transportation [32], major roads within the study area were selected.
An overlay of major highways with campgrounds, along with the establishment of 10 km and 20 km buffer zones centered around these highways [25], reveals that 389 campgrounds (76.4% of the total) are located within the 10 km buffer zones, while 457 campgrounds (89.8%) are situated within the 20 km buffer zones. This distribution pattern demonstrates a strong “along-road” characteristic for campgrounds in the Yellow River Basin.
Furthermore, campgrounds tend to cluster around highway network hubs, particularly in Jinan, Taiyuan, Xi’an, and Ningxia. As the political and economic centers of their respective provinces, these areas boast a developed transportation infrastructure, enabling local residents and visitors from neighboring regions to easily access campgrounds via convenient transportation options. Additionally, the non-provincial capital city of Qingdao has also emerged as a campground hub due to its importance as a port city and tourist destination, offering both a superior natural environment and accessible transportation (Figure 7).

5.2.4. Tourism Conditions

Tourism resources are essential for tourism’s growth and serve as its foundation, significantly shaping destination tourism [40]. The Pearson correlation test reveals a significant correlation between the number of 4A and above-grade scenic spots and campgrounds at the 0.01 level. This finding aligns with the current standard for evaluating tourism resources in China. Therefore, 4A and 5A scenic spots, which represent the development of tourism in each province, are utilized as a measurement index for tourism resources.
Using ArcGIS 10.8 software, the coordinates of attractions and campgrounds in the Yellow River Basin were superimposed. Based on prior research, buffer areas of 10 km and 15 km were created around the attractions. Within the 10 km range, 351 campgrounds were found, accounting for 68.9% of the total campgrounds. Within the 15 km range, there were 439 campgrounds, comprising 86.2% of the total campgrounds (Table 4). This indicates that campgrounds in the Yellow River Basin tend to be distributed around high-level scenic spots.
High-level scenic spots provide well-developed supporting facilities and convenient transportation, attracting many tourists and offering a substantial passenger flow for campgrounds. Additionally, these scenic spots provide spaces for campers to explore and unwind. The Pearson correlation test indicates a significant relationship at the 0.01 level between tourist counts and campground numbers, suggesting that tourist presence significantly impacts campground distribution across provinces.
Figure 8b shows that Shandong and Henan provinces attract the largest number of tourists, providing numerous sources for campgrounds surrounding scenic spots. This aligns with how campgrounds are distributed around the high-grade scenic areas shown in Figure 8a. It can be inferred that campground sources consist of two parts: local residents near the campgrounds and tourists visiting scenic spots.

5.2.5. Demographic and Economic Conditions

To investigate how demographic factors and levels of economic growth affect campground distribution within the study area, we conducted an analysis at the provincial level. The number of residents, the number of college and university students, and the average GDP over the past five years were obtained for each province. The Pearson correlation test revealed significant correlations between campground distribution and these three influencing factors at the 0.01 level.
Population size significantly supports industry development by furnishing human resources and customer bases [41]. As shown in Figure 9a, Henan Province, Shandong Province, and Shaanxi Province had the largest resident populations in the study area in 2021, with 115.33 million, 101.7 million, and 39.54 million people, respectively. These three provinces also had the highest number of campgrounds, with 103, 117, and 89, respectively.
By overlaying the number of students with an undergraduate education and above with the number of campgrounds in each province (Figure 9b), it is evident that campgrounds are more abundant in areas with higher numbers of students pursuing higher education. The top three provinces with the highest number of students pursuing higher education are Shandong, Henan, and Shaanxi, and these provinces account for 60.7% of the campgrounds in the entire study area. This aligns with previous findings suggesting that participation in tourism activities is positively correlated with education levels [42], as individuals with higher education tend to prioritize comprehensive relaxation and self-improvement through tourism [43]. Moreover, they exhibit greater openness to new industries and experiences.
Regional industrial development is closely linked to the level of economic development within a region [44]. While the sports industry can enhance local economic conditions, a robust economic foundation is essential for its sustainable development. By overlaying the coordinates of Yellow River campgrounds with the average GDP of each province over the past five years using ArcGIS 10.8 software (Figure 10), it is evident that campground numbers exhibit a positive correlation with the GDP of the respective provinces. The Shandong and Henan provinces boast the highest levels of economic development and the largest number of campgrounds. In contrast, Ningxia Hui Autonomous Region and Qinghai Province have the lowest economic development levels and, consequently, the smallest number of campgrounds. This pattern can be attributed to the fact that camping tourism, as a significant form of leisure and relaxation tourism, is influenced by local economic conditions [45,46,47]. In regions with stronger economic development, residents tend to prioritize spiritual relaxation, and their higher acceptance of new business forms resulted in the current distribution patterns.

6. Discussion

This research article investigates campground distribution patterns in the Yellow River Basin by utilizing campground POI data from Gaode Maps and applying the nearest neighbor index, geographic concentration index, imbalance index, and kernel density analysis. Furthermore, the study identifies influencing factors on campground distribution through Pearson correlation analysis and draws the following conclusions:
(1)
Campground distribution in the Yellow River Basin exhibits an unbalanced agglomeration pattern. Overall, a distribution pattern characterized by a high density in eastern regions and low density in western regions, as well as higher densities in provincial capitals compared to non-provincial capitals, is evident. The number of campgrounds diminishes progressively across each province from east to west. Kernel density distribution analysis reveals that campgrounds are primarily located in recreational areas surrounding provincial capitals, with Zhengzhou, Taiyuan, Xi’an, and Yinchuan being the most prominent. Notably, Xi’an’s campgrounds account for 65% of the total in the province.
(2)
Natural factors significantly influence campground distribution. Although campgrounds generally exhibit a “mountain type” distribution, they are negatively correlated with elevation, indicating that campgrounds are found in low-elevation mountain regions. These areas provide scenic views, adequate accessibility, and a sense of security for campers. Additionally, the refreshing air quality and mild temperatures offer a comfortable environment for enjoying nature and promoting relaxation.
(3)
Social factors deeply impact campground distribution. Most campgrounds are located within 10 km of highways, as good accessibility offers a customer base for campgrounds and facilitates brand development. High-level scenic spots can provide tourists with a convenient infrastructure, improving the perception of campgrounds. Moreover, these attractions exert a positive influence on campgrounds, furthering their sustainable development. Economic and population factors also play critical roles in campground distribution, as more developed areas or educated populations tend to prioritize leisure and possess the economic resources and time needed to support the camping industry’s growth.

7. Conclusions

This research builds upon the work of Li Xinjian [25], further exploring the spatial distribution of campgrounds at a regional scale within the Yellow River Basin and supplementing the existing research on campground spatial distribution. The study expands on spatial distribution patterns by examining distribution characteristics, balance, and density. It also addresses the lack of research on elements related to campground distribution by constructing an indicator system with 17 influencing factors that are analyzed across six levels. The Pearson correlation test demonstrated that social factors, especially the economy and population, significantly influence campground distribution, surpassing the effects of environmental factors like air quality and average temperature. These findings provide valuable insights for optimizing campground distribution in the Yellow River Basin and fostering its high-quality development.
This study investigates the number and locations of campsites in the Yellow River Basin using Python tools to scrape data from mapping software. The obtained data may not be entirely accurate due to some smaller or newly established campsites not being displayed on the maps, resulting in potential omissions. Future research should aim for a more precise verification of the number and locations of campsites. Additionally, at the time of writing, some provincial government websites did not have updated social and economic data for 2023 and 2024, leading to inaccuracies in the socio-economic analysis. In addition, the primary objective of this paper is to provide macro-level guidance for optimizing the layout of campsites in the Yellow River Basin. Detailed measures for promoting the sustainable development of these campsites are beyond the scope of this study; future development efforts can focus on the following aspects:
(1)
The continuous development of tourism resources: Provinces in the Yellow River Basin should leverage their unique natural resources, cultural heritage, and intrinsic advantages to expand camping functionalities. Combined with extrinsic advantages, such as transportation and population, these efforts can optimize campgrounds’ spatial distribution and promote rapid development through tourism resources.
(2)
Emphasis on unique characteristics: Each region in the Yellow River Basin possesses distinct natural resources and cultural attributes. Strengthening these unique features and building characteristic campgrounds can cater to diverse camper preferences.
(3)
Integration with rural revitalization: With short-distance camping gaining popularity, integrating campgrounds with rural areas can create leisure industry clusters. This approach not only fulfills urban residents’ desire to escape city life but also stimulates rural development, providing an impetus for sustainable rural revitalization.

Author Contributions

X.F. initiated the study and drafted the original manuscript. P.T. provided technical support. F.J. contributed optimization ideas and refined the article. All authors have read and agreed to the published version of the manuscript.

Funding

This research received no external funding.

Institutional Review Board Statement

Not applicable.

Informed Consent Statement

Not applicable.

Data Availability Statement

The data presented in this study are available from the corresponding author upon request.

Conflicts of Interest

The authors state that there are no conflicts of interest.

References

  1. Yang, M. High-quality Development of Sports Tourism Industry in the Lower Yellow River Region: Logic, Dilemma and Relief. Sports Sci. 2024, 45, 96–105. [Google Scholar]
  2. Huang, Q.; Tan, Y.J.; Wang, C.H. Interpretation of power and realization path of high-quality development of sports industry under the new development pattern of “double cycle”. J. Xi’an Sports Inst. 2021, 38, 297–306. [Google Scholar]
  3. State General Administration of Sport. Fourteen Departments Issued a Document: Open-Air Business Development Added Impetus [EB/OL]. Available online: https://www.sport.gov.cn/n20001280/n20067608/n20067635/c25003848/content.html (accessed on 9 December 2022).
  4. Zhang, X.L. Research on the Constraints and Constraint Consultations of Mass Camping Tourism Participation in China; Shanghai Institute of Physical Education: Shanghai, China, 2022. [Google Scholar]
  5. Gibbs, K.C.; Hees, W.W.S. Cost of operating public campgrounds. J. Leis. Res. 1981, 13, 243–253. [Google Scholar] [CrossRef]
  6. Milohni, I.; Bonifai, J.C. Global Trends Affecting Camping Tourism: Managerial Challenges and Solutions. Tourism and Hospitality Industry. 2014. Available online: https://www.cabidigitallibrary.org/doi/pdf/10.5555/20193386766#page=385 (accessed on 28 May 2024).
  7. Park, J.; Ellis, G.D.; Kim, S.S.; Prideaux, B. An Investigation of Perceptions of Social Equity and Price Acceptability Judgments for Campers in the U.S.Nation Forest. Tour. Manag. 2010, 31, 202–212. [Google Scholar] [CrossRef]
  8. Brooker, E.; Joppe, M. Trends in camping and outdoor hospitality-An international review. J. Outdoor Recreat. Tour. 2013, 12, 1–6. [Google Scholar] [CrossRef]
  9. Connelly, N.A. Critical factors and their threshold for camper satisfaction at two campgrounds. J. Leis. Res. 1987, 19, 159–173. [Google Scholar] [CrossRef]
  10. Foster, J.R.; Jackson, L.E. Factors Associated With Camping Satisfaction in Alberta Provincial Park Campgrounds. J. Leis. Res. 1979, 11, 292–306. [Google Scholar] [CrossRef]
  11. Mallikage, S.T.; Perera, P.; Newsome, D.; Bandara, R.; Simpson, G. Effects of recreational camping on the environmental values of national parks in Sri Lanka. Trop. Life Sci. Res. 2021, 32, 119. [Google Scholar] [CrossRef]
  12. Perera, P.; Mallikage, S.T.; Newsome, D.; Vlosky, R. Profiling of shelter campers, their attitudes, and perceptions towards environmental impacts of campsite use and management: Evidence from national parks of Sri Lanka. Sustainability 2022, 14, 13311. [Google Scholar] [CrossRef]
  13. Kim, K.; Wang, Y.; Shi, J.; Guo, W.; Zhou, Z.; Liu, Z. Structural Relationship between Ecotourism Motivation, Satisfaction, Place Attachment, and Environmentally Responsible Behavior Intention in Nature-Based Camping. Sustainability 2023, 15, 8668. [Google Scholar] [CrossRef]
  14. Luo, Y.N. Research on the Planning and Design Method of Auto Campground: With Nanjing Dashi Lake Ecological Tourism Resort as the Example. Chin. Landsc. Archit. 2008, 7, 51–57. [Google Scholar]
  15. Gaładyk, P.; Podhorodecka, K. Tourist attractions and the location of campsites in Western Australia. Curr. Issues Tour. 2021, 24, 2144–2166. [Google Scholar] [CrossRef]
  16. Sánchez-Sánchez, F.J.; Sánchez-Sánchez, A.M. The Impact of COVID-19 Outbreak on Camping Tourism in Spain: A Spatial Approach to Tourist Destinations. Int. J. Environ. Res. 2022, 16, 94. [Google Scholar] [CrossRef] [PubMed]
  17. Shao, X.B.; Mu, M.J.; Chu, D.P. Spatial pattern evolution and cause analysis of museums in the Yellow River Basin based on GWR. Resour. Dev. Mark. 2023, 39, 894–902. [Google Scholar]
  18. Li, B.G.; Hu, Z.Q.; Miao, C.H. Spatio-temporal evolution characteristics and influencing factors of the industrial eco-efficiency in the Yellow River Basin. Geogr. Res. 2021, 40, 2156–2169. [Google Scholar]
  19. Sun, J.W.; Cui, Y.Q.; Zhang, H. Spatio-temporal pattern and mechanism analysis of coupling between ecological protection and economic development of urban agglomerations in the Yellow River Basin. J. Nat. Resour. 2022, 37, 1673–1690. [Google Scholar] [CrossRef]
  20. Guo, H. Sustainable development and ecological environmental protection in the high quality development of the yellow river basin. J. Humanit. 2020, 5, 17–21. [Google Scholar]
  21. Xu, X.L. Multi-Year Data of Administrative Division Boundaries in China. Resources and Environment Science Data Registration and Publication System. 2023. Available online: http://www.resdc.cn/DOI (accessed on 28 May 2024).
  22. Lu, S.; Zhang, X.J.; Zhang, Y.C. Spatial-temporal distribution and controlling factors of traditional villages in Huizhou region. Sci. Geogr. Sin. 2018, 38, 1690–1698. [Google Scholar]
  23. Yuan, D.; Wu, R.; Li, D.; Zhu, L.; Pan, Y. Spatial Patterns Characteristics and Influencing Factors of Cultural Resources in the Yellow River National Cultural Park, China. Sustainability 2023, 15, 6563. [Google Scholar] [CrossRef]
  24. Xiao, N.L.; Zhou, D.P.; Zhao, B.B. Spatial pattern evolution and its influencing factors of national sports industry base in China. J. Shandong Sport Univ. 2023, 39, 12–21. [Google Scholar]
  25. Li, X.J.; Yin, T.T.; Li, S. Spatial distribution and influencing mechanism of campsites in China. Econ. Geogr. 2023, 43, 205–218. [Google Scholar]
  26. Hu, C.; Liu, W.; Jia, Y.; Jin, Y. Characterization of Territorial Spatial Agglomeration Based on POI Data: A Case Study of Ningbo City, China. Sustainability 2019, 11, 5083. [Google Scholar] [CrossRef]
  27. You, M.L.; Ren, T. Spatial distribution characteristics, influencing factors and development strategies of sports parks in China: An analysis with poi big data. J. Sports Res. 2023, 37, 42–54. [Google Scholar]
  28. Sun, S.B.; Zhang, K.Y. Factor decomposition of regional disparity and driving force of China’s economy. Econ. Theory Bus. Manag. 2022, 42, 21–35. [Google Scholar]
  29. Zhu, R.; Xue, Y. The insight of inbound tourism to camping tourism at the Hexi corridor, Gansu province, northwestern China. J. Glaciol. Geocryol. 2019, 41, 246–256. [Google Scholar]
  30. Li, F.; Wang, D.G. Influencing factors and mechanism of campgrounds development based on tourist online reviews: A case study of Suzhou Taihu RV camping park. Geogr. Geo-Inf. Sci. 2019, 35, 135–140. [Google Scholar]
  31. Tang, L.; Huang, S.Q. Spatial distribution and influencing factors of the key villages of national rural tourism in Fujian Province. J. Cent. South Univ. For. Technol. 2023, 43, 181–190. [Google Scholar]
  32. Wang, X.W.; Li, X.J. Characteristics and influencing factors of the key villages of rural tourism in China. Acta Geogr. Sin. 2022, 77, 900–917. [Google Scholar]
  33. Ge, D.D.; Zheng, Y.Y.; Tong, L. Research on spatial differentiation and influencing factors of rural tourism industry based on poi data mining: A case study of Zhejiang province. J. Zhejiang Univ. 2023, 50, 483–494+507. [Google Scholar]
  34. Wang, S.P.; Han, L.; Xie, S.Y. Spatial distribution features and influencing factors of the eco-tourism demonstration areas in the Yangtze river economic belt. Ecol. Sci. 2022, 41, 75–83. [Google Scholar]
  35. Weyland, F.; Laterra, P. Recreation potential assessment at large spatial scales: A method based in the ecosystem services approach and landscape metrics. Ecol. Indic. 2014, 39, 34–43. [Google Scholar] [CrossRef]
  36. Bao, P.C.; Huang, L. How does ecological wealth promote tourism economy development: Empirical evidence from 286 cities in China. J. China Univ. Geosci. 2023, 23, 73–88. [Google Scholar]
  37. Noome, K.; Fitchrtt, J.M. An assessment of the climatic suitability of Afriski Mountain Resort for outdoor tourism using the Tourism Climate Index(TCI). J. Mt. Sci. 2019, 16, 2453–2469. [Google Scholar] [CrossRef]
  38. Fang, Y.L.; Wang, Q.Y.; Wu, Y.N. Spatial distribution characteristics of tourist flow network structure for cities along Shanghai-Kunming high-speed railway. Geogr. Geo-Inf. Sci. 2023, 39, 138–144. [Google Scholar]
  39. Li, F.; Wang, D.G.; Liu, C.X. Spatial distribution characteristics and mechanistic drivers of self-driving and RV camping in China. Resour. Sci. 2017, 39, 288–302. [Google Scholar]
  40. Zhang, G.H.; Su, Z. The impact of the coordinated development of Beijing-Tianjin-Hebei urban agglomeration on regional tourism economy: Direct effects and spillover effects. J. Ocean. Univ. China 2023, 11, 36–48. [Google Scholar]
  41. Wu, J.Q.; Min, W.F. A probe into the impact of education on industrial structure upgrading. Educ. Res. 2022, 43, 23–34. [Google Scholar]
  42. Wang, Q.Y.; Wei, J.J. Research on the influence of income and leisure time on leisure consumption. Tour. Trib. 2018, 33, 107–116. [Google Scholar]
  43. Luo, R.; Peng, C.H.; Bao, X.Z. Internet usage and family tourism consumption: An analysis of intermediary effect of information channel. Tour. Trib. 2022, 37, 52–66. [Google Scholar]
  44. Liu, X.Y. Study on spatial distribution characteristics and influencing factors of rural leisure tourism in Shanxi province. Chin. J. Agric. Resour. Reg. Plan. 2019, 40, 262–268. [Google Scholar]
  45. Tang, H.; Xu, C.X. Spatial distribution characteristics and formation mechanism of urban leisure tourism resources in Changsha city. Econ. Geogr. 2022, 42, 214–223. [Google Scholar]
  46. Chen, G.Y.; Zhao, Q.L.; Qi, S.Q. Spatial distribution of recreational fishery in Hainan province and its influence factors. J. Shanghai Ocean Univ. 2022, 31, 542–553. [Google Scholar]
  47. Li, L.; Hou, G.L.; Xia, S.Y. Spatial distribution characteristics and influencing factors of leisure tourism resources in Chengdu. J. Nat. Resour. 2020, 35, 683–697. [Google Scholar] [CrossRef]
Figure 1. Map of the study area. Note: This figure is from the website of the Institute of Geographic Sciences and Resources, Chinese Academy of Sciences. Figure 2 and Figure 4 in Supplement 10 are the same [21].
Sustainability 16 04944 g001
Figure 2. Number of campsites in the Yellow River Basin.
Sustainability 16 04944 g002
Figure 3. Lorentz curve of the spatial distribution of campsites in the study area.
Sustainability 16 04944 g003
Figure 4. Kernel density map of campsites in the study area.
Sustainability 16 04944 g004
Figure 5. Campsite with elevation map overlay.
Sustainability 16 04944 g005
Figure 6. Correlation between natural environment and campsites in the Yellow River Basin.
Sustainability 16 04944 g006
Figure 7. Road buffer to campsite correlation map.
Sustainability 16 04944 g007
Figure 8. Link between tourism conditions and campsite distribution.
Sustainability 16 04944 g008
Figure 9. The relationship between campsites and resident population and number of highly educated people in the study area.
Sustainability 16 04944 g009
Figure 10. Correlation between economic level and campsite distribution.
Sustainability 16 04944 g010
Table 1. Campsite counts per province in the Yellow River Basin.
ProvinceNumber of CampsitesWeightingCumulative Weight
Shandong Province11722.9922.99
Henan Province10320.2443.22
Shaanxi Province8917.4960.71
Shanxi Province489.4370.14
Inner Mongolia Autonomous Region469.0479.17
Gansu Province428.2587.43
Ningxia Hui Autonomous Region346.6894.11
Qinghai Province305.89100.00
Table 2. Influential factors affecting the spatial distribution of campsites within the study area.
Influencing FactorsSpecific Indicators
Geographical FactorsRiver Network Density (km/km2)
Elevation (°)
Altitudes (m)
Number of Geologic Hazards
Environmental ConditionsAir Quality (PM2.5) (μg/m3)
Average Annual Precipitation (mL)
Average Annual Temperature (°C)
Transport ConditionRoad Mileage (km)
Road Passenger Traffic
Distance to Nearest Administrative Center (km)
Tourism ConditionsNumber of High-Level Scenic Spots
Number of Tourists Received
Demographic and Economic ConditionsGDP per Capita (CNY)
Consumption Expenditure per Capita (CNY)
Provincial GDP (billions)
Number of Resident Population
Enrollment Figures for Higher Education Students
Table 3. Pearson correlation test of factors affecting campsites throughout the study area.
Indicators of Impact FactorsPearson’s Correlation Coefficient
River Network Density (km/km2)0.306
Elevation (°)−0.266
Altitudes (m)−0.786 *
Number of Geologic Hazards−0.083
Air Quality (PM2.5) (μg/m3)0.942 *
Average Annual Precipitation (mL)0.579
Average Annual Temperature (°C)0.840 **
Road Mileage (km)0.914 **
Road Passenger Traffic0.215
Distance to Nearest Administrative Center (km)−0.321
Number of High-Level Scenic Spots0.930 **
Number of Tourists Received0.909 **
GDP per Capita (CNY)0.254
Consumption Expenditure per Capita (CNY)0.212
Provincial GDP (billions)0.943 **
Number of Resident Population0.902 **
Enrollment Figures for Higher Education Students0.952 **
Note: * Indicates significant correlation at the 0.05 level, ** indicates significant correlation at the 0.01 level.
Table 4. Number of campsites in different buffer zones in advanced scenic areas.
BufferQuantitiesProportions
10 km35168.9%
15 km43986.2%
Disclaimer/Publisher’s Note: The statements, opinions and data contained in all publications are solely those of the individual author(s) and contributor(s) and not of MDPI and/or the editor(s). MDPI and/or the editor(s) disclaim responsibility for any injury to people or property resulting from any ideas, methods, instructions or products referred to in the content.

