Article

Determining the Interaction of Social Sustainability with the Physical Environment: A Case Study of Adana, Turkey

by
Buse Acik Etike
1,* and
Muyesser Ebru Erdonmez Dincer
2
1
Department of Architecture, Faculty of Architecture and Design, Adana Alparslan Turkes Science and Technology University, Sarıcam, Adana 01250, Turkey
2
Department of Architecture, Faculty of Architecture, Istanbul University, Fatih, İstanbul 34116, Turkey
*
Author to whom correspondence should be addressed.
Sustainability 2024, 16(12), 4947; https://doi.org/10.3390/su16124947
Submission received: 29 April 2024 / Revised: 31 May 2024 / Accepted: 5 June 2024 / Published: 9 June 2024
(This article belongs to the Special Issue Urban Social Space and Sustainable Development)

Abstract

:
Social sustainability has emerged as a critical factor in evaluating societal welfare and well-being. Consequently, researchers have initiated the development of a theoretical framework to delineate the components of social sustainability, achieving notable progress in this endeavor. However, the interplay between the social dimension and the environmental and economic dimensions remains insufficiently explored in user experiences, posing challenges in integrating social sustainability into preliminary design parameters in the built environment and resulting in socially inefficient spaces. This study seeks to elucidate the relationship between social sustainability and the environment while devising a measurement methodology that encompasses the physical environment. Concentrating on public spaces, pivotal in daily experiences and reflective of individual interactions, the research was conducted across five distinct public spaces in the Seyhan district of Adana. Methodologically, the study employed field research, preliminary examination, and statistical analysis. Data collection techniques, including surveys, observations, and measurements, were utilized to unveil statistically significant correlations between social sustainability and the physical environment of public spaces. Consequently, this study delineates the dimensions of these relationships and translates them into actionable design data.

1. Introduction

Since the publication of the Brundtland Report in 1987, sustainability has evolved into a dominant paradigm, expanding beyond environmental concerns to encompass social and economic dimensions as distinct elements [1]. Theoretical studies on social sustainability have gained momentum since then, supported by empirical evidence highlighting its significance for society [2,3,4]. Despite widespread acknowledgment of its importance, the literature on the social dimension of sustainability remains relatively sparse compared to other dimensions [5,6,7], contributing to ambiguity in its definitions [8,9,10,11] and conceptual confusion [12,13].
In addition to the uncertainties surrounding the definitions of social sustainability, studies have been inadequate in establishing a comprehensive framework for its relationship with other dimensions. However, social sustainability begins to elucidate aspects of social identity and culture when assessed in conjunction with other dimensions [14]. One of the most evident relationships is between social sustainability and the physical environment, a topic implicitly emphasized or theorized in many studies. The necessity of delineating this relationship stems from the requirement for spaces conducive to social interaction, which in turn shape and are shaped by social relations, accumulating mental, cultural, and historical information about society [15]. Consequently, it is challenging to address social issues independently of spatial considerations. However, scientific studies have yet to comprehensively determine this relationship in the transition from theory to practice, relegating the physical environment to merely “affecting” social sustainability rather than actively shaping it. Thus, the physical environment often remains a passive backdrop to social relations.
The information provided by space, both at micro and macro levels, influences the parameters of social sustainability [16], making the scale and context of space crucial in examining social sustainability. While previous studies have focused on city and neighborhood scales, we introduce the concept of “public space”, situated between these scales, as a new dimension. Public spaces hold significant social and cultural significance, serving as venues for social interactions and daily experiences [17], thus providing insights into societal trends and the interaction between social sustainability and the physical environment.
The motivation for this study is based on the assumption that the physical environment in public spaces directly contributes to social sustainability. Therefore, this article addresses the extent to which this theoretical assumption defines this relationship in the built environment, particularly in public spaces.
In this context, this study focuses on answering two research questions:
  • Is there a relationship between the concept of social sustainability and the physical formation of public spaces?
  • To what extent are the parameters of social sustainability related to the physical environment of public spaces?
Accordingly, the article aims to explore the impact of society’s interactions with the physical environment on social sustainability, viewing public spaces as stages for social relations and examining the role of the physical environment as a determinant of social sustainability parameters. The study asserts that social sustainability is intricately linked to the physical environment, contributing to a concrete understanding of the relationship between the two beyond theoretical frameworks. The model developed in this study offers a basis for researchers across different societies to assess the role of the physical environment in social sustainability. Furthermore, this study provides valuable data for stakeholders, such as designers and local governments, who hold decision-making positions in practical contexts, aiding them in understanding key parameters of user preferences. Consequently, the research findings possess the potential to influence a broad spectrum of individuals and communities.

2. Literature Review

2.1. Social Sustainability and Its Interactions with the Physical Environment

Social sustainability is conceptualized in three distinct ways in the literature [18]. Firstly, there is the development-oriented approach, which views social sustainability as a component of sustainable development, grounded in social values, norms, or structures, emphasizing the preservation of societal traditions and structures [4]. Secondly, the environment-oriented approach highlights social sustainability as a means to address environmental challenges, positioning it as a bridge between people and the environment in achieving ecological goals [19]. Lastly, the human-oriented perspective focuses on safeguarding or enhancing the well-being of present and future generations, viewing social sustainability as an integral aspect of overall sustainability and recognizing its interconnectedness with other dimensions [18]. This view has gained traction among researchers in recent years, emphasizing the importance of social parameters in ensuring sustainability [1,20,21].
Within the context of this study, which aligns with the third perspective on social sustainability, various researchers have defined and conceptualized the concept in diverse ways. Rashidfarokhi et al. [2] view it as the enhancement and maintenance of the well-being of present and future generations, while McKenzie [3] sees it as a process leading to improved living conditions within communities. The UK Presidency [22] defines it as a society that is safe, inclusive, well-planned, environmentally friendly, and offers equal opportunities and a high quality of life. Stren and Polese [20] characterize it as a development approach that fosters harmonious coexistence among culturally and socially diverse groups and enhances the quality of life for all segments of the population. Sachs [4] emphasizes the core values of equality and democracy, defining social sustainability as the comprehensive adoption of all human rights by all individuals. Despite the conceptual ambiguities surrounding social sustainability [19,23,24], studies emphasize the importance of parameters aimed at enhancing societal stability, cohesion, and well-being, revealing similar underlying relationships.
Social sustainability is closely intertwined with other dimensions. Cuthill [25] argues that contemporary development approaches fail to deliver fair social outcomes and advocates for a realistic approach by identifying two premises focused on the “social” concept. The first premise suggests that environmental issues are primarily social issues, emphasizing that it is humans, not nature, that can be managed. The second premise asserts that the economy exists to benefit society, highlighting its connection to social aspects through the fair distribution of resources.
Rashidfarokhi et al. [2] assert that social sustainability encompasses both concrete and abstract concepts, where abstract concepts pertain to societal relationships and concrete concepts are associated with the economic and physical environment. The Bristol Agreement, held in England as part of the European Union in 2005, outlined sustainable societies and underscored the significance of cities and urban areas in their formation [22]. Eizenberg and Jabareen [10] emphasize the importance of the physical aspects of human spaces in fostering social sustainability, mitigating environmental risks, and enhancing human well-being, categorizing them under the umbrella of urban form. Grum and Grum [26] explain the relationship between social sustainability and the physical environment through social infrastructure. Goosen and Cilliers [27] define the relationship between urban space and social sustainability by exploring the philosophical and sociological dimensions of place, emphasizing that a place is defined by movement, interaction, activities, and contextual meaning within the space. In their field study, Chen et al. [28] found that levels of quality of life in the context of social sustainability can be explained by the community environment and surrounding facilities. The quality of life and user satisfaction, as components of social sustainability, are directly related to environmental quality [29].
There is an extensive body of literature concerning the societal and physical criteria of social sustainability. These criteria can be summarized as justice and social equity [9,18,23,25], cohesion [1,19,23], integration [21,30,31], social network [31,32] and social capital [1,2,9], security [5,11,33], social infrastructure [25,34], activities [33,35,36], participation and democracy [5,14,37], governance [25,30,38], property acquisition [21], inclusion [11,18,33], diversity [3,5,9], social stability [32], identity and cultural heritage [30,33,37], legibility [34], imageability [39], quality of environmental structures [40], and health [21,33].
Ultimately, the level of social interaction in cities is closely linked to the city’s design elements, its hosted activities, and its layout [34]. Successful urban design fosters quality of life, socialization, and a collective cultural, political, and social life, thus determining the quality of social inputs and serving as a foundation for sustainable development. Furthermore, analyzing public spaces can offer valuable insights into the overall character of a city in certain instances [41].

2.2. Understanding the Social Aspect of Public Spaces

Public spaces, the “eyes” of the city [42], vividly portray the spirit of the place (genius loci), its people, and culture tangibly and profoundly [43]. The contribution of individuals to the shaping of this physical and cultural environment, fostered by communal unity, is procured through natural behavioral patterns. Consequently, the concrete and abstract manifestations of public spaces throughout history have been scrutinized by various disciplines, with interdisciplinary interactions significantly influencing the interpretation and evolution of the concept of the public. Different definitions of “public” have thus yielded diverse understandings of the contemporary public sphere [44].
Public space represents a forum where the public engages in discussions on societal issues without economic or social distinctions (guided by democratic principles) [45]. In this regard, public space not only shapes the spatial organization of multifaceted social phenomena but also embodies an abstract realm of freedom for activities and thoughts inherent to publicness [46]. The relationship between freedom and public space has evolved from ancient times to modern states, becoming a fundamental element in the formation of the public sphere.
Habermas [47] historically and etymologically grounds the concept of the “public” in the Greek Polis, defining it as the realm of facts, conflicts, and relationships. He developed the theory of discourse to restore an ideal public sphere essential for democracy, characterized not only by its openness and equal access but also by its critical and independent nature [48]. According to Arendt [49], the public sphere is where citizens can engage in politics freely, separated from the necessary activities for survival in private life. Associating the boundaries of the public sphere with the “human condition” of private space [49] helps identify deviations in the balance between the public and private. Sennet [50] strengthens the theoretical perspective by providing historical evidence, associating social relations with the public sphere from the Roman Empire onwards, and defining the problems of the public sphere from a social perspective. Goffman’s [17] studies on the connection between social relations and public life have provided an examinable transcript of the social order that shapes human behavioral patterns through rules and routines. Schmidt and Nemeth [51] argue that evaluating the public sphere as a normative purpose rather than merely as an end is a novel phenomenon in today’s world. However, discussions conducted within the theoretical framework of the public sphere disregard the physical space requirements of the public space. While some argue that public space gains meaning only as a developmental area for the social public sphere, others contend that “the use or active formation of public space (physically) is necessary for one’s rights to be heard” [51].
Madanipour [52] establishes the relationship between the physical formation of public space and its social and political implications by referencing the physical space where interpersonal communication and rational-critical discussions take place. The analysis of the formation and transformation of public communication within physical public spaces is inherently linked to the concept of public space. This necessitates the inclusion of both social and physical processes in defining public space. Mehta [53] defines public space as areas open to all segments of society, where public use generates active or passive social behavior, and where all individuals are subject to rules regulating the use of space. A well-designed public space should serve as a platform for discussion, planned or spontaneous encounters, and the exchange of diverse attitudes and ideas. Similarly, Carr et al. [54] begin the first chapter of their book with the definition of public space as a platform where the stage of social life unfolds, facilitating functional or ceremonial activities either by groups or individuals, with open and public access. Smith and Low [55] contextualize public space with social diversity across various settings such as streets, parks, media, the internet, shopping centers, national governments, international organizations, and local neighborhoods, without limiting it to a purely physical space concept. Instead, they approach it as a phenomenon encompassing the tension between spatial and non-spatial concepts. Carmona et al. [56] present two broad and narrow definitions of public space. The first definition encompasses all types of spaces, whether internal or external, urban or rural, restricted or unrestricted, built or natural environments, where public access is possible. However, considerations of selective ownership within society, time constraints, access barriers, and activity limitations have led to the adoption of the narrower second definition. According to this definition, public space is defined as built and natural areas where the public enjoys free and unrestricted access.
The ambiguities surrounding the definition of the public sphere offer researchers the flexibility to craft their own definitions, shaping the boundaries of their research. In this study, public space is defined as inclusive urban and social areas where individuals can engage in diverse social and physical activities equitably and freely, enhancing democratic communication with open dialogue channels, unrestricted by time, space, or community constraints.

3. Materials and Methods
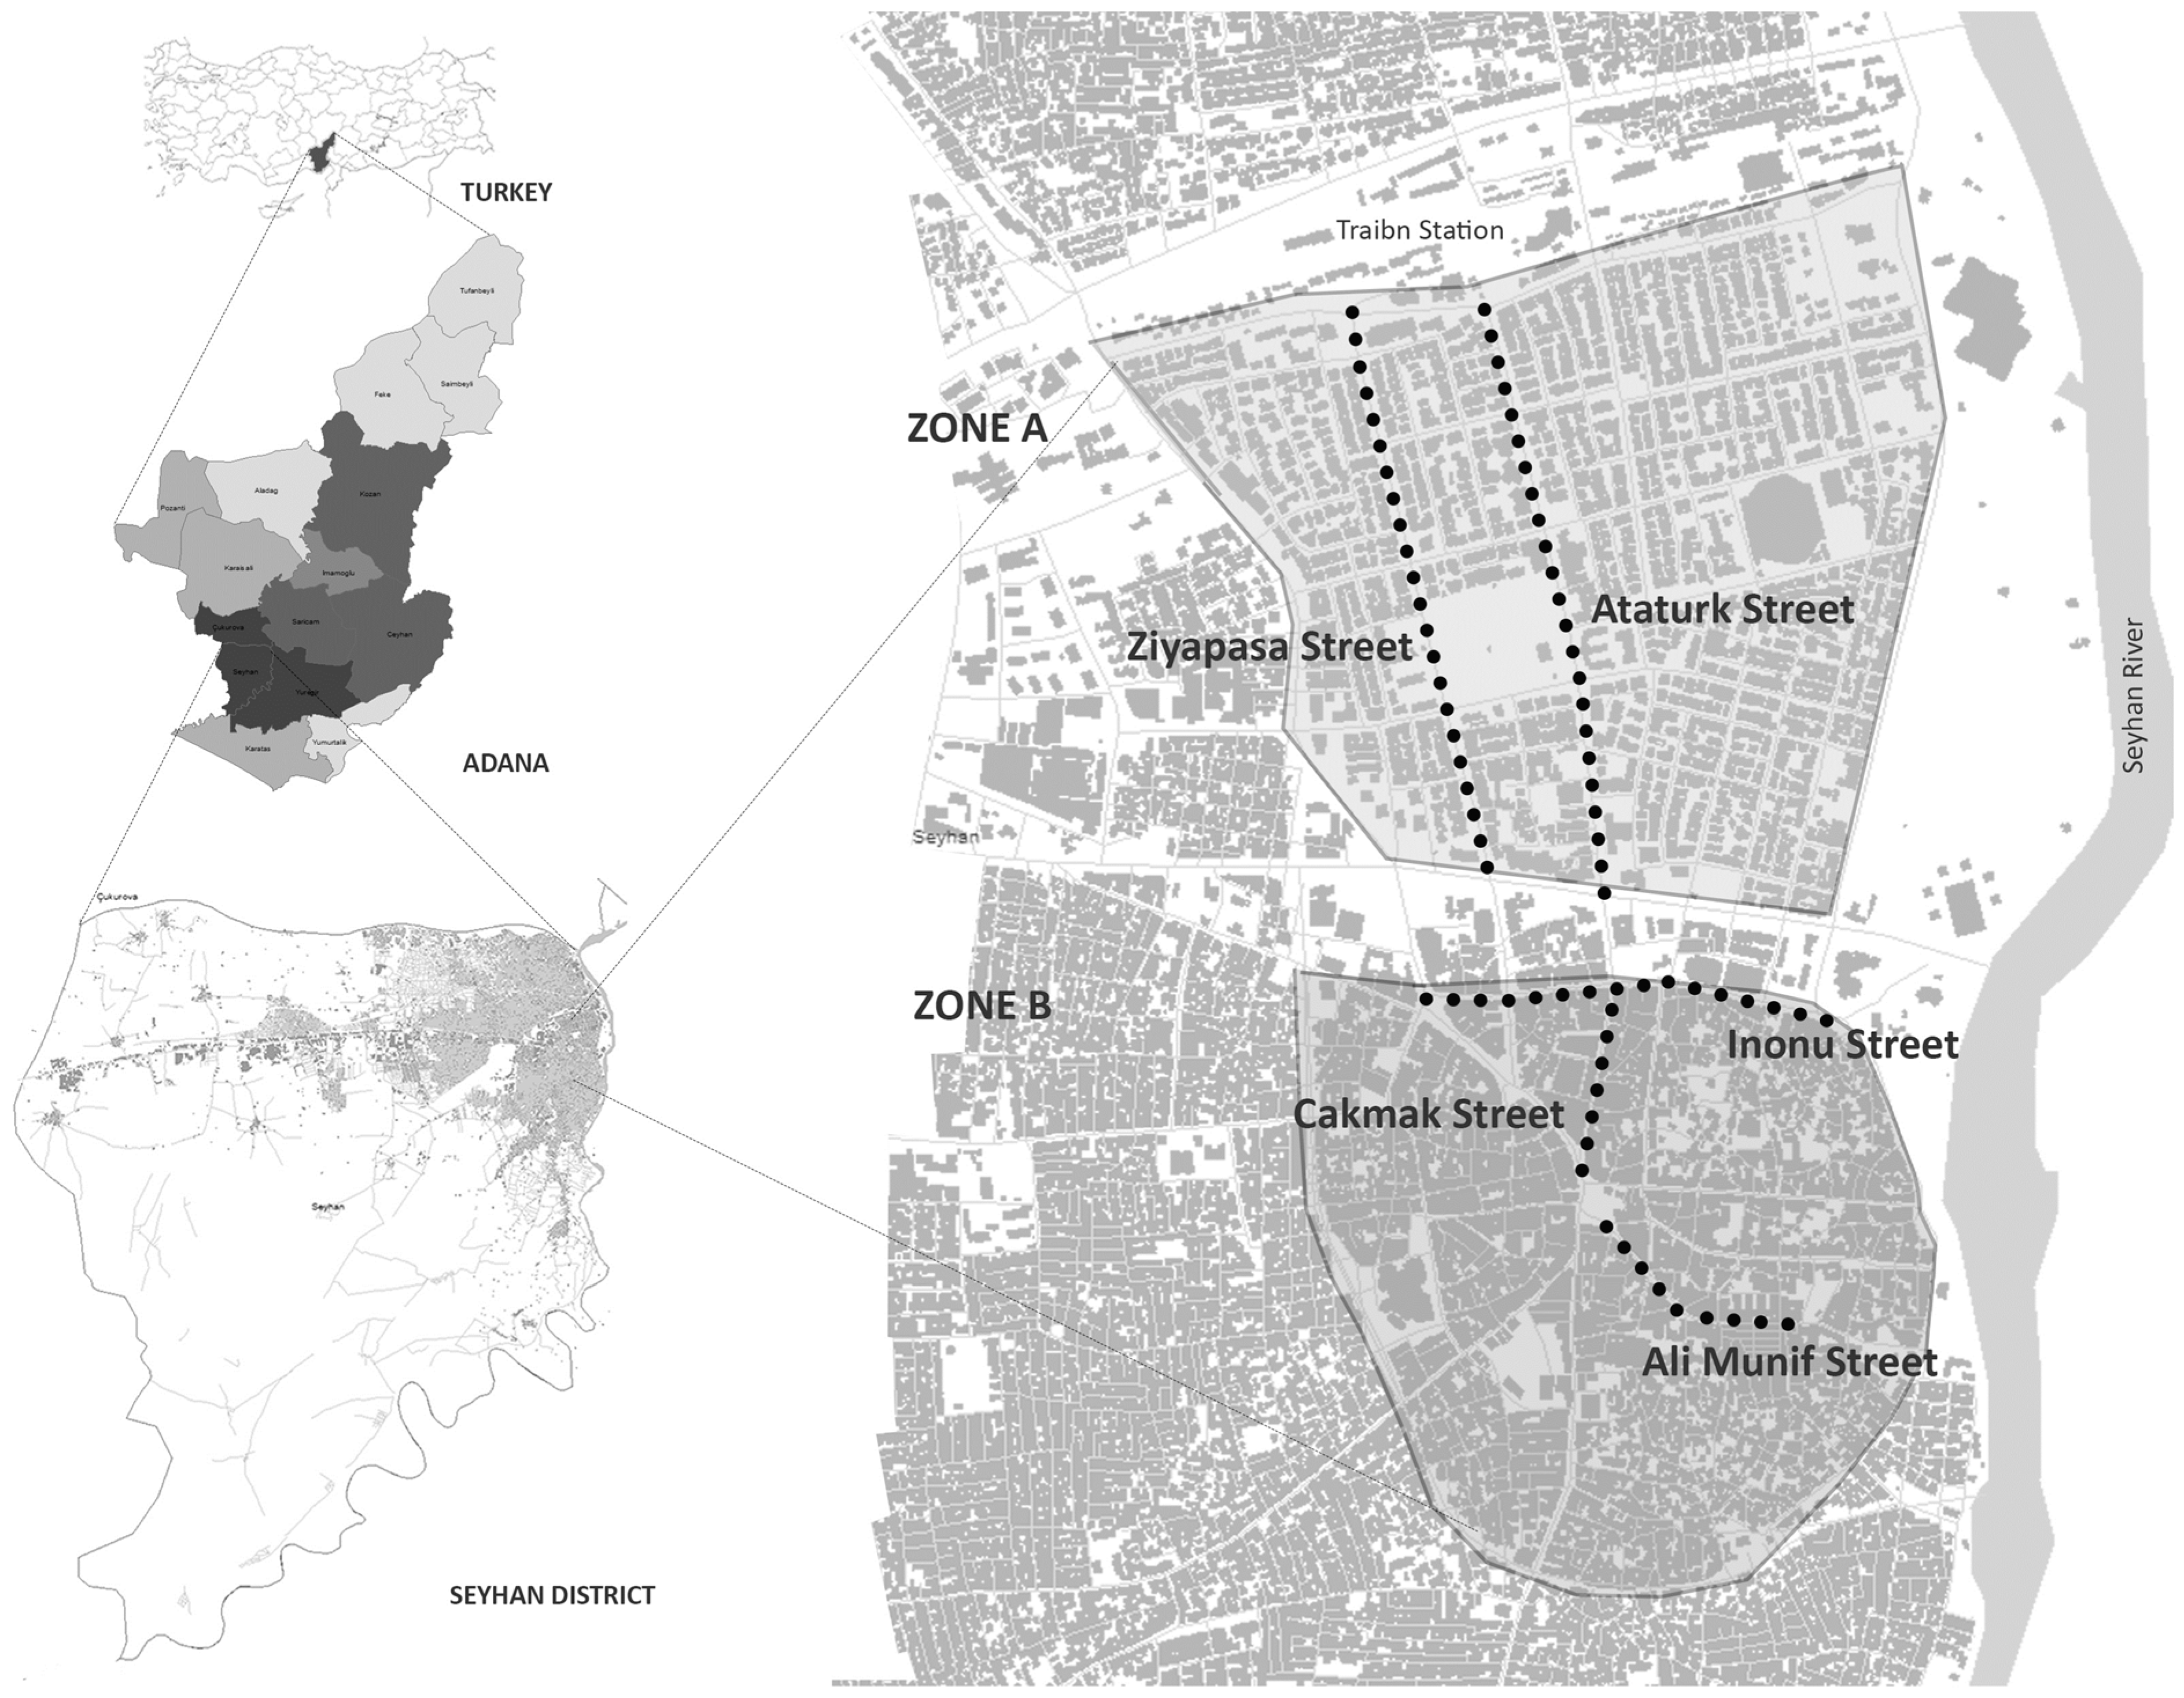
3.1. Case Context

This research was conducted in the Seyhan district of Adana province, situated in southern Turkey (Figure 1). Adana, the sixth-largest province, has approximately 2.3 million residents, representing 2.7% of the country’s population [57]. The selection of this region was motivated by several factors. Firstly, it lies in a transitional zone between Asia and Europe, characterized by diverse living conditions, cultural variety, and human behavior, notably influenced by recent migrations [58]. Secondly, Adana’s rich historical background has fostered a milieu where multiple cultures converge, giving rise to blended traditions and facilitating a synthesis of east-west cultural diversity [59,60,61,62]. Lastly, as a significant metropolitan city, Adana offers insights into human diversity and behavior that are reflective of broader trends in the country. Thus, research conducted in this region yields data applicable to studies nationwide. The Seyhan district, located centrally within the city, features some of the earliest examples of both planned and organic urban development. Within the study’s scope, the investigation focused on avenues and streets, integral components of public space serving densely populated residential areas.
For the study, we examined two areas within the Seyhan district of Adana, each representing different socio-economic levels. The first area (Zone A) comprises Ziyapaşa Boulevard and Atatürk Street. Atatürk Street, appearing in plans drafted by H. Jansen between 1935 and 1940, serves as a significant thoroughfare connecting the city station and the old city center. It connects the city station and the old city center, represents an important axis, both as a memory of the housing and development plan of the Early Republican Period, and remains a vital public space in Adana. Ziyapaşa Boulevard, running parallel to Atatürk Street, was established later to address the housing and transportation demands of subsequent periods.
The second area (Region B) encompasses İnönü Street, Çakmak Street, and Ali Münif Yeğenağa Street, situated around the historic Tepebağ Mound, which served as the initial residential zone of Adana. Consequently, it has long been a repository of Adana’s social memory and has played a pivotal role in shaping the city’s sense of identity and belonging through its physical infrastructure [63].
The rationale behind the division of these two regions within the study is their distinct social and community compositions. This segmentation allows for the development of a model that applies to a broader spectrum of society.

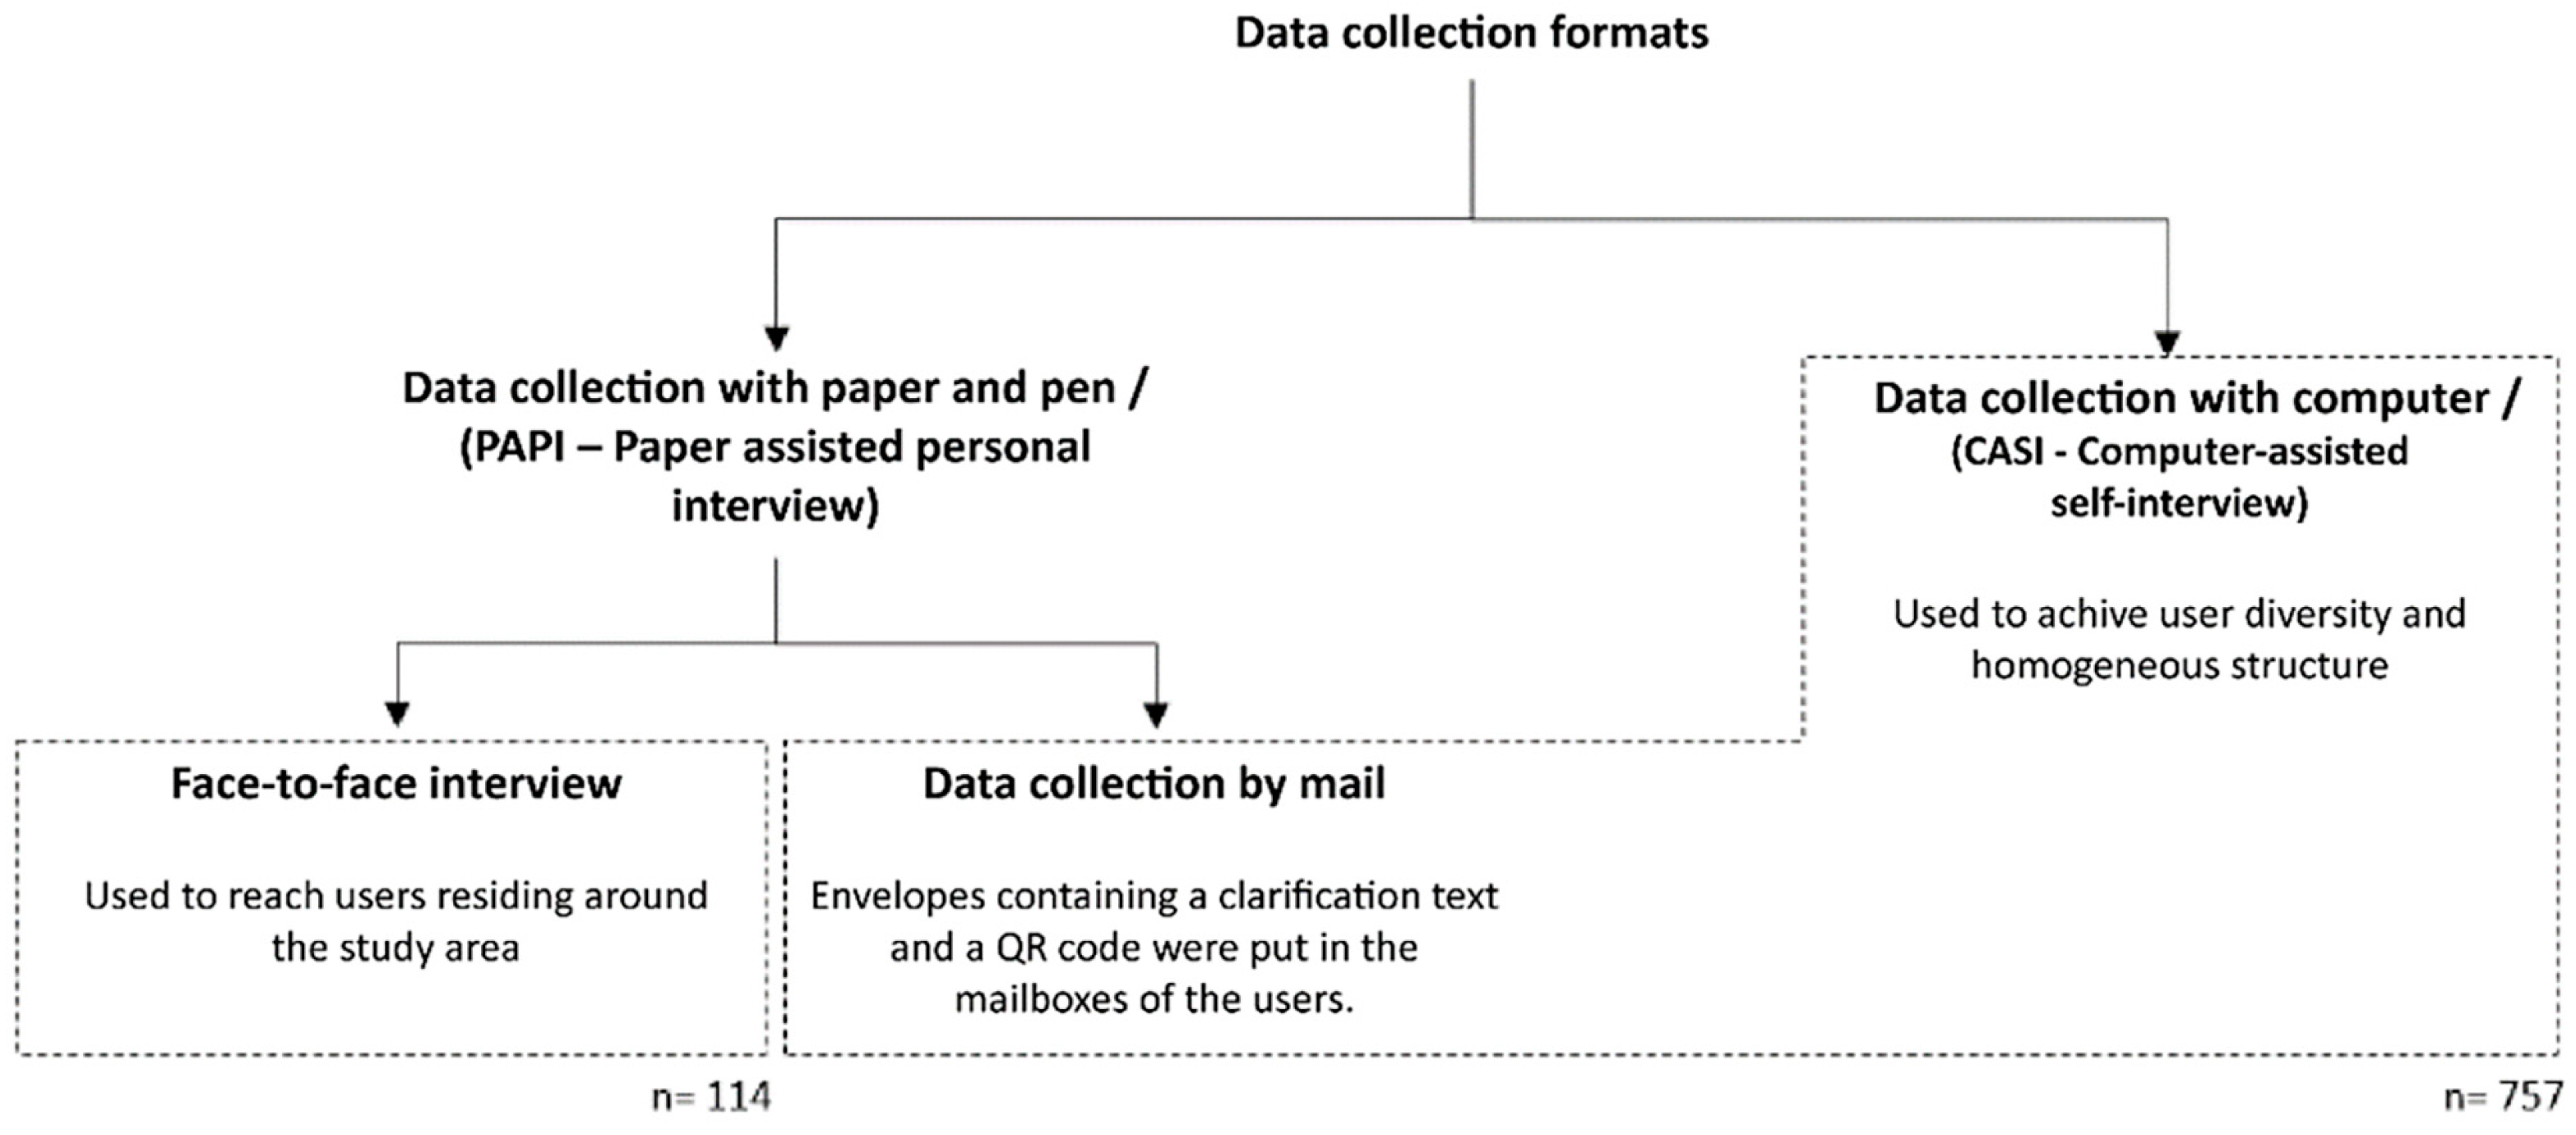
3.2. Design and Data Collection

The study comprises two primary sequential stages (Figure 2). The first stage involves identifying social sustainability criteria from a comprehensive review of the literature. This phase lays the groundwork for the survey design. The second stage entails designing a questionnaire, which serves as a method for determining social sustainability parameters and gathering other statistical data.

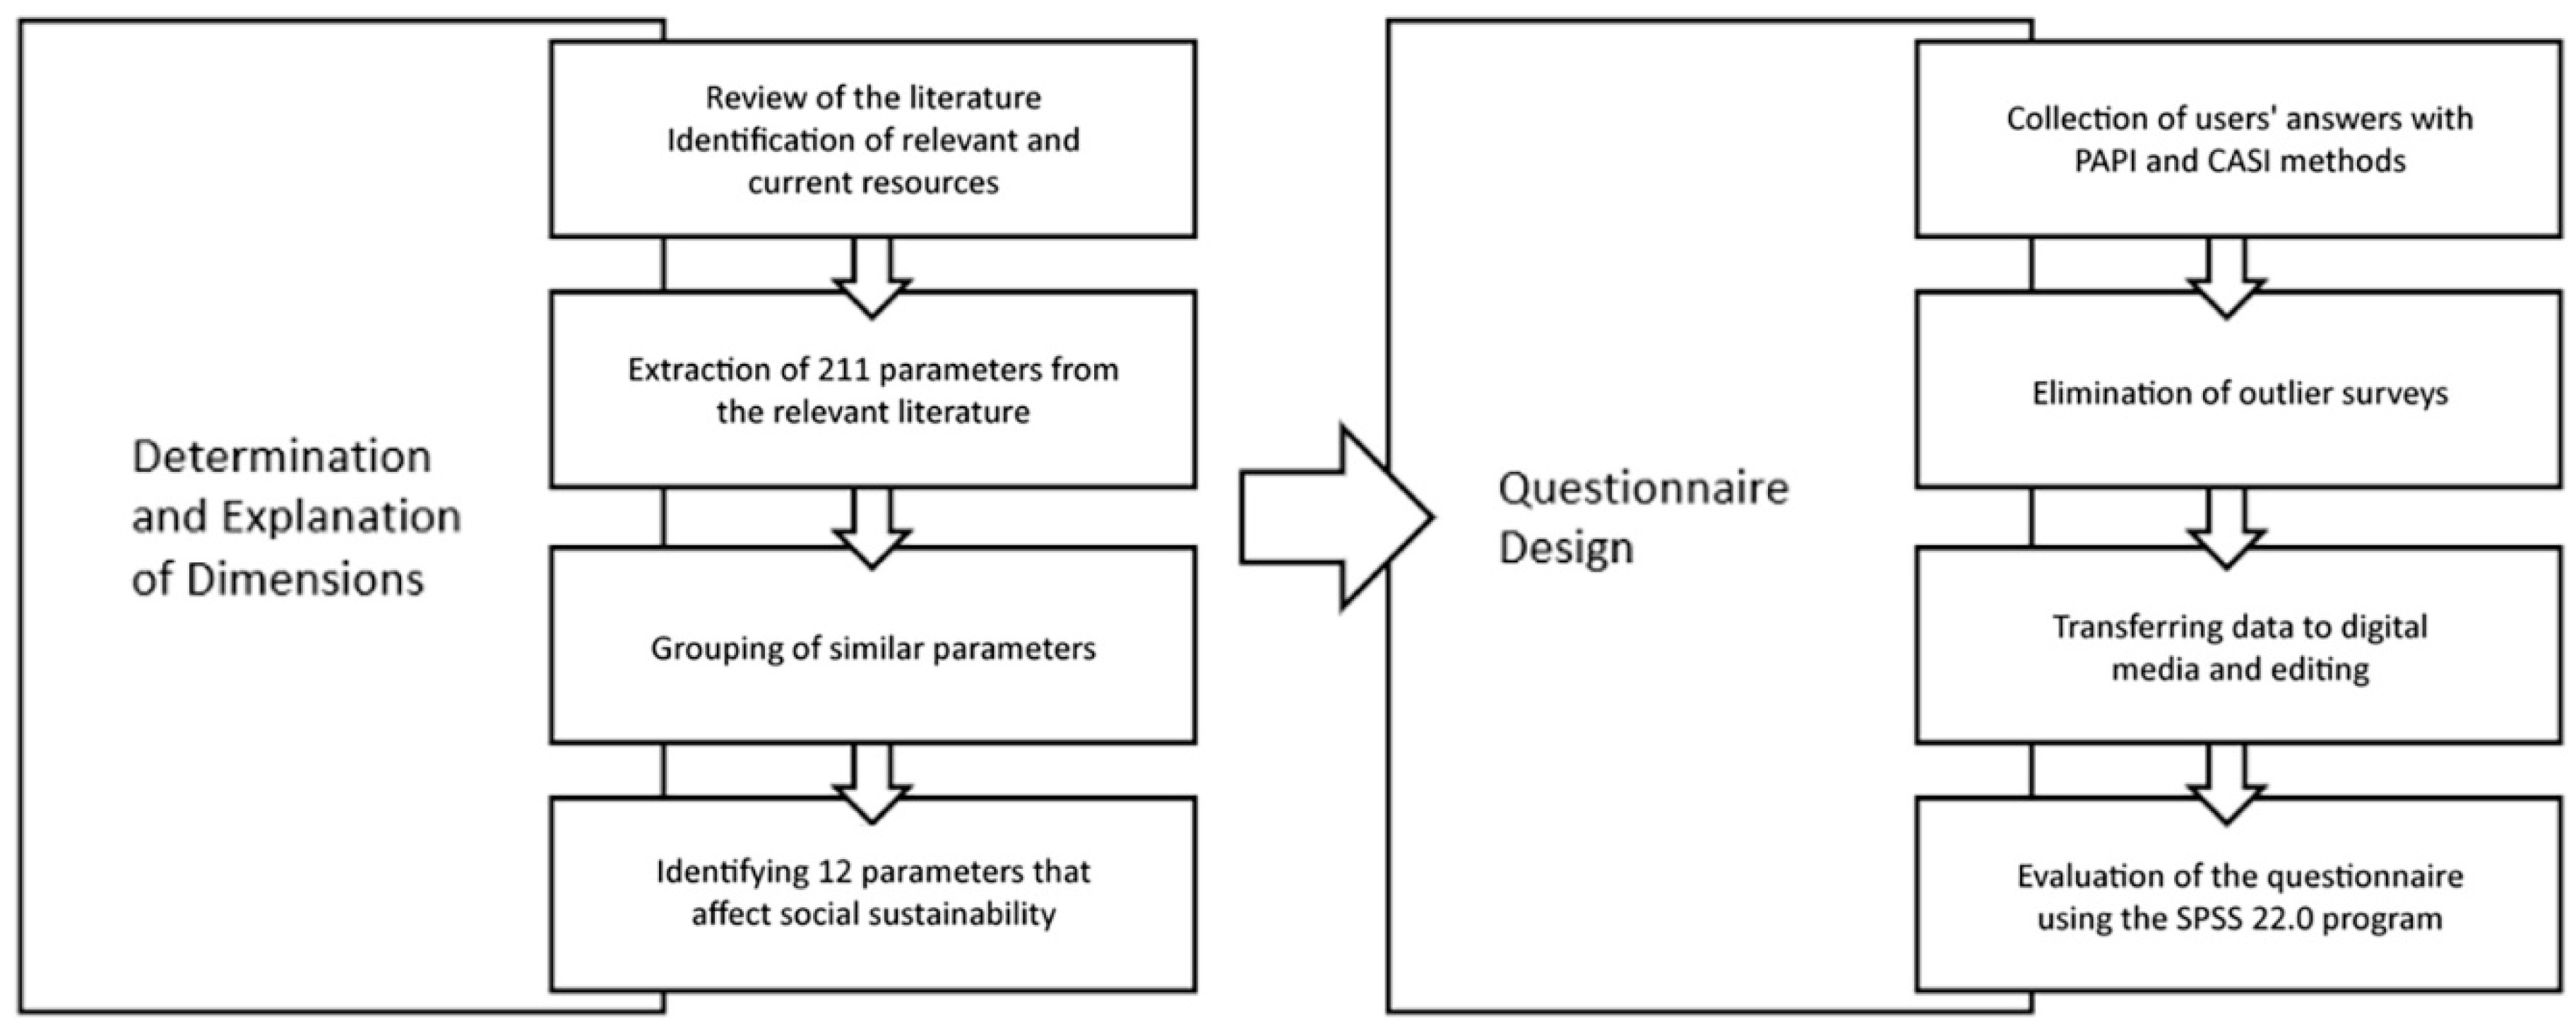
3.3. Determination and Explanation of Dimensions

The determination and elucidation of the parameters comprising the first stage of the study were carried out in four steps. The objective of this stage is to establish the necessary parameter information framework for questionnaire design, which involves collecting and evaluating information based on subjective opinion.
In the first step, a comprehensive literature review was conducted, focusing on parameters identified by researchers within the target society. These parameters encompassed a theoretical exploration of social sustainability and the social aspect of public space.
In the second step, a total of 211 parameters were identified from the gathered sources, with each parameter’s meanings and explanations documented.
Subsequently, parameters with similar meanings were grouped and organized under specific headings, resulting in a reduction to 28 parameters. This reduction was accomplished through the input of 5 experts: 3 faculty members from Yıldız Technical University, 1 faculty member from Istanbul Technical University, and 1 faculty member from Beykent University in Istanbul. The items under each heading also constitute the contents of the factors.
Finally, the compacted and categorized parameters were integrated under a common title, forming 14 main social sustainability parameters through consultation with the same experts (Table 1). Additionally, other parameters identified from studies falling under these groups were included in the study as sub-criteria.

3.4. Questionnaire Design

A questionnaire study was conducted to assess the parameters derived from the literature review, aiming to establish a method for determining and measuring factors influencing social sustainability. The identified parameters and their associated variables were translated into questions, and the questionnaire was designed using a 5-point Likert scale, categorizing responses from “strongly disagree (1)” to “strongly agree. (5)” The Likert scale used in the study was treated as an interval scale ranging from 1 to 5.
The questionnaire was administered through a combination of two data collection methods (Figure 3). The first method involved face-to-face interviews using the Paper-Assisted Personnel Interview (PAPI) technique, along with data collection via mail. Face-to-face interviews were conducted by field interviewers who engaged with settled members of the public within the study area, reaching a total of 114 users. For individuals who could not be reached or were not found at home, a questionnaire link accessible through a QR code on the document was mailed to them for completion.
The second method utilized a computer-assisted data collection model, specifically employing a self-administered web-based questionnaire linked via the Internet (Google Forms). This method, known as computer-assisted self-interviewing (CASI), enabled the questionnaire to be distributed to users online, resulting in reaching 757 participants. In both methods, the sample was selected using a cluster and then a random sampling approach to minimize the effects of the pandemic issues.
A total of 871 questionnaires were collected from users, and normality was assessed by examining kurtosis and skewness values. According to Kim [64], for cases where N > 300, kurtosis and skewness values are considered normally distributed within the range of −2 to +7 without a z value. Hence, extreme values disrupting normality were removed from the study by examining the boxplot to ensure accurate results for future tests. Additionally, duplicate surveys identified in the data collected via Google Forms were eliminated, as they were caused by a software issue. Specifically, individuals with repetitive email addresses were identified and excluded from the analysis. Consequently, 676 valid questionnaires were obtained.
The data collected from both digital and face-to-face methods were consolidated using the Excel program and subsequently transferred to SPSS 22.0 software for further analysis.
In the survey study, ANOVA and stepwise regression tests were applied. The ANOVA test was utilized to demonstrate the differences between zones A and B, aiming to develop a generalizable model for various social fabrics. Stepwise regression was employed to identify the independent variables that best fit the model and to determine their effects on the dependent variable.

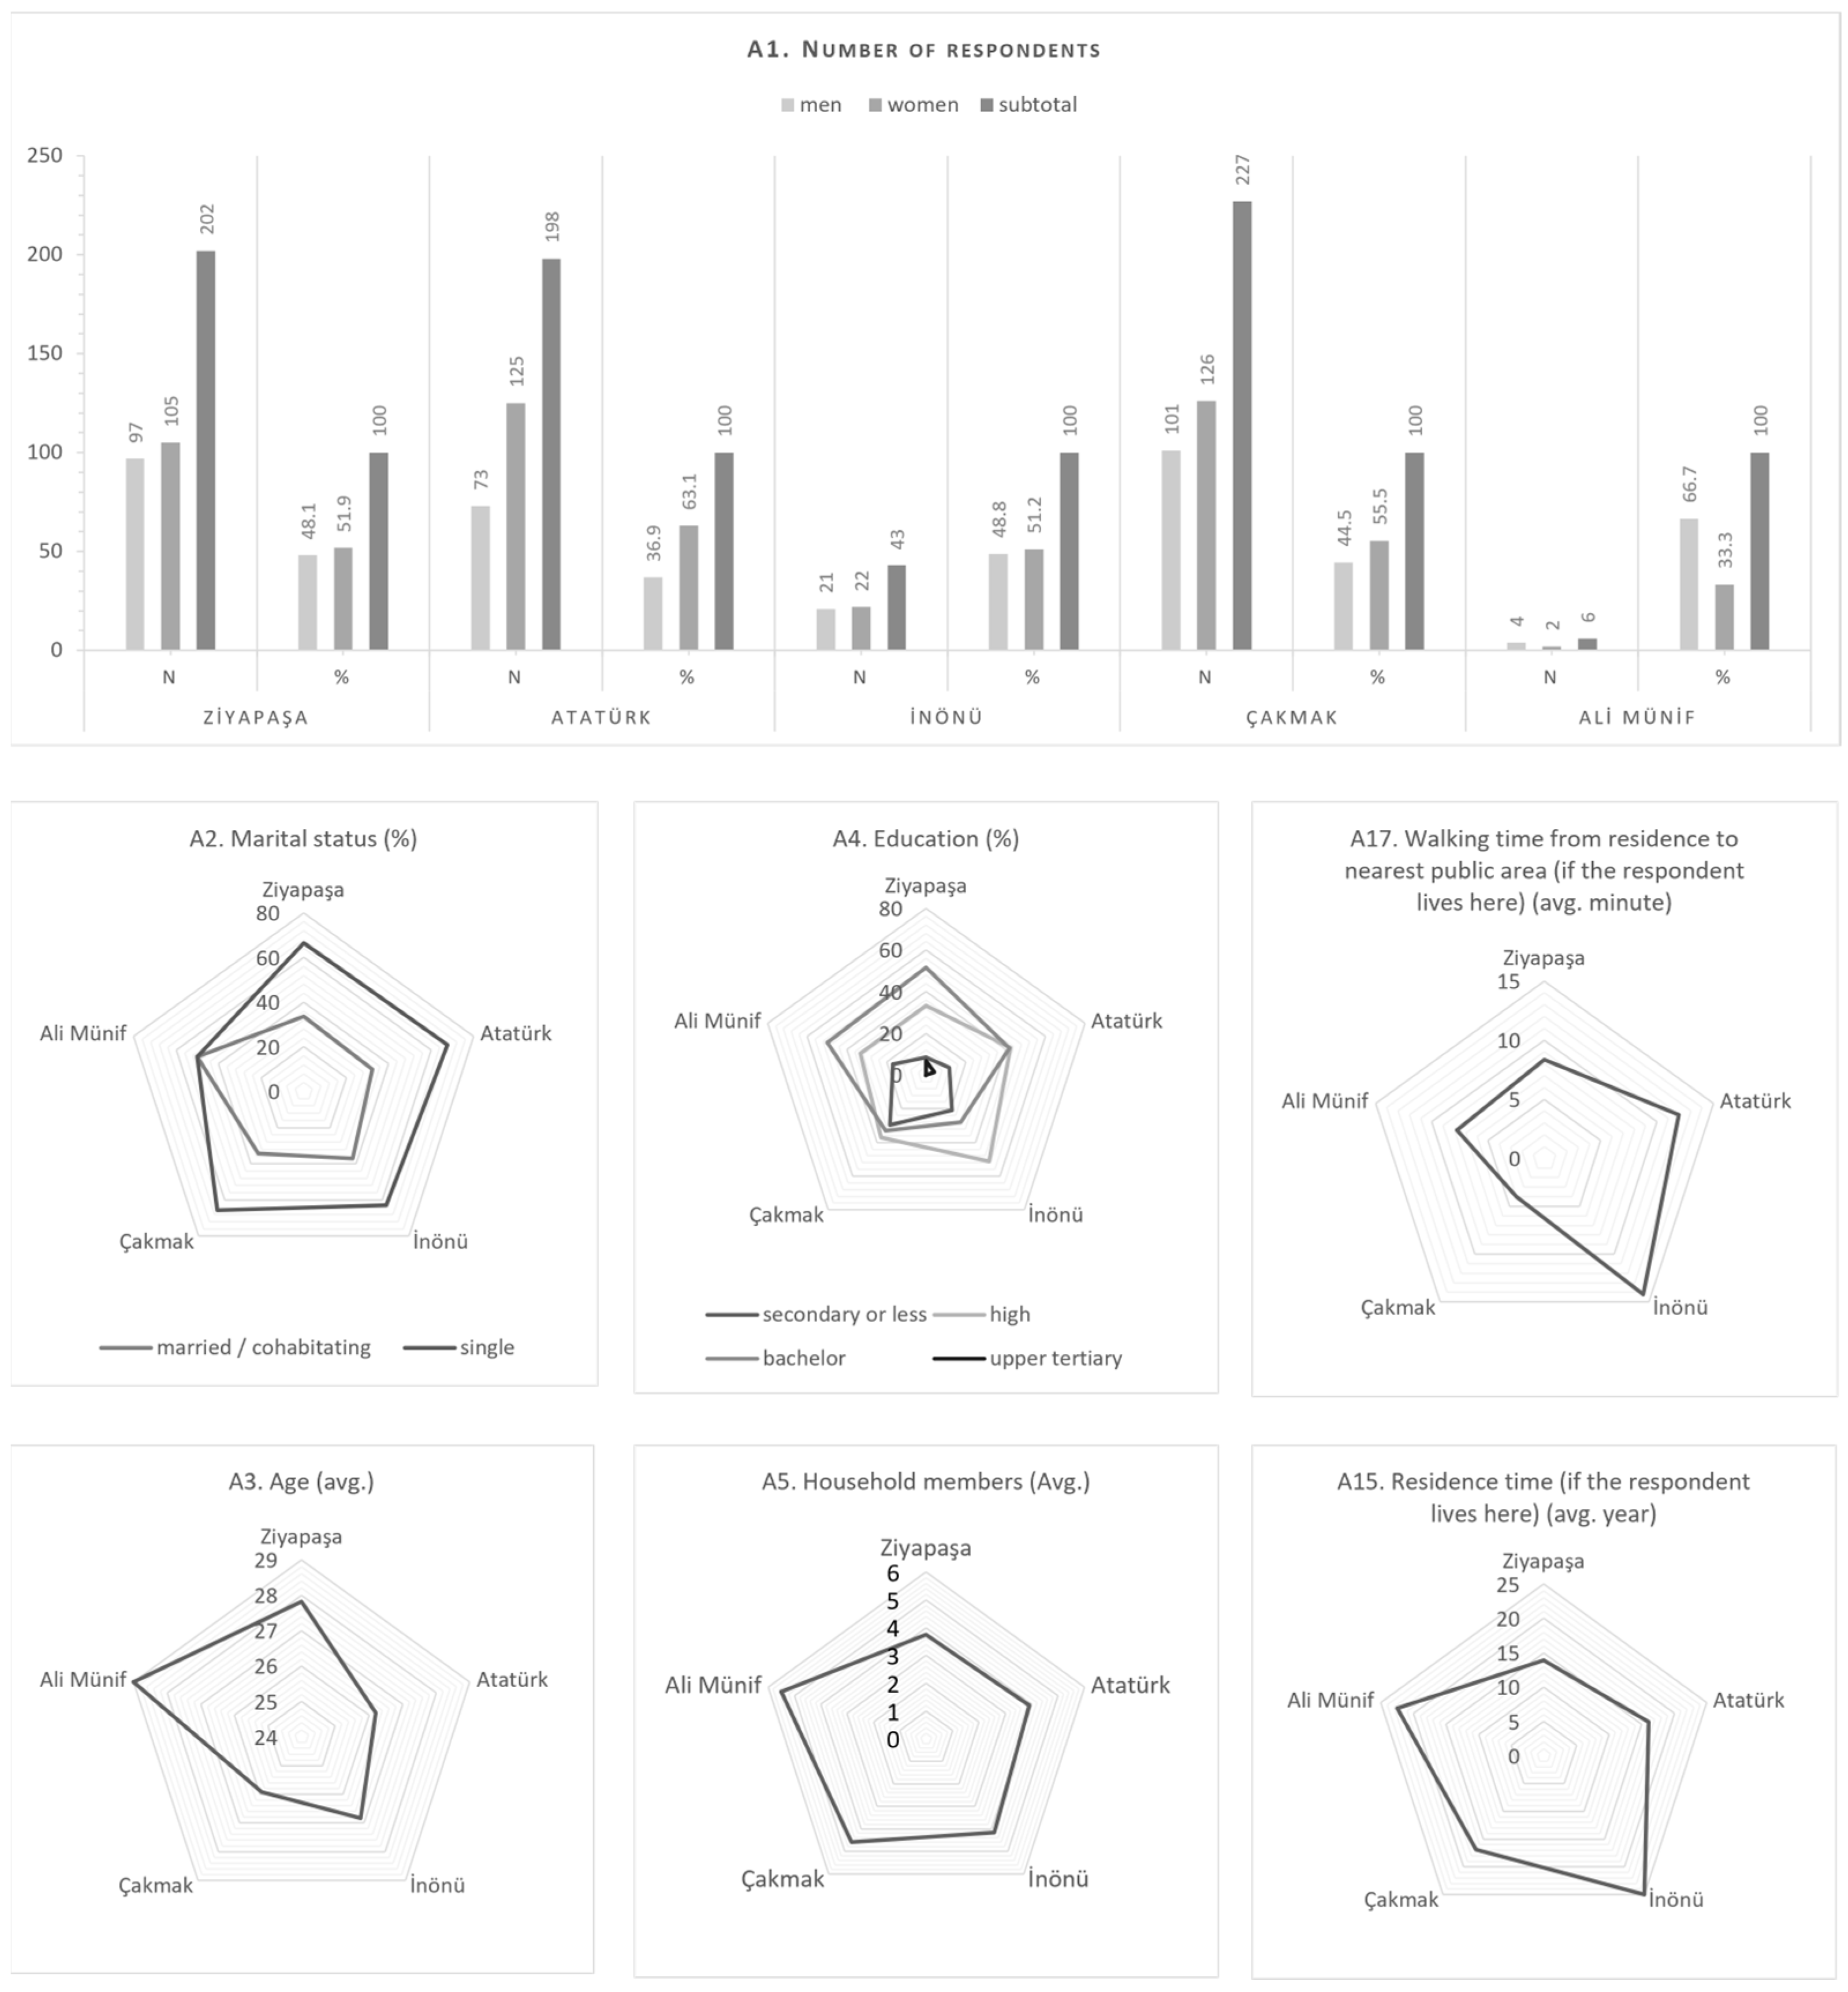
3.5. Demographic Description

The demographic data of 676 individuals is presented in Figure 4. The participants were selected from individuals residing and actively utilizing the study area in Adana. In region A, which includes Ziyapaşa and Atatürk, 230 women (57%), and 170 men (42%), answered the questions. In region B, covering Çakmak, İnönü, and Ali Münif, 150 women (54%) and 126 men (45%) participated. Overall, 59% of the participants were female, and 41% were male. Among the participants, 229 were married (33%), while 447 were single (66%). The ages of the participants ranged from 15 to 58 years, with a concentration between 18 and 27 years. The average age of the 676 survey participants was 26.66 years. To assess the educational backgrounds of the participants, they were asked to select one of seven categories: “no formal education”, “primary school” “secondary school”, “high school”, “bachelor”, “master”, and “PhD”. However, considering the frequencies of the responses, the categories were reduced to four, as shown in Table 2. According to the responses, the majority of participants were graduates of undergraduate and high school programs. It was observed that participants in Ziyapaşa and Atatürk were predominantly graduates, while as one moves south in Adana, the number of high school graduate participants increases. Participants living in Zone A reside with an average of 3.75 to 3.91 people in their households, whereas in Zone B, the number of people per household increases. The average length of residence in the study areas ranges from 13.94 years to 22.5 years. Finally, when participants were asked about the walking time to the nearest public space from their residences, Çakmak had the shortest time at 4 min, followed by Ali Münif at 7.75 min, Ziyapaşa at 8.33 min, Atatürk at 11.93 min, and İnönü at 14.23 min.

4. Results

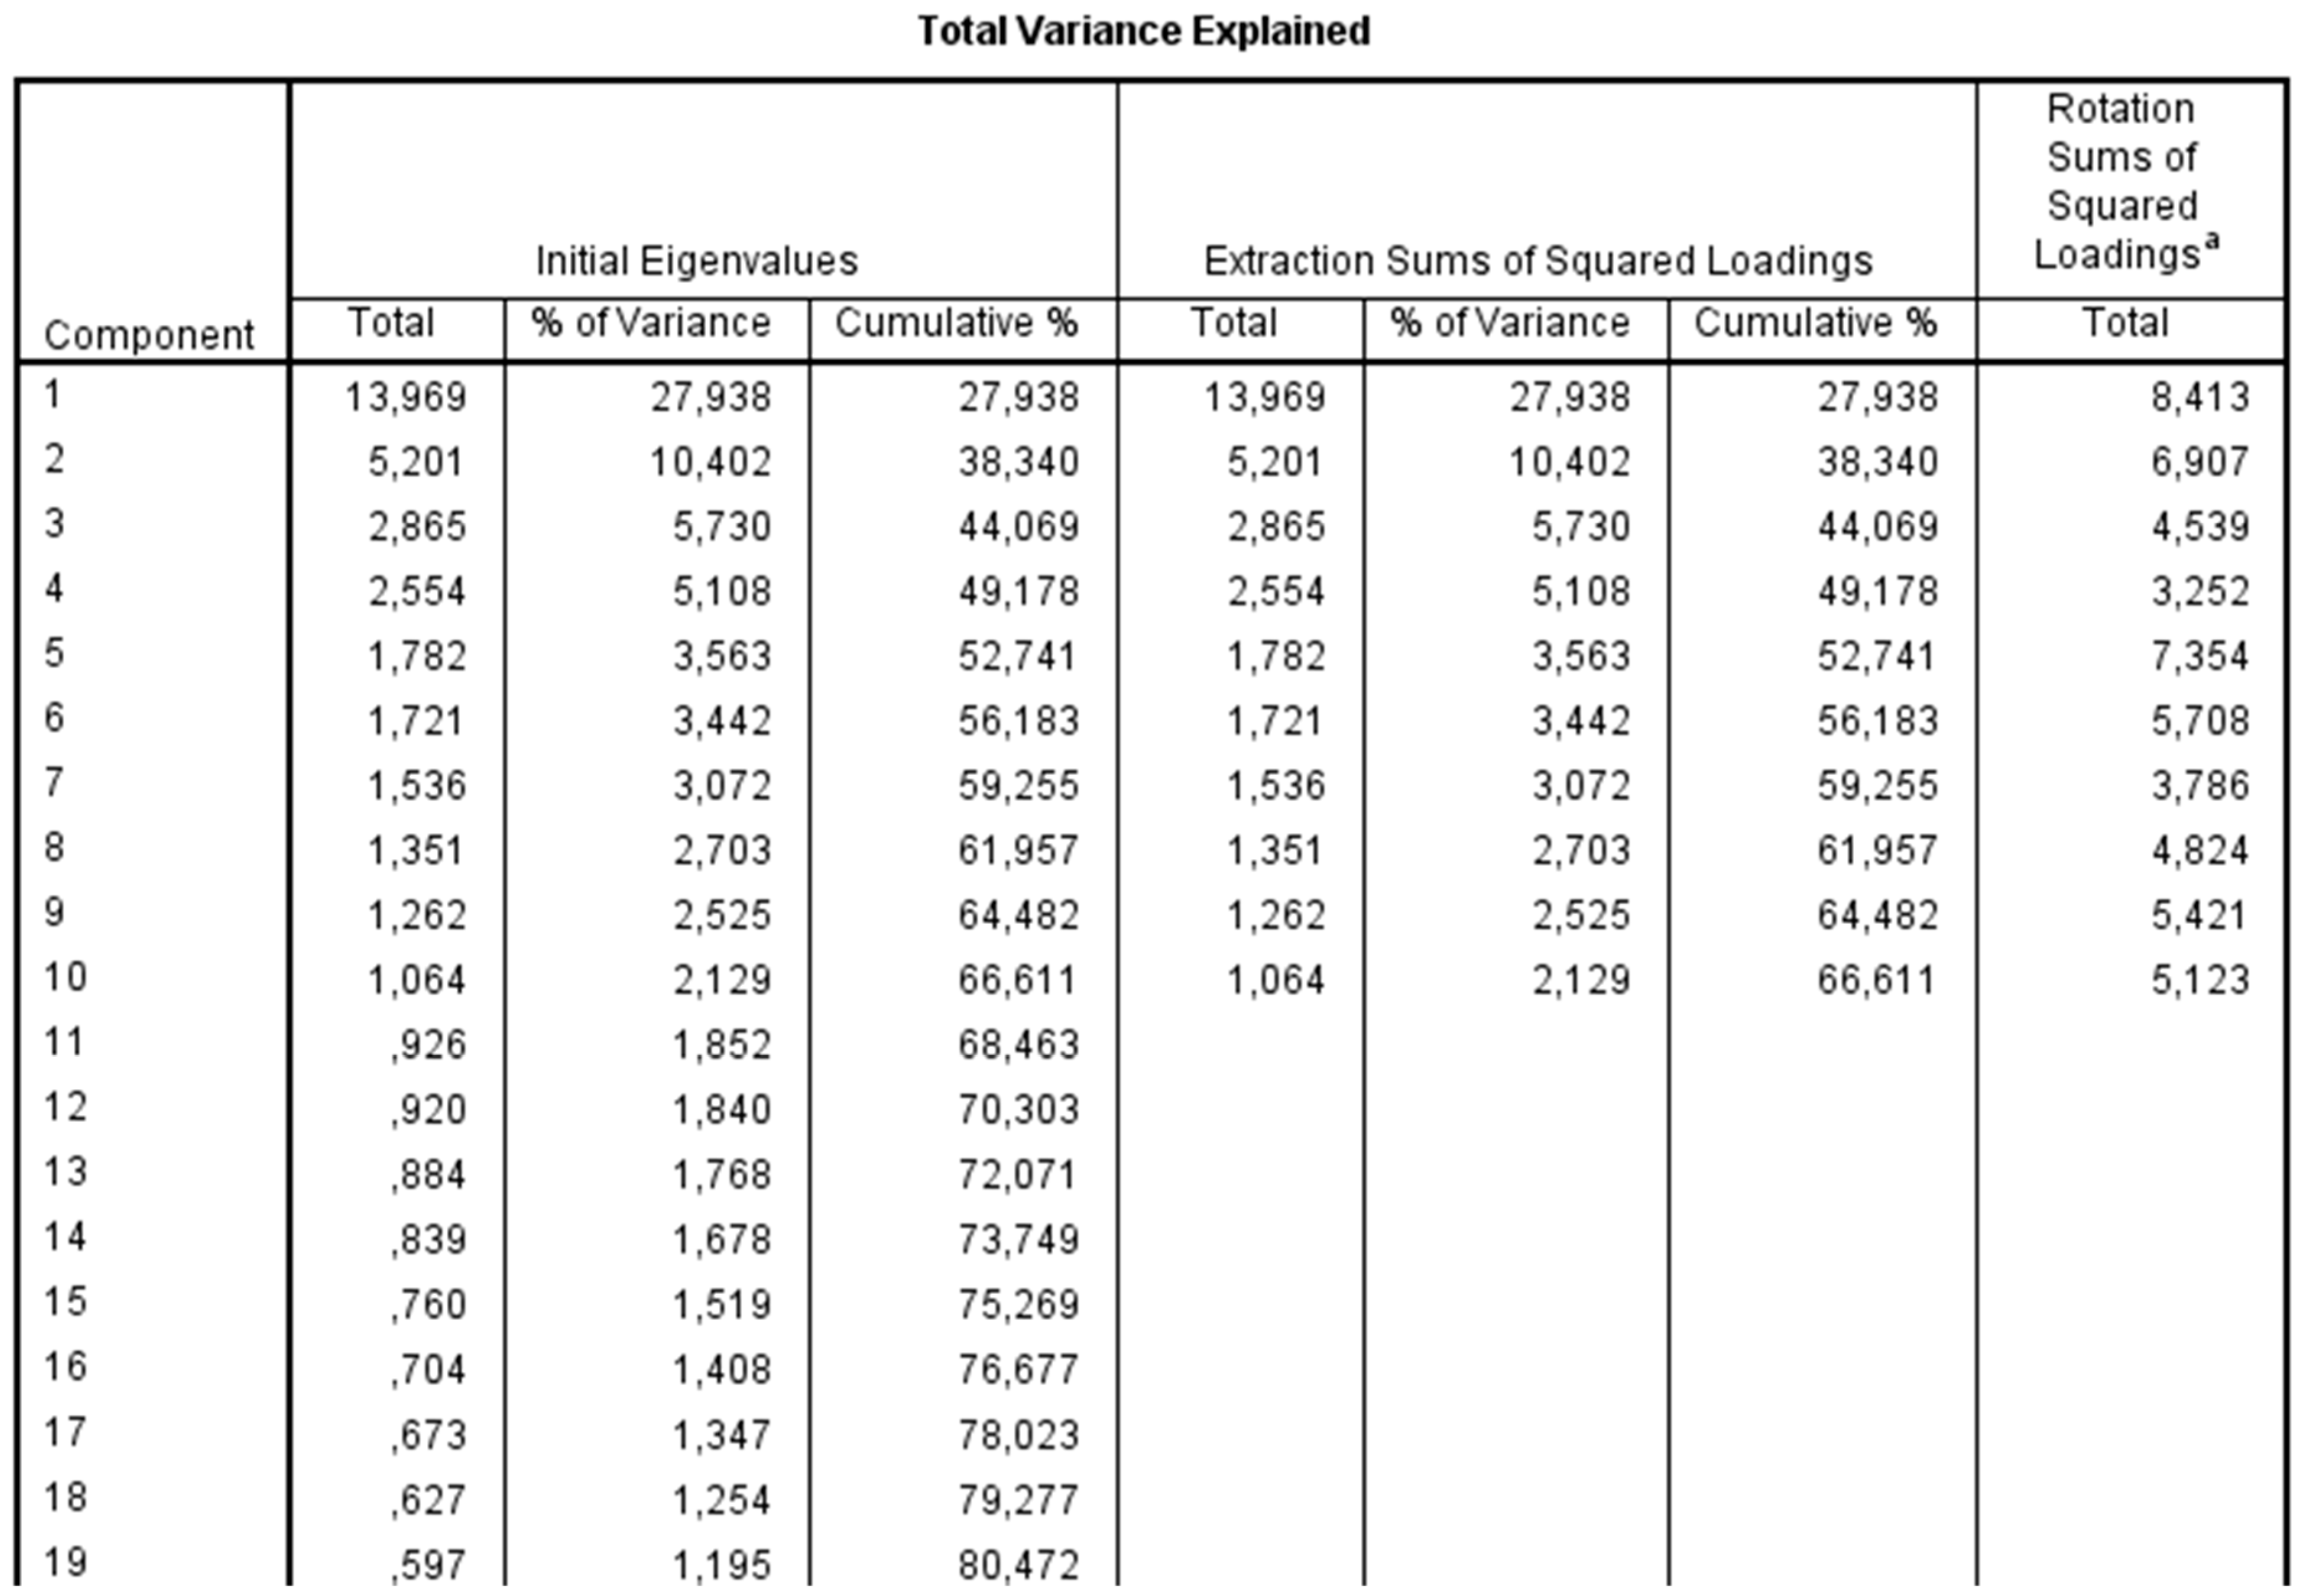
4.1. Determination of the Indicators

In the questionnaire study, factor and reliability analyses were conducted to assess the social equivalents of the parameters and variables identified from the literature. Exploratory Factor Analysis (EFA) was employed for validity analysis, utilizing Principal Component Analysis (PCA) as the inference method. The objective of this analysis was to enlighten the multidimensional structure of the questionnaire by elucidating the relationships among the variables. Specifically, factor analysis aimed to discern correlations between the questions and derive fewer factors. The rotation process was employed to enhance the interpretability of the factor distributions of the variables. The “Oblimin with Kaiser Normalization” rotation method was selected, considering the theoretical acceptance of inter-factor relationships in this study. KMO values and Bartlett’s test of sphericity confirmed the sample’s suitability for factor analysis (Table 2).
The number of factors was determined using Eigenvalue values, with factors having Eigenvalues greater than 1 being considered. 10 factors explain 66.611% of the variances (Figure 5).
Factor analysis revealed 10 factors and their contents (Table 3). Additionally, 11 variances that loaded less than 0.3 and showed a high load on the double factor were extracted. If variances loaded onto multiple factors differ by more than 0.1 among the loads, the factor with the highest load was considered.
In the second stage, reliability analyses of these factors were conducted to assess the clarity of the questions for the users. For the reliability analysis, Cronbach’s Alpha scores were examined for each factor. The reliability results obtained from SPSS are presented in Table 4. Additionally, the Cronbach’s Alpha values for all questions are provided as a total value at the bottom of the table.
The factors identified through the questionnaire and statistical analysis were labeled as follows: (1) Belonging and Identity, (2) Attractiveness, (3) Vitality, (4) Social Capital, (5) Participation and Democracy, (6) Justice and Social Equality, (7) Cohesion and Integration, (8) Health, (9) Security Perception, and (10) Social Infrastructure.
Belonging and Identity. Belonging plays a crucial role in enhancing social well-being, enhancing motivation to overcome challenges, and promoting happiness [35]. Shirazi [5] outlined the benefits of belonging, linking it to environmental security, social bonds, and welfare. Hemani, Das, and Chowdhury [65] emphasized the significance of belonging in people’s enjoyment of artificial physical environments. It remains a pivotal psychosocial strategy for developing resilience, healing, adaptation, and development [66]. Additionally, identity contributes to social dynamism and the preservation of cultural infrastructure [30]. Identity can be conceptualized in two dimensions: physical identity [67] and social identity [68]. Physical identity delineates familiarity from unfamiliarity and may encompass attributes such as distinctiveness, permanence, and stability [30]. Conversely, social identity refers to the identity shaped within a social context [69].
The attractiveness of the physical environment. Attractiveness refers to the extent to which environmental characteristics align with users’ expectations overall [70]. Lariman et al. [71] found a positive correlation between urban environment quality, physical environment attractiveness, aesthetic appeal, and satisfaction, with satisfaction increasing as quality improves. However, attractiveness is influenced by social and communal factors, shaping both physical and social realities accordingly [72]. Thus, the quality and perception of attractiveness are closely tied to social data.
Calmness–Vitality. Khalili and Fallah [73] define vitality as the presence of ongoing activities in space, rendering it functional and appealing throughout the day. Jacobs [42] observed that human presence in public spaces contributes to safety, while Montgomery [39] linked vitality to pedestrian flows. Vitality’s creation is associated with environmental activities [39], physical attributes [74], and human diversity, which are closely interrelated. Consequently, many researchers view public space vitality as a criterion for social sustainability [75].
Social capital. According to the World Bank [76], social capital covers institutions, relationships, attitudes, and values governing interactions among people, contributing to economic and social development. Holman and Rydin [77] highlight networks rich in trust, norms, and values as central to all definitions of social capital, facilitating collective actions and cohesion. Rashidfarokhi et al. [2] further categorize social capital into three groups: “bonding” signifies homogeneous social relations, “bridging” denotes broader homogeneous social networks, and “linking” indicates ties with institutions or decision-makers. This network of relationships within society offers diverse social, economic, or physical benefits to individuals.
Participation and democracy. Søholt et al. [38] underscored participation and democracy as crucial mechanisms for enhancing knowledge, capacity, and confidence. Matthies et al. [78] posit participation as central to the normative aspects of social sustainability, while McIntye-Mills [79] stresses the significance of social services for sustaining social infrastructure. Thus, irrespective of societal identity, participation, and democracy play pivotal roles in understanding social needs and fostering equitable governance opportunities. Consequently, it is not surprising that numerous researchers from diverse countries [5,21,33,35,80] have extensively explored this topic.
Justice and social equity. This statement underscores the importance of society providing equal opportunities and access to sufficient resources for individual progress and advancement [9]. Sachs [4] stressed that such efforts should be grounded in the fundamental values of equality and democracy. Colantino [9] further observed that societies with high levels of equality tend to exhibit low delinquency rates, high civic participation, and robust economies. Moreover, justice and social equality encompass indicators such as equal opportunities, gender equality, and immigrant rights [23]. Additionally, justice and equality can be analyzed in two dimensions: environmental equality [21,80,81] and social equality [18,31,32].
Cohesion and integration. Social sustainability should encompass conflict reduction and the promotion of cohesion and stability [18]. Therefore, cohesion and integrity are crucial factors in social sustainability [25]. Cohesion denotes the harmony and integration in the attitudes and behaviors of individuals cohabitating [82], or participation in activities, solidarity, and tolerance within society [23]. Although the social cohesion dimension [83] is often used interchangeably with social capital, it diverges when beneficial networks in society transform into harmful activities such as gang-related actions [84,85]. Consequently, the relationship between the two lacks linearity, and cohesion should be assessed in conjunction with other dimensions.
Health. The health criterion [86], outlined within the Sustainable Development Strategy, serves as a mechanism for enhancing quality of life and promoting social sustainability [87]. Given the reduction in seasonal diseases due to pandemic-related measures [88], and the heightened concerns about the pandemic in the study area affecting public space densities, incorporating pandemic-related data into this study segment was deemed appropriate.
Perception of security. The security criterion [10,89], a cornerstone of social sustainability, also improves social development [90] and serves as a catalyst for various activities [91]. Dempsey et al. [83] explain this phenomenon as the assurance individuals seek in social networks during activity participation, similar to a need in Maslow’s hierarchy of needs, improving social cohesion. Particularly in the physical environments of developing countries, amidst challenges such as unemployment and homelessness, the perception of security holds significant importance for social sustainability [92]. Moreover, the perception of security is directly linked to the quality of public spaces [42,53,93,94].
Social infrastructure. Social infrastructure encompasses the provision of specific services to meet the social needs of individuals [25] and supports various forms of physical space [21]. Grum and Temeljotov [95] linked the concept of social infrastructure with social resources. While this concept has various definitions [96], its most general interpretation views it as an element that promotes social unity [26].

4.2. ANOVA for Identifying Regional Differences

To assess the influence of physical factors on social factors, parameters were categorized into two groups: social-related factors and environmental-related factors, based on expert opinion. This categorization was determined by considering whether the factor is associated with the environment or not.
Social-related factors, including belonging and identity, social capital, participation and democracy, justice and social equity, cohesion and integration, and health factors, comprise a set of abstract constructs influenced by, but not directly related to, the physical environment. ANOVA was initially employed to discern differences between areas concerning these factors (Table 5), followed by a post-hoc test to identify specific areas exhibiting variance (Table 6). The objective of these tests is to establish social disparities between areas, showcasing social diversity.
Belonging and Identity (B_ak). A one-way ANOVA test revealed a statistically significant difference in terms of belonging and identity across regions (F[4, 671] = 17.247, p = 0.000) within a confidence interval of 0.05, allowing for the statistical interpretation of responses provided by users. Due to unequal survey counts in work areas, the Games-Howell test was applied in the post-hoc test. The test identified a significant difference between Ziyapaşa-Çakmak and Atatürk-Çakmak in terms of mean values for belonging and identity (p = 0.000, 95% confidence interval).
Social Capital (So_ss). According to the results of the one-way ANOVA test, no significant difference was detected between the areas within the 0.05 confidence interval (F[4, 671] = 2.204, p = 0.067 > 0.05). For this reason, the post-hoc test, which helps compare the differences between groups, was not applied.
Participation and Democracy (P_kd). The one-way ANOVA test revealed a statistically significant difference in terms of participation and democracy at the 0.05 confidence interval (F[4, 671] = 6.586, p = 0.000). Due to the unequal number of surveys administered in the regions, the Games-Howell test was applied in the post-hoc test. The test revealed a significant difference between Ziyapaşa-Çakmak and Atatürk-Çakmak in the participation and democracy factors (p = 0.000, 95% confidence interval).
Justice and Social Equity (E_ase). The results of the ANOVA test indicate differences in terms of justice and social equality among the study areas (F[4, 671] = 11.352, p = 0.000). In the post-hoc comparison test conducted using the Games-Howell test, it was found that there was a significant difference between Ziyapaşa-Çakmak, Atatürk-Çakmak, and Çakmak-Inönü regarding the average values of the attractiveness of the physical environment (p = 0.000, 95% confidence interval).
Cohesion and Integration (I_ub). According to the results of the ANOVA test, there is a significant difference in terms of cohesion and integration among the study areas (F[4, 671] = 13.863, p = 0.000). Post-hoc test using the Games-Howell method revealed significant differences between Ziyapaşa-Cakmak, Atatürk-Çakmak, Ziyapaşa-İnönü, and Atatürk-İnönü (p < 0.05, 95% confidence interval).
Health (H_s). The one-way ANOVA test indicated a statistically significant difference in health parameters at a confidence interval of 0.05 (F[4, 671]= 7.445, p = 0.000). Given the unequal number of surveys administered in the study areas, the Games-Howell test was employed in the post-hoc test. Results from the test revealed a significant difference between Ziyapaşa-Çakmak and Atatürk-Çakmak concerning average health values (p = 0.000, 95% confidence interval).

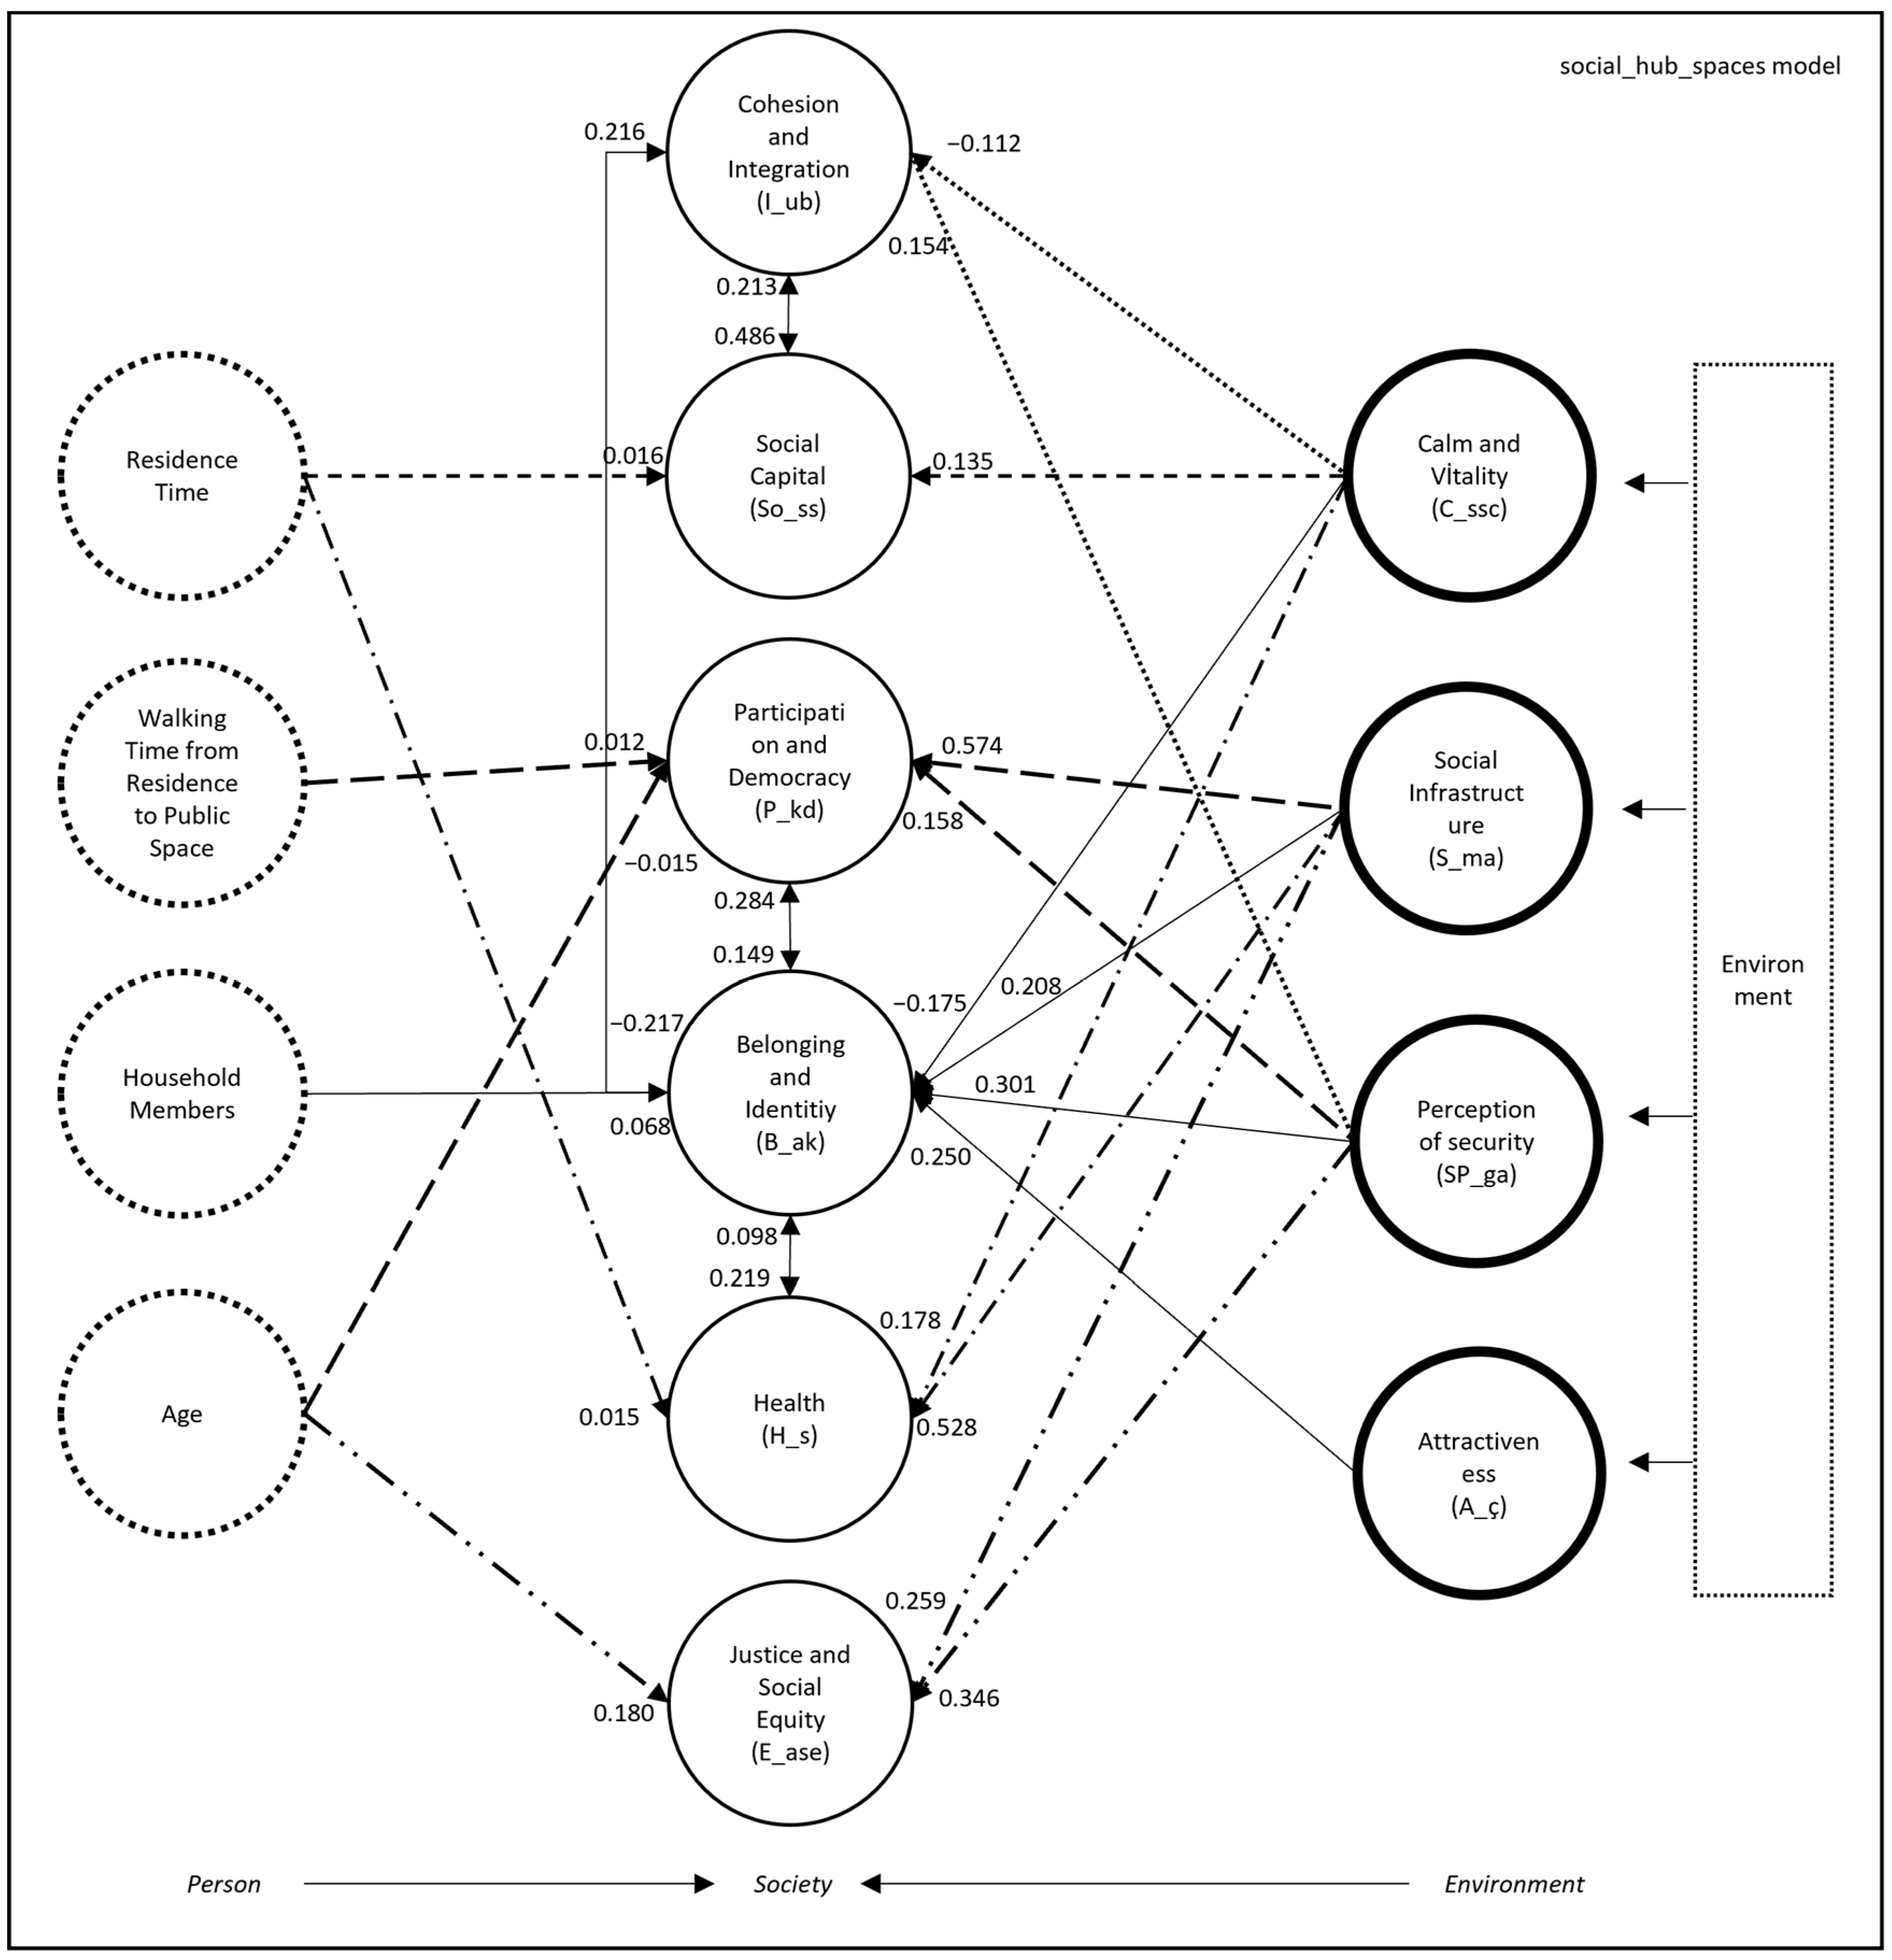
4.3. Correlation between Social and Physical Factors

Linear regression analysis was conducted for each factor to enlighten relationships with other factors, thereby clarifying the connections between the social and physical environments.
Environmental-related factors include factors through which the environmental effects of public spaces can be monitored and correlated. These factors comprise the attractiveness of the physical environment, calmness and vitality, security, and social infrastructure. At this stage, these factors are utilized to determine the impacts of the physical environment on social factors.
Belonging and Identity (B_ak). To elucidate the relationship between the factor of “belonging and identity” and other factors, and to measure the proportion of environmental factors within these relationships, a stepwise regression test was conducted. This method allows for the simultaneous analysis of numerous variables added to the model, the retention of significant variables in the model, and the sequential addition of factors that best explain the variable.
The factors included in the regression model consist of demographic factors involving ordinal variability, environmental-related factors, and social-related factors. The aim of testing all these factors is to obtain the most suitable model.
According to the regression results, the parameters that are effective in explaining belonging and identity at a significance level of 0.05 are security (Sp_ga), social infrastructure (S_mç), attractiveness (A_ç), cohesion and integration (I_ub), participation and democracy (P_kd), calm and vitality (C_ssc), household size (A5), and health (H_s). With these eight factors identified, 69.7% of the belonging and identity factors can be explained.
Examining the R2 change in the results, it is observed that the primary explanatory factor for belonging and identity is the security factor, accounting for 46.3% (0.463) of the factor. The second influential factor is social infrastructure, which contributes to 11% (0.11) of the variance. Another significant factor explaining this is the attractiveness of the physical environment (4.3%). Therefore, among the factors explaining belonging and identity, which account for 69.7%, environmental-related factors constitute 61%.
When examining the factors contributing to the formation of the belonging and identity factors in the 8th model, it is observed that the factor most positively influenced by each standard deviation in the model measurement is the security factor (β = 0.326, p = 0.00). Conversely, the calm factor and the number of people living in the household are inversely related to the model (β = −0.168, p = 0.001, and β = −0.113, p = 0.005, respectively). This indicates that a decrease in the average of the elements of belonging and identity occurs if the public space becomes quieter, calmer, away from traffic, or if the number of household members increases (Table 7).
Social Capital (So_ss). A stepwise regression test was conducted to determine the relationship between the social capital factor and other factors used in this study. Demographic and information questions, environmental-related factors, and social-related factors with ordinal variability were included in the regression test.
According to the regression results, the social capital factor comprises the factors of cohesion and integration (I_ub), duration of residence in the area (A15), calmness and vitality (C_ssc), examined at the 0.05 significance level. This model explains the factor at a level of 22.9%. The relatively low explanatory value suggests that there are additional factors contributing to the formation of the social capital factor that were not investigated within the scope of the study. These factors may include aspects such as culture, tradition, and economic conditions at both micro and macro levels. Upon closer examination of the regression test details, it is evident that cohesion and integration are the primary contributors to the social capital factor (R2 = 16.4). The duration of residence in the region accounts for an additional 4.1%, while parameters related to calmness and vitality also affect the model.
When examining the factors contributing to the formation of the social capital factor in the 3rd model, it is evident that the element with the highest β coefficient is cohesion and integration (I_ub) (p = 0.000). Other factors include the duration of residence in the region with a β ratio of 0.214 and calm and vitality with a β ratio of 0.153 (p = 0.001 and p = 0.015) (Table 8).
Participation and Democracy (P_kd). In the stepwise regression test, demographic and information questions, environmental, and social-related factors with ordinal variability were included. The factors comprising the participation and democracy factor are social infrastructure (S_mç), belonging and identity (B_ak), walking time between the house and the public area (A17), perception of security (SP_ga), and age (A3). These factors collectively explain 59.2% of the participation and democracy factor. Upon examining the regression details, it is evident that the social infrastructure primarily explains the participation and democracy factor, accounting for 50.8% (R2 = 0.508). Belonging and identity also contribute to explaining the participation and democracy factor at a rate of 5.3%. Other factors influencing the formation of this factor include walking distance from the house to the public area (1.2%), security (1%), and age (0.9%).
The most influential factor contributing to the formation of the participation and democracy factor has been determined to be the social infrastructure (β = 0.482, p = 0.000). The arrangement of surrounding buildings, the adequacy of parking areas, the presence of socializing spaces, and freedom of movement are among the determinants of this factor. Other factors include belonging and identity with a β coefficient of 0.252, walking time from home to public areas with β = 0.101, security with β = 0.151, and age factors with β = −0.097. While these factors exhibit a positive linear relationship with the participation and democracy factors, they demonstrate a negative linear relationship with age. In short, as the average age of users increases, participation decreases (Table 9).
Justice and Social Equity (E_ase). The regression test was conducted with demographic, environmental, and social-related factors containing ordinal variability. The factors constituting the justice and social equity factors include security (SP_ga), social infrastructure (S_mç), and age (A3) factors. These factors collectively explain 34.3% of the factors. Upon examining the regression analysis, it is observed that the most significant factor contributing to the explanation of the justice and social equity factors is security, accounting for 28.6% (R2 = 0.286). Another factor influencing this factor is the social infrastructure elements, explaining 3.9% (R2 = 0.039). Factors such as the layout of surrounding structures, the adequacy of open spaces and car parks, and special arrangements for various groups affect justice and social equality. Finally, the age factor affects this factor by 1.8% (R2 = 0.018). In this case, it can be predicted that only environmental conditions affect this factor by 32.5%.
The factor that plays the most significant role in its formation is the security factor, with a coefficient of β = 0.378 (p = 0.000). The standardized coefficients of the other two elements, the social infrastructure and age factors, are β = 0.248 (p = 0.000) and β = 0.135 (p = 0.020), respectively (Table 10).
Cohesion and Integration (I_ub). Demographic factors, environmental factors, and social-related factors with ordinal variability were included in the stepwise regression test.
According to the results of the regression test, the cohesion and integration factor is influenced by the factors of belonging and identity (B_ak), social capital (So_ss), security (SP_ga), and calm and vitality (C_ssc) within a 95% confidence interval. These factors collectively explain 38.4% of the variance. The remaining 61.6% of unexplained factors comprise elements that are not included in the scope of this study.
The regression results indicate that the primary explanatory factor for the cohesion and integration factor is the belonging and identity factor, accounting for 27.4% (R2 = 0.274). Another significant contributor to the factor is the social capital element, explaining 6.6%. Beneficial social relations in the region contribute to ensuring cohesion and integration. Additionally, factors such as security (R2 = 0.022, 2.2%) and calm and vitality (R2 = 0.022, 2.2%) are equally important in fostering harmony and integrity.
The most influential factor impacting the formation of the cohesion and integration factors is belonging and identity (β = 0.311). Social capital (β = 0.261), security (β = 0.239), and the calm and vitality factor (β = −0.156) also contribute to this factor. Notably, in this linear model, only calm and vitality show an inverse relationship with cohesion and integration. In summary, the presence of crowds, noise, and traffic in the environment positively influences the establishment of cohesion and integration (Table 11).
Health (H_s). In the stepwise regression test, demographic factors, environmental-related factors, and social-related factors with ordinal variability were included. At a 95% confidence interval, 39.2% of the health factor was explained by social infrastructure (S_mç), belonging and identity (B_ak), duration of residence in the area (A15), and calm and vitality (C_ssc). According to the regression results, the largest contribution to the health factor, at 31.5%, comes from the social infrastructure. The presence of social spaces, layouts, and aesthetic quality of public spaces have a direct impact on the health factor. Among other factors, it was found that belonging and identity contribute 2.8% (R2 = 0.028), duration of residence in the region 1.7% (R2 = 0.017), and calm and vitality 1.9% (R2 = 0.019) to the health factor.
Upon examining the beta (β) values, which represent the standardized coefficients of the factors contributing to the formation of the factor, it is found that the factors have the following values: social infrastructure: 0.419, belonging and identity: 0.184, residence time: 0.143, and calmness and vitality: 0.143 (Table 12).

5. Discussion

Social sustainability is increasingly recognized as an important area of study. While theoretical research has laid the foundation, empirical studies have begun to support and enrich our understanding of social sustainability. However, there remains a gap in the theoretical literature regarding the interconnectedness of social sustainability with other dimensions, such as those proposed in the three-pillar models of sustainability. Additionally, practical research in this area is limited. This article seeks to address this gap by providing evidence of the relationship between social sustainability and the physical environment through field research.
The study involved the creation of a parameter pool sourced from literature, which was then refined into a theoretical parameter set with expert input. To validate this set, a survey was administered to 676 respondents using a 5-point Likert scale and analyzed using statistical tests in SPSS. The resultant parameter set was categorized into two groups based on their level of association with the environment: social-related factors and environmental-related factors.
Social-related factors encompass parameters indirectly tied to the individual’s place of residence, stemming from their direct social interactions. Through the study, it was found that factors such as belonging and identity [5], social capital [2], participation and democracy [3], justice and social equity [23,25], cohesion and integration [1], and health [80] within this group are interrelated at varying degrees. This theoretical assertion was corroborated by the tests conducted. These test results generally align with the criteria identified by Chiu [18].
Environmental life factors consist of elements that act as bridges between social life and the environment for social sustainability. This group of factors includes the attractiveness of the physical environment, calm and vitality, security perception, and social infrastructure factors.
Environmental life factors gain significance in ensuring social sustainability when evaluated alongside social life factors. Belonging and identity, among the social life factors, were found to be related to security [34], social infrastructure [25], attractiveness of the physical environment [97], and calm-vitality [36]. Social capital was directly related only to calmness and vitality. Participation-democracy and justice-social equity factors are directly linked to social infrastructure and security, while cohesion and integration factors are affected by security and calm-vitality factors. Finally, the health factor was found to be related to social infrastructure and the calm-vitality factors of the physical environment.
The correlation between data from social-related factors and environmental-related factors validates the main hypothesis of this study, asserting that “there is a significant relationship between physical environmental parameters and social sustainability in public space”. This finding aligns with the research conducted by Karuppannan and Sivam [34] at the neighborhood scale, addressing issues such as participation, belonging, security, and social infrastructure, as well as with the work of Ali et al. [14], which establishes a link between the city and social sustainability at the urban scale. However, it is essential to acknowledge the relatively low explanatory power of some factors, and one must not overlook the influence of local characteristics and economic factors beyond the scope of this study on social sustainability.
The study revealed correlations between demographic characteristics and social-related factors, indicating links between age, duration of residence, walking distance to public areas, household size, and social-related factors. Specifically, belonging and identity were associated with household size, while social capital was linked to duration of residence and calmness and vitality. Participation-democracy correlated with walking distance to public spaces and age, while justice-social equity showed a connection with age. Health was related to the duration of residence. However, cohesion and integration were not found to be associated with demographic characteristics, contrasting with the findings of Duhaime et al. [98], who assessed user structure in measuring social cohesion and integration. However, the measured social-related factors do not correspond with Chan et al.’s [35] study as they are not associated with marital status. Additionally, the independence of the same factors from educational status contradicts the findings of Wan [37] and Ahman’s [19] study.
Hence, it is evident that individual, social, and physical environmental factors collectively contribute to fostering social sustainability in public spaces. Consequently, a comprehensive evaluation of social data, inclusive of diverse components in an expanded context, is essential. Social data ought not to be viewed in isolation from spatial inputs; rather, these two dimensions should complement each other to enhance the overall sustainability of public spaces.
The developed model not only validates the correlation between the built environment and social sustainability but also delineates the contributing factors to this association. Therefore, this model also delineates the extent of the relationship between the physical environment of public spaces and the parameters of social sustainability. Termed as “social_hub_spaces”, this comprehensive model involves the complicated network of relationships within the public space, reflecting its aggregative function in social dynamics and sustainability analysis (Figure 6).
While the relationship between the social environment and the physical environment has been acknowledged in theory, this study presents, for the first time, a comprehensive understanding of this relationship in practice. By delineating the quality and extent of this connection, it transforms it into actionable design data. Consequently, in a world where resources are limited, this paves the way for creating higher-quality living spaces with fewer resources. Ultimately, this study facilitates the integration of specific physical interventions in the preliminary design phase, thus establishing fundamental principles for ensuring social sustainability.

6. Conclusions

Social sustainability has recently emerged as a significant concept. Despite extensive research efforts, there are aspects yet to be elucidated. One such aspect is the relationship between social sustainability and the physical environment, which forms the foundation of the social environment. This study delineates this relationship, establishing that a substantial portion of social sustainability parameters are influenced to varying degrees by the physical environment.
This critical finding emphasizes the importance of the built or physical environment in achieving social sustainability, both theoretically and practically. The study clarifies and expands the considerations necessary for shaping the physical environment for stakeholders in decision-making positions, particularly designers and local governments, who aim to support future social production in public spaces established with specific criteria globally. Furthermore, it provides a method for the implementation of participatory design principles. The developed scale enables the measurement of social sustainability parameters within a specific area.
Additionally, this study offers researchers a new dataset created with a holistic approach to social sustainability. The identification and interrelation of individual, societal, and physical factors believed to influence social sustainability have established a significant methodological and conceptual foundation for future research.
Indeed, by incorporating more comprehensive economic indicators, which are only briefly addressed in this study, a more holistic approach encompassing all three pillars of social sustainability will emerge. Moreover, the methodology, initially constrained to public spaces in this study, can be transformed into a framework applicable to different urban areas, thereby providing a foundation for various studies and enabling broader application on larger scales.

Author Contributions

Conceptualization, B.A.E. and M.E.E.D.; Methodology, B.A.E.; Software, B.A.E.; Validation, B.A.E. and M.E.E.D.; Formal analysis, B.A.E. and M.E.E.D.; Investigation, B.A.E. and M.E.E.D.; Resources, B.A.E. and M.E.E.D.; Data curation, B.A.E. and M.E.E.D.; Writing—original draft, B.A.E.; Writing—review & editing, B.A.E. and M.E.E.D.; Visualization, B.A.E.; Supervision, M.E.E.D. All authors have read and agreed to the published version of the manuscript.

Funding

This research received no external funding.

Institutional Review Board Statement

Ethical review and approval were waived for this study due to it was derived from an approved doctoral dissertation. Additionally, institutional access was challenging due to the pandemic.

Informed Consent Statement

Informed consent was obtained from all subjects involved in the study.

Data Availability Statement

Data are contained within the article.

Conflicts of Interest

The authors declare no conflict of interest.

References

  1. Bramley, G.; Power, S. Urban form and social sustainability: The role of density and housing type. Environ. Plan. B Plan. Des. 2009, 36, 30–48. [Google Scholar] [CrossRef]
  2. Rashidfarokhi, A.; Yrjänä, L.; Wallenius, M.; Toivonen, S.; Ekroos, A.; Viitanen, K. Social sustainability tool for assessing land use planning processes. Eur. Plan. Stud. 2018, 26, 1269–1296. [Google Scholar] [CrossRef]
  3. McKenzie, S. Social sustainability: Towards some definitions. In Working Paper Series, No: 27; Hawke Research Institute: Magill, Australia, 2004. [Google Scholar]
  4. Sachs, I. Social sustainability and whole development. In Sustainability and the Social Sciences; Becker, E., Jahn, T., Eds.; Zed Books and UNESCO: New York, NY, USA, 1999; pp. 25–36. [Google Scholar]
  5. Shirazi, M.R.; Keivani, R. The triad of social sustainability: Defining and measuring social sustainability of urban neighbourhoods. Urban Res. Pract. 2019, 12, 448–471. [Google Scholar] [CrossRef]
  6. Lotfata, A.; Ataöv, A. Urban streets and urban social sustainability: A case study on Bagdat street in Kadikoy, Istanbul. Eur. Plan. Stud. 2019, 28, 1735–1755. [Google Scholar] [CrossRef]
  7. Ročak, M.; Hospers, G.J.; Reverda, N. Searching for Social Sustainability: The Case of the Shrinking City of Heerlen, the Netherlands. Sustainability 2016, 8, 382. [Google Scholar] [CrossRef]
  8. Glasson, J.; Wood, G. Urban regeneration and impact assessment for social sustainability. Impact Assess. Proj. Apprais. 2009, 27, 283–290. [Google Scholar] [CrossRef]
  9. Colantino, A. Social sustainability: A review and critique of traditional versus emerging themes and assessment methods. In Proceedings of the Second International Conference on Whole Life Urban Sustainability and Its Assessment, Loughborough, UK, 22–24 April 2009; Malcolm, H., Price, A., Bebbington, J., Rohinton, E., Eds.; Loubhborough University: Loughborough, UK, 2009; pp. 865–885. [Google Scholar]
  10. Eizenberg, E.; Jabareen, Y. Social sustainability: A new conceptual framework. Sustainability 2017, 9, 68. [Google Scholar] [CrossRef]
  11. Davidson, M. Social sustainability: A potential for politics? Local Environ. 2009, 14, 607–619. [Google Scholar] [CrossRef]
  12. Weingaertner, C.; Moberg, A. Exploring Social Sustainability: Learning from Perspectives on Urban Development and Companies and Products. Sustain. Dev. 2014, 22, 122–133. [Google Scholar] [CrossRef]
  13. Vallance, S.; Perkins, H.C.; Dixon, J.E. What is social sustainability? A clarification of concepts. Geoforum 2011, 42, 342–348. [Google Scholar] [CrossRef]
  14. Ali, H.H.; Betawi, Y.N.; Qudah, H.S. Effects of urban form on social sustainability—A case study of Irbid. Jordan. Int. J. Urban Sustain. Dev. 2019, 11, 203–222. [Google Scholar] [CrossRef]
  15. Lefebvre, H. The Production of Space; Blackwell: Oxford, UK, 1992. [Google Scholar]
  16. Shirazi, M.R.; Keivani, R. Critical Reflections on the Theory and Practice of Social Sustainability in the Built Environment–A Meta-Analysis. Local Environ. 2017, 22, 1526–1545. [Google Scholar] [CrossRef]
  17. Goffman, E. Relations in Public: Microstudies of the Public Order; Basic Books: New York, NY, USA, 1971. [Google Scholar]
  18. Chiu, R.L.H. Socio-cultural sustainability of housing: A conceptual exploration. Hous. Theory Soc. 2004, 21, 65–76. [Google Scholar] [CrossRef]
  19. Ahman, H. Social sustainability—Society at the intersection of development and maintenance. Local Environ. 2013, 18, 1153–1166. [Google Scholar] [CrossRef]
  20. Stren, R.; Polese, M. Understanding the new sociocultural dynamics of cities: Comparative urban policy in a global context. In The Social Sustainability of Cities; Polese, M., Stren, R., Eds.; University of Toronto Press: Toronto, ON, Canada, 2000. [Google Scholar]
  21. Manzi, T.; Lucas, K.; Lloyd-Jones, T.; Allen, J. Understanding Social Sustainability: Key Concepts and Developments in Theory and Practice. In Social Sustainability in Urban Areas: Communities, Connectivity and the Urban Fabric; Manzi, T., Lucas, K., Lloyd-Jones, T., Allen, J., Eds.; Earthscan Publishing: London, UK, 2010. [Google Scholar]
  22. UK Presidency. The Bristol Accord: Conclusions of Ministerial Informal on Sustainable Communities in Europe; The Office of the Deputy Prime Minister: Ottawa, ON, Canada, 2005. [Google Scholar]
  23. Littig, B.; Grießler, E. Social Sustainability. A Catchword between Political Pragmatism and Social Theory. Int. J. Sustain. Dev. 2005, 8, 65–79. [Google Scholar] [CrossRef]
  24. Farhadikhah, H.; Ziari, K. Social sustainability between old and new neighborhoods, case study: Tehran neighborhoods. Environ. Dev. Sustain. 2020, 23, 2596–2613. [Google Scholar] [CrossRef]
  25. Cuthill, M. Strengthening the ‘social’ in sustainable development: Developing a conceptual framework for social sustainability in a rapid urban growth region in Australia. Sustain. Dev. 2010, 18, 362–373. [Google Scholar] [CrossRef]
  26. Grum, B.; Grum, D.K. Concepts of social sustainability based on social infrastructure and quality of life. Facilities 2020, 38, 783–800. [Google Scholar] [CrossRef]
  27. Goosen, Z.; Cilliers, E.J. Enhancing social sustainability through the planning of third places: A theory based framework. Soc. Indic. Res. 2020, 150, 835–866. [Google Scholar] [CrossRef]
  28. Chen, J.; Pellegrini, P.; Xu, Y.; Ma, G.; Wang, H.; An, Y.; Shi, Y.; Feng, X. Evaluating residents’ satisfaction before and after re-generation. The case of a high-density resettlement neighbourhood in Suzhou, China. Cogent Soc. Sci. 2022, 8, 2144137. [Google Scholar] [CrossRef]
  29. Chen, J.; Pellegrini, P.; Wang, H. Comparative Residents’ Satisfaction Evaluation for Socially Sustainable Regeneration—The Case of Two High-Density Communities in Suzhou. Land 2022, 11, 1483. [Google Scholar] [CrossRef]
  30. Izadi, A.; Mohammadi, M.; Nasekhian, S.; Memar, S. Structural Functionalism, Social Sustainability and the Historic Environment: A Role for Theory in Urban Regeneration. Hist. Environ. Policy Pract. 2020, 11, 158–180. [Google Scholar] [CrossRef]
  31. Landorf, C. Evaluating social sustainability in historic urban environments. Int. J. Herit. Stud. 2011, 17, 463–477. [Google Scholar] [CrossRef]
  32. Dempsey, N.; Brown, C.; Bramley, G. The key to sustainable urban development in UK cities? The influence of density on social sustainability. Prog. Plan. 2012, 77, 89–141. [Google Scholar] [CrossRef]
  33. Stender, M.; Walter, A. The role of social sustainability in building assessment. Build. Res. Inf. 2019, 47, 598–610. [Google Scholar] [CrossRef]
  34. Karuppannan, S.; Sivam, A. Social sustainability and neighbourhood design: An investigation of residents’ satisfaction in Delhi. Local Environ. 2011, 16, 849–870. [Google Scholar] [CrossRef]
  35. Chan, H.H.; Hu, T.; Fan, P. Social sustainability of urban regeneration led by industrial land redevelopment in Taiwan. Eur. Plan. Stud. 2019, 27, 1245–1269. [Google Scholar] [CrossRef]
  36. Ahmed, K.G. Urban social sustainability: A study of the Emirati local communities in Al Ain. Journal of Urbanism. Int. Res. Placemaking Urban Sustain. 2012, 5, 41–66. [Google Scholar] [CrossRef]
  37. Wan, L.; Ng, E. Evaluation of the social dimension of sustainability in the built environment in poor rural areas of China. Archit. Sci. Rev. 2018, 61, 319–326. [Google Scholar] [CrossRef]
  38. Søholt, S.; Ruud, M.E.; Braathen, E. A question of social sustainability: Urban interventions in critical neighbourhoods in Portugal and Norway. Urban Res. Pract. 2012, 5, 256–272. [Google Scholar] [CrossRef]
  39. Montgomery, J. Making a City: Urbanity, Vitality and Urban Design. J. Urban Des. 1998, 3, 93–116. [Google Scholar] [CrossRef]
  40. Marinkovic, A.; Vasilevska, L.; Miric, A.; Peric, D. Functional and design potential of city squares related to social sustainability. Tech. Technol. Educ. Manag. 2012, 7, 1446–1461. [Google Scholar]
  41. Carmona, M. The Place-shaping Continuum: A Theory of Urban Design Process. J. Urban Des. 2014, 19, 2–36. [Google Scholar] [CrossRef]
  42. Jacobs, J. The Death and Life of Great American Cities; Vintage Books: New York, NY, USA, 1961. [Google Scholar]
  43. Miao, P. Introduction. In Public Places in Asia Pacific Cities: Current Issues and Strategies; Springer: Berlin/Heidelberg, Germany, 2001; pp. 1–45. [Google Scholar]
  44. Iveson, K. Putting the public back into public space. Urban Policy Res. 1998, 16, 21–33. [Google Scholar] [CrossRef]
  45. Ozbek, M. Kamusal alanın sınırları. In Kamusal Alan; Özbek, M., Ed.; Hil Yayın: Istanbul, Turkey, 2004; pp. 19–90. [Google Scholar]
  46. Ruppert, E.S. Rights to public space: Regulatory reconfigurations of liberty. Urban Geogr. 2006, 27, 271–292. [Google Scholar] [CrossRef]
  47. Habermas, J. Strukturwandel der Öffentlichkeit; Hermann Luchterhand Verlag: Neuwied, Germany, 1962. [Google Scholar]
  48. Lee AY, L. Online news media in the Web 2.0 era: From boundary dissolution to journalistic transformation. Chin. J. Commun. 2012, 5, 210–226. [Google Scholar] [CrossRef]
  49. Arendt, H. The Human Condition; The University of Chicago Press: Chicago, IL, USA, 1998. [Google Scholar]
  50. Sennett, R. The Fall of Public Man; Alfred A. Knopf: New York, NY, USA, 1977. [Google Scholar]
  51. Schmidt, S.; Nemeth, J. Space, Place and the City: Emerging Research on Public Space Design and Planning. J. Urban Des. 2010, 15, 453–457. [Google Scholar] [CrossRef]
  52. Madanipour, A. Design of Urban Space: An Inquiry into a Socio-Spatial Process; John Wiley & Sons: Hoboken, NJ, USA, 1996. [Google Scholar]
  53. Mehta, V. Evaluating Public Space. J. Urban Des. 2014, 19, 53–88. [Google Scholar] [CrossRef]
  54. Carr, S.; Francis, M.; Rivlin, L.G.; Stone, A.M. Public Space; Cambridge University Press: Cambridge, UK, 1992. [Google Scholar]
  55. Smith, N.; Low, S. Introduction: The imperative of public space. In The Politics of Public Space; Low, S., Smith, N., Eds.; Taylor and Francis Group: Abingdon, UK, 2006; pp. 1–16. [Google Scholar]
  56. Carmona, M.; Magalhaes, C.; Hammond, L. Public Space: The Management Dimension; Routledge: London, UK, 2008. [Google Scholar]
  57. Turkish Statistical Institute-TUIK. 2021. Available online: https://www.tuik.gov.tr/ (accessed on 10 December 2021).
  58. Bodur Ün, M.; Paydak, A. Küreselleşen Dünyada Düzensiz Göç ve Türkiye: Adana İli Yabancılar Misafirhanesi Çalışması. Anadolu Üniversitesi Sos. Bilim. Derg. 2017, 17, 187–204. [Google Scholar] [CrossRef]
  59. Tülücü, T.A. The City of Adana’s Historical Industry Buildings Structural Analysis and a Study on Conservation Method (Publication No. 212652). Doctoral Dissertation, Gazi University, Ankara, Türkiye, 2007. [Google Scholar]
  60. Yılmaz, N. Konut Tasarım Sürecinde Kullanıcı Katılımı: Adana Kenti Bağlamında Bir Okuma (1960–1980). Master’s Thesis, Cukurova University, Institute of Natural and Applied Sciences, Adana, Türkiye, 2016. [Google Scholar]
  61. Reel, N.B. Analyse of the Evolution of Adana Tepebağ Tumulus and Its Environment in Historical Continum and Bringing This Region to Nowadays (Publication No. 182709). Master’s Thesis, Yildiz Technical University, İstanbul, Türkiye, 2006. [Google Scholar]
  62. Moghaddam, A. An Analysis on the Urban Tissue and Historic Buildings of Yarıyakup Urban Conservation Area in the City of Adana (Publication No. 307693). Master’s Thesis, Cukurova University, Adana, Türkiye, 2013. [Google Scholar]
  63. Erman, O.; Baş Yanarateş, D. Adana’da tarihi doku ve kentsel kimlik ilişkisi. In Adana Kentsel Kültür Envanteri; Durukan, İ., Karaman, F., Saban, D., Erman, O., Baş Yanarateş, D., Rmazanoğlu, G., Eds.; Adana Urban Culture Inventory; Ulusoy Ofset: Adana, Türkiye, 2012; pp. 37–38. [Google Scholar]
  64. Kim, H.Y. Statistical notes for clinical researchers: Assessing normal distribution (2) using skewness and kurtosis. Restor. Dent. Endod. 2013, 38, 52–54. [Google Scholar] [CrossRef]
  65. Hemani, S.; Das, A.K.; Chowdhury, A. Influence of urban forms on social sustainability: A case of Guwahati, Assam. Urban Des. Int. 2017, 22, 168–194. [Google Scholar] [CrossRef]
  66. Slavich, G.M.; Roos, L.G.; Zaki, J. Social belonging, compassion, and kindness: Key ingredients for fostering resilience, recovery, and growth from the COVID-19 pandemic. Anxiety Stress Coping 2021, 35, 1–8. [Google Scholar] [CrossRef] [PubMed]
  67. Lynch, K. The Image of the City; MIT Press: Cambridge, MA, USA, 1960. [Google Scholar]
  68. Tajfel, H.; Turner, J.C. An integrative theory of intergroup conflict. In The Social Psychology of Intergroup Relations; Austin, W.G., Worchel, S., Eds.; Brooks/Cole: Pacific Grove, CA, USA, 1979; pp. 33–37. [Google Scholar]
  69. Wagoner, J.A.; Belavadi, S.; Jung, J. Social identity uncertainty: Conceptualization, measurement, and construct validity. Self Identity 2017, 16, 505–530. [Google Scholar] [CrossRef]
  70. Kronenberg, J.; Haase, A.; Łaszkiewicz, E.; Antal, A.; Baravikova, A.; Biernacka, M.; Dushkova, D.; Filčak, R.; Haase, D.; Ignatieva, M.; et al. Environmental justice in the context of urban green space availability, accessibility, and attractiveness in postsocialist cities. Cities 2020, 106, 102862. [Google Scholar] [CrossRef]
  71. Larimian, T.; Freeman, C.; Palaiologou, F.; Sadeghi, N. Urban social sustainability at the neighbourhood scale: Measurement and the impact of physical and personal factors. Local Environ. 2020, 25, 747–764. [Google Scholar] [CrossRef]
  72. Collin, F. Social Reality; Routledge: London, UK, 2002. [Google Scholar]
  73. Khalili, A.; Fallah, S.N. Role of social indicators on vitality parameter to enhance the quality of women’s communal life within an urban public space (case: Isfahan’s traditional bazaar, Iran). Front. Archit. Res. 2018, 7, 440–454. [Google Scholar] [CrossRef]
  74. Low, S.; Altman, I. Place attachment: A conceptual inquiry. In Human Behavior and Environments: Advances in Theory and Research; Altman, I., ve Low, S., Eds.; Plenum Press: New York, NY, USA, 1992; Volume 12, pp. 1–12. [Google Scholar]
  75. Lopes, M.N.; Camanho, A.S. Public green space use and consequences on urban vitality: An assessment of European cities. Soc. Indic. Res. 2013, 113, 751–767. [Google Scholar] [CrossRef]
  76. World Bank. The Initiative on Defining, Monitoring and Measuring Social Capital (Working Paper 1); Social Capital Initiative; World Bank: Washington, DC, USA, 1998. [Google Scholar]
  77. Holman, N.; Rydin, Y. What can social capital tell us about planning under localism? Local Gov. Stud. 2013, 39, 71–88. [Google Scholar] [CrossRef]
  78. Matthies, A.L.; Kattilakoski, M.; Rantamäki, N. Citizens’ participation and community orientation—Indicators of social sustainability of rural welfare services. Nord. Soc. Work. Res. 2011, 1, 125–139. [Google Scholar] [CrossRef]
  79. McIntyre-Mills, J. Participatory Design for Democracy and Wellbeing: Narrowing the Gap Between Service Outcomes and Perceived Needs. Syst. Pract. Action Res. 2010, 23, 21–45. [Google Scholar] [CrossRef]
  80. Almahmoud, E.; Doloi, H.K. Identifying the key factors in construction projects that affect neighbourhood social sustainability. Facilities 2020, 38, 765–782. [Google Scholar] [CrossRef]
  81. Opp, S.M. The forgotten pillar: A definition for the measurement of social sustainability in American cities. Local Environ. 2017, 22, 286–305. [Google Scholar] [CrossRef]
  82. Friedkin, N.E. Social cohesion. Annu. Rev. Sociol. 2004, 30, 409–425. [Google Scholar] [CrossRef]
  83. Dempsey, N.; Bramley, G.; Power, S.; Brown, C. The social dimension of sustainable development: Defining urban social sustainability. Sustain. Dev. 2011, 19, 289–300. [Google Scholar] [CrossRef]
  84. Ballet, J.; Bazin, D.; Mahieu, F.R. A policy framework for social sustainability: Social cohesion, equity and safety. Sustain. Dev. 2020, 28, 1388–1394. [Google Scholar] [CrossRef]
  85. Portes, A.; Landolt, P. The Downside of Social Capital. Am. Prospect. 1996, 26, 18–21. [Google Scholar] [CrossRef] [PubMed]
  86. European Commission. Accompanying Document to the Progress Report on the European Union Sustainable Development Strategy 2007 (SEC 2007 1416). Commission Staff Working Document. 2007. Available online: https://eur-lex.europa.eu/legal-content/EN/ALL/?uri=CELEX%3A52007SC1416 (accessed on 10 December 2022).
  87. Hussain, M.; Ajmal, M.M.; Gunasekaran, A.; Khan, M. Exploration of social sustainability in healthcare supply chain. J. Clean. Prod. 2018, 203, 977–989. [Google Scholar] [CrossRef]
  88. Olsen, S.J.; Azziz-Baumgartner, E.; Budd, A.P.; Brammer, L.; Sullivan, S.; Pineda, R.F.; Cohen, C.; Fry, A.M. Decreased Influenza Activity During the COVID-19 Pandemic—United States, Australia, Chile, and South Africa. MMWR Morb. Mortal. Wkly. Rep. 2020, 69, 1305–1309. [Google Scholar] [CrossRef]
  89. Barton, H. Conflicting perceptions of neighbourhood. In Sustainable Communities: The Potential for Eco–Neighbourhoods; Barton, H., Ed.; Earthscan: London, UK, 2000; pp. 3–18. [Google Scholar]
  90. Crabtree, A.; Gasper, D. Conclusion: The sustainable development goals and capability and human security analysis. In Sustainability, Capabilities and Human Security; Crabtree, A., Ed.; Palgrave Macmillan: London, UK, 2020; pp. 169–182. [Google Scholar] [CrossRef]
  91. Shaftoe, H. Community safety and actual neighbourhoods. In Sustainable Communities: The Potential for Eco–Neighbourhoods; Barton, H., Ed.; Earthscan: London, UK, 2000; pp. 230–243. [Google Scholar]
  92. Dave, S. Neighbourhood density and social sustainability in cities of developing countries. Sustain. Dev. 2011, 19, 189–205. [Google Scholar] [CrossRef]
  93. Charkhchian, M.; Daneshpour, S.A. Introduction to multiple dimensions of responsive public space: A case study in Iran. Prostor 2010, 18, 218–227. [Google Scholar]
  94. Low, S.; Taplin, D.; Scheld, S. Rethinking Urban Parks: Public Space and Cultural Diversity; The University of Texas Press: Austin, TA, USA, 2005. [Google Scholar]
  95. Grum, B.; Temeljotov Salaj, A. The comparison of expressed satisfaction and expectations of potential real estate buyers in Slovenia and Japan. Facilities 2013, 31, 6–23. [Google Scholar] [CrossRef]
  96. Wai SHYusof AHai, T.; Ismail, S. A conceptual review of social infrastructure projects. Commun. IBIMA 2012, 2012, 222039. [Google Scholar] [CrossRef]
  97. Praliya, S.; Garg, P. Public space quality evaluation: Prerequisite for public space management. J. Public Space 2019, 4, 93–126. [Google Scholar] [CrossRef]
  98. Duheime, G.; Searles, E.; Usher, P.J.; Myers, H.; Frechette, P. Social cohesion and living conditions in the Canadian Arctic: From theory to measurement. Soc. Indic. Res. 2002, 66, 295–317. [Google Scholar] [CrossRef]
Figure 1. Study area in Adana, Turkey.
Sustainability 16 04947 g001
Figure 2. Graphical summary of the study design.
Sustainability 16 04947 g002
Figure 3. Summary of data collection formats in the questionnaire.
Sustainability 16 04947 g003
Figure 4. Demographic description of the sample.
Sustainability 16 04947 g004
Figure 5. Eigenvalue showing the level of explanation of the factors.
Sustainability 16 04947 g005
Figure 6. Visual description of the social_hub_spaces model.
Sustainability 16 04947 g006
Table 1. Dimensions and variables of the questionnaire from the literature review and their definitions.
DimensionVariablesDefinition
B. Justice and Social Equity1. Equal benefit from public services
2. Equal benefit in activities
3. Gender equality
4. Financial necessity
Equal access to all resources without any criteria.
C. Cohesion and Integration1. Responsibility towards people and the environment
2. Helping those in need
3. Tolerance
4. Empathy
5. A sense of solidarity
6. Conditions for the formation of unity and solidarity
Existence of common consciousness, responsibility, trust, and integrity in society.
D. Social Network and Social Capital1. Encounters with acquaintances
2. Familiarity
3. Recognition in the environment
4. Enjoying spending time
5. The effect of familiarity on daily life
Individuals creating networks that increase happiness and quality of life in society.
E. Security1. Sense of security during the daytime
2. Sense of security at night
3. Adequacy of security measures
4. Feeling free
The adequacy of the elements that ensure society’s security and the sum of the consequent feelings it creates in individuals.
F. Social Infrastructure and Activities1. Activities benefited
2. Type of transportation
3. Adequacy of public transport
4. Adequacy of activity
5. Adequacy of parking space
6. Vehicle traffic
7. Adequacy of open space
The physical spaces and activities required for the formation of social connections and capital.
G. Participation and Democracy1. Being able to express ideas without hesitation
2. Cooperation with local government
3. Feeling valued in decision-making processes
Participatory approach to management processes and activity arrangements.
H. Governance and Property Acquisition1. Regulation adequacy
2. Adequacy in acquiring knowledge
3. Stability in management
4. Adequacy of financial power to acquire property
Existence of transparency, institutional stability, and flexibility in local governments
I. Inclusion and Diversity1. Freedom of movement for the elderly and disabled
2. Discrimination
3. Human diversity
Everyone benefiting from spatial and social activities, and human diversity is ensured in a heterogeneous society.
J. Social Stability and Cohesion1. Enjoying spending time
2. The desire to live in the environment for a long time
3. Commitment
4. Sense of belonging
Desire to live in the region for a long time and a sense of commitment and belonging to that region
K. Identity and Cultural Heritage1. Identity of the environment
2. Being unique
3. Perception of the environment
3(1). Perception of attractiveness
3(2). Perception of easy accessibility
3(3). Perception of being well connected
3(4). Perception of being in the center
3(5). Perception of holism
3(6). Perception of accessibility
3(7). Perception of familiarity
3(8). Perception of foliage
3(9). Perception of sound
3(10). Perception of calmness
3(11). Perception of permanence
3(12). Perception of cleanliness
3(13). Perception of traffic
3(14). Perception of beauty
3(15). Perception of smell
The region having its own and unique identity.
L. Legibility1. Easy navigation
2. Getting lost
Ease of mental processing in an urban space
M. Imageability1. Meeting points
2. Points of attraction
The quality of visualization and image construction in an urban space.
N. Quality of Environmental Structures1. Perception of orderly structure
2. Facade
The quality of the physical environment lived in
O. Health1. Social use of streets during the pandemic
2. Concern about street use during the pandemic
3. The effect of the pandemic on the way of life
4. Interacting with people during the pandemic
5. Desire to be in open spaces
6. Garbage collection
7. Cleaning satisfaction
The effect of various diseases, cleaning orders, and elements that affect the environment, such as garbage, on the individual.
Table 2. KMO and Bartlett’s test of sphericity results.
Kaiser-Meyer-Olkin Measure of Sampling Adequacy.0.926
Bartlett’s Test of SphericityApprox. Chi-Square21,552.922
df1225
Sig.0.000
Table 3. Factor loadings of each variance.
12345678910
Belonging and Identity
(B_ak)
J4. I feel like I belong to the square/street in this neighborhood.0.750
K2. The unique stance of the square/street in this neighborhood makes this place attractive to me.0.728
J1. I enjoy spending a long time in this neighborhood.0.705
J3. I feel connected to the square/street in this neighborhood.0.686
K1. I think that the square/street in this neighborhood has its own identity.0.661
J2. I would like to live in this neighborhood for a long time.0.622
D4. I enjoy spending time with my acquaintances in this neighborhood.0.548
F4. I find activities sufficient to spend time with my acquaintances in this neighborhood.0.449
I3. I am happy with the diversity and heterogeneity of the people in this neighborhood.0.417
Attractiveness
(A_c)
K3. [Easily accessible] 0.957
K3. [Close by] 0.920
K3. [Memorable] 0.910
K3. [Attractive] 0.822
K3. [Nice looking] 0.758
K3. [Clean] 0.701
K3. [Green] 0.684
K3. [Fragrant] 0.627
Calm and Vitality
(C_ssc)
K3. [Silent] 0.904
K3. [Calm] 0.865
K3. [Low traffic] 0.833
Social Capital
(So_ss)
D2. People in this neighborhood know each other. 0.828
D3. People in this street recognize me. 0.815
D1. I come across familiar people all the time in this neighborhood. 0.707
D5. The people I know in this neighborhood make my daily life easier. 0.530
Participation and Democracy
(P_kd)
G2. I can cooperate and share ideas with local governments about this square/street. 0.877
G3. In this neighborhood, I feel that my opinion is valued in decision-making processes. 0.850
G1. In this neighborhood, I freely express my ideas in the processes of renewal, change, and transformation. 0.739
H3. I think that stability has been achieved in the management of this neighborhood. 0.555
H2. I can get adequate information about the square/street from the local administration covering this neighborhood. 0.551
Justice and Social Equity
(E_ase)
B1. In this neighborhood, I can benefit from public institutions and organizations on an equal basis with everyone. 0.876
B2. I can benefit from the activities in this neighborhood equally with everyone. 0.851
B3. There is gender equality in this neighborhood. 0.645
B4. I do not need money to spend time in this neighborhood. 0.467
Cohesion and Integration
(I_ub)
C3. I am tolerant of people in this neighborhood. 0.852
C2. I help the elderly and disabled in this neighborhood. 0.844
C4. I see understanding from people in this neighborhood. 0.437
C5. There is a sense of solidarity among people in this neighborhood. 0.416
Health
(H_s)
O3. The pandemic has not changed the way I use this square/street. 0.842
O2. I used this square/street without hesitation during the pandemic. 0.749
O1. I used this square/street as a social place during the pandemic. 0.730
Security Perception
(SP_ga)
E2. I feel safe on this street at night. −0.776
E3. The security measures in this neighborhood are sufficient. −0.657
E4. I feel free in this square/street. −0.650
E1. I feel safe on this street during daylight hours. −0.601
Social infrastructure
(S_mc)
N1. I find the structures around this square/street orderly. −0.700
N2. I like the facades of the buildings around this square/street. −0.638
F5. I find the car parking areas sufficient in this neighborhood. −0.592
I1. The elderly and the disabled (mentally or physically) can move freely in this neighborhood. −0.436
F7. I find the open spaces for socializing sufficient in this neighborhood. −0.375
F6. Vehicle traffic in this neighborhood bothers me. 0.316
Table 4. Cronbach’s Alpha coefficients of the factors.
NoNumber of ItemsCronbach’s Alpha Coefficient
190.903
280.943
330.892
440.778
550.771
640.715
740.687
830.773
940.832
1060.864
Coefficient calculated for all questions: 0.943
Table 5. ANOVA test results.
Between GroupsSum of SquaresdfMean SquareFSig.
Belonging and identity (B_ak)55.645413.91117.2470.000 *
Social capital (So_ss)7.937 4 1.984 2.204 0.067
Participation and democracy (P_kd)29.05047.2636.5860.000 *
Justice and Social Equity (E_ase)39.47149.86811.3520.000 *
Cohesion and Integration (I_ub)21.43645.35913.8630.000 *
Health (H_s)40.195410.0497.4450.000 *
* The mean difference is significant at the 0.05 > p level.
Table 6. Post-hoc (Games Howell) test results.
Mean Difference (I–J)Std. ErrorSig.
ZiyapaşaCakmak0.68386 *0.084020.000
Belonging and identity (B_ak)AtaturkCakmak0.51945 * 0.08945 0.000
CakmakZiyapasa
Ataturk
−0.68386 * 0.08402 0.000
−0.51945 * 0.08945 0.000
Social capital (So_ss)-----
Participation and democracy (P_kd)ZiyapaşaCakmak0.44964 * 0.10241 0.000
AtaturkCakmak0.43806 * 0.10086 0.000
CakmakZiyapasa
Ataturk
−0.44964 *0.102410.000
−0.43806 *0.100860.000
Justice and Social Equity (E_ase)ZiyapaşaCakmak0.52511 * 0.09008 0.000
AtaturkCakmak0.49007 * 0.09202 0.000
CakmakZiyapasa
Ataturk
Inonu
−0.52511 * 0.09008 0.000
−0.49007 * 0.092020.000
−0.41225 *0.146750.050
InonuCakmak0.41225 *0.146750.050
Cohesion and Integration (I_ub)ZiyapasaCakmak
Inonu
0.37162 *0.060870.000
0.32803 *0.112050.038
AtaturkCakmak
Inonu
0.36166 *0.061450.000
0.31806 *0.112370.049
CakmakZiyapasa
Ataturk
−0.37162 * 0.06087 0.000
−0.36166 * 0.061450.000
InonuZıyapasa
Ataturk
−0.32803 *0.112050.038
−0.31806 *0.112370.049
Health (H_s)ZiyapasaCakmak0.56320 * 0.11346 0.000
AtaturkCakmak0.47291 * 0.11159 0.000
CakmakZiyapasa
Ataturk
−0.56320 * 0.11346 0.000
−0.47291 * 0.111590.000
* The mean difference is significant at the 0.05 > p level.
Table 7. Belonging and identity regression analysis—Coefficients for Model 8.
Model 8
R: 0.835; R2: 0.697; Adj. R2: 0.610; Std. Err.: 0.57087; R2 Change: 0.009;
ANOVA: F: 56.243; p (sig.): 0.000
ModelBStd. ErrorßSig.
(Constant)0.3350.295 0.258
SP_ga0.3010.0500.3260.000
A_ç0.2500.0420.2880.000
I_ub0.2170.0670.1510.001
C_ssc−0.1750.052−0.1680.001
S_mç0.2080.0650.1970.002
P_kd0.1490.0530.1680.005
A5−0.0680.024−0.1130.005
H_s0.0980.0420.1160.020
Table 8. Social capital regression analysis—Coefficients for Model 3.
Model 3
R: 0.478; R2: 0.229; Adj. R2: 0.217; Std. Err.: 0.76398; R2 Change: 0.023;
ANOVA: F: 19.876; p (sig.): 0.000
ModelBStd. ErrorßSig.
(Constant)1,3610.358 0.000
I_ub0.4860.0760.3970.000
A150.0160.0050.2140.001
C_ssc0.1350.0550.1530.015
Table 9. Participation and democracy regression analysis—Coefficients for Model 5.
Model 5
R: 0.769; R2: 0.592; Adj. R2: 0.582; Std. Err.: 0.74156; R2 Change: 0.009;
ANOVA: F: 57.720; p (sig.): 0.000
ModelBStd. ErrorßSig.
(Constant)0.0610.302 0.839
S_mç0.5740.0740.4820.000
B_ak0.2840.0790.2520.000
SP_ga0.1580.0660.1510.018
A170.0120.0060.1010.031
A3−0.0150.007−0.0970.036
Table 10. Social equity regression analysis—Coefficients for Model 3.
Model 3
R: 0.586; R2: 0.343; Adj. R2: 0.333; Std. Err.: 0.82190; R2 Change: 0.018;
ANOVA: F: 34.996; p (sig.): 0.000
ModelBStd. ErrorßSig.
(Constant)0.8030.296 0.007
SP_ga0.3460.0640.3780.000
S_mç0.2590.0730.2480.000
A30.0180.0080.1350.020
Table 11. Cohesion and integration regression analysis—Coefficients for Model 4.
Model 4
R: 0.620; R2: 0.384; Adj. R2: 0.372; Std. Err.: 0.55869; R2 Change: 0.022;
ANOVA: F: 31.216; p (sig.): 0.000
ModelBStd. ErrorßSig.
(Constant)2.3140.214 0.000
B_ak0.2160.0530.3110.000
So_ss0.2130.0480.2610.000
SP_ga0.1540.0500.2390.002
C_ssc−0.1120.042−0.1560.008
Table 12. Health regression analysis—Coefficients for Model 5.
Model 5
R: 0.626; R2: 0.392; Adj. R2: 0.377; Std. Err.: 0.095699; R2 Change: 0.012;
ANOVA: F: 25.643; p (sig.): 0.000
ModelBStd. ErrorßSig.
(Constant)0.0340.304 0.912
S_mç0.4980.0950.3960.000
C_ssc0.2730.0850.2200.002
B_ak0.2840.0940.2380.003
A150.0160.0060.1460.010
A_c−0.1500.074−0.1450.045
Disclaimer/Publisher’s Note: The statements, opinions and data contained in all publications are solely those of the individual author(s) and contributor(s) and not of MDPI and/or the editor(s). MDPI and/or the editor(s) disclaim responsibility for any injury to people or property resulting from any ideas, methods, instructions or products referred to in the content.

