Article

Research on the Effects of Different Environmental Regulation Tools on China’s Industrial Water Green Use Efficiency—Comparison between the Yellow River Basin and the Yangtze River Economic Belt

1
College of Economics, Northwest Normal University, Lanzhou 730070, China
2
Management Studies Department, Bahria Business School, Bahria University Islamabad, Islamabad 44000, Pakistan
*
Author to whom correspondence should be addressed.
Sustainability 2024, 16(12), 4984; https://doi.org/10.3390/su16124984
Submission received: 24 April 2024 / Revised: 26 May 2024 / Accepted: 7 June 2024 / Published: 11 June 2024

Abstract

:
Improving industrial water green use efficiency (IWGUE) is a primary means to ensure the production, living, and ecological use of water quantity and quality, while effective environmental regulation tools are important to promote efficiency. This paper calculates the industrial water green use efficiency in China’s 30 provinces from 2010 to 2022 by the SE-SBM model and divides environmental regulatory tools into command-based, market-oriented, and voluntary types. The panel Tobit model is constructed to test the impact and differences in the effects of three environmental regulations on regional industrial water green use efficiency. The results show the following: (1) Under the constraint of undesired output, IWGUE fluctuates upward slowly in China, and the potential for improving the efficiency value is enormous, with significant regional and basin-level differences. (2) At the national level, the impact of command-based and market-oriented environmental regulations on IWGUE shows a U-shaped trend, while the positive promoting effect of voluntary environmental regulations on efficiency is not significant. (3) In the Yellow River Basin, the impact of three types of environmental regulations on IWGUE shows a U-shaped pattern. Command-based and voluntary environmental regulations have crossed the inflection point and have a significant promoting effect on efficiency, while market-oriented environmental regulations have not yet crossed the inflection point. (4) In the Yangtze River Economic Belt, the impact of command-based and market-oriented environmental regulations on IWGUE shows a U-shaped pattern, while voluntary environmental regulations have a significant promoting effect on efficiency. This study may provide a reference for tailored policy design to improve industrial water efficiency in China from the perspective of environmental regulations.

1. Introduction

As natural resources, water resources are the source of life, the necessity of production, and the foundation of the ecosystem. They are not only a vital strategic economic resource for a nation but also critical to the construction of ecological civilization and sustainable and high-quality economic development [1]. In the world, China is the sixth largest country in terms of water resources; however, because of its large population, per capita water resources amount to only a quarter of the world average level. Ranked 119th in the world, China is one of the countries with scarce water resources. Additionally, its water consumption per CNY 10,000 of GDP is several times higher than the world’s advanced level [2], and thus, China faces huge pressures and challenges in water resource security. In 2022, among the 1890 national groundwater environmental quality assessment points monitored nationwide, Class V water quality points accounted for 22.4%, with the main exceeding indicators being iron, sulfate, and chloride [3]. Industrial pollution emissions have led to severe water resource shortages in many regions, making the supply–demand contradiction of China’s water resources more prominent. The report of the 20th National Congress of the Communist Party of China highlighted the concept that “lucid waters and lush mountains are invaluable assets” in 2022, aiming to strengthen water resource protection and utilization and promote low-carbon development [4]. Improving industrial water use efficiency and reducing the unit output of industrial water consumption and industrial wastewater discharge are the keys to solving the contradiction between development and resource protection. The public goods characteristics of water resources make it difficult to eradicate industrial pollution through the role of traditional market competition [5,6]. Therefore, the Chinese government usually formulates environmental regulatory policies to solve ecological and environmental issues, such as the “Water Pollution Prevention and Control Action Plan” (2015), the “National Water Conservation Action Plan” (2019), and the “Industrial Water Efficiency Improvement Action Plan” (2022), and to compensate for market failures. The policies inevitably have an impact on the efficiency of water resource utilization. How do environmental regulatory policy tools affect the efficiency of industrial water green utilization? Can we improve industrial water green use efficiency? Answering these questions has great practical meaning for accelerating industrial green transformation, achieving efficient and sustainable utilization of water resources, and building a beautiful China.
Water resource utilization efficiency measures the ability of humans to allocate water resources and the effectiveness of economic activities in production activities [7]. Industrial water use efficiency (IWUE) is a key component of the research on water resource utilization efficiency. The measurement of IWUE includes the single-factor productivity method, which takes the amount of industrial water use as input and the industrial added value as output, that is, the industrial added value of water in CNY ten thousand is the efficiency value [8], and the total-factor productivity method, which incorporates labor, capital and water resource into the production function and calculates the ratio of the target water input to the actual industrial water input in the industrial sector while keeping all other input factors unchanged. The latter method for measuring efficiency is more practically meaningful, and this paper chooses the total-factor productivity method. IWUE considering industrial wastewater is defined as industrial water green use efficiency (IWGUE). The academic research on IWUE has concentrated on the calculation of values, regional differences, and influencing factors. Among them, the research methods often include the SFA method [9,10] and the DEA method [11,12,13,14]. Xu et al. [12] measured the IWUE of various provinces in China based on a four-stage DEA method under conditions with and without environmental constraints. They found that efficiency decreased significantly considering pollutant emissions, and the eastern coastal regions have the highest utilization efficiency values among all provinces. Liu et al. [13] used an improved SBM-DEA model with industrial wastewater. Their results indicated that the IWUE in water absolute scarcity areas is higher than in vulnerability areas, and the efficiency in the water-stressed and scarce region is higher than in the water-abundant region. Lv et al. [14] incorporated industrial water consumption and water pollution discharge into their analysis framework, using the Super-SBM model to calculate IWGUE in five prefecture-level cities in the Poyang Lake region. They found that the efficiency value in Jingdezhen is the lowest and then analyzed the impact of the industrialization level, technology expenditures, industrial wastewater treatment capacity, and industrial water intensity on efficiency. Zheng et al. [10] applied the SFA model to calculate the total-factor water use efficiency of 30 provinces in China and found that import and export trade, urbanization, and industrial structure have significant positive effects on efficiency, while the level of economic development has an inhibitory effect. With the continuous deepening of research, the realization path and influencing factors of IWGUE have attracted researchers’ attention [15,16,17,18]. For instance, Shi et al. [15] examined the impact of new urbanization on the industrial water use efficiency in China. They found that new urbanization has a positive promoting effect on IWUE in both local and neighboring provinces based on spatial spillover effects, and when new urbanization exceeds the threshold value, the promotion effect is significant. Jin et al. [16] analyzed the spatial difference in the impact of driving factors such as technological innovation, environmental regulation, and the combined effect of the two factors, as well as industrial water resources and resident education levels, on the IWGUE in Chinese three major regions. Ding et al. [17] showed that the population urbanization level, advanced industrial structure, urban primacy, and foreign investment have a significant impact on the IWUE in the Yangtze River Economic Belt.
Environmental regulations are an important tool for environmental governance and have played a significant role in improving quality and efficiency to a large extent [19,20,21]. With increasing attention paid to the growth of the green economy, research on the relationship between environmental regulation and water resource efficiency is also increasing. For example, Zhang et al. [22] empirically showed that environmental regulation has a significant positive effect on green water efficiency in both eastern and western China, but the impact is insignificant in the central areas, owing to regional differences. The results of Wang et al. [23] study indicated that environmental regulation restrained an improvement in water resource efficiency. Wang et al. [24] used the Super-DEA model to measure water resource utilization efficiency and found that the empirical relationship between environmental regulation and water resource utilization efficiency shows a “U” shape. From a spatial perspective, Zhang et al. [25] found that local environmental regulation has a promoting effect on improving urban water use efficiency in neighboring areas. The regulatory effects of environmental regulation have been widely discussed in the existing literature, yet the existing literature primarily focuses on the impact of environmental regulations on the efficiency of overall water resource utilization, and there is relatively little research on the impact of environmental regulation on industrial water use efficiency. Moreover, there are significant differences in the mechanisms and effectiveness of various environmental regulatory policy tools [26], and there is currently no research exploring the impact of different types of environmental regulations on IWGUE. Furthermore, there are distinct differences in the natural environment, economic development level, and environmental supervision between the Yellow River Basin and the Yangtze River Economic Belt in China. Therefore, it is necessary to study the impact of different types of environmental regulations on IWGUE in different river basins. The results will help formulate targeted environmental regulation policies and provide an important basis for China’s industrial green transformation and water resource utilization protection.
As mentioned above, this paper attempts to expand on the previous research from the following aspects. First, this paper takes regional industries as the research object, uses the SE-SBM model that includes unexpected outputs to calculate IWGUE in each province, and analyzes its spatiotemporal variation characteristics. Second, this paper divides environmental regulations into the following three types: mandatory, market-oriented, and voluntary types. At the national level, the panel Tobit model is constructed and empirical research is conducted on the impact and differences in the effects of the three types of environmental regulations on IWGUE. Third, at the basin level, the impact mechanism of different types of environmental regulations on IWGUE in different basins is studied in order to provide references for selecting environmental regulatory policies that are suitable for industrial water conservation and intensive use.

2. Materials and Methods
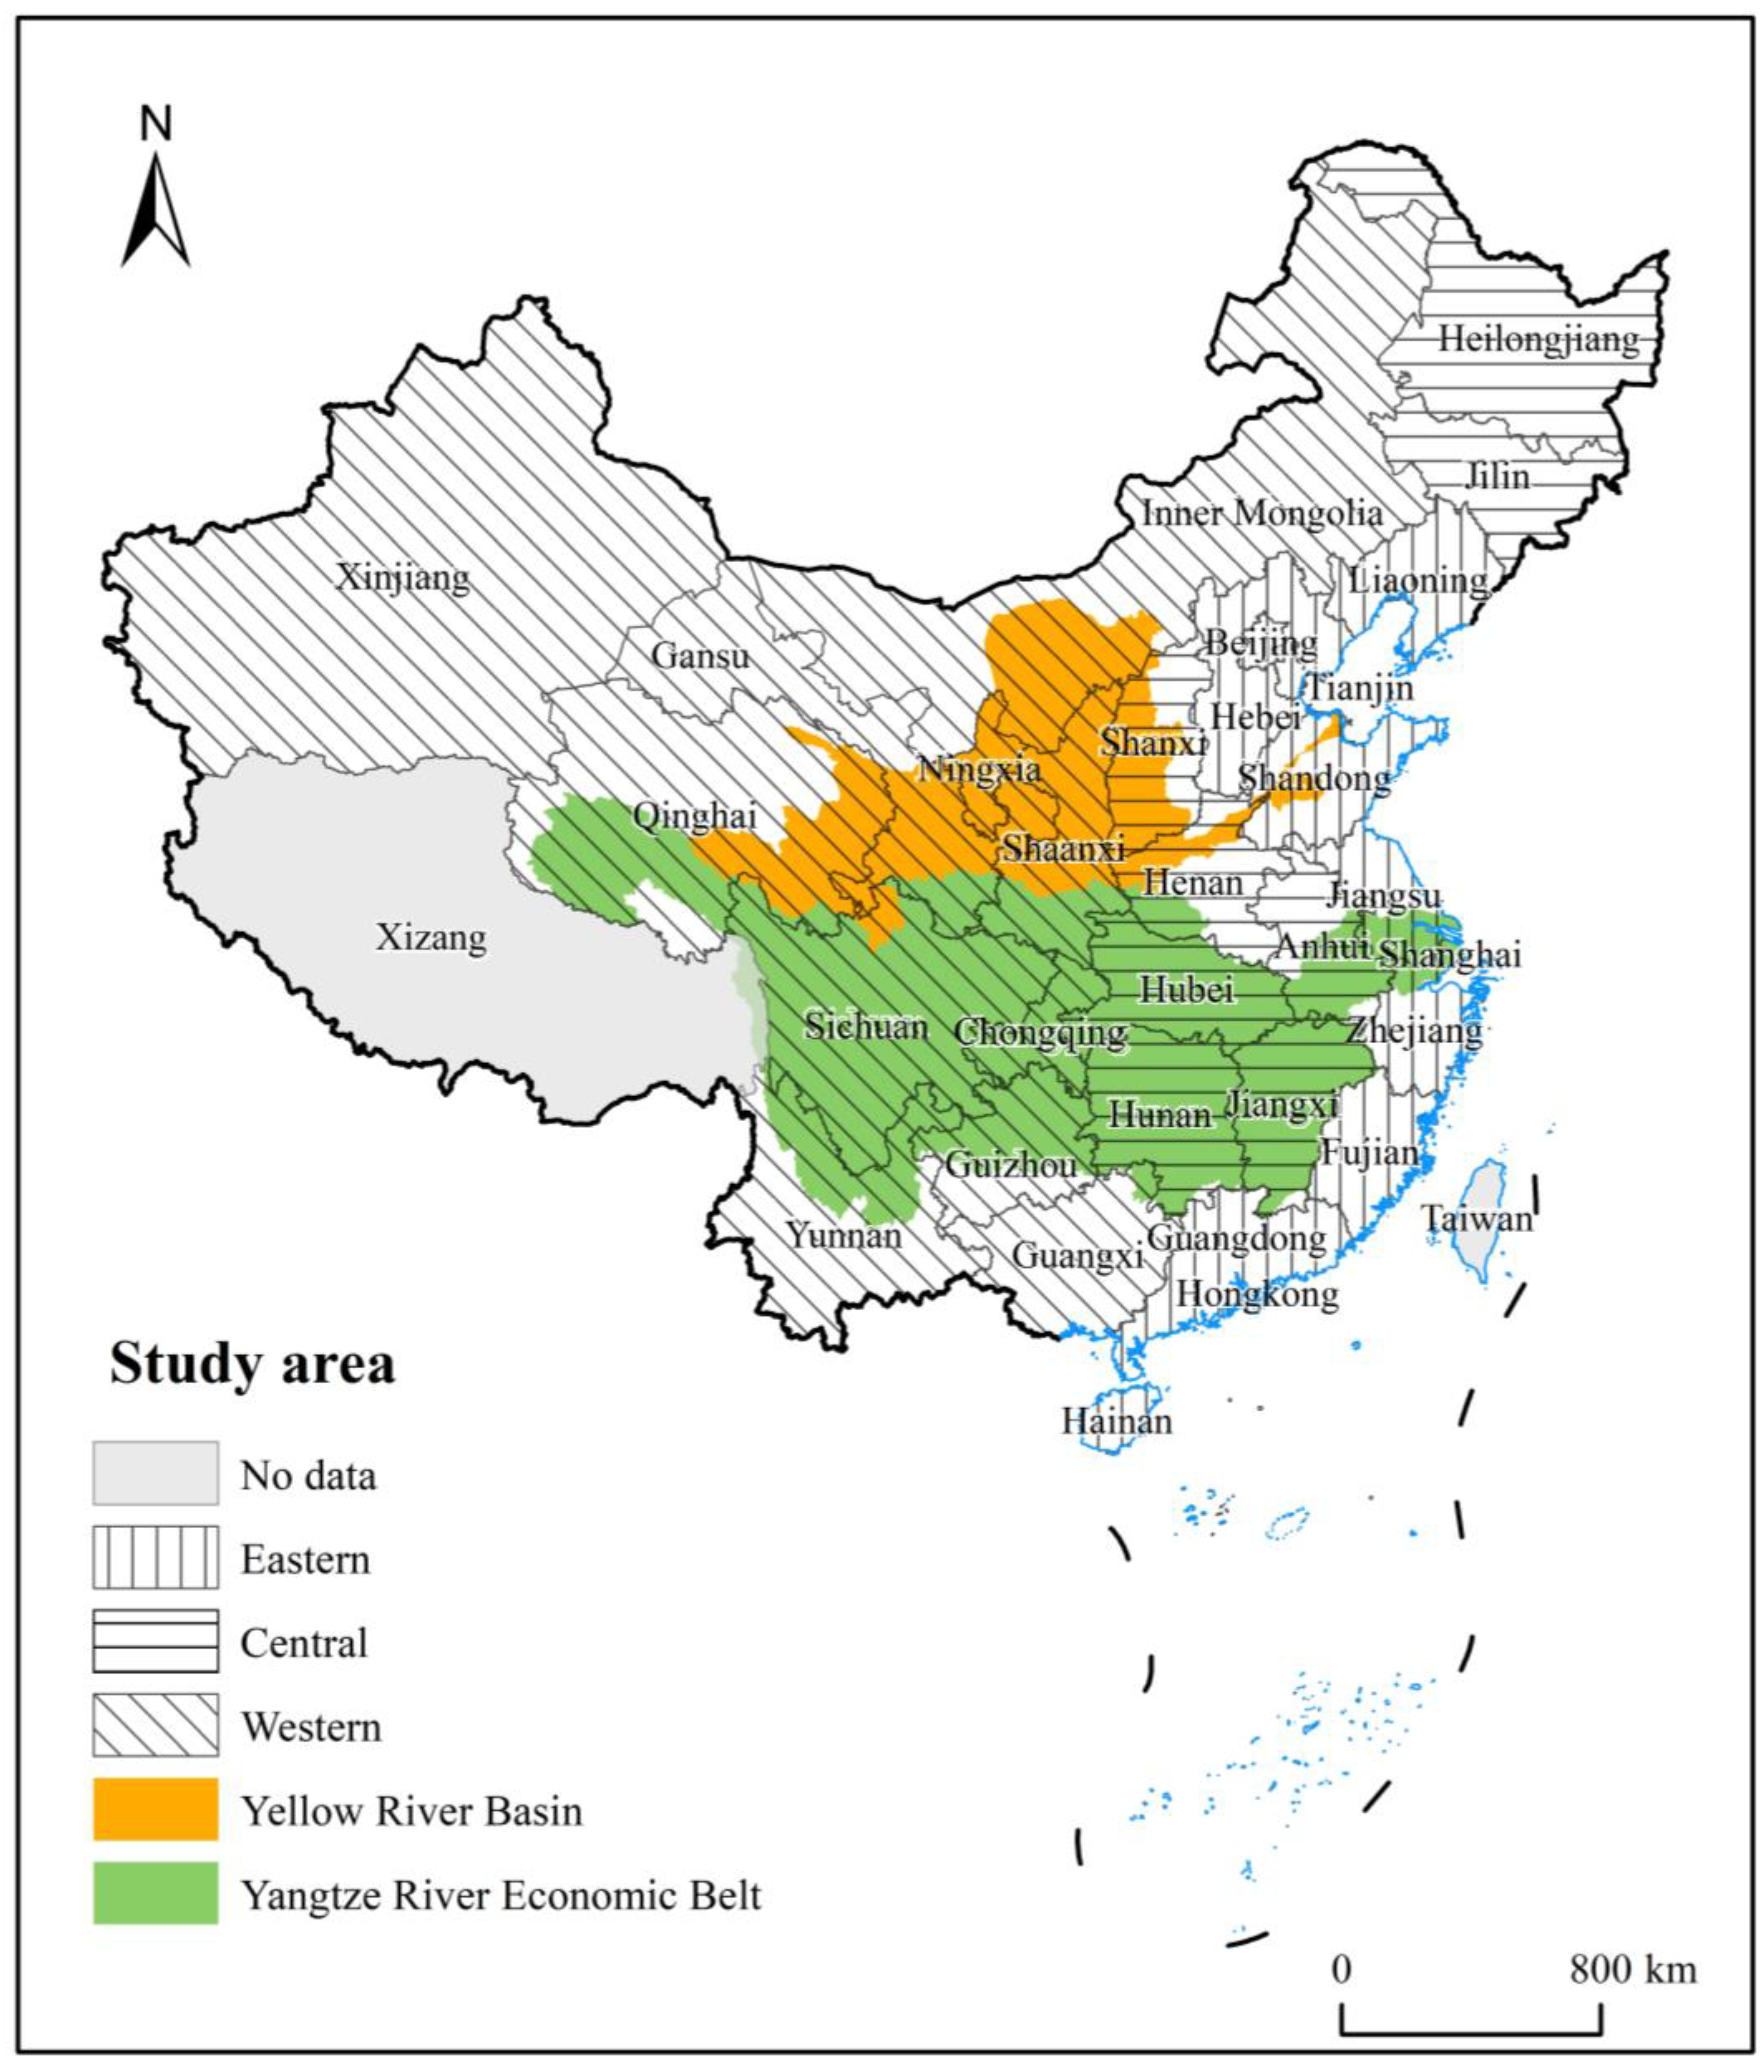
2.1. Study Area

The study area included 30 provinces in China (Hong Kong, Macao, Taiwan, and Xizang were excluded because of data unavailability). In accordance with the China Statistic Yearbook [27], the 30 provinces were divided into three regions as follows: eastern, central, and western. The Yellow River Basin spans the eastern, central, and western regions of China, located in the core area of China’s ecological barrier pattern. Traditionally, the relevant area of the Yellow River flowing through provinces and regions is referred to as the Yellow River Basin, which includes the following 8 provinces: Shaanxi, Qinghai, Gansu, Ningxia, Inner Mongolia, Shanxi, Henan, and Shandong. The Yangtze River Economic Belt is a globally influential inland economic belt that covers 11 provinces and cities, including Shanghai, Jiangsu, Zhejiang, Chongqing, Sichuan, Yunnan, Guizhou, Anhui, Jiangxi, Hubei, and Hunan, with an area of approximately 2.0523 million km2, accounting for 21.4% of the total national area. Figure 1 shows the study area.

2.2. Assessing IWGUE with the SE-SBM Model

The DEA method is a non-parametric statistical method for assessing the relative efficiency of homogenous decision-making units with multiple input factors and multiple output factors [28]. The method does not require weighting or dimensionless treatment of input–output indicators when calculating efficiency, and it does not consider conditions such as cost and profit. It has the advantage of more objective calculation results and has been widely used in different industries and departments. Using the CCR model, Tone proposed a Slack-Based Measurement method (SBM) based on excess input and insufficient output [29]. This method overcomes the radial and orientational limitations of traditional distance function models, such as BBC and CCR, and can address slack problems in efficiency evaluation, providing stronger efficiency discrimination. Enabling effective decision-making units to further compare, rank, and incorporate the model with undesired output, Tone proposed the Super SBM (SE-Super) model, which can consider the overall input factors, good outputs, and bad outputs [30]. This article uses the SE-SBM model to measure IWGUE in 30 provinces of China, assuming there are n decision-making units, using m production input factors, and obtaining s desirable output variables and t undesirable outputs. The linear programming expression is as follows:
m i n θ = 1 + 1 m i = 1 m S i / x i k 1 1 S + t ( r = 1 S S r g + / y r k g + p = 1 t S p b / y r k b )
s . t .   j = 1 , j k n x i j λ j s i x i k           i = 1 , 2 , , m j = 1 , j k n y r j λ j + s i g + y r k g           γ = 1 , 2 , , s j = 1 , j k   n   y p j b λ j s p b y r k b         p = 1 , 2 , , t j = 1 , j k n λ j = 1           j = 1 , 2 , , n j k     s i ,     s r ,     s p 0 ,       λ > 0        
where θ is the industrial water green use efficiency value and x i k , y r k g , and y r k b stand for the input factor vector, the desirable output vector, and the non-desired output vector, respectively. ∑λj = 1 and ∑λj ≠ 1 represent constant and variable returns to scale, respectively, and s i , s r , a n d   s p represent the slack amount for the input and two types of output factors, which are referred to as input redundancy and insufficient desirable output.

2.3. The Tobit Model

Because the value range of IWGUE measured by SE-SBM model is greater than 1 and is a limited dependent variable, which is a restricted dependent variable, using ordinary OLS will result in biased or inconsistent parameter estimates. This paper uses the Tobit regression model, which is used to address regression problem with restricted or truncated dependent variables. The Tobit model’s formula is as follows:
Y i t = Y i t * = β 0 + t = 1 n β t x i t + μ i t ,     Y i t * > 0   0 , Y i t * 0
where Y i t is the efficiency value of industrial water utilization, x i t is the vector of environmental regulation tools, β stand for the estimated coefficient vector, and μ i t ~N (0, σ 2 ). The model adds the square term of environmental regulation to investigate whether the nonlinear impact of environmental regulation policies on IWGUE exists. The Tobit model is set up in this paper as follows:
I G W U i t = β 0 + β 1 e r i t + β 2 e r i t 2 + α x i t
where i stands for the province, t stands for the year, and e r i t specifically refers to the intensity of command-based, market-oriented, and voluntary environmental regulation types and public participation-based environmental regulation. β1 and β2 represent the coefficients of the primary and secondary terms for different types of environmental regulations. x i t represents a series of control variables, and α denotes the vector of coefficients.

2.4. Input–Output Indicators for IWGUE and Data Sources

IWGUE not only evaluates industrial water consumption in production processes from the perspective of traditional water resource efficiency, but it also introduces water environmental pollution factors, combining economic and ecological dimensions to calculate relative efficiency. It aims to achieve sustained growth in industrial output while minimizing industrial water use and wastewater discharge.
This paper constructed an index evaluation system of IWGUE. The indicators used to estimate the efficiency of 30 provinces in China included labor, capital, and water resources. For labor input, we selected the annual average of the total number of employees in industrial enterprises above a designated size. For water resources input, we used the total amount of industrial water used. For capital input, we chose the annual average net value of fixed assets of industrial enterprises and calculated the capital stock [31]. The desired outputs measured the economic benefits. We used the industrial added value in each province, converted to constant prices in 2010. We selected the total amount of COD, nitrogen, and ammonia emissions in industrial wastewater as the unexpected output. All the data in this paper were collected from the China Statistical Yearbook [27], China’s Industrial Statistical Yearbook [32], and China’s Environmental Statistical Yearbook [33]. Table 1 shows the details of the input–output indicators.

2.5. Variable Selection for the Tobit Model

2.5.1. Explanatory Variable

Environmental regulation is an essential tool to address negative environmental externalities and carry out water environmental governance for the government [34]. Based on the degree of enforcement of regulations, the OECD classifies environmental governance policy tools into three types as follows: command and control tools, economic means, and persuasive approaches. At present, China’s industrial environmental protection sector implements an environmental policy that combines administrative and market regulation with appropriate public participation. Based on the current situation of multiple policy tools participating in environmental protection, environmental regulations cannot be simply summarized as one or a certain type of indicator. Drawing on the studies of Ren et al. and Ma et al. [35,36], this article also categorizes environmental regulation into three types as follows. The intensity of environmental regulation in various types is calculated by the entropy method [37].
(1)
Command-based environmental regulation (CER): Command-based environmental regulation includes laws and regulations, which are formulated and enforced by the government to improve environmental quality, including the environmental technologies that economic entities must adopt and the environmental standards they must comply with. The main indicators used to represent command-based regulation are the number of environmental administrative penalty cases, the number of regulations issued by various regions, and inspections and supervision frequency by environmental protection agencies, which reflect the government’s willingness. Drawing on the method of Li et al. [38], we selected the ratio of “three simultaneities” environmental investment to industrial added value in each province’s construction projects, the number of administrative penalty cases accepted, and the number of completed investments in industrial pollution control to measure CER.
(2)
Market-oriented environmental regulation (MER): MER aims to use market mechanisms, according to the “polluter pays” theory, to internalize the external costs of enterprises and incentivize them to reduce pollution emissions autonomously. By employing market-oriented instruments such as pollutant discharge taxes and subsidies for pollution control, MER encourages economic entities to choose their level of pollution control under the government’s overall control, providing motivation for enterprises to adopt pollution control technologies that are cost-effective and yield good results. Drawing on the method of Peng et al. [39], this paper selected the proportion of total pollution discharge fees collected in each province to industrial added value, as well as resource tax and vehicle and vessel tax, to reflect the level of market-oriented environmental regulation.
(3)
Voluntary environmental regulation (VER): VER is the willing participation of non-governmental organizations and individuals in resource and environmental protection actions. The main tools include ecological product certification, environmental labeling, environmental auditing, etc., mainly using indicators such as the number of actual staff in the environmental protection system and the number of concluded cases in the environmental protection system’s petition and visit. With the improvement in public education and income levels, the enhancement in environmental awareness, and the pursuit of a better life, individual residents have begun to spontaneously pay attention to and participate in solving environmental problems. Referring to the study of Wang et al. [40], this paper selected the number of environmental petitions and visits from each province and the number of proposals from the two sessions to indicate VER.

2.5.2. Control Variables

In this paper, we selected the economic development level (lnpgdp and lnpgdp2), water resource endowment (sup), water use structure (inpwat), industrial structure (ind), and technological innovation (ti) as the control variables. We selected actual per capita GDP, calculated at constant prices, and the quadratic term of actual per capita GDP was introduced in the model. The water resource endowment was measured by per capita water resources [41]. This paper used the proportion of industrial water usage to the total water usage in each province to represent the water use structure. We selected the proportion of industrial added value in a province’s GDP to represent industrial structure. We selected the patent grant volume per 10,000 people as a proxy variable to characterize technological innovation. To ensure the stationarity of the data, logarithms were taken for some variables (Table 2). The data were derived from the China Statistical Yearbook [27] and the China Environmental Yearbook [42].

3. Results and Discussion

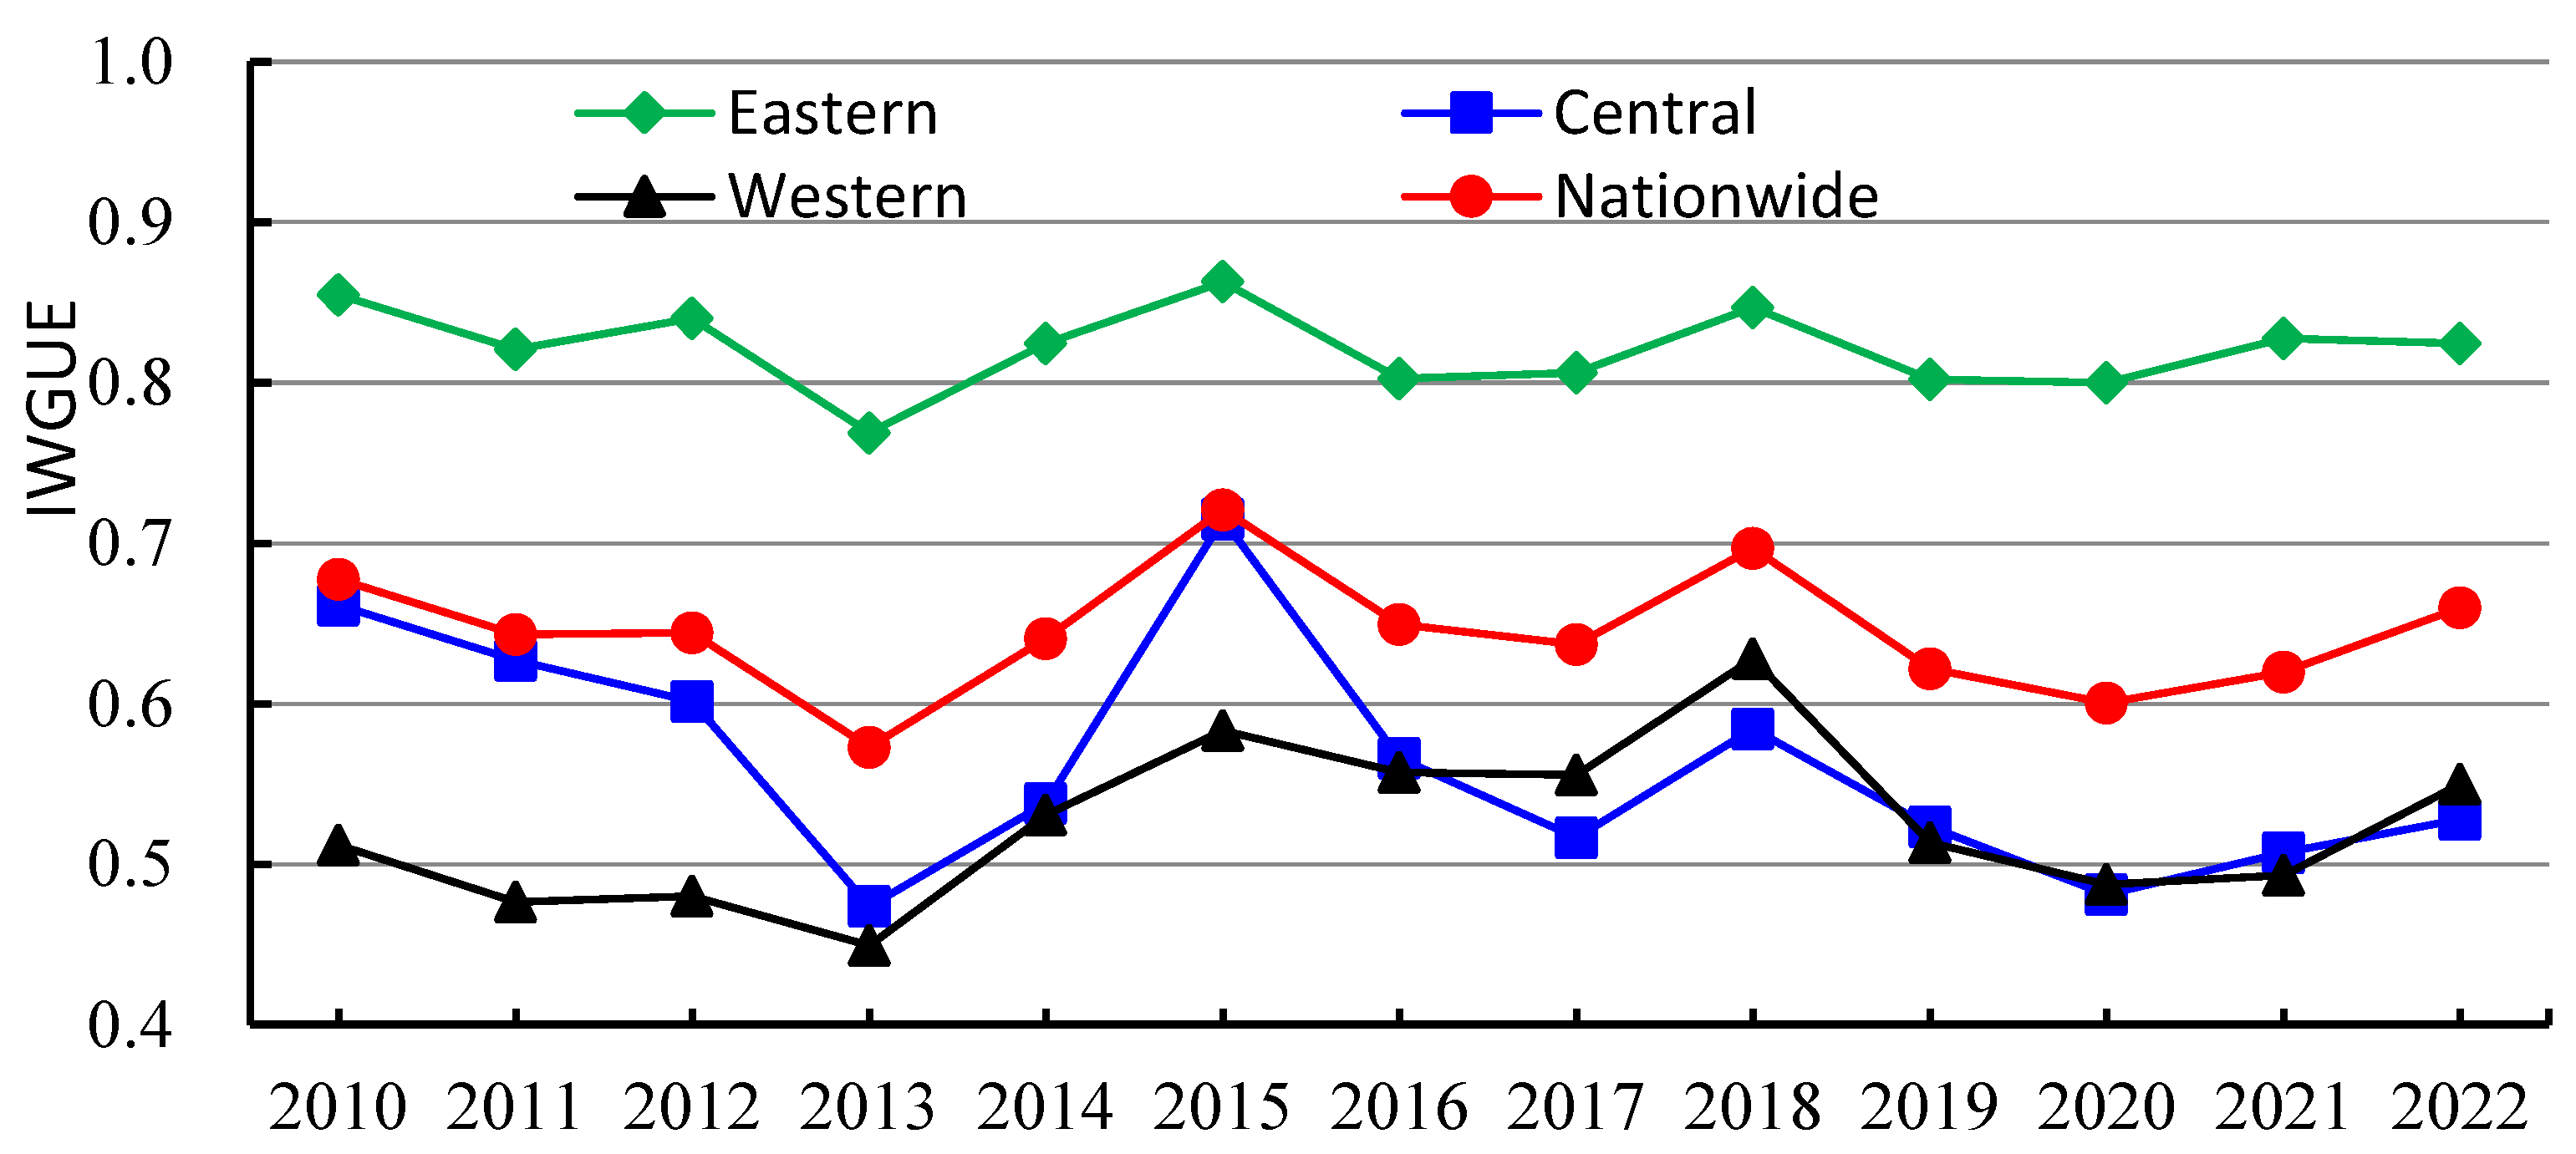
3.1. Results of IWGUE

We selected MaxDEA8.0 software to calculate the utilization efficiency of industrial water during 2010–2011 based on the Super-SBM model. On the whole, the average industrial water green use efficiency increased from 0.678 in 2010 to 0.701 in 2022, which is generally low and shows a slow upward trend in fluctuations [42,43]. The potential for improving IWGUE is enormous. China’s long-term development model, which relies on investment and factor-driven growth, has brought serious ecological pressure, and IWGUE is relatively low. The average value of IWGUE in the three major economic zones of the eastern, central, and western regions is 0.822, 0.563, and 0.515, respectively. The efficiency in the eastern region is significantly higher than that in the central and western regions, showing a gradient pattern of “high in the east and low in the west”. After the year 2012, the Chinese government attached great importance to the construction of ecological civilization. Apart from the central region where the rise in IWGUE has been moderate, pollution control has been effective, and there has been an advancement in the level of industrial water utilization and management. The change trend in the mean efficiency value in 2010–2022 is shown in Figure 2.
From the perspective of river basins, for China’s river basin economic belts to take an “ecological priority and green development path”, more attention to the IWGUE is required. Figure 3 shows the temporal evolution of the efficiency in both major river basins. The Yangtze River Economic Belt is situated in the south with abundant water resources, as well as a high proportion of manufacturing and non-ferrous metal smelting. In the past, because of the lack of effective supervision, there was a significant investment in industrial water consumption, accompanied by serious waste. At present, the country has taken the Yangtze River Economic Belt as a pilot demonstration zone for ecological protection [44].
With the strengthening of industrial pollution control along the river and the elimination of outdated production capacity, IWGUE in the Yangtze River Basin has shown a fluctuating upward trend [45]. The Yellow River Basin serves as a considerable base for energy resources, raw materials, and basic industry in China. Coupled with an extensive development model, this has caused a large input of natural resources, a large amount of wastewater discharge, and a downward trend in IWGUE in the Yellow River Basin.
Except for the years 2014 and 2020, IWGUE in the two major basins was lower than the average efficiency of the country, indicating that the problem of heavy chemical industry surrounding rivers was prominent and traditional high-input, high-pollution industries still occupied a relatively high share. The extensive use of industrial water has reduced water environment quality, so there is an urgent need for water pollution control.
From the perspective of provinces, only Beijing, Tianjin, Guangdong, and Shanghai achieved an effective value of IWGUE, consistently being at the forefront of efficiency [45]. However, the average efficiency of other provinces and cities is less than 1, indicating non-effectiveness (Figure 4). The average value of Guizhou, Shanxi, Qinghai, Gansu, and Ningxia was only 0.2–0.4. IWGUE in these provinces is greatly affected by natural factors, resulting in significant losses, with a fragile ecological environment and a heavy industry-oriented industrial structure. Among them, Shanxi improved its efficiency by carrying out an energy revolution and realizing green transformation in a resource-oriented economy. There was a clear upward trend in Zhejiang, Fujian, Hunan, and other provinces, which depended on the local governments implementing the concept of sustainable development with a focus on low-carbon and environmental protection. IWGUE in Hebei, Jiangxi, Heilongjiang, and Henan declined significantly and should become a focus for industrial water conservation. During the research period, most provinces and cities with higher IWGUE were mostly located in coastal areas with advantageous economic and political geographic positions, with more complete industrial systems and advanced production technologies. There was a greater emphasis on innovation and application of industrial water-saving technologies in these areas, which improved the effective allocation of industrial water. It was evident that the IWGUE is greatly influenced by policies, economic development levels, natural resource endowments, and technological innovation.

3.2. Impact of Environmental Regulation on the IWGUE

3.2.1. National Empirical Analysis

At the national level, it can be seen that the impact of three types of environmental regulation on the efficiency of green industrial water use apparently varies, based on the estimated results in Table 3. The coefficients of the first-order terms for CER and MER are negative, and the coefficients of the second-order terms are positive, both of which are significant at the 1% or 5% level in models 1–4. This indicates that the impact on efficiency initially decreases and then increases, showing a U-shaped characteristic, as the intensity of regulatory intensity increases. There is a nonlinear relationship between command-based, market-oriented regulation and the efficiency of green industrial water use. When regulatory intensity is weak, the direct cost of investing in green production and contamination control accounts for a relatively low proportion of the total cost incurred by industrial enterprises, and production constraints are still within an acceptable range. Most enterprises would choose to allocate funds to the treatment of end-of-pipe pollution discharge, lacking the motivation to improve water-saving technologies and clean production. Regulatory policies reduced the discharge of industrial wastewater to some extent, but at the direct cost of using productive investment and R&D funds, which has affected output and suppressed an improvement in IWGUE. As the intensity of environmental regulation policies increases, in order to obtain stable profits, meet discharge standards, and establish a good corporate image, industrial enterprises will input more manpower and financial resources to accelerate the research of clean technology, upgrade production processes and technology, and transform towards green production to maximize their own profits. The innovation effect can offset and exceed the costs of environmental regulation and innovation investment. At the same time, industry barriers are raised, and enterprises that do not meet the standards are gradually eliminated, which promotes IWGUE improvement. The inflection point values calculated further in models 2 and 4 are 0.437 and 0.472, respectively. Looking at the intensity of environmental regulation in various provinces from 2010 to 2022, most years and provinces did not cross the threshold value. In terms of MER, areas such as Shanghai, Zhejiang, and Shanxi have a larger regulatory intensity and crossed the critical value, indicating that the use of market-based environmental policies has effectively motivated enterprises in these areas to properly handle the use of water in industrial production. The regulatory effect of CER and MER on different provinces in China depends on which compliance cost or innovation compensation is dominant. In the long term, this can improve the input–output ratio of industrial water and enhance IWGUE.
In models 5 and 6, the impact of VER on industrial water use efficiency is either positively insignificant or displays an inverted U-shape, suggesting that moderate public participation-oriented environmental regulation can improve industrial water use efficiency. The number of mass petitions serves as a channel for the public to express their environmental rights, demanding that the government and industrial enterprises enhance their capacity for water pollution prevention and control. It is generally believed that a high level of public concern indirectly reflects the severity of pollution in the area for that year. In practice, because of constraints such as the participatory nature of the government system and the capacity for participation, the production decision-making behavior of industrial enterprises is relatively independent, and the role of VER is limited. This shows that the regulatory effects of the three types on the efficiency of green industrial water use are heterogeneous. It is vital to select various regulation policies flexibly and their optimized combinations according to the actual reality of each province to improve the efficiency of green industrial water use.
Regarding the control variables, the impact of per capita water resources on IWGUE is significantly negative, showing that the abundance of water resources inhibits the improvement in the efficiency in a region, which is consistent with the conclusions of Lei et al. [9]. The impact of the water use structure is not significant. The larger ratio of industrial water consumption indicates that the industry is still the pillar industry of the region, with a higher level of industrial output, which promotes efficiency improvement. On the other hand, there is redundant water resource input in some provinces, and the industrial water reuse rate is low. The estimated coefficient of industrial structure is significantly positive. The optimization of the internal structure of industrial enterprises and transformation towards high technology and a high added value industry is beneficial for the conservation and protection of water resources. The spatial differences in industrial layout are also one of the sources of the large efficiency disparities among various regions. There is a U-shaped relationship between the economic development level and green industrial water use efficiency [46]. A good economic foundation provides financial security for environmental governance investment and R&D funds. When the level of economic development crosses a certain threshold, it promotes green industrial water use efficiency, supporting the “Environmental Kuznets Curve” hypothesis. Technical progress has a promoting effect on IWGUE. Regions with developed technology have advantages in production equipment and clean technology. Advanced technology is the key to improving the efficiency of industrial water resource utilization.

3.2.2. Comparative Analysis at the Basin Level

The estimated results of the impact of the three environmental regulation types on IWGUE in the two river basins are shown in Table 4. The results indicate that there is a “U”-shaped relationship between CER and MER and the efficiency in both river basins. The intensity of CER has a large elasticity and the most significant impact on IWGUE in the Yellow River Basin. Further calculations reveal that the mean values of market-based environmental regulation in both river basins are on the left side of the “U”-shaped curve. As for VER, there is a significant positive correlation between environmental regulation and efficiency in the Yellow River Basin, while in the Yangtze River Basin, the impact of environmental regulation shows an inverted U-shaped relationship. A possible reason for this is that the aquatic ecology is fragile in the Yellow River Basin and water resource supply and demand contradiction is prominent. The awareness of water safety among the government and the public is stronger, and protecting ecological resources is equivalent to protecting productivity. In addition, this study indicated that the per capita water resources and industrial water use structure are significant in the Yangtze River Economic Belt. The impact of per capita water resources on IWGUE is significantly promoting, indicating that the higher the abundance of water resources, the greater the promotion of efficiency in the Yangtze River Basin. The endowment of water resources is a “blessing” for economic growth, and the degree of dependence of the economy on natural resources is the key to the “resource curse.” The Yangtze River Basin has a more developed level of industrialization, with a high proportion of technology-oriented industries, which provides support for the promoting effect of the industrial water use structure on IWGUE.

4. Conclusions and Policy Implications

In the context of building a beautiful China, studying the driving effect of environmental regulation on industrial water green use efficiency is of pressing importance. This article measured the IWGUE of 30 provinces in China by the SE-SBM model and divided environmental regulations into command-based, market-oriented, and voluntary regulations. The panel Tobit model was selected for empirical tests of the impact and differences in the effects of three environmental regulations on IWGUE. The research found the following: (1) The industrial water green use efficiency fluctuates upward slowly in China under the constraint of undesired output, and the potential for improving the efficiency value is enormous, with significant regional and basin level differences. (2) At the national level, the impact of command-based and market-oriented environmental regulations on IWGUE shows a U-shaped trend. Only when these environmental regulations cross the inflection point can an improvement in IWGUE be promoted. Most provinces are still on the left side of the U-shaped curve, and the positive promoting effect of voluntary environmental regulations on efficiency is not significant. (3) In the Yellow River Basin, command-based and voluntary environmental regulations have crossed the turning point and have a significant promoting effect on IWGUE. Market-oriented environmental regulations also have a U-shaped impact on the efficiency value and have not yet crossed the turning point. (4) In the Yangtze River Economic Belt, the impact of command-based and market-oriented environmental regulations on IWGUE shows a U-shaped pattern, while voluntary environmental regulations have a significant promoting effect on efficiency.
Based on the above research findings, the policy recommendations of this article include the following three points. First, the intensity of environmental regulation should be further enhanced. Because the impact of mandatory and market-oriented environmental regulations on industrial water green use efficiency has not crossed the U-shaped curve inflection point, it is necessary to further increase the intensity of supervision and enforcement within an appropriate range, raise pollution fees, improve the ecological compensation system, etc., to motivate and force industrial enterprises to perform green technological innovation and apply advanced water-saving technologies. Fully mobilizing enterprises to “clean production”, assisting in industrial restructuring, controlling pollution generation from the source, and raising the efficiency of industrial water green utilization. Second, the combination of three types of environmental regulatory policy tools should be optimized. The Chinese government should clarify the advantages and disadvantages of various regulatory tools when choosing environmental regulation tools, promote their mutual supplementation, and work together by, for example, increasing the punishment for high-water-consumption and high-pollution enterprises and implementing tax incentives and financial subsidies for industrial water-saving and environmental protection enterprises. This includes guiding enterprises to self-govern and improve water use efficiency, encouraging non-governmental environmental protection organizations, improving public awareness of water resource conservation, broadening channels for public participation, and building a joint governance system for the water environment. Third, in view of the significant differences in the impact of environmental regulations on IWGUE between the Yellow River and Yangtze Economic Belt in China, local governments should develop water ecological management policies based on the actual situations in different regions, such as industrial structure and water resource endowment, and adopt targeted and classified measures. This includes strengthening the innovation of market-oriented environmental regulation means, further clarifying the rights and responsibilities of the “river chief system”, strictly implementing the accountability system, giving full play to the regulatory role of environmental regulations in river basins, and injecting new motivation into green and high-quality development of the regional economy.

Author Contributions

Conceptualization, Y.Y. and S.L.; methodology, Y.Y.; software, S.L.; validation, M.K.K. and S.L.; formal analysis, Y.Y.; investigation, Y.Y.; resources, Y.Y.; data curation, S.L. and M.K.K.; writing—original draft preparation, Y.Y.; writing—review and editing, M.K.K.; visualization, S.L.; supervision, M.K.K.; project administration, Y.Y.; funding acquisition, Y.Y. All authors have read and agreed to the published version of the manuscript.

Funding

This research was supported by Gansu Province Philosophy and Social Science Planning Project (2023YB011) and Higher Education Innovation Fund Project in Gansu Province (2023B-072).

Institutional Review Board Statement

Not applicable.

Informed Consent Statement

Not applicable.

Data Availability Statement

The data that support the findings of this study are available from the corresponding author upon reasonable request.

Conflicts of Interest

The authors declare no conflicts of interest.

References

  1. Liu, K.; Yang, G.; Yang, D. Industrial water-use efficiency in China: Regional heterogeneity and incentives identification. J. Clean. Prod. 2020, 258, 120828. [Google Scholar] [CrossRef]
  2. Geng, S.; Liu, D.; Xia, P. Comparative analysis of China’s water use efficiency from domestic and international perspective. Water Resour. Res. 2022, 22, 77–82. [Google Scholar]
  3. Ministry of Ecology and Environment of the People’s Republic of China. 2022 China Environmental Status Bulletin. Available online: https://www.mee.gov.cn/hjzl/sthjzk/zghjzkgb/202305/P020230529570623593284.pdf (accessed on 23 April 2024).
  4. Huang, C.; Ren, W.; Fatima, N.; Zhu, J. Carbon intensity constraint, economic growth pressure and China’s low-carbon development. J. Environ. Manag. 2023, 348, 119282. [Google Scholar] [CrossRef]
  5. Marques, R. A yardstick competition model for Portuguese water and sewerage services regulation. Util. Pol. 2006, 14, 175–184. [Google Scholar] [CrossRef]
  6. Rouse, M. Institutional Governance and Regulation of Water Services: The Essential Elements; IWA Publishing: London, UK, 2007. [Google Scholar]
  7. Hu, J.; Wang, S.; Yeh, F. Total-factor water efficiency of regions in China. Resour. Policy 2006, 31, 217–230. [Google Scholar] [CrossRef]
  8. Guerrero-García-Rojas, H.R.; García-Vega, D.; Seguí-Amórtegui, L. Industrial water productivity in Mexico: Efficiency analysis for eight sectors. Tecnol. Cienc. Agua. 2021, 12, 313–357. [Google Scholar] [CrossRef]
  9. Lei, Y.; Huang, L.; Zhang, H. Research on the dynamic evolution and the driving factors of industrial water consumption efficiency in China. Resour. Environ. Yangtze Basin 2017, 26, 159–170. [Google Scholar]
  10. Zheng, J.; Zhang, H.; Xing, Z. Re-examining regional total-factor water efficiency and its determinants in China: A parametric distance function approach. Water 2018, 10, 1286. [Google Scholar] [CrossRef]
  11. Pan, Z.; Wang, Y.; Zhou, Y.; Wang, Y. Analysis of the water use efficiency using super-efficiency data envelopment analysis. Appl. Water. Sci. 2020, 10, 139. [Google Scholar] [CrossRef]
  12. Xu, R.; Wu, Y.; Wang, G.; Zhang, X.; Wu, W.; Xu, Z. Evaluation of industrial water use efficiency considering pollutant discharge in China. PLoS ONE 2019, 14, e0221363. [Google Scholar] [CrossRef]
  13. Liu, K.; Yang, G.; Yang, D. Investigating industrial water-use efficiency in mainland China: An improved SBM-DEA model. J. Environ. Manag. 2020, 270, 110859. [Google Scholar] [CrossRef] [PubMed]
  14. Lv, T.; Liu, W.; Zhang, X.; Yao, L. Spatiotemporal evolution of the green efficiency of industrial water resources and its influencing factors in the Poyang Lake region. Phys. Chem. Earth 2021, 124, 103049. [Google Scholar] [CrossRef]
  15. Shi, C.; Shang, T.; Zhi, J.; Na, X. Research on the impact of China’s new urbanization on industrial water utilization efficiency-based on spatial spillover effects and threshold characteristics. Water Sci. Technol. 2023, 87, 1832–1852. [Google Scholar] [CrossRef] [PubMed]
  16. Jin, W.; Zhang, H.; Liu, S.; Zhang, H. Technological innovation, environmental regulation, and green total factor efficiency of industrial water resources. J. Clean. Prod. 2019, 211, 61–69. [Google Scholar] [CrossRef]
  17. Ding, X.; Fu, Z.; Jia, H. Study on Urbanization Level, Urban Primacy and Industrial Water Utilization Efficiency in the Yangtze River Economic Belt. Sustainability 2019, 11, 6571. [Google Scholar] [CrossRef]
  18. Trang, T.T.; Bush, S.R.; van Leeuwen, J. Enhancing institutional capacity in a centralized state: The case of industrial water use efficiency in Vietnam. J. Ind. Ecol. 2023, 27, 210–222. [Google Scholar] [CrossRef]
  19. Pan, D.; Chen, H.; Zhang, N.; Kong, F. Do livestock environmental regulations reduce water pollution in China? Ecol. Econ. 2023, 204, 107637. [Google Scholar] [CrossRef]
  20. Zhang, C.; Lin, J. An empirical study of environmental regulation on carbon emission efficiency in China. Energy Sci. Eng. 2022, 10, 4756–4767. [Google Scholar] [CrossRef]
  21. Yue, L.; Huang, C.; Ren, W. Performance evaluation and driver analysis of pollution control and carbon reduction in China: Based on a new analytical framework. Environ. Sci. Pollut. Res. 2023, 30, 84368–84385. [Google Scholar] [CrossRef]
  22. Zhang, M.; Qiu, D. Research on the impact of environmental regulations on China’s regional water resources efficiency: Insights from DEA and fixed effects regression models. Pol. J. Environ. Stud. 2022, 31, 2407–2423. [Google Scholar] [CrossRef]
  23. Wang, Q.; Wang, S. The impact of environmental regulation on water resources utilization efficiency. Front. Environ. Sci. 2022, 10, 1022929. [Google Scholar] [CrossRef]
  24. Wang, X.; Wang, Z. Research on the impact of environmental regulation on water resources utilization efficiency in China based on the SYS-GMM model. Water Supply 2021, 21, 3643–3656. [Google Scholar] [CrossRef]
  25. Zhang, Y.; Wang, T.; Ren, C.; Wang, L.; Zhang, K.; Song, R. Heterogeneous impacts and spillover effects of green innovation network and environmental regulation on water use efficiency: A spatiotemporal perspective from 269 cities in China. Sustain. Cities Soc. 2023, 90, 104361. [Google Scholar] [CrossRef]
  26. Stavins, R.N. Correlated uncertainty and policy instrument choice. J. Environ. Econ. Manag. 1996, 30, 218–232. [Google Scholar] [CrossRef]
  27. Statistical Bureau of China. Chinese Statistical Yearbook; China Statistics Press: Beijing, China, 2023. [Google Scholar]
  28. Charnes, A.; Cooper, W.W.; Rhodes, E. Measuring the efficiency of decision making units. Eur. J. Oper. Res. 1978, 2, 429–444. [Google Scholar] [CrossRef]
  29. Tone, K. A slacks-based measure of efficiency in data envelopment analysis. Eur. J. Oper. Res. 2001, 130, 498–509. [Google Scholar] [CrossRef]
  30. Tone, K. A slacks-based measure of super-efficiency in data envelopment analysis. Eur. J. Oper. Res. 2002, 143, 32–41. [Google Scholar] [CrossRef]
  31. Shi, Q.; Chen, S.; Shi, C.; Wang, Z.; Deng, X. The impact of industrial transformation on water use efficiency in northwest region of China. Sustainability 2015, 7, 56–74. [Google Scholar] [CrossRef]
  32. Industrial Statistics Department of the National Bureau of Statistics. China’s Industrial Statistical Yearbook; China Statistics Press: Beijing, China, 2023. [Google Scholar]
  33. National Bureau of Statistics, Ministry of Ecology and Environment. China’s Environmental Statistical Yearbook; China Statistics Press: Beijing, China, 2023. [Google Scholar]
  34. Ribeiro, F.M.; Kruglianskas, I. Principles of environmental regulatory quality: A synthesis from literature review. J. Clean. Prod. 2015, 96, 58–76. [Google Scholar] [CrossRef]
  35. Ren, S.; Li, X.; Yuan, B.; Li, D.; Chen, X. The effects of three types of environmental regulation on eco-efficiency: A cross-region analysis in China. J. Clean. Prod. 2018, 173, 245–255. [Google Scholar] [CrossRef]
  36. Ma, H.; Dong, S. Effects of different types of environmental regulations on carbon emission efficiency. J. Beijing Inst. Technol. (Soc. Sci. Ed.) 2020, 22, 1–10. [Google Scholar]
  37. Mao, J.; Wu, Q.; Zhu, M.; Lu, C. Effects of environmental regulation on green total factor productivity: An evidence from the Yellow River Basin, China. Sutainability 2022, 14, 2015. [Google Scholar] [CrossRef]
  38. Li, X.; Li, X. Study on the differences and convergence of industry environment regulation intensity in China. China Popul. Resour. Environ. 2017, 27, 1–9. [Google Scholar]
  39. Peng, X.; Li, B. On green industrial transformation in China under different types of environmental regulation. J. Financ. Econ. 2016, 42, 134–144. [Google Scholar]
  40. Wang, H. Comparison and selection of environmental regulation policy in China: Based on Bayesian model averaging approach. China Popul. Resour. Environ. 2016, 26, 132–138. [Google Scholar]
  41. Editorial Committee of China Environmental Yearbook. China Environmental Yearbook; China Environmental Yearbook Press: Beijing, China, 2020. [Google Scholar]
  42. Chen, Y.; Yin, G.; Liu, K. Regional differences in the industrial water use efficiency of China: The spatial spillover effect and relevant factors. Resour. Conserv. Recycl. 2021, 167, 105239. [Google Scholar] [CrossRef]
  43. Li, J.; Huang, Z.; Zhou, L.; Dai, Y.; Yang, Y. A comparative study of the driving factors of water resources use efficiency in China’s agricultural and industrial sectors. Water 2024, 16, 387. [Google Scholar] [CrossRef]
  44. Zhuang, Y.; Zhang, L.; Chiu, Y.; Guo, Z.; Chu, Y.; Du, X. Evaluating the recycling efficiency of industrial water use systems in China: Basin differences and factor analysis. J. Environ. Manag. 2022, 316, 115313. [Google Scholar] [CrossRef] [PubMed]
  45. Li, F.; Li, Y. Industrial water use efficiency and regional deviations among the provinces along the Yangtze River Economic Belt Under the “Double Carbon” goals. Resour. Environ. Yangtze Basin 2023, 11, 2360–2370. [Google Scholar]
  46. Yang, F.; Wang, D.; Zhao, L.; Wei, F. Efficiency evaluation for regional industrial water use and wastewater treatment systems in China: A dynamic interactive network slacks-based measure model. J. Environ. Manag. 2021, 279, 111721. [Google Scholar] [CrossRef]
Figure 1. Study area.
Sustainability 16 04984 g001
Figure 2. The change trend in industrial water green use efficiency in China.
Sustainability 16 04984 g002
Figure 3. The change trend in industrial water green use efficiency in the major river basins.
Sustainability 16 04984 g003
Figure 4. The average value of industrial water green use efficiency of various provinces in China.
Sustainability 16 04984 g004
Table 1. The evaluation index system of industrial water green use efficiency.
CategoryFactorsIndictorsUnit
inputcaptialAnnual average net value of fixed assets of industrial enterprises above the designated sizeCNY 100 million
laborAnnual average of all employees in industrial enterprises above the designated size10 thousand persons
water resourcesTotal amount industrial water consumption 100 million m3
desirable outputbenefitsIndustrial added value in each provinceCNY 100 million
undesirable outputnegative effect on the environmentCOD emissions from industrial wastewater10 thousand tons
Ammonia nitrogen emissions from industrial wastewater10 thousand tons
Table 2. Descriptive statistical results of variables.
VariableObsMeanStd.Dev.MinMax
IWGUE 3900.6410.3060.2311.33
CER3900.1130.8220.010.535
MER3900.2410.1190.0270.712
VER3900.2050.1550.0010.839
pgap3903.8742.4210.50512.899
sup3902138.712490.5772.8016,176.90
inpwat39022.29513.3161.61367.685
indu39043.5014.6319.0161.50
ti3906.0488.6330.14549.262
Table 3. Estimated results of three types of environmental regulations.
Variable NameCERMERVER
Model 1Model 2Model 3Model 4Model 5Model 6
CER−8.3234 ***−14.1153 ***
(−5.47)(−4.27)
CER2 16.5846 **
(1.97)
MER −0.9861 ***−2.7405 ***
(−5.89)(−6.73)
MER2 2.8999 ***
(4.70)
VER 0.01690.0773
(1.38)(1.02)
VER2 −0.0035
(−0.81)
lnpgdp−3.2223 ***−3.2391 ***−4.1371 ***−4.3218 ***−3.5891 ***−3.6244 ***
(−4.20)(−4.24)(−5.97)(−6.40)(−4.91)(−4.95)
lnpgdp20.1703 ***0.1713 ***0.2094 ***0.2163 ***0.1858 ***0.1875 ***
(4.5)(4.55)(6.09)(6.47)(5.12)(5.16)
lnsup−0.0248 **−0.0229 **−0.0477 ***−0.0573 ***−0.0284 **−0.0269 **
(−2.19)(−2.03)(−4.16)(−5.06)(−2.48)(−2.32)
Inpwat0.02770.01920.0373−0.04340.06890.087
(0.27)(0.19)(0.37)(−0.44)(0.64)(0.79)
indu0.0028 ***0.0030 ***0.0043 ***0.0043 ***0.0041 ***0.0041 ***
(2.98)(3.16)(4.59)(4.70)(4.18)(4.19)
ti0.0050 *0.0049 *0.0046 *0.0053 **0.00450.0039
(1.89)(1.85)(1.72)(2.06)(1.58)(1.34)
_cons15.8247 ***15.9109 ***21.2082 ***22.5951 ***17.6698 ***17.5845 ***
(4.10)(4.15)(6.10)(6.66)(4.87)(4.85)
N390390390390390390
Note: The values of T statistics in the small brackets and the asterisks *, **, and *** indicate that the statistical values are significant at the 1%, 5%, and 10% levels, respectively.
Table 4. Estimated results of the two major river basins.
Variable NameYellow River BasinYangtze River Economic Belt
Model 1Model 2Model 3Model 4Model 5Model 6
CER−3.0346 *** −6.7374 **
(−5.39) (−2.02)
CER225.692 *** 15.273 *
(3.48) (1.79)
MER −2.1464 *** −1.5489 *
(−2.68) (−1.82)
MER2 1.9157 * 0.5195 *
(1.76) (1.26)
VER 0.1101 *** 0.2196 ***
(3.68) (2.64)
VER2 −0.0130 **
(−2.60)
lnpgdp−3.5094 **−6.2214 ***−4.6829 ***−2.6765 ***−4.2106 ***3.6865 ***
(−2.48)(−3.86)(−2.30)(−2.70)(−4.19)(−4.02)
lnpgdp20.1907 ***0.3185 ***0.2404 ***0.1431 ***0.2129 ***0.1933 ***
(2.73)(3.99)(3.10)(2.85)(4.18)(4.15)
lnsup−0.0119−0.0539 **0.03160.0852 **0.0819 **0.0778 **
(−0.66)(−2.16)(−1.47)(−2.44)(−2.42)(−2.25)
inpwat−0.42490.77060.42590.9778 ***0.9928 ***0.8424 ***
(−0.96)(1.64)(0.94)(4.38)(4.56)(3.86)
indu0.0042 **0.0067 ***0.0068 ***0.00190.0027 **0.0028 **
(2.39)(3.53)(3.61)(1.42)(2.03)(2.07)
ti0.0269 **0.0349 **0.0273 *0.0086 **0.0098 ***0.0092 **
(2.04)(2.08)(1.76)(2.42)(2.75)(2.58)
_cons16.7777 **31.0364 ***21.6899 ***12.0139 **20.4155 ***16.1798 ***
(2.35)(3.79)(2.75)(2.49)(4.2)(3.73)
N104104104143143143
Note: The values of T statistics in the small brackets and the asterisks *, **, and *** indicate that the statistical values are significant at the 1%, 5%, and 10% levels, respectively.
Disclaimer/Publisher’s Note: The statements, opinions and data contained in all publications are solely those of the individual author(s) and contributor(s) and not of MDPI and/or the editor(s). MDPI and/or the editor(s) disclaim responsibility for any injury to people or property resulting from any ideas, methods, instructions or products referred to in the content.

