
Research on the Capability to Prevent Returning to Poverty and Its Enhancement Path for the Ecologically Fragile Areas: A Case Study of Enshi Prefecture
Abstract
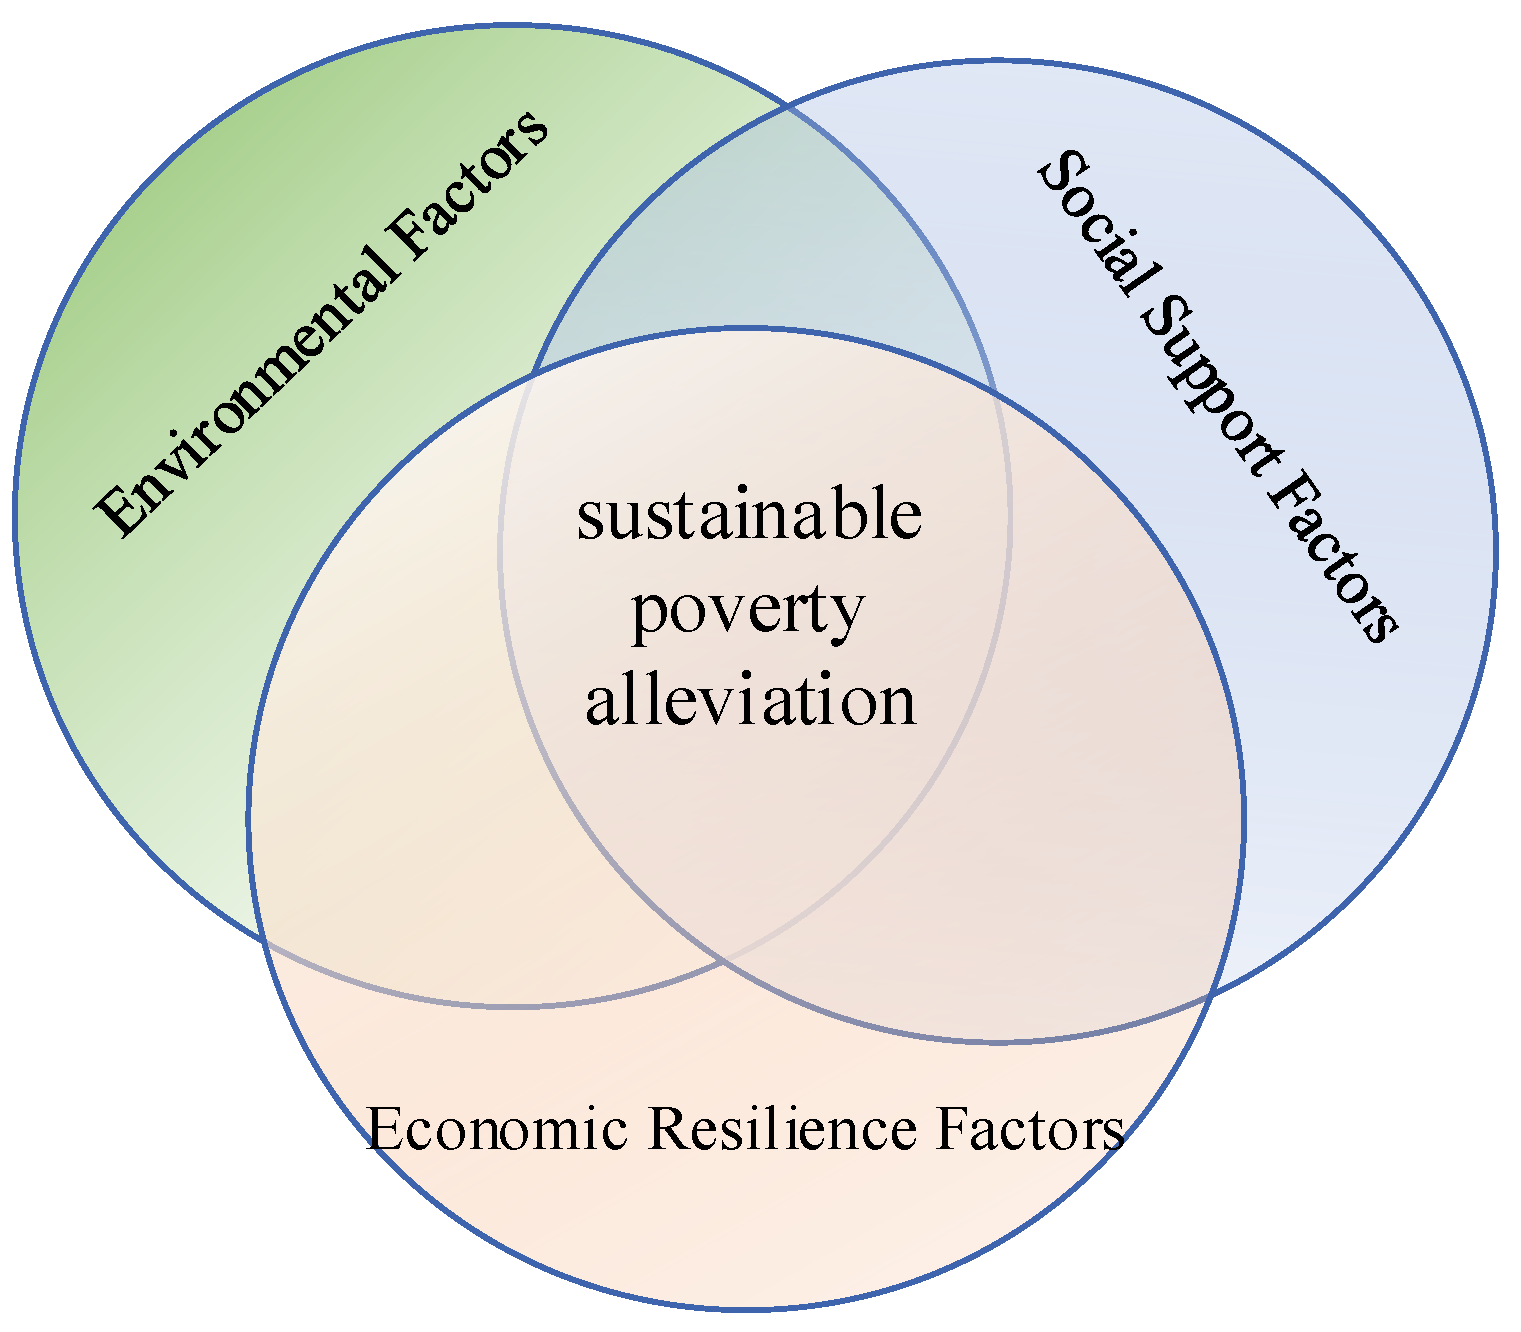
1. Introduction
2. Literature Review
3. Materials and Methods
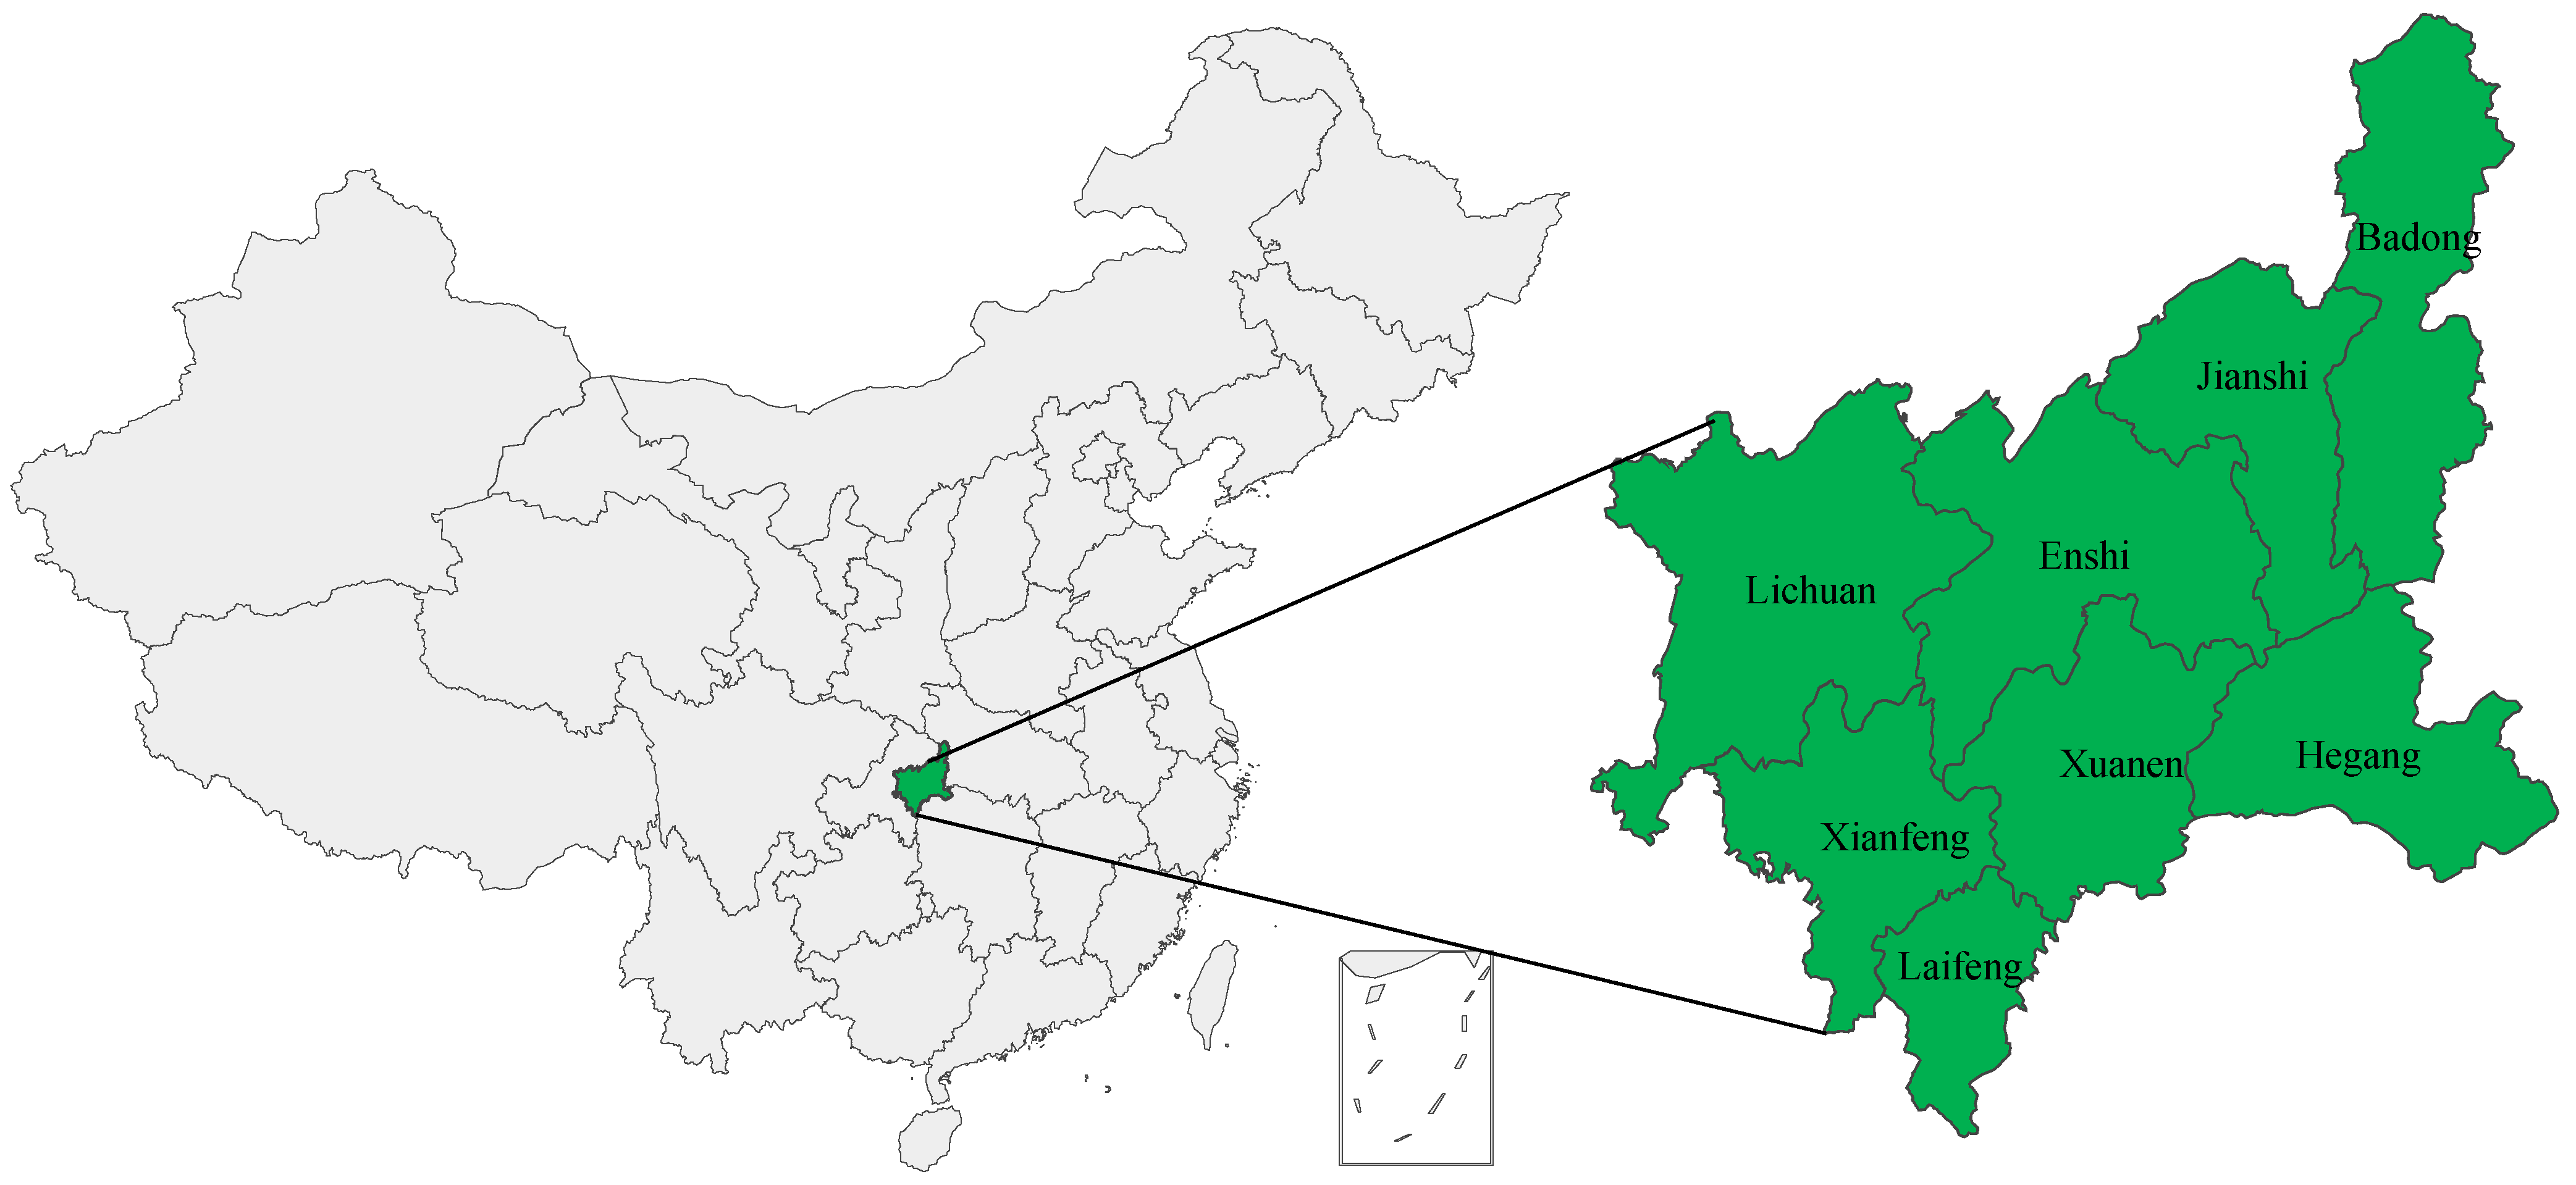
3.1. Overview of the Study Area
3.2. Methods
- Entropy weight TOPSIS method
- 2.
- Identification of Obstacle Factors
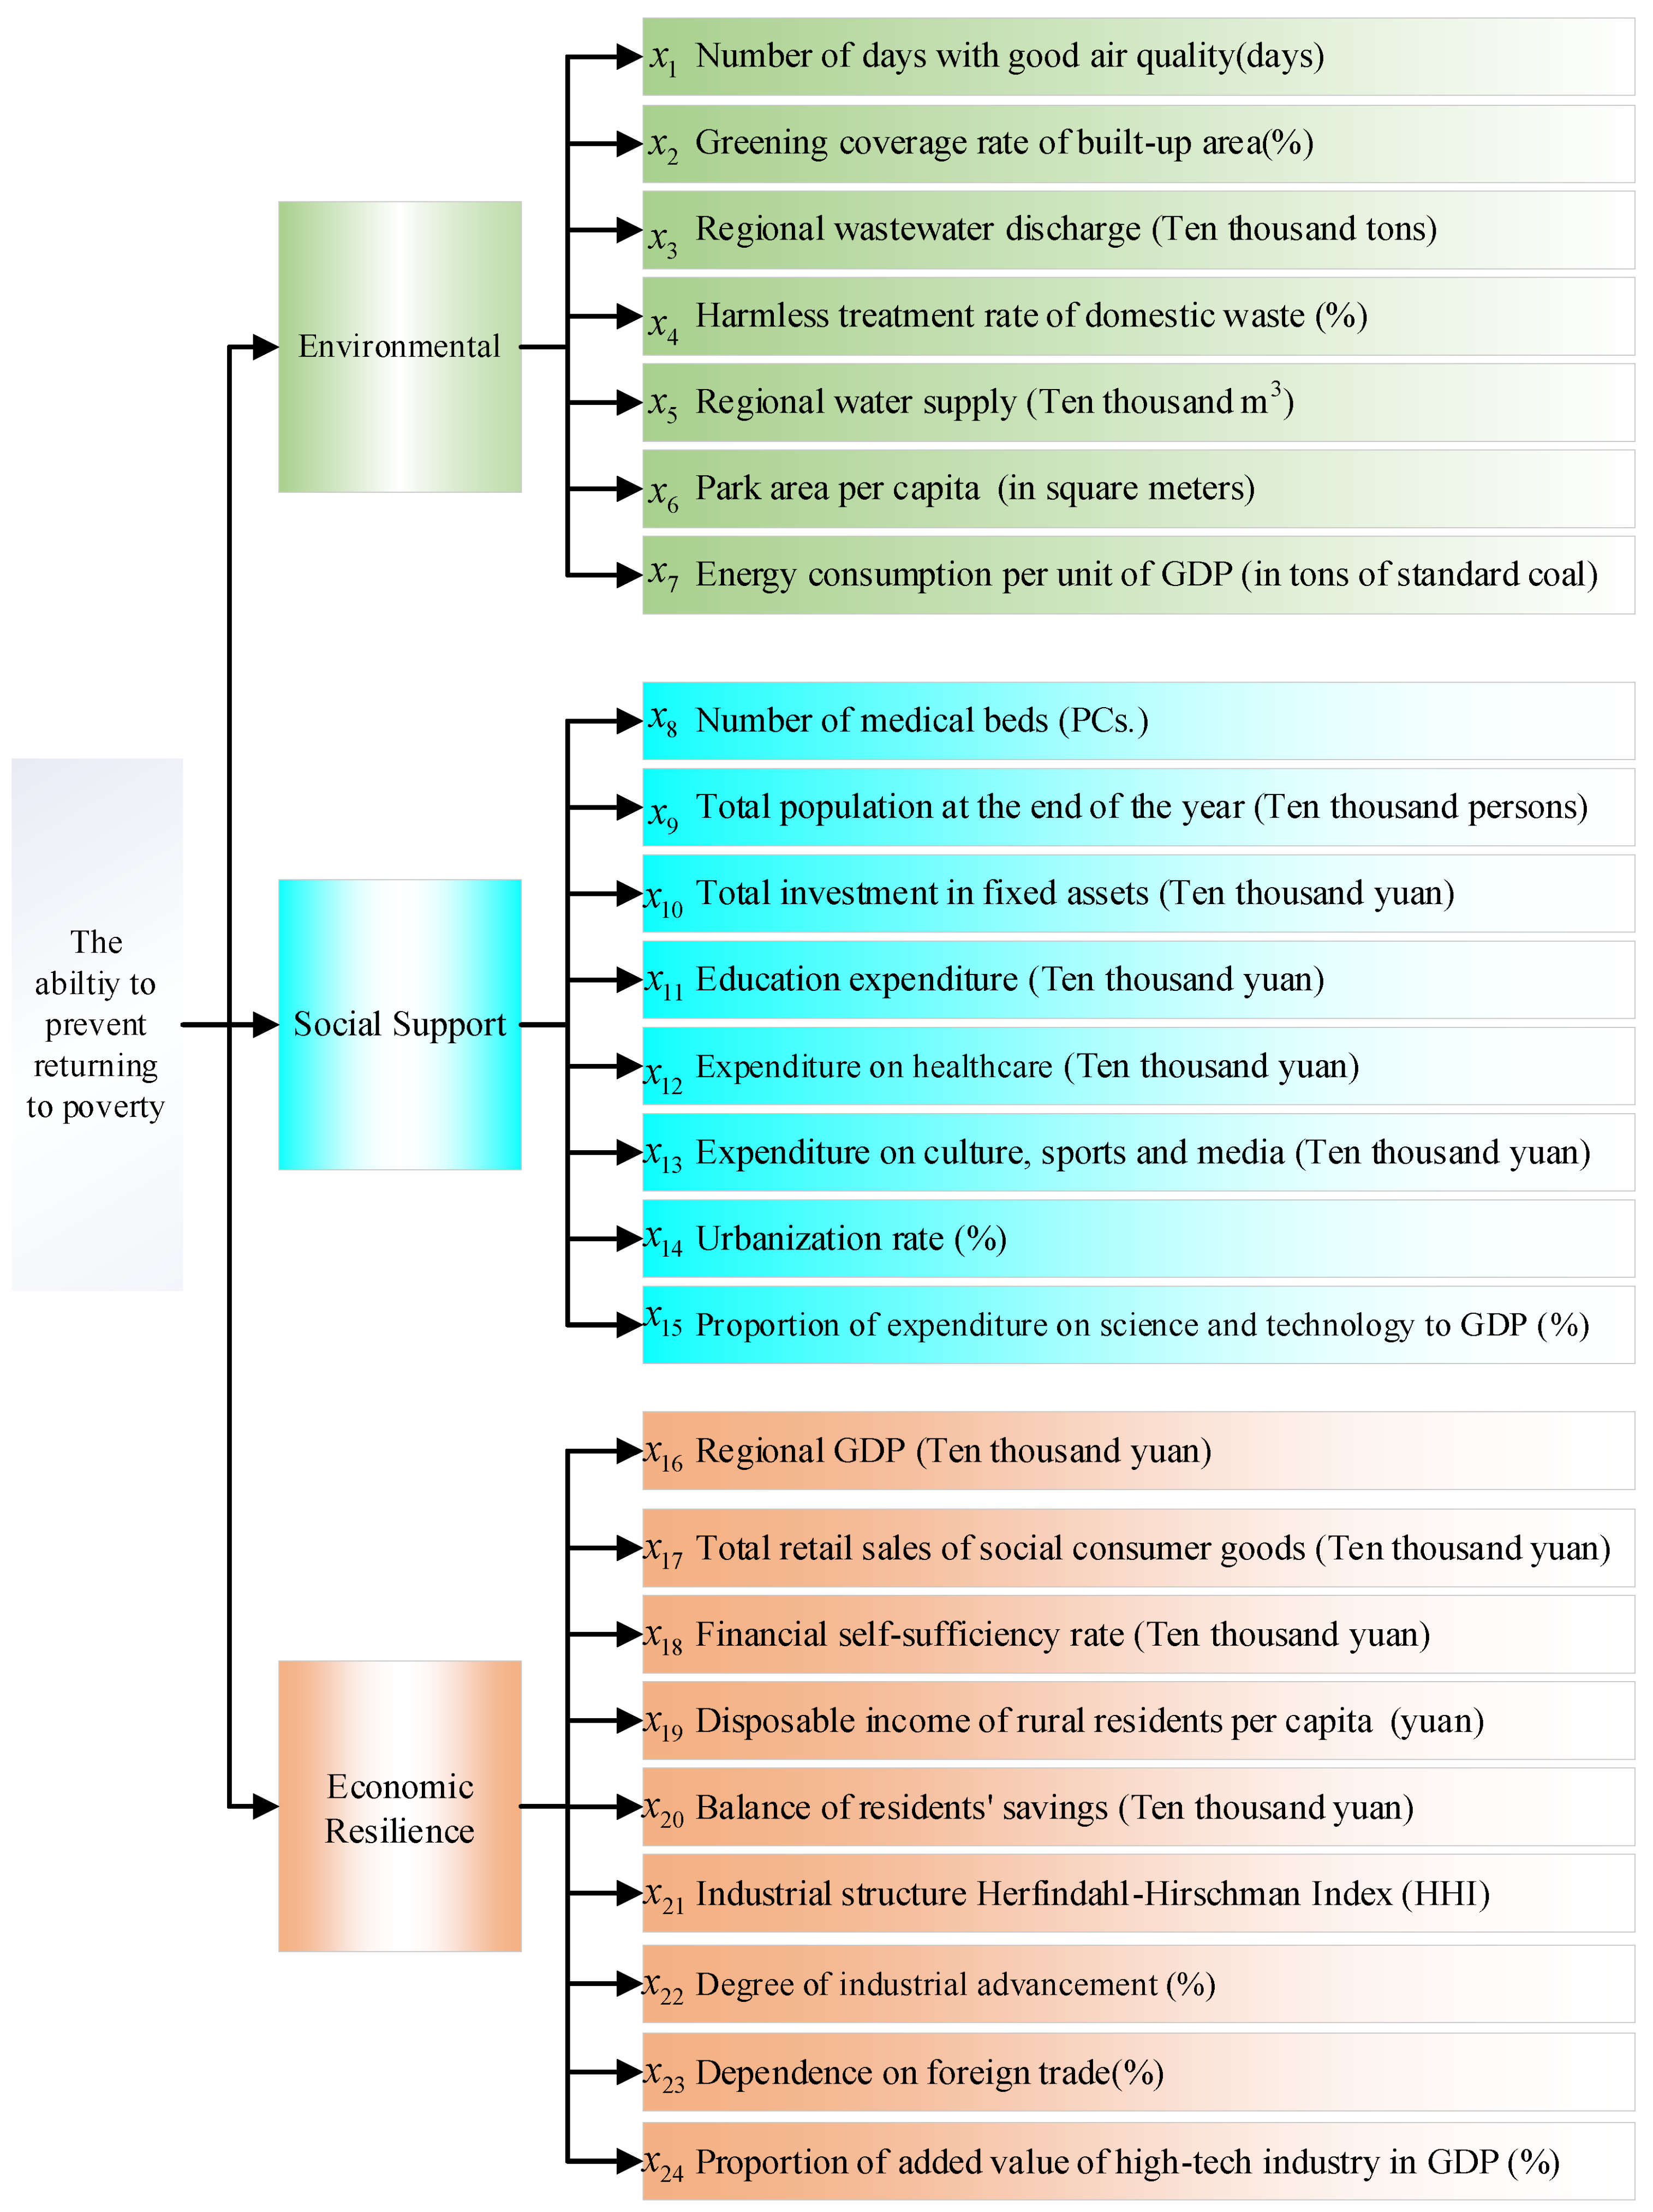
4. Evaluation Indicator System
5. Case Study
5.1. Analysis of the Weight of Each Indicator
5.2. Analysis of the Capability to Prevent Returning to Poverty
5.3. Obstacle Analysis
6. Conclusions, Discussion, and Limitations of the Study
6.1. Conclusions
- (1)
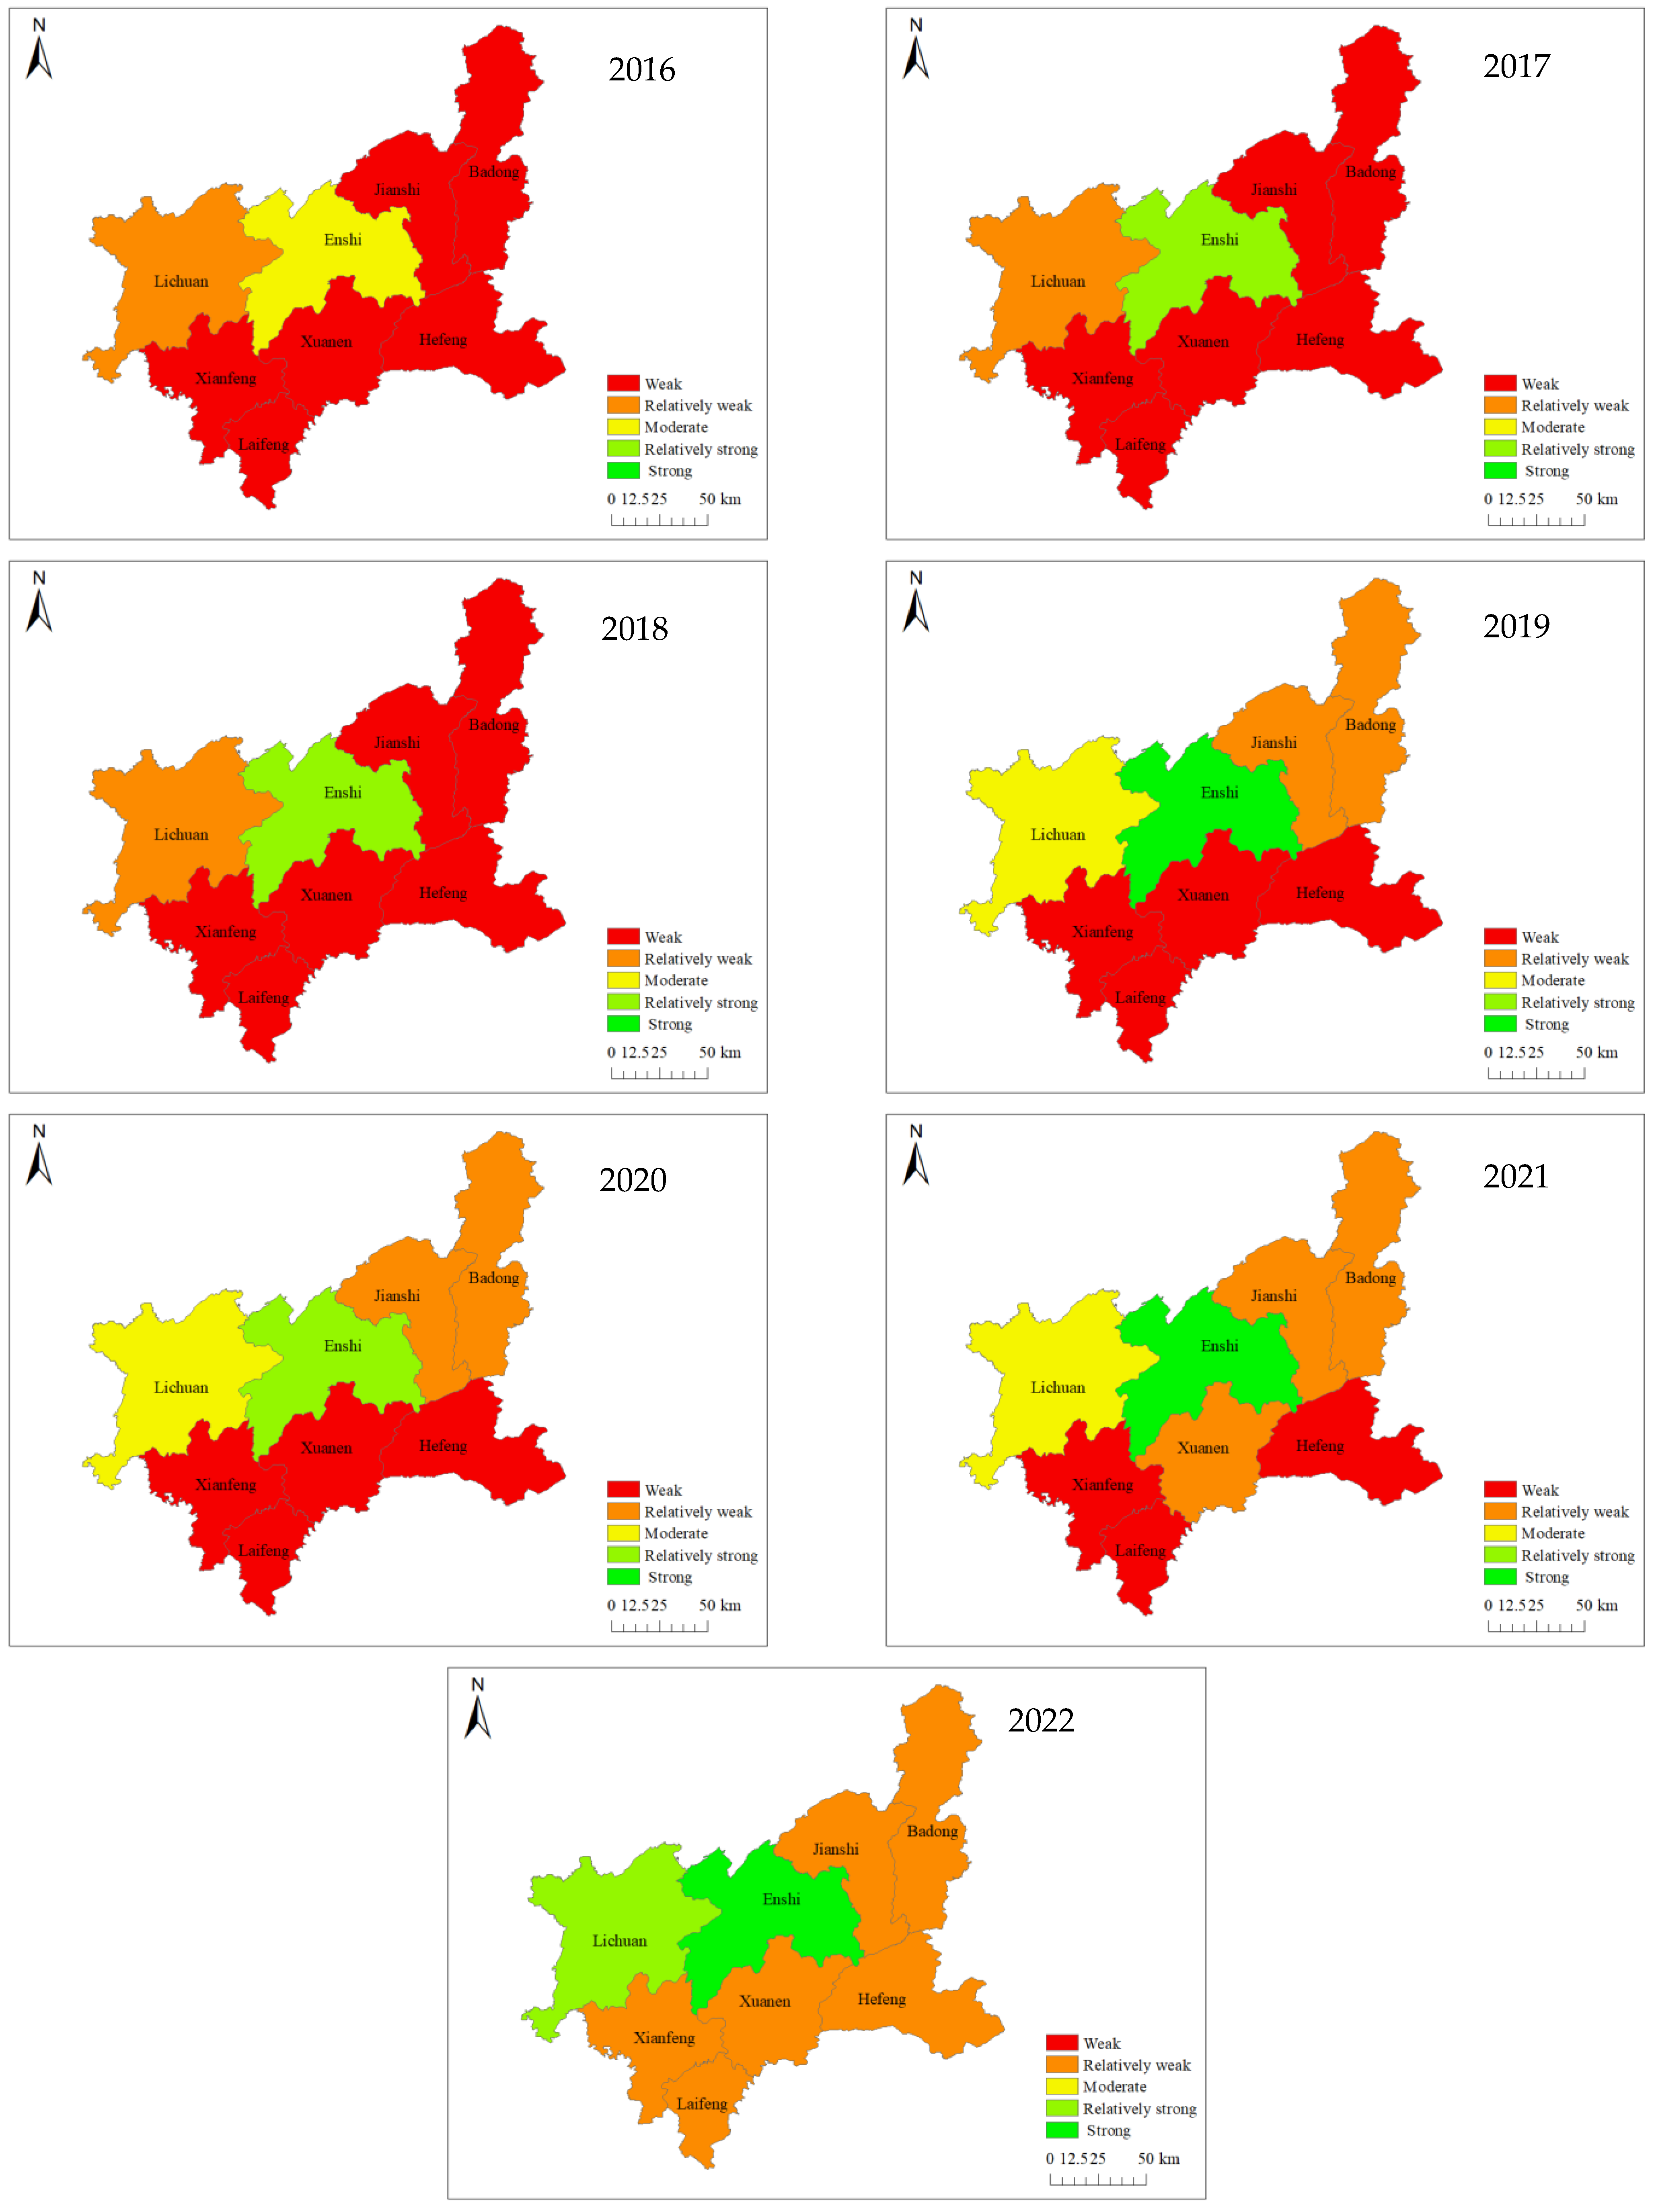
- Enshi City and Lichuan City exhibited significantly stronger capabilities to prevent returning to poverty than other regions. In contrast, areas such as Jianshi, Badong, Xuanen, Xianfeng, Laifeng, and Hefeng Counties showed lower capabilities, with minimal variance among them. In 2020, most regions saw a decline in their capabilities, illustrating the ongoing vulnerability of ecological, social, and economic systems in post-poverty alleviation phases, susceptible to disruptions from unforeseen events.
- (2)
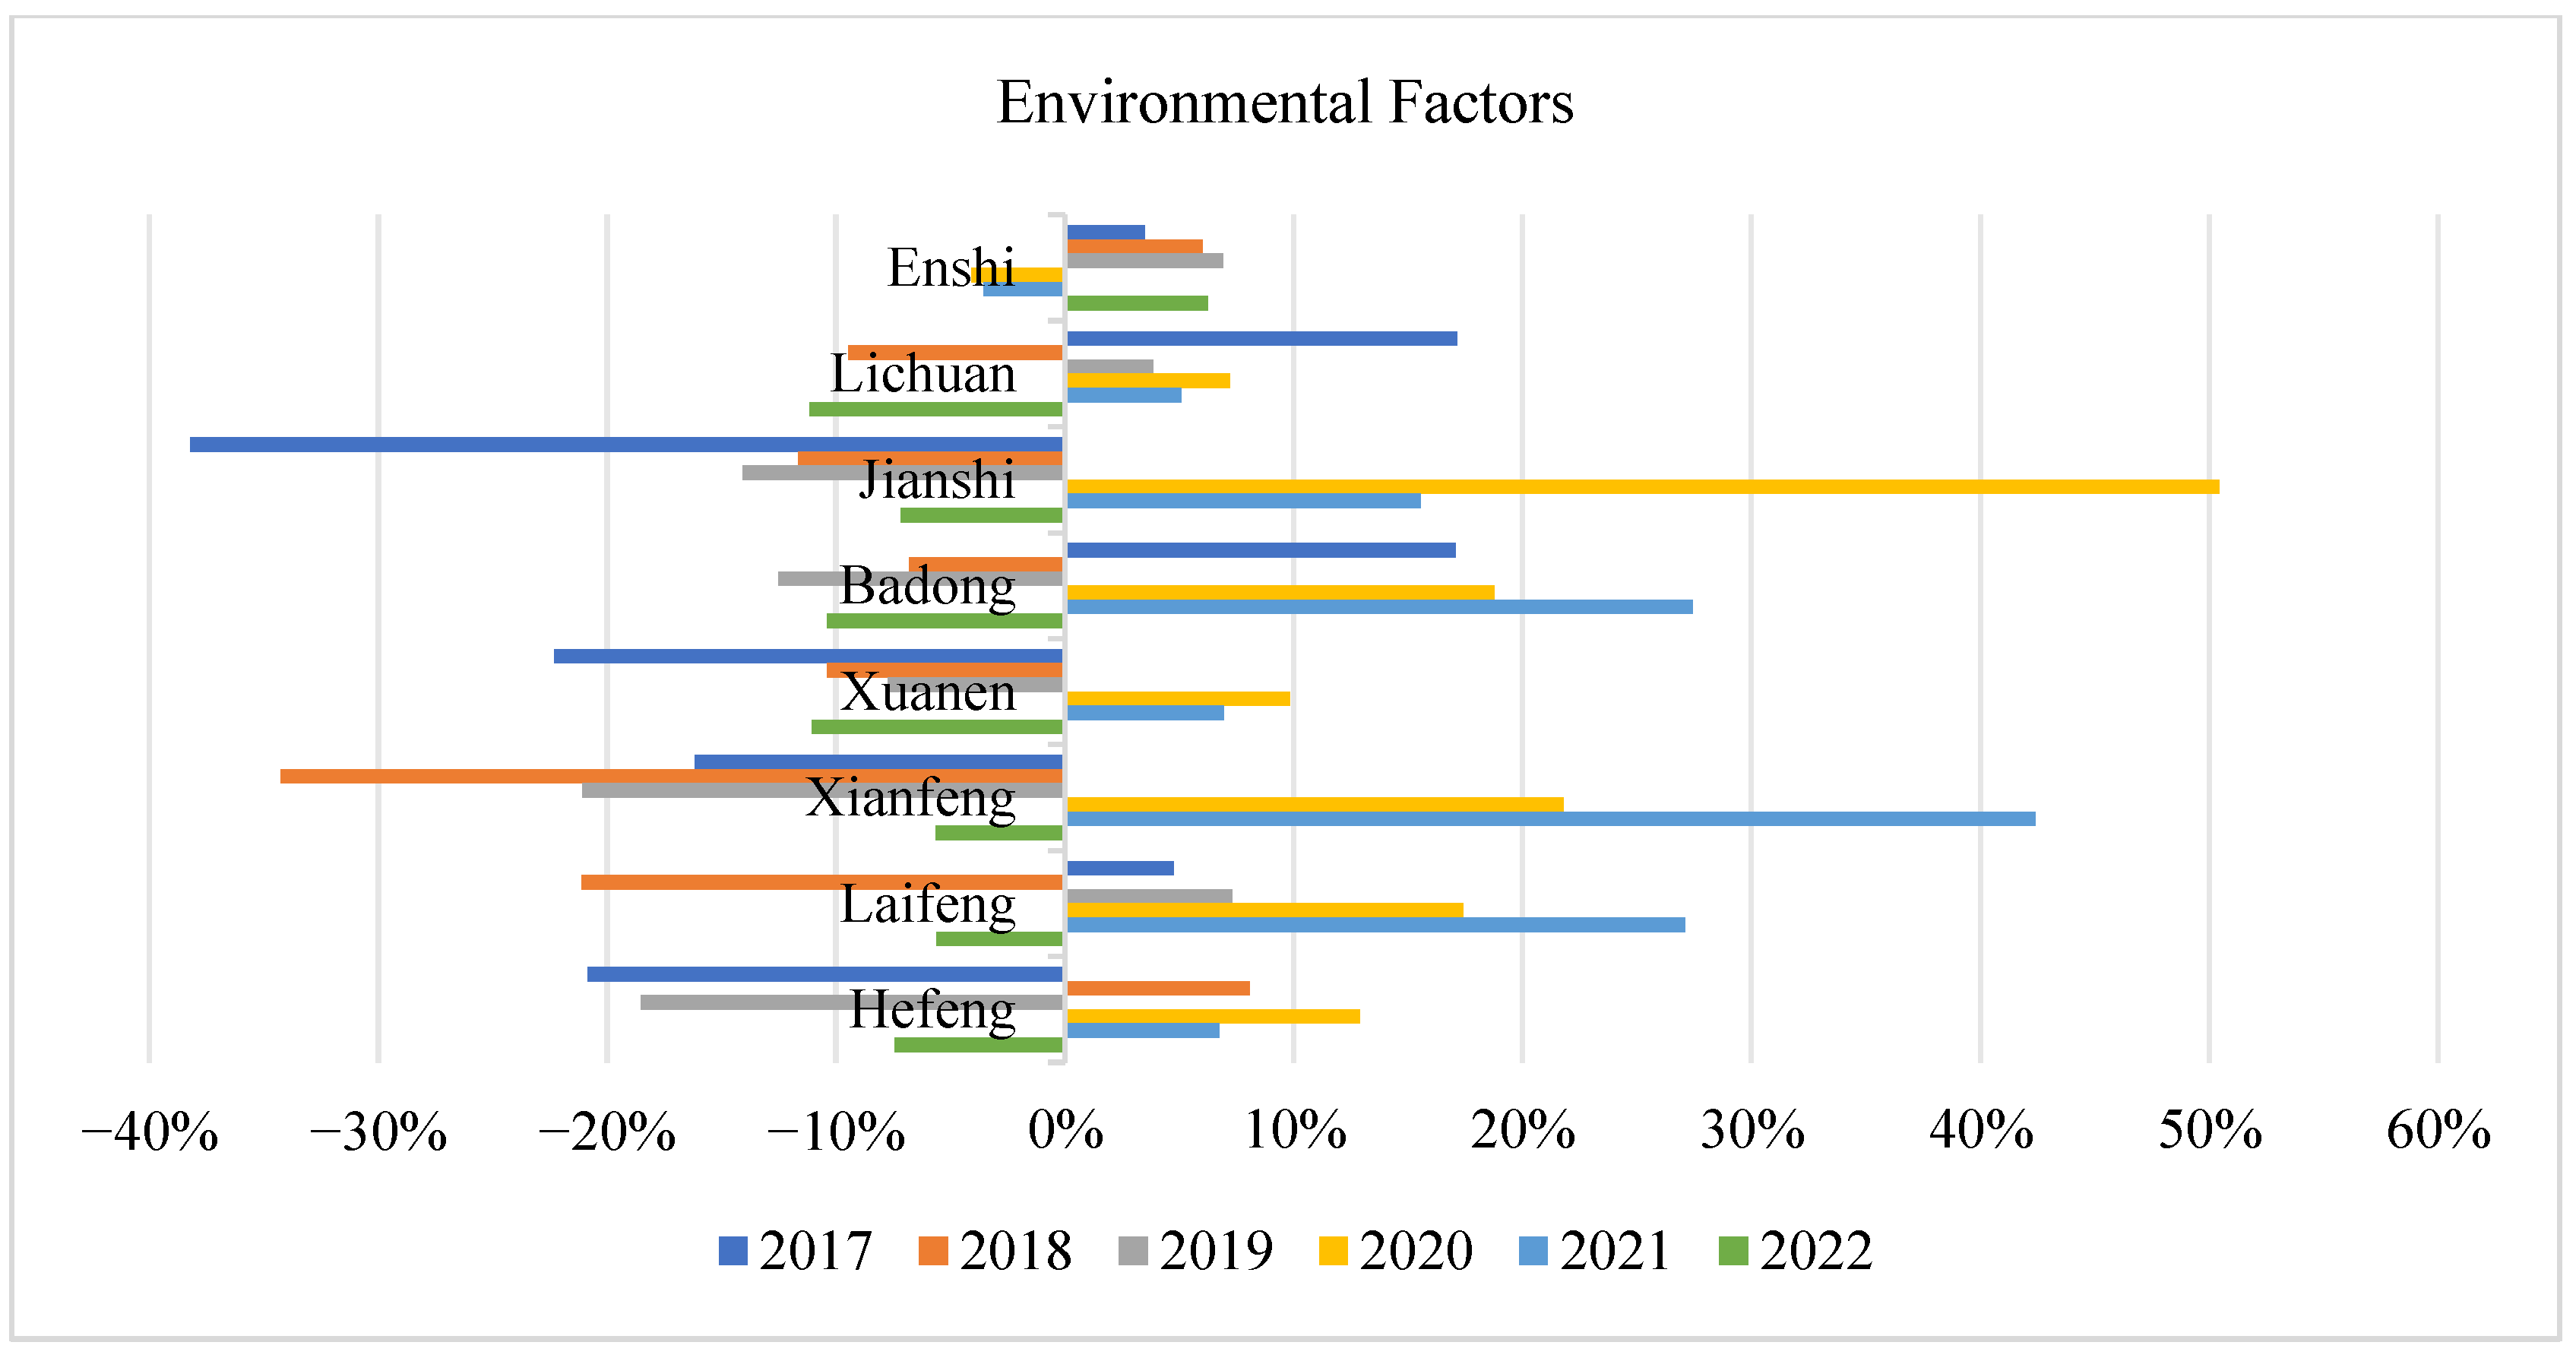
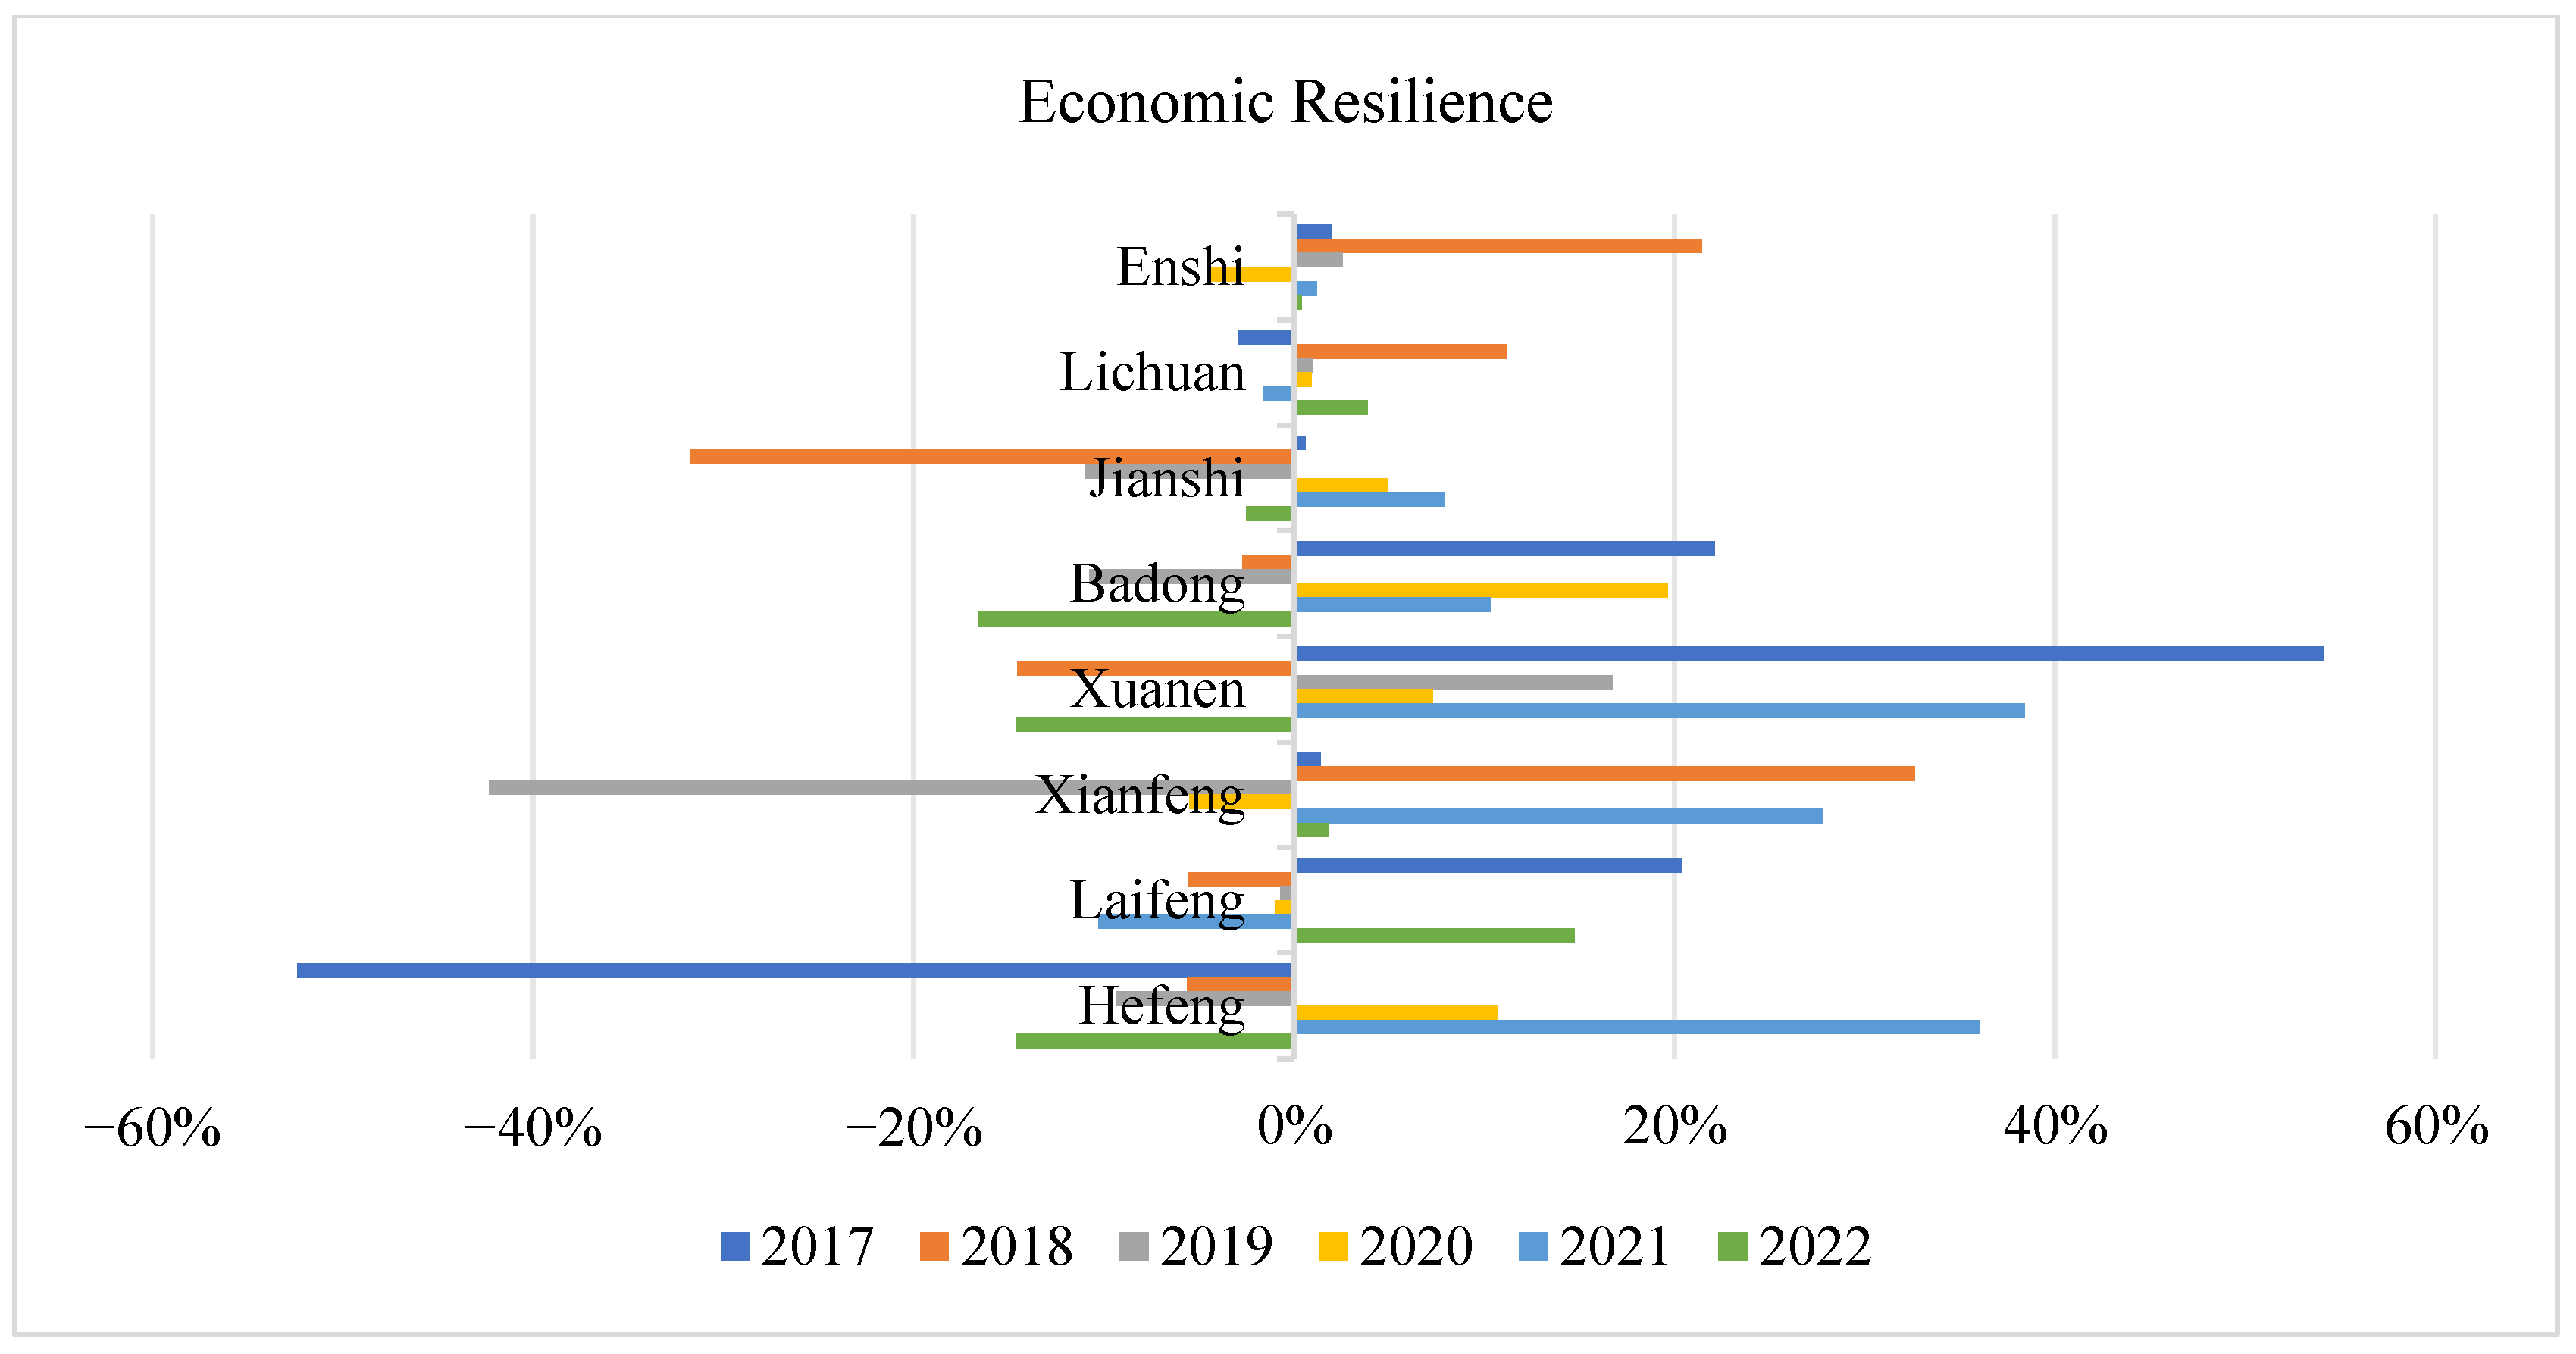
- Across the dimensions of environmental, social support, and economic resilience, Enshi City’s capabilities far exceeded those of other counties, particularly in economic resilience. However, Enshi City saw a significant decline in the capabilities to prevent returning to poverty across all three dimensions in 2020, and other counties also experienced declines in different dimensions in 2020, with the largest decrease in the social support dimension. More notably, the corresponding capabilities of all cities across all dimensions have not recovered to previous levels since 2020, indicating that sudden public crises can cause long-term impacts on the ecological, social, and economic systems of ecologically fragile areas.
- (3)
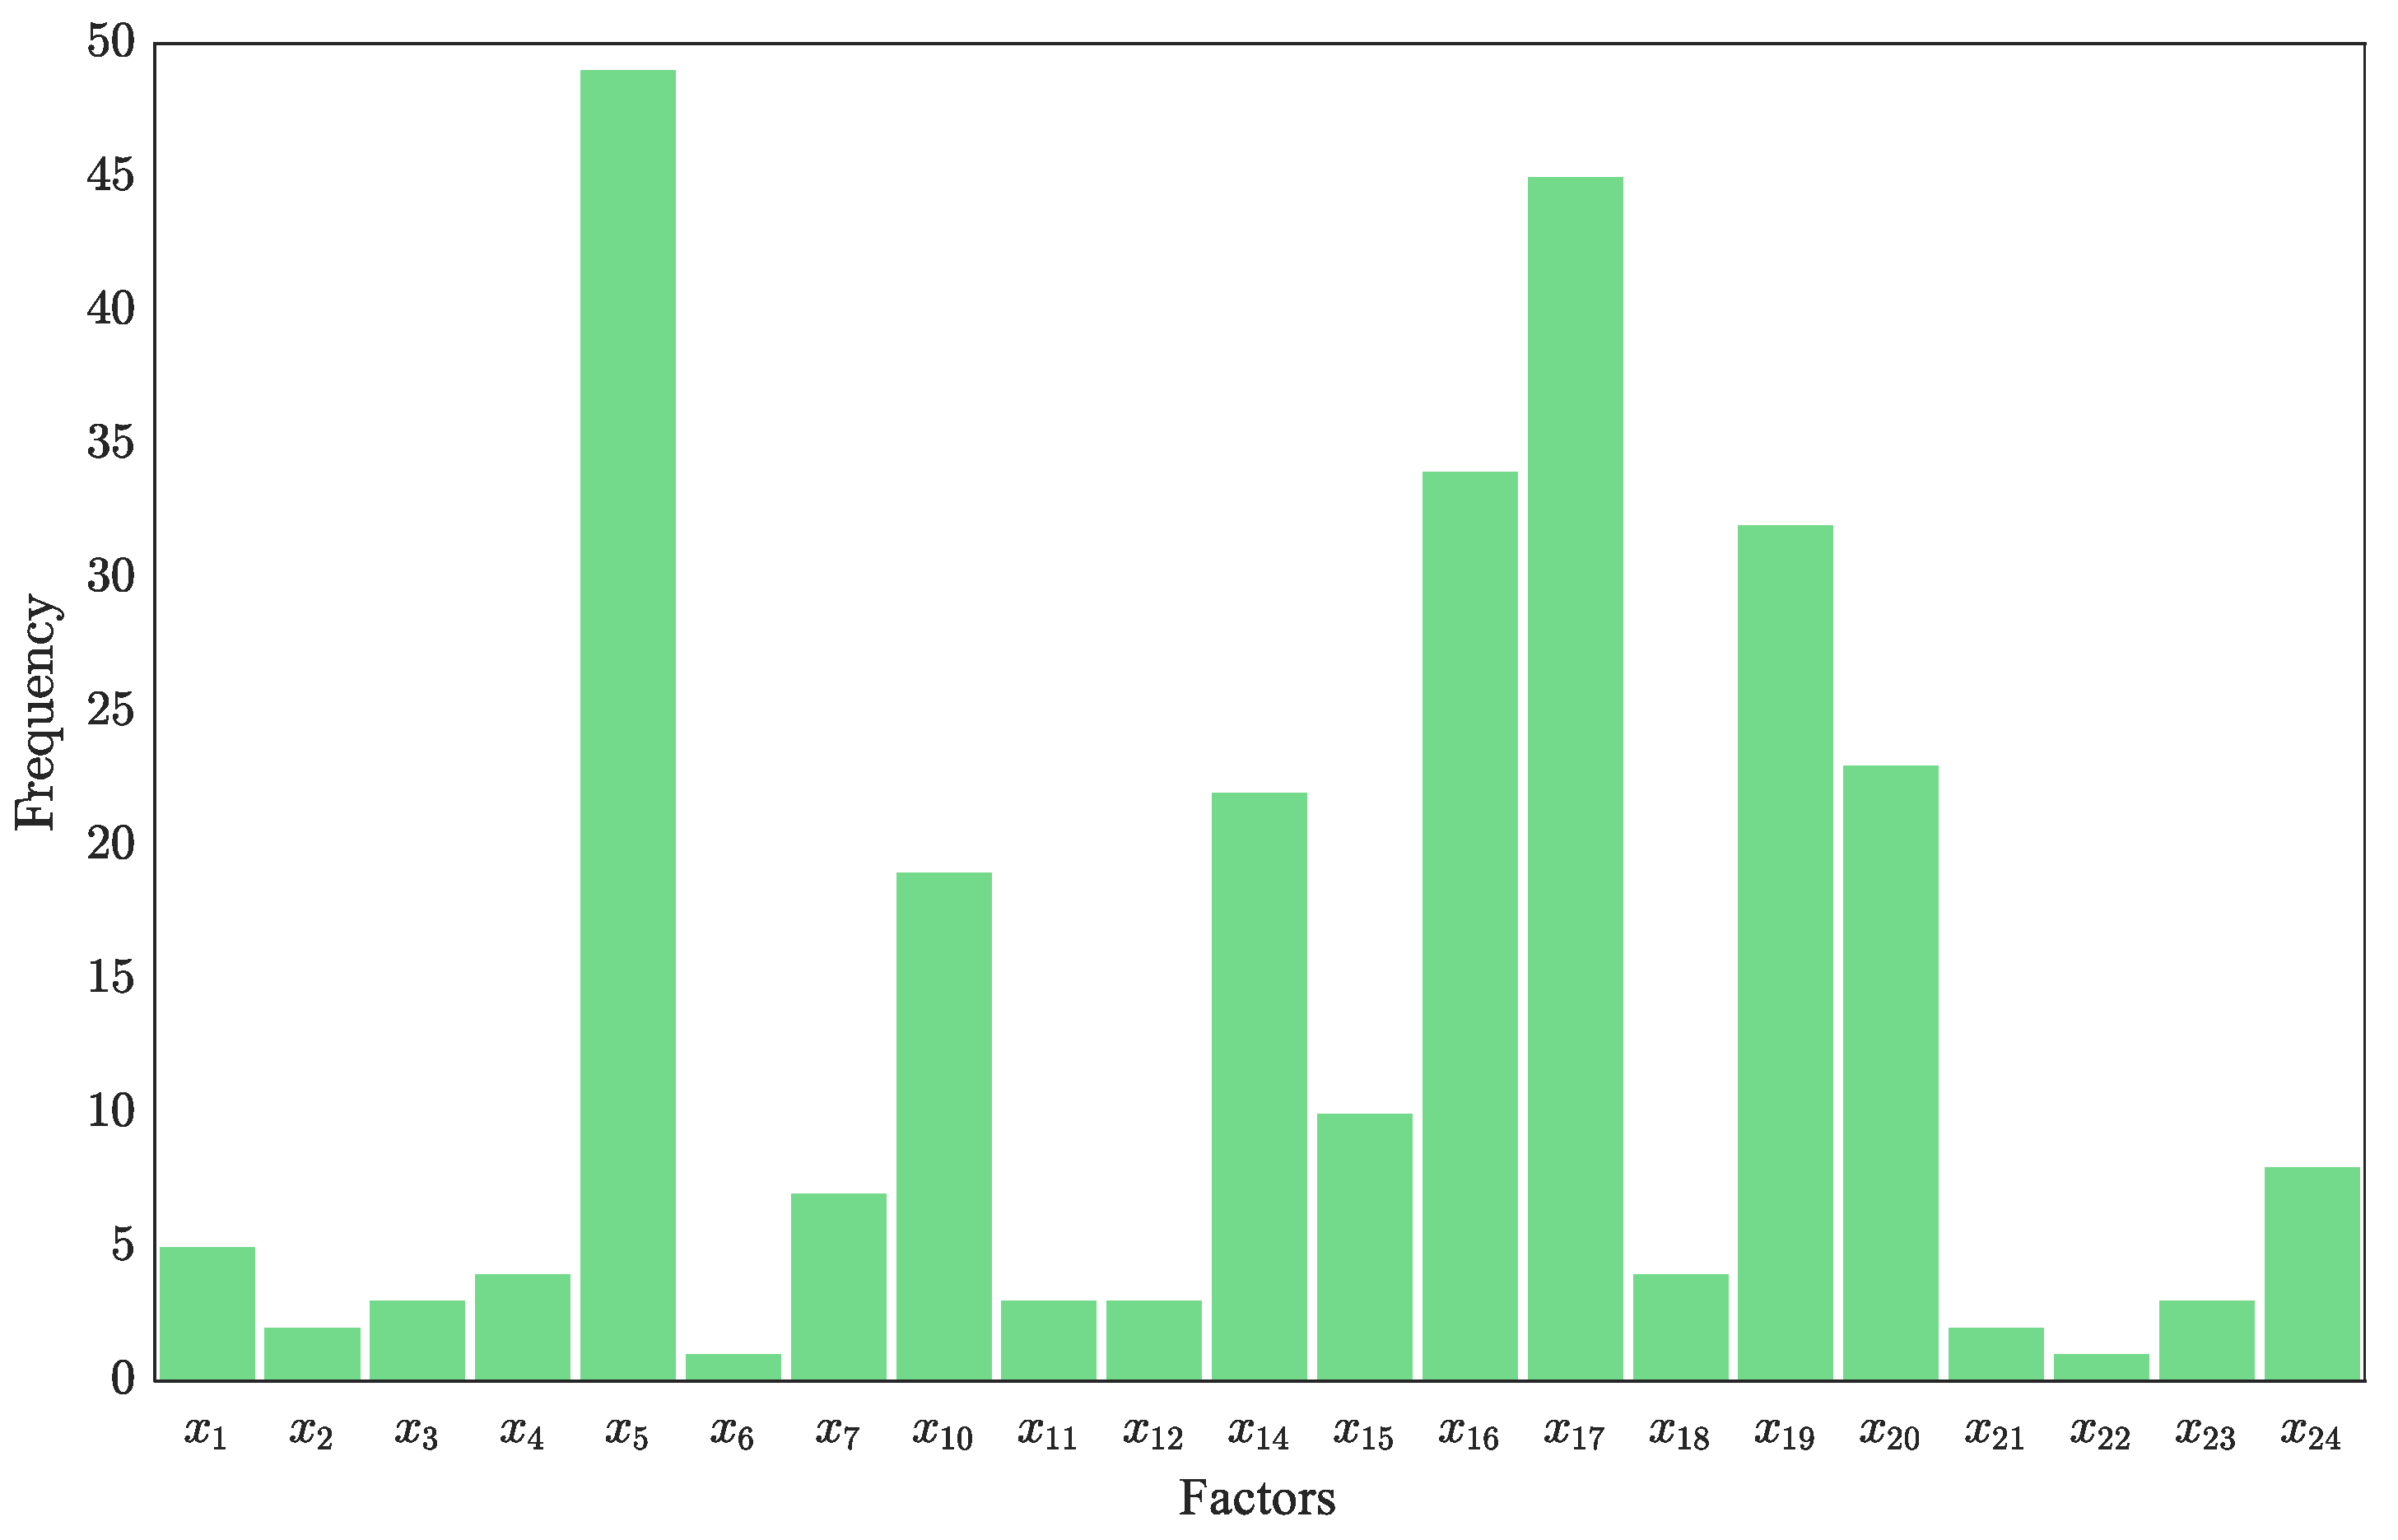
- The analysis results of the obstacle model showed that the factors hindering the enhancement of the capabilities to prevent returning to poverty in Enshi Prefecture came from environmental, social, and economic dimensions. It was also found that factors related to economic resilience remained the most significant barrier to enhancing the capabilities for all counties, consistent with the highest weighting of economic resilience in the evaluation system. The total regional water supply was the most frequently occurring factor among the top five barriers, corresponding to it being the most heavily weighted indicator in the model. Enshi Prefecture needs to strengthen the management of water resources in future development, actively adjust the economic structure, increase economic resilience, and optimize water resource utilization efficiency.
- (4)
- Horizontal and vertical analyses of the barrier factors faced by different counties revealed significant spatial imbalances in environmental management, social public welfare, and economic development among different cities. There was also an imbalance in the development of environmental, social, and economic systems across regions, which cannot develop in coordination. Moreover, the social and economic systems of ecologically vulnerable areas were quite fragile and easily affected by sudden events, and this result is consistent with the comprehensive assessment results of the capabilities to prevent returning to poverty.
6.2. Discussion
6.3. Limitations and Future Research Direction
7. Challenges, Recommendations, and Policy Implications
7.1. Challenges and Recommendations for Enshi Prefecture
7.2. Implications for Policy in Poverty Alleviation
7.3. Suggestions for Ecologically Vulnerable Areas
- (1)
- Adhere to the principles of green and sustainable development, ensure an adequate supply of regional water resources, and improve water resource utilization efficiency.
- (2)
- Strengthen social support measures, improve the monitoring and early-warning mechanisms for poverty relapse, and reduce the threats that emergency public crises and natural disasters pose to the economic and social systems of ecologically vulnerable areas.
- (3)
- Considering the disparities in regional development, leveraging emerging technologies and digital economy strategies can harness ecological resource advantages to foster industries with unique local characteristics.
Author Contributions
Funding
Institutional Review Board Statement
Informed Consent Statement
Data Availability Statement
Conflicts of Interest
References
- Li, H.; Liu, Y.; Zhao, R.; Zhang, X.; Zhang, Z. How Did the Risk of Poverty-Stricken Population Return to Poverty in the Karst Ecologically Fragile Areas Come into Being?—Evidence from China. Land 2022, 11, 1656. [Google Scholar] [CrossRef]
- Chen, Z.; Yang, C. Cognitive-Behavioral Differences Between Officials and Folks in China’s Targeted Poverty Alleviation: An Evolutionary Game Theory Perspective. Front. Psychol. 2022, 13, 916030. [Google Scholar] [CrossRef] [PubMed]
- Zhai, Y.; Zhang, L.; Xing, A. Sustainable Poverty Alleviation Capacity Construction of Farmers in Poverty-Stricken Areas under the Background of Rural Revitalization. PLoS ONE 2022, 17, e0276804. [Google Scholar] [CrossRef] [PubMed]
- Qi, X.; Ye, S.; Xu, Y.; Chen, J. Uneven Dynamics and Regional Disparity of Multidimensional Poverty in China. Soc. Indic. Res. 2021, 159, 169–189. [Google Scholar] [CrossRef]
- Xu, L.D.; Deng, X.Z.; Jiang, Q.; Ma, F.K. Identification and Alleviation Pathways of Multidimensional Poverty and Relative Poverty in Counties of China. J. Geogr. Sci. 2021, 31, 1715–1736. [Google Scholar] [CrossRef]
- Cui, Y.; Liu, X.; Jiang, C.; Tian, R.; Niu, Q. Influencing Factors and Prediction of Risk of Returning to Ecological Poverty in Liupan Mountain Region, China. Chin. Geogr. Sci. 2024, 34, 420–435. [Google Scholar] [CrossRef]
- Huang, C.-C.; Jin, H.; Zhang, J.; Zheng, Q.; Chen, Y.; Cheung, S.; Liu, C. The Effects of an Innovative E-Commerce Poverty Alleviation Platform on Chinese Rural Laborer Skills Development and Family Well-Being. Child. Youth Serv. Rev. 2020, 116, 105189. [Google Scholar] [CrossRef]
- Chang, I.-S.; Liu, H.; Wu, J.; Zhou, C.; Zheng, L. Process Analysis of Poverty Eradication in China: A Case Study on Photovoltaic Projects for Poverty Alleviation. Environ. Impact Assess. Rev. 2021, 90, 106630. [Google Scholar] [CrossRef]
- Yang, Y.; De Sherbinin, A.; Liu, Y. China’s Poverty Alleviation Resettlement: Progress, Problems and Solutions. Habitat. Int. 2020, 98, 102135. [Google Scholar] [CrossRef]
- Wang, S.; Guo, Y.; He, Z. Analysis on the Measurement and Dynamic Evolution of Multidimensional Return to Poverty in Chinese Rural Households. Soc. Indic. Res. 2023, 165, 31–52. [Google Scholar] [CrossRef]
- He, J.; Fu, C.; Li, X.; Ren, F.; Dong, J. What Do We Know about Multidimensional Poverty in China: Its Dynamics, Causes, and Implications for Sustainability. ISPRS Int. J. Geo-Inf. 2023, 12, 78. [Google Scholar] [CrossRef]
- Wang, Y.; Qi, W. Multidimensional Spatiotemporal Evolution Detection on China’s Rural Poverty Alleviation. J. Geogr. Syst. 2021, 23, 63–96. [Google Scholar] [CrossRef]
- Su, J.; Tang, L.; Xiao, P.; Wang, E. Multidimensional Poverty Vulnerability in Rural China. Empir. Econ. 2023, 64, 897–930. [Google Scholar] [CrossRef]
- Dou, H.; Ma, L.; Liu, S.; Fang, F. Identification of Rural Regional Poverty Type Based on Spatial Multi-Criteria Decision-Making—Taking Gansu Province, an Underdeveloped Area in China, as an Example. Environ. Dev. Sustain. 2022, 24, 3439–3460. [Google Scholar] [CrossRef]
- Melnyk, M.; Ivaniuk, U.; Leshchukh, I.; Halkiv, L. The Sustainable Development and Resilience of Socio-Economic System: Conceptualization and Diagnostics of Problems in Conditions of Global Challenges and Shocks. Int. J. Sustain. Dev. Plan. 2023, 18, 1035–1043. [Google Scholar] [CrossRef]
- Rublev, G.; Bogdanova, L.; Kurbatova, S.; Krasnousov, S.; Kolmakov, V. Socio-Economic Model of Sustainable Development. E3S Web Conf. 2021, 244, 10053. [Google Scholar] [CrossRef]
- Li, X.; Gao, Q.; Tang, J. Who Are Identified as Poor in Rural China’s Targeted Poverty Alleviation Strategy? Applying the Multidimensional Capability Approach. J. Chin. Polit. Sci. 2022, 27, 221–246. [Google Scholar] [CrossRef]
- Dhongde, S.; Haveman, R. Spatial and Temporal Trends in Multidimensional Poverty in the United States over the Last Decade. Soc. Indic. Res. 2022, 163, 447–472. [Google Scholar] [CrossRef] [PubMed]
- Lekobane, K.R. Leaving No One Behind: An Individual-Level Approach to Measuring Multidimensional Poverty in Botswana. Soc. Indic. Res. 2022, 162, 179–208. [Google Scholar] [CrossRef]
- Dong, Y.; Jin, G.; Deng, X.; Wu, F. Multidimensional Measurement of Poverty and Its Spatio-Temporal Dynamics in China from the Perspective of Development Geography. J. Geogr. Sci. 2021, 31, 130–148. [Google Scholar] [CrossRef]
- Wang, Z.; Wang, W.; Yu, L.; Zhang, D. Multidimensional Poverty Alleviation Effect of Different Rural Land Consolidation Models: A Case Study of Hubei and Guizhou, China. Land Use Policy 2022, 123, 106399. [Google Scholar] [CrossRef]
- Lu, C. Who Is Poor in China? A Comparison of Alternative Approaches to Poverty Assessment in Rural Yunnan. J. Peasant. Stud. 2010, 37, 407–428. [Google Scholar] [CrossRef]
- Liang, X.; Xiao, H.; Hou, F.; Guo, X.; Li, L.; Huang, L. Breaking the Chains of Poverty: Examining the Influence of Smartphone Usage on Multidimensional Poverty in Rural Settings. Humanit. Soc. Sci. Commun. 2024, 11, 142. [Google Scholar] [CrossRef]
- Li, Y.H.; Jin, Q.H.; Li, A. Understanding the Multidimensional Poverty in South Asia. J. Geogr. Sci. 2022, 32, 2053–2068. [Google Scholar] [CrossRef]
- Xiang, M.; Yang, J.; Han, S.; Liu, Y.; Wang, C.; Wei, F. Spatial Coupling Relationship between Multidimensional Poverty and the Risk of Geological Disaster. Local Environ. 2023, 28, 662–680. [Google Scholar] [CrossRef]
- Zhou, D.; Cai, K.; Zhong, S. A Statistical Measurement of Poverty Reduction Effectiveness: Using China as an Example. Soc. Indic. Res. 2021, 153, 39–64. [Google Scholar] [CrossRef]
- Xu, Z.; Cai, Z.; Wu, S.; Huang, X.; Liu, J.; Sun, J.; Su, S.; Weng, M. Identifying the Geographic Indicators of Poverty Using Geographically Weighted Regression: A Case Study from Qiandongnan Miao and Dong Autonomous Prefecture, Guizhou, China. Soc. Indic. Res. 2019, 142, 947–970. [Google Scholar] [CrossRef]
- Mohanty, S.K.; Rasul, G.; Mahapatra, B.; Choudhury, D.; Tuladhar, S.; Valdemar Holmgren, E. Multidimensional Poverty in Mountainous Regions: Shan and Chin in Myanmar. Soc. Indic. Res. 2018, 138, 23–44. [Google Scholar] [CrossRef]
- Xue, E.; Zhou, X. Education and Anti-Poverty: Policy Theory and Strategy of Poverty Alleviation through Education in China. Educ. Philos. Theory 2018, 50, 1101–1112. [Google Scholar] [CrossRef]
- Liu, W.; Li, J.; Zhao, R. The Effects of Rural Education on Poverty in China: A Spatial Econometric Perspective. J. Asia Pac. Econ. 2023, 28, 176–198. [Google Scholar] [CrossRef]
- Zhang, A.; Imai, K.S. Do Public Pension Programmes Reduce Elderly Poverty in China? Rev. Dev. Econ. 2024, 28, 3–33. [Google Scholar] [CrossRef]
- Zhou, L.; Zhu, C.; Walsh, C.A.; Zhang, X. Assessing the Effect of Health Status on Multidimensional Poverty among Older Adults: The Chinese Longitudinal Healthy Longevity Survey. Front. Public Health 2023, 11, 1150344. [Google Scholar] [CrossRef] [PubMed]
- Li, C.; Zhang, X. A Moderated Mediation Model of the Relationship Between Multidimensional Poverty and Psychological Consequences of Left-Behind Children. Int. J. Ment. Health Addict. 2023, 1–21. [Google Scholar] [CrossRef]
- Zhou, Y.; Guo, Y.; Liu, Y.; Wu, W.; Li, Y. Targeted Poverty Alleviation and Land Policy Innovation: Some Practice and Policy Implications from China. Land Use Rural Sustain. China 2018, 74, 53–65. [Google Scholar] [CrossRef]
- Li, C.; Guo, M.; Li, S.; Feldman, M. The Impact of the Anti-Poverty Relocation and Settlement Program on Rural Households’ Well-Being and Ecosystem Dependence: Evidence from Western China. Soc. Nat. Resour. 2021, 34, 40–59. [Google Scholar] [CrossRef]
- Rogers, S.; Li, J.; Lo, K.; Guo, H.; Li, C. China’s Rapidly Evolving Practice of Poverty Resettlement: Moving Millions to Eliminate Poverty. Dev. Policy Rev. 2020, 38, 541–554. [Google Scholar] [CrossRef]
- Liu, M.; Feng, X.; Zhao, Y.; Qiu, H. Impact of Poverty Alleviation through Relocation: From the Perspectives of Income and Multidimensional Poverty. J. Rural Stud. 2023, 99, 35–44. [Google Scholar] [CrossRef]
- Wang, H.; Huang, W.; Wang, S.; Zhou, Y. Has the Largest-Scale Poverty Alleviation Relocation in Human History Promoted Urbanization? An Empirical Analysis from China. Appl. Econ. 2023, 1–13. [Google Scholar] [CrossRef]
- Zhang, H.; Xu, Z.; Wu, K.; Zhou, D.; Wei, G. Multi-Dimensional Poverty Measurement for Photovoltaic Poverty Alleviation Areas: Evidence from Pilot Counties in China. J. Clean. Prod. 2019, 241, 118382. [Google Scholar] [CrossRef]
- He, J.; Ren, F.; Weibel, R.; Fu, C. The Effect of Large Scale Photovoltaic-Based Projects on Poverty Reduction: Empirical Evidence from China. Renew. Energy 2023, 218, 119294. [Google Scholar] [CrossRef]
- Ren, Z.P.; Ge, Y.; Wang, J.F.; Mao, J.Y.; Zhang, Q. Understanding the Inconsistent Relationships between Socioeconomic Factors and Poverty Incidence across Contiguous Poverty-Stricken Regions in China: Multilevel Modelling. Spat. Stat. 2017, 21, 406–420. [Google Scholar] [CrossRef]
- Chen, J.; Rong, S.; Song, M. Poverty Vulnerability and Poverty Causes in Rural China. Soc. Indic. Res. 2020, 153, 65–91. [Google Scholar] [CrossRef]
- Ullah, A.; Kui, Z.; Ullah, S.; Pinglu, C.; Khan, S. Sustainable Utilization of Financial and Institutional Resources in Reducing Income Inequality and Poverty. Sustainability 2021, 13, 1038. [Google Scholar] [CrossRef]
- Wan, L.; Wan, M. Measure on Factors of Poverty-Stricken Households Return to Poverty and Risk Mitigation Path. Stat. Decis. 2021, 37, 10–14. [Google Scholar] [CrossRef]
- Yue, W.; Wang, X.; Zhang, Q. Health Risk, Medical Insurance and Household Financial Vulnerability. China Ind. Econ. 2021, 39, 175–192. [Google Scholar] [CrossRef]
- Pasovets, Y.M. Risks of Poverty in the Modern Russian Conditions. Econ. Soc. Changes Facts Trends Forecast 2015, 38, 143–203. [Google Scholar] [CrossRef]
- Alexander, J.T.; Andersen, R.; Cookson, P.W.; Edin, K.; Fisher, J.; Grusky, D.B.; Mattingly, M.; Varner, C. A Qualitative Census of Rural and Urban Poverty. Ann. Am. Acad. Pol. Soc. Sci. 2017, 672, 143–161. [Google Scholar] [CrossRef]
- Azeem, M.M.; Mugera, A.W.; Schilizzi, S.; Siddique, K.H.M. An Assessment of Vulnerability to Poverty in Punjab, Pakistan: Subjective Choices of Poverty Indicators. Soc. Indic. Res. 2017, 134, 117–152. [Google Scholar] [CrossRef]
- Wan, G.H.; Hu, X.S.; Liu, W.Q. China’s Poverty Reduction Miracle and Relative Poverty: Focusing on the Roles of Growth and Inequality. China Econ. Rev. 2021, 68, 101643. [Google Scholar] [CrossRef]
- Wang, X.Q.; Liu, J.A.; Yao, S.J.; Xin, X.A. China’s Rural Poverty Line and the Determinants of Rural Poverty. China Agric. Econ. Rev. 2009, 1, 283–300. [Google Scholar] [CrossRef]
- Liu, Y.L.; Zhu, K.; Chen, Q.Y.; Li, J.; Cai, J.; He, T.; Liao, H.P. Impact of the COVID-19 Pandemic on Farm Households’ Vulnerability to Multidimensional Poverty in Rural China. Sustainability 2021, 13, 1842. [Google Scholar] [CrossRef]
- Lu, J.; Zhang, M.; Zhang, J.; Xu, C.; Cheng, B. Can Health Poverty Alleviation Project Reduce the Economic Vulnerability of Poor Households? Evidence from Chifeng City, China. Comput. Ind. Eng. 2021, 162, 107762. [Google Scholar] [CrossRef]
- Xu, X.; Yang, H. Elderly Chronic Diseases and Catastrophic Health Expenditure: An Important Cause of Borderline Poor Families’ Return to Poverty in Rural China. Humanit. Soc. Sci. Commun. 2022, 9, 291. [Google Scholar] [CrossRef]
- Ma, Y.; Xiang, Q.; Yan, C.; Liao, H.; Wang, J. Poverty Vulnerability and Health Risk Action Path of Families of Rural Elderly With Chronic Diseases: Empirical Analysis of 1,852 Families in Central and Western China. Front. Public Health 2022, 10, 776901. [Google Scholar] [CrossRef]
- Pacas, J.D.; Rothwell, D.W. Why Is Poverty Higher in Rural America According to the Supplemental Poverty Measure? An Investigation of the Geographic Adjustment. Popul. Res. Policy Rev. 2020, 39, 941–975. [Google Scholar] [CrossRef]
- Zhou, Y.; Liu, Y.S. The Geography of Poverty: Review and Research Prospects. J. Rural Stud. 2022, 93, 408–416. [Google Scholar] [CrossRef]
- Ding, J.; Wang, Z.; Liu, Y.; Yu, F. Measurement of Economic Resilience of Contiguous Poverty-Stricken Areas in China and Influencing Factor Analysis. Prog. Geogr. 2020, 39, 924–937. [Google Scholar] [CrossRef]
- Li, Q.; Sun, P.; Li, B.; Mohiuddin, M. Impact of Climate Change on Rural Poverty Vulnerability from an Income Source Perspective: A Study Based on CHIPS2013 and County-Level Temperature Data in China. Int. J. Environ. Res. Public Health 2022, 19, 3328. [Google Scholar] [CrossRef] [PubMed]
- Wang, Y.; Zhao, J.; Yao, R.; Zhao, R.; Li, Y. Risk of Poverty Returning to the Tibetan Area of Gansu Province in China. Sustainability 2022, 14, 11268. [Google Scholar] [CrossRef]
- Tian, L.; Liu, L. Tourism Driven Regional Poverty Return: Connotation, Path and Interruptions. Huxiang Forum 2021, 34, 86–92. [Google Scholar] [CrossRef]
- Wang, K.; Gan, C.; Chen, L.; Voda, M. Poor Residents’ Perceptions of the Impacts of Tourism on Poverty Alleviation: From the Perspective of Multidimensional Poverty. Sustainability 2020, 12, 7515. [Google Scholar] [CrossRef]
- Liu, Y.S.; Liu, J.L.; Zhou, Y. Spatio-Temporal Patterns of Rural Poverty in China and Targeted Poverty Alleviation Strategies. J. Rural Stud. 2017, 52, 66–75. [Google Scholar] [CrossRef]
- Xiong, M.; Li, W.; Teo, B.S.X.; Othman, J. Can China’s Digital Inclusive Finance Alleviate Rural Poverty? An Empirical Analysis from the Perspective of Regional Economic Development and an Income Gap. Sustainability 2022, 14, 16984. [Google Scholar] [CrossRef]
- Wang, F.; Zhang, X.; Ye, C.; Cai, Q. The Household Multidimensional Poverty Reduction Effects of Digital Financial Inclusion: A Financial Environment Perspective. Soc. Indic. Res. 2024, 172, 313–345. [Google Scholar] [CrossRef]
- Jia, H.; Chen, F.; Pan, D.; Zhang, C. The Impact of Earthquake on Poverty: Learning from the 12 May 2008 Wenchuan Earthquake. Sustainability 2018, 10, 4704. [Google Scholar] [CrossRef]
- Zeng, H.; Xiao, X. The Study on Rural Vocational Education to Keep Within Limits of Poverty in the Era of Post Poverty. In Proceedings of the 2018 4th International Conference on Social Science and Higher Education (ICSSHE 2018), Sanya, China, 28–30 September 2018; Xiao, X., Hauer, T., Khan, S., Eds.; Springer: Berlin/Heidelberg, Germany, 2018; Volume 181, pp. 317–320. [Google Scholar]
- Alkire, S.; Fang, Y. Dynamics of Multidimensional Poverty and Uni-Dimensional Income Poverty: An Evidence of Stability Analysis from China. Soc. Indic. Res. 2019, 142, 25–64. [Google Scholar] [CrossRef]
- Guo, X.; Li, X.; Li, L.; Wang, X. Impact of Social Integration and Government Support on Ecological Immigrants’ Vulnerability to Poverty. Environ. Ecol. Stat. 2023, 30, 61–79. [Google Scholar] [CrossRef]
- Enshi Prefecture Bureau of Statistics 2022 National Economic and Social Development Statistical Bulletin of Enshi Prefecture. Available online: http://www.enshi.gov.cn/sj/qztjgb/202304/t20230411_1423791.shtml (accessed on 1 June 2024).
- Wang, H.; Bai, K.; Wang, H.; Rafiqul, I. Research on the Motivation Mechanism of Precise Poverty Alleviation in Rural Tourism in China. Sustainability 2022, 14, 14328. [Google Scholar] [CrossRef]
- Li, H.; Ai, X.; Song, H.; He, Y.; Zeng, X.; Su, J. Policy of Government Subsidy for Supply Chain with Poverty Alleviation. Sustainability 2022, 14, 12808. [Google Scholar] [CrossRef]
- Zhou, Y.; Huang, H. Geo-Environmental and Socioeconomic Determinants of Poverty in China: An Empirical Analysis Based on Stratified Poverty Theory. Environ. Sci. Pollut. Res. Int. 2022, 30, 23836–23850. [Google Scholar] [CrossRef]
- Holm, J.R.; Østergaard, C.R. Regional Employment Growth, Shocks and Regional Industrial Resilience: A Quantitative Analysis of the Danish ICT Sector. Reg. Stud. 2015, 49, 95–112. [Google Scholar] [CrossRef]
- Mushongera, D.; Zikhali, P.; Ngwenya, P. A Multidimensional Poverty Index for Gauteng Province, South Africa: Evidence from Quality of Life Survey Data. Soc. Indic. Res. 2017, 130, 277–303. [Google Scholar] [CrossRef]
- Yang, F.; Paudel, K.; Zhuang, T.H.; Jiang, Y. Multidimensional Poverty of the Ethnic Tibetan Farm and Herder Households in Gansu Province, China. Cienc. Rural 2019, 49, e20180559. [Google Scholar] [CrossRef]
- Li, Y.; Su, B.; Liu, Y. Realizing Targeted Poverty Alleviation in China People’s Voices, Implementation Challenges and Policy Implications. CHINA Agric. Econ. Rev. 2016, 8, 443–454. [Google Scholar] [CrossRef]
- Bao, C.; Zou, J. Evaluation of Water Resource Security Patterns in the Bejjing-Tianjin-Hebei Urban Agglomeration Based on Human-Water Relationships. Acta Ecol. Sin. 2018, 38, 4180–4191. [Google Scholar]
- Yang, Y.; Feng, Z.; Feng, Z.; Sun, T.; Tang, Z. Water Resources Endowment and Exploitation and Utilization of Countries along the Belt and Road. J. Nat. Resour. 2019, 34, 1146–1156. [Google Scholar] [CrossRef]
- Shuai, J.; Liu, J.; Cheng, J.; Cheng, X.; Wang, J. Interaction between Ecosystem Services and Rural Poverty Reduction: Evidence from China. Environ. Sci. Policy 2021, 119, 1–11. [Google Scholar] [CrossRef]
- Mu, L.; Liu, Y.; Chen, S. Alleviating Water Scarcity and Poverty through Water Rights Trading Pilot Policy: A Quasi-Natural Experiment Based Approach. Sci. Total Environ. 2022, 823, 153318. [Google Scholar] [CrossRef] [PubMed]
- Li, T.; Cao, X.; Qiu, M.; Li, Y. Exploring the Spatial Determinants of Rural Poverty in the Interprovincial Border Areas of the Loess Plateau in China: A Village-Level Analysis Using Geographically Weighted Regression. ISPRS Int. J. Geo-Inf. 2020, 9, 345. [Google Scholar] [CrossRef]
- Fischer, C.; Aubron, C.; Trouvé, A.; Sekhar, M.; Ruiz, L. Groundwater Irrigation Reduces Overall Poverty but Increases Socioeconomic Vulnerability in a Semiarid Region of Southern India. Sci. Rep. 2022, 12, 8850. [Google Scholar] [CrossRef]
- Yang, H.; Luo, Q.; Li, X.; Gao, G. Multidimensional Poverty Measurement and Influencing Factor Analysis at the Households Scale of the Ecological Sensitive Area: A Case Study on Three Villages of Xichuan County in Henan Province. Econ. Geogr. 2016, 10, 137–144. [Google Scholar]
- Xue, J. Research on the Impact of High-Tech Industry Development on Regional Economic Growth. Ind. Eng. Innov. Manag. 2023, 6, 6–10. [Google Scholar] [CrossRef]
- Ge, Y.; Liu, M.; Hu, S.; Wang, D.; Wang, J.; Wang, X.; Qader, S.; Cleary, E.; Tatem, A.J.; Lai, S. Who and Which Regions Are at High Risk of Returning to Poverty during the COVID-19 Pandemic? Humanit. Soc. Sci. Commun. 2022, 9, 183. [Google Scholar] [CrossRef]


| County (City) | 2016 | 2017 | 2018 | 2019 | 2020 | 2021 | 2022 |
|---|---|---|---|---|---|---|---|
| Enshi | 0.5049 | 0.5547 | 0.6098 | 0.7663 | 0.7381 | 0.8058 | 0.8449 |
| Lichuan | 0.3512 | 0.3810 | 0.4061 | 0.4755 | 0.4655 | 0.5079 | 0.5504 |
| Jianshi | 0.2333 | 0.2378 | 0.2409 | 0.2594 | 0.2547 | 0.2894 | 0.3312 |
| Badong | 0.1800 | 0.2160 | 0.2352 | 0.2581 | 0.2580 | 0.2996 | 0.3362 |
| Xuanen | 0.1762 | 0.1762 | 0.1874 | 0.2127 | 0.2372 | 0.2692 | 0.3107 |
| Xianfeng | 0.1824 | 0.1738 | 0.2009 | 0.2154 | 0.2112 | 0.2431 | 0.2713 |
| Laifeng | 0.1598 | 0.1762 | 0.1821 | 0.2185 | 0.2199 | 0.2449 | 0.2749 |
| Hefeng | 0.1487 | 0.1516 | 0.1863 | 0.1931 | 0.1967 | 0.2265 | 0.2802 |
| County (City) | 2016 | 2017 | 2018 | 2019 | 2020 | 2021 | 2022 |
|---|---|---|---|---|---|---|---|
| Environment | |||||||
| Enshi | 0.6588 | 0.6818 | 0.7226 | 0.7725 | 0.7408 | 0.7144 | 0.7590 |
| Lichuan | 0.3993 | 0.4677 | 0.4234 | 0.4398 | 0.4715 | 0.4954 | 0.4401 |
| Jianshi | 0.3017 | 0.1864 | 0.1647 | 0.1415 | 0.2128 | 0.2459 | 0.2283 |
| Badong | 0.1765 | 0.2066 | 0.1925 | 0.1684 | 0.2000 | 0.2549 | 0.2284 |
| Xuanen | 0.4235 | 0.3289 | 0.2947 | 0.2719 | 0.2987 | 0.3194 | 0.2841 |
| Xianfeng | 0.3395 | 0.2846 | 0.1870 | 0.1476 | 0.1798 | 0.2560 | 0.2416 |
| Laifeng | 0.2062 | 0.2160 | 0.1703 | 0.1828 | 0.2146 | 0.2727 | 0.2574 |
| Hefeng | 0.3405 | 0.2695 | 0.2913 | 0.2373 | 0.2678 | 0.2859 | 0.2646 |
| Social Support | |||||||
| Enshi | 0.8102 | 0.8017 | 0.8441 | 0.8728 | 0.8030 | 0.8152 | 0.8107 |
| Lichuan | 0.6163 | 0.6747 | 0.6414 | 0.6291 | 0.5865 | 0.5942 | 0.5921 |
| Jianshi | 0.3016 | 0.3815 | 0.3529 | 0.3177 | 0.2658 | 0.2927 | 0.3048 |
| Badong | 0.2817 | 0.3362 | 0.3123 | 0.2832 | 0.2997 | 0.3295 | 0.3189 |
| Xuanen | 0.2147 | 0.1472 | 0.1529 | 0.1900 | 0.2431 | 0.3271 | 0.2596 |
| Xianfeng | 0.3288 | 0.2070 | 0.2476 | 0.2513 | 0.2174 | 0.2365 | 0.2173 |
| Laifeng | 0.2149 | 0.1780 | 0.1839 | 0.1578 | 0.2290 | 0.2054 | 0.1584 |
| Hefeng | 0.1268 | 0.1124 | 0.1149 | 0.1119 | 0.1148 | 0.1256 | 0.1225 |
| Economic Resilience | |||||||
| Enshi | 0.7600 | 0.7749 | 0.9411 | 0.9650 | 0.9207 | 0.9318 | 0.9354 |
| Lichuan | 0.4423 | 0.4292 | 0.4772 | 0.4818 | 0.4862 | 0.4784 | 0.4970 |
| Jianshi | 0.3717 | 0.3738 | 0.2553 | 0.2273 | 0.2384 | 0.2573 | 0.2508 |
| Badong | 0.2221 | 0.2712 | 0.2638 | 0.2354 | 0.2816 | 0.3106 | 0.2592 |
| Xuanen | 0.0908 | 0.1400 | 0.1196 | 0.1396 | 0.1498 | 0.2073 | 0.1771 |
| Xianfeng | 0.1552 | 0.1573 | 0.2086 | 0.1204 | 0.1138 | 0.1454 | 0.1480 |
| Laifeng | 0.2030 | 0.2443 | 0.2308 | 0.2292 | 0.2270 | 0.2037 | 0.2337 |
| Hefeng | 0.3320 | 0.1582 | 0.1493 | 0.1353 | 0.1498 | 0.2038 | 0.1740 |
| Enshi | Lichuan | Jianshi | Badong | Xuanen | Xianfeng | Laifeng | Hefeng | ||
|---|---|---|---|---|---|---|---|---|---|
| 2016 | Environmental Factors | 37.19% | 31.35% | 25.27% | 27.01% | 15.21% | 20.35% | 26.74% | 19.16% |
| Social Support | 22.62% | 17.98% | 34.40% | 29.13% | 33.40% | 27.76% | 31.90% | 36.59% | |
| Economic Resilience | 40.19% | 50.66% | 40.33% | 43.86% | 51.40% | 51.89% | 41.35% | 44.24% | |
| 2017 | Environmental Factors | 37.05% | 24.97% | 27.00% | 23.39% | 16.98% | 19.39% | 23.39% | 18.25% |
| Social Support | 25.91% | 17.21% | 33.26% | 33.33% | 37.51% | 35.26% | 36.79% | 38.09% | |
| Economic Resilience | 37.04% | 57.82% | 39.75% | 43.28% | 45.51% | 45.35% | 39.83% | 43.66% | |
| 2018 | Environmental Factors | 49.33% | 28.91% | 25.03% | 23.39% | 17.25% | 22.01% | 21.49% | 16.19% |
| Social Support | 30.71% | 22.09% | 33.28% | 35.40% | 38.45% | 35.76% | 37.32% | 44.05% | |
| Economic Resilience | 19.96% | 48.99% | 41.69% | 41.21% | 44.31% | 42.23% | 41.19% | 39.77% | |
| 2019 | Environmental Factors | 51.53% | 22.13% | 21.84% | 21.44% | 16.07% | 19.65% | 20.17% | 14.71% |
| Social Support | 28.58% | 30.09% | 37.61% | 36.30% | 37.06% | 33.61% | 40.52% | 43.08% | |
| Economic Resilience | 19.89% | 47.78% | 40.56% | 42.27% | 46.86% | 46.74% | 39.31% | 42.21% | |
| 2020 | Environmental Factors | 48.71% | 21.06% | 19.84% | 20.17% | 16.36% | 18.81% | 19.75% | 13.14% |
| Social Support | 39.41% | 35.10% | 38.97% | 38.20% | 35.82% | 36.54% | 38.35% | 45.18% | |
| Economic Resilience | 11.88% | 43.84% | 41.19% | 41.63% | 47.82% | 44.64% | 41.90% | 41.68% | |
| 2021 | Environmental Factors | 63.97% | 23.45% | 24.74% | 16.53% | 17.97% | 16.46% | 19.24% | 14.13% |
| Social Support | 21.98% | 28.79% | 35.84% | 37.60% | 35.80% | 39.14% | 39.50% | 45.63% | |
| Economic Resilience | 14.04% | 47.76% | 39.41% | 45.87% | 46.23% | 44.40% | 41.27% | 40.23% | |
| 2022 | Environmental Factors | 51.37% | 21.40% | 23.35% | 17.11% | 15.99% | 17.39% | 18.18% | 13.54% |
| Social Support | 32.08% | 31.44% | 34.68% | 36.61% | 36.05% | 38.21% | 41.19% | 44.80% | |
| Economic Resilience | 16.55% | 47.16% | 41.97% | 46.29% | 47.95% | 44.40% | 40.63% | 41.66% |
| County (City) | Year | Obstacle Degree Rank | |||||||||
|---|---|---|---|---|---|---|---|---|---|---|---|
| 1 | 2 | 3 | 4 | 5 | |||||||
| Enshi | 2016 | 14.32% | 13.89% | 12.70% | 11.77% | 11.72% | |||||
| 2017 | 16.33% | 13.87% | 10.61% | 9.35% | 8.28% | ||||||
| 2018 | 22.12% | 16.26% | 14.84% | 9.44% | 9.03% | ||||||
| 2019 | 20.07% | 19.12% | 18.50% | 12.33% | 7.36% | ||||||
| 2020 | 28.45% | 14.21% | 14.08% | 9.08% | 8.45% | ||||||
| 2021 | 13.17% | 11.12% | 10.79% | 10.24% | 9.95% | ||||||
| 2022 | 21.01% | 14.66% | 10.18% | 9.58% | 8.85% | ||||||
| Lichuan | 2016 | 11.99% | 11.97% | 8.30% | 6.64% | 6.40% | |||||
| 2017 | 12.71% | 12.57% | 9.96% | 7.75% | 7.05% | ||||||
| 2018 | 13.60% | 10.87% | 9.25% | 7.99% | 7.77% | ||||||
| 2019 | 12.52% | 8.80% | 8.77% | 8.42% | 8.41% | ||||||
| 2020 | 11.47% | 10.76% | 9.92% | 7.76% | 7.35% | ||||||
| 2021 | 12.32% | 9.56% | 8.72% | 8.38% | 8.22% | ||||||
| 2022 | 10.34% | 9.54% | 9.07% | 8.71% | 8.62% | ||||||
| Jianshi | 2016 | 13.49% | 8.18% | 7.83% | 7.32% | 6.46% | |||||
| 2017 | 13.56% | 8.11% | 7.14% | 7.01% | 6.54% | ||||||
| 2018 | 12.78% | 7.47% | 7.32% | 7.22% | 6.77% | ||||||
| 2019 | 12.83% | 8.07% | 7.34% | 6.64% | 6.46% | ||||||
| 2020 | 10.12% | 8.96% | 7.38% | 7.37% | 6.93% | ||||||
| 2021 | 8.80% | 8.74% | 8.02% | 7.92% | 7.83% | ||||||
| 2022 | 9.31% | 8.88% | 8.59% | 8.49% | 7.32% | ||||||
| Badong | 2016 | 10.51% | 7.43% | 6.48% | 6.47% | 6.24% | |||||
| 2017 | 12.00% | 9.25% | 7.32% | 6.79% | 6.36% | ||||||
| 2018 | 12.66% | 8.30% | 7.21% | 7.14% | 7.02% | ||||||
| 2019 | 11.92% | 7.34% | 7.25% | 7.05% | 6.83% | ||||||
| 2020 | 10.84% | 7.75% | 7.35% | 7.11% | 6.93% | ||||||
| 2021 | 10.62% | 9.59% | 8.94% | 8.39% | 7.64% | ||||||
| 2022 | 9.79% | 8.61% | 8.48% | 8.37% | 7.30% | ||||||
| Xuanen | 2016 | 13.16% | 9.29% | 8.72% | 7.87% | 7.41% | |||||
| 2017 | 12.16% | 8.12% | 7.40% | 7.20% | 6.86% | ||||||
| 2018 | 11.63% | 7.99% | 7.90% | 7.64% | 7.28% | ||||||
| 2019 | 11.17% | 8.05% | 7.49% | 7.29% | 7.15% | ||||||
| 2020 | 10.53% | 9.42% | 8.03% | 7.98% | 7.73% | ||||||
| 2021 | 9.33% | 9.23% | 9.15% | 8.63% | 8.51% | ||||||
| 2022 | 9.71% | 9.70% | 9.44% | 9.42% | 8.01% | ||||||
| Xianfeng | 2016 | 12.66% | 8.44% | 7.81% | 7.79% | 6.96% | |||||
| 2017 | 11.36% | 8.67% | 7.00% | 6.78% | 6.54% | ||||||
| 2018 | 12.14% | 8.07% | 7.62% | 6.98% | 6.88% | ||||||
| 2019 | 11.79% | 8.10% | 7.67% | 7.17% | 6.60% | ||||||
| 2020 | 10.34% | 8.79% | 7.72% | 7.54% | 7.28% | ||||||
| 2021 | 9.53% | 9.51% | 8.66% | 8.65% | 7.39% | ||||||
| 2022 | 9.85% | 9.63% | 9.09% | 8.44% | 6.96% | ||||||
| Laifeng | 2016 | 11.55% | 8.66% | 7.52% | 7.38% | 6.06% | |||||
| 2017 | 11.63% | 7.49% | 7.28% | 7.27% | 7.18% | ||||||
| 2018 | 11.26% | 7.78% | 7.57% | 7.36% | 6.77% | ||||||
| 2019 | 11.02% | 8.12% | 7.75% | 7.56% | 7.30% | ||||||
| 2020 | 10.26% | 9.81% | 8.35% | 8.35% | 8.14% | ||||||
| 2021 | 9.89% | 9.32% | 8.98% | 8.97% | 8.68% | ||||||
| 2022 | 9.79% | 9.25% | 8.88% | 8.33% | 7.99% | ||||||
| Hefeng | 2016 | 12.23% | 8.30% | 7.88% | 6.87% | 6.66% | |||||
| 2017 | 11.83% | 8.50% | 7.95% | 7.37% | 7.16% | ||||||
| 2018 | 12.94% | 8.82% | 8.74% | 8.59% | 7.83% | ||||||
| 2019 | 11.78% | 8.51% | 7.96% | 7.31% | 7.22% | ||||||
| 2020 | 10.99% | 9.33% | 8.56% | 8.46% | 7.73% | ||||||
| 2021 | 9.92% | 9.85% | 9.79% | 9.24% | 8.10% | ||||||
| 2022 | 10.07% | 9.99% | 9.72% | 9.70% | 8.06% | ||||||
Disclaimer/Publisher’s Note: The statements, opinions and data contained in all publications are solely those of the individual author(s) and contributor(s) and not of MDPI and/or the editor(s). MDPI and/or the editor(s) disclaim responsibility for any injury to people or property resulting from any ideas, methods, instructions or products referred to in the content. |
© 2024 by the authors. Licensee MDPI, Basel, Switzerland. This article is an open access article distributed under the terms and conditions of the Creative Commons Attribution (CC BY) license (https://creativecommons.org/licenses/by/4.0/).
Share and Cite
Ma, L.; Ding, T.; Zhang, J. Research on the Capability to Prevent Returning to Poverty and Its Enhancement Path for the Ecologically Fragile Areas: A Case Study of Enshi Prefecture. Sustainability 2024, 16, 4986. https://doi.org/10.3390/su16124986
Ma L, Ding T, Zhang J. Research on the Capability to Prevent Returning to Poverty and Its Enhancement Path for the Ecologically Fragile Areas: A Case Study of Enshi Prefecture. Sustainability. 2024; 16(12):4986. https://doi.org/10.3390/su16124986
Chicago/Turabian StyleMa, Linmao, Tonggen Ding, and Jinsong Zhang. 2024. "Research on the Capability to Prevent Returning to Poverty and Its Enhancement Path for the Ecologically Fragile Areas: A Case Study of Enshi Prefecture" Sustainability 16, no. 12: 4986. https://doi.org/10.3390/su16124986
APA StyleMa, L., Ding, T., & Zhang, J. (2024). Research on the Capability to Prevent Returning to Poverty and Its Enhancement Path for the Ecologically Fragile Areas: A Case Study of Enshi Prefecture. Sustainability, 16(12), 4986. https://doi.org/10.3390/su16124986