Abstract
As one of the important driving forces of sustainable development in coastal areas, foreign direct investment (FDI) has provided new ideas for exploring optimal strategies. This analysis explores the linear impact of FDI on sustainable development in coastal areas with 53 cities in China from 2012 to 2020. Accordingly, a dynamic panel smoothed transition regression (PSTR) model is used to analyze the non-linear impact of FDI on sustainable development, with transition mechanisms of industrial structure and technological innovation level. The findings reveal that the non-linear effect of FDI on the sustainable development of coastal areas is obvious. When the coastal area’s industrial structure is more optimized, and the level of technological innovation is higher, the promotion effect of FDI on sustainable development is more obvious. Further, the threshold effect of industrial structure and technological innovation is different. The threshold conversion rate of industrial structure is faster, but the threshold effect of technological innovation is stronger. Regionally, the impact of FDI on the sustainable development of coastal adjacent areas is significant, but not on the sustainable development of inland areas due to the few FDI inflows. This analysis offers guidance for policymakers to further develop the tertiary industry, increase financial investment in innovation in coastal areas and encourage enterprises to improve their independent innovation capacity.
1. Introduction
Sustainable development is an inevitable requirement for the development of social productivity and technological progress and is the key to solving current global problems [1]. China has been actively exploring sustainable development strategies from the perspectives of ideology, strategy, and behavior and seeking the optimal path to achieve sustainable development goals [2]. However, due to their unique geographical location, coastal areas can be subjected to intense levels of activities, and many of them face problems of deteriorating natural, economic, and cultural resources [3]. To solve these problems, some studies have explored various aspects such as environmental regulation [4], ecological health evaluation system [5], and biological diversity [6], attempting to find effective ways to promote sustainable development, but most of them ignored the role of foreign direct investment (FDI) in them.
Since the reform and opening up, FDI has become one of the important driving forces for promoting China’s economic and social development [7], and its impact and role on China’s sustainable development have always been a focus of attention [8,9,10]. The World Investment Report published by UNCTAD particularly emphasized that FDI is one of the key external sources of funding for achieving sustainable development goals [11]. Moreover, both the OECD and the United Nations Framework Convention on Climate Change (UNFCCC) consider FDI as a crucial driver of sustainable development, whereas the OECD identifies it as part of the ‘Green Economic Opportunities’ toolkit, the UNFCCC considers it as a component of the ‘Clean Development Mechanism’ [12]. Especially for the coastal areas, with their unique industrial structure advantages and technological innovation level, they have shown great attraction to FDI. In 2022, China’s actual use of foreign investment reached 1232.68 billion yuan, of which nearly 70% came from the coastal areas (‘Statistical Bulletin of FDI in China 2022’ from the Ministry of Commerce of the People’s Republic of China.). FDI from the coastal areas can more effectively enhance own resilience as it has the most potential market size and business environment, and then drive local enterprises’ technological innovation [13] and industrial structure optimization [14,15] through technological spillovers and capital transfer [16] to promote the sustainable development. However, the increasing scale of FDI has also sparked speculation about the pollution heaven hypothesis and environmental Kuznets curve hypothesis that FDI can increase pollutant emissions at a certain stage, which is against the achievement of sustainable development goals [17,18]. Although FDI may affect environmental quality as its quantity increases, it cannot be denied that FDI is often seen as the remedy to a country’s development challenge, as it offers a substitute for domestic investment with the potential to influence the host country’s macroeconomic variables such as technology endowment and industrial structure [19].
Therefore, this analysis takes FDI as the research object and explores its key role in promoting the sustainable development of coastal areas. At the same time, considering the obvious advantages of technological innovation and industrial structure in coastal areas, the level of technological innovation and industrial structure are taken as two important influencing factors to enhance the effect of FDI on sustainable development and the key role of the two in releasing the positive effect of FDI and then promoting sustainable development is explored. It is important to note that we are concerned with the concept of sustainable development, which is an integrated concept that simultaneously brings together economic, environmental, and social dimensions and the role of FDI in confronting such a large and complex system of sustainable urban development. Specifically, an ordinary regression model is used to analyze the linear impact of FDI on sustainable development in the coastal region, and accordingly, the PSTR model is used to further analyze the role of technological innovation and industrial structure in the impact of FDI on sustainable development, as well as the regional heterogeneity of such impacts, so as to provide practical recommendations for the high-quality introduction of FDI in the coastal region to achieve sustainable development.
The rest of our analysis is as follows: Section 2 introduces the related literature review and research hypothesis. Section 3 analyses the underlying methodological framework and data construction. Section 4 reports the empirical results. Section 5 discusses the empirical results. Section 6 presents the conclusions.
2. Literature Review and Research Hypothesis
In a global economy of increasingly interdependent markets, understanding the role of FDI is of paramount importance as it informs many national and regional policies for sustainable economic development and innovation [10]. Some scholars have fully affirmed the role of FDI in sustainable development. Narula theoretically presented a framework to apply the principles of ‘Sustainable Investing’ (SI) on FDI in order to achieve the goal of Sustainable Development [20]. Kardos considered FDI as a vital source for development and even for sustainable development and used the analysis and synthesis, data interpretation as well as data comparison to verify the importance and relevance of green FDI in the sustainable development of EU countries [21]. Aust et al. applied a multivariate analysis and an ordered probit model and found that FDI positively influences Sustainable Development Goals (SDGs) but it has some adverse environmental consequences and climate action [8]. Fang emphasized that the FDI from China can help African countries achieve their SDGs, including climate action [22]. Sauvat and Gabor specifically emphasized that the developmental focus of FDI can be on development in general and sustainable development in particular, and based on the investment facilitation theory, explore four questions and related specific recommendations on FDI for sustainable development [9]. Additionally, some scholars have studied the role of FDI in sustainable economy and environment (such as but not limited to human capital [19], carbon dioxide emission [23], economic growth [24], energy use [25], FDI interconnectedness [10], electricity [26], inclusive green growth [12], etc., and confirmed the positive role of FDI. However, with the increasing scale of FDI, some scholars have raised doubts about the impact of FDI on sustainable development. One important and frequently-raised issue about FDI is the potentially negative consequences for the environment [27]. Variations in the FDI inflows are highly sensitive to the environment [28]. Especially, FDI from developing countries is averse to the environment of the lower-middle-income host countries as it mainly comes from pollution-intensive industries, but the policy environment of the source country can reduce the adverse effects of FDI [29]. Furthermore, environmental information disclosure [30], the coordinated development of inward and outward FDI [31], and environmental-related technological innovations [32] are all effective ways to alleviate the negative effects of FDI on the environment.
Theoretically, both the pollution heaven hypothesis and the environmental Kuznets curve hypothesis verify the negative effect of FDI: investment nations prefer to shift the FDI from pollution-intensive enterprises to host countries if environment protection laws are relatively loose in their respective countries [33]. In this situation, attracting FDI to coastal areas may encounter the following problems, which are detrimental to sustainable development: the first issue is marine pollution. FDI from pollution-intensive industries to coastal areas may inevitably fall into the trap of external diseconomies, such as the increase of air pollutants and industrial wastewater [34]. A large amount of untreated sewage is discharged into the sea, which can exacerbate environmental pollution in the coastal waters. The second issue is the production efficiency of local enterprises. When pollution-intensive industries engage in cross-border investment, they often transfer several low-value-added products to other countries. These products have low technology content, making it difficult for FDI to exert a technological demonstration effect on the production and operation of local enterprises, and the local production efficiency cannot be substantially improved [35]. Moreover, some smaller local enterprises may engage in low-end industry processing and manufacturing due to limited core technology and may even be subject to technological monopolies from investing countries [36]. Third is the issue of industrial structure. Coastal areas are highly concentrated and developed areas of industrial activities in China, with a relatively complete range of industries and a good economic foundation. With the continuous deepening of reform and opening up, the industrial structure in coastal areas continues to be optimized and upgraded, and the foundation for the development of the tertiary industry continues to be consolidated. In 2019, the gross domestic product of this industry accounted for 62.2%, almost 1.5 times the total gross domestic product of the primary and secondary industries (‘China marine statistical year book’ from the Ministry of Natural Resources.). If the quality of FDI in coastal areas is poor, the local enterprises may not only be unable to learn from advanced foreign technologies but may even affect their own product transformation and structural upgrading as a result [15].
On the contrary, the pollution halo hypothesis affirms the role of FDI, believing that the inflow of FDI can improve local environmental quality to promote sustainable development. The favorable ecological consequences can be attributed to the transmission of industrial structure and creative green technology, which can be anticipated to generate jobs and drive sustainable economic growth in coastal areas [33]. For coastal areas, with the increasingly accumulated experience in technological innovation and talent advantages, it is becoming a key area to attract more high-quality FDI inflows. This means that coastal areas have more opportunities to learn from advanced foreign technologies, attract more high-quality talents, and fully leverage the technological spillover effect of FDI [35]. However, the technological spillover effect of FDI is not automatically generated, and its degree and direction not only on factors such as the availability of resources in the host country, investment policies, infrastructure conditions, law, and social order but also on the industrial structure and technological absorption capacity [37]. For coastal areas, efforts should be made to technological innovation of enterprises and industrial structure optimization and avoid problems such as technological monopoly and environmental pollution brought by FDI as much as possible.
Consequently, due to differences in technological innovation level and industrial structure among regions, the impact of FDI on sustainable development in coastal areas cannot be simply described by linear positive or negative, and there may also be nonlinear effects. Based on the above, we put forward the hypothesis as follows:
Hypothesis 1.
FDI in coastal areas has an impact on sustainable development.
Hypothesis 2.
The impact of FDI on sustainable development has a non-linear character that varies with industrial structure and the level of technological innovation.
The contributions of our analysis are as follows: Firstly, regarding the theme of how FDI affects sustainable development, existing studies have mainly focused on the impact of FDI on both the environment and the economy. Our analysis selects the urban sustainable competitiveness index to reflect the sustainable development of coastal regions, which happens to satisfy the above connotation of sustainable development in its full aspect and multi-dimension and is analyzed in six aspects: knowledge, harmony, ecology, culture, whole region, and information. Further, it expands the study dimension from the national level to the city level, and the sample data are expanded to improve the accuracy of the estimation results. Secondly, empirical research on the impact of FDI on sustainable development often focuses on the linear analysis but neglects the nonlinear analysis methods that provide a dynamic and comprehensive perspective on the changes in the effectiveness of FDI in different scenarios. This article focuses on the nonlinear analysis method of panel smooth transition regression (PSTR) method and explores the nonlinear impact of FDI on sustainable development in coastal areas.
3. Research Methods and Data
3.1. Models
3.1.1. Ordinary Regression Model
First, a conventional linear analysis was employed to preliminarily explore the relationship between FDI and sustainable development. We considered three models, the ordinary least squares model (OLS), fixed effects panel model (FE), and random effects panel model (RE), at the same time and found that the fixed-effects model was the most appropriate by using the F-test and Hausman’s test, and the test found that the intercepts for different cross-sections and different time-series models were significantly different, so we built a point-in-time individual fixed-effects model, controlling for both time and individual effects. Moreover, since the core explanatory and control variables in the model are absolute quantities of change, we logarithmized these variables in order to reduce the absolute values of the data and statistical errors. The specific model setting is as follows:
where represents 53 coastal cities, represents the period from 2012 to 2020. represents the sustainable development of each city over the years, represents the actual amount of foreign investment utilized by 53 coastal cities and represents the set of control variables. is the number of control variables. , and represent individual effects, time effects, and random error terms, respectively. is the constant term, is the coefficient for the core explanatory variable, and represents the corresponding coefficients for each control variable.
3.1.2. Panel Smooth Transition Model
The Panel Smooth Transition Regression (PSTR) model is used to empirically explore the heterogeneous effects of FDI on sustainable development in coastal areas under the level of industrial structure and technological innovation, as well as the threshold effects of these factors. The advantages of this model are as follows: (1) Compared with ordinary linear panel models, the PSTR model can identify heterogeneity of cross-sections based on nonlinear statistical tests and reflect the slow changes in the system by transforming variables to describe the nonlinear relationship between economic variables; (2) the PSTR model can be regarded as a generalized Panel Threshold Regression (PTR) model, although the PTR model can also reflect cross-sectional heterogeneity, it is only applicable to economic data with structural mutations [38]. The PSTR model has a wider scope of application, which is suitable for continuous and gentle economic data of institutional transformation [39]. Specifically, the model better solves the problem of jumping back and forth in the threshold value in the PTR model by adding a continuous transformation function to the model, which is more in line with the economic reality. In addition to the smooth transformation, the model also has the advantage of effectively capturing the heterogeneity among different cross-sections, which is suitable for the study of multi-cross-section data. The specific model setting is as follows:
where and are the numbers of cross-section and time dimensions of the panel, respectively. denotes fixed effect factors. represents the variable for which in Equation (1) has been normalized for data. represents the FDI inflows after data normalization. is the smooth, continuous transition function of , which is the threshold variable of industrial structure and technological innovation level in our analysis. The nexus between FDI and sustainable development is specified by the parameter in the low regime (when ) and the impact of FDI on sustainable development equal when in the high regime. The logistics of the transition function is as follows:
where the values of ranges between 0 and 1, and and represent the threshold variable, the threshold parameter, and the slope of the transition function. describes the smoothing parameter that describes the speed of transition from one state to another, and is the number of thresholds between two extreme states given the transition function . First, the homogeneity test (also known as the linearity test) is performed in Equation (2), and the original assumption of the test is . Since there are uncertain parameters and in the PSTR model, it is impossible to perform the test, and Gonzalez et al. solved the problem by performing a first-order Taylor expansion of the transformation function at in Equation (2) [39], and further obtaining auxiliary regression as follows:
The parameter vectors are the concatenated terms of , , and is the residual term of the Taylor expansion. Therefore, the original hypothesis in the Equation (2) is equivalent to in Equation (4). If the linear test rejects the null hypothesis, that is, at least one of to is not equal to 0, further remaining no linearity test is required. Accordingly, set as the panel residual sum of squares under the original hypothesis , and as the panel residual sum of squares under the alternative hypothesis, and construct the Wald tests (), Fisher tests (), and Likelihood Ratio tests () to test the original hypothesis [40]. Their statistics are as follows:
denotes the total number of samples. The next step is to determine the number of conversion functions () and positional parameters () in the PSTR model. Generally, it is common to take or . In both cases, the residual nonlinearity test is performed on the model to determine the parameter . The test generally includes the linear test and the non-linear test, which are all based on the three statistics above. The linear test requires the p-value of the three statistics to be less than 0.1, while the non-linear test requires the p-value of these statistics to be greater than 0.1, and it is also an important basis for determining whether the level of technological innovation and industrial structure can play a role in the impact of FDI on sustainable development.
3.2. Variable Selection
3.2.1. Explained Variable
We choose the urban sustainable competitiveness index to represent sustainable development (). The urban sustainable competitiveness index was from the ‘Annual Report on China’s Urban Competitiveness’ published by the Chinese Academy of Social Sciences (CASS) [41] and it is the ability of a city to provide better and more sustainable well-being for all its inhabitants by enhancing its economic, social, ecological, innovative and globally connected strengths and seeking to optimize the system. Its goal is to guide the development of China’s cities in a sustainable and competitive direction and to build ideal cities that can maximize the welfare of their inhabitants in a sustainable manner, thus fully reflecting a city’s ability to achieve sustainable development. The index is based on five dimensions, namely economic vitality, environmental resilience, social inclusion, science and technology innovation, and global connectivity, and 28 secondary indicators are collected and calculated using a non-linear weighted composite method. See Appendix A for the composition of the urban sustainable competitiveness index.
3.2.2. Explanatory and Control Variables
The explanatory variable () uses the actual amount of foreign investment utilized to measure the use of FDI, which is adjusted according to the average exchange. Since FDI is an absolute quantity indicator and the variation of this indicator is large, we took a logarithmic treatment for it to facilitate comparison and less statistical error.
The control variables include population size (), the number of Internet practitioners (), air pollution (), the scale of cultural industries (), and education expenditure (). Similarly, we logarithmized all control variables. The above variables are described as follows: (1) Referring to the analysis of Din et al. [42], we choose population size as one of the control variables and measure it with the total population at the end of the year. Coastal areas have attracted a large number of people into the area by virtue of their unique policy advantages and geographical location, and along with the increase in population, the demand for fuel, energy, and transport grows, which in turn accelerates carbon dioxide emissions [43]; (2) referring to the analysis of Tian and Feng [31], the Internet indicator is added as one of the control variables and measured by the employment of urban units in information transmission, software, and information technology services. Internet development not only helps to reduce transaction costs and resource allocation distortions but also helps to increase the utilization of clean energy, reduce tailpipe emissions, and improve environmental performance, while it is also important in shortening the cycle of technological upgrading and expanding technological integration and diffusion [31]. All these have a positive impact on the sustainable development of coastal areas; (3) referring to the analysis of Qian et al. [44], the air pollution variable is added to the model and expressed in terms of industrial sulfur dioxide emissions. Air pollution not only affects greenhouse gas emissions by altering the atmospheric composition, leading to global warming but also affects the entire ecosystem by entering water and soil and being absorbed by plants and grazing livestock. Reducing air pollution can contribute to the progress of sustainable development in many ways; (4) referring to the analysis of Zheng et al. [45], the variable of the scale of culture industries is added to the model and measured as the employment of urban units in culture, sports and recreation industries; (5) education contributes to the development of high-quality human capital, which is critical for green innovation planning and implementation and necessary for sustainable development [46]. Accordingly, we include education expenditure as a control variable and measure it with general public budget expenditure on education.
3.2.3. Threshold Variable
Threshold variables include industrial structure () and technological innovation level (). The ratio of the gross domestic product of the tertiary industry to the gross domestic product of the secondary industry represents the industrial structure (), the science and technology expenditure in local general public budget expenditure represents technological innovation (), and we took the zero-mean data normalization for them. The details of variables have been described in Table 1 and Table 2.

Table 1.
Description of variables.
Table 2.
Descriptive statistics of variables.
3.3. Study Area and Data Sources
The study area includes the following 53 coastal cities in China with advantages in both geography and marine economy: Liaoning, Hebei, Shandong, Tianjin, Shanghai, Jiangsu, Zhejiang, Fujian, Guangdong, Guangxi, and Hainan. The data were all collected from the 2012–2020 ‘China Statistical Yearbook’ and ‘Annual Report on China’s Urban Competitiveness’. Among them, the 2019 urban sustainable competitiveness index was not published and was filled in using the linear interpolation method, while other variables were not processed.
4. Empirical Results
4.1. Ordinary Regression Results
The STATA 17.0 is used to analyze the impact of FDI on sustainable development in coastal areas. First, we provide the results of the Variance Inflation Factor (VIF) test, which is specifically designed to detect multicollinearity in the model. In general, the more severe the multicollinearity between variables, the greater the value of VIF. An easy-to-use criterion: when the VIF value is greater than 10, it is considered that there is a strong multicollinearity between the variables, which cannot be accepted. Table 3 shows the results of the test of multicollinearity, and it is easy to find that the VIF values of all variables are less than 10. The results indicate that the degree of multicollinearity between the variables is weak and that the selected variables are reasonable and scientific. Further, the results of the ordinary regression are given in Table 4.
Table 3.
Results of multicollinearity test.
Table 4.
Results of ordinary regression.
In Table 4, the estimated coefficient of the core explanatory variable is always positive and significant, regardless of the model used or whether control variables are included. The estimated coefficients using the OLS and FE methods are essentially the same, with only a small difference in the t statistics while controlling for both time and individual effects. Such results indicate that FDI can promote sustainable development in coastal areas, which in turn proves the pollution halo hypothesis. In terms of control variables, the estimated coefficients for population size, and air pollutants are all significantly negative, in line with our expectations, with air pollutants being the most significant at the 5% level. The effect of the number of Internet users on sustainable development is positive and significant at the 1% level, which fully indicates the importance of Internet construction in the context of big data development in reducing transaction costs and promoting sustainable development in coastal areas. The estimated coefficient of the scale of culture industries is significantly positive, which is in general agreement with the findings of the study by Zheng et al. [45]. The estimated coefficient of education expenditure is positive but not significant, which is a little biased from the expectation and may be related to the small scale of education expenditure.
4.2. Robustness Test
Five methods, including the substitution of variables, fixed effects replacement, time-frame adjustments, winsorize processing, and censored processing, are used for the robustness analysis. For the replacement variables, two variables, namely the share of FDI to real GDP () and the number of inward investment strokes (), are used separately, and all data are obtained from the China City Statistical Yearbook [47]. In terms of fixed effects, only time effects were controlled for, not individual effects. In addition, considering the unfavorable impact of the New Crown epidemic on the economic environment, the sample data interval was further shortened to the period before the New Crown epidemic, i.e., 2012 to 2018, so as to circumvent the estimation bias that might be caused by the large fluctuation of the sample data after the New Crown epidemic. For winsorize processing and censored processing, the treatment is for observations in the quartiles below 1% and above 99% of the explanatory variables.
Table 5 presents the results of the robustness tests. The estimated coefficients of the core explanatory are insignificant only when the replacement explanatory variable is the number of inward investment strokes (). Otherwise, the estimated coefficients of for all other tests are positive and significant. Even then, the estimated coefficients for in these two tests are positive. With respect to the control variables, the estimated coefficients on the control variables for all tests are generally consistent with the results of the ordinary regression in Table 4, with slight variations in significance. Therefore, the model passes the robustness test, and FDI has a positive effect on sustainable development in coastal regions, which verifies Hypothesis 1.
Table 5.
Results of robustness test.
4.3. Endogeneity Test
In terms of endogeneity, reverse causation is usually one of the main sources of endogeneity in econometric models. As FDI inflows continue to increase, FDI may raise the level of sustainable development. At the same time, an increase in the level of sustainable development also creates a healthier and more harmonious business environment, which in turn attracts more FDI inflows. Moreover, given the comprehensive and complex character of the sustainable urban competitiveness index, this reverse causality can also appear in the relationship between the explanatory and control variables, which in turn creates endogeneity problems. Second, in terms of research tools, OLS and FE estimation methods cannot avoid the possible omission of control variables, measurement errors, and other problems in the model, and it is necessary to further select variables related to the endogenous explanatory variables but not directly affect the explained variable as instrumental variables for estimation. For this reason, the instrumental variable method of two-stage least squares (2SLS) are selected for regression in this analysis to deal with possible endogeneity problems, and we chose as the instrumental variable, and all control variables are lagged by one period. The model settings based on the 2SLS estimation method are set as follows:
where is an instrumental variable, and are the predicted values of in Equation (8). The other variables have the same meanings as Equation (1).
Generally, the 2SLS method requires three tests to pass which have been shown in Table 6. First, the correlation between instrumental variables and explanatory variables is tested. is selected as the instrumental variable, and the regression results in Column (1) of Table 6 show that the instrumental variables have passed the correlation test, indicating that the instrumental variables are correlated with the explanatory variables. Meanwhile, the Durbin–Wu–Hausman test value in Table 6 is significant at the 5% level, indicating that the explanatory variables are endogenous. Secondly, the instrumental variables are tested for reasonableness. Kleibergen–Paap rk LM value is significant at 1% level, which indicates that the instrumental variables are identifiable; the Cragg–Donald Wald F value is equal to 356.121, which is greater than 10, and the original hypothesis of weak instrumental variables is rejected. Further, according to the results in Column (2) of Table 6, it can be found that the estimated coefficients of are significantly positive at the 1% level, the impact of FDI on sustainable development is still positive, and the estimated coefficients of the control variables have not changed significantly. This also indicates that the endogeneity problem of the model does not affect the robustness of the results in general, and the regression results have good robustness.
Table 6.
Results of endogeneity test.
4.4. PSTR Estimation Results
The results of the ordinary regression test verified the positive linearity of the impact of FDI on the sustainable development of coastal areas, and the results were robust, indicating that FDI does play an important role in promoting the sustainable development process of coastal areas. However, as proposed in Hypothesis 2, there may be non-linear effects of FDI in different situations. Therefore, we adopted the PSTR model to further examine the non-linear effects of FDI.
4.4.1. Linearity Tests
First, make the heterogeneity test to determine whether there is a non-linear relationship between FDI and sustainable development, and if not, then a linear panel regression model should be used rather than the PSTR model. As can be seen from Table 7, for the model where the transformed variable is , the LMw, LMF, and LR tests reject the original hypothesis for either m = 1 or m = 2 for r = 1, indicating the existence of heterogeneity in our panel data. The LMw, LMF, and LR statistics are all significant at the 1% level for models where the transformed variable is , regardless of whether m = 1 or m = 2. It is necessary and reasonable to adopt the PSTR model to investigate the non-linear relationship between FDI and sustainable development.
Table 7.
Linearity test.
Then, make the residual non-linearity test to further determine the number of transformation functions. The results are shown in Table 8. The original hypothesis of cannot be rejected at the 10% significance level for the two models with the transformed variables of and for both m = 1 and m = 2, respectively. Combining the results of Table 7 and Table 8 shows that the impact of FDI on sustainable development is non-linear, which in turn verifies the necessity of the analysis using the PSTR model. Finally, decide the number of optimal threshold parameters based on the AIC and BIC information criteria and the location parameter c. As shown in Table 9, for both and , the parameters are r = 1 and m = 1.
Table 8.
Remaining no linearity test.
Table 9.
Determination of the number of optimal threshold parameters.
4.4.2. Estimation Results
After passing the above non-linear test of the model, we referred to the approach of Gonzalez et al. to further obtain the estimation values of the PSTR model [39]; the specific steps are as follows: First, remove individual-specific means to eliminate the fixed effects. Then, establish the threshold parameter and the threshold slope of the transition function by a grid search method in the case where the sum of squared residuals (RSS) of the model of interest was minimized. Finally, estimate the parameters by using non-linear least squares (NLS), where and denote the parameter results for the linear part and the non-linear part of the model, respectively. The estimation results are shown in Table 10.
Table 10.
PSTR estimation results.
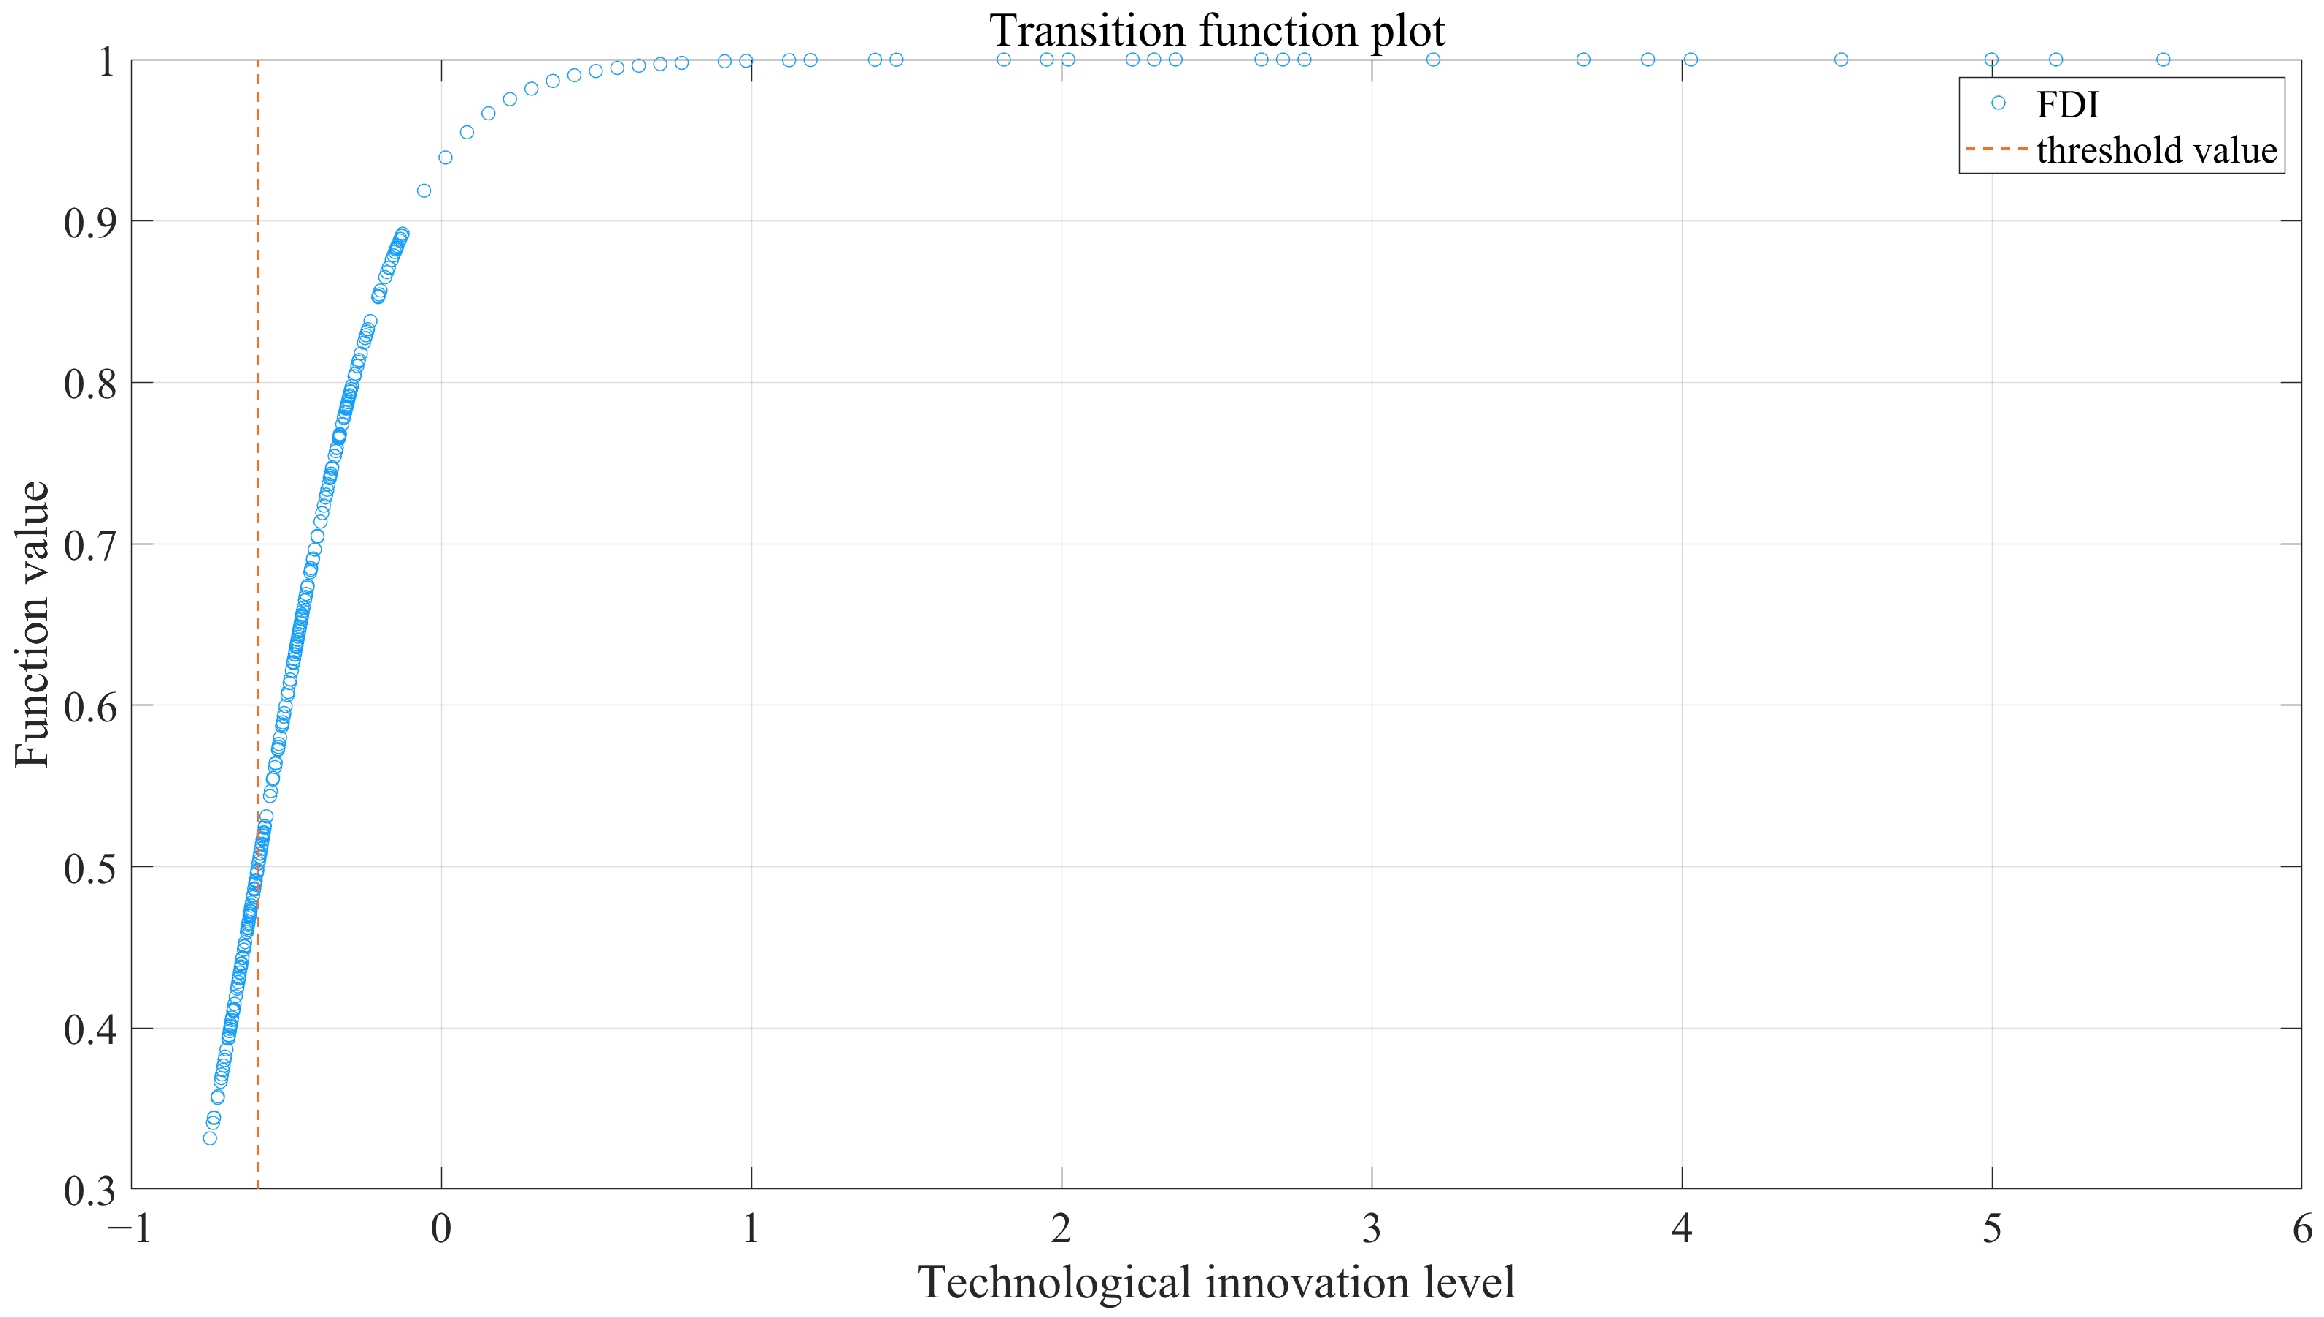
In Table 10, for the model where the transformation variable is , when , the impact coefficient of FDI is −1.0055 () and the model is in a low regime. When , the coefficient of FDI increases to 0.0267 (+) and the model rises to a high mechanism state. The impact coefficient of FDI on sustainable development in coastal areas shifts smoothly around a c value of −0.5751 in the interval [−1.0055,0.0267]. Accordingly, the image of the conversion function shows an S-shaped character (see Figure 1). When the value of is at a lower level, the value of the conversion function is close to 0, and the effect of FDI on sustainable development is mainly reflected in the linear part. However, from Table 9, the linear estimation coefficient is not significant, and the non-linear estimation coefficients is significantly positive, indicating that for any level of industrial structure, FDI has a significant positive effect on sustainable development. In addition, the threshold value is −0.8061; that is to say, when the value of is greater than −0.8061, the rate at which FDI enhances sustainable development is significantly increased. The slope parameter is 10.0709, indicating that the model converts moderately between different regimes and that the change in conversion function is smooth and gradual.
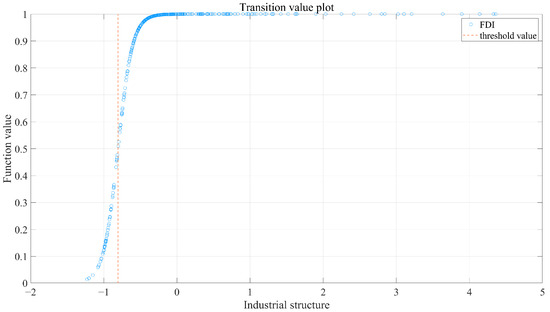
Figure 1.
The logistic relation between the industrial structure and transition function.
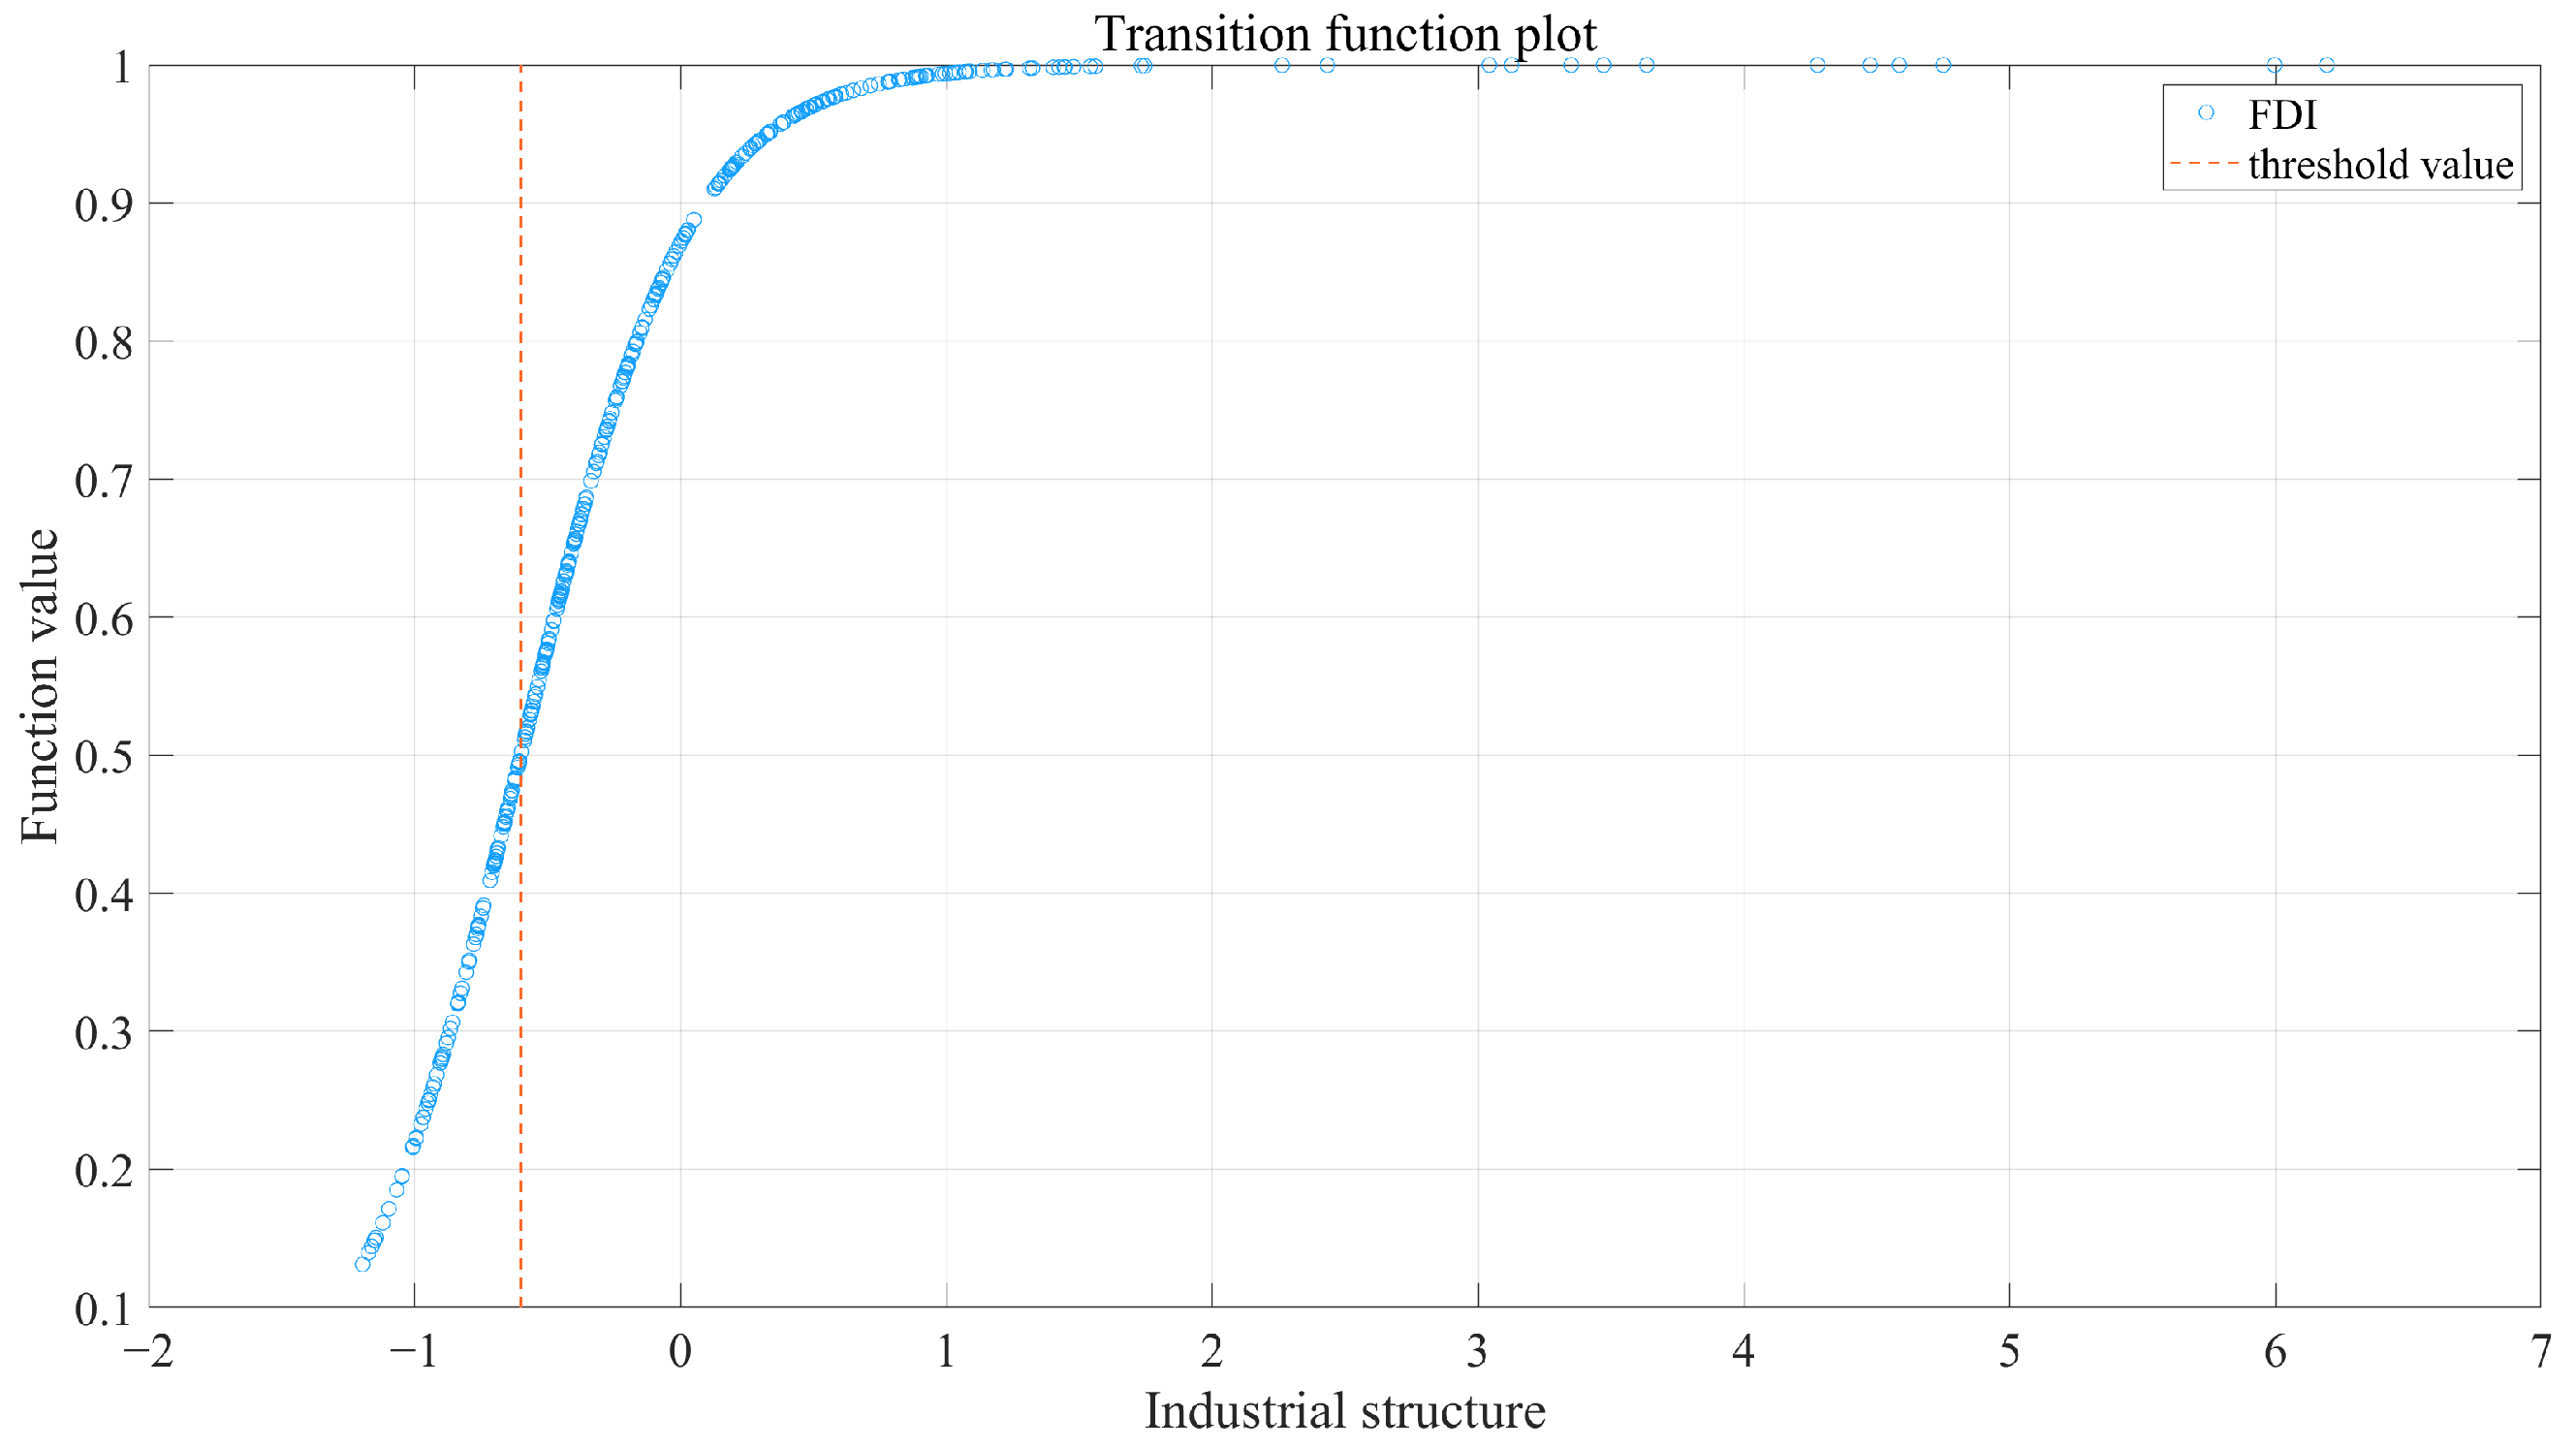
For the transformation variable , when , the estimation coefficient of FDI is −1.2347 () and the model is in a low regime. When , the estimation coefficient of FDI increases to 0.0491 (+) and the model rises to a high mechanism state. Accordingly, there is a parameter position of the conversion function image shows an inverted L-shaped character (see Figure 2) with an insignificant linear coefficient and a significant non-linear coefficient . Only when the value of is greater than −0.5909 the rate at which FDI enhances sustainable development is significantly increased. However, the slope parameter is 4.5324, indicating that the model converts slowly between different regimes, and the conversion function shows a smooth and gradual change trend. In conclusion, the optimization of the industrial structure can exert the positive non-linear effect of FDI on sustainable development more quickly, but the positive degree of FDI is more obvious when the technological innovation level reaches a high level. Anyway, FDI in coastal areas has a non-linear impact on sustainable development, with both industrial structure and technological innovation playing a threshold effect, which verifies Hypothesis 2.
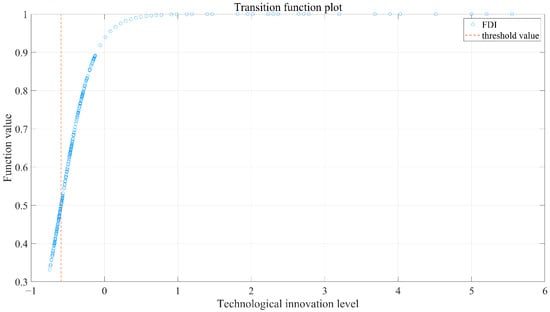
Figure 2.
The logistic relation between the technological innovation level and transition function.
4.5. Further Discussion: Heterogeneity Test Based on the Coastal, Coastal Neighboring and Inland Areas
Further sample data from inland areas as well as coastal adjacent areas were collected to explore the regional heterogeneity of the effects of FDI. While there is much empirical evidence on FDI spillovers and a general consensus on their impact, they hardly capture the role of different geographical scales on the impact. In this regard, a number of leading authors have raised theoretical or empirical debates on whether the spatial distribution patterns of foreign and local firms in host countries are related to the scale and scope of technology diffusion [48,49]. In particular, they argue that FDI spillovers are not uniform across all regions of a host country. In other words, geographical proximity between firms plays a key role in the diffusion of technology, as it promotes opportunities for social interaction between firms and even agglomeration externalities [50]. Thus, the impact of FDI spillovers generated by foreign firms may gradually spread first to adjacent local firms and then to more distant local firms. Coastal regions, as the main regions attracting FDI, undertake the key task of actively developing FDI and improving its quality, which in turn promotes the spread of FDI spillover effects to adjacent cities. Therefore, we referred to the idea of a 0–1 adjacency matrix when selecting sample data from adjacent cities in the coastal region [51]. When two cities have a common boundary, a weight of 1 is defined otherwise, a weight of 0. After screening and processing, a total of 44 cities adjacent to 53 coastal cities were selected, as well as 183 inland cities. Appendix B provides a detailed description of the cities included in each region.
The results for coastal adjacent cities and inland cities are shown in Table 11. For the coastal adjacent cities, the estimation coefficient of is significantly positive at the 1% level, but it is significantly negative for the inland areas. Considering the larger sample size in the inland areas, it’s likely to produce statistical bias caused by endogeneity problems, so we conducted the endogeneity test using the 2SLS method, and the estimated coefficient of is still insignificant with the t-value is 0.53. Further disregarding the control variables, the estimated coefficient of is insignificant, and the t-value is 1.56. FDI in the coastal adjacent cities plays a positive role in sustainable development, but the role of FDI in the inland areas is not significant.
Table 11.
Ordinary regression results of coastal adjacent cities and inland cities.
Further, the PSTR model is used to analyze the coastal adjacent cities. First, according to Table 12, since the p-value of the non-linear residual test at m = 1 and r = 1 is less than 0.1, only the transformation function at m = 1 and r = 1 can satisfy the linear and non-linear test conditions of the model. Analyzing the estimation results of PSTR in conjunction with Table 13, for the model where the transformation variable is , the impact coefficient of FDI on sustainable development in coastal adjacent areas shifts smoothly around a c value of −0.6013 in the interval [−0.2323,0.2216], and the linear estimated coefficient is insignificant, and the non-linear estimated coefficient is significantly positive at the 5% level. But for the conversion variable , both and are insignificant, indicating that the moderating effect of industrial structure on FDI is more pronounced. (See Figure 3). Compared with the coastal region, both the conversion rate and of in the coastal adjacent cities are smaller. For any level of , FDI in the coastal adjacent areas can always significantly promote sustainable development, especially when the value of is greater than −0.6013, the rate of FDI for sustainable development can be increased, but the overall effect is still not as good as the impact of FDI in the coastal region.
Table 12.
Linearity test of coastal adjacent cities.
Table 13.
PSTR estimation results of coastal adjacent cities.
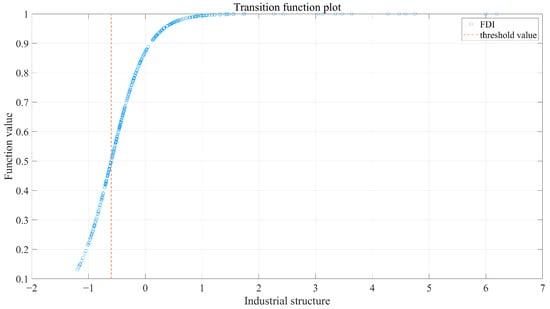
Figure 3.
The logistic relation between the industrial structure and transition function of coastal neighboring cities.
5. Results Discussion
5.1. Analysis of the Impact of FDI on Sustainable Development
Our analysis first verifies the positive impact of FDI on sustainable development in coastal areas, which varies with the industrial structure and technological innovation level. They all have one thing in common: there is a threshold for the impact of FDI on sustainable development, with FDI always positively affecting sustainable development and turning to increase this positive effect as the industrial structure and technological innovation level improves. The empirical results confirm the Hypotheses 1 and 2. When FDI was introduced in the early days, the proportion of the tertiary industry was relatively low, and the quality of attracting FDI was poor. The economic development at that time was seeking growth, and a large number of financial expenditures were spent on stimulating economic growth, neglecting the support for technological innovation, which led to a large number of imported multinational corporations engaging in the processing of primary products. Moreover, the bottom-up competition effect has even led some cities to lower the threshold of introduction at the expense of environmental quality to attract more FDI inflows [52]. In addition, as the coastal areas are not yet equipped with more mature production technology at the early stage of development, even if the quality of FDI introduced is high, it is difficult to quickly absorb the mature technology and management experience of foreign countries, which may even affect the development of domestic enterprises due to the occupation of domestic market share [37]. More seriously, some foreign-funded enterprises sign technology protection treaties during the investment process to protect core technologies and exercise technological monopoly, which seriously affects the production and operation activities of local enterprises [36]. However, with the increasing of tertiary industries and the government expenditure on science and technology, especially to promote the sustainable development of capital-intensive industries such as high-tech, cities have competed to bring in high-quality FDI, which has greatly enhanced the positive technological spillover effect of FDI and significantly promoted the sustainable development.
However, there are also different points in our empirical results: the effects of industrial structure and technological innovation level differ. Under the regulation of industrial structure, FDI can quickly reach the threshold value, and its transformation rate is much faster. Under the regulation of technological innovation level, the degree of the positive effect of FDI is more pronounced, but the transition speed is slower. The differences in results are related to the intrinsic mechanism of industrial structure and technological innovation. The advanced and rationalized industrial structure implies a rational allocation of resources across economic sectors. On the one hand, the advanced tertiary industry can force the transfer of labor in sectors with excess capacity or low production efficiency and promote the flow of talent, thus accelerating the spread of knowledge and technology, lowering the barriers to technological risk, and attracting foreign companies. On the other hand, the rationalization of the industrial structure can lead to a balance of input and output factors by alleviating the mismatch of resources, bringing about a further increase in capital productivity and labor productivity and attracting a large number of new local and foreign enterprises [33,53]. Technological innovation has a lag in policy effects [54], which is why the transition speed of FDI regulated by technological innovation is slower. But once the fiscal policy works, enterprises can improve their technological absorption capacity to learn more advanced foreign technologies [55,56], and lead to a series of chain reactions such as industrial agglomeration, structural optimization, and efficiency improvement, that may even far exceed the positive effect of FDI regulated by industrial structure, thus utilizing the positive spillover effect of FDI on sustainable development.
5.2. Analysis of the Regional Heterogeneity Result
For the regional heterogeneity test, the results differed significantly among coastal areas, coastal adjacent, and inland areas. FDI significantly affects the sustainable development of coastal adjacent areas, but the effect on other inland areas is not significant. First, the overall level of economic development in coastal adjacent is low compared to coastal areas, and local governments sacrifice the environment in exchange for economic growth and employment stability, such as lowering the level of environmental regulations to attract more FDI inflows. It is undeniable that the transfer of polluting industries has brought a large amount of capital to the neighboring coastal regions to promote economic growth, but with the continuous optimization of the industrial structure and the increase in the number of tertiary industries in these regions, the traditional way of attracting FDI is no longer applicable to the development pattern of local industries, and the inflow of environmentally unfriendly products, in turn, poses a threat to the local environment. Moreover, the coastal neighboring cities can absorb the technological spillover effect of FDI from the coastal areas more conveniently by virtue of their geographical location, but there is also a certain lag in policy effects. Second, the results show that technological innovation does not have a significant threshold effect on FDI in the coastal neighboring regions, and it is related to the variable of science and technology expenditure in the local general public budget expenditure we used. The science and technology financial expenditures in the coastal neighboring regions are much less than in the coastal regions.
However, except for the coastal and neighboring regions, FDI in other regions has not played a significant role in sustainable development. Although the government has vigorously supported the development of the central and western regions and attracted more multinational companies through the joint construction of the China–Europe liner, the Belt and Road, and the development of the western region, the number of FDI in these regions is less than one-third of the number of FDI in the coastal region. The small scale of FDI, coupled with the difficulty of absorbing the spillover effect of FDI from the coastal region, makes the impact of FDI in these regions on sustainable development insignificant.
6. Conclusions
6.1. Conclusions and Research Limitations
This analysis empirically analyses the non-linear impact of FDI on sustainable development and its regional heterogeneity, using data from 53 coastal cities from 2012 to 2020 as a sample. The conclusions are as follows:
First, the non-linear effect of FDI on the sustainable development of coastal areas is obvious: FDI has a positive effect on the sustainable development of coastal areas, but there is a threshold effect of this positive effect. When the coastal area’s industrial structure is more optimized, and the level of technological innovation is higher, the promotion effect of FDI on sustainable development is more obvious. Second, the threshold effect of industrial structure and technological innovation has differences. The threshold conversion rate of industrial structure is fast; that is, the optimization of industrial structure in a short time can significantly enhance the promotion effect of FDI on sustainable development. The threshold effect of technological innovation is strong, and once it exceeds the threshold value of the level of technological innovation, the positive effect of FDI on sustainable development is increased substantially. Third, there is regional heterogeneity in the impact of FDI on sustainable development. The impact of FDI on the sustainable development of coastal adjacent areas is significant but not on the sustainable development of inland areas. There is only a threshold effect of industrial structure in the promotion of sustainable development by FDI in the coastal adjacent areas; that is, the more optimized the industrial structure of the coastal neighborhood, the more obvious the promotion of sustainable development by FDI.
In summary, our findings are similar to those of Narula [20], Kardos [21], Aust et al. [8], Fang [22], Sauvat and Gabor [9], in that we all recognize the key role of FDI in contributing to the achievement of sustainable development in each country. The difference is that our study not only analyzes the linear impact of FDI on sustainable development like the above studies but also finds the non-linear impact of FDI under different industrial structures and technological conditions, and such findings can provide theoretical support for regions to further attract FDI and improve the quality of FDI in the future. Especially for coastal regions, as the region that attracts the most FDI in China, the coastal region’s unique resource endowment, geographic location, and technological advantages have also gradually become a typical representation to promote the high-quality development of FDI. In addition, our heterogeneity analysis has divided the sample into coastal adjacent and other inland regions, which is also different from previous studies. While confirming the role of FDI in coastal adjacent regions, our findings also highlight the attractiveness of coastal areas as a regional advantage.
However, there are still some questions stemming from this analysis that need to be further studied. For example, this analysis used the urban sustainable competitiveness index to measure sustainable development, which integrates six aspects: knowledge, harmony, ecology, culture, whole region, and information, but we did not further analyze the heterogeneity of sustainable development in terms of above six dimensions limited to the data availability. In the future, it is planned to collect indicators from the six dimensions and further analyze the heterogeneity of FDI’s impact on sub-indicators of sustainable development in coastal areas. As this analysis only used the ratio of GDP of tertiary industry to secondary industry and government financial expenditure on science and technology as threshold variables, these two variables cannot fully reflect the industrial structure and technological innovation of a region. In the future, it is necessary to measure from other aspects, such as technology absorption capacity and the number of patents granted by enterprises.
6.2. Recommendations
Taking into account the findings of the study, the following policy recommendations are made: first, it is necessary to actively develop the tertiary industry in coastal areas, give full play to the advantages of natural resources, and vigorously develop the marine tertiary industry. The government should strengthen the infrastructure construction of the marine transport industry, reasonably allocate the use of port resources, encourage the intensive development of ports, strengthen the connection between port development and the hinterland economy, and create large-scale and international ports. At the same time, the government should selectively and purposefully regulate FDI according to the various characteristics of the industries to which it belongs so as to ensure that there are screenings, thresholds, and requirements for FDI in the industries from which it originates and to strictly control the entry of FDI in high-pollution, high-emission, and high-energy-consumption industries; second, the government should establish the enterprise-oriented, market-oriented, and industry-university-research combination of scientific and technological innovation system, and encourage various types of enterprises, especially sea-related institutions to build a strategic alliance of technological innovation, and accelerate the construction of scientific and technological innovation platforms and marine science and technology parks. At the same time, the government should formulate relevant incentive policies for the transformation of various scientific and technological innovations and adopt measures such as R&D subsidies and R&D risk guarantees for significant technological innovation breakthroughs; third, the government should encourage FDI in important industries, such as digital economy, medical care, pension, new energy, biology, and new medicine, etc., in the form of releasing a list of incentives for foreign investment. While increasing the quantity of FDI, attention should also be paid to optimizing the quality of FDI.
Author Contributions
Y.Z.: conceptualization, methodology, and writing. J.L.: data collection, software, and writing. S.L.: writing, reviewing and editing. Y.W.: reviewing and editing. All authors have read and agreed to the published version of the manuscript.
Funding
This work was supported by the [Natural Science Foundation of Shandong Province] under Grant [ZR2020MG044].
Institutional Review Board Statement
Not applicable.
Informed Consent Statement
Not applicable.
Data Availability Statement
The datasets used and/or analyzed during the current study are available on reasonable request.
Conflicts of Interest
This article has no interest or conflict with any individual or group. The authors declare that they have no competing interests.
Appendix A. Explanatory Indicator System for Urban Sustainable Competitiveness
| First Level Indicators | Secondary Indicators | Indicator Content | Data Sources |
| Economic vitality competitiveness | Ease of doing business index | World bank ease of doing business index is adjusted for the number of routes | World Bank |
| Property protection index | International property protection report is revised by the city’s property protection popularity | International Property Protection Report | |
| Youth talent ratio index | The proportion of youth (aged 16–45) in the total population is revised by GDP per capita | Economist Intelligence Unit (EIU);Global Cities Database | |
| Economic growth rate index | 5 years economic growth rate of urban GDP | Economist Intelligence Unit (EIU); Global Cities Database | |
| Labor productivity index | Urban GDP divided by working population (ages 15–59) | Economist Intelligence Unit (EIU); Global Cities Database | |
| Environmental resilience competitiveness | Transportation convenience index | Numbeo traffic data was adjusted by urban traffic topic public opinion crawler data | Numbeo website; Web crawler data |
| Power abundance index | Nightlight data extraction calculation | Night light map | |
| Ecological diversity index | The comprehensive area of 10 landforms, including forests, lakes, green spaces and wetlands | Global Land Cover Products (FROM-GLC10) | |
| Climate comfort index | Four indexes of temperature, precipitation, disaster weather and visibility are scored and calculated | Global Environmental Information Statistical Database | |
| Environmental excellence index | PM2.5 and per capita CO2 emissions were calculated and revised by per capita GDP | Global Environmental Information Statistical Database | |
| Natural hazards index | Calculated based on historical data for six types of natural disasters | Columbia university; World Bank | |
| Social harmony and competitiveness | History and culture index | Number of museums | Map crawler data |
| Social security index | Crime rate data | Numbeo website; Reports of people’s procuratorates | |
| Social equity index | Gini coefficient | Economist Intelligence Unit (EIU); Global Cities Database | |
| Residential index | The price-to-income ratio works backwards | Numbeo website | |
| Openness index | Starbucks, McDonald’s Walmart number calculation | Map crawler data | |
| Health care organization index | The number of health facilities per capita is revised by the Universal Health Coverage (UHC) index | Map crawler data | |
| Technological innovation competitiveness | Patent application index | Number of patent applications | WIPO website |
| Academic papers index | Number of published papers | Web of Science website | |
| Technology enterprise index | Distribution of tech | Google website | |
| College index | The best Universities in each city index is scored by category and adjusted for the number of universities | Webometrics website; Map crawler data | |
| Cultural facilities index | Number of libraries divided by city area | Map crawler data | |
| Global connectivity competitiveness | Air connectivity index | Number of airport flights | flights from website |
| Internet popularity index | Google trends and Baidu trends | Map crawler data | |
| Researcher connectivity index | Number of collaborative papers published | Nature index | |
| Financial enterprise connectivity index | Distribution of 75 financial multinational corporations | Google website | |
| Technology enterprise connectivity index | Distribution of 25 science and technology multinationals | Google website | |
| Shipping connectivity Index | Port shipping connectivity index is calculated by adjusting port throughput | United Nations Conference on Trade and Development (UNCAD) |
Appendix B. City Composition by Region
| Coastal Cities | Coastal Adjacent Cities | Other Inland Cities |
| Tianjin, Tangshan, Qinhuangdao, Changzhou, Dalian, Dandong, Jinzhou, Yingkou, Panjin, Huludao, Shanghai, Nantong, Lianyungang, Yancheng, Hangzhou, Ningbo, Wenzhou, Jiaxing, Shaoxing, Zhoushan, Taizhou, Fuzhou, Xiamen, Putian, Quanzhou, Zhangzhou, Ningde, Qingdao, Dongying, Yantai, Weifang, Weihai, Rizhao, Binzhou, Guangzhou, Shenzhen, Zhuhai, Shantou, Jiangmen, Zhanjiang, Maoming, Huizhou, Shanwei, Yangjiang, Dongguan, Zhongshan, Chaozhou, Jieyang, Beihai, Fangchenggang, Qinzhou, Haikou, Sanya | Beijing, Baoding, Zhangjiakou, Chengde, Langfang, Hengshui, Shenyang, Anshan, Benxi, Fuxin, Liaoyangm, Tieling, Chaoyang, Tonghua, Xuzhou, Suzhou, Huai’an, Yangzhou, Taizhou, Suqian, Huzhou, Jinhua, Quzhou, Lishui, Huangshan, Xuancheng, Sanming, Nanping, Longyan, Jinan, Zibo, Linyi, Dezhou, Shaoguan, Foshan, Meizhou, Heyuan, Qingyuan, Yunfu, Nanning, Wuzhou, Guigang, Yulin, Chongzuo | Shijiazhuang, Handan, Xingtai, Taiyuan, Datong, Yangquan, Changzhi, Jincheng, Shuozhou, Jinzhong, Yuncheng, Xinzhou, Linfen, Lvliang, Hohhot, Baotou, Wuhai, Chifeng, Tongliao, Ordos, Hulunbeir, Wulanchabu, Fushun, Changchun, Jilin, Siping, Liaoyuan, Baishan, Songyuan, Baicheng, Harbin, Qiqihar, Jixi, Hegang, Shuangyashan, Daqing, Yichun, Jiamusi, Qitaihe, Mudanjiang, Heihe, Suihua, Nanjing, Wuxi, Changzhou, Zhenjiang, Hefei, Wuhu, Bengbu, Huainan, Ma’anshan, Huaibei, Tongling, Anqing, Chuzhou, Fuyang, Suzhou, Lu’an, Chizhou, Nanchang, Jingdezhen, Pingxiang, Jiujiang, Xinyu, Yingtan, Ganzhou, Ji’an, Yichun, Fuzhou, Shangrao, Zaozhuang, Jining, Tai’an, Liaocheng, Heze, Zhengzhou, Kaifeng, Luoyang, Pingdingshan, Anyang, Hebi, Xinxiang, Jiaozuo, Puyang, Xuchang, Luohe, Sanmenxia, Nanyang, Shangqiu, Xinyang, Zhoukou, Zhumadian, Wuhan, Huangshi, Shiyan, Yichang, Ezhou, Jingmen, Xiaogan, Jingzhou, Huanggang, Xianning, Suizhou, Changsha, Zhuzhou, Xiangtan, Hengyang, Shaoyang, Yueyang, Changde, Zhangjiajie, Yiyang, Chenzhou, Yongzhou, Huaihua, Loudi, Zhaoqing, Liuzhou, Guilin, Baise, Hezhou, Hechi, Laibin, Chongqing, Chengdu, Zigong, Panzhihua, Luzhou, Deyang, Mianyang, Guangyuan, Suining, Neijiang, Leshan, Nanchong, Meishan, Yibin, Guang’an, Dazhou, Ya’an, Bazhong, Ziyang, Guiyang, Liupanshui, Zunyi, Anshun, Kunming, Qujing, Yuxi, Baoshan, Zhaotong, Lijiang, Lincang, Xi’an, Tongchuan, Baoji, Xianyang, Weinan, Yan’an, Hanzhong, Yulin, Ankang, Shangluo, Lan’Zhou, Jiayuguan, Jinchang, Baiyin, Tianshui, Wuwei, Zhangye, Pingliang, Jiuquan, Qingyang, Dingxi, Longnan, Xining, Yinchuan, Shizuishan, Wuzhong, Guyuan, Zhongwei, Urumqi, Karamay |
References
- Ni, R.; Wang, F.; Yu, J. Spatiotemporal changes in sustainable development and its driving force in the Yangtze River Delta region. China. J. Clean. Prod. 2022, 379, 134751. [Google Scholar] [CrossRef]
- Islam, Z.; Wang, S. Exploring the unique characteristics of environmental sustainability in China: Navigating future challenges. Chin. J. Popul. Resour. Environ. 2023, 21, 37–42. [Google Scholar] [CrossRef]
- Schernewski, G.; Schönwald, S.; Kataržytė, M. Application and evaluation of an indicator set to measure and promote sustainable development in coastal areas. Ocean Coast. Manag. 2014, 101 Pt A, 2–13. [Google Scholar] [CrossRef]
- Sun, J.; Zhai, N.; Miao, J.; Mu, H.; Li, W. How do heterogeneous environmental regulations affect the sustainable development of marine green economy? Empirical evidence from China’s coastal areas. Ocean Coast. Manag. 2023, 232, 106448. [Google Scholar] [CrossRef]
- Qian, L.; Wang, F.; Cao, W.; Ding, S.; Cao, W. Ecological health assessment and sustainability prediction in coastal area: A case study in Xiamen Bay. China. Ecol. Indic. 2023, 148, 110047. [Google Scholar] [CrossRef]
- Li, H.; Mao, D.; Wang, Z.; Huang, X.; Li, L.; Jia, M. Invasion of Spartina alternilora in the coastal zone of mainland China: Control achievements from 2015 to 2020 towards the Sustainable Development Goals. J. Environ. Manag. 2022, 323, 116242. [Google Scholar] [CrossRef] [PubMed]
- Zheng, W. Effects of China’s market-oriented economic reform, FDI inflows on electricity intensity. Energy 2021, 220, 119934. [Google Scholar] [CrossRef]
- Aust, V.; Morais, A.I.; Pinto, I. How does foreign direct investment contribute to Sustainable Development Goals? Evidence from African countries. J. Clean. Prod. 2020, 245, 118823. [Google Scholar] [CrossRef]
- Sauvat, K.P.; Gabor, E. Facilitating Sustainable FDI for Sustainable Development in a WTO Investment Facilitation Framework: Four Concrete Proposals. J. World Trade 2021, 55, 261–286. [Google Scholar] [CrossRef]
- Quaye, E.; Acquaye, A.; Yamoah, F.; Ndiaye, M. FDI interconnectedness and sustainable economic development: A linear and non-linear Granger causality assessment. J. Bus. Res. 2023, 164, 113981. [Google Scholar] [CrossRef]
- UNCTAD. World Investment Report 2014—Investing in the SDGs: An Action Plan. 2014. Available online: https://unctad.org/en/PublicationsLibrary/wir2014_en.pdf (accessed on 27 August 2019).
- Isaac, K.O.; Francesco, F.; Nathanael, O. Towards sustainability: The relationship between foreign direct investment, economic freedom and inclusive green growth. J. Clean. Prod. 2023, 406, 137020. [Google Scholar] [CrossRef]
- Sugiharti, L.; Yasin, M.Z.; Purwono, R.; Esquivias, M.A.; Pane, D. The FDI Spillover Effect on the Efficiency and Productivity of Manufacturing Firms: Its Implication on Open Innovation. J. Open Innov. Technol. Mark. Complex. 2022, 8, 99. [Google Scholar] [CrossRef]
- Ito, B.; Yashiro, N.; Xu, Z.; Chen, X.; Wakasugi, R. How do Chinese industries benefit from FDI spillovers? China Econ. Rev. 2012, 23, 342–356. [Google Scholar] [CrossRef]
- Tian, L.; Zhai, Y.; Zhang, Y.; Tan, Y.; Feng, S. Pollution emission reduction effect of the coordinated development of inward and outward FDI in China. J. Clean. Prod. 2023, 391, 136233. [Google Scholar] [CrossRef]
- Global Development Finance. Financial Flows to Developing Countries: Recent Trends and Near-Term Prospects; World Bank: Washington, DC, USA, 2005; Available online: https://openknowledge.worldbank.org/server/api/core/bitstreams/d71c7701-b322-52eb-9f79-c42ae94cc13f/content (accessed on 30 May 2005).
- Balsalobre-Lorente, D.; Driha, O.M.; Halkos, G.; Mishra, S. Influence of growth and urbanization on CO2 emissions: The moderating effect of foreign direct investment on energy use in BRICS. Sustain. Dev. 2021, 30, 227–240. [Google Scholar] [CrossRef]
- Luo, Y.; Guo, C.; Ali, A.; Zhang, J. A dynamic analysis of the impact of FDI, on economic growth and carbon emission, evidence from China, India and Singapore. Environ. Sci. Pollut. Res. 2022, 29, 82256–82270. [Google Scholar] [CrossRef] [PubMed]
- Fagbemi, F.; Osinubi, T.T. Leveraging foreign direct investment for sustainability: An approach to sustainable human development in Nigeria. Resour. Environ. Sustain. 2020, 2, 100005. [Google Scholar] [CrossRef]
- Narula, K. ‘Sustainable Investing’ via the FDI Route for Sustainable Development. Procedia-Soc. Behav. Sci. 2012, 37, 15–30. [Google Scholar] [CrossRef]
- Kardos, M. The relevance of foreign direct investment for sustainable development. Empir. Evid. Eur. Union. Procedia Econ. Financ. 2014, 15, 1349–1354. [Google Scholar] [CrossRef]
- Fang, Y. Influence of foreign direct investment from China on achieving the 2030 Sustainable Development Goals in African countries. Chin. J. Popul. Resour. Environ. 2021, 19, 213–220. [Google Scholar] [CrossRef]
- Gyamfi, B.A.; Adebayo, T.S.; Bekun, F.V.; Agyekum, E.B.; Kumar, N.M.; Alhelou, H.H.; Al-Hinai, A. Beyond environmental Kuznets curve and policy implications to promote sustainable development in Mediterranean. Energy Rep. 2021, 7, 6119–6129. [Google Scholar] [CrossRef]
- Zaman, M.; Pinglu, C.; Hussain, S.I.; Ullah, A.; Qian, N. Does regional integration matter for sustainable economic growth? Fostering the role of FDI, trade openness, IT exports, and capital formation in BRI countries. Heliyon 2021, 7, e08559. [Google Scholar] [CrossRef] [PubMed]
- Nepal, R.; Paija, N.; Tyagi, B.; Harvie, C. Energy security, economic growth and environmental sustainability in India: Does FDI and trade openness play a role? J. Environ. Manag. 2021, 281, 111886. [Google Scholar] [CrossRef] [PubMed]
- Aluko, O.A.; Opoku, E.E.O.; Ibrahim, M.; Kufuor, N.K. Put on the light! Foreign direct investment, governance and access to electricity. Energy Econ. 2023, 119, 106563. [Google Scholar] [CrossRef]
- Demena, B.A.; Afesorgbor, S.K. The effect of FDI on environmental emissions: Evidence from a meta-analysis. Energy Policy 2020, 138, 111192. [Google Scholar] [CrossRef]
- Chishti, M.Z. Exploring the dynamic link between FDI, remittances, and ecological footprint in Pakistan: Evidence from partial and multiple wavelet based-analysis. Res. Glob. 2023, 6, 100109. [Google Scholar] [CrossRef]
- Adeel-Farooq, R.M.; Riaz, M.F.; Ali, T. Improving the environment begins at home: Revisiting the links between FDI and environment. Energy 2021, 215 Pt. B, 119150. [Google Scholar] [CrossRef]
- Pan, A.; Qin, Y.; Li, H.; Zhang, W.; Shi, X. Can environmental information disclosure attract FDI? Evidence from PITI project. J. Clean. Prod. 2023, 403, 136861. [Google Scholar] [CrossRef]
- Tian, Y.; Feng, C. How does internet development drive the sustainable economic growth of China? Evidence from internal-structural perspective of green total-factor productivity. Sci. Total. Environ. 2023, 887, 164125. [Google Scholar] [CrossRef]
- Uche, E.; Das, N.; Bera, P.; Cifuentes-Faura, J. Understanding the imperativeness of environmental-related technological innovations in the FDI–Environmental performance nexus. Renew. Energy 2023, 206, 285–294. [Google Scholar] [CrossRef]
- Zhang, Z.; Zhao, Y.; Cai, H.; Ajaz, T. Influence of renewable energy infrastructure, Chinese outward FDI, and technical efficiency on ecological sustainability in belt and road node economies. Renew. Energy 2023, 205, 608–616. [Google Scholar] [CrossRef]
- Wang, H.; Luo, Q. Can a colonial legacy explain the pollution haven hypothesis? A city-level panel analysis. Struct. Chang. Econ. Dyn. 2022, 60, 482–495. [Google Scholar] [CrossRef]
- Wang, X.; Luo, Y. Has technological innovation capability addressed environmental pollution from the dual perspective of FDI quantity and quality? Evidence from China. J. Clean. Prod. 2020, 258, 120941. [Google Scholar] [CrossRef]
- Kováč, E.; Žigić, K. Persistence of monopoly, innovation, and R&D spillovers. Res. Econ. 2016, 70, 714–734. [Google Scholar] [CrossRef]
- De Vita, G.; Li, C.; Luo, Y. The inward FDI—Energy intensity nexus in OECD countries: A sectoral R&D threshold analysis. J. Environ. Manag. 2021, 287, 112290. [Google Scholar] [CrossRef] [PubMed]
- Hansen, B.E. Threshold effects in non-dynamic panels: Estimation, testing, and inference. J. Econom. 1999, 93, 345–368. [Google Scholar] [CrossRef]
- Gonzalez, A.; Teräsvirta, T.; Dijk, D.V. Panel Smooth Transition Regression Models; SSE/EFI Working Paper Series in Economics and Finance; Stockholm School of Economics: Stockholm, Sweden, 2005; Available online: https://www.docin.com/p-717366768.html (accessed on 1 August 2005).
- Chang, T.; Chiang, G. Regime-switching effects of debt on real GDP per capita the case of Latin American and Caribbean countries. Econ. Model. 2011, 28, 2404–2408. [Google Scholar] [CrossRef]
- Ni, P. Annual Report on China's Urban Competitiveness (No. 18); Social Sciences Academic Press (China): Beijing, China, 2020; Available online: http://naes.cssn.cn/cj_zwz/cg/yjbg/csjzlbg/202111/t20211104_5371703.shtml (accessed on 25 October 2020). (In Chinese)
- Din, A.U.; Ming, J.; Rahman, I.U.; Han, H.; Yoo, S.; Alhrahsheh, R.R. Green road transportation management and environmental sustainability: The impact of population density. Heliyon 2023, 9, e19771. [Google Scholar] [CrossRef] [PubMed]
- Ohlan, R. The impact of population density, energy consumption, economic growth and trade openness on CO2 emissions in India. Nat. Hazards 2015, 79, 1409–1428. [Google Scholar] [CrossRef]
- Qian, Y.; Cao, H.; Huang, S. Decoupling and decomposition analysis of industrial sulfur dioxide emissions from the industrial economy in 30 Chinese provinces. J. Environ. Manage. 2020, 260, 110142. [Google Scholar] [CrossRef]
- Zheng, X.; Wang, R.; Hoekstra, A.Y.; Krol, M.S.; Zhang, Y.; Guo, K.; Sanwal, M.; Sun, Z.; Zhu, J.; Zhang, J.; et al. Consideration of culture is vital if we are to achieve the Sustainable Development Goals. One Earth 2021, 4, 307–319. [Google Scholar] [CrossRef]
- Li, X.; Ma, L.; Ruman, A.M.; Iqbal, N.; Strielkowski, W. Impact of natural resource mining on sustainable economic development: The role of education and green innovation in China. Geosci. Front. 2024, 15, 101703. [Google Scholar] [CrossRef]
- State Statistics Bureau. China Statistical Yearbook. Beijing. 2021. Available online: https://www.stats.gov.cn/zs/tjwh/tjkw/tjzl/202302/t20230220_1913734.html (accessed on 20 February 2023).
- Audretsch, D.; Feldman, M. Chapter 61 Knowledge Spillovers and the Geography of Innovation. Handb. Reg. Urban Econ. 2004, 4, 2713–2739. [Google Scholar] [CrossRef]
- Girma, S. Absorptive capacity and productivity spillovers from FDI: A threshold regression analysis. Oxf. Bull. Econ. Stat. 2005, 67, 281–306. [Google Scholar] [CrossRef]
- Duranton, G.; Puga, D. Chapter 48-Micro-foundations of Urban Agglomeration Economies. Handb. Reg. Urban Econ. 2004, 4, 2063–2117. [Google Scholar] [CrossRef]
- Su, L.; Wang, Y.; Yu, F. Analysis of regional differences and spatial spillover effects of agricultural carbon emissions in China. Heliyon 2023, 9, e16752. [Google Scholar] [CrossRef] [PubMed]
- Hecock, R.D.; Jepsen, E.M. Should Countries Engage in a Race to the Bottom? The Effect of Social Spending on FDI. World Dev. 2013, 44, 156–164. [Google Scholar] [CrossRef]
- Zhang, Y.; Dilanchiev, A. Economic recovery, industrial structure and natural resource utilization efficiency in China: Effect on green economic recovery. Resour. Policy 2022, 79, 102958. [Google Scholar] [CrossRef]
- De Cesare, L.; Sportelli, M. Fiscal policy lags and income adjustment processes. Chaos Solitons Fractals 2012, 45, 433–438. [Google Scholar] [CrossRef]
- Abbasi, K.R.; Hussain, K.; Haddad, A.M.; Salman, A.; Ozturk, I. The role of Financial Development and Technological Innovation towards Sustainable Development in Pakistan: Fresh insights from consumption and territory-based emissions. Technol. Forecast. Soc. Chang. 2021, 176, 121444. [Google Scholar] [CrossRef]
- Ahmad, N.; Youjin, L.; Žiković, S.; Belyaeva, Z. The effects of technological innovation on sustainable development and environmental degradation: Evidence from China. Technol. Soc. 2023, 72, 102184. [Google Scholar] [CrossRef]
Disclaimer/Publisher’s Note: The statements, opinions and data contained in all publications are solely those of the individual author(s) and contributor(s) and not of MDPI and/or the editor(s). MDPI and/or the editor(s) disclaim responsibility for any injury to people or property resulting from any ideas, methods, instructions or products referred to in the content. |
© 2024 by the authors. Licensee MDPI, Basel, Switzerland. This article is an open access article distributed under the terms and conditions of the Creative Commons Attribution (CC BY) license (https://creativecommons.org/licenses/by/4.0/).