Abstract
The dairy sector faces increasing pressure to adopt sustainable practices. Various tools have been developed to evaluate sustainability of the dairy supply chain. This paper provides an overview of these tools, highlighting their strengths and limitations regarding sustainability dimensions, indicators, and system boundaries. A systematic literature search identified 27 tools that were then categorized into a typology based on dimensions of sustainability, geographical applicability, and accessibility. In-depth analysis was conducted on six tools: Sustainability Assessment of Food and Agriculture (SAFA), Sustainability Monitoring and Assessment RouTine (SMART), Response-Inducing Sustainability Evaluation (RISE) 3.0 version, Swiss Agricultural Life Cycle Assessment (SALCAsustain), MOnitoring Tool for Integrated Farm Sustainability (MOTIFS), and Technology Impact and Policy Impact CALculations (TIPICAL). Assessment focused on the relevance of covered sustainability dimensions to the dairy sector, level of supply chain coverage, type of indicators, accessibility, and practicability. The review identified tools which integrate multiple sustainability aspects in a comprehensive way (SAFA and SMART) and tools offering accurate quantification of the impact on sustainability dimensions of the production system (SALCAsustain, RISE, MOTIFS, TIPICAL). Only two tools extend assessment past the farm gate (SAFA, SMART). Future users should select tools based on the specific objectives of measuring sustainability in dairy systems. This review contributes to the literature by addressing various aspects of sustainability assessment tools, by addressing the need for an integrated and comprehensive view, and by considering the entire dairy supply chain.
1. Introduction
In recent decades, many frameworks and tools have been developed to measure, evaluate, and improve agricultural production practices [1,2,3], yet variations in definitions and components still exist due to diverse disciplines, political viewpoints, and values [1]. Addressing this contextual challenge involves establishing an understanding of the notion of sustainability and a universally recognized benchmark of what sustainable food production comprises [1]. Historically, the notion of sustainability has integrated environmental, social, and economic aspects, known as the “triple bottom line” of sustainability [4] or the three-pillar conception [5]. Governance was formally established as the fourth pillar by the United Nations Commission on Sustainable Development [6].
While the concept of sustainability has been long recognized, it has only begun to be actively discussed in the dairy sector since 2011, with many sustainability-related initiatives being implemented [7]. Assessing sustainability is a complex process, as the dairy sector involves a range of stakeholders, from farmers to consumers, and impacts multiple sustainability dimensions [3]. Actors from different societal groups, including the food industry, contribute to the transformation of food systems towards environmental friendliness, economic feasibility, and the provision of access to affordable food [8]. The dairy sector is facing major challenges in adopting sustainable practices and providing responsibly produced food [9,10,11]. External societal pressure and internal company pressure have driven components of dairy supply chains worldwide to start various initiatives and pledges to sustainability. Consumers also prioritize sustainability when selecting dairy products [12]. Taking this into account, retailers and large dairy processors are becoming the main initiators of implementing sustainability programs [13].
Globally, greenhouse gas emissions from the dairy sector increased by 18% between the years 2005 to 2015 [14]. Dairy production has also been strongly linked to acidification, eutrophication, the monotony of landscapes, and low biodiversity [10,11,15,16]. This generic statement is in line with findings on dairy production’s impact on individual categories [9,10,11,16]. This has led to the majority of sustainability assessment studies focusing on environmental issues and process efficiency [7], which in turn has led to an emphasis on the environmental dimension of sustainability assessment tools [17,18].
For a comprehensive supply chain assessment, the added dimension of governance is important [19]. Dairy farming is regulated at the national as well as international level, giving importance to the governance dimension when it comes to examining sustainability within the dairy context [17]. This particular dimension should garner attention to sustainability assessment due to the unfairness exhibited in terms of dairy farmers and their relation to the entire supply chain [19] and the demand in production and delivery transparency from consumers [20]. Equally important, economic sustainability focuses both on natural and economic capital, and ensures its sustainable use [17].
Sustainability assessment tools utilized for different food systems are often criticized for inadequately addressing the social sustainability dimension [21], while the economy and environment dimensions are commonly included [3,18,22,23,24]. This is partly because, in this context, social concepts are not sufficiently comprehensive and specified, let alone measured [25,26]. SAFA guidelines provide an integrated framework for assessing sustainability [1], through detailed consideration of all four dimensions as mentioned before. Therefore, industry stakeholders and major dairy producers need to establish frameworks in order to develop sustainability practices that take the focus beyond the environmental aspects.
Over the years, a vast array of methods, tools, and frameworks has emerged by which to assess sustainability at the levels of individual farms, farming systems, or supply chains [2]. Simultaneously, these tools have undergone review in terms of relevance, applicability, and ease of implementation. Scientists have systematically compared and categorized these tools through different schemes, as shown in Table 1. Díaz De Otálora et al. [3] identified the tool’s level of integration of three main sustainability pillars. This was also undertaken by Schader et al. [2], who explained the distinct perspective on sustainability and classified tools according to their scope and precision. Many of these integrated three pillars of sustainability [5]. Gasparatos and Scolobig categorized sustainability assessment tools into three main types: monetary tools, biophysical tools, and indicator tools [27]. Others have assessed tools based on their definition and their operationalization of specific sustainability dimensions, such as the social dimension [24]. Their applicability in certain regions was also analyzed and categorized [28], along with their normative systemic and procedural dimensions [23], object and temporal focus [22], scientific soundness, utility, and applicability [29], as well as the methodology, data, time, and budgetary constraints they imposed [30].

Table 1.
Literature background. Previous reviews with a focus on sustainability assessment tools and their limitations.
Sustainability assessment is undertaken using qualitative and quantitative indicators, and a holistic and integrated approach [31] has been deemed successful for the sustainability assessment of agricultural systems [30]. In the context of the dairy sector, the majority of sustainability assessment studies have primarily focused on environmental issues and process efficiency [7], which has led to an emphasis on the ecological dimension of sustainability. Because overall sustainability of the dairy sector is an outcome of all four dimensions, our research utilizes the SAFA guidelines to evaluate selected dairy sustainability assessment tools and their coverage of the four dimensions. The motivation for this work was to offer a review that does not only investigate the thoroughness of the tools in terms of sustainability dimensions, but also investigates the way in which tools are suited for the dairy sector’s specific challenges. While numerous reviews have focused on sustainability assessment tools for food systems, they have not systematically examined the sustainability aspects relevant to the dairy sector. Considering the scarcity in comprehensive tool coverage in the context of the dairy sector, this work contributes to the literature by addressing various aspects of sustainability and considering the entire dairy supply chain. The tools are analyzed for thematic relevance to the dairy sector, supply chain coverage, comprehensiveness of sustainability dimensions, type of indicators, accessibility, and practicability.
The overall aim of this review is to offer guidance for actors along the dairy value chain who are beginning to engage in a comprehensive sustainability analysis on the choice of an accessible and appropriate tool by which to assess sustainability in the dairy supply chain. It also seeks to address the questions regarding what sustainability themes and sub-themes are covered in accessible dairy sustainability assessment tools and how different parts of the supply chain are accounted for in the assessment process, while also taking into consideration the type of indicators used.
2. Materials and Methods
2.1. Methodological Framework
Prior to conducting the search and analysis, a methodological framework was established based on the Preferred Reporting Items for Systematic Review and Meta-Analysis (Prisma) method [32]. This method provides a transparent, complete, and accurate account of the review’s purpose, methodology, and findings [32].
A comprehensive search strategy was applied by focusing on terms such as “sustainability”, “assessment”, “analysis”, “method”, “tool”, “indicator”, “dairy sector”, and “dairy farm”, to capture a broad spectrum of tools relevant to the study objectives. Based on the research question, a search string was developed: (sustainability AND (assessment OR analysis*) AND (method OR tool) AND indicator AND (dairy sector OR dairy farm OR cow OR milk)). The search was conducted in the scientific databases Scopus and Web of Science. The latter yielded 135 results, while the former yielded 6525 results. Prior to full-text screening, duplicates (68 publications) were removed manually. The remaining entries (6592 publications) were selected for screening in ASReview [33]. ASReview, an AI tool from the University of Utrecht, supports literature reviews by sorting search results for relevance. Users upload search results with abstracts and identify relevant and irrelevant publications. The AI learns from these selections, continuously re-evaluating and prioritizing the list, iteratively presenting the next best options to the user. It was arbitrarily decided to stop the review after reaching 7.33% of the total number of papers (i.e., 483 publications). Due to this, 1.52% (i.e., 100 publications) of the total number were deemed irrelevant following the last relevant paper addressing the research question. Of 483 publications, 388 were excluded as they did not focus on sustainability assessment and did not consider any sustainability assessment tools, methodologies, or frameworks. This ensured that 95 potentially relevant publications were to be analyzed individually.
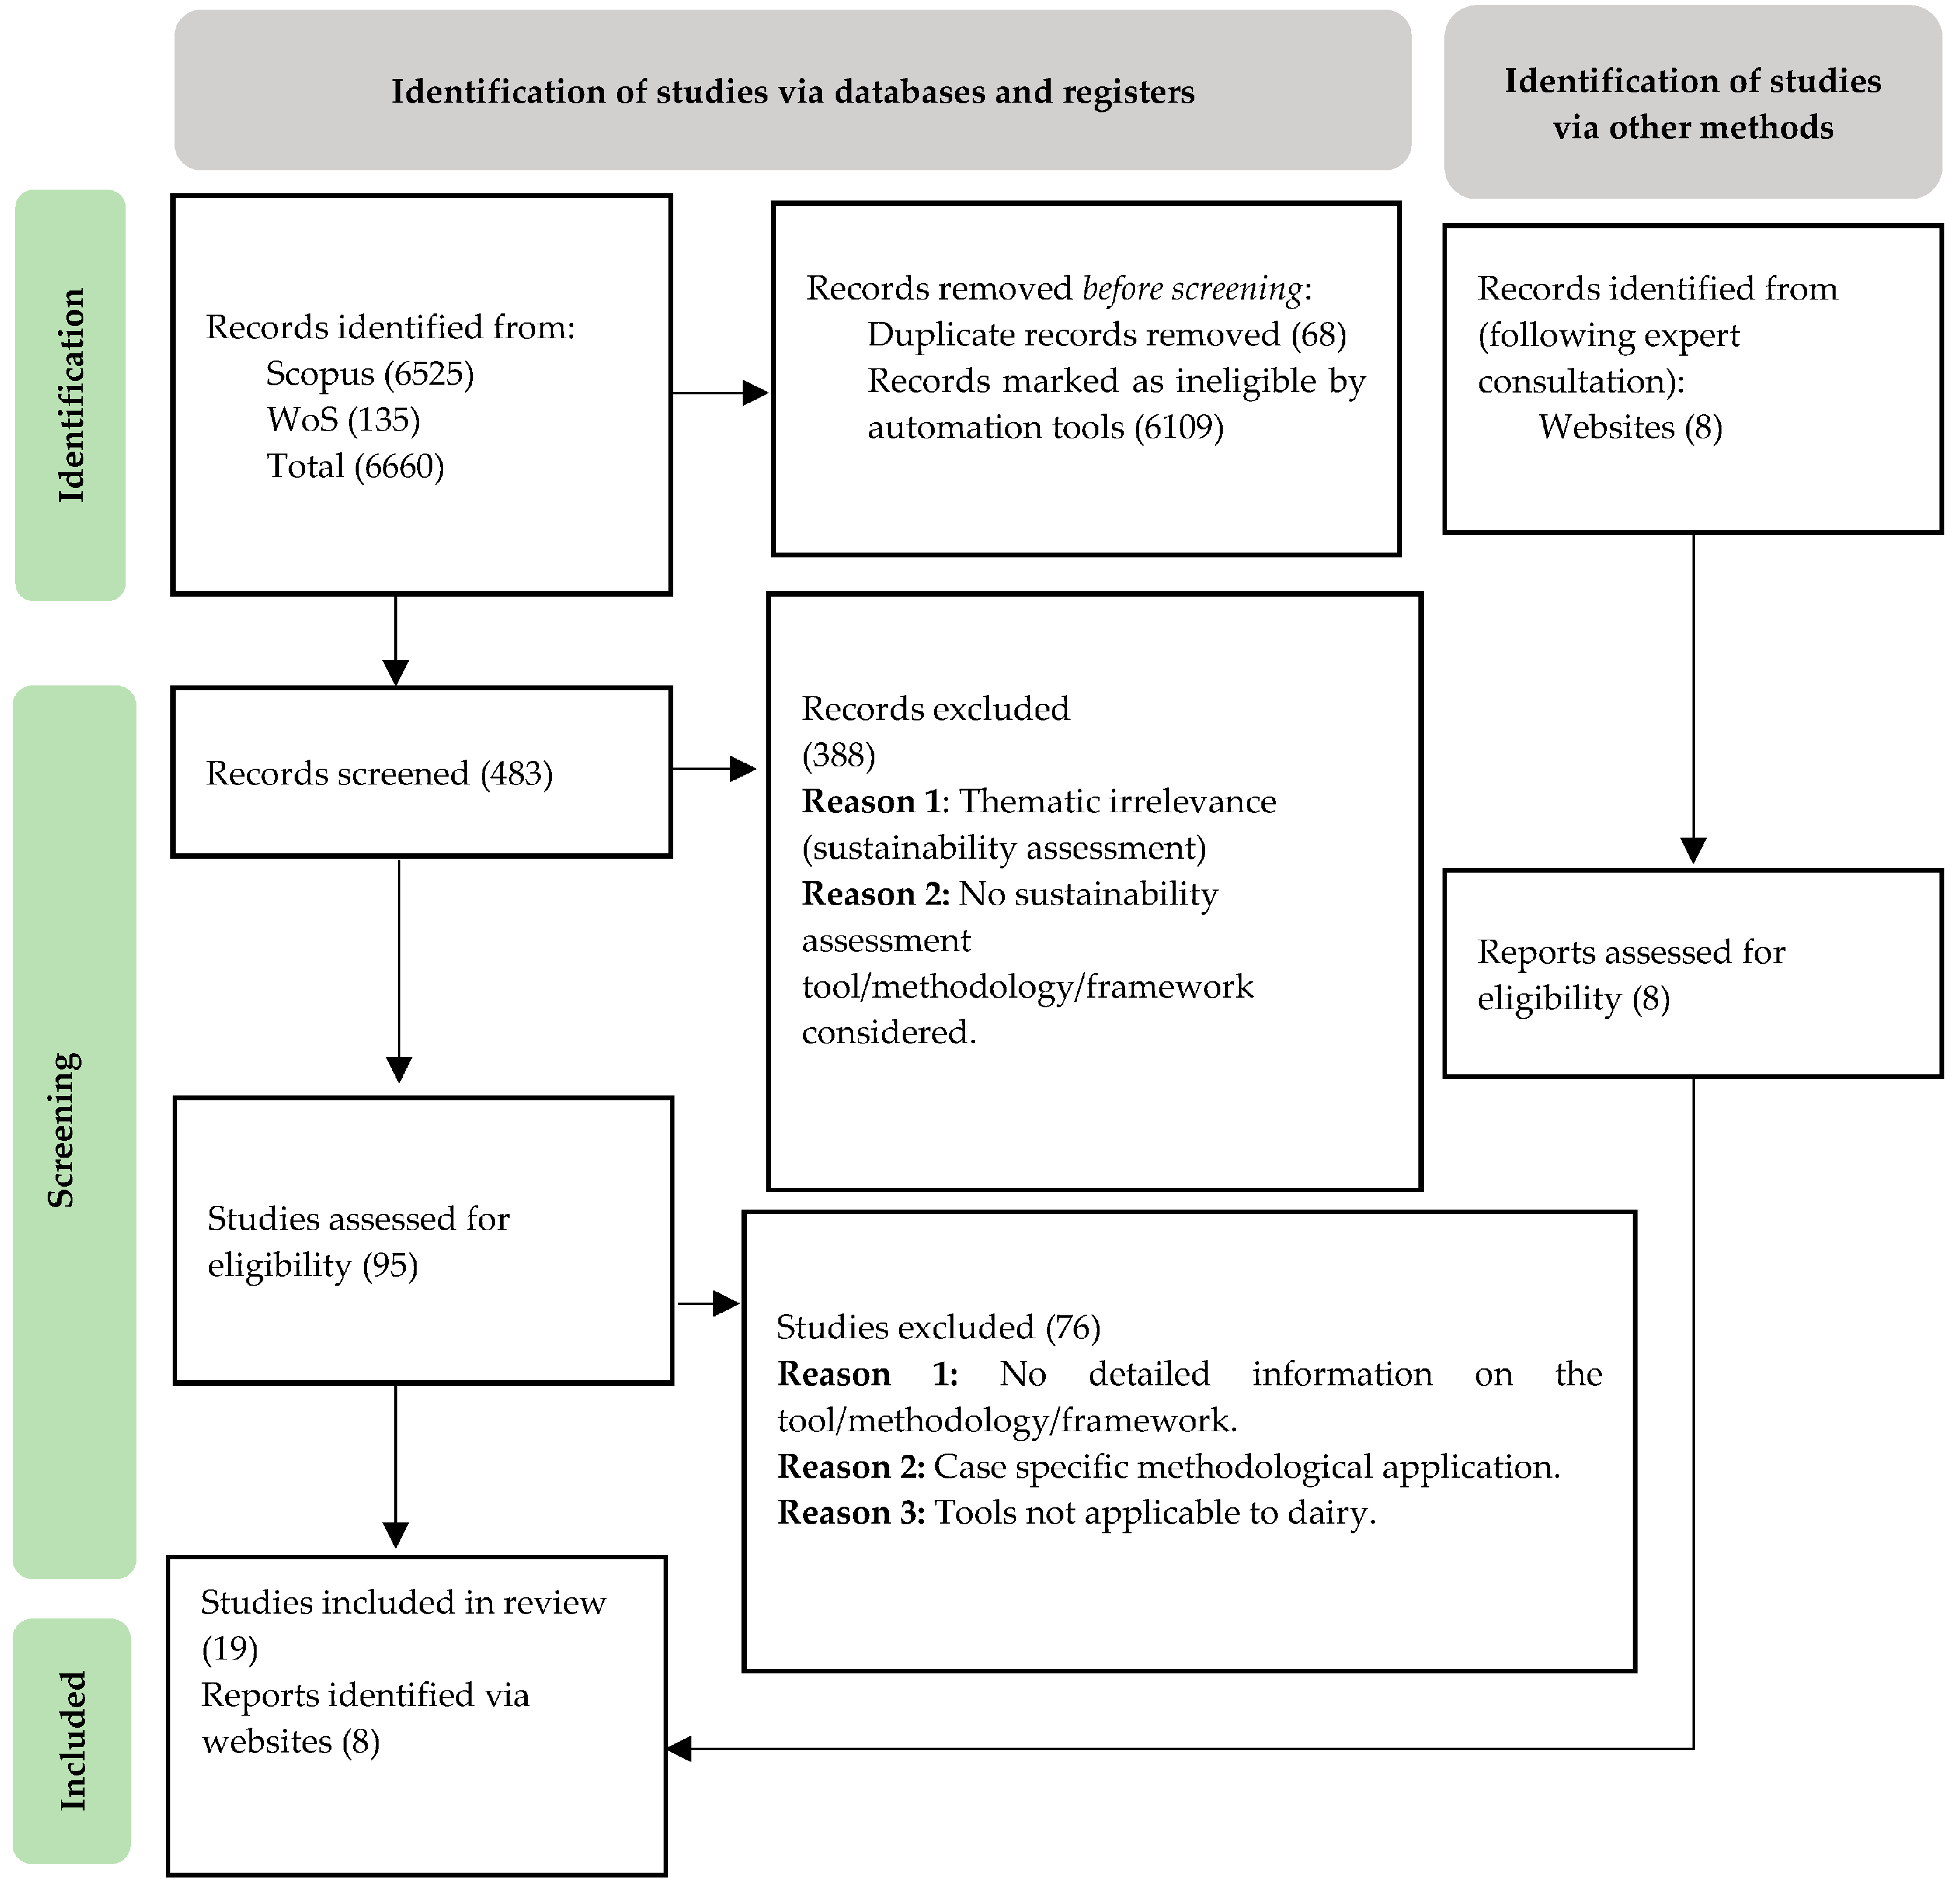
During the individual analysis of the 95 publications, 76 were excluded due to (1) not offering detailed information on the sustainability assessment tool, methodology, or framework; because they were (2) case-specific methodological applications; and (3) because the tool/methodology/framework could not be applied to the dairy sector. This yielded 19 relevant publications in total. Additionally, 8 relevant records were identified from websites following expert consultation, amounting to 27 total entries relevant to the study. Figure 1 shows a flow diagram of the research process.
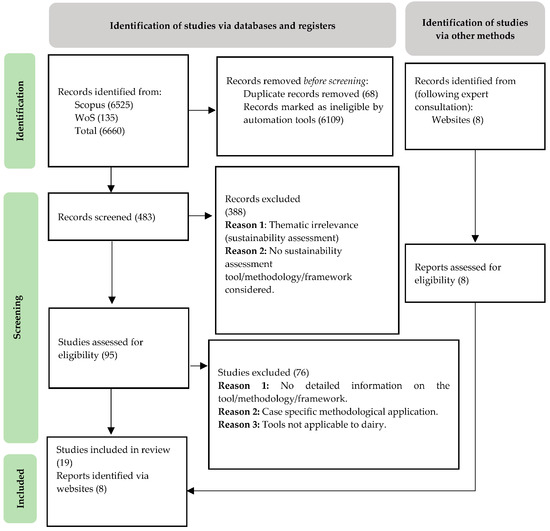
Figure 1.
Research process flow. Authors own elaboration based on PRISMA2020 [32].
Specific criteria were applied for manually selecting tools for in-depth analysis from the total of 27. These criteria included accessibility, coverage of at least three dimensions of sustainability, and utilization of indicator-based assessment methodologies. This process is further elaborated in the next section.
2.2. Development of Typology and Selection for In-Depth Analysis
Based on the works of Schader et al. [2], and by utilizing the selected tools, a typology was constructed to categorize the tools based on their sustainability dimensions, geographical applicability, and accessibility. Although the focus was on tools covering three dimensions of sustainability, tools with a strong dominance of environmental aspects were not excluded, for the sake of comparison. Geographical applicability indicates the intended geographical scope of the tools, while accessibility defines whether the tools were fully accessible for use or if information on the tools was retrieved from other sources.
Subsequently, six tools were selected for further analysis, guided by the predefined selection criteria: Sustainability Assessment of Food and Agriculture “SAFA Sustainability Monitoring” and Assessment RouTine (SMART), Response-Inducing Sustainability Evaluation (RISE) 3.0 version, Swiss Agricultural Life Cycle Assessment “SALCAsustain”, MOnitoring Tool for Integrated Farm Sustainability “MOTIFS”, and Technology Impact and Policy Impact CALculations “TIPICAL”. All six of these tools cover all three of the following sustainability dimensions: environmental integrity (EI), economic resilience (ES), and social wellbeing (SW), while SAFA and SMART also cover good governance (GG). The indicators of each sub-theme of sustainability used by each tool were counted and compared. Additionally, a critical discussion was conducted regarding whether the predefined sub-themes by SAFA guidelines [1] were addressed by the tools through the specifically tailored indicators. All six tools could be used in a wider geographic scope, and descriptions of their methodology and indicator type were available. Tools were then analyzed according to (1) sustainability dimensions covered, (2) level of supply chain coverage, and (3) type of indicators and accessibility. The level of supply chain coverage defines the extent to which the tools address different elements of the dairy supply chain, from the production of raw materials to retail. A special section is dedicated to the type of indicators and accessibility criterion.
3. Results and Discussion
The results are presented and discussed in the following section. The typology, as the first part of the review, was applied to 27 tools in total (see Table 2). The second part includes the in-depth analysis of the six tools that were selected from the typology.
Table 2.
Categorization of sustainability assessment tools that apply to dairy according to the set criteria.
3.1. Categories and Characteristics of Tools
Tools were categorized from the perspective of the dairy sector rather than the sector for which they were primarily intended. Of all 27 tools (see Table 2), four covered only the environmental dimensions (COOL FARM, DAIRY SAT, DairyGEM, and GLEAM). Two tools (SAFA and SMART) also covered good governance in addition to the three pillars of sustainability. Except for the six tools mentioned above, the other tools covered the environmental and social dimension. Overall, the selected tools can be categorized as (i) indicator-based assessment tools (IDEA, MOTIFS, RISE, SAFA, SMART, SALCAsustain, IFSC, DSI, Dairy Sustainability Framework-DSF, SPA, INSPIA, Caring dairy, SEEbalance, SSP, Public Goods Tool, and TIPICAL), (ii) dynamic models offering an impact-related and quantitative assessment (Delta, GAMEDE, SIMS Dairy, FARMIS, and WLGP) and (iii) life cycle assessment tools (COOL FARM, Dairy SAT, DairyGEM, and GLEAM). The latter tools extensively focused on the environmental dimension. Of the selected tools, two could not be assigned to any of the categories above: MODAM, an on-farm cost-calculating tool, which also considers the environmental and social dimensions, and FARMIS, which considers the environmental and the economic dimensions.
Concerning the geographical scope, nine tools can be applied globally (DairyGEM, COOL FARM, GAMEDE, GLEAM, RISE, SAI, SMART, TIPICAL and DSF), nine tools were intended for, and applied at, the national level so far (DAIRY SAT, DELTA, FARMIS, IFSC, IDEA, MASFDD, MODAM, Public Goods Tool, and WLGP) and eight tools were intended for transnational use (Caring dairy, DSI, INSPIA, MOTIFS, SALCAsustain, SIMS Dairy, SSP, and SEEBalance).
Of all 27 of the tools, two labeled as “Free” (Table 2) were fully accessible (SAFA, and GLEAM). The tools categorized as “Accessible *” were those for which the authors needed to be contacted or for which information could be retrieved from scientific articles. For most of the tools, information on their accessibility could not be found. Some tools among those selected for in-depth review were accessible through scientific papers or reviews, reports on tools instructions, or through the retrieval of information directly from the developers or people responsible for the tool’s maintenance and update. Some of the tools were created in recent years, while RISE, though created in 1999, has been updated continuously in terms of its thematic relevance and applicability.
Six tools were selected for further in-depth analysis, which covered at least three dimensions of sustainability, and which were accessible entirely or through information given in academic papers, with a wider geographical scope (regional or global). Selected tools (see Table 3) were further reviewed according to their (I) thematic relevance (sustainability dimensions/themes/sub-themes covered), (II) level of supply chain, and (III) input data type and accessibility.
Table 3.
Assessment of tools: sustainability dimensions, level of supply chain, type and count of indicator, and accessibility.
3.1.1. SAFA
The SAFA Tool (version 2.2. 40) is a freely accessible software. The tool has a wide scope and covers the entire dairy supply chain, including upstream and downstream impacts. It is a comprehensive tool for assessing sustainability and can be used free of charge by any assessor or relevant stakeholder [1]. The themes, sub-themes, and indicators provided in the SAFA guidelines serve as a basis for evaluating the integration of themes in other tools. SAFA allows for contextualization of the assessment, allowing the assessor to tailor the sub-themes and indicators to the entity being assessed [1], and provides 116 indicators in total.
3.1.2. SMART
SMART is a comprehensive sustainability assessment tool, based on SAFA guidelines, that has been successfully applied to various farming systems [2,57,65]. It consists of up to 327 indicators for farm applications in a custom-built database. Some of these indicators can also be used in different stages of the supply chain. SMART adjusts the SAFA dimensions, themes, sub-themes and objectives to the entity being assessed, selecting only relevant indicators. It is important to note that similar indicators are used several times within a sub-theme. The tool is not intended for the farmer as the end user, but rather as an assessment and advisory tool for the entire supply chain [56]. However, it is still applicable to the farm level as it accounts for the impact of farm activities on the upstream parts of the supply chain.
3.1.3. RISE
RISE is a farm advisory tool that uses an interview-based method to assess the sustainability performance of on-farm production across all three dimensions of sustainability [2,52]. It is intended for use by farmers and farm advisors and has been widely applied globally, including in the dairy sector [2]. RISE emphasizes indicators within the environmental dimension and generates a farm sustainability profile based on calculated parameters and scores derived from normalized data. The tool is useful for identifying areas of good vs. poor sustainability performance on a farm and offers 46 indicators in total, though its software does not offer free access.
3.1.4. SALCAsustain
The need for a comprehensive indicator-based sustainability assessment tool that incorporates more quantitative indicators motivated Roesch et al. [53,54] to develop SALCAsustain. This tool, although not exclusively created and used for the dairy sector, presents a feasible on-farm sustainability assessment tool that focuses on the transnational level. This model presents another comprehensive approach, which estimates the environmental, social, and economic impact of farms with the use of indicators. In addition to its use at farm level, SALCAsustain has also proven to be a robust method by which to assess product level, which presents as an important overall differentiation feature from other reviewed tools.
3.1.5. MOTIFS
MOTIFS stands for MOnitoring Tool for Integrated Farm Sustainability, and represents a comprehensive tool for sustainability assessment [49]. This model is also indicator based, with a focus on the environmental and social dimensions. Although its sector scope is wide, so far it has only been used to assess sustainability in Flemish dairy farms [2]. Important consultants and stakeholders have taken part in the development of the model, especially in regard to the social dimension. The tool offers a total of 22 indicators. The tool does not offer its own software but comprises a specifically created database.
3.1.6. TIPICAL
The Technology Impact Policy Impact CALculations (TIPICAL) model is a farm level tool that enables its user to analyze a farm’s impact not only in the scope of the economic dimension, but also regarding social and environmental issues [66]. It has been designed specifically to offer a comprehensive sustainability assessment of the dairy sector. This is a key differentiation feature from other reviewed comprehensive assessment tools. TIPICAL is an excel sheet-based database and provides farm benchmarking, sensitivity analysis and forecast.
3.2. Thematic Coverage, Input Data Requirements and Accessibility
The quality of the tool is dependent on the tool’s relevance regarding themes, sub-themes, and aspects of sustainability. This, among many other attributes, indicates the tool’s future usage. Focus was placed on the number of indicators used and if they are designed to truly capture the main environmental and socio-economic issues for which the dairy sector has a high impact.
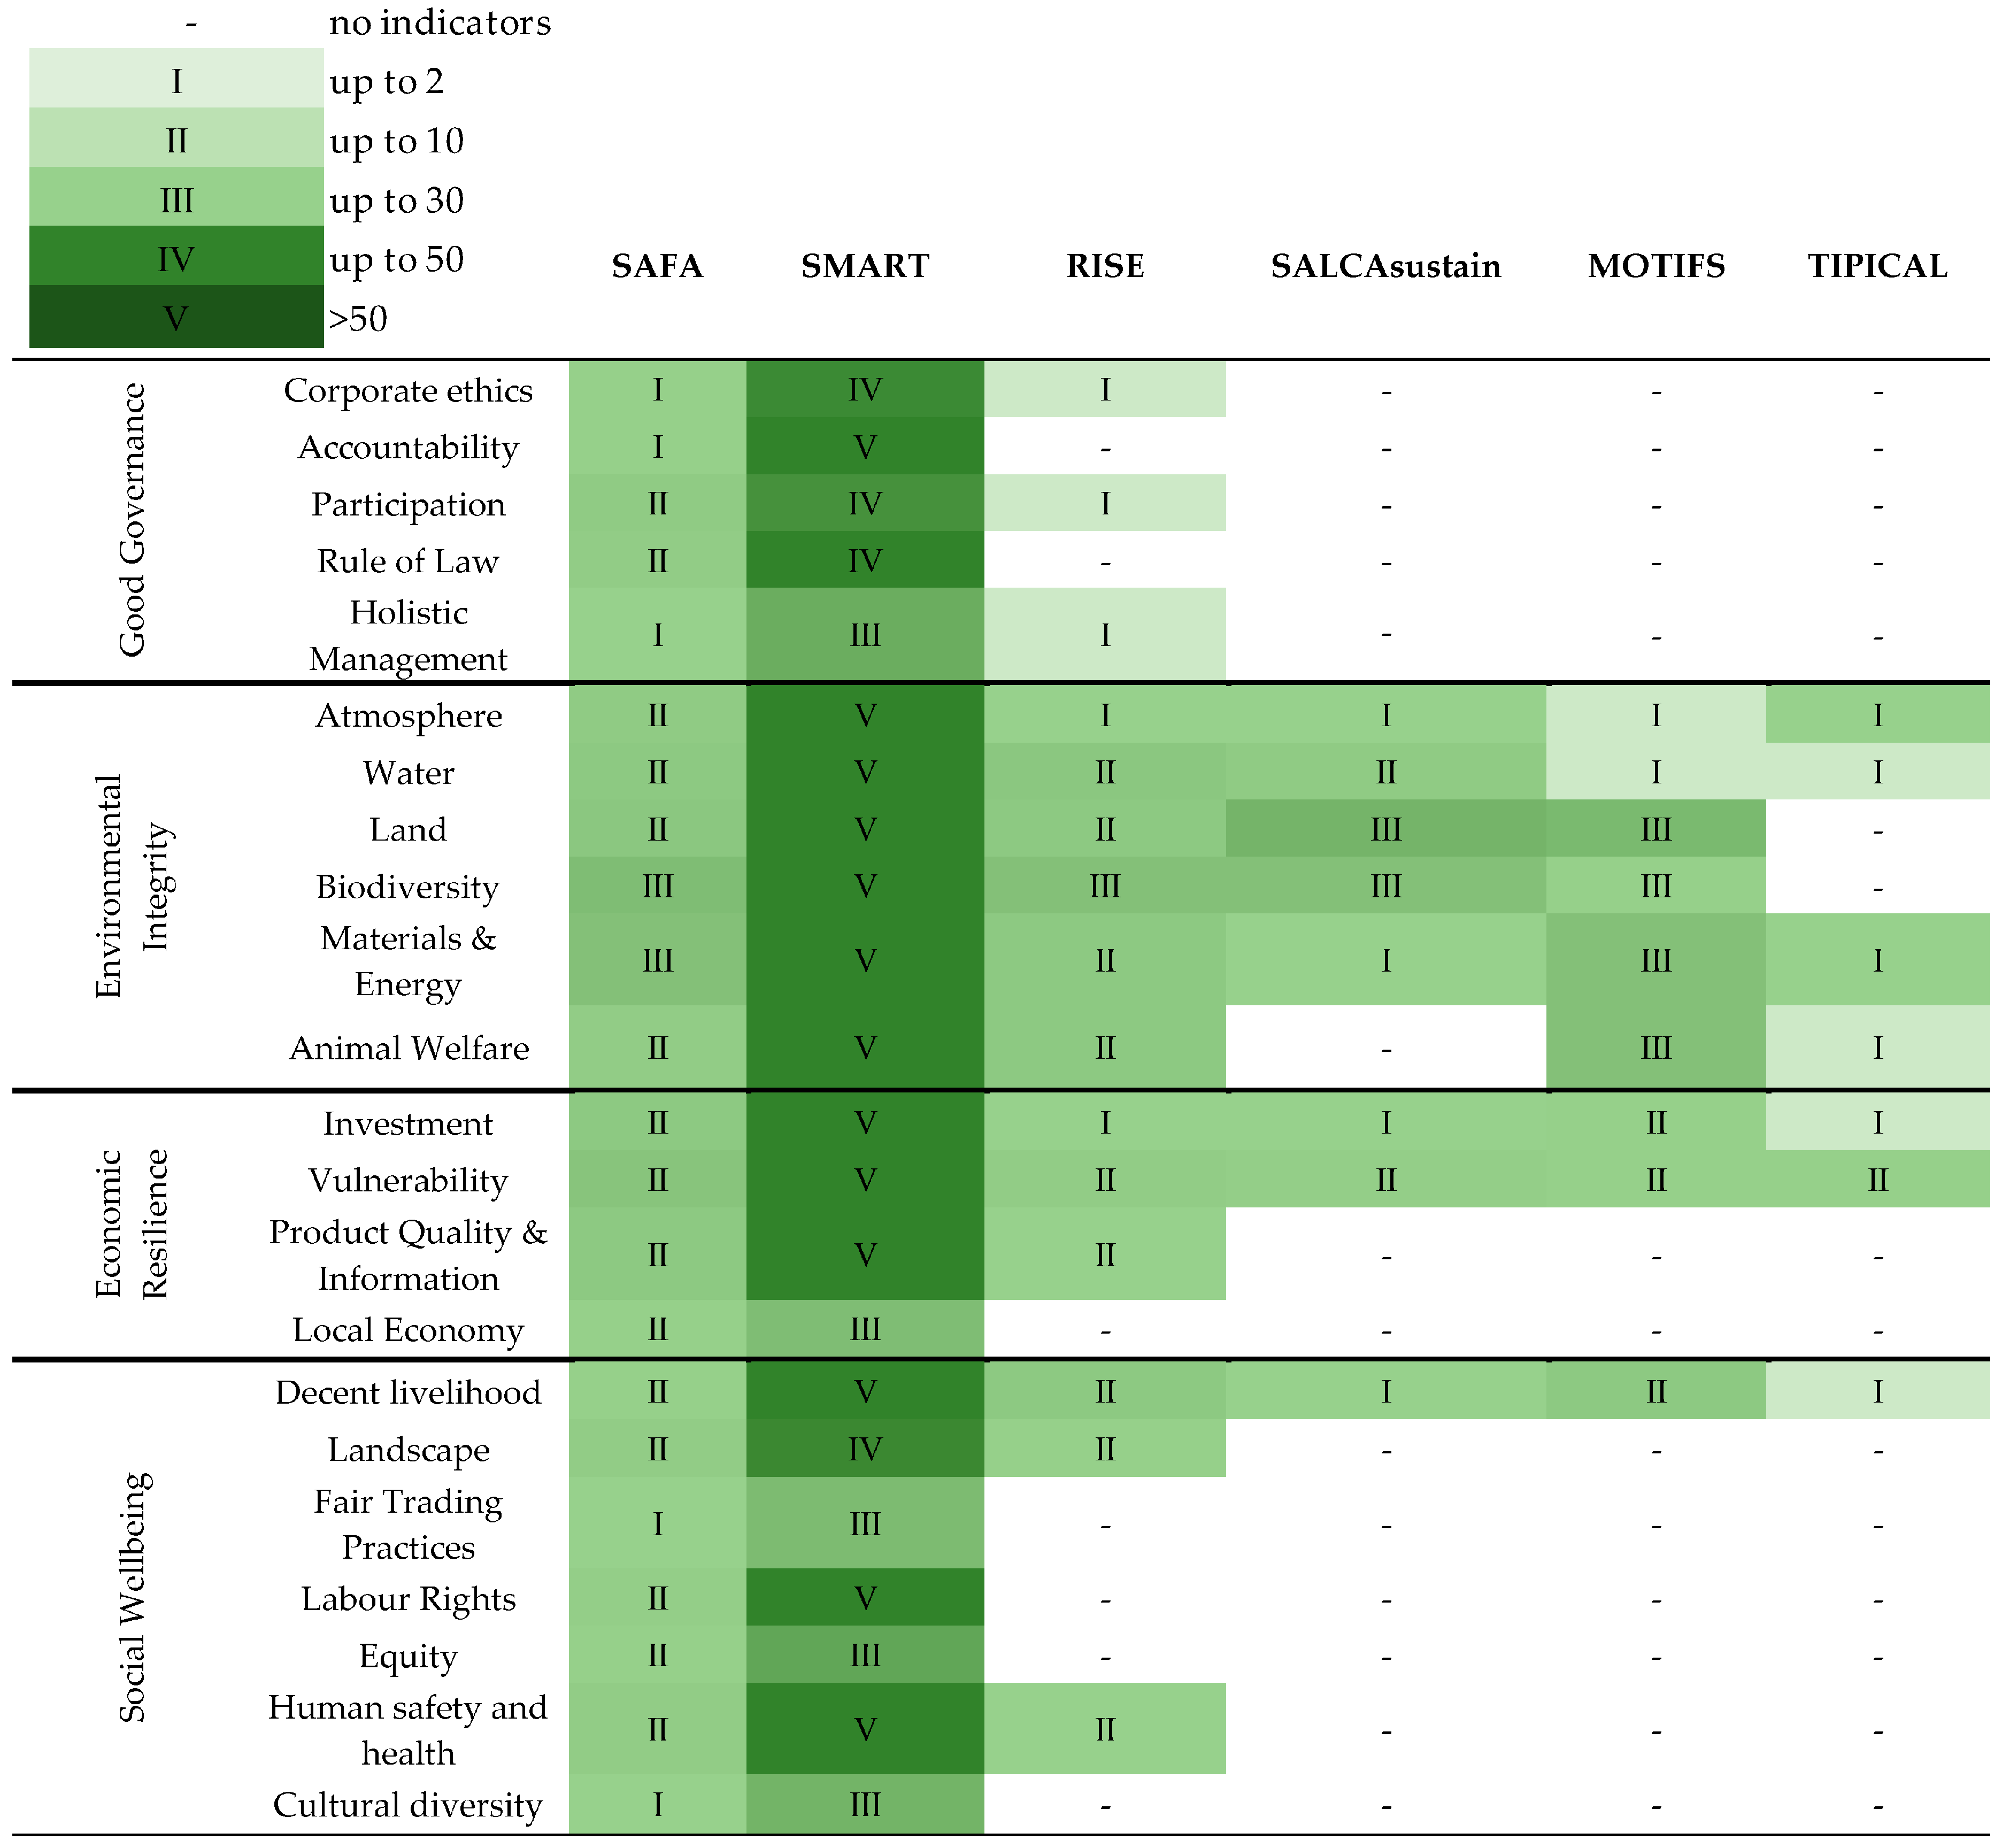
The SAFA guidelines present four key dimensions: good governance, environmental integrity, economic resilience, and social wellbeing. In this study, assessment was made regarding the number of indicators that the tools consist of in regards to the sub-themes listed in the SAFA guidelines. In good governance, the sub-themes include corporate ethics, accountability, participation, rule of law, and holistic management. Environmental integrity includes sub-themes such as atmosphere, water, land, biodiversity, materials and energy, and animal welfare. Economic resilience covers sub-themes like investment, vulnerability, product quality and information, and local economy. Lastly, social wellbeing comprises sub-themes such as decent livelihoods, fair trading practices, labor rights, equity, human health and safety, and cultural diversity. In Figure 2, the information provided in Table 2 is examined, specifically the dimensions of sustainability and the extent of coverage of the sub-themes. A hierarchical categorization is devised in Figure 2, with five distinct levels. Level (-) indicates the lack of indicators for the respective sub-theme, all the way to level (V) which denotes that more than 50 indicators address that theme in the respective tool. This shall provide an overview of whether certain sub-themes are addressed by the respective tool but does not depict whether the sub-themes are covered adequately, nor whether a certain tool should be considered as “the ideal tool”.

Figure 2.
Visual representation of the extent of thematic coverage in selected tools based on numbers of indicators.
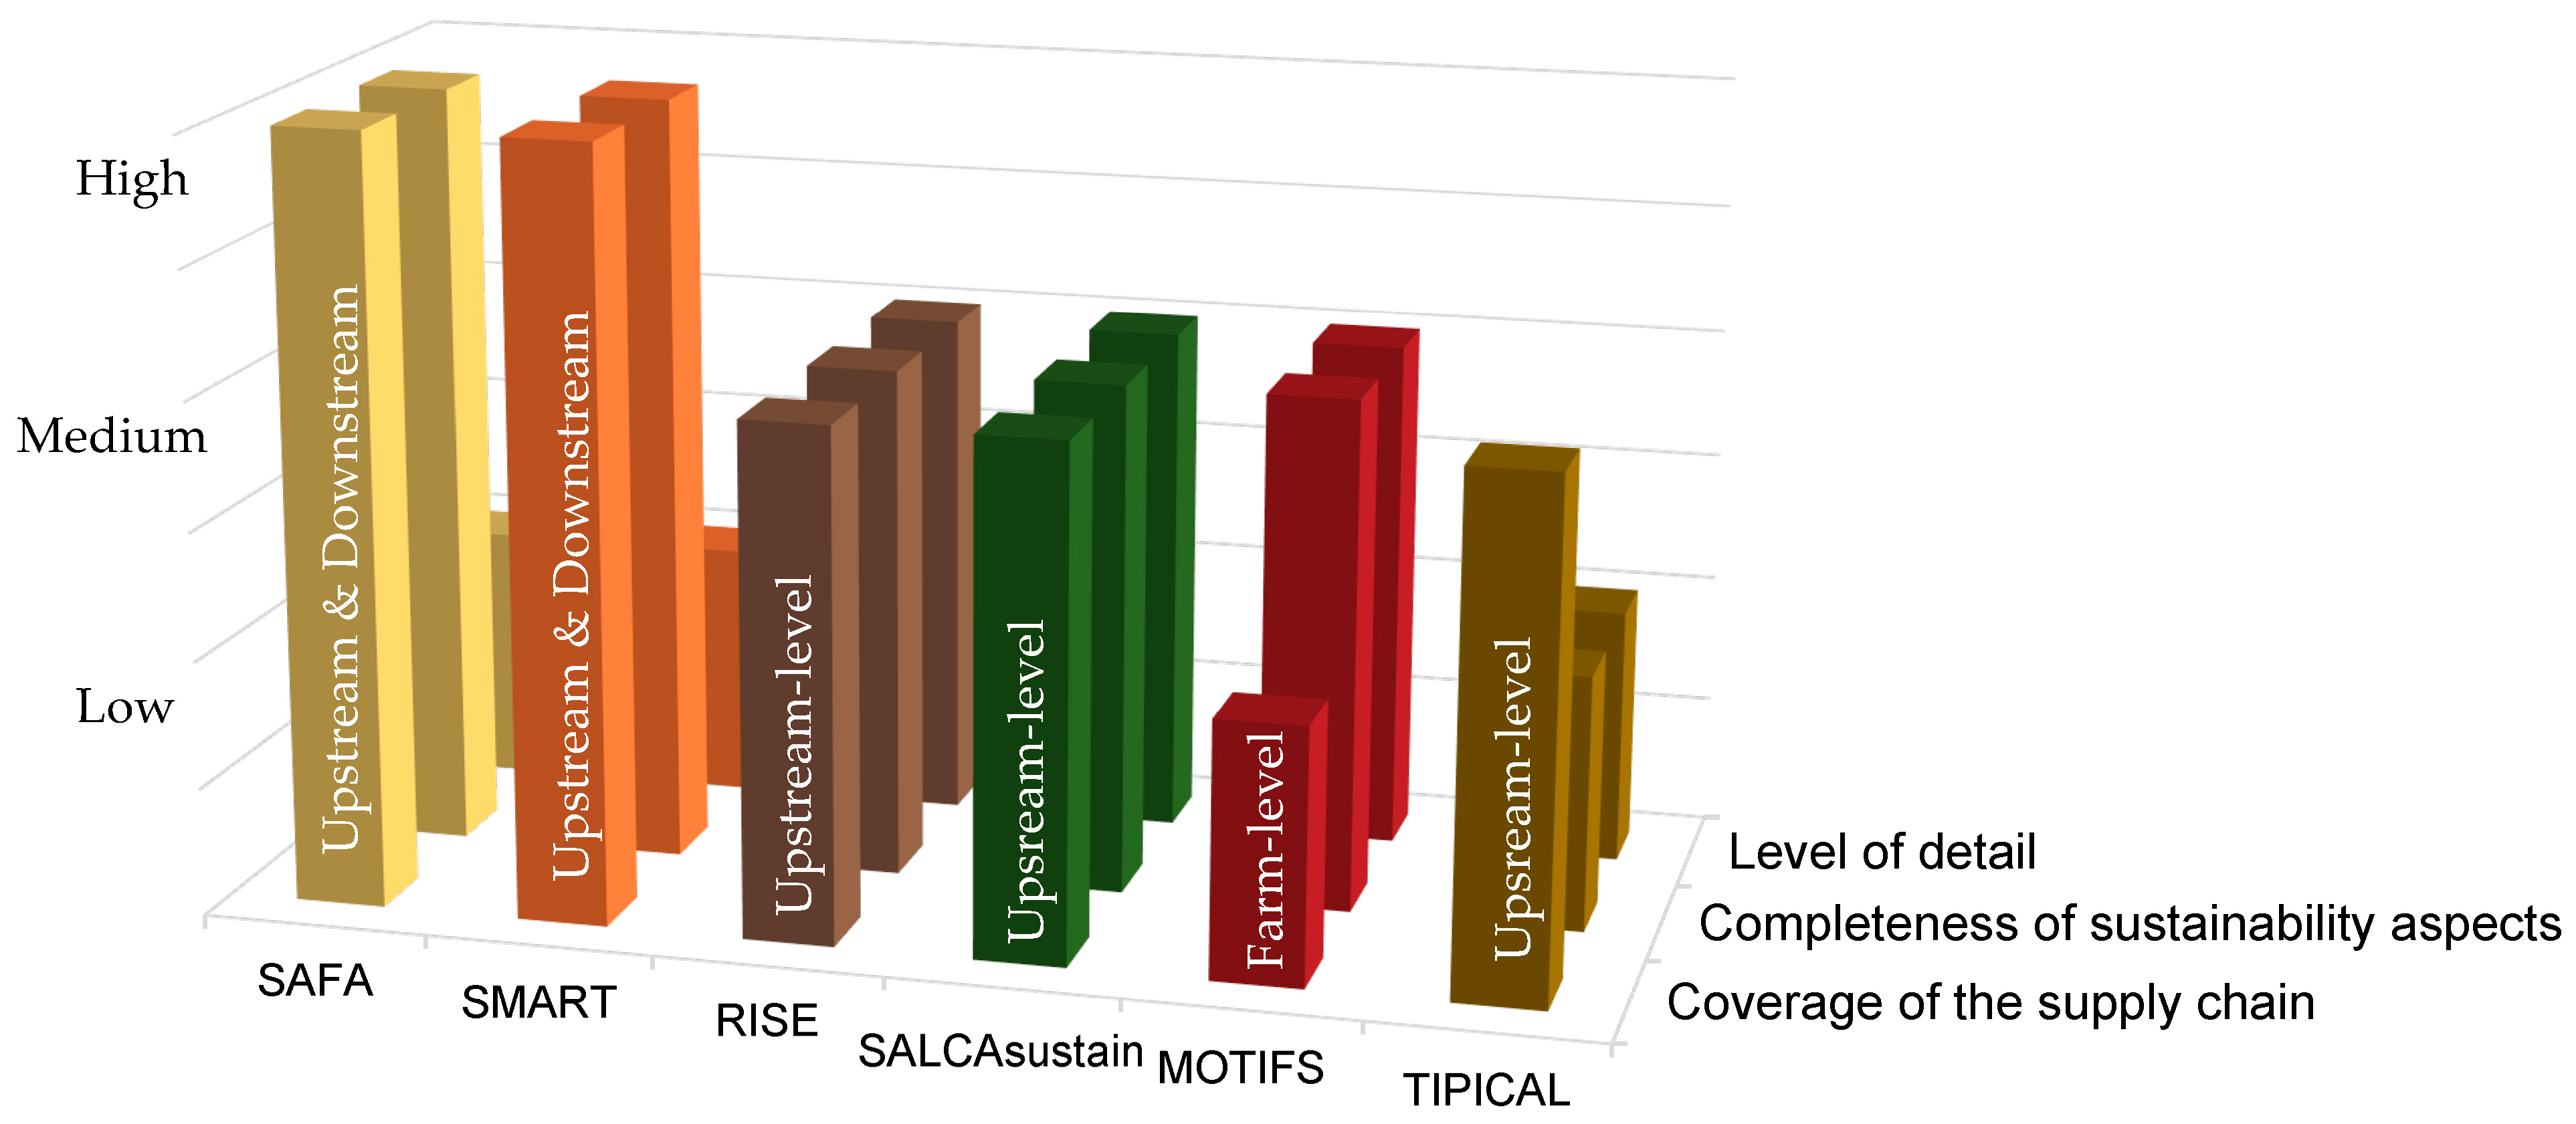
Substantial gaps were witnessed for certain sub-themes of good governance and especially the social wellbeing and good governance dimensions in most tools. Environmental sub-themes were addressed by all tools, albeit rather differently. This variety between tools in terms of addressing the sustainability dimensions is also presented in Figure 3. This visual presentation offers a key to also understanding the level of detail of each tool and coverage of the dairy supply chain compared with one another.
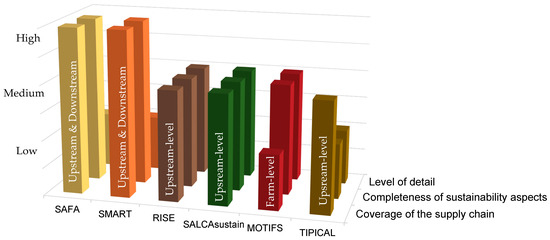
Figure 3.
Comparison of tools in terms of level of detail, completeness of sustainability aspects, and coverage of the dairy supply chain.
Category levels range from “low” to “high” in terms of detail or indicator type (where high denotes that the tool consists of more quantitative indicators and low of more qualitative indicators) and thoroughness (sustainability aspects included). Supply chain coverage includes “farm”, “upstream level”, and “upstream and downstream”. Upstream level consists of farm plus the input supply, while the downstream goes beyond the farm gate.
3.2.1. Good Governance
The SAFA tool covers good governance with a set of 19 indicators [1]. The designed indicators aim at measuring an enterprise’s mission transparency, the responsible stakeholder’s participation, continuous improvement of regulatory frameworks in the context of sustainability and more. In addition, having a sustainability management plan is considered to be the starting point of aligning with sustainability practices, in the context of good governance [1]. Indicators for this dimension can be applied across the entire supply chain but would need different measures included to be applicable to the farm.
Aspects of good governance, such as responsibility, transparency, and rule of law, stand for open-access reliable information for the public, social responsibility towards all stakeholders, and their protection, respectively [1]. In the context of the dairy sector this also refers to regulations on milk safety, traceability and transparency [20] throughout the whole dairy supply chain. These aspects are covered extensively in SAFA and SMART. RISE has indicators that could fit within the scope of transparency, in the form of available information about a farm and its financial situation. In RISE, there are also indicators that cover the impact of farm management on sustainability dimensions, namely the expected impact on economic, environmental, and social aspects. A dairy farmer’s management strategies are assessed based on how they prioritize impacts on and off the farm in terms of sustainability standards. In dairy and other agriculture supply chains, good governance indicators also consider the rights of less engaged stakeholders. This is particularly important for dairy, as farmers need to be engaged and to ensure their participation as stakeholders within the supply chain in order to have bargaining power, which is also important for economic resilience. SMART also emphasizes a farmer’s civic responsibility and their duty to engage with their local communities on social and environmental issues [56].
Corporate social responsibility (CSR) is a key determinant of competitive advantages in dairy supply chains [13] and is emphasized in both the SAFA and SMART tools through various indicators. Well-established CSR ensures efficient dairy production and quality of dairy products [13]. In an exclusive dairy sustainability assessment tool, the quality assurance aspect should garner special attention, not only to the scope of good governance but also in relation to the environment and the product. SMART and SAFA both employ indicators when measuring responsibility and transparency in the context of the farm and the farmer. SMART offers indicators that also account for farm inputs and their suppliers, like information on an input supplier’s origin and traceability, how much of the input is externally sourced, and many more issues that are accounted for through a range of indicators. RISE, SAFA, and SMART also place importance on resilient relationships and conflict resolution aspects, giving these tools advantages in good governance assessment. SALCAsustain, and MOTIFS do not incorporate indicators that could pertain to the alignment of a farm’s strategy and management with the mentioned good governance dimension principles and goals. TIPICAL does not offer indicators within the good governance scope.
3.2.2. Environmental Integrity
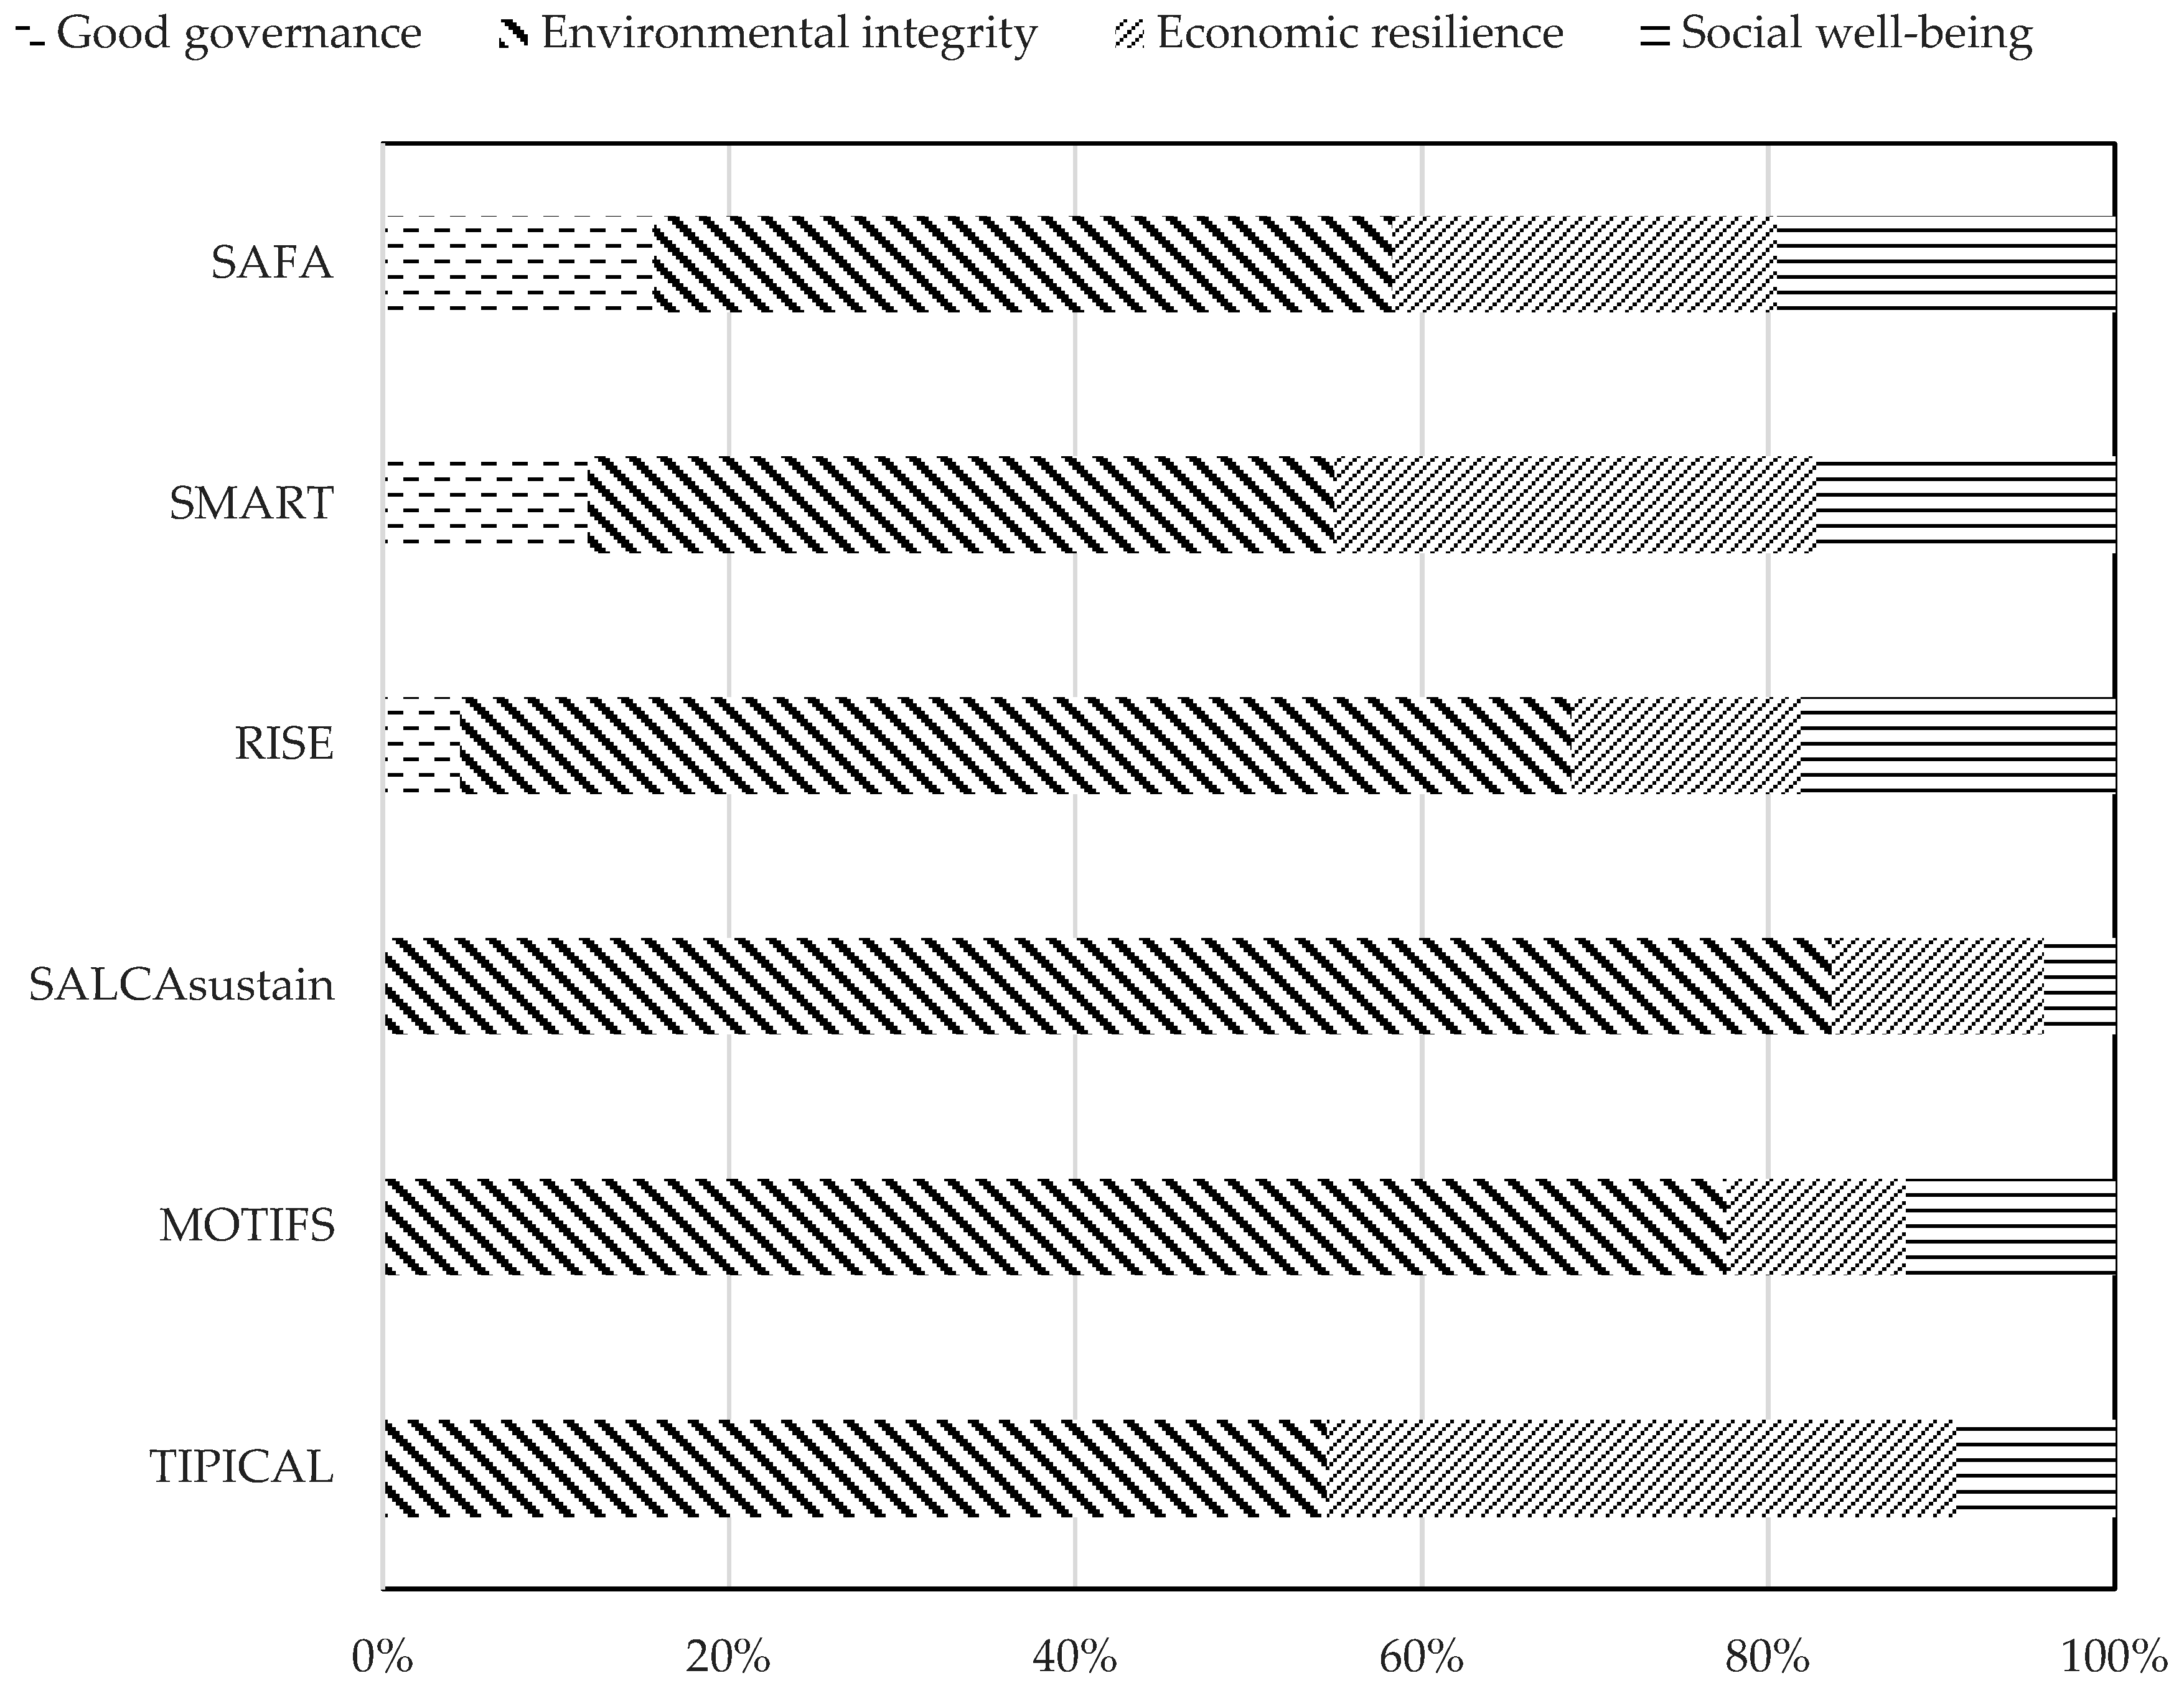
The environmental dimension is quite extensively accounted for in most of the tools, as seen in Table 2 and Figure 2 and Figure 4. SAFA offers 52 indicators, which mostly offer semi-quantitative output. The sub-themes depict the major facets of impact of the dairy sector and can be easily employed to its context. In this respect, SMART can be used as an example. Schader et al. [56] have reported that, in SMART, a total of 654 indicators affects the environmental dimension in its entirety, as the same indicators are used several times throughout three dimensions due to synergy. When referring to dairy being linked to GHG emissions, it is important for these tools to be able to offer the appropriate indicators when identifying and measuring the main emission sources related to dairy, e.g., enteric methane. SMART does not contain this, while RISE and TIPICAL apply various parameters, including the estimation of methane emissions. In RISE, the environmental dimension can be considered as sufficiently covered and quantified. In fact, of all of the dimensions, this is the most comprehensively covered. This is due to RISE including a higher level of quantitative detailed indicators in the context of the dairy impact facets. This is also witnessed in MOTIFS, where 12 environmental indicators out of 21 cover the environmental impact.
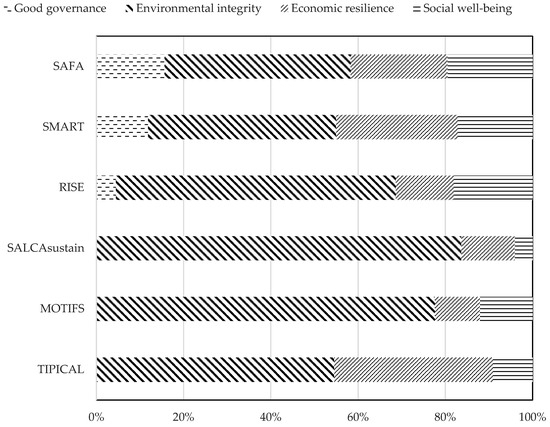
Figure 4.
Distribution of sustainability dimensions in reviewed tools.
Following the steps of Schader et al. [56] and the review of SMART indicators, RISE contains a total of 28 indicators that refer to the environmental dimension. SALCAsustain contains 42 indicators that address the overall dimension, while MOTIFS has 43 indicators. Other important sub-themes within the environmental dimension in SAFA address land, water, energy, material, and waste. In SAFA guidelines these themes refer to the resources extracted from the environment and their use in the economic processes of the assessed entity [1]. A total of 132 indicators are assigned to the energy and material use sub-themes in SAFA. Due to the dairy chain being energy intensive, this sub-theme should be considered in a comprehensive sustainability assessment. Contrary to other tools, like RISE and SALCAsustain, which typically only included the non-renewable source-use measure, SAFA and MOTIFS also assess the target on renewable energy use as well as the established energy saving practices of the assessed entity. This is important due to renewable energy being essential in achieving sustainability goals in energy security, climate change and air pollution mitigation [67]. MOTIFS also highlights material use and efficiency of resource use. SMART employs about 62 indicators, which cover energy and material consumption, the latter referring to the flow of materials within and without the process being assessed [1]. The tool addresses all aspects relevant to this sub-theme, from the share of arable land devoted to different crops (each in separate indicators), to detailed information on organic or synthetic fertilizer use. Fertilizer use is part of the nutrient balance which falls into the materials and energy sub-theme in both SAFA and SMART. This indicator assesses the balance of nitrogen and phosphorous from the context of supply vs. demand and imports and exports at farm level.
Biodiversity is also an important theme, encompassing the variety of species in the ecosystem and the diversity within these species [1]. RISE covers biodiversity with a small number of indicators on management and protection, intensity and diversity of production, and state and distribution of ecological infrastructures, which all fall within the sub-themes of the environmental dimension in the SAFA guidelines. However, genetic and species diversity, besides agricultural crop diversity, needs to also be taken into account, given that it is affected by a farm’s activities, and the way in which multi-species farming has the potential to improve sustainability should be emphasized [68]. Ecosystem biodiversity is also important, not just to the environmental dimension but also the social, due to the indicator impacting landscape. Agricultural landscapes not only represent societal values, but they also represent the visible result of the interaction between farming, environment, and natural resources [69]. SALCAsustain calculates landscape quality, RISE assesses the development of ecological landscape, and MOTIFS assesses landscape management through various indicators like nature conservation, architectural quality, visual nuisance and more. Given the landscape aspect and landscape scale effects of intensive dairy farms, the impact on biodiversity is significant. Grazing should also be covered in this aspect, as it presents one of the most common human activities which has an impact on the vegetation community both directly and indirectly [70]. This impact is not necessarily negative, and, considering local factors and different ecosystems, it can also be highly beneficial if properly managed and targeted [71]. Due to this, indicators developed for assessing grazing management plans need to be integrated in dairy sustainability tools. However, due to local factors not being properly integrated into the assessment [71], it is a challenge to analyze or portray the impact objectively. Biodiversity is not covered in TIPICAL.
One other important environmental issue which is not included in the SAFA guidelines or SAFA tool but should be integrated within a sustainability assessment is ecotoxicity. SALCAsustain accounts for terrestrial ecotoxicity, by taking into account pesticides and emissions released from their production [54]. The intensity of pesticide use is of high importance, especially due to the risk of soil, water, animals, and other vegetation damage. MOTIFS also accounts for pesticide use and pesticide management. SMART, on the other hand, employs a set of indicators with regard to pesticides’ persistence in water and in soil and their management by the farmers. A pesticide-related indicator in SMART is instead part of the economic dimension, which falls within the aspect of food quality, and requires knowing how pesticide residues that affect food quality are handled. SMART includes indicators specifically related to the environmental impact of homegrown and purchased feed.
Looking at life cycle stages like transportation, dairy products are highly dependent on refrigeration, which has a high impact on GHG emissions globally [72]. This requires the engagement of different actors of the dairy supply chain to ensure that environmentally friendly ways are adopted and enabled, further establishing the connection to other dimensions. A dairy sustainability assessment tool should also focus on the processing and transportation part, due to their high impact. Considered to be one of the most GHG intensive stages, integration of this aspect related to the downstream impact was only witnessed in SAFA.
Animal welfare, defined as “the physical and mental state of an animal in relation to the conditions in which it lives and dies” by The World Organization for Animal Health (WOAH), Terrestrial Animal Health Code (TAHC), is considered to be a major challenge for agriculture in the 21st century [73]. SAFA and SMART consider animal welfare as part of the environmental integrity dimension. The inter-connectivity or synergy to the social-wellbeing dimension is given in both tools; however, the ethical and social nature of the aspect of animal welfare and wellbeing needs to be emphasized as such in a comprehensive tool. However, the quality of housing in SMART is accounted for. Injuries, animal losses, and risk of feed contamination are among the aspects considered. RISE also accounts for animal health, quality of housing and for the possibility to perform species-specific behavior [74]. These are identified as welfare consequences that impair the health of an animal [75]. Another aspect that is closely linked to animal welfare is livestock productivity—also accounted for in RISE. MOTIFS accounts for dirtiness, skin lesions and locomotion [74], among other previously mentioned concerns, which give a clear advantage to the tool regarding these particular aspects. It also accounts for udder health, using separate indicators, which is crucial to dairy sustainability. While these indicators are related to animal welfare, none of the reviewed tools can provide a reliable measurement on the overall animal welfare condition. The Welfare Quality® framework can be used as a reference by which to measure animal welfare accurately [74,76].
3.2.3. Economic Resilience
Economic turbulences and demand uncertainty drive farmers into recognizing and adapting to this ever-changing environment [77]. For an enterprise to be economically sustainable, or, essentially, economically resilient, it must have the resources to handle economic turbulence and downturns [1]. The dimension of sustainability assessment tools covers financial aspects such as profitability and vulnerability (all six tools), and aspects such as traceability, transparency, and information (SAFA, SMART, RISE). It includes indicators related to product quality and safety, supply chain management, and the economic viability of the farmers and their families (SMART). TIPICAL also offers an indicator similar to assessing the economic viability of the farmers, in the context of the decent livelihood sub theme. Investment and vulnerability are sub-themes in the SAFA tool which comprise a total 15 indicators and four sub-themes.
There is an evident synergy to the sub-themes of good governance with economic resilience both in SAFA and SMART, especially to aspects like traceability, transparency and information, which are considered effective development promoters within the economic resilience scope. Furthermore, the daily intake of dairy products by consumers depends on the assumption that the products are produced, processed, transported, and kept in compliance with safety and quality standards [78]. To ensure that, sustainability assessment tools should employ indicators to this aspect, and the respective results should be as transparent as possible. This theme also includes product labeling, certified production, and plans and set practices on ensuring product quality from farm to consumer. For the alignment of the dairy sector and sustainable development, stakeholders need to ensure quality of production and transparency regarding product safety through the entire production chain [13]. While these aspects pertain to the good governance dimension, in SAFA and SMART these are considered in the economic dimension as well. This ultimately depicts the interacting effect of the dimensions. Furthermore, a study has shown that the sustainability initiatives within the dairy supply chain enabled retailers to further divide and impose control over farmers/suppliers [72]. This could be seen as a synergy between the economic, social, and good governance dimensions.
In the SAFA tool, the 26 economic resilience indicators can be adjusted to all parts of the dairy supply chain. Stability is an important subject to the farmer, and for that, indicators that would require direct quantitative data from the farm are needed, such as capitalization ratio and equity-to-fixed-assets ratio [54]. RISE covers this sub-theme with the parameter of economic vulnerability in the context of indebtedness within the economic viability theme. In TIPICAL, vulnerability is covered through the indicators of risk management and liquidity. SALCAsustain covers aspects such as equity-to-fixed-assets ratios in the form of accounting data and presents an important indicator that could be considered to affect both the economic resilience and the wellbeing of the farmer.
Within the economic resilience dimension in SAFA, vulnerability also entails the stability of supplier relationships, which merely portrays whether a business contract is stable between the entity and the suppliers. In terms of the dairy supply chain, this is particularly important to the relationship between farmers and dairies as well as dairies and retailers. In SMART, the quality of cooperation between the farmer and contracted suppliers is an indicator of its own. This simultaneously contributes positively to the stability of production, due to also having a secure supply of farm inputs. In SALCAsustain, stability is a subject that is measured through equity-to-fixed assets ratios and fixed assets to total assets. While this is part of economic resilience, it does not contribute to the context of stability of production. This sub-theme could be particularly also applied in the context of the processing section of the dairy supply chain. This is somehow covered in SMART as the right of suppliers in collective bargaining and agreements, but still considered from the farmer’s perspective. In addition, other indicators in SMART could be considered that also account for the processing part, regarding quality of products delivered. Some indicators also require information on whether the farmer cooperates with the processors in terms of common product development and planning. RISE also highlights stability of production through farm management indicators, including parameters on supply and yield security and farm planning. Because everything starts from the farm, the dimension of economic resilience must garner a major focus, similar to the extensive coverage witnessed in SMART. SALCAsustain also covers the economic dimension in the farm context, in terms of general farm economic indicators. However, economic vulnerability and what it entails are also crucial, especially when looking at the dairy sector and its dynamic state. This is not covered by SALCAsustain in such a comprehensive manner as it is in RISE, SAFA, and SMART. SMART underlines stability of production and supply through a range of indicators. They account for production equipment, farm input restraints and many other related concerns.
3.2.4. Social Wellbeing
Most social indicators address themes such as working conditions, quality of life, and economic viability which characterize livelihood security of the farmers (witnessed in all six tools). Such indicators are considered very important for measuring social sustainability and the impact of agriculture production [24].
The social wellbeing dimension is addressed through a total of 19 indicators in SAFA. The social issues considered therein can be adjusted to the context of actors of the dairy supply chain. SMART applies a vast number, 358, of indicators in total, in terms of the themes of the social dimensions. This emphasizes the perspective of the farmers and their families’ social and ethical concerns. The latter is not a focal point of SAFA [21], which puts little to no attention into the farmer’s family situation and the related subjective wellbeing. Workload, work/life balance, education and social connections are among the aspects not considered in any of the tools in terms of the farmer’s perspective. As small-scale family farms are highly reliant on their business, the family perspective is important when assessing social sustainability. Additionally, an indicator that measures whether the farmer’s work is valued should also be incorporated, but is not accounted for by SAFA [21]. In the decent livelihood theme, SAFA accounts for quality of life and wage level. The quality-of-life indicator might leave room for different ways of interpreting and does not fully depict the reality of the life quality of the farmer. Giving a person-centric view by defining the pay level indicator (minimum salary to cover the family’s needs) and the subjective wellbeing of farmers and their families is important [79]. RISE applies a set of parameters that account for the quality of life of the farmer, like education, occupation, personal freedom, and social relations etc., which also indicate the farmer’s subjective wellbeing and satisfaction. The relevant farmer’s satisfaction about leisure time, workload, time management, health, cultural activities etc., is explored in interviews. From a different perspective, MOTIFS also includes indicators on social services and a farmer’s professional pride, which reflects how a farmer’s identity connects with the ever-changing farming environment [49], which is an important concept regarding the critical issue of farm succession. Similar approaches were not witnessed in other tools. TIPICAL covers decent livelihood through farmer’s income. Similarly, SALCAsustain measures quality of life through workload and family income at farm level. A well-developed set of indicators that portrays this aspect as to how dairy sector impacts the overall public health is necessary for a holistic dairy sustainability assessment tool. SAFA, SMART and RISE heavily account for this sub-theme, along with workplace safety. RISE takes it to another level by also considering satisfaction at work. Overall, the social wellbeing theme remains insufficiently addressed, as seen in Figure 4.
3.3. Input Data, Accessibility, and Practicability
Another important feature of a sustainability assessment tool is the input data type that it requires. For the end-user, this translates into time spent in assessment and the extent of facilitated contextualization the tool offers. First, it is important to establish the goal or the outcome intended from the sustainability assessment (sustainability performance measurement, to support decision making, quantifying impacts, identifying areas of improvement, etc.), identify the most affected stakeholders, and thus design indicators accordingly [27].
In terms of input data type, RISE has proven quite flexible [52]. SAFA and RISE both allow for the use of primary and secondary data [1,51,52]. The main method for data collection for both of the tools is based on on-farm interviews for data collection. Similarly, for MOTIFS, the qualitative indicators require qualitative data based on questionnaires. SALCAsustain, RISE, MOTIFS, and TIPICAL provide mainly quantitative indicators. Indicators that were found to be not at all related or not of concern to the dairy sector in SMART were removed from its analysis. SMART provides for a total of 327 indicators, but 20 (qualitative) of these are not related to dairy systems or the overall dairy sector.
In terms of accessibility, SAFA is the only tool provided entirely free. For this research, tools were accessed either through trial versions of the tool (RISE and TIPICAL), or through scientific papers or reviews published regarding tools, throughout the years (SMART, MOTIFS, and SALCAsustain).
Data collection times can vary significantly. RISE has been deemed to take a fair amount of time and SALCAsustain was seen to be very time consuming [2]. Time for collecting all input data in SALCAsustain varied between 3 to 30 h, depending on the focus of the tool and the system boundaries as reported by Roesch et al. [54]. For SAFA, time needed to conduct an assessment depends on the type of input data to be used and their availability. This is usually estimated to last for several days or even weeks [1]. Comprehensive sustainability assessment tools are not solely using qualitative data.
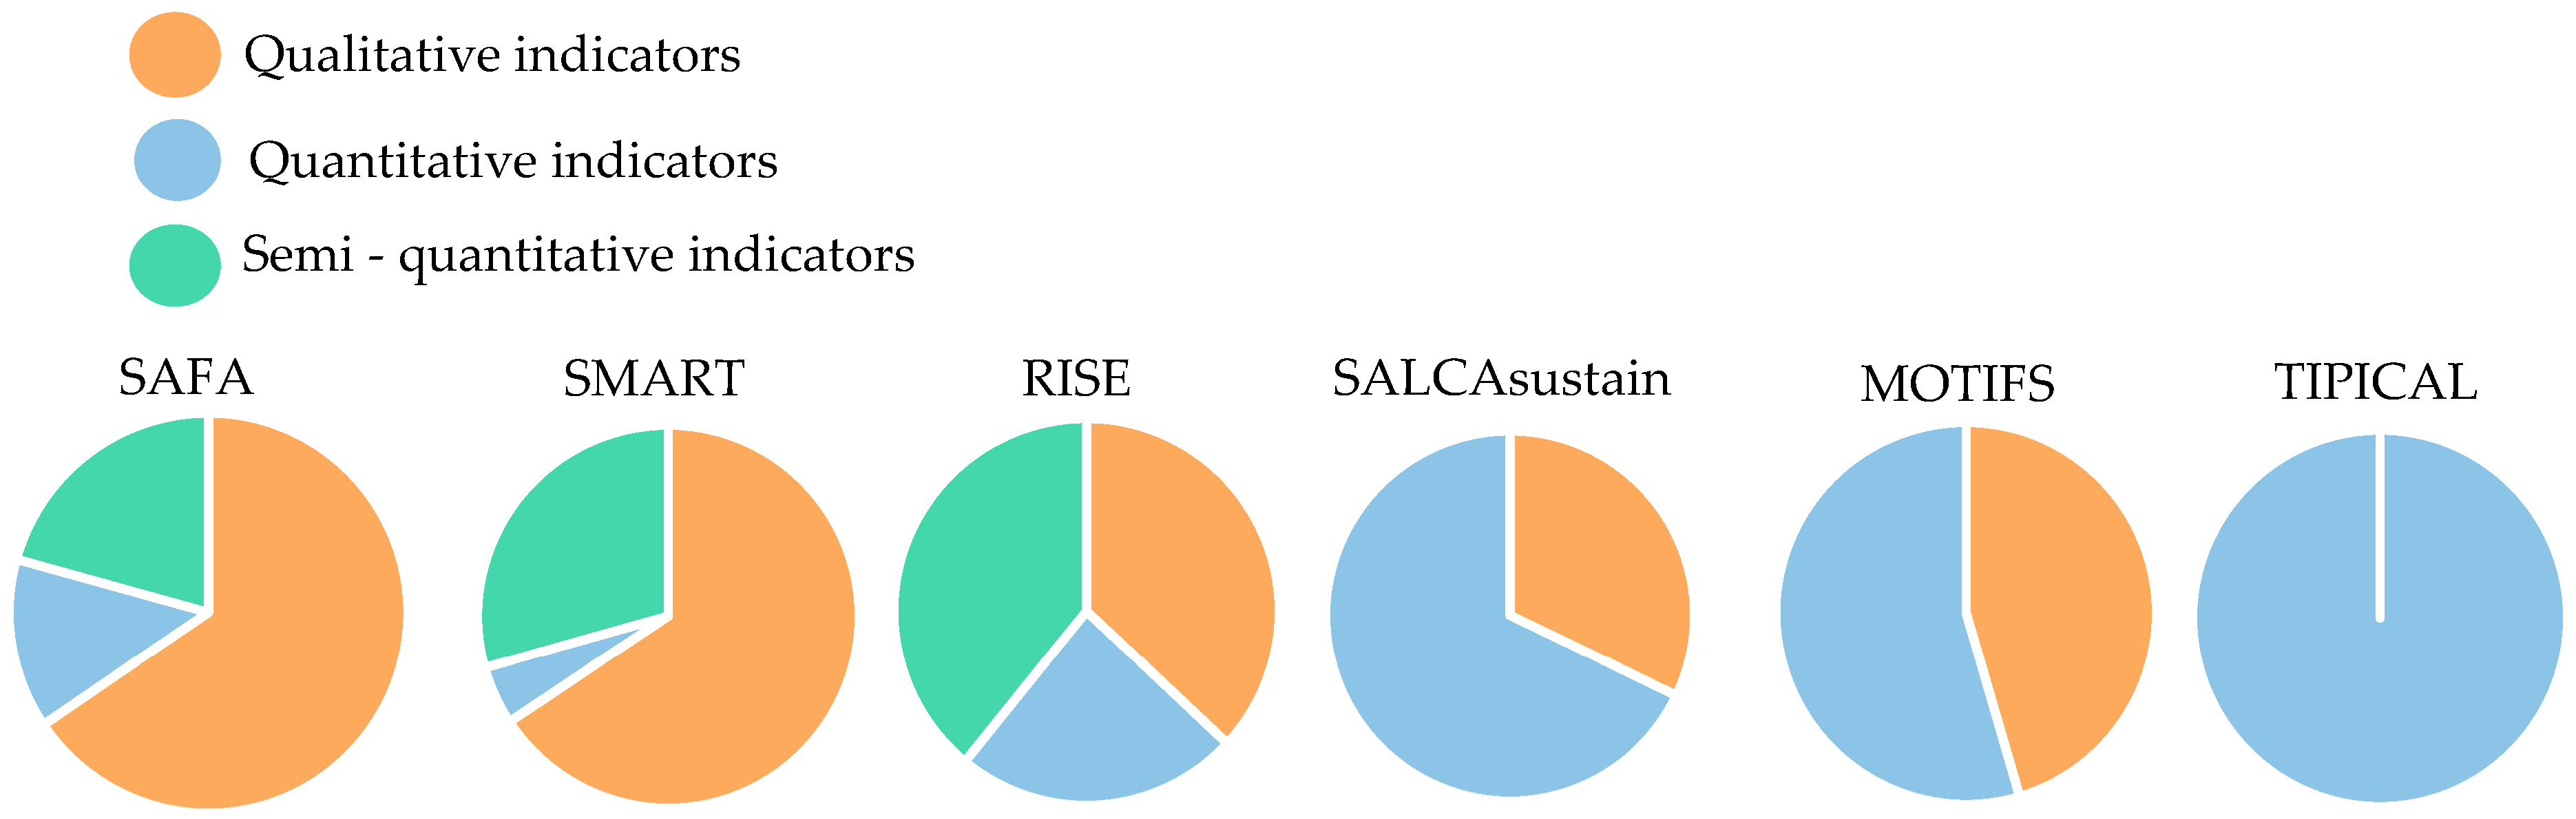
In terms of the outputs depicted in Table 2 and, visually, in Figure 5. TIPICAL offers all quantitative indicators. SALCAsustain and MOTIFS offer more quantitative indicators, mainly for the environmental and economic dimension. RISE contains mostly quantitative and semi-quantitative indicators. SAFA provides mainly qualitative and semi-quantitative indicators, which is also the case for SMART.
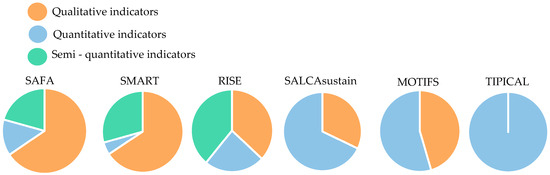
Figure 5.
Distribution of indicator types in reviewed tools.
In terms of scale, SAFA has proven to be adequate when assessing the sustainability of small producers [80]. It provides a broad picture of sustainability, but it is entirely dependent on company information overlooking the influence of market dynamics [81]. The emerging instability of the dairy market [82] should definitely be taken into consideration for a future dairy sustainability assessment tool, as it should be within the scope of the economic resilience dimension. SALCAsustain has also proven to be adequate when applied to the assessment of a small-scale farm, yet its complexity is more suited for addressing research inquiries and analyzing farm management strategies. TIPICAL is based on the typical farming approach, so it integrates different farm scales as representative farms. Similarly, TIPICAL is more adequate for evaluating farm management strategies [53,54]. With these gained insights, stakeholders or experts engaged in assessing sustainability in the dairy supply chain can weigh the strengths and limitations of each reviewed tool. By considering differences in methodologies, indicators, and applicability to the dairy supply chain context, users can determine which tool provides more reliable and robust sustainability assessment. Moreover, evaluating the reviewed tools’ capacities to address key sustainability issues in the dairy supply chain will promote informed decision making.
4. Conclusions
There are various tools available for sustainability assessment in the dairy sector, each with its strengths and limitations, as were shown in this review. The main strength considered is the integration of multiple aspects of sustainability. A considerable limitation of all six tools would be the lack of comprehensive integration of various other sustainability aspects (especially pertaining to the social dimension). SAFA and SMART offer a holistic assessment by integrating many aspects of sustainability dimensions through many indicators but do lack the accuracy gained when quantifying some of those aspects, especially towards dairy farms impact issues. SAFA stands out for being accessible at no charge for the user, an option important to consider in terms of financial budgeting. SALCAsustain, RISE, MOTIFS and TIPICAL’s main strength is the quantification which allows for a detailed assessment over the whole dairy supply chain. The advantage of MOTIFS and TIPICAL is that both specifically cater to the dairy sector, although TIPICAL lacks in terms of assessing sustainability in a holistic perspective. RISE, although designed as a farm advisory tool for different agricultural production systems, contains indicators that are oriented towards categories which are important for dairy farm impacts. These considerations are crucial for users in the dairy sector.
The advantage of RISE is its flexibility in terms of the user-friendly interface and data requirement, which makes it adaptable to different data availability scenarios. MOTIFS was also deemed user friendly, with an obvious equality of dimensions covered and an adequate share of quantitative indicators. Similarly, tools like TIPICAL are suitable for users in search of precise quantitative measures, while tools like SAFA and SMART offer broader insights with more qualitative and semi-quantitative indicators. Users must also consider their time capacity in data collection, which can vary significantly among all tools, with SALCAsustain, RISE, and SAFA reported as being particularly time consuming.
A combination of existing tools into one framework can help identify trade-offs and synergies between various sustainability dimensions, such as social, environmental, and economic impacts, and provide a more comprehensive and holistic view of dairy sustainability. While this review draws to such a conclusion, this might be challenging. In identifying an appropriate tool for sustainability assessment in the dairy sector, the specific goals and needs of the user, as well as the context in which the assessment is being conducted should be thoroughly considered. Future research should delve further into the practicalities in order to enhance tool usability and into the development of tools that integrate all sustainability aspects in a comprehensive manner while providing accurate quantification of those aspects. Applying methods for stakeholder engagement and collaboration could also present a future combination and consensus for a future tool.
Author Contributions
Conceptualization, R.P., S.H., W.Z., T.H. and M.W.; methodology, R.P., S.H., W.Z., T.H. and M.W.; software, R.P. and S.H.; validation, R.P., S.H. and W.Z.; formal analysis, R.P., S.H. and W.Z.; investigation, R.P. and S.H.; resources, R.P., S.H. and W.Z.; data curation, R.P. and S.H.; writing—original draft preparation, R.P.; writing—review and editing, R.P., S.H., W.Z., M.W. and T.H.; visualization, R.P. and S.H.; supervision, W.Z., S.H., M.W. and T.H.; project administration, R.P. and W.Z. All authors have read and agreed to the published version of the manuscript.
Funding
This research received no external funding.
Institutional Review Board Statement
Not applicable.
Informed Consent Statement
Not applicable.
Data Availability Statement
Not applicable.
Acknowledgments
The authors would like to express their sincere gratitude to the International Farm Comparison Network (IFCN) for granting a scholarship to the first author.
Conflicts of Interest
Author Torsten Hemme is chairman of the advisory board in the International Farm Comparison Network—IFCN. The remaining authors declare that the research was conducted in the absence of any commercial or financial relationships that could be construed as a potential conflict of interest.
Abbreviations
SAFA: Sustainability Assessment of Food and Agriculture; SMART: Sustainability Monitoring and Assessment RouTine; RISE: Response-Inducing Sustainability Evaluation version 3.0; SALCAsustain: Swiss Agricultural Life Cycle Assessment; MOTIFS: MOnitoring Tool for Integrated Farm Sustainability; TIPICAL: Technology Impact and Policy Impact CALculations; DSF: dairy sustainability framework; GG: good governance; EI: environmental integrity; ER: economic resilience; SW: social wellbeing.
References
- FAO. SAFA—Sustainability Assessment of Food and Agriculture Systems Guidelines. Available online: https://www.fao.org/nr/sustainability/sustainability-assessments-safa/en (accessed on 28 April 2024).
- Schader, C.; Grenz, J.; Meier, M.S.; Stolze, M. Scope and Precision of Sustainability Assessment Approaches to Food Systems. ES 2014, 19, art42. [Google Scholar] [CrossRef]
- Díaz De Otálora, X.; Del Prado, A.; Dragoni, F.; Estellés, F.; Amon, B. Evaluating Three-Pillar Sustainability Modelling Approaches for Dairy Cattle Production Systems. Sustainability 2021, 13, 6332. [Google Scholar] [CrossRef]
- Hacking, T.; Guthrie, P. A Framework for Clarifying the Meaning of Triple Bottom-Line, Integrated, and Sustainability Assessment. Environ. Impact Assess. Rev. 2008, 28, 73–89. [Google Scholar] [CrossRef]
- Purvis, B.; Mao, Y.; Robinson, D. Three Pillars of Sustainability: In Search of Conceptual Origins. Sustain. Sci. 2019, 14, 681–695. [Google Scholar] [CrossRef]
- Spangenberg, J. The institutional dimension of sustainable development. In Sustainability Indicators: A Scientific Assessment; ResearchGate: Berlin/Heidelberg, Germany, 2007; pp. 107–124. [Google Scholar]
- Feil, A.A.; Schreiber, D.; Haetinger, C.; Haberkamp, Â.M.; Kist, J.I.; Rempel, C.; Maehler, A.E.; Gomes, M.C.; da Silva, G.R. Sustainability in the Dairy Industry: A Systematic Literature Review. Environ. Sci. Pollut. Res. 2020, 27, 33527–33542. [Google Scholar] [CrossRef] [PubMed]
- Béné, C.; Oosterveer, P.; Lamotte, L.; Brouwer, I.D.; de Haan, S.; Prager, S.D.; Talsma, E.F.; Khoury, C.K. When Food Systems Meet Sustainability—Current Narratives and Implications for Actions. World Dev. 2019, 113, 116–130. [Google Scholar] [CrossRef]
- Rotz, C.; Montes, F.; Hafner, S. DairyGEM: A Software Tool for Whole Farm Assessment of Emission Mitigation Strategies; ResearchGate: Berlin/Heidelberg, Germany, 2011. [Google Scholar]
- Üçtuğ, F.G. The Environmental Life Cycle Assessment of Dairy Products. Food Eng. Rev. 2019, 11, 104–121. [Google Scholar] [CrossRef]
- Tricarico, J.M.; Kebreab, E.; Wattiaux, M.A. MILK Symposium Review: Sustainability of Dairy Production and Consumption in Low-Income Countries with Emphasis on Productivity and Environmental Impact. J. Dairy Sci. 2020, 103, 9791–9802. [Google Scholar] [CrossRef] [PubMed]
- Schiano, A.N.; Harwood, W.S.; Gerard, P.D.; Drake, M.A. Consumer Perception of the Sustainability of Dairy Products and Plant-Based Dairy Alternatives. J. Dairy Sci. 2020, 103, 11228–11243. [Google Scholar] [CrossRef]
- Ding, H.; Fu, Y.; Zheng, L.; Yan, Z. Determinants of the Competitive Advantage of Dairy Supply Chains: Evidence from the Chinese Dairy Industry. Int. J. Prod. Econ. 2019, 209, 360–373. [Google Scholar] [CrossRef]
- European Commission. The Environmental Impact of Dairy Production in the EU: Practical Options for the Improvement of the Environmental Impact: Final Report; European Commission: Brussels, Belgium, 2000. [Google Scholar]
- Rotz, C.A. Modeling Greenhouse Gas Emissions from Dairy Farms. J. Dairy Sci. 2018, 101, 6675–6690. [Google Scholar] [CrossRef] [PubMed]
- Guzmán-Luna, P.; Mauricio-Iglesias, M.; Flysjö, A.; Hospido, A. Analysing the Interaction between the Dairy Sector and Climate Change from a Life Cycle Perspective: A Review. Trends Food Sci. Technol. 2022, 126, 168–179. [Google Scholar] [CrossRef]
- Arvidsson Segerkvist, K.; Hansson, H.; Sonesson, U.; Gunnarsson, S. Research on Environmental, Economic, and Social Sustainability in Dairy Farming: A Systematic Mapping of Current Literature. Sustainability 2020, 12, 5502. [Google Scholar] [CrossRef]
- Desiderio, E.; García-Herrero, L.; Hall, D.; Segrè, A.; Vittuari, M. Social Sustainability Tools and Indicators for the Food Supply Chain: A Systematic Literature Review. Sustain. Prod. Consum. 2022, 30, 527–540. [Google Scholar] [CrossRef]
- Hoang, V.; Nguyen, A.; Hubbard, C.; Nguyen, D. Exploring the Governance and Fairness in the Milk Value Chain: A Case Study in Vietnam. Agriculture 2021, 11, 884. [Google Scholar] [CrossRef]
- Ménard, C.; Martino, G.; De Oliveira, G.M.; Royer, A.; Saes, M.S.M.; Schnaider, P.S.B. Governing Food Safety through Meso-institutions: A Cross-country Analysis of the Dairy Sector. Appl. Econ. Perspect. Policy 2022, 44, 1722–1741. [Google Scholar] [CrossRef]
- Röös, E.; Fischer, K.; Tidåker, P.; Nordström Källström, H. How Well Is Farmers’ Social Situation Captured by Sustainability Assessment Tools? A Swedish Case Study. Int. J. Sustain. Dev. World Ecol. 2019, 26, 268–281. [Google Scholar] [CrossRef]
- Ness, B.; Urbel-Piirsalu, E.; Anderberg, S.; Olsson, L. Categorising Tools for Sustainability Assessment. Ecol. Econ. 2007, 60, 498–508. [Google Scholar] [CrossRef]
- Binder, C.R.; Feola, G.; Steinberger, J.K. Considering the Normative, Systemic and Procedural Dimensions in Indicator-Based Sustainability Assessments in Agriculture. Environ. Impact Assess. Rev. 2010, 30, 71–81. [Google Scholar] [CrossRef]
- Janker, J.; Mann, S. Understanding the Social Dimension of Sustainability in Agriculture: A Critical Review of Sustainability Assessment Tools. Environ. Dev. Sustain. 2020, 22, 1671–1691. [Google Scholar] [CrossRef]
- Boström, M. A Missing Pillar? Challenges in Theorizing and Practicing Social Sustainability: Introduction to the Special Issue. Sustain. Sci. Pract. Policy 2012, 8, 3–14. [Google Scholar] [CrossRef]
- Eizenberg, E.; Jabareen, Y. Social Sustainability: A New Conceptual Framework. Sustainability 2017, 9, 68. [Google Scholar] [CrossRef]
- Gasparatos, A.; Scolobig, A. Choosing the Most Appropriate Sustainability Assessment Tool. Ecol. Econ. 2012, 80, 1–7. [Google Scholar] [CrossRef]
- Ndambi, A.; Pishgar Komleh, H.; Van Der Lee, J. An Overview and Analysis of Integral Tools to Monitor People, Planet and Profit Sustainability Dimensions of Dairy Development in East Africa; Wageningen Livestock Research: Wageningen, The Netherlands, 2020. [Google Scholar]
- Byomkesh, T.; Blay-Palmer, A. Comparison of Methods to Assess Agricultural Sustainability; ResearchGate: Berlin/Heidelberg, Germany, 2017; pp. 149–168. ISBN 978-3-319-58678-6. [Google Scholar]
- Marchand, F.; Debruyne, L.; Triste, L.; Gerrard, C.; Padel, S.; Lauwers, L. Key Characteristics for Tool Choice in Indicator-Based Sustainability Assessment at Farm Level. ES 2014, 19, art46. [Google Scholar] [CrossRef]
- Buys, L.; Mengersen, K.; Johnson, S.; Van Buuren, N.; Chauvin, A. Creating a Sustainability Scorecard as a Predictive Tool for Measuring the Complex Social, Economic and Environmental Impacts of Industries, a Case Study: Assessing the Viability and Sustainability of the Dairy Industry. J. Environ. Manag. 2014, 133, 184–192. [Google Scholar] [CrossRef]
- Page, M.J.; McKenzie, J.E.; Bossuyt, P.M.; Boutron, I.; Hoffmann, T.C.; Mulrow, C.D.; Shamseer, L.; Tetzlaff, J.M.; Akl, E.A.; Brennan, S.E.; et al. The PRISMA 2020 Statement: An Updated Guideline for Reporting Systematic Reviews. BMJ 2021, 372, n71. [Google Scholar] [CrossRef] [PubMed]
- Van De Schoot, R.; De Bruin, J.; Schram, R.; Zahedi, P.; De Boer, J.; Weijdema, F.; Kramer, B.; Huijts, M.; Hoogerwerf, M.; Ferdinands, G.; et al. An Open Source Machine Learning Framework for Efficient and Transparent Systematic Reviews. Nat. Mach. Intell. 2021, 3, 125–133. [Google Scholar] [CrossRef]
- Caring Dairy. Available online: https://www.benjerry.com/values/how-we-do-business/caring-dairy (accessed on 25 April 2024).
- Cool Farm Tool|An Online Greenhouse Gas, Water, and Biodiversity Calculator. Available online: https://coolfarm.org/ (accessed on 25 April 2024).
- An Environmental Self Assessment Tool (SAT) for Australian Dairy Farmers; Department of Primary Industries: Melbourne, Australia, 2003; ISBN 978-1-74106-737-8.
- Bélanger, V.; Vanasse, A.; Parent, D.; Allard, G.; Pellerin, D. DELTA: An Integrated Indicator-Based Self-Assessment Tool for the Evaluation of Dairy Farms Sustainability in Quebec, Canada. Agroecol. Sustain. Food Syst. 2015, 39, 1022–1046. [Google Scholar] [CrossRef]
- Elsaesser, M.; Jilg, T.; Herrmann, K.; Boonen, J.; Debruyne, L.; Laidlaw, A.; Aarts, F. Quantifying Sustainability of Dairy Farms with the DAIRYMAN-Sustainability-Index. Grassl. Sci. Eur. 2015, 20, 367–376. [Google Scholar]
- Offermann, F.; Kleinhanss, W.; Huettel, S.; Kuepker, B.; Offermann, F.; Kleinhanss, W.; Huettel, S.; Kuepker, B. Assessing the 2003 CAP Reform Impacts on German Agriculture Using the Farm Group Model FARMIS. 2005. Available online: https://www.semanticscholar.org/paper/Assessing-the-2003-CAP-Reform-Impacts-on-German-the-Offermann-Kleinhanss/f2554c9f60f4caea5daeb8bc26527d7c48a34a8d (accessed on 28 April 2024).
- Schader, C.; Sanders, J.; Nemecek, T.; Lampkin, N.; Stolze, M. A Modelling Approach for Evaluating Agri-Environmental Policies at Sector Level. Yearb. Socioecon. Agric. 2008, 1, 93–132. [Google Scholar]
- Vayssières, J.; Guerrin, F.; Paillat, J.-M.; Lecomte, P. GAMEDE: A Global Activity Model for Evaluating the Sustainability of Dairy Enterprises Part I—Whole-Farm Dynamic Model. Agric. Syst. 2009, 101, 128–138. [Google Scholar] [CrossRef]
- Zahm, F.; Viaux, P.; Vilain, L.; Girardin, P.; Mouchet, C. Assessing Farm Sustainability with the IDEA Method—From the Concept of Agriculture Sustainability to Case Studies on Farms. Sustain. Dev. 2008, 16, 271–281. [Google Scholar] [CrossRef]
- Zahm, F.; Alonso Ugaglia, A.; Barbier, J.-M.; Boureau, H.; Del’Homme, B.; Gafsi, M.; Girard, S.; Gasselin, P.; Guichard, L.; Loyce, C.; et al. Evaluating Sustainability of Farms: Introducing a New Conceptual Framework Based on Three Dimensions and Five Key Properties Relating to the Sustainability of Agriculture. The IDEA Method Version 4. In Proceedings of the 13th European IFSA Symposium “Farming Systems: Facing Uncertainties and Enhancing Opportunities”. Symposium Theme “Agroecology and New Farming Arrangements, Chania, Greece, 1–5 July 2018. [Google Scholar]
- IDEALS. Illinois Farm Sustainability Calculator. Available online: https://www.ideals.illinois.edu/collections/639 (accessed on 25 April 2024).
- INSPIA. Initiative for Sustainable Productive Agriculture. Available online: https://inspia-europe.eu/ (accessed on 25 April 2024).
- van Calker, K.J.; Berentsen, P.B.M.; Romero, C.; Giesen, G.W.J.; Huirne, R.B.M. Development and Application of a Multi-Attribute Sustainability Function for Dutch Dairy Farming Systems. Ecol. Econ. 2006, 57, 640–658. [Google Scholar] [CrossRef]
- Schuler, J.; Kächele, H. Modelling On-Farm Costs of Soil Conservation Policies with MODAM. Environ. Sci. Policy 2003, 6, 51–55. [Google Scholar] [CrossRef]
- Schuler, J.; Sattler, C. The Estimation of Agricultural Policy Effects on Soil Erosion—An Application for the Bio-Economic Model MODAM. Land Use Policy 2010, 27, 61–69. [Google Scholar] [CrossRef]
- Meul, M.; Van Passel, S.; Nevens, F.; Dessein, J.; Rogge, E.; Mulier, A.; Van Hauwermeiren, A. MOTIFS: A Monitoring Tool for Integrated Farm Sustainability. Agron. Sustain. Dev. 2008, 28, 321–332. [Google Scholar] [CrossRef]
- Gerrard, C.L.; Smith, L.G.; Pearce, B.; Padel, S.; Hitchings, R.; Measures, M.; Cooper, N. Public Goods and Farming. In Farming for Food and Water Security; Lichtfouse, E., Ed.; Springer: Dordrecht, The Netherlands, 2012; pp. 1–22. ISBN 978-94-007-4500-1. [Google Scholar]
- Grenz, J.; Thalmann, C.; Stämpfli, A.; Studer, C.; Häni, F. RISE–a Method for Assessing the Sustainability of Agricultural Production at Farm Level. Rural Dev. News 2009, 1, 5. [Google Scholar]
- Häni, F.; Braga, F.; Stampfli, A.; Keller, T.; Fischer, M.; Porsche, H. RISE, a Tool for Holistic Sustainability Assessment at the Farm Level. Int. Food Agribus. Manag. Rev. 2003, 6, 4. [Google Scholar]
- Roesch, A.; Gaillard, G.; Isenring, J.; Jurt, C.; Keil, N.; Nemecek, T.; Rufener, C.; Schüpbach, B.; Umstätter, C.; Waldvogel, T.; et al. Comprehensive Farm Sustainability Assessment. 2017. Available online: https://www.researchgate.net/publication/316275882_Comprehensive_Farm_Sustainability_Assessment (accessed on 28 April 2024).
- Roesch, A.; Nyfeler-Brunner, A.; Gaillard, G. Sustainability Assessment of Farms Using SALCAsustain Methodology. Sustain. Prod. Consum. 2021, 27, 1392–1405. [Google Scholar] [CrossRef]
- Prado, A.D.; Scholefield, D. Use of SIMS DAIRY Modelling Framework System to Compare the Scope on the Sustainability of a Dairy Farm of Animal and Plant Genetic-Based Improvements with Management-Based Changes. J. Agric. Sci. 2008, 146, 195–211. [Google Scholar] [CrossRef]
- Schader, C.; Baumgart, L.; Landert, J.; Muller, A.; Ssebunya, B.; Blockeel, J.; Weisshaidinger, R.; Petrasek, R.; Mészáros, D.; Padel, S.; et al. Using the Sustainability Monitoring and Assessment Routine (SMART) for the Systematic Analysis of Trade-Offs and Synergies between Sustainability Dimensions and Themes at Farm Level. Sustainability 2016, 8, 274. [Google Scholar] [CrossRef]
- Schader, C.; Curran, M.; Heidenreich, A.; Landert, J.; Blockeel, J.; Baumgart, L.; Ssebunya, B.; Moakes, S.; Marton, S.; Lazzarini, G.; et al. Accounting for Uncertainty in Multi-Criteria Sustainability Assessments at the Farm Level: Improving the Robustness of the SMART-Farm Tool. Ecol. Indic. 2019, 106, 105503. [Google Scholar] [CrossRef]
- Wiek, A.; Binder, C. Solution Spaces for Decision-Making—A Sustainability Assessment Tool for City-Regions. Environ. Impact Assess. Rev. 2005, 25, 589–608. [Google Scholar] [CrossRef]
- IFCN Products & Services. Available online: https://ifcndairy.org/ifcn-products-services/ (accessed on 25 April 2024).
- van Calker, K.J.; Berentsen, P.B.M.; Giesen, G.W.J.; Huirne, R.B.M. Maximising Sustainability of Dutch Dairy Farming Systems for Different Stakeholders: A Modelling Approach. Ecol. Econ. 2008, 65, 407–419. [Google Scholar] [CrossRef]
- Ozkan, S. Global Livestock Environmental Assessment Model—Interactive (GLEAM-i). Available online: https://gleami.apps.fao.org/ (accessed on 28 April 2024).
- SAI Platform. Sustainable Agriculture Initiative Platform. Available online: https://saiplatform.org/ (accessed on 25 April 2024).
- SEEBALANCE®. Available online: https://www.basf.com/global/en/who-we-are/sustainability/we-drive-sustainable-solutions/quantifying-sustainability/seebalance.html (accessed on 25 April 2024).
- Dairy Sustainability Framework. Available online: https://www.dairysustainabilityframework.org/ (accessed on 25 April 2024).
- Schader, C.; Jawtusch, J.; Emmerth, D.; Bickel, R.; Grenz, J.; Stolze, M. Sustainability Assessment of Operators in the Food Chain Based on the FAO SAFA-Guidelines. In Proceedings of the Zukunft der Ökolebensmittelverarbeitung: Nachhaltigkeit—Qualität—Integrität. 2. IFOAM EU-Verarbeiterkonferenz zum Thema Ökolebensmittelverarbeitung und Umweltleistungen, Frankfurt, Germany, 26–27 November 2012. [Google Scholar]
- Hagemann, M.; Ndambi, A.; Hemme, T.; Latacz-Lohmann, U. Contribution of Milk Production to Global Greenhouse Gas Emissions. Environ. Sci. Pollut. Res. 2012, 19, 390–402. [Google Scholar] [CrossRef] [PubMed]
- Güney, T. Renewable Energy, Non-Renewable Energy and Sustainable Development. Int. J. Sustain. Dev. World Ecol. 2019, 26, 389–397. [Google Scholar] [CrossRef]
- Martin, G.; Barth, K.; Benoit, M.; Brock, C.; Destruel, M.; Dumont, B.; Grillot, M.; Hübner, S.; Magne, M.-A.; Moerman, M.; et al. Potential of Multi-Species Livestock Farming to Improve the Sustainability of Livestock Farms: A Review. Agric. Syst. 2020, 181, 102821. [Google Scholar] [CrossRef]
- OECD. Measuring the Environmental Performance of Agriculture Across OECD Countries; OECD: Paris, France, 2023. [Google Scholar]
- Zainelabdeen, Y.M.; Yan, R.; Xin, X.; Yan, Y.; Ahmed, A.I.; Hou, L.; Zhang, Y. The Impact of Grazing on the Grass Composition in Temperate Grassland. Agronomy 2020, 10, 1230. [Google Scholar] [CrossRef]
- Öllerer, K.; Varga, A.; Kirby, K.; Demeter, L.; Biró, M.; Bölöni, J.; Molnár, Z. Beyond the Obvious Impact of Domestic Livestock Grazing on Temperate Forest Vegetation—A Global Review. Biol. Conserv. 2019, 237, 209–219. [Google Scholar] [CrossRef]
- Cannas, V.G.; Ciccullo, F.; Pero, M.; Cigolini, R. Sustainable Innovation in the Dairy Supply Chain: Enabling Factors for Intermodal Transportation. Int. J. Prod. Res. 2020, 58, 7314–7333. [Google Scholar] [CrossRef]
- Albernaz-Gonçalves, R.; Olmos Antillón, G.; Hötzel, M.J. Linking Animal Welfare and Antibiotic Use in Pig Farming—A Review. Animals 2022, 12, 216. [Google Scholar] [CrossRef] [PubMed]
- Endres, M. Understanding the Behaviour and Improving the Welfare of Dairy Cattle, 1st ed.; Burleigh Dodds Science Publishing: London, UK, 2021; ISBN 978-1-78676-462-1. [Google Scholar]
- EFSA Panel on Animal Health and Welfare (AHAW); Nielsen, S.S.; Alvarez, J.; Bicout, D.J.; Calistri, P.; Canali, E.; Drewe, J.A.; Garin-Bastuji, B.; Gonzales Rojas, J.L.; Gortázar Schmidt, C.; et al. Methodological Guidance for the Development of Animal Welfare Mandates in the Context of the Farm to Fork Strategy. EFS2 2022, 20, 7403. [Google Scholar] [CrossRef] [PubMed]
- Buller, H.; Blokhuis, H.; Lokhorst, K.; Silberberg, M.; Veissier, I. Animal Welfare Management in a Digital World. Animals 2020, 10, 1779. [Google Scholar] [CrossRef] [PubMed]
- Darnhofer, I.; Lamine, C.; Strauss, A.; Navarrete, M. The Resilience of Family Farms: Towards a Relational Approach. J. Rural Stud. 2016, 44, 111–122. [Google Scholar] [CrossRef]
- Grunert, K.G.; Bech-Larsen, T.; Bredahl, L. Three Issues in Consumer Quality Perception and Acceptance of Dairy Products. Int. Dairy J. 2000, 10, 575–584. [Google Scholar] [CrossRef]
- Searle, R.H.; McWha-Hermann, I. “Money’s Too Tight (to Mention)”: A Review and Psychological Synthesis of Living Wage Research. Eur. J. Work Organ. Psychol. 2021, 30, 428–443. [Google Scholar] [CrossRef]
- Pérez-Lombardini, F.; Mancera, K.F.; Suzán, G.; Campo, J.; Solorio, J.; Galindo, F. Assessing Sustainability in Cattle Silvopastoral Systems in the Mexican Tropics Using the SAFA Framework. Animals 2021, 11, 109. [Google Scholar] [CrossRef] [PubMed]
- Leknoi, U.; Rosset, P.; Likitlersuang, S. Multi-Criteria Social Sustainability Assessment of Highland Maize Monoculture in Northern Thailand Using the SAFA Tool. Resour. Environ. Sustain. 2023, 13, 100115. [Google Scholar] [CrossRef]
- Thorsøe, M.; Noe, E.; Maye, D.; Vigani, M.; Kirwan, J.; Chiswell, H.; Grivins, M.; Adamsone-Fiskovica, A.; Tisenkopfs, T.; Tsakalou, E.; et al. Responding to Change: Farming System Resilience in a Liberalized and Volatile European Dairy Market. Land Use Policy 2020, 99, 105029. [Google Scholar] [CrossRef]
Disclaimer/Publisher’s Note: The statements, opinions and data contained in all publications are solely those of the individual author(s) and contributor(s) and not of MDPI and/or the editor(s). MDPI and/or the editor(s) disclaim responsibility for any injury to people or property resulting from any ideas, methods, instructions or products referred to in the content. |
© 2024 by the authors. Licensee MDPI, Basel, Switzerland. This article is an open access article distributed under the terms and conditions of the Creative Commons Attribution (CC BY) license (https://creativecommons.org/licenses/by/4.0/).