Article

Renewable Energy Distributed Energy System Optimal Configuration and Performance Analysis: Improved Zebra Optimization Algorithm

1
Key Laboratory of Environmental Protection in Water Transport Engineering Ministry of Transport, Tianjin Research Institute for Water Transport Engineering, Tianjin 300456, China
2
Institute of Innovation and Circular Economy, Asia University, Taichung 41354, Taiwan
3
Department of Medical Research, China Medical University Hospital, China Medical University, Taichung 406040, Taiwan
4
UKM-Graduate School of Business, Universiti Kebangsaan Malaysia, Bangi 43000, Selangor, Malaysia
5
Department of Industrial Engineering, Khon Kaen University, Khon Kaen 40002, Thailand
*
Author to whom correspondence should be addressed.
Sustainability 2024, 16(12), 5016; https://doi.org/10.3390/su16125016
Submission received: 9 May 2024 / Revised: 4 June 2024 / Accepted: 10 June 2024 / Published: 12 June 2024
(This article belongs to the Section Energy Sustainability)

Abstract

:
The use of distributed energy systems (DES) can utilize local resources to achieve flexible and efficient energy production and supply. However, this aspect of pollutant emission reduction has not been sufficiently investigated in current related studies. On this basis, this study establishes a DES system that integrates a ground-source heat pump, a gas turbine, a photovoltaic device and an energy storage device. An Improved Zebra Optimization Algorithm (IZOA) is proposed for optimizing the capacity of DES devices and the energy supply ratio of the ground-source heat pump. Using the economic cost saving rate (ECSR), pollutant emission reduction rate (PERR) and energy saving rate (ESR) as the optimization objectives, the study builds a DES configuration optimization model. By analyzing the arithmetic example of a large hotel building, the study verifies the effectiveness of the IZOA algorithm in solving the DES configuration optimization problem. This study provides useful research ideas in promoting the development of distributed energy systems, environmental protection and energy conservation.

1. Introduction

Renewable energy distributed energy systems (DES) with flexible installation, reliable operation and suitability for integrated clean energy are considered the most promising renewable energy systems, with more than 10 GW of installed capacity in over 30 countries [1]. The centralized approach to energy supply is fraught with problems such as energy wastage and air pollution [2]. In contrast, distributed systems deployed on the demand side are able to utilize multiple energy resources more efficiently and meet user needs more flexibly [3]. Over-consumption of fossil energy has led to serious problems such as energy shortages and air pollution. Therefore, the promotion of sustainable energy supply systems is an important solution to help reduce dependence on fossil energy, lower energy consumption and improve environmental quality [4]. In addition, many countries and regions have successively put forward their own decarbonization strategy goals, committing to reach carbon neutrality by 2060 [5]. Moreover, energy consumption in buildings, as an important energy consumption segment, is predicted to increase by 50% in 2060. The DES process with renewable energy installation is urgently needed for efficient renewable energy utilization and for reducing pollutant emissions altogether. The background of today’s technological development is the rapid development of digitalization and information technology [6], and the continuous innovation and development of these technologies are profoundly changing the way people live and work, promoting the transformation of all industries to digitalization and intelligence [7]. Distributed energy systems and intelligent optimization technology can be combined with each other to achieve more intelligent and efficient management and control of distributed energy systems.
DES’ architectural design and optimal configuration coupled with renewable energy sources is an especially hot research topic at present [8]. For instance, Wang et al. [9] optimized the installation location and capacity of energy storage equipment in DES using a mixed-integer linear programming method, which effectively enhanced the energy storage system’s economic performance. Wang et al. [10] proposed a predefined time optimization method for distributed generators to achieve a fairly fast convergence rate. Li et al. [11] considered the distributed power generation with uncertainties that used a Bonferroni test and a conditional value at risk method to solve a distributed microgrid system coupled with photovoltaic (PV) cells, wind power, and hydrogen energy storage with a configuration scheme. Liu et al. [12] used a multi-objective optimization model to optimize the park-level DES with renewable energy, and determined the optimal capacity allocation under different carbon tax constraints. In sum, the DES optimal configuration and performance analysis is needed for improving economic performance.
There are obvious defects in the speed of solving practical problems, although the mathematical programming model is the DES capacity optimization mainstream method. An intelligent optimization algorithm has become the preferred method for many studies to understand the DES optimization model in order to solve the problem of solving speed. For instance, Cao et al. [13] solved a configuration optimization problem for a DES in the Kerman region of Iran employing the owl algorithm. Taghikhani and Khamseh [14] proposed a water cycle algorithm for microgrid energy management, which can reduce the total operating cost by 2% compared with the mixed-integer linear programming method. Deng et al. [15] applied the black hole algorithm to solve the device capacity and the energy ratio of the Ground-Source Heat Pumps (GSHP) for a DES system coupled with GSHP. In sum, intelligent algorithms can effectively solve the capacity optimization problems of various DES. However, the difficulty of solving the DES capacity optimization is greatly improved with the simultaneous access of a variety of renewable energy conversion equipment and energy storage equipment. It is necessary to develop intelligent algorithms with better convergence performance to solve large-scale capacity configuration problems. The contributions are summarized as follows:
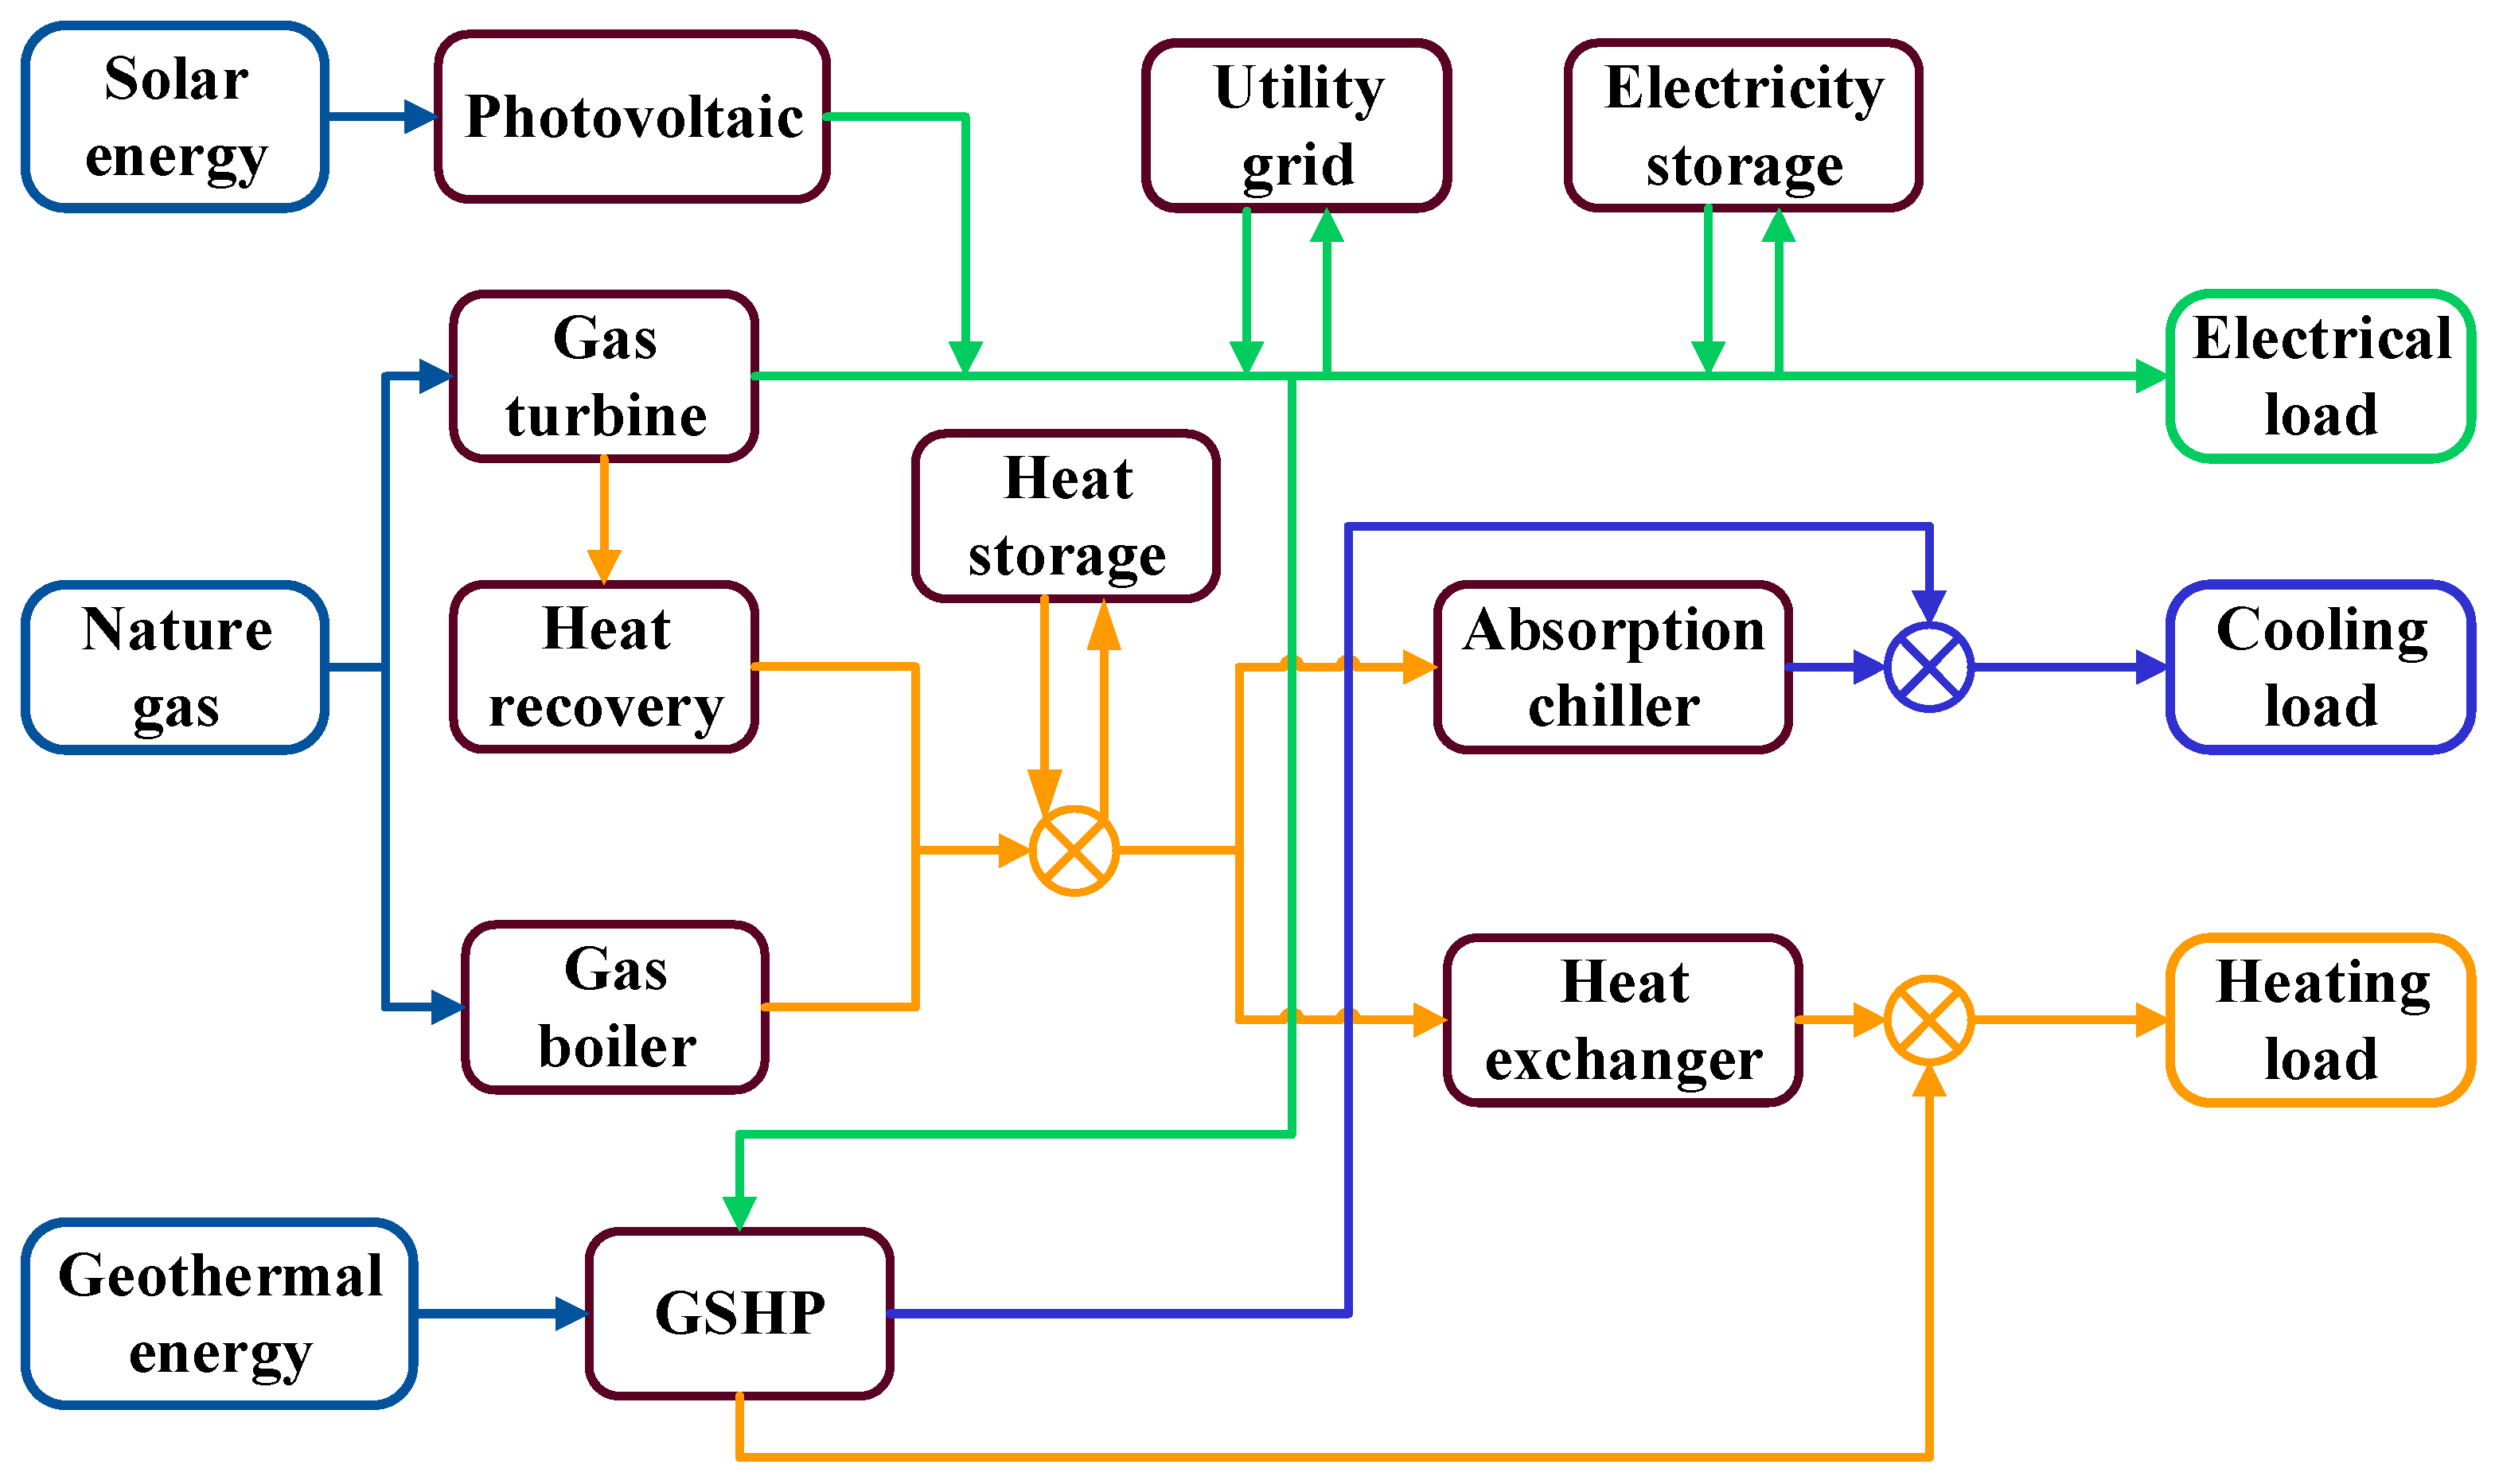
  • A novel DES structure with a simultaneous application of PV, GSHP and energy storage technologies is proposed;
  • A DES optimization model is constructed, which takes into account the emissions of SO2, CO2 and NOx, and reduces the pollutant emissions by 69.90% compared with the conventional SP energy supply system;
  • An IZOA incorporating a sinusoidal cosine strategy, tent chaotic initialization and dynamic adaptive weighting is proposed, which improves the ECSR by up to 13.31% and the PERR by up to 17.57% compared to the comparison algorithms.
The remaining sections of this study are structured as follows: Section 2 provides an introduction to the optimization objective function and the mathematical model of the components within DES. Section 3 introduces the IZOA and tests its performance. Section 4 applies the proposed IZOA to optimize the DES. Section 5 summarizes the results.

2. Literature Review

2.1. Distributed Energy System

The limited and non-renewable nature of traditional energy resources has led to concerns about energy security [16]. DES can reduce dependence on traditional energy resources and improve the stability and security of an energy supply by diversifying energy sources and locations. By utilizing renewable energy resources, DES reduce the use of fossil fuels, which helps to reduce carbon emissions and protect the environment [17]. With the continuous maturity and application of new energy technologies, such as solar, wind, and energy storage, DES can be realized to be deployed and applied in a wider range [18]. Some researchers continue to explore new distributed energy technologies and solutions, such as the application of blockchain technology in energy trading and the design and optimization of microgrid systems [19]. Other researchers are committed to applying artificial intelligence, machine learning and other technologies to DES to achieve intelligent management and optimal scheduling of energy supply and demand [20]. Solar technology has been widely explored for its application in DES as an excellent alternative to traditional fossil energy sources [21]. For instance, Liu et al. [22] proposed a hybrid DES that can efficiently convert and utilize solar energy, consisting of a preheat module, a solar energy conversion module, and a syngas storage module, which significantly improved the solar power generation efficiency and economic benefits of the DES. Zhang et al. [23] analyzed the DES powered benefits using biomass and solar energy under various modes of operation in a cold region. The analysis showed that the constructed DES emitted significantly less CO2 and NOx, as well as having lower annual costs, compared to the traditional energy supply system in this cold region. Xue et al. [24] designed a DES combining carbon capture and solar technologies, and discussed the effects of three CO2 utilization methods on the DES performance. Deng et al. [25] constructed a DES jointly driven using a ground-source heat pump (GSHP) and solar energy, and further enhanced the overall performance of the coupled system by optimizing the GSHP starting factor. Ashrafi et al. [26] investigated a hybrid DES system configured with GSHP and PV and demonstrated that the combination of the two renewable energy technologies is superior to DES coupled with GSHP or solar alone. The constructed DES saved 2.03 × 10⁴ t CO2 emissions and 6.48 × 10⁵ USD compared to the reference system without solar energy. Some studies used ground-source heat pump (GSHP) technology as a heating and cooling source for DES, integrating both solar and geothermal energy to maximize the exploitation of the DES energy supply potential [27].
The energy transfer and storage capabilities of energy storage devices fit well with the flexibility needs, and its introduction into DES helps to better coordinate the operation of each device. Ma et al. [28] investigated the effect of thermal storage devices on the DES energy efficiency, and concluded that the reasonable deployment of thermal storage capacity can effectively improve the flexibility and energy efficiency. Ge et al. [29] found that energy storage devices can reduce annual operating costs by 7.48%. Batteries gradually outperform the utility grid in terms of electricity regulation capability as investment costs decreased by introducing batteries and thermal storage tanks in a solar DES. Li et al. [30] proposed a multi-energy complementary DES incorporating solar technology, GSHP and hybrid energy storage technology, and concluded that transferring energy in different time dimensions through energy storage technology could reduce carbon emissions by 42%.

2.2. Optimization Algorithm

Optimization algorithms play an important role in the optimization of DES and can help the system to achieve low-cost energy production, storage and distribution [31]. The application of optimization algorithms improves the efficiency of the system, reduces costs, and reduces carbon emissions [32]. Common optimization algorithms include the genetic algorithm [33], the particle swarm algorithm [34], and the grey wolf optimizer [35]. The equipment installation capacity of each component within DES directly affects the DES economic performance and energy consumption; therefore, many studies have conducted in-depth studies on its configuration optimization methods. Moser et al. [36] used mixed-integer linear programming to optimize the equipment capacity of an energy supply system in an Austrian urban area, which could save 3%-6% of the annual cost for the area. Huang et al. [37] developed a mixed-integer optimization framework containing a double penalty strategy for DES, and the computation time was reduced by 79.2% compared to the conventional planning algorithm. Tian et al. [38] designed a mixed-integer planning model for a campus DES that accounts for flexibility metrics, and the model is effective in improving the DES flexibility under different operating scenarios.
However, the planning algorithm suffers from problems of falling into local optima and long solution times when configuring DES with complex structures. Intelligent optimization algorithms with excellent computational power are gradually becoming the mainstream tool for DES capacity optimization. Hou et al. [39] proposed a hybrid energy system consisting of gravity energy storage and distributed power sources, and used a cat swarm optimization algorithm to calculate the optimal equipment capacity for PV, wind power, and gravity energy storage. Meanwhile, the performance differences in three energy storage devices under different electricity pricing modes were also discussed. Huang et al. [40] used a genetic algorithm to optimize the optimal capacity of shared cells in a community solar DES, reducing power loss by 55% and capacity configuration by 36.6%. Gao et al. [41] used the particle swarm optimization and the empirical mode decomposition method to optimize the capacity and power output of the hybrid energy storage unit in the regional DES, which reduced the investment cost by 8.8%.
In summary, a great deal of research has been carried out in DES design and optimization, but there are still shortcomings, as reflected in the following: (1) The current consideration of pollutants is relatively homogeneous, focusing mainly on CO2 emission; and (2) the performance of the existing intelligent algorithms needs to be further improved to cope with the difficulties in capacity configuration caused by upgrading the DES structure. To address the issues, this study proposes an IZOA algorithm for optimizing the DES configuration scheme coupled with renewable energy sources.

3. Distributed Energy System

3.1. System Description

DES cover multiple energy fields such as electricity, heat and cooling, and contain a variety of distributed energy supply devices that can match the multiple energy demands of multiple users in a region in a timely manner through conversion and synergy between different energy sources. The DES system configured in this study couples solar and geothermal energy conversion devices and introduces energy storage devices to regulate the energy flow in the system, and the system structure is presented in Figure 1. The DES system consists mainly of a power subsystem, a heating and cooling subsystem, an energy storage subsystem and an auxiliary energy supply module. The power subsystem consists of a fossil fuel driven gas turbine (GT) and a solar absorbing PV unit, which is the main source of electricity for the system. The heating and cooling subsystem consists of three main modules: the waste heat recovery unit (HR) and gas boiler for heat production, the absorption chiller (AC) for heat cooling and the GSHP for both the cold and heat supply, and the energy storage subsystem consisting of the electricity storage unit (ES) and the heat storage unit (HS) for short-term energy supply. The auxiliary energy supply module consists of the heat exchanger (HE) and the utility grid, which is used to integrate the energy supplied using the cooling and heating subsystems and transmit it to the different users. The DES is able to interact with the external grid, relying on the excess power generated through the PV to generate revenue from the grid, and purchasing power in time to guarantee the reliability of the supply when the power generated within the DES is insufficient.
In order to evaluate and analyze the DES performance, a reference system needs to be selected to compare with. A separate supply system (SP), which relies on the grid, electric chillers and boilers for the supply of electrical, cooling and thermal energy, was defined as the reference system for this study and its structure is shown in Figure 2. In Figure 1 and Figure 2, the green line indicates the flow of electricity, the orange line indicates the flow of heat energy, and the blue line indicates the flow of cold energy.

3.2. DES Energy Balance

3.2.1. Cooling Balance

The equilibrium equation for the DES cooling can be expressed as follows [42]:
Q l o a d c = Q h p c + Q A C , o u t
Q h p c = k c Q l o a d c
where Q l o a d c , Q h p c and Q A C , o u t represent the total cooling load demand of the users in the area, the cooling capacity of the GSHP and AC, and k c is the cooling ratio, which is used to regulate the output of the GSHP during the cooling season. The electrical energy consumed by the GSHP in cooling with geothermal energy, E h p c , and the heat absorbed by the AC, Q A C , i n , can be expressed as follows [43]:
E h p c = Q h p c η h p c
Q A C , i n = Q A C , o u t η a c
where η a c and η h p c denote the cooling efficiency of AC and GSHP.

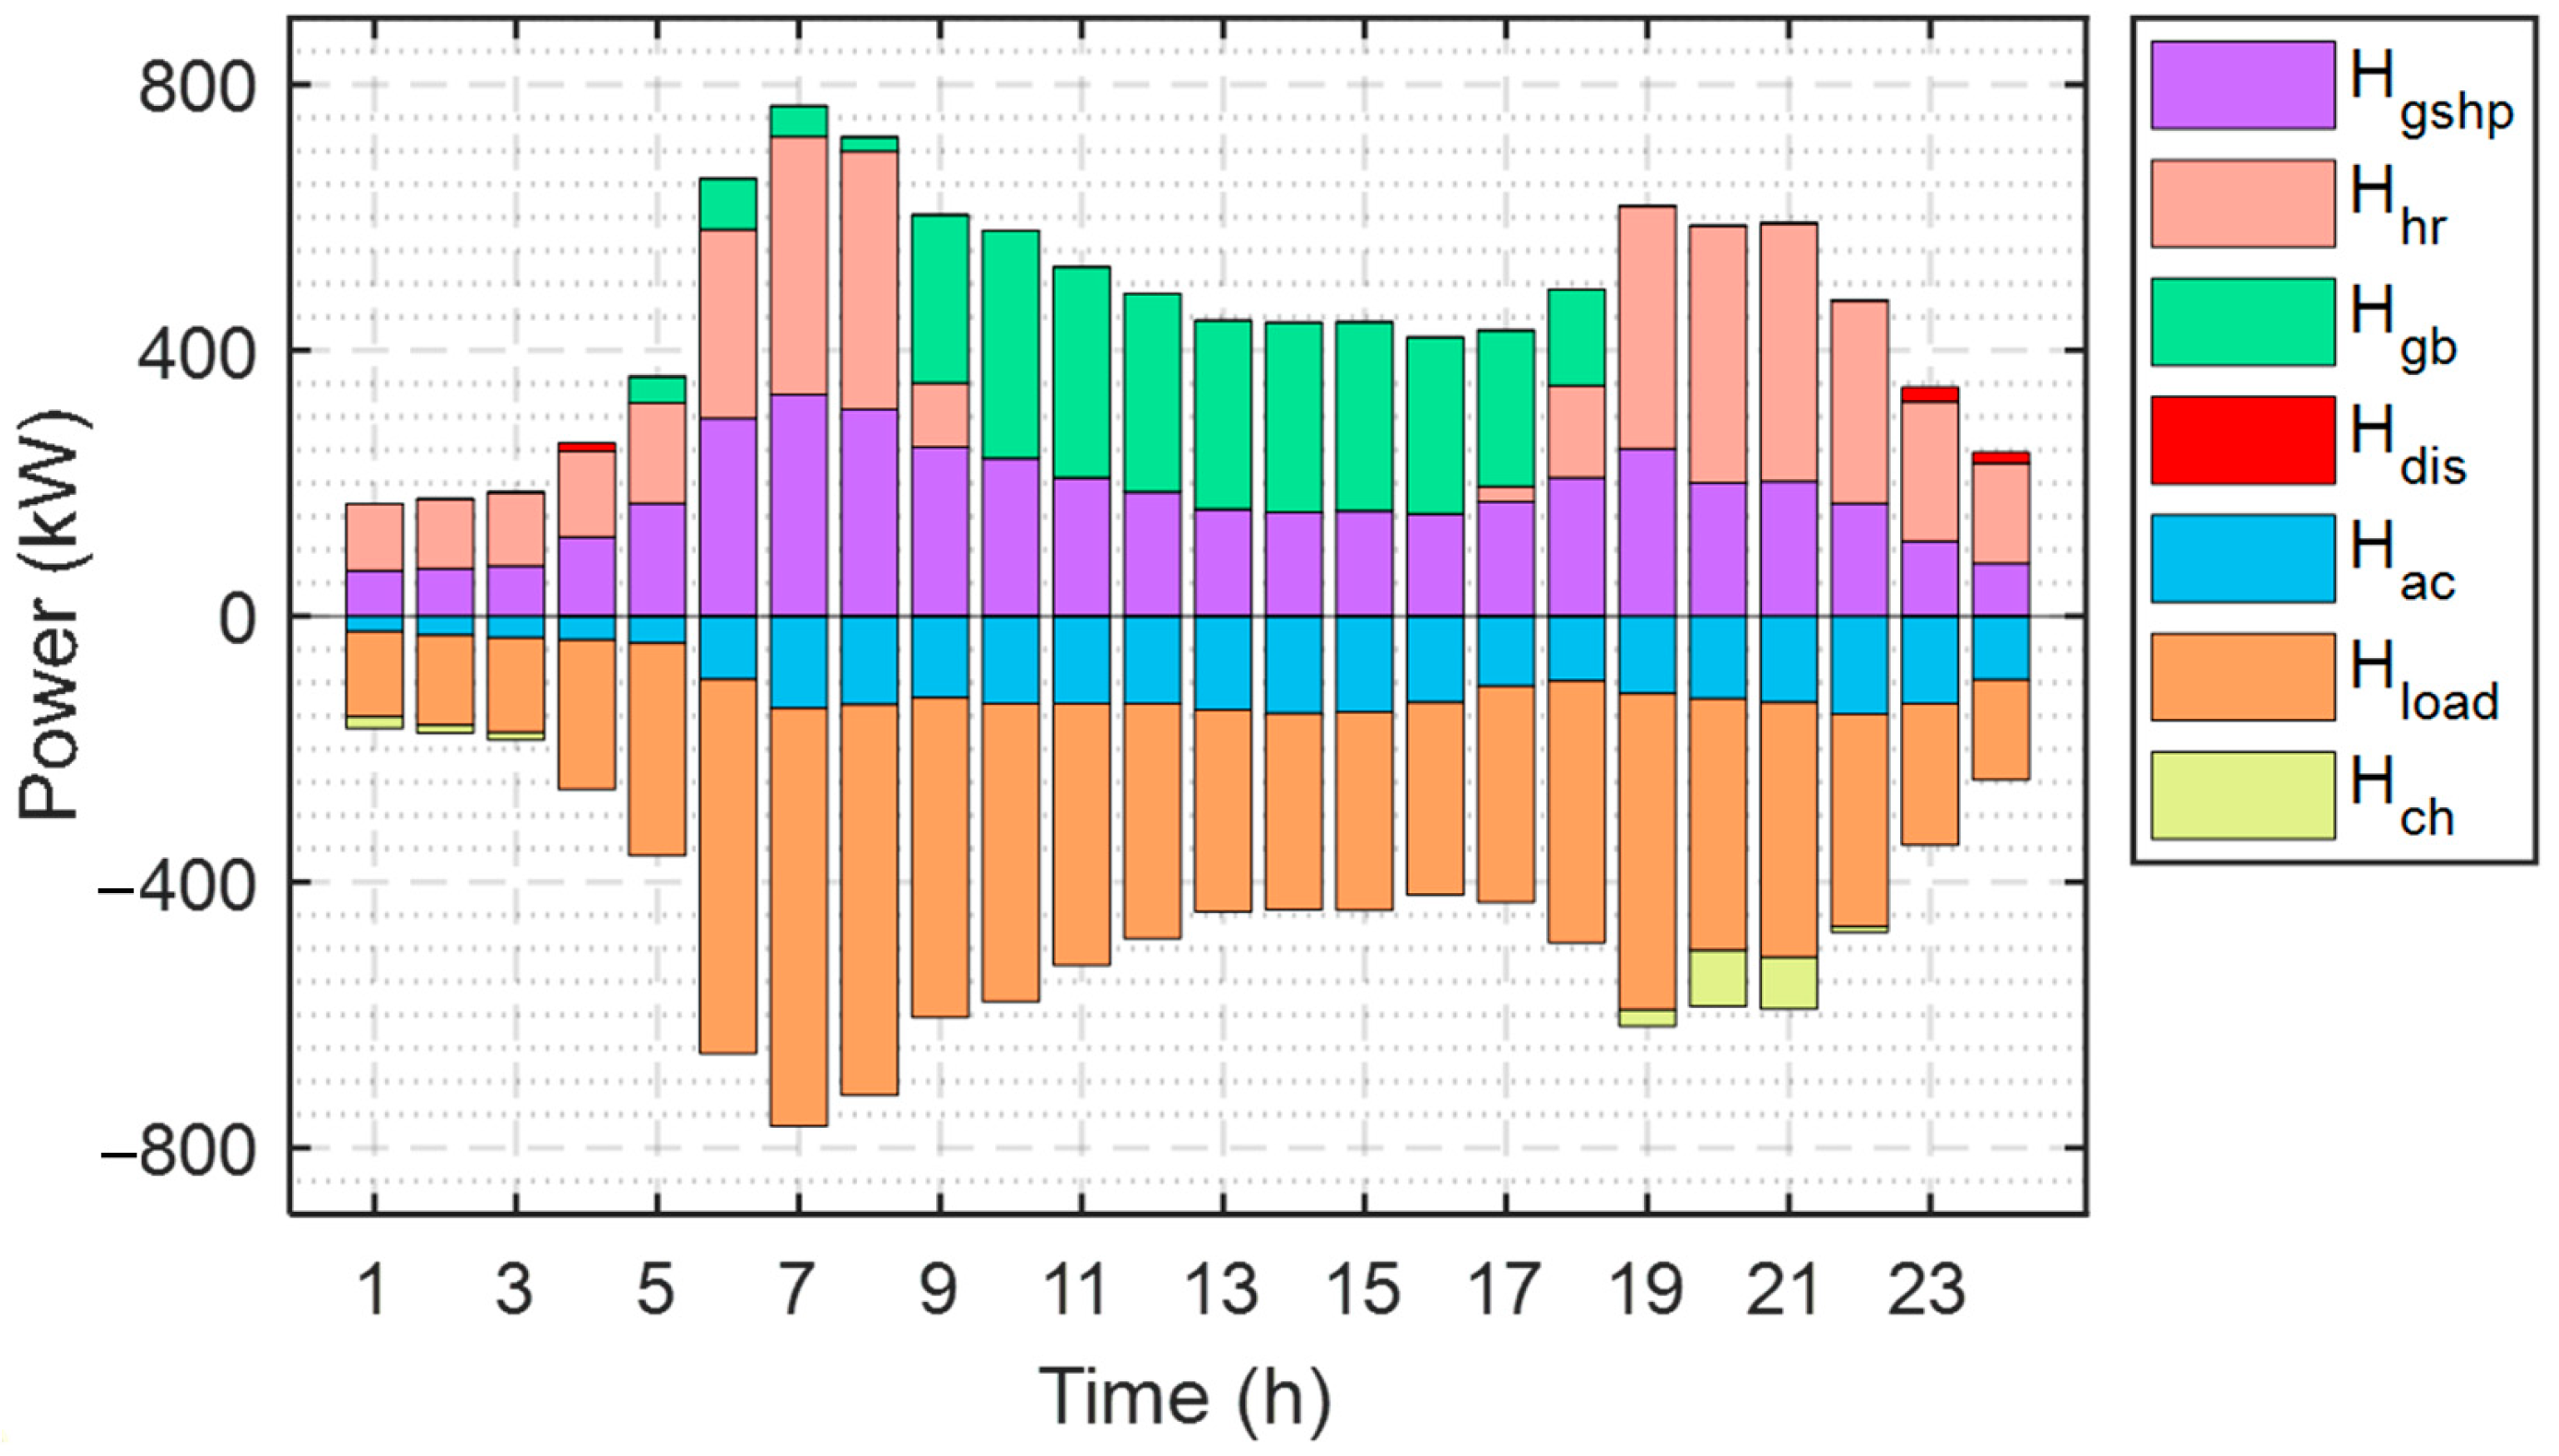
3.2.2. Heating Balance

The heat balance equation for DES can be represented as follows:
Q l o a d h = Q H e + Q h p h Q h p h = Q l o a d h k h Q H e = Q H e , i n η h e Q H e , i n = Q g t + Q g b + Q H s , o u t Q H s , i n
where Q l o a d h , Q h p h and Q H e represent the sum of the heat load demand of the users in the area, the heat provided by GSHP and HE; k h is the heating ratio, which is used to regulate the output of GSHP during the heating season; Q H e , i n and η h e indicate the heat flow into HE and the conversion efficiency of HE; Q g t , Q g b and Q H s , o u t denote the heat from GT, GB and HS, and Q H s , i n denotes the heat absorbed by HS when DES produces too much heat.
The electrical energy consumed by GSHP for heating, E h p h , is as follows [44]:
E h p c = Q h p h η h p h
where η h p h is the heating efficiency of GSHP.
The thermal energy Q g t and Q g b produced by GT and GB can be calculated as follows [45]:
Q g t = F g t η r e ( 1 η g t )
Q g b = F g b η g b
where F g t and F g b are the amount of fuel consumed by the device; η r e , η g b and η g t indicate the waste heat utilization efficiency of HR, the thermal efficiency of GB and the power generation efficiency of GT.
The heat Q H s , o u t and Q H s , i n at a given point in time can be calculated from the equation of state of HS [46]:
Q H s , t = Q H s , t 1 ( 1 σ h ) + ( Q H s , i n , t η h s , i n Q H s , o u t , t η h s , o u t )
where Q H s , t is the heat storage capacity of HS at a given moment and Q H s , t 1 corresponds to the remaining heat of HS in the previous hour; the heat self-loss rate, heat absorption and heat release efficiency of HS are denoted as σ h , η h s , i n and η h s , out , respectively.

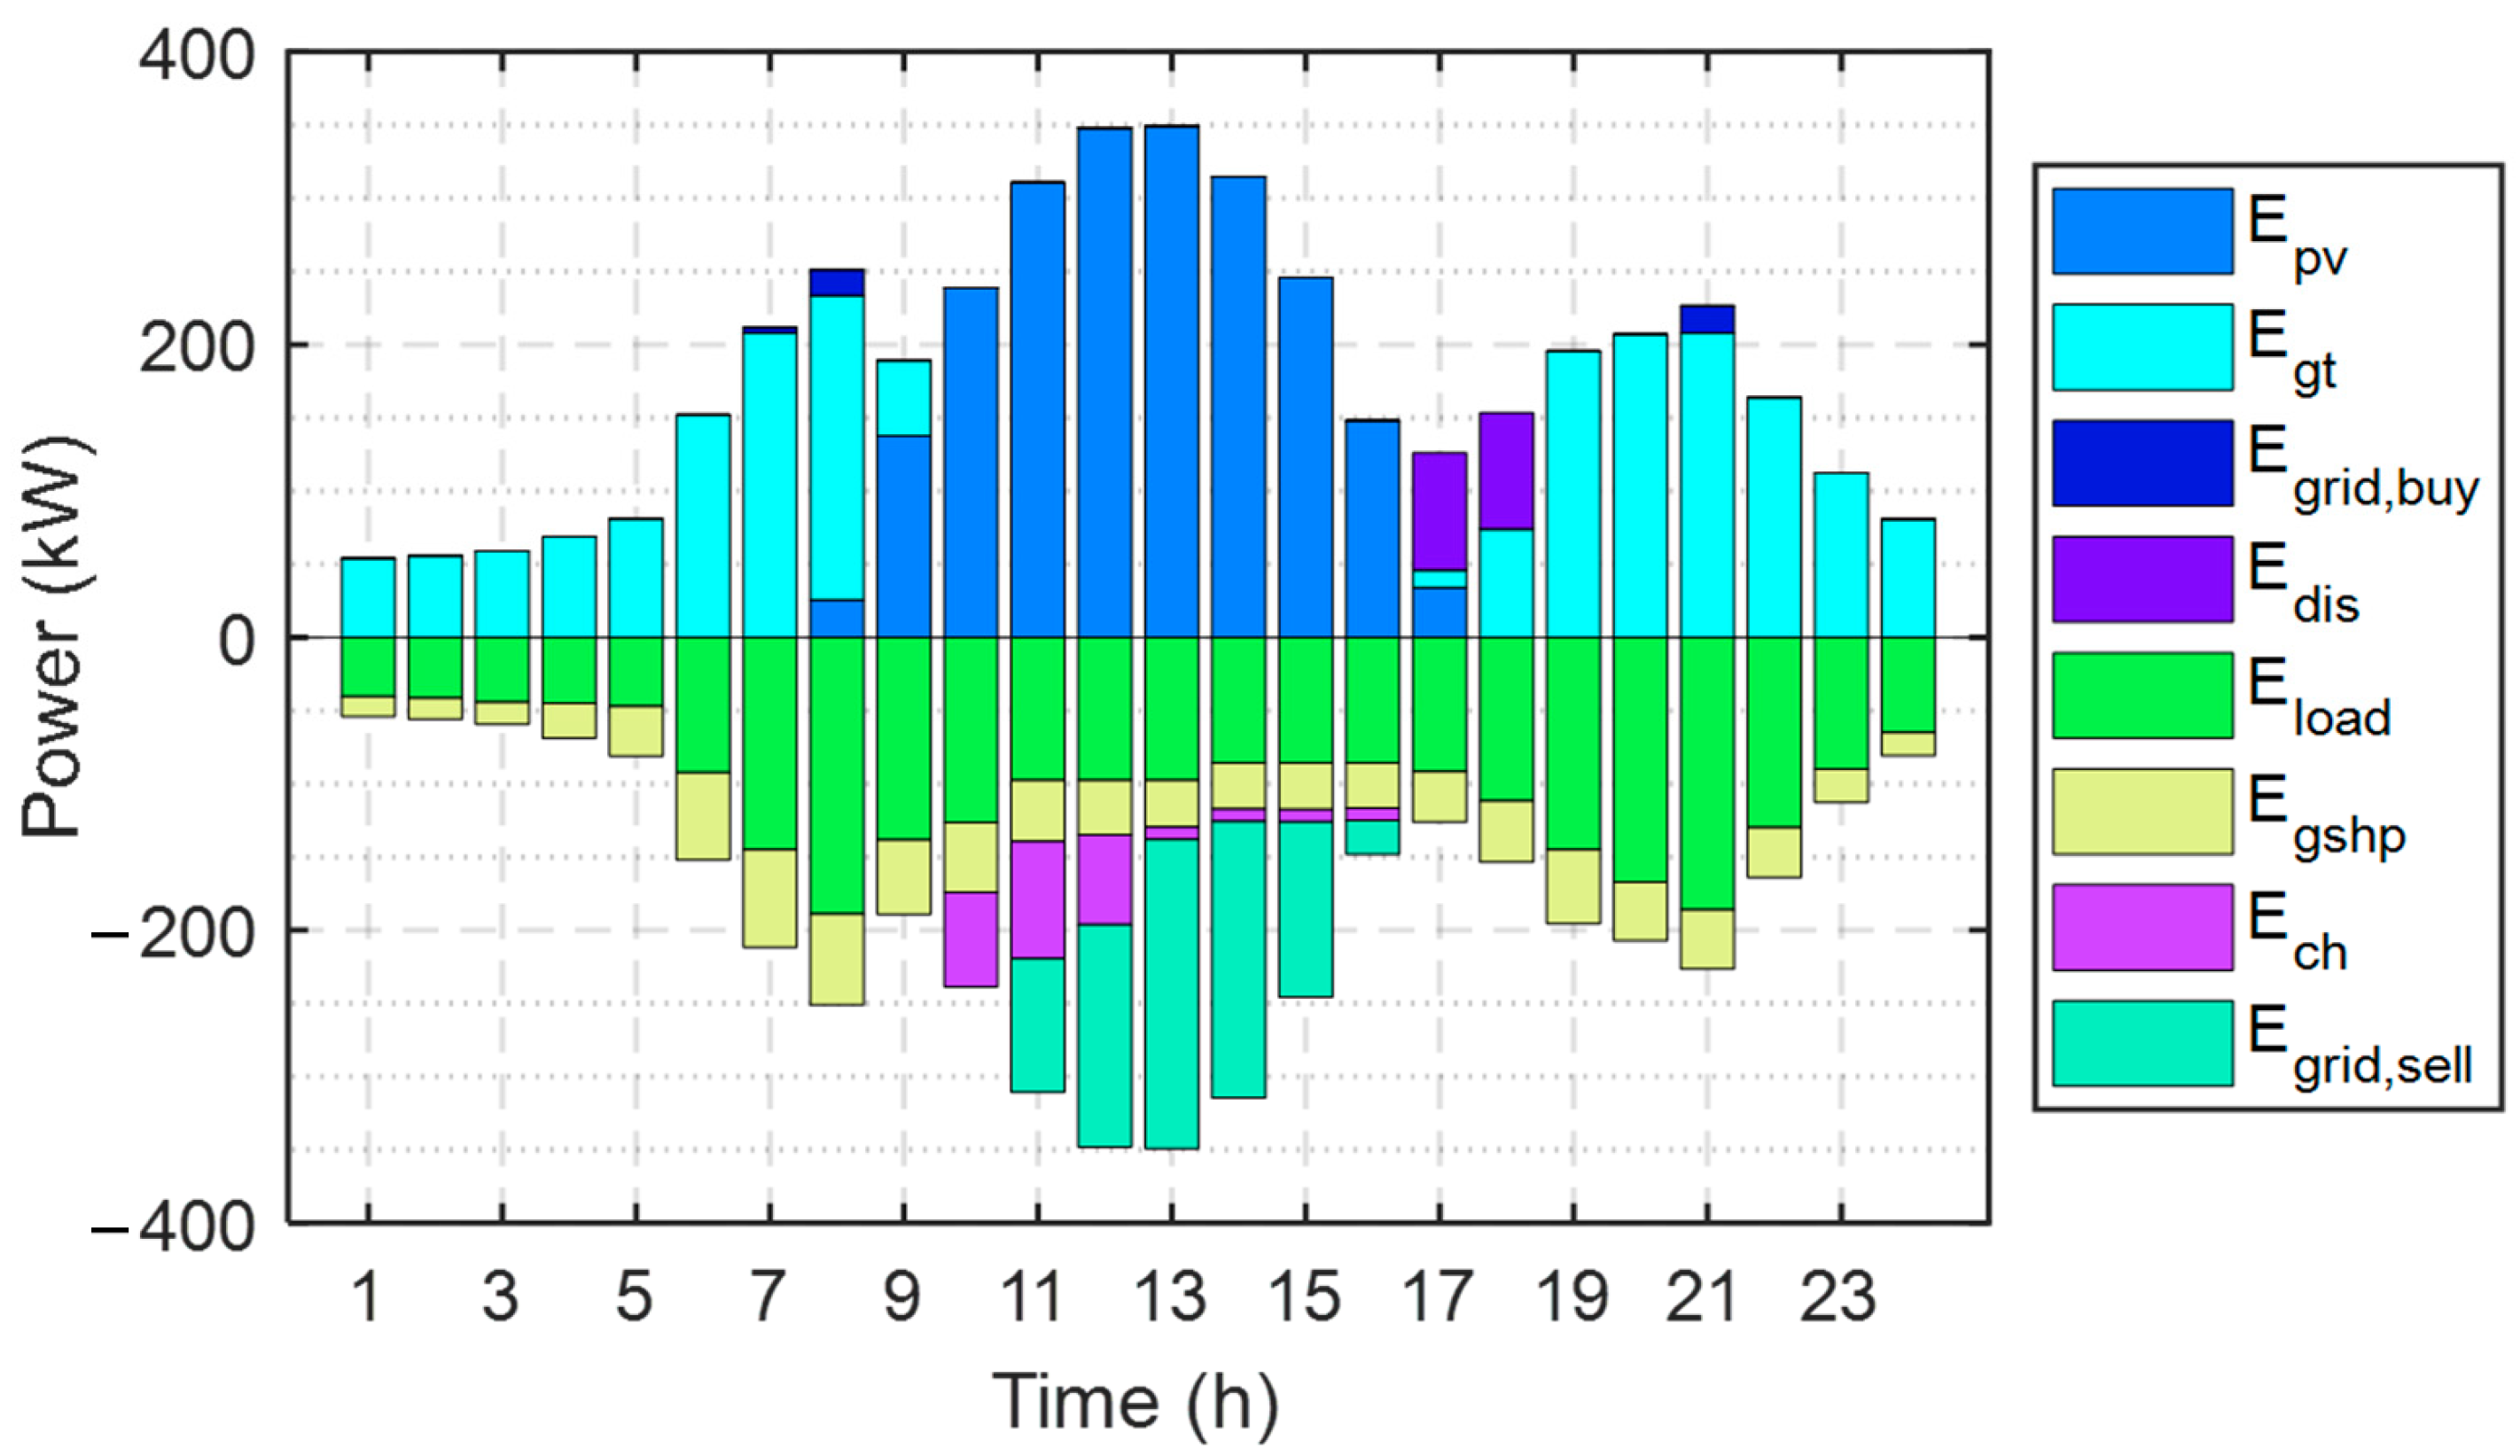
3.2.3. Electricity Balance

The electricity balance equation for DES can be expressed as follows:
E l o a d + E g s h p h + E g s h p c = E g t + E p v + E g r i d , b u y E g r i d , s e l l + E E s , o u t E E s , i n
where E l o a d , E g t and E p v represent the total electricity demand of users in the region, the generation of GT and PV; E g r i d , b u y and E g r i d , s e l l denote the purchase and sale of electricity between DES and the utility grid; E E s , o u t and E E s , i n denote the electricity released and stored by ES.
The electricity generation of GT ( E g t ) and PV ( E p v ) is calculated as follows [47]:
E g t = F g t η g t
E p v = N p v G A C G S T C 1 + μ ( T c T r )
where N p v , G A C and G S T C denote the installed capacity of the PV, and the light radiation intensity under actual and standard conditions; μ , T c and T r denote the power temperature coefficient, the operating and PV panels’ reference temperatures.
The electrical energy A and B at a certain time can be calculated from the equation of state of ES [48]:
E E s , t = E E s , t 1 ( 1 σ e ) + ( E E s , i n , t η e s , i n E E s , o u t , t η e s , o u t )
where E E s , t is the electrical energy stored in the ES at a given moment and E E s , t 1 corresponds to the remaining energy in the ES in the previous hour; the self-loss rate of the ES, the efficiency of replenishing and releasing energy are denoted as σ e , η e s , i n and η e s , out , respectively.

3.3. Operation Strategy

Choosing the right operating strategy can maximize the DES performance and reduce more costs and pollutant emissions. The following electrical load (FEL) strategy and following heat load (FHL) strategy are two of the energy efficiency management strategies used to effectively manage electrical and thermal loads in a building or industrial facility. The following electrical load (FEL) strategy was selected to guide the DES operation. The operation process under FEL strategy is briefly introduced below.
When DES operates in FEL mode, it is first necessary to allocate the cooling and heating load demand to be borne by GSHP according to the cooling ratio k c and heating ratio k h and to find the GSHP power consumption. The electrical energy consumed by GSHP and the electrical load demand of users is supplied by PV and GT, and the shortfall is supplemented by ES and the external grid. The heat generated by GT is used to match the heat load demand of HE and AC, and the shortfall. The excess heat and power generated within the DES are stored by the TS and HS.
The FEL strategy focuses on monitoring and tracking power demand and adjusting to actual loads to ensure power availability.
FHL strategies are primarily concerned with monitoring and tracking heat load demand and adjusting to actual loads to ensure heat supply.
The DES established in this study contains a PV power generation unit that relies on the excess power generated by the PV to generate revenue from the grid and to purchase power from the grid in a timely manner when there is a shortage of power generated within the DES. Electricity generated by PV systems typically varies with solar radiation and may generate large amounts of electricity on sunny days. Using the FEL strategy ensures that these large amounts of solar power are utilized efficiently and not wasted. The FEL strategy allows the DES to be adjusted according to the actual power demand to ensure that sufficient power is available at all times. This helps to improve the stability and reliability of the system. Compared with the FHL strategy, the FEL strategy is more suitable for this study because the PV power plant in the DES mainly generates electricity rather than heat. Therefore, by choosing the FEL strategy, the system can better meet the power demand and improve energy efficiency.

3.4. Objective Function

The objective of this study is to improve the DES economic, energy and environmental performance, so the objective function is set as a composite function containing three evaluation indicators: economic cost saving rate (ECSR), pollutant emission reduction rate (PERR) and energy saving rate (ESR), with the following expression [30]:
min F = 1 ( ω 1 E C S R + ω 2 P E R R + ω 3 E S R )
where ω 1 , ω 2 and ω 3 denote the weighting coefficients to measure the importance of ECSR, PERR and ESR. The most commonly used equal weighting method is applied in this study, setting ω 1 = ω 2 = ω 3 = 1 / 3 .
The mathematical expression for ECSR is as follows:
E C S R = C R S C D E S C R S
where C R S and C D E S indicate the economic cost of the reference system and DES, respectively. The cost C D E S can be expressed in detail using the following equation:
C D E S = p ( 1 + p ) m ( 1 + p ) m 1 k = 1 n N k C i k + t = 1 T ( E g r i d , b u y t E g r i d , s e l l t ) δ g r i d + t = 1 T ( F g t t + F g b t ) δ g a s
where p, Nk and m denote interest, the installed capacity of the DES kth device and its service life, respectively; C i k is the corresponding investment cost of the device; δ g r i d and δ g a s denote the purchase cost per kWh of electricity and natural gas.
The mathematical expression for PERR is as follows:
P E R R = P R S P D E S P R S
where P R S and P D E S indicate the pollutant emissions from the reference system and DES, respectively, taking into account the emissions of CO2, SO2 and NOx, and P D E S is calculated in detail as follows:
P D E S = γ C O 2 , e E g r i d , b u y + γ C O 2 , g ( F g t + F g b ) + γ S O 2 , e E g r i d , b u y   + γ S O 2 , g ( F g t + F g b ) + γ N O x , e E g r i d , b u y + γ N O x , g ( F g t + F g b )
where γ C O 2 , g and γ C O 2 , e are CO2 emission factors for natural gas and utility grids, respectively, γ S O 2 , g and γ S O 2 , e are SO2 emission factors, and γ N O x , g and γ N O x , e are NOx emission factors.
The mathematical expression for ESR is as follows:
E S R = F R S F D E S F R S
F g r i d = E g r i d , b u y η g , p η g , t
where F R S and F D E S denote the total fuel consumption of the reference system and DES, respectively, including natural gas F g b and F g t consumed by GB and GT and fossil fuel F g r i d burned for external grid generation. η g , p and η g , t represent the generation efficiency and transmission efficiency of the power grid, respectively.

4. Optimization Algorithm

4.1. Zebra Optimization Algorithm

The Zebra Optimization Algorithm (ZOA) is a new meta-heuristic optimization algorithm proposed by Eva Trojovská in 2022, inspired by the social life behavior of zebras in nature [49]. The algorithm solves complex mathematical optimization problems by modelling the zebra’s foraging and defensive response in response to predators, with excellent convergence speed and search performance. The solution process of the ZOA can be divided into three stages: population initialization and fitness calculation, foraging behavior, and defending strategy.
(1)
Population initialization and fitness calculation
In the ZOA, in order to obtain an optimal solution to the target problem, a random population of zebras is generated as the search space for the problem, and the optimal zebra individual positions are found via iterative computation.
The randomly generated initialized zebra position matrix is as follows:
X Z = x 1 , 1 x 1 , 2 x 1 , d x 2 , 1 x 2 , 2 x 2 , d x N , 1 x N , 2 x N , d
where X Z denotes the initialized generated zebra population; x i , j is the position of the ith zebra in the jth dimension; d and N denote the dimension of the optimization problem and the number of individuals in the zebra population.
The fitness calculation formula of zebra is as follows:
F Z = F 1 F 2 F N
where FZ is the fitness matrix of zebras and Fi is the fitness value of the ith zebra. In solving the DES configuration problem, the objective function of the problem is set as the fitness function of the zebra population.
(2)
Foraging behavior
At the second stage of the optimization process, the zebra population updates its position through foraging behavior guided by the optimal zebra individuals, and the position update expression is as follows:
x i , j n 1 = x i , j + a 1 ( Z j P a 2 x i , j )
a 1 = r a n d a 2 = r o u n d ( r a n d + 1 )
X i = X i F i < F i n 1 X i n 1 F i > F i n 1
where Z j P is the best zebra with the smallest fitness, called the pioneer zebra; rand is a random number in the interval [0, 1]; X i n 1 is the new position of the zebra after the position update in the foraging phase, and F i n 1 is its corresponding fitness value; if the fitness value of the new position is smaller, the zebra individual replaces the original position with the updated position in the first phase and enters the next phase.
(3)
Defending strategy
At the third stage of the optimization process, the zebra population updates its position according to the defending strategy. The defending strategy is divided into two modes, M1 and M2, and the random number a3 generated by the [0, 1] interval determines which mode the zebra performs; the updated formula is shown below:
X i , j n 2 = M 1 : x i , j + R ( 2 r a n d 1 ) ( 1 t / T m a x ) x i , j ( a 3 0.5 ) M 2 : x i , j + r a n d ( Z j A a 2 x i , j ) ( a 3 > 0.5 )
X i = X i F i < F i n 2 X i n 2 F i > F i n 2
where R is an artificially set constant; X i n 2 is the new position of the ith zebra after the position update of foraging phase, and F i n 2 is its corresponding fitness value; Z j A is the value of a randomly selected zebra individual in the jth dimension, and this random individual is called the attacked zebra.

4.2. Improved Zebra Optimization Algorithm

(1)
Tent chaotic mapping initialization population
The ZOA algorithm generates a completely random zebra population in the initialization phase of the population. This traditional initialization method may lead to an uneven distribution of the initial individuals of zebras, and if most of the initial zebra positions are far from the optimal solution, the ZOA is prone to fall into a local optimal solution in the subsequent solution process. Therefore, in order to generate a zebra population that is more uniformly distributed in the search space, this study introduces tent chaotic mapping to initialize the population, and the new initialization equation can be expressed as follows:
x i = r i ( u b l b ) + l b
r i = r i 1 / β r i 1 [ 0 , β ] ( 1 r i 1 ) / ( 1 β ) r i 1 ( β , 1 ]
where xi denotes the individual zebra after tent chaos initialization and ri denotes the generated chaotic sequence; ub and lb denote the upper and lower boundaries of the generatable zebra positions; and β is an adjustable chaos parameter.
(2)
Sine cosine strategy
To strengthen the global search ability of ZOA, the sine cosine strategy was introduced in the foraging phase to modify the position update Formula (22) of zebra individuals according to the sine cosine model in the Sine Cosine Algorithm (SCA). The new formula for foraging behavior after the introduction of the sine cosine strategy is as follows:
x i , j n 1 = x i , j + b 1 sin b 2 b 3 Z j P a 2 x i , j ) r a n d < 0.5 x i , j + b 1 cos b 2 b 3 Z j P a 2 x i , j ) r a n d 0.5
b 1 = 1 ( t / T m a x ) k 1 / k
where b2 and b3 are random numbers generated in the interval [0, 2π], k is the adjustment coefficient, and k 1 .
(3)
Dynamic adaptive weight factor
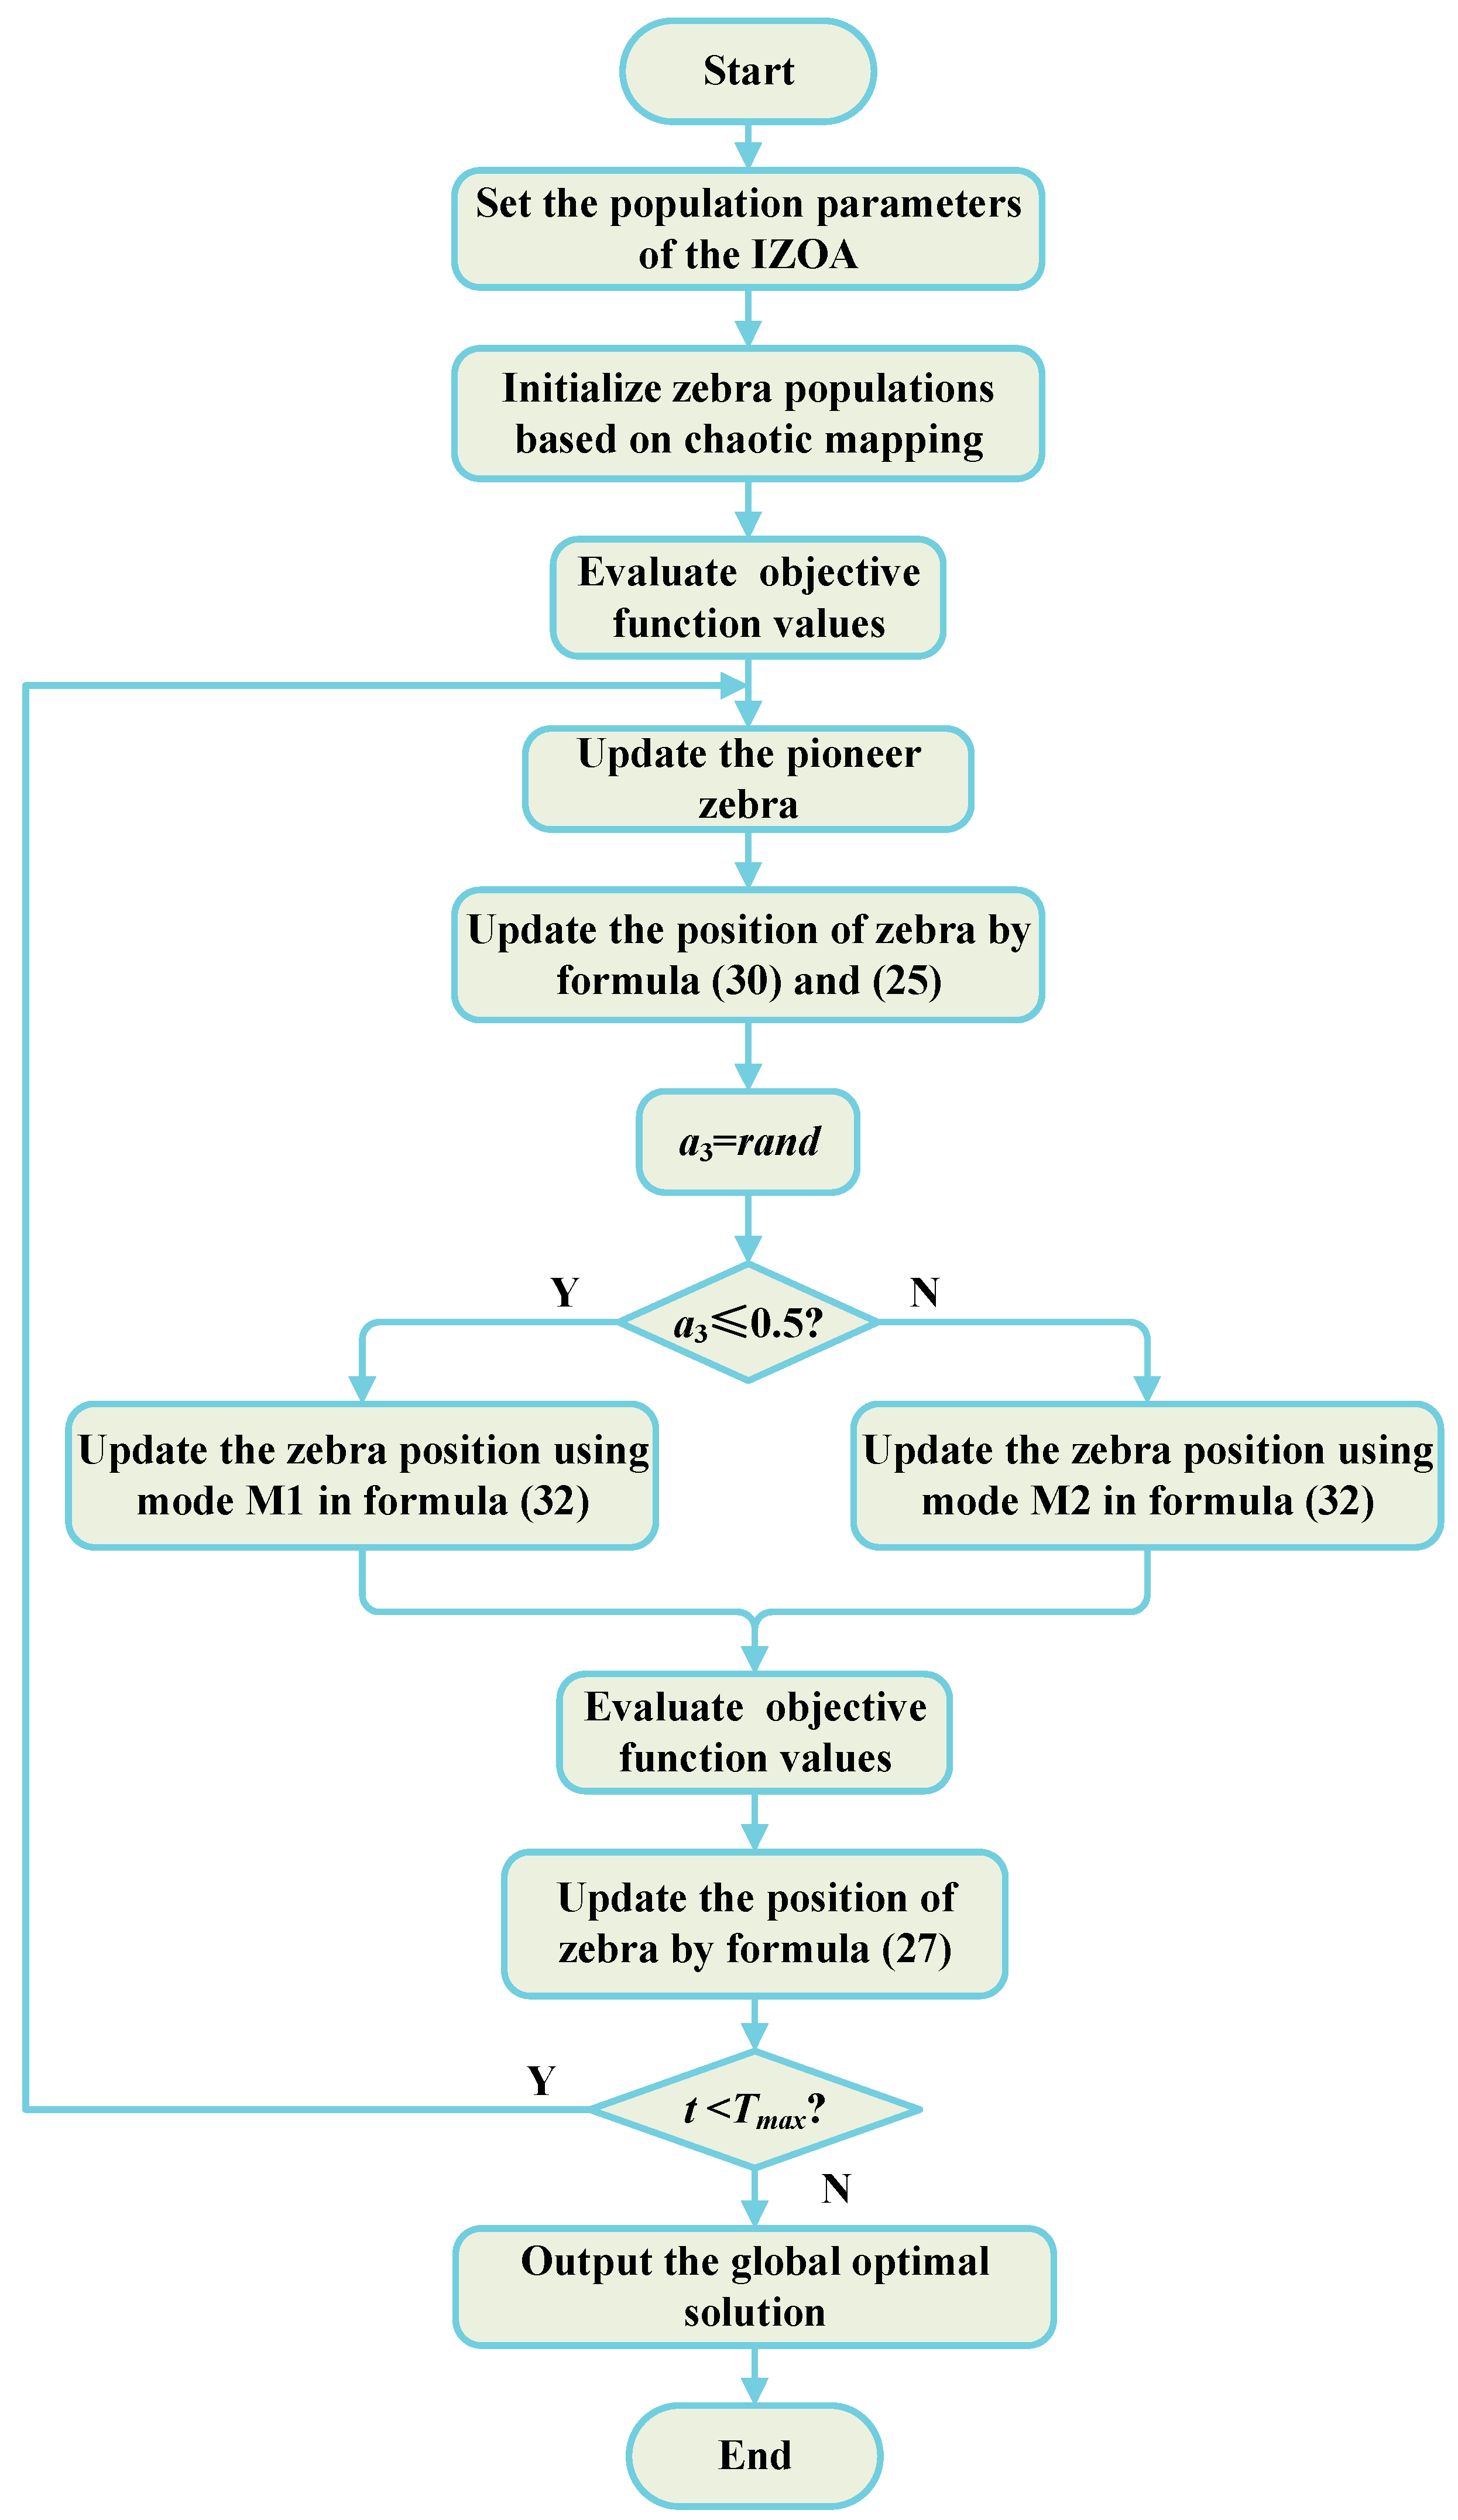
The introduction of dynamic adaptive weight factors in the defending strategy of ZOA is beneficial to dynamically balance the global search and local exploration ability of the algorithm. In the early iterations, the weight factor decreases rapidly, which helps to enhance the global search ability of individual zebras, while in the middle and late iterations, the weight factor changes gradually and slowly to match the zebras’ local exploration in the search space. The new position update formula and dynamic adaptive weight factor wz for the zebra imperial strategy are shown below:
X i , j n 2 = M 1 : w z x i , j + 0.01 ( 2 r a n d 1 ) ( 1 t / T m a x ) x i , j ( a 3 0.5 ) M 2 : w z x i , j + r a n d ( Z j A a 2 x i , j ) ( a 3 > 0.5 )
w z = [ 1 + cos ( 3 2 π + 1 2 π t T m a x ) ]
The specific optimization process of the IZOA is illustrated in Figure 3. IZOA is initialized using the tent chaos mapping strategy and iteratively optimized by incorporating the foraging formula with a sine cosine strategy and the defending formula with the introduction of a dynamic weighting factor, as follows:
(1)
Set the population parameters of IZOA, including dimensionality, number of zebras, and maximum number of iterations;
(2)
Initialize the zebra population using tent mapping;
(3)
Calculate the individual zebra fitness values and record the optimal zebra positions;
(4)
Update the individual zebra positions by incorporating the foraging formula of the sine cosine strategy;
(5)
Generate a random number a3 and select the defending mode according to a3. If a 3 0.5 , update the zebra position using mode M1 in the update Formula (32) with the addition of dynamic adaptive weights; if a 3 > 0.5 , the zebra updates the zebra position using mode M2 in Formula (32);
(6)
Calculate the fitness value of all zebras, update the zebra position through Formula (27) and save the global optimal solution;
(7)
Determine whether the iteration termination condition is reached. If the condition is reached, the global optimal solution is output, and the IZOA is ended. If the termination condition is not satisfied, step (4) is returned for loop iteration.

4.3. Performance Analysis of IZOA

In order to test the effects of the three improvement strategies proposed in this study on the ZOA search performance, the Sine Cosine Algorithm (SCA) [50], Grey Wolf Optimizer (GWO) [51], Genetic Algorithm (GA) [52], and Simulated Annealing (SA) [53], which are currently widely used in engineering problems, are selected as the comparison algorithms and are used together with ZOA and IZOA to conduct comparative search experiments on four benchmark test functions. The expressions, dimensions, and theoretical minima of the four test functions (Fmin) are shown in Table 1. F1 and F2 are single-peaked functions used to examine the convergence speed and local search accuracy, and F3 and F4 represent multi-peaked test functions to verify the global search capability of the algorithm. The search performance of the algorithm on F1F4 can objectively evaluate the comprehensive search ability of IZOA and verify the effectiveness of IZOA [54].
Table 2 presents the special parameter settings of the six algorithms. N is the population size of the algorithm. α is the component of the adaptive parameter controlling the sine cosine range in SCA; a = 2 – t × (2/Tmax) is the convergence control factor in the GWO algorithm; R is the invariant parameter in the ZOA defense phase position update formula; β and k represent the chaos parameter and the regulation parameter in IZOA. The same number of populations and maximum number of iterations are set for each algorithm to create a fair testing environment for the algorithms, which are 30 and 1000. Each algorithm is tested 20 times independently, and the mean (Avg), optimal value, standard deviation (Std) and worst value of the 20 independent experimental results are listed in Table 3, and the iterative convergence curves of F1F4 are given in Figure 4. The optimal values of the comparison results of different algorithms are shown in bold in Table 3.
The results in Table 3 and Figure 4 show that both ZOA and IZOA converge to the theoretical minimum fitness 0 when solving the single-peak functions F1 and F2, whereas the convergence curves of the comparison algorithms GWO and SCA show a flat trend and stagnate at the later stage, based on which it can be seen that ZOA and IZOA exhibit good search performance. From the convergence curves of F1 and F2, it is clear that the curve of IZOA decreases rapidly at the beginning and searches for the optimal value before 400 iterations, which proves that the convergence speed of IZOA has obvious enhancement compared with that of ZOA. For the multi-peaked functions F3 and F4, IZOA outperforms the GWO, ZOA and SCA algorithms in terms of convergence accuracy and stability due to the introduction of the sine cosine strategy and dynamic adaptive weighting factors. The average values of IZOA on F3 and F4 are −1.14 × 10⁴ and 4.42 × 10⁻⁴, which are significantly superior to those of ZOA at −6.84 × 10³ and 1.31 × 10⁻³, highlighting the positive effect of the improvement strategy on the optimization-seeking ability of the ZOA, which reflects that IZOA has the ability to jump out of the local optimal solution. In addition, the standard deviation of IZOA is also the smallest among the tested algorithms, which shows the strong stability of IZOA.

5. Case Analysis

5.1. Case Description

A hotel building in China is adopted as the research object in this study, and the DES proposed in this study is used as an energy supply system to match the various load demands of the target building. Meanwhile, the optimization method described in this study is applied to configure the DES internal equipment. The hourly cooling, electrical, and thermal energy consumption of the building during the year is given in Figure 5a. Due to the alternation of winter and summer in the region, the cooling and thermal loads show obvious seasonal differences, while the electrical energy consumption is less affected by the climate and the load curve is relatively smooth throughout the year. Figure 5b gives the light and temperature parameters in the region, which mainly affect the PV output power in DES. The major equipment technical parameters in DES are listed in Table 4. Table 5 presents the cost per kW of the configured equipment and the energy purchase price. Affected by the policy, the electricity price was divided into two grades: 0.171 and 0.101 USD/kWh in the peak and trough phases. Table 6 shows the CO2, SO2 and NOx emission factors per unit of natural gas and purchased electricity.
Four algorithms, IZOA, ZOA, SCA, and GWO, are selected to optimize DES, and the optimization results of different algorithms are compared and discussed to test the practicality of the proposed IZOA on the DES configuration problem. The algorithm parameters are set as listed in Table 2, and the number of populations and iterations are set to 100. The decision variables for the optimal configuration of the DES include the PV, GT, ES, HS, and GB capacities, as well as the heating ratio kh and cooling ratio kc of GSHP. The changeable ranges of each variable are given in Table 7.

5.2. Optimization Results

Figure 6 depicts the changes in the objective function values over 100 iterations when the four algorithms optimize DES. The GWO and SCA sequentially fall into local optimum solutions when solving the DES configuration problem due to their search capability limitations, so the objective function values that eventually converge via the GWO and SCA are higher than the results obtained using the ZOA and IZOA. Since the IZOA introduces a chaotic mapping strategy in the initialization stage, its population has a better initial distribution and the objective function value is closer to the best value at the beginning of the iteration, although the final convergence of the two curves to the function value is approximately equal when comparing the IZOA and ZOA. The IZOA declines significantly faster and converges to the optimal value within the first 10 iterations, while the ZOA gradually finds the optimal solution only after 20 iterations, indicating that the convergence speed and global search ability of the IZOA are obviously better than the ZOA. Overall, the choice of optimization algorithm has an important impact on the solution results of the DES configuration problem, and the IZOA shows a better performance and results regarding this problem.
Table 8 indicates the objective function values and evaluation metrics values of the DES optimized using four different algorithms. The objective functions include the annual cost, fuel consumption, and CO2, SO2, and NOx emissions of the DES, corresponding to the evaluation metrics of ECSR, ESR, and PERR. In terms of economic performance, the DES optimized using GWO performs the worst with a cost of USD 228,368.68, corresponding to a negative ECSR, indicating that the DES economic performance in this case is inferior to the performance of the SP system. The DES optimized using the IZOA achieved the best economic efficiency with an ECSR index of 13.03%, which is an improvement of 13.04%, 0.17%, and 0.26% compared to the DES with the GWO, SCA, and ZOA algorithms. In terms of environmental performance, the configuration scheme obtained using IZOA optimization has the lowest pollution emission of 366,994.87 kg. Compared to the DES system optimized with the GWO, SCA, and ZOA algorithms, the DES system optimized with the IZOA improved by 17.57%, 4.72%, and 0.11% in terms of PERR. In addition, the IZOA can obtain a system configuration scheme with less energy consumption compared to the other three algorithms, and the DES system achieved an ESR of 60.71%. The optimal DES configuration scheme derived via IZOA solving is listed in Table 9.
Two typical days (winter day and summer day) are selected to analyze the DES electrical and thermal energy distribution over a 24 h period to demonstrate the operating state and energy balance process components under the specified configuration scheme. Figure 7 gives the DES electric balance diagram on a winter typical day. In the power supply and demand relationship, the output of generation equipment such as PV and GT depend on the electrical load of the building at the current moment and the power consumption of GSHP, Egshp. This study concludes that 7:00–9:00 and 19:00–22:00 are the peak electricity consumption hours for the selected hotel buildings from the fluctuating trend of Eload in the graph. Egshp is also at a higher level during the same time period, mainly because of the high heat demand during this time period, which makes GSHP heating require more electrical power consumption. However, the lack of light hours during the late sunrise and early sunset in winter causes the PV to supply power to the DES only from 8:00 to 17:00. Therefore, the power demand during the hours of 1:00–8:00 and 18:00–24:00 is almost entirely supplied by the GT. During the peak power consumption hours of 8:00 and 21:00, the GT reaches its power limit and needs to purchase some power from the utility grid to maintain the DES in a balanced state. During 10:00–16:00, it coincides with the high PV output power and the small Eload, so there is excess electrical power available for ES storage. As the ES gradually reaches its maximum storage capacity, most of the surplus power is sold to the external grid. During the 17:00–18:00 period, ES releases all the stored power.
The operating state of each device within DES on a typical winter day is shown in Figure 8. Most of the heat energy generated is provided to users via HE to fulfill the district heating demand Hload, and a small portion flows to AC to match the cooling load. GSHP produces heat steadily throughout the day, and the heat provided by it, Hgshp, has a similar trend to Hload over a 24 h period. Since DES works in FEL mode, the heat Hhr recovered by HR depends on the electricity generation of GT, Egt. During 10:00–18:00, Egt is 0, GT does not work, and GB becomes the major heat source inside DES. Furthermore, the larger heat load in winter makes DES produce little surplus heat after satisfying the demand of users, which limits the heat absorption and discharge power of the heat storage unit. The winter operation status reflected in Figure 8 demonstrates the DES system’s operation strategy to cope with the heating and cooling demand during the cold season, as well as the role and energy conversion of each device at different times of the year. This solution helps to guarantee users adequate comfort and energy utilization efficiency in winter.
The operation strategy of the energy system in winter obviously takes full account of the balance between electricity and heat to ensure that the system can operate effectively and remain stable during high-load periods. By rationally distributing the output of different generating equipment at different times of the day, the energy system is able to satisfy the building’s power demand and heat demand, while maximizing the efficiency of energy use. Photovoltaic power generation equipment comes into play during daytime hours, while GT plays a role during periods of low light. GSHP provides a stable heating capacity throughout the time period, synchronizing with the building’s heat load and allowing the system to flexibly cope with the switch between different energy sources. Through the ES’s energy storage function, the DE system is able to store excess power when there is sufficient PV generation and release it when needed, further improving energy utilization efficiency. The interaction with the external grid also gives the system more flexibility, enabling it to buy or sell power when needed and keeping the system running stably. Overall, the DES’s operational status on winter days demonstrates its strengths and capabilities in energy supply and balancing. Through the comprehensive utilization of different energy devices, the rational arrangement of operating hours and the use of energy storage, the DES provides users with a comfortable and efficient energy solution, and makes a positive contribution to the development of sustainable energy.
Figure 9 and Figure 10 demonstrate the DES supply and demand balance for electricity and heat energy on a typical day in summer. The electrical load curve in summer is similar to the winter load curve due to the low fluctuation of electricity consumption changes throughout the year. The difference is that the increase in sunshine hours and temperature in summer directly affects the PV and GT in DES power generation share, the PV working hours are extended from 8:00–17:00 to 6:00–19:00, and the electricity generation per hour is increased compared with a typical winter day. Correspondingly, GT generates less Egt in summer, mainly concentrated in the hours of 1:00–6:00 and 20:00–24:00. The thermal power distribution of each component differs significantly from a typical winter day. The hotel building requires very little thermal energy supplied during that season, so the DES heat power output for each time period is clearly less than that in winter. The AC provides less cooling, mainly because the DES is configured with a larger cooling ratio kc, although there is a large cooling demand from users in summer which allows most of the cooling load to be satisfied by the GSHP. Moreover, due to the FEL mode, the GT generates much more heat than the building demand on summer days. In order to use this energy wisely, HS keeps heat storage during 1:00–7:00 and 19:00–24:00 when the GT is operating, while releasing heat energy from 8:00 to 12:00 to reduce the use of GB. In summary, the DES achieves a balance of energy supply and demand during typical days in both winter and summer, with no energy shortage or wasteful conditions, verifying the rationality of the configuration scheme.
The DES demonstrated efficient operation and energy utilization during a typical day of energy supply and demand balancing in the summer. The high temperatures and prolonged sunlight in the summer directly impacted the performance of the PV generation and GT equipment in the system. The working hours of the PV were extended to 6 a.m. to 7 p.m., resulting in an increase in the hourly power generation compared to the winter season. At the same time, GT generation decreased during the summer months, mainly from 1 a.m. to 6 a.m. and 8 p.m. to 12 p.m. During the summer months, the heat demand of the hotel is relatively low, so the thermal power output of the DES at different times of the day decreases accordingly. The reduction in cooling provided using the air conditioning system is mainly due to the fact that the system is configured with a larger cooling ratio, allowing most of the cooling load to be met by the GSHP. In addition, due to the application of the FEL mode, the GT produces much more excess thermal energy than the building needs during the summer months. In order to efficiently utilize this extra energy, the thermal storage system stores thermal energy during the GT operation from 1 a.m. to 7 a.m. and from 7 p.m. to 12 a.m., and then releases the heat from 8 a.m. to 12 p.m., reducing the reliance on the boiler.
Overall, the DES was able to balance energy supply and demand on a typical operating day in both winter and summer, fully utilizing the performance of the various equipment to ensure the system operated efficiently and consistently, both to meet user demand and to ensure the efficient use of energy. These analyses and results verify the rationality of the system configuration scheme. The results reveal the characteristics of the system’s power and heat supply and demand in different seasons, which can help provide guidance for the design of similar projects, including the optimization of equipment configuration, operation strategy and energy management.

6. Concluding Remarks

A renewable energy DES coupling PV, GSHP and energy storage devices is proposed. The optimization model of system equipment capacity and GSHP supply ratio is constructed considering the emission of multiple pollutants as well as energy and economic costs. Then, an IZOA algorithm is proposed and used to optimize the DES configuration. The proposed method is verified in a DES of a hotel building, and the following conclusions can be drawn:
  • The IZOA algorithm incorporating the sine and cosine strategy, chaotic initialization, and dynamic adaptive weighting factors exhibits excellent convergence speed and superior global search capability on both single-peak and multi-peak test functions;
  • The DES minimum cost, fuel consumption, and pollutant emission in FEL mode are USD 198,568.92, 1,650,039.44 kWh, and 366,994.87 kg, which are 13.03%, 60.71%, and 69.90% lower compared with the conventional SP energy supply system;
  • The DES optimized using IZOA improves the ECSR by 13.31%, 0.17%, and 0.26%, the PERR by 17.57%, 4.72%, and 0.11%, and the ESR by 16.22%, 6.26%, and 0.12%, compared to the DES configured using the GWO, SCA, and ZOA algorithms. Additionally, the convergence speed of the IZOA is significantly better than that of other algorithms in solving the DES configuration optimization problem.
This study contributes to the improvement of the DES’s economic, environmental and energy saving performance with coupled solar and geothermal energy technologies to determine the DES’s optimal configuration. This study also has some limitations; the optimization models and algorithms used in the study are based on some simplified assumptions which may be at variance with the actual situation, thus affecting the accuracy and applicability of the results. The reliability of the research results is highly dependent on the quality and accuracy of the data used. If the data sources are not reliable enough or have errors, it may have an impact on the credibility of the conclusions. Therefore, in further studies in the future, attempts can be made to more realistically simulate the environment and conditions under which the system operates, to gradually relax the assumptions, and to conduct a more comprehensive empirical analysis of the model. At the same time, considerations of uncertainty, such as sensitivity analysis and risk assessment, can also be introduced to cope with the complexity of reality more effectively. There is also a need to explore the impact of uncertainties such as user demand, energy prices and solar radiation on DES planning and to analyze the application of DES in different building types.

Author Contributions

Conceptualization, Z.Q. and S.P.; methodology, S.P.; software, S.P.; validation, P.W.; formal analysis, Z.Q.; investigation, Z.Q.; resources, S.P.; data curation, S.P.; writing—original draft preparation, P.W.; writing—review and editing, P.W.; visualization, M.-L.T.; supervision, M.-L.T.; project administration, M.-L.T.; funding acquisition, Z.Q. All authors have read and agreed to the published version of the manuscript.

Funding

This study was supported by the following foundation programs: The China National Key R&D Program (Grant No. 2022YFB2603100). Guangxi Science and Technology Major Program (Grant No. AA23062054). The Basic Research Fund of Central Public-interest Scientific Research Institutes in China (Grant No. TKS20230301).

Data Availability Statement

The data used in the study are presented in visual form in graphs and tables with labeled references.

Conflicts of Interest

The authors declare no conflict of interest.

References

  1. Nadeem, T.B.; Siddiqui, M.; Khalid, M.; Asif, M. Distributed energy systems: A review of classification, technologies, applications, and policies. Energy Strategy Rev. 2023, 48, 101096. [Google Scholar] [CrossRef]
  2. Wu, Y.; Meng, D. Synchronizability-Based Distributed Learning Control for Multi-Agent Systems. IEEE Trans. Circuits Syst. Ii Express Briefs 2024, 71, 2109–2113. [Google Scholar] [CrossRef]
  3. Hong, T.; Zhang, Y.; Liu, J.; Zhao, D.; Xiong, J. Distributed Data-Driven Optimization for Voltage Regulation in Distribution Systems. IEEE Trans. Power Syst. 2024, 39, 1263–1273. [Google Scholar] [CrossRef]
  4. Ji, B.-X.; Liu, H.-H.; Cheng, P.; Ren, X.-Y.; Pi, H.-D.; Li, L.-L. Phased optimization of active distribution networks incorporating distributed photovoltaic storage system: A multi-objective coati optimization algorithm. J. Energy Storage 2024, 91, 112093. [Google Scholar] [CrossRef]
  5. Yin, L.; Tao, M. Balanced broad learning prediction model for carbon emissions of integrated energy systems considering distributed ground source heat pump heat storage systems and carbon capture & storage. Appl. Energy 2023, 329, 120269. [Google Scholar]
  6. Liu, C.; Yue, X.; Shi, K.; Sun, Z. Chapter 1—Introduction of basic knowledge. In Spacecraft Attitude Control; Liu, C., Yue, X., Shi, K., Sun, Z., Eds.; Elsevier: Amsterdam, The Netherlands, 2022; pp. 1–35. [Google Scholar]
  7. Liu, C.; Yue, X.; Zhang, J.; Shi, K. Active Disturbance Rejection Control for Delayed Electromagnetic Docking of Spacecraft in Elliptical Orbits. IEEE Trans. Aerosp. Electron. Syst. 2022, 58, 2257–2268. [Google Scholar] [CrossRef]
  8. Huang, C.; Yan, Y.; Madonski, R.; Zhang, Q.; Deng, H. Improving operation strategies for solar-based distributed energy systems: Matching system design with operation. Energy 2023, 276, 127610. [Google Scholar] [CrossRef]
  9. Wang, J.; Deng, H.; Qi, X. Cost-based site and capacity optimization of multi-energy storage system in the regional integrated energy networks. Energy 2022, 261, 125240. [Google Scholar] [CrossRef]
  10. Wang, Y.W.; Zhang, Y.; Liu, X.K.; Chen, X. Distributed Predefined-time Optimization and Control for Multi-bus DC Microgrid. IEEE Trans. Power Syst. 2024, 1–11. [Google Scholar] [CrossRef]
  11. Li, J.; Xiao, Y.; Lu, S. Optimal configuration of multi microgrid electric hydrogen hybrid energy storage capacity based on distributed robustness. J. Energy Storage 2024, 76, 109762. [Google Scholar] [CrossRef]
  12. Liu, J.; Rao, Z.; Liu, G.; Liao, S. Promotion of distributed energy system considering capacity allocation optimization and multi-stakeholder decision-making behaviors. J. Clean. Prod. 2024, 437, 140464. [Google Scholar] [CrossRef]
  13. Cao, Y.; Wang, Q.; Wang, Z.; Jermsittiparsert, K.; Shafiee, M. A new optimized configuration for capacity and operation improvement of CCHP system based on developed owl search algorithm. Energy Rep. 2020, 6, 315–324. [Google Scholar] [CrossRef]
  14. Taghikhani, M.A.; Khamseh, J. Multi-objective optimal energy management of storage system and distributed generations via water cycle algorithm concerning renewable resources uncertainties and pollution reduction. J. Energy Storage 2022, 52, 104756. [Google Scholar] [CrossRef]
  15. Deng, Y.; Liu, Y.; Zeng, R.; Wang, Q.; Li, Z.; Zhang, Y.; Liang, H. A novel operation strategy based on black hole algorithm to optimize combined cooling, heating, and power-ground source heat pump system. Energy 2021, 229, 120637. [Google Scholar] [CrossRef]
  16. Han, H.; Zhang, H.; Yang, J.; Yang, L. Distributed Containment Control Strategy for the Dynamic Stabilization of Integrated Energy System with Multiple Virtual Leaders. IEEE Trans. Ind. Inform. 2024, 20, 6642–6651. [Google Scholar] [CrossRef]
  17. Nazloo, H.T.; Babazadeh, R.; Varmazyar, M. Optimal Configuration and Planning of Distributed Energy Systems Considering Renewable Energy Resources. J. Environ. Inform. 2024, 43, 50–64. [Google Scholar]
  18. Yuan, Z.-P.; Li, P.; Li, Z.-L.; Xia, J. A Fully Distributed Privacy-Preserving Energy Management System for Networked Microgrid Cluster Based on Homomorphic Encryption. IEEE Trans. Smart Grid 2024, 15, 1735–1748. [Google Scholar] [CrossRef]
  19. Sadeghi, R.; Sadeghi, S.; Memari, A.; Rezaeinejad, S.; Hajian, A. A peer-to-peer trading model to enhance resilience: A blockchain-based smart grids with machine learning analysis towards sustainable development goals. J. Clean. Prod. 2024, 450, 141880. [Google Scholar] [CrossRef]
  20. Lee, C.-C.; Yan, J. Will artificial intelligence make energy cleaner? Evidence of nonlinearity. Appl. Energy 2024, 363, 123081. [Google Scholar] [CrossRef]
  21. Wang, J.; Han, Z.; Guan, Z. Hybrid solar-assisted combined cooling, heating, and power systems: A review. Renew. Sustain. Energy Rev. 2020, 133, 110256. [Google Scholar] [CrossRef]
  22. Liu, T.; Liu, Q.; Lei, J.; Sui, J. A new solar hybrid clean fuel-fired distributed energy system with solar thermochemical conversion. J. Clean. Prod. 2019, 213, 1011–1023. [Google Scholar] [CrossRef]
  23. Zhang, D.; Zhang, R.; Zhang, B.; Zheng, Y.; An, Z. Environment dominated evaluation modeling and collocation optimization of a distributed energy system based on solar and biomass energy. Renew. Energy 2023, 202, 1226–1240. [Google Scholar] [CrossRef]
  24. Xue, K.; Wang, J.; Hu, G.; Wang, S.; Zhao, Q.; Chong, D.; Yan, J. Optimal planning for distributed energy systems with carbon capture: Towards clean, economic, independent prosumers. J. Clean. Prod. 2023, 414, 137776. [Google Scholar] [CrossRef]
  25. Deng, Y.; Liu, Y.; Zhang, Y.; Zeng, R.; Zheng, Z.; Yao, Y.; Wu, L.; Gong, Z.; Liu, S. Optimization and performance analysis of CCHP-GSHP-SE system under different start factors. Energy Convers. Manag. 2022, 266, 115827. [Google Scholar] [CrossRef]
  26. Ashrafi, N.; Ahmadi, R.; Zahedi, A. Technical, economical, and environmental scenario based modeling of the building equipped with ground source heat pump (GSHP) and solar system. Energy Build. 2023, 289, 113048. [Google Scholar] [CrossRef]
  27. Lasemi, M.A.; Arabkoohsar, A.; Hajizadeh, A.; Mohammadi-ivatloo, B. A comprehensive review on optimization challenges of smart energy hubs under uncertainty factors. Renew. Sustain. Energy Rev. 2022, 160, 112320. [Google Scholar] [CrossRef]
  28. Ma, H.; Sun, Q.; Chen, Q.; Zhao, T.; He, K. Exergy-based flexibility cost indicator and spatio-temporal coordination principle of distributed multi-energy systems. Energy 2023, 267, 126572. [Google Scholar] [CrossRef]
  29. Ge, Y.; Han, J.; Ma, Q.; Feng, J. Optimal configuration and operation analysis of solar-assisted natural gas distributed energy system with energy storage. Energy 2022, 246, 123429. [Google Scholar] [CrossRef]
  30. Li, C.; Wang, L.; Zhang, Y.; Yu, H.; Wang, Z.; Li, L.; Wang, N.; Yang, Z.; Maréchal, F.; Yang, Y. A multi-objective planning method for multi-energy complementary distributed energy system: Tackling thermal integration and process synergy. J. Clean. Prod. 2023, 390, 135905. [Google Scholar] [CrossRef]
  31. Fan, W.; Fan, Y.; Yao, X.; Yi, B.; Jiang, D.; Wu, L. Distributed transaction optimization model of multi-integrated energy systems based on nash negotiation. Renew. Energy 2024, 225, 120196. [Google Scholar] [CrossRef]
  32. Su, Y.; Wu, S.; Wang, Z.; Bao, Z.; Liu, F. Hierarchically Distributed Energy Management in Distribution Systems: An Error-Tolerant and Asynchronous Approach. IEEE Trans. Smart Grid 2024, 15, 2909–2920. [Google Scholar] [CrossRef]
  33. Babaei, M.A.; Hasanzadeh, S.; Karimi, H. Cooperative energy scheduling of interconnected microgrid system considering renewable energy resources and electric vehicles. Electr. Power Syst. Res. 2024, 229, 110167. [Google Scholar] [CrossRef]
  34. Xu, X.F.; Wang, K.; Ma, W.H.; Huang, X.R.; Ma, Z.X.; Li, Z.H. Multi-objective particle swarm optimization algorithm based on multi-strategy improvement for hybrid energy storage optimization configuration. Renew. Energy 2024, 223, 120086. [Google Scholar] [CrossRef]
  35. Toopshekan, A.; Ahmadi, E.; Abedian, A.; Rad, M.A.V. Techno-economic analysis, optimization, and dispatch strategy development for renewable energy systems equipped with Internet of Things technology. Energy 2024, 296, 131176. [Google Scholar] [CrossRef]
  36. Moser, A.; Muschick, D.; Gölles, M.; Nageler, P.; Schranzhofer, H.; Mach, T.; Ribas Tugores, C.; Leusbrock, I.; Stark, S.; Lackner, F.; et al. A MILP-based modular energy management system for urban multi-energy systems: Performance and sensitivity analysis. Appl. Energy 2020, 261, 114342. [Google Scholar] [CrossRef]
  37. Huang, D.; Zhou, D.; Jia, X.; Yan, S.; Li, T.; Huang, D.; Zhang, C. A mixed integer optimization method with double penalties for the complete consumption of renewable energy in distributed energy systems. Sustain. Energy Technol. Assess. 2022, 52, 102061. [Google Scholar] [CrossRef]
  38. Tian, Z.; Li, X.; Niu, J.; Zhou, R.; Li, F. Enhancing operation flexibility of distributed energy systems: A flexible multi-objective optimization planning method considering long-term and temporary objectives. Energy 2024, 288, 129612. [Google Scholar] [CrossRef]
  39. Hou, H.; Xu, T.; Wu, X.; Wang, H.; Tang, A.; Chen, Y. Optimal capacity configuration of the wind-photovoltaic-storage hybrid power system based on gravity energy storage system. Appl. Energy 2020, 271, 115052. [Google Scholar] [CrossRef]
  40. Huang, P.; Sun, Y.; Lovati, M.; Zhang, X. Solar-photovoltaic-power-sharing-based design optimization of distributed energy storage systems for performance improvements. Energy 2021, 222, 119931. [Google Scholar] [CrossRef]
  41. Gao, M.; Han, Z.; Zhang, C.; Li, P.; Wu, D.; Li, P. Optimal configuration for regional integrated energy systems with multi-element hybrid energy storage. Energy 2023, 277, 127672. [Google Scholar] [CrossRef]
  42. Li, B.; Hu, P.; Zhu, N.; Lei, F.; Xing, L. Performance analysis and optimization of a CCHP-GSHP coupling system based on quantum genetic algorithm. Sustain. Cities Soc. 2019, 46, 101408. [Google Scholar] [CrossRef]
  43. Dai, Y.; Zeng, Y. Optimization of CCHP integrated with multiple load, replenished energy, and hybrid storage in different operation modes. Energy 2022, 260, 125129. [Google Scholar] [CrossRef]
  44. Song, Z.; Liu, T.; Lin, Q. Multi-objective optimization of a solar hybrid CCHP system based on different operation modes. Energy 2020, 206, 118125. [Google Scholar] [CrossRef]
  45. Hou, H.; Wu, J.; Ding, Z.; Yang, B.; Hu, E. Performance analysis of a solar-assisted combined cooling, heating and power system with an improved operation strategy. Energy 2021, 227, 120516. [Google Scholar] [CrossRef]
  46. Wang, J.; Ren, X.; Zhang, S.; Xue, K.; Wang, S.; Dai, H.; Chong, D.; Han, X. Co-optimization of configuration and operation for distributed multi-energy system considering different optimization objectives and operation strategies. Appl. Therm. Eng. 2023, 230, 120655. [Google Scholar] [CrossRef]
  47. Liang, J.F.; Fan, H.; Cheng, L.; Rong, S.Y.; Li, T.C.; Yu, T.K.; Wang, L.B. Control strategy for improving the frequency response characteristics of photovoltaic and energy storage systems based on VSG control. Energy Rep. 2024, 11, 2295–2305. [Google Scholar] [CrossRef]
  48. Zhang, Z.-L.; Zhang, H.-J.; Xie, B.; Zhang, X.-T. Energy scheduling optimization of the integrated energy system with ground source heat pumps. J. Clean. Prod. 2022, 365, 132758. [Google Scholar] [CrossRef]
  49. Trojovska, E.; Dehghani, M.; Trojovsky, P. Zebra Optimization Algorithm: A New Bio-Inspired Optimization Algorithm for Solving Optimization Algorithm. IEEE Access 2022, 10, 49445–49473. [Google Scholar] [CrossRef]
  50. Wei, F.T.; Zhang, Y.Y.; Li, J.Y. Multi-strategy-based adaptive sine cosine algorithm for engineering optimization problems. Expert Syst. Appl. 2024, 248, 123444. [Google Scholar] [CrossRef]
  51. Lian, Z.C.; Shu, J.G.; Zhang, Y.; Sun, J. Convergent Grey Wolf Optimizer Metaheuristics for Scheduling Crowdsourcing Applications in Mobile Edge Computing. IEEE Internet Things J. 2024, 11, 1866–1879. [Google Scholar] [CrossRef]
  52. Zhou, C.W.; Liu, G.; Liao, S.M. Probing dominant flow paths in enhanced geothermal systems with a genetic algorithm inversion model. Appl. Energy 2024, 360, 122841. [Google Scholar] [CrossRef]
  53. Zhang, Z.P.; Fu, Y.P.; Gao, K.Z.; Zhang, H.; Wang, L. A cooperative evolutionary algorithm with simulated annealing for integrated scheduling of distributed flexible job shops and distribution. Swarm Evol. Comput. 2024, 85, 101467. [Google Scholar] [CrossRef]
  54. Li, L.L.; Ji, B.X.; Lim, M.K.; Tseng, M.L. Active distribution network operational optimization problem: A multi-objective tuna swarm optimization model. Appl. Soft Comput. 2024, 150, 111087. [Google Scholar] [CrossRef]
  55. Ren, F.; Lin, X.; Wei, Z.; Zhai, X.; Yang, J. A novel planning method for design and dispatch of hybrid energy systems. Appl. Energy 2022, 321, 119335. [Google Scholar] [CrossRef]
  56. Li, L.-L.; Ren, X.-Y.; Tseng, M.-L.; Wu, D.-S.; Lim, M.K. Performance evaluation of solar hybrid combined cooling, heating and power systems: A multi-objective arithmetic optimization algorithm. Energy Convers. Manag. 2022, 258, 115541. [Google Scholar] [CrossRef]
Figure 1. Structural diagram of the DES.
Sustainability 16 05016 g001
Figure 2. Structural diagram of the SP system.
Sustainability 16 05016 g002
Figure 3. IZOA flow chart.
Sustainability 16 05016 g003
Figure 4. Convergence curves of test functions.
Sustainability 16 05016 g004
Figure 5. Regional load demand and environmental parameters.
Sustainability 16 05016 g005
Figure 6. Convergence curves for four algorithms.
Sustainability 16 05016 g006
Figure 7. DES electricity balance diagram on a typical winter day.
Sustainability 16 05016 g007
Figure 8. DES heat balance diagram on a typical winter day.
Sustainability 16 05016 g008
Figure 9. DES electricity balance diagram on a typical summer day.
Sustainability 16 05016 g009
Figure 10. DES heat balance diagram on a typical summer day.
Sustainability 16 05016 g010
Table 1. Test functions.
FunctionRangeDimFmin
F 1 ( x ) = i = 1 n x i 2 [−100, 100]300
F 2 ( x ) = i = 1 n x i + i = 1 n x i [−10, 10]300
F 3 ( x ) = i = 1 n x i sin ( x i ) [−500, 500]30−418.9829 × 30
F 4 ( x ) = i = 1 11 a i x 1 ( b i 2 + b 1 x 2 ) b i 2 + b 1 x 3 + x 4 2 [−5, 5]40
Table 2. Parameter settings.
AlgorithmsParameters
SCAα = 2, N = 30
GWOa = 2 t × (2/Tmax), N = 30
GAN = 30
SAN = 30
ZOAR = 0.1, N = 30
IZOAR = 0.1, β = 0.4, k = 1.5, N = 30
Table 3. Algorithm performance test results.
FunctionAlgorithmAvgStdBestWorst
F1SCA3.30 × 10−21.29 × 10−12.69 × 10−75.81 × 10⁻¹
GWO5.15 × 10−599.34 × 10−592.26 × 10−613.44 × 10−58
GA1.68 × 10−28.41 × 10−31.01 × 10−22.98 × 10⁻²
SA3.05 × 1034.97 × 1031.02 × 1022.73 × 104
ZOA0.00 × 1000.00 × 1000.00 × 1000.00 × 100
IZOA0.00 × 1000.00 × 1000.00 × 1000.00 × 100
F2SCA5.74 × 10−51.97 × 10−48.61 × 10−88.84 × 10⁻⁴
GWO1.11 × 10−341.28 × 10−347.47 × 10−364.44 × 10⁻³⁴
GA4.97 × 10−21.05 × 10−29.67 × 10−36.83 × 10⁻²
SA8.94 × 1012.41 × 1013.34 × 1011.03 × 102
ZOA3.63 × 10−2650.00E + 005.02 × 10−2733.68 × 10−264
IZOA0.00 × 1000.00 × 1000.00 × 1000.00 × 100
F3SCA−3.87 × 1033.09 × 102−4.55 × 10³−3.31 × 10³
GWO−5.98 × 1038.09 × 102−7.56 × 10³−4.11 × 10³
GA−1.13 × 1043.09 × 102−1.15 × 10⁴−1.11 × 10⁴
SA−7.20 × 1036.38 × 102−7.99 × 10³−7.10 × 10³
ZOA−6.84 × 1037.05 × 102−8.07 × 10³−5.43 × 10³
IZOA−1.14 × 1041.91 × 103−1.26 × 10⁴−7.63 × 10³
F4SCA1.12 × 10−33.31 × 10−45.61 × 10−41.51 × 10⁻³
GA1.72 × 10−34.39 × 10−31.32 × 10−32.13 × 10⁻³
SA1.51 × 10−22.20 × 10−21.09 × 10−21.77 × 10⁻²
GWO1.51 × 10−34.46 × 10−33.07 × 10−42.04 × 10⁻²
ZOA1.31 × 10−34.48 × 10−33.07 × 10−42.04 × 10⁻²
IZOA4.42 × 10−41.32 × 10−43.24 × 10−47.87 × 10⁻⁴
Table 4. Device parameters for DES [55].
EquipmentSymbolsValues
GT η g t 0.30
HR η r e 0.80
HE
GSHP
η h e 0.80
η h p c 4.00
η h p h 5.89
GB
AC
ES
η g b 0.80
η a c 0.70
σ e 0.04
η e s , i n ,   η e s , o u t 0.95
HS σ h 0.04
η h s , i n ,   η h s , o u t 0.8
Table 5. Cost and energy price of the DES [56].
ItemsRepresentativesValues
Unit investment price (USD/kW)GT1046
GB25
GSHP373
AC216
PV2039
HE22
ES487
HS32.8
Electricity price (USD/kWh)Peak period (6:00–22:00)0.171
Valley period (23:00–5:00)0.101
Natural gas price (USD/kWh)0.0464
Table 6. Pollutant emission parameters.
ItemsSymbolValue (g/kWh)
Utility gridγCO2,e968
γSO2,e3.12
γNOx,e2.35
γCO2,g200
Natural gasγSO2,g0.0009
γNOx,g0.619
Table 7. Variation range of decision variables.
ItemsSymbolValue
GT capacityNgt[0, 400]
PV capacityNpv[0, 400]
ES capacityNES[0, 1000]
HS capacityNHS[0, 1000]
GB capacityNGB[0, 1000]
Heating ratio of GSHPkh[0, 1]
Cooling ratio of GSHPkc[0, 1]
Table 8. Comparison of optimization results of each algorithm.
ItemsGWOSCAZOAIZOA
Economic cost (USD)228,368.68198,980.37199,174.45198,568.92
Pollutant emission (kg)581,200.92424,629.87368,350.14366,994.87
Fuel consumption (kWh)2,330,738.651,912,459.161,654,882.951,650,039.44
ECSR (%)−0.011612.8612.7713.03
PERR (%)52.3365.1869.7969.90
ESR (%)44.4954.4560.5960.71
Table 9. Optimal configuration scheme obtained using the IZOA algorithm.
ItemsGT/kWPV/kWES/kWHS/kWGB/kWkhkc
Value282.6400208793.7912.30.530.81
Disclaimer/Publisher’s Note: The statements, opinions and data contained in all publications are solely those of the individual author(s) and contributor(s) and not of MDPI and/or the editor(s). MDPI and/or the editor(s) disclaim responsibility for any injury to people or property resulting from any ideas, methods, instructions or products referred to in the content.

