Article

Research on the Spatial Differences and Network Structure of Economic Development in the Yangtze River Belt, China

School of Modern Post, Xi’an University of Posts and Telecommunications, Xi’an 710061, China
*
Author to whom correspondence should be addressed.
Sustainability 2024, 16(12), 5023; https://doi.org/10.3390/su16125023
Submission received: 23 April 2024 / Revised: 6 June 2024 / Accepted: 7 June 2024 / Published: 12 June 2024

Abstract

:
The Yangtze River economic belt is the main force leading the high-quality development of China’s economy, but its current internal economic differentiation issues require further study. In this study, to understand the development laws, change characteristics, evolutionary pattern, and main influencing factors on economic differences and economic network structure in the Yangtze River economic belt, 20 years of data from 1999 to 2018 at the general scale, three major regions, province, and city scales were analyzed. The results indicated that from 1999 to 2018, the total GDP of the Yangtze River economic belt steadily increased year by year, and the absolute difference in regional economy showed an expanding trend, while the relative difference was relatively stable. The total economic output and proportion of the three major regions all showed a trend of eastern region > central region > western region, but the growth rate and proportion trends were exactly the opposite. The GDP of 11 provinces and 110 cities showed positive global autocorrelation and obvious local spatial autocorrelation, but their radiative driving effect on surrounding areas was not strong, and the spatial agglomeration effect at the provincial level was better than that at the prefecture level or city level. The economic network structure was characterized by a single center structure dominated by the Shanghai and Jiangsu Province, gradually strengthening from west to east, and the gravity value growth rate in the western region was significantly higher than in the central and eastern regions. The city cluster in the middle reaches of the Yangtze River and the Chengdu–Chongqing served as the main bridges and links, playing a crucial role in the cascade radiation process of economic connections. The research results have strategic significance for coordinating the region development of the Yangtze River economic belt and promoting the rise of central China.

1. Introduction

Regional economic development is a comprehensive category, which mainly refers to the economic development status of a region, in various aspects, within a certain time range horizontally, and the potential and possibility of coordinated regional economic development vertically [1]. In the context of globalization, regional relations and economic order are rapidly changing and rebuilding. Attracting capital and promoting expenditure competition at regional, national, and international levels has a significant impact on long-term sustainable economic growth. The development pattern of economic space is influenced by three dimensions: national, regional, and global [2]. The basic elements of all three dimensions are cities. City is not only a fundamental element of the three dimensions, but also a focal point of the three dimensions; an important center of the three dimensions and an important element of the three dimensions, playing a crucial role [3]. Currently, China is experiencing rapid urbanization and a shift in value orientation. The 14th Five-Year Plan for National Urban Infrastructure Construction, released in 2022, points out that urban infrastructure is the material foundation for ensuring the normal operation and healthy development of cities, and an important support for achieving economic transformation. On the one hand, we need to promote the integrated development of infrastructure between urban agglomerations and metropolitan areas, and on the other hand, we need to promote the formation of a new pattern of coordinated development between regions and urban–rural areas [4]. How to construct a scientific and reasonable economic spatial development pattern, adapt to the needs of China’s new normal of economic development and its new urbanization strategy, is an urgent new problem that needs to be solved at the current stage.
The German economist Thünen is considered the initiator of research on regional economic development differences, as he was one of the pioneers in the 19th century [5]. After World War II, regional economic disparities widened globally, leading to a significant development of imbalanced growth ideas in the mid-20th century. The theories that make up this collection are mostly those of Gunnar Myrdal (cumulative causation theory) [6], Akamatsu (unbalanced growth theory) [7], Bunker (growth pole theory) [8], Friedmann (core–periphery theory) [9], Hatton (inverted “U” theory) [10], and others. The core of the theory of unbalanced development discusses the impossibility of balanced development from the perspective of resource scarcity. Its central principle is that an economy can only selectively develop specific regions and sectors, in order to achieve the ultimate comprehensive development of the region, in situations where the established resource endowment structure is different [11].
Scholars have conducted extensive empirical research on regional economic disparities. These studies mainly involve the measurement, temporal and spatial aspects, and impact mechanisms of regional economic development inequality. The measurement mainly focuses on the selection of different research methods, such as the orthogonal function [12], spatial variance function [13], Theil index [14], standard deviation [15], coefficient of variation [16], and so on, which are the primary emphasis of the measurement. The convergence of time [17] and the variety of spatial scales [18] are the primary focal points of the spatiotemporal features. The causes can be summed up as follows, in terms of influencing mechanisms: globalization [19], border effects [20], development strategies [21], and regional policies [22]. Scholars’ attention has gradually shifted to the economic network connecting cities, as a result of cities’ ongoing economic growth and the progressive strengthening of their economic linkages to one another. The term “economic network” describes an organic system of points, lines, and surfaces that are closely connected by factor flows and transportation corridors that connect cities of various sizes and spheres of influence [23]. The region serves as the carrier and economic activity serves as the basis. This system is also the fundamental element of the spatial linkage network. It is generally distinguished by the integration of theory with actual data, both qualitative and quantitative, and they specifically exhibit three clear patterns. From a single city or region to a multi-city and city cluster, the study object changes [24,25]. Research views have shifted from those of urban economic flow and tourism flow to those of industrial flow and information flow [26,27]. From the conventional gravitational model and gravity model to complex network and social network analysis, research techniques have changed over time [28,29].
As an extremely important development axis in the “T-shaped” strategy of land development and economics in China, the Yangtze River economic belt, accounting for 20% of the national land area, supports more than 40% of the country’s total economic output [30]. Scholars have conducted in-depth research using various technologies and perspectives based on theories related to regional economic development, combined with the specific situation of the development of the Yangtze River economic belt. Due to the Yangtze River economic belt spanning three key regions in eastern, central, and western China, there are extremely substantial regional economic disparities in terms of economic development. Scholars have studied the Yangtze River economic belt’s economic strength [31], total factor productivity [32], industrial energy efficiency [33], and other features. The research methodologies used in these studies included spatial autocorrelation [34], Theil’s index [35], and more. Deficits include having just one measuring indicator, having a short research time, and focusing the research region only on specific economic subgroups in relation to the Yangtze River economic belt. There is a long way to go before there is an integrated development pattern, with signs of fragmentation and unbalanced development being prominent. The Yangtze River economic belt has developed relatively quickly in recent years, and the comprehensive three-dimensional transportation corridor has gradually taken shape. However, there are obvious differences in the resource endowment and economic development status of the different regions within it. This offers potentially creative concepts and serves as a crucial point of reference and central concern for the research. Therefore, it is necessary to analyze the regional economic development differences and economic network characteristics of the Yangtze River economic belt in the past 20 years, based on the comprehensive research results, in order to provide valuable references for the future development and construction of the Yangtze River economic belt.
In general, the Yangtze River economic belt was used as the study area, and the main objectives of this study based on more recent data from 1999 to 2018 are as follows: (1) exploration of the economic differences at the overall scale of the Yangtze River economic belt; (2) analysis of the spatiotemporal trend and intensity of the three major regions at the eastern, central, and western regional scales; (3) determination of the evolutionary law and identification of the main economic networks structure at the province and city scales. The research results are expected to provide decision support for sustainable economic development in the Yangtze River economic belt.

2. Materials and Methods

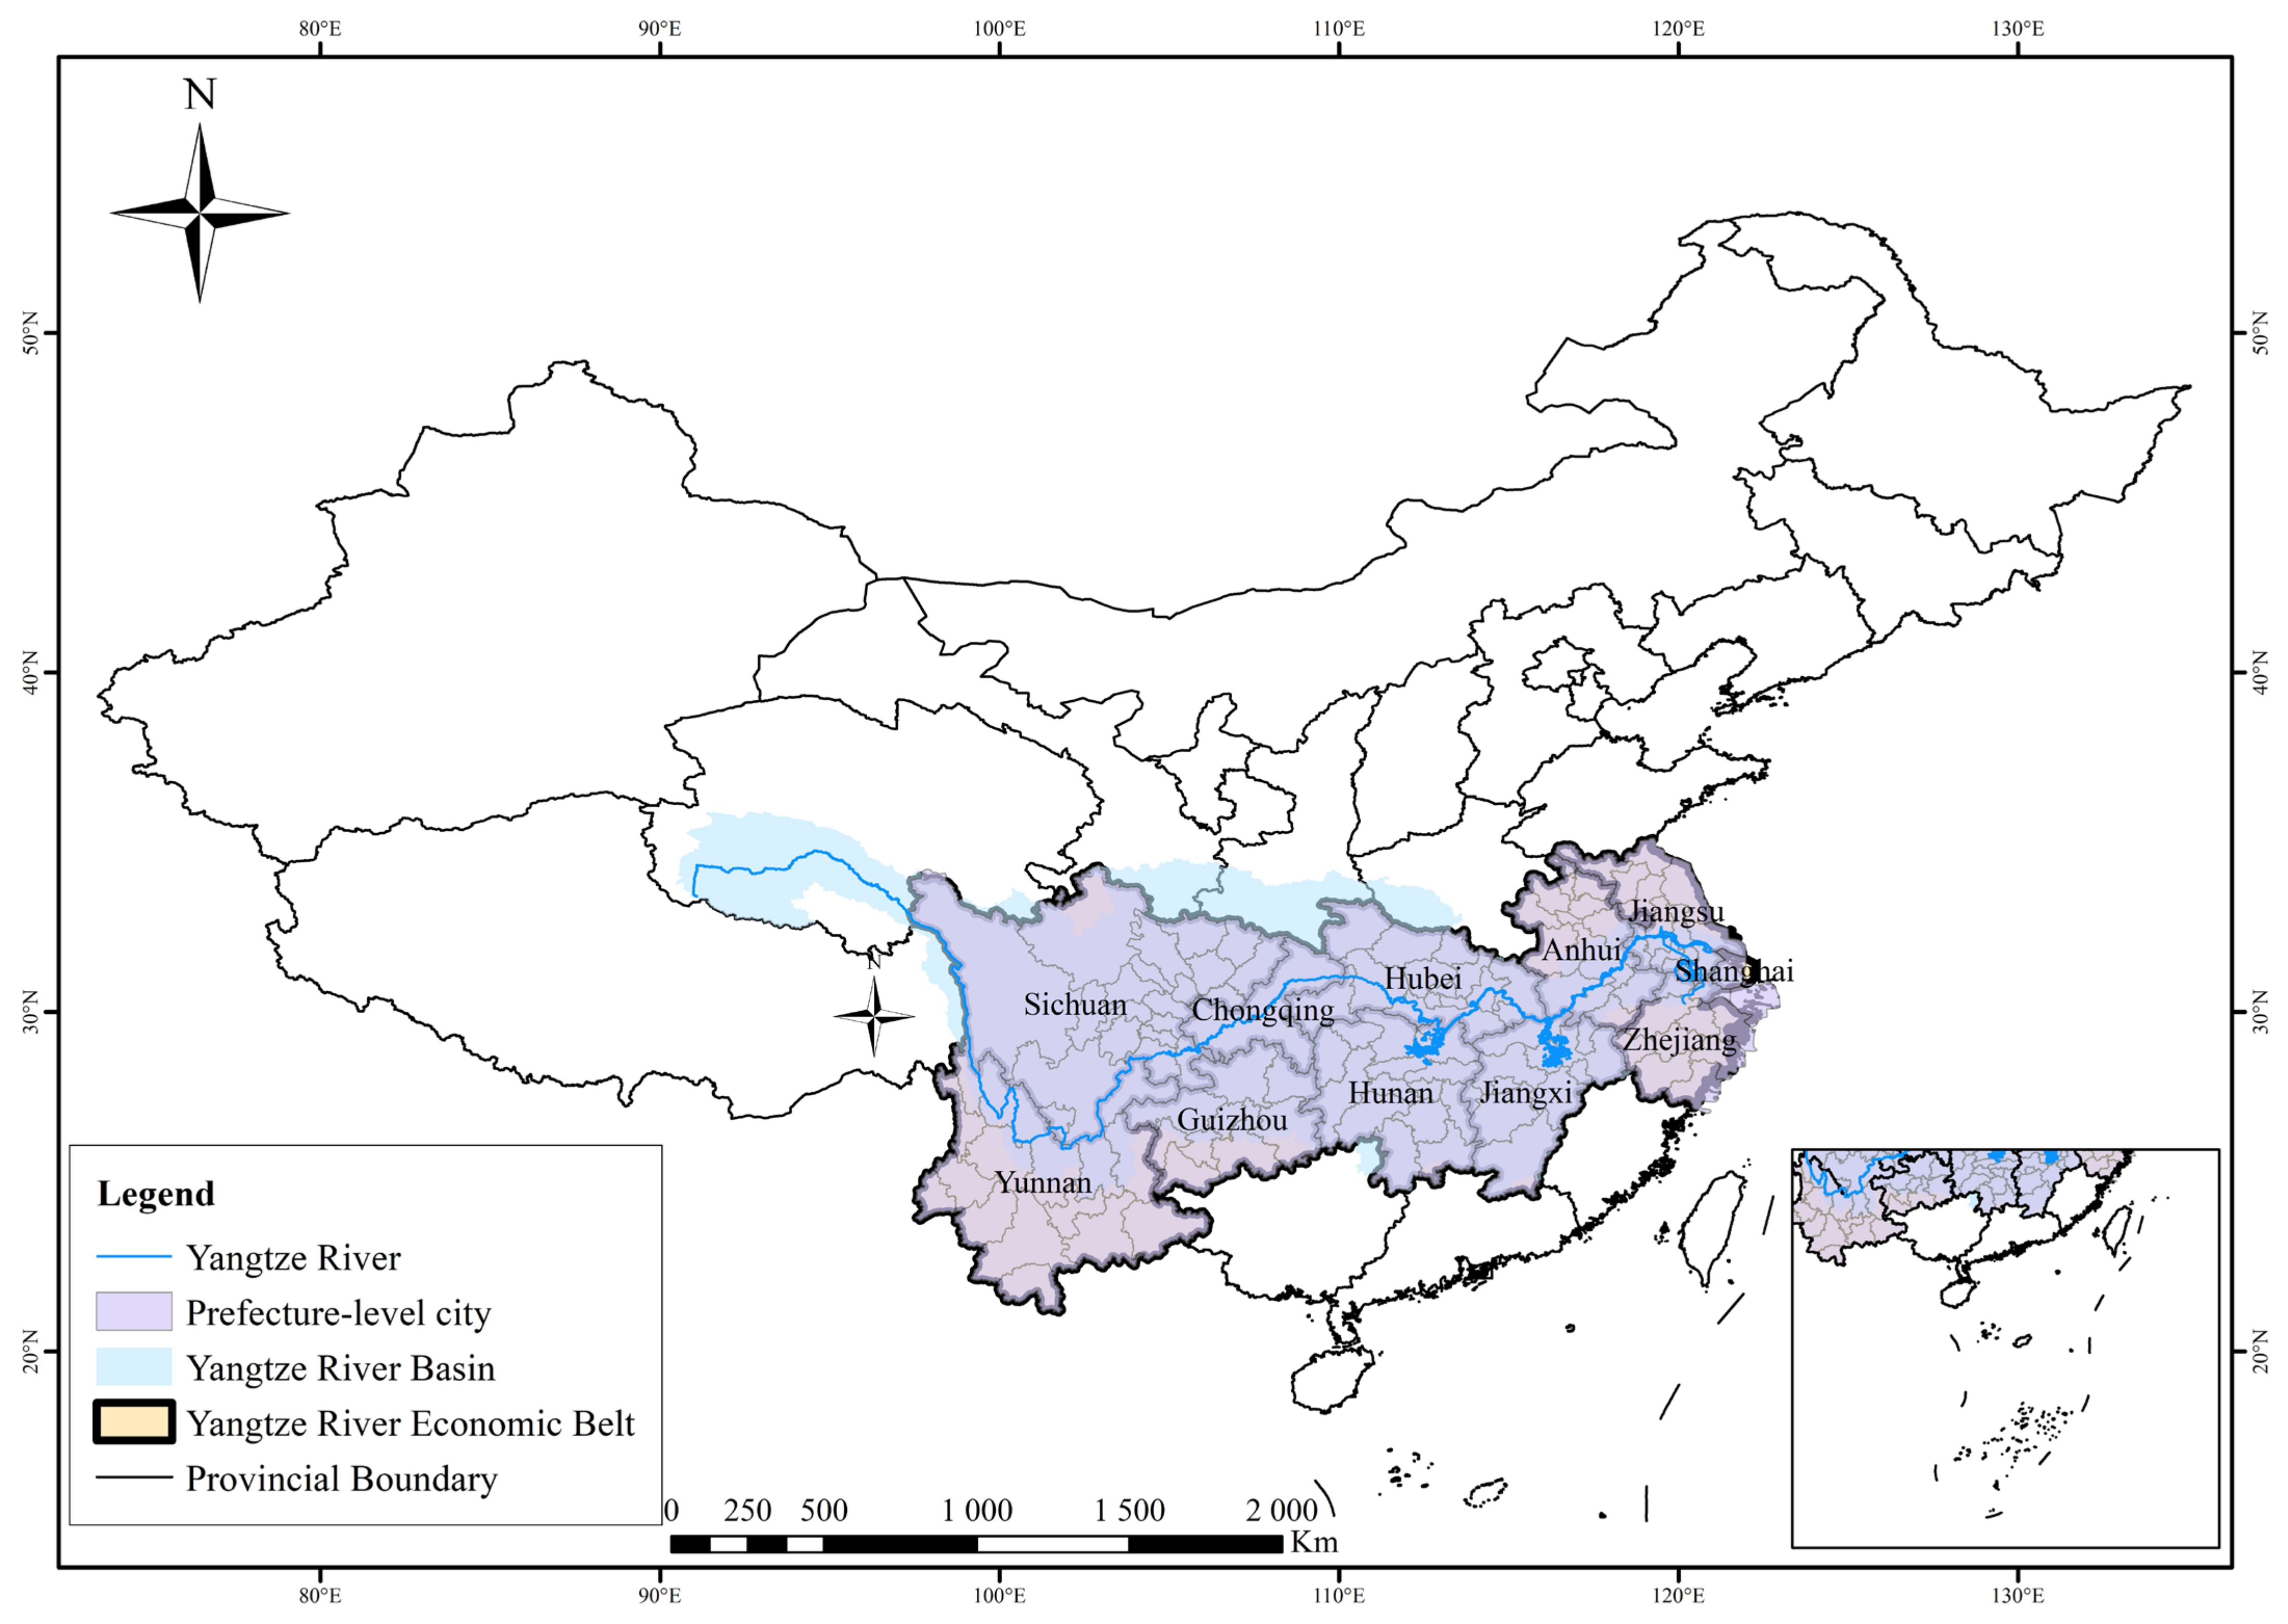
2.1. Study Area and Data Sources

With an area of 2.05 × 10⁶ km2 and complex topography, with elevations above 1000 m, the Yangtze River economic belt (97°21′–123°10′ E, 21°08′–35°20′ N) is divided into three regions (11 provinces), based on topography and natural conditions: the eastern region, which includes Shanghai, Zhejiang, and Jiangsu; the central region, which includes Anhui, Jiangxi, Hubei, and Hunan, and the western region, which includes Sichuan, Chongqing, Yunnan, and Guizhou [30]. In total, 126 cities may be found within the region. Due to the challenges associated with obtaining data, this study only included 110 cities in its analysis (Figure 1). In general, China has three main development strategies, one of which is the Yangtze River economic belt. Despite making up only 20% of China’s land area, it is home to more than 40% of the country’s population and supports more than 40% of the country’s economy [36]. A total of 11 provinces and 110 cities’ worth of 20-year GDP records, spanning from 1999 to 2018, were obtained for this study from the National Bureau of Statistics (http://www.stats.gov.cn/ accessed on 22 April 2024). The datasets are accessible and have undergone quality control processing, with fewer than 0.1% of the data missing.

2.2. Standard Deviation

One typical way to measure the overall change in absolute regional economic inequalities is to use the standard deviation [37]. In order to examine the relative differences in the Yangtze River economic belt, the coefficient of variation is employed in conjunction with the standard deviation, accounting for the effect of growing GDP on the standard deviation’s expansion. The formula is as follows:
s = i = 1 n ( x x ¯ ) 2 / n
where s is the regional standard deviation, x is the per capita GDP of the region, i is the GDP of the region, and n is the number of regions.
The coefficient of variation, which primarily reacts to the relative difference in the deviation of elements from the average, is traditionally defined as the ratio of the standard deviation to the average. The weighted coefficient of variation is used in the Yangtze River economic belt, as a measure that accounts for the impact of regional population size. The formula is as follows:
C v = 1 x ¯ i = 1 n ( x x ¯ ) 2 × p i p
where C v is the variation weighting coefficient, p is the total population of the study area, p i is the population of the i province.

2.3. Theil Index

This study uses the Theil index as an indicator of internal and external economic inequality in the Yangtze River economic belt. Its capacity to quantify the relative contributions of intra- and intergroup disparities to total inequalities is its greatest strength [14]. The formula is as follows:
T = T W + T B = i = 1 n y i l o g ( y i / p i ) + i = 1 n y q l o g ( y q j / p q j )
L q = T q / T
where T is the total Theil index, T W is the Theil index among urban agglomerations, T B is the Theil index within urban agglomerations, y i is the proportion of GDP of group i in the total region, p i is the proportion of population of group i in the total region, j is the number of cities in group q , y q is the proportion of GDP of group q in the total region, y q j is the proportion of GDP of city j in Group q urban agglomeration to Group q urban agglomeration, p q j is the proportion of GDP of city j in Group q urban agglomeration to Group q urban agglomeration, L q is the proportion of the Theil index of Group q urban agglomeration to the total Theil index, T q is the Theil index of urban agglomeration q , reflecting the contribution of urban agglomeration q to the total regional variation.

2.4. Spatial Autocorrelation

The degree of association between a certain geographic phenomenon or attribute value on one regional unit and the same phenomenon or attribute value on adjacent regional units is reflected by spatial autocorrelation. The Moran’s I model is used in this study to measure the spatial correlation properties in the Yangtze River economic belt. Both local and global spatial autocorrelation analyses are included in Moran’s I index [38]. The formula is as follows:
I = i = 1 n j = 1 n ( x i x ¯ ) ( x j x ¯ ) s 2 i = 1 n j = 1 n w i j
s 2 = i = 1 n ( x i x ¯ ) 2 n
where n is the number of irregular spatial units in the study area, x i and x j are the observed values for regions i and j , w i j is the spatial weight matrix. In this study, w i j is determined using the spatial adjacency criterion. When region j is adjacent to region i , w i j is 1, otherwise it is 0.
The local Moran’s I index is as follows:
I i = ( x i x ¯ ) 2 s 2 j = 1 , j i n w i j ( x i x ¯ ) = z i j = 1 , j i n w i j z j
where z i and z j are the standardized values for per capita GDP in regions i and j .

2.5. Modified Gravitation Model

The economic network mainly utilizes the gravity model and, from the perspective of the volume of urban economic links, urban quality mainly focuses on the level of urban economic development, and economic volume is the primary indicator of quality measurement [23]. The Yangtze River economic belt has the characteristics of non-equilibrium and complexity, this study adopts the accessibility to measure the distance of time cost between cities under the full consideration of the influence of the real transportation factors, and constructs the time cost matrix of cities. The modified gravity model is as follows:
F i j = E i E i + E j × E i 3 × E j 3 T i j 2
where F i j is the economic connection strength between City i and City j , E i and E j represent the economic quality of City i and City j , T i j is the time cost distance between City i and City j .

3. Results

3.1. The Yangtze River Economic Belt

Four scales—the Yangtze River economic belt as a whole, three major regions, 11 provinces, and 110 cities—are examined in this study’s analysis of the economic development of the region. With an average annual growth rate of 13.74%, the overall economic volume of the Yangtze River economic belt increased steadily from 1999 to 2018 (Table 1), surpassing 10 trillion yuan in 2007, 20 trillion yuan in 2011, 30 trillion yuan in 2015, and 40 trillion yuan in 2018. Prior to 2007, the country’s economy’s share fluctuated, growing then declining. After 2007, it experienced rapid growth, rising from a low of 42.08% in 2007 to 47.16% in 2018, a gain of 5.08% annually. The Yangtze River economic belt’s overall economic status is observed to be expanding gradually and sustainably. With roughly half of China’s land area, the Yangtze River economic belt is a significant support belt for the nation’s overall economic development and generates half of the nation’s total economic output, allowing it to fully utilize its distinct advantages and vast development potential in the area.
There is a noticeable rising trend in the regional standard deviation for the Yangtze River economic belt. It grew by 11.40 times, from 0.187 in 1999 to 2.129 in 2018, suggesting that the absolute regional inequalities are generally on the rise. With a maximum value of 0.663 in 2006 and a low value of 0.551 in 1999, the coefficient of variation exhibits growing and subsequently falling tendencies. However, the overall change is not very great, suggesting that the total regional GDP difference tends to stabilize. With a maximum value of 0.179 in 2006 and a minimum value of 0.121 in 2018, the Theil index has followed a trend of increase followed by decrease, albeit with overall narrowing. This suggests that the differences in the total GDP have been increasing and subsequently reducing.

3.2. Three Major Regions

The Shanghai, Zhejiang, and Jiangsu Provinces are generally classified as the eastern region; the Anhui, Jiangxi, Hubei, and Hunan Provinces as the central region, and thte Chongqing municipality, Sichuan, Guizhou, and Yunnan Provinces as the western region, according to the degree of economic development and geographic location of the provinces within the Yangtze River economic belt. This study uses four components to examine the total GDP, the total GDP share, the total GDP growth rate, and the GDP per capita, in order to more thoroughly assess the economic development of the three main regions (Figure 2).
The three main regions—the eastern, central, and western regions—saw annual increases in total GDP from 1999 to 2018, rising from 1.71 trillion, 1.21 trillion, and 0.81 trillion in 1999, to 18.15 trillion, 14.24 trillion, and 10.07 trillion in 2018, respectively. The three main regions, the eastern, central, and western regions, had changes in their GDP share from 1999 to 2018, going from 45.82%, 32.33%, and 21.84% in 1999, to 42.74%, 33.53%, and 23.72% in 2018, respectively. Two key characteristics define the development pattern of the total GDP share over the 20-year period, despite the fact that the total GDP shares of the three primary regions, the eastern, central, and western regions, varied greatly, with the eastern region leading the way and the western region trailing behind. The GDP share of the central and western regions of the group displayed an upward and then downward trend, reaching their highest points in 2018 and their lowest points in 2006, respectively. In contrast, the eastern region, and its central and western regions, showed an upward and then downward trend, reaching their highest point in 2006 and their lowest point in 2018. Overall, the GDP shares of the central and western regions of the Yangtze River economic belt are increasing while the eastern region’s share is declining, despite the fact that the total GDP continues to hold its leading position. This is due to the advancement of the national strategies for the development of the western part of the country in 2000 and the rise of central China in 2004.
The three main regions of the Yangtze River economic belt—the eastern, central, and western regions—distinguish themselves from one another clearly in terms of their GDP growth rates. Regarding the temporal trend, there is a variation in stage; prior to 2006, the GDP growth rate in the eastern region was greater than that of the central and western regions; following 2006, it was lower. On the other hand, there has been less of a difference in GDP growth rates between the central and western regions, and the development pattern has been more stable. The GDP growth rates of the eastern, central, and western regions—the three main regions of the Yangtze River economic belt—have generally followed a rising and then declining trend. The eastern region has progressively slowed down because of its larger base, while the central and western regions have recently experienced significant growth because of their weaker bases.
The three main regions of the Yangtze River economic belt—the eastern, central, and western regions—have been gradually improving year over year in terms of GDP per capita. There have been significant shifts in the absolute difference in the per capita GDP of the three main regions—the eastern, central, and western regions. Over time, the absolute differences in per capita GDP between the eastern and western region, as well as between the eastern and central region, have changed. Conversely, the western and central sections are closer together, but have undergone minimal alteration.
The average ranking of the Theil index over the 20-year period is western (0.106) > eastern (0.055) > central (0.007), with the western region having the largest internal GDP aggregate differences and the central region having the smallest internal GDP aggregate differences. This is based on the decomposition of the internal Theil index of the GDP aggregates of the three major regions (Table 2). In particular, the contribution rate and the Theil index for the eastern region both exhibit an overall upward trend (after 2000), pointing to a progressive rise in the aggregate GDP disparities within the region. The general higher trend in the Theil index and the contribution rate for the central region points to a progressive enlargement of the disparities in the region’s total GDP. The Theil index for the western region exhibits two phases: a continuous reduction from 1999 to 2000 and a further decline from 2001 to 2018, indicating a progressive decrease in internal GDP aggregate disparities, which has intensified in recent years. The difference in total GDP between the three main regions of the Yangtze River economic belt—the eastern, central, and western regions—has undergone a process of first increasing and then decreasing, according to the intergroup analysis of the Theil index and contribution ratio of total GDP, which both consistently exhibit the characteristic of first increasing and then decreasing.

3.3. 11 Provinces

This study only computes the standard deviation and coefficient of variation of nine provinces with respect to the cities of each province over the 20-year period (Table 3), because Shanghai and Chongqing lack the subsequent level of city units. The standard deviation indicates that the absolute disparities in the total GDP of the nine provinces exhibit a broadening tendency, with the total GDP of the provinces showing a consistent upward trend in relation to the cities. As can be observed, the absolute disparities in total GDP are always expressed as western region < central region < eastern region, indicating that in the Yangtze River economic belt, the absolute differences in total GDP progressively increase from west to east.
According to the coefficient of variation, there are three main trends that can be seen in the total GDP of the nine provinces in relation to cities; the Jiangsu, Hubei, and Guizhou provinces exhibit rising and then declining characteristics; the Zhejiang, Anhui, and Hunan provinces show an upward trend, and the Jiangxi, Sichuan, and Yunnan Provinces show a wave-like change of rising, then declining, and then rising. Observing the results of the extreme value ratio, we can assume that in the central region, relative to the eastern and western regions, the relative difference of the change is larger, while the changes in the eastern and western regions are essentially the same. As can be seen, the relative difference between the nine provinces over the 20 years is not very obvious, and each has its own trend.
The global autocorrelation, Moran’s I index, Z-value, and p-value of the Yangtze River economic belt’s total GDP were computed from 1999 to 2018 using the ArcGis 10.8 and GeoDa 1.20 software. p is less than 0.05, suggesting that the GDP totals of the Yangtze River economic belt region as a whole exhibit positive global autocorrelation. For the GDP totals of 11 provinces, the global autocorrelation Moran’s I indices are all positive throughout the 20-year period. The study interval can be specifically divided into two time periods; the first stage, which spans from 1999 to 2004, shows that the correlation is increasing because the global autocorrelation Moran’s I index is in the rising stage. The second stage, which spans from 2005 to 2018, shows that the correlation is increasing. The worldwide autocorrelation Moran’s I index is in the dropping stage in the second stage, which spans the years 2005–2018, suggesting that the correlation is currently weakening. The Z-value’s fluctuation and change features are entirely consistent with the I index, and all of them are greater than 1.96 before 2012. This suggests that prior to 2012, the 11 provinces’ GDP totals’ clustering characteristics were more pronounced.
By choosing the LISA clustering diagrams (local indicators of spatial association) for the years 1999, 2003, 2007, 2011, 2015, and 2018, then analyzing the local economic development of the regional economic development at the province scale, this study investigates the temporal and spatial perspectives (Figure 3), respectively, in the local autocorrelation analysis attributes of associations. The term “diffuse” refers to the situation when a high-value region is surrounded by other high-value regions—the diffuse region has a positive correlation with nearby regions that have fewer gaps and equivalent levels of development. Low–low (L–L) indicates that the low value region is encircled by the low value region, which is referred to as the “low growth type” region; there is also a positive link since the low growth type region and its surrounding regions have a lower degree of economic development and the gap is narrower. Low–high (L–H) maps show that a low-value area is encircled by a high-value area known as a “transitional” area. Transitional cities have a low degree of development, which causes them to be negatively correlated, but their surrounding areas have a higher level of development and a greater difference. The term “polarized” refers to the high-value area that is encircled by the low-value area; this area has a higher degree of economic development than its neighbors, who have a lower degree of development and a greater difference, indicating a negative correlation. The term “high–low” (H–L) describes this situation.
There are two distinct phases for GDP aggregates; the first stage occurred in 1999, 2003, and 2007, while the second stage occurred in 2011, 2015, and 2018. In stage 1, the agglomeration type with a positive connection is more stable. The high–high type includes Shanghai and Jiangsu Province, no low–low type exists, the only province with a low–high type is the Anhui Province (9.09%), and the only province with a high–low type is the Sichuan Province (9.09%). Stage 2 will not be repeated and has the same qualities as the spatial perspective. Overall, the total GDP of the 11 provinces in the Yangtze River economic belt from 1999 to 2018 shows some spatial correlation, and similar types of regions are spatially clustered and distributed. The Sichuan Province (high–low) and Anhui Province (low–high) are the more stable regions, suggesting that their economic radiation-driven effect on the neighboring regions is not very strong. In stage 2, Shanghai’s type changed from high–high to low–high, suggesting that the city has lately been developing more slowly than the neighboring provinces.
The economic network pattern between regions is characterized in this study using GDP aggregates and the modified gravity model. The effective connectivity lines are classified using the natural breakpoint method and are primarily visualized by choosing six representative years: 1999, 2003, 2007, 2011, 2015, and 2018 (Figure 4). The economic networks of the 11 provinces that make up the Yangtze River economic belt are complicated in terms of spatial characteristics, yet there is a clear trend and a seemingly monocentric network structure. It creates a non-equilibrium linking network that gradually becomes stronger from west to east. It also creates a core spatial structure, with the provinces of Zhejiang and Anhui acting as the second largest cities and Shanghai and Jiangsu as the primary cities.
The economic gravitational pull between the 11 provinces has been growing over time. With an extreme ratio of 112.38, the total average value climbed year over year from 60.96 in 1999 to 6850.67 in 2018. With the largest growth rate of 45.07% in 2004 and even the lowest rate of 14.67% in 2015, the gravitational force value has fluctuated in a wave-like manner, increasing and then falling. Despite the fact that the connecting line between the Shanghai and Jiangsu Provinces still dominates the overall core spatial structure, it is evident that there has been an increase in the connectivity among provinces, the gravitational value has shown exponential growth, and the growth rate of the gravitational value in the western region is significantly higher than that in the central and eastern regions.

3.4. 110 Cities

Examining the spatial relationships between economic disparities is the main goal of the examination of the evolution of these disparities in 110 cities. The worldwide autocorrelation for the GDP aggregates of the 110 cities, as well as the 11 provinces, and the GDP aggregates of the 110 cities in the Yangtze River economic belt exhibit positive global autocorrelation, as indicated by the positive Moran’s I index over the 20-year period. The study interval can be specifically divided into two time periods; the first stage, which spans from 1999 to 2006, shows that the correlation is increasing because the global autocorrelation Moran’s I index is in the rising stage. The second stage, which spans from 2007 to 2018, shows that the correlation is increasing. The worldwide autocorrelation of Moran’s I index is dropping in the second stage, which spans 2007 to 2018, suggesting that the correlation is currently weakening. The Z value’s fluctuation and change features during the 20-year period are all more than 1.96, which is entirely compatible with the I index. This suggests that the 110 cities’ GDP aggregate shows clear clustering characteristics.
Positive correlation agglomeration dominates the type of spatial correlation at the city scale, with the high–high type holding an entirely dominant position, as shown by the LISA agglomeration map of the 110 cities’ GDP totals (Figure 5). In terms of geography, the high–high type (diffusion type) is primarily found in the east, making up 14.55% of the total. With 5.45% of the total, the low–low type (poor growth type) is mostly found in the southwest. With a percentage of 2.73%, the low–high type (transitional type) is primarily found in the eastern area, close to high–high type. With a percentage of 2.73%, the high–low type (polarized type) is mostly found in the western provincial capitals. Compared to the total spatial perspective, there is less change in the time trend. The total GDP of the 110 cities in the Yangtze River economic belt from 1999 to 2018 showed some geographical correlation overall, with similar types clustered and distributed in a more stable and spatially consistent manner. This suggests that the majority of highly developed cities are located in western province capitals and eastern coastal areas, yet none of them significantly affect the economies of nearby cities.
Regarding the spatial characteristics of the economic network pattern of the 110 cities (Figure 6), the average gravitational force between all nodes in the economic linkage network is 42.99, and 1108 edges (or 8.75% of the total) are above the average value. A total of 12,328 of them are less than 200.55, making up 97.41% of the total; 244 are between 200.56 and 941.70, making up 1.93%; 62 are between 941.71 and 2591.95, making up 0.49%; 12 are between 2591.96 and 5838.13, making up 0.095%; and the remaining 12 are greater than 5838.14, making up 0.08%, are present. The 110 cities’ gravitational values vary by an order of magnitude, with Shanghai, Suzhou, and Wuxi having the greatest gravitational connections, compared to other locations. Despite the complexity of the economic network connecting the 110 cities in the Yangtze River economic belt, polycentricity still seems to be a defining feature of the network structure. In general, a spatial structure has been developed, with the major core being the Chengdu–Chongqing city cluster, the Yangtze River Delta city cluster, and the city cluster in the middle reaches of the Yangtze River. The network structure is then progressively strengthened from west to east. The strength of the economic ties amongst the 110 cities in the Yangtze River economic belt is largely determined by their spatial distance from one another; the ties within the Yangtze River Delta city cluster in the east are more tightly knit than those in the country’s central and western regions, and the ties between the eastern and central regions are stronger than those between the two regions.
The economic gravitational attraction between the 110 cities has been growing over time. From 1.77 in 1999 to 237.17 in 2018, the overall average value climbed year over year, while the extreme value ratio reached 133.99. The gravitational force value’s growth rate has varied in a wave-like manner, increasing and then falling. It is currently lower in 2018 (18.24%) than it was in 1999 (22.04%). The core spatial structure of the Yangtze River economic belt as a whole has gradually changed over the past 20 years, with closer economic ties within the Yangtze River Delta city clusters, the city clusters in the middle reaches of the Yangtze River, and the Chengdu–Chongqing city clusters, as well as gradually strengthened ties between the city clusters. Overall, the growth rate of the gravitational value of the three regions is the western region > central region > eastern region. It can be stated that the eastern region’s radiation power, which is moving from agglomeration to diffusion, is progressively reaching the central and western regions. Meanwhile, the Chengdu–Chongqing city cluster and the city clusters in the middle reaches of the Yangtze River serve as the primary links and bridges, and they are essential to the process of the economic links’ graded radiation.

4. Discussion

4.1. Research Perspective

Many academics have conducted extensive research in recent years, using a range of techniques and viewpoints, drawing on pertinent theories of regional economic growth, as well as the unique circumstances surrounding the development of the Yangtze River economic belt. The Yangtze River economic belt, which spans the three main regions of eastern, central, and western China, is distinguished by notable regional economic disparities in terms of economic development. Scholars have studied the Yangtze River economic belt’s economic strength [31], total factor productivity [32], and industrial energy efficiency [33], etc. Using techniques like spatial autocorrelation [35], Theil’s index [34], and others, scholars have examined the spatial organization, traits, and development of the urban economic network [39].
Looking through the body of literature, it is clear that the study of differences in economic development and urban economic networks has developed into a well-established field of study, both domestically and internationally. Scholars have made significant contributions to the theoretical underpinnings and research methodologies of the field, but they tend to focus on qualitative research and analyze social structures and policies. Deficits include a single measuring index, a brief study term, and a research area that is limited to specific economic groupings, specifically for the Yangtze River economic Belt. There is a long way to go before there is an integrated development pattern, with signs of fragmentation and unbalanced development prominent. The Yangtze River economic Belt has been developing quickly in recent years, and the comprehensive three-dimensional transportation corridor is gradually taking shape. However, there are noticeable differences in resource endowment and economic development among different regions within the belt. This offers potentially creative concepts and serves as a crucial point of reference and a central concern for the research.

4.2. Scale Characteristics

Finding the best places to assign controls and maintain them in the future is crucial. Research has indicated that small spatial scale data pieces are useful for improving the accuracy of major source identification [30]. This study discovered that the use of city-scale data in this study can more successfully identify major economic districts when compared to provincial-scale data.
The 11 provinces’ economic network structures are characterized by a monocentric structure that is progressively stronger from west to east, with the provinces of Shanghai and Jiangsu dominating it. The 11 provinces are more closely connected to one another, the gravitational value is growing exponentially, and the growth rate of gravitational value in the western region is much higher than in the central and eastern regions. However, the core spatial structure is not changing temporally. The network structure of 110 cities is polycentric in nature, with the Chengdu–Chongqing city cluster, the Yangtze River Delta city cluster, and the city cluster in the middle of the Yangtze River forming the main core. The network structure is strengthened progressively from west to east. The economic ties within the Yangtze River Delta city cluster, the Chengdu–Chongqing city cluster, the city cluster in the middle reaches of the Yangtze River, and the links between the city clusters have all gotten stronger over time. The economic gravity between the 110 cities has been rising over time, with the growth rate size of the western region > central region > eastern region. The Chengdu–Chongqing city cluster and the city cluster in the middle reaches of the Yangtze River act as the main bridges and links, playing a crucial role in transferring the graded radiation process of the economic links. The radiation power of the eastern region is gradually spreading from agglomeration to diffusion to the central region and the western region.
This is consistent with Zhao, who reported that the administrative area has been reduced at the city scale [30]. Generally, research conducted at the city scale is more effective in identifying and optimizing the control area compared to the provincial scale.

4.3. Future Development

There is an increasing degree of economic cohesion among the city clusters of Chengdu–Chongqing, the Yangtze River Delta city cluster, and the middle reaches of the Yangtze River city cluster. Distinct cities should choose distinct growth pathways in order to better propel the Yangtze River Economic Belt’s coordinated economic development. Cities should maximize their comparative advantages, lower factor costs, increase industrial competitiveness, and efficiently support both quick and sustainable economic growth. They should also adjust to their unique endowment structures. Simultaneously, the growth of industrial clusters can both positively stimulate their own economic development by giving them a competitive edge and serve as a platform and carrier for other cities looking to incorporate into their own economic development [40].
Building stronger industrial and economic ties with their peers and superiors, as well as actively assimilating into their industrial clusters to share the benefits of their shared industrial and economic development, are crucial steps that various cities can take to advance their own economic development. Higher-level cities have a greater positive spill-over impact on their own economic development than peer cities do in the synergistic network of economic development with other types of cities [41].
Furthermore, regardless of the type of economic activity a city engages in, it should actively create or take the initiative to join the synergistic industrial networks and clusters of regional urban economic development. This will help to foster the integration and natural extension of comparative advantages, with the endowment structure serving as a logical starting point, and competitive advantages, with the development of industrial clusters acting as a carrier. Finally, economic synergy will help to realize sustainable and stable development by creating a positive feedback loop [42].

5. Conclusions

Four scales are used in this study to quantitatively assess the regional socioeconomics; the Yangtze River Economic Belt as a whole, three major regions, 11 provinces, and 110 cities. This study examines two aspects, the economic differences and the structure of the economic network. It overcomes the short time scale and the perspective of largely economic subgroups of previous studies and focuses on problems like fragmentation and disequilibrium. The following are the primary conclusions:
(1)
From 1999 to 2018, the Yangtze River economic belt’s overall GDP exhibited a consistent annual growth trend. While the relative gaps are more stable, the absolute regional economic differences typically show a trend toward growing;
(2)
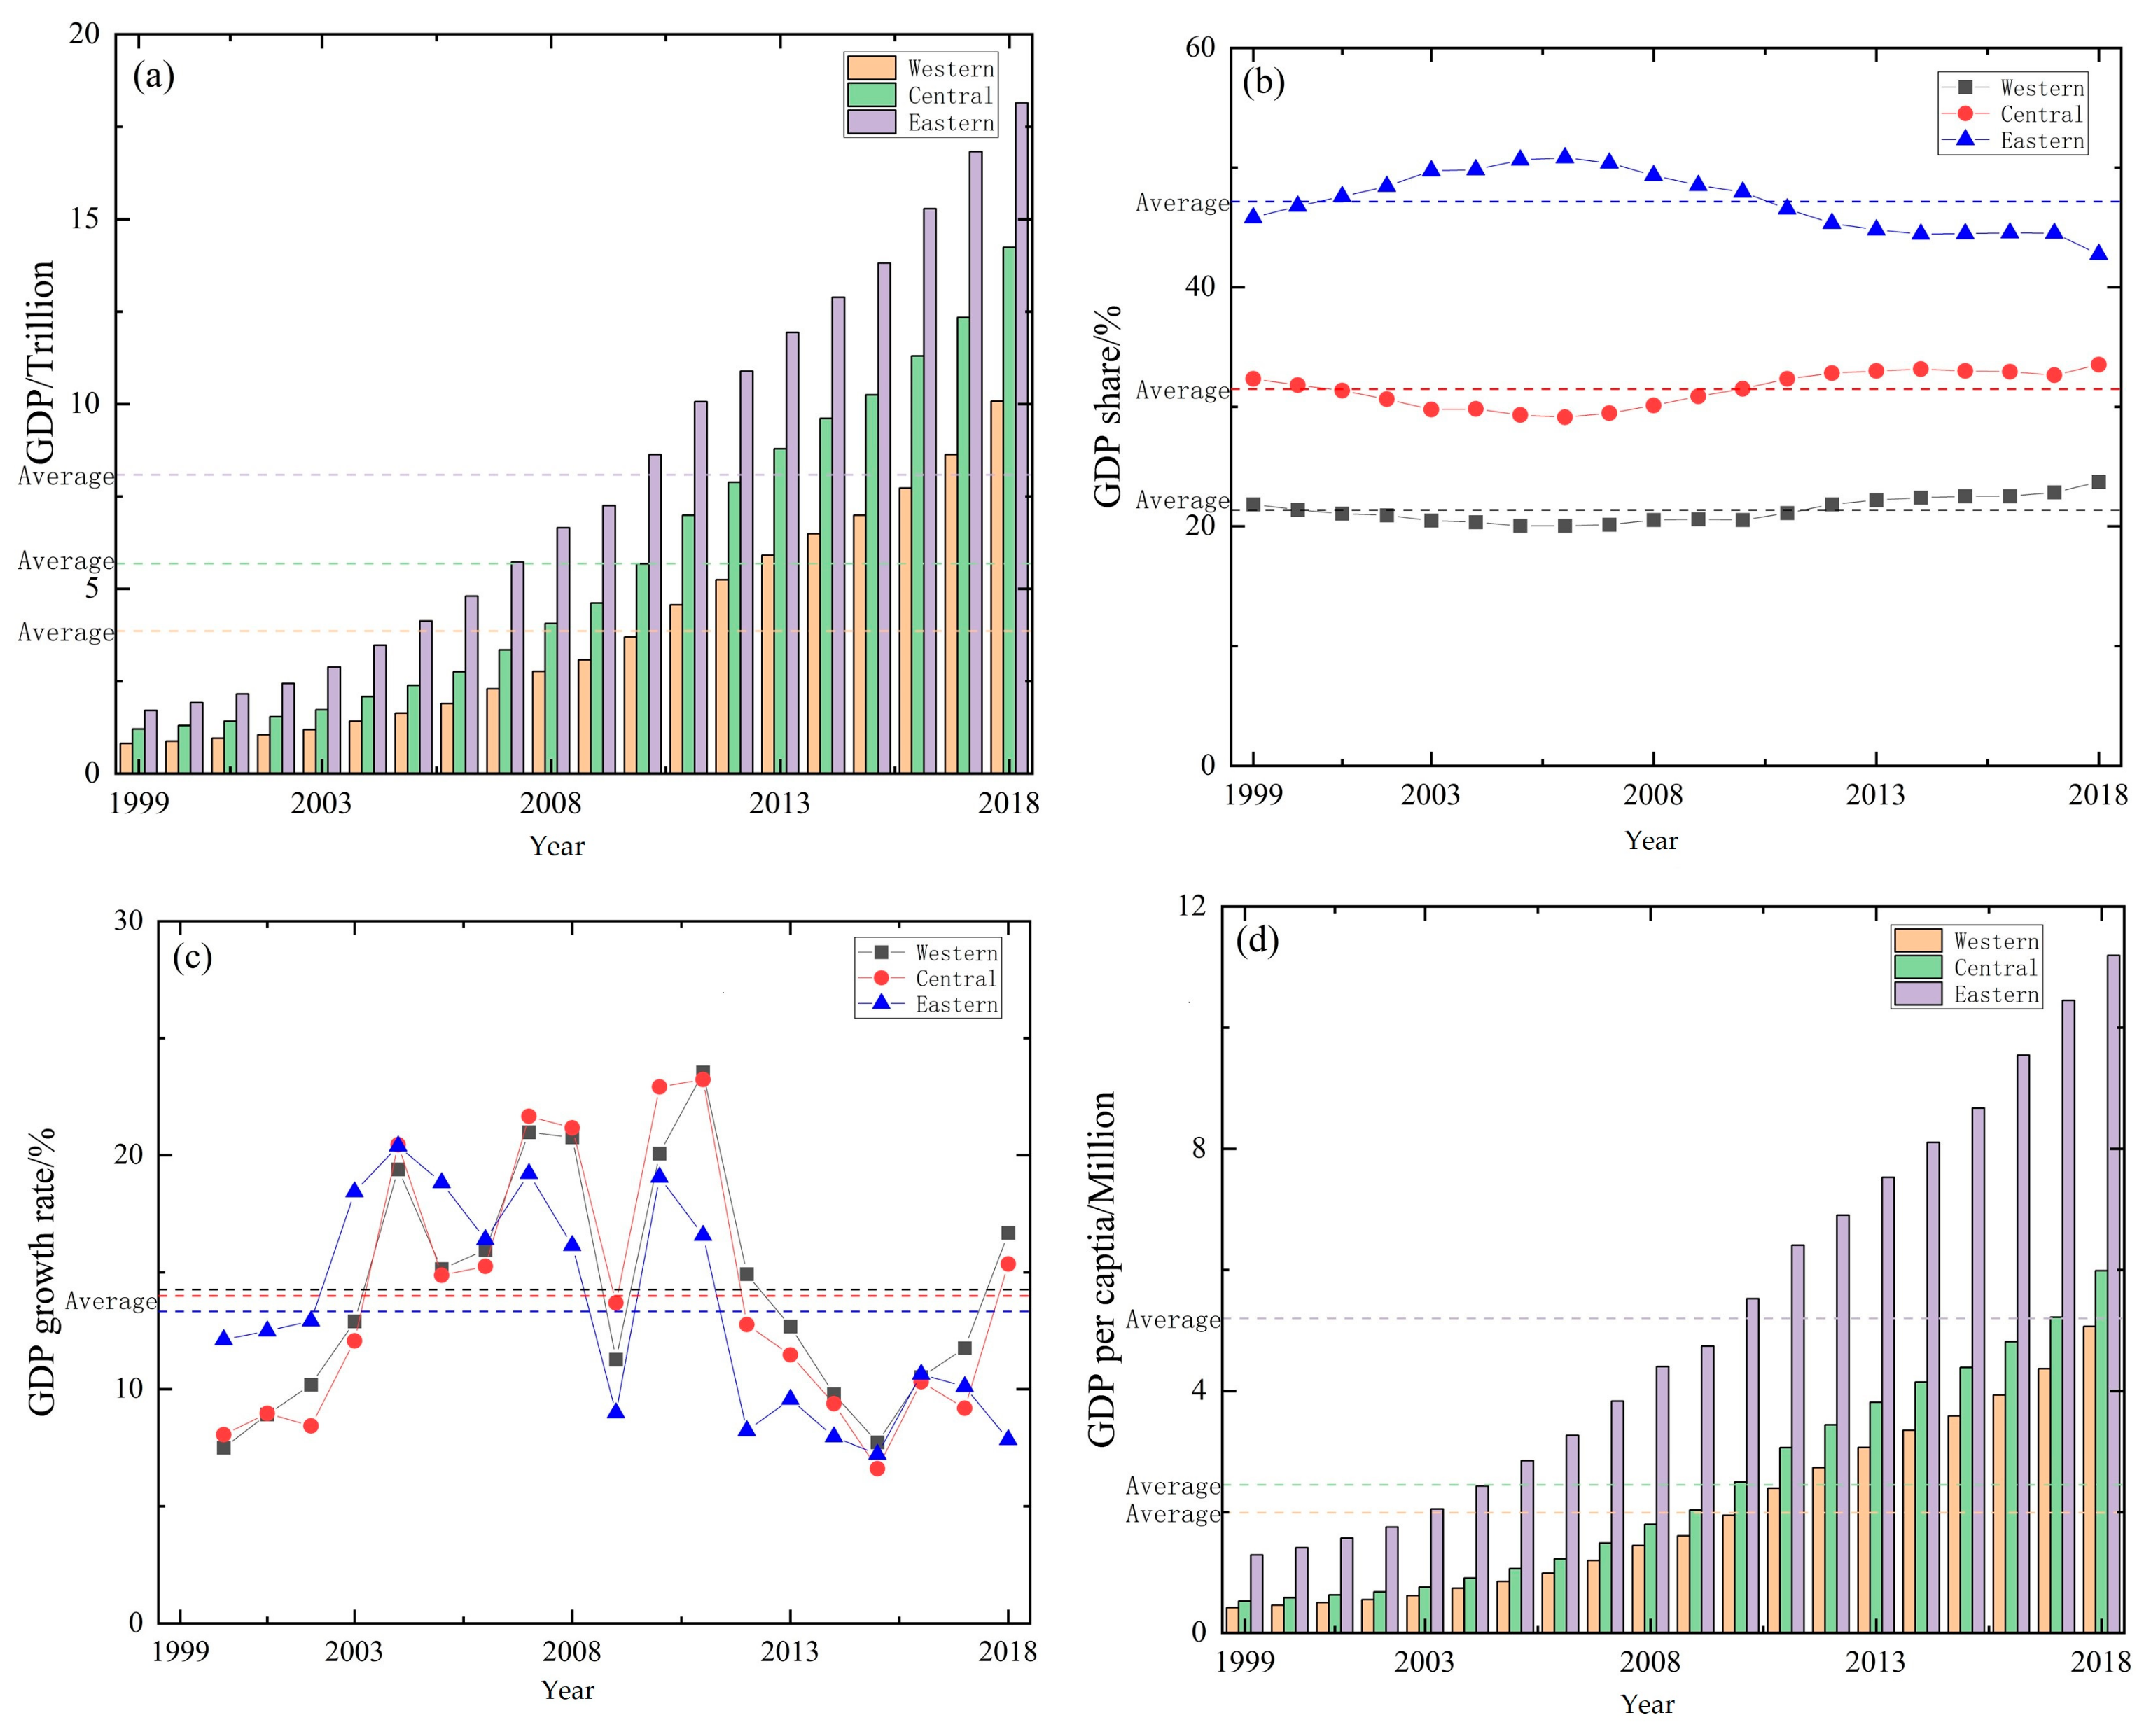
Although the order of the three major areas’ overall economic volume and share is eastern region > central region > western region, the growth rate and share trend is really the exact opposite. The process of initially increasing and then diminishing has been observed in the intergroup differences in the total GDP. The central region has the smallest variation in total GDP, while the western region has the largest;
(3)
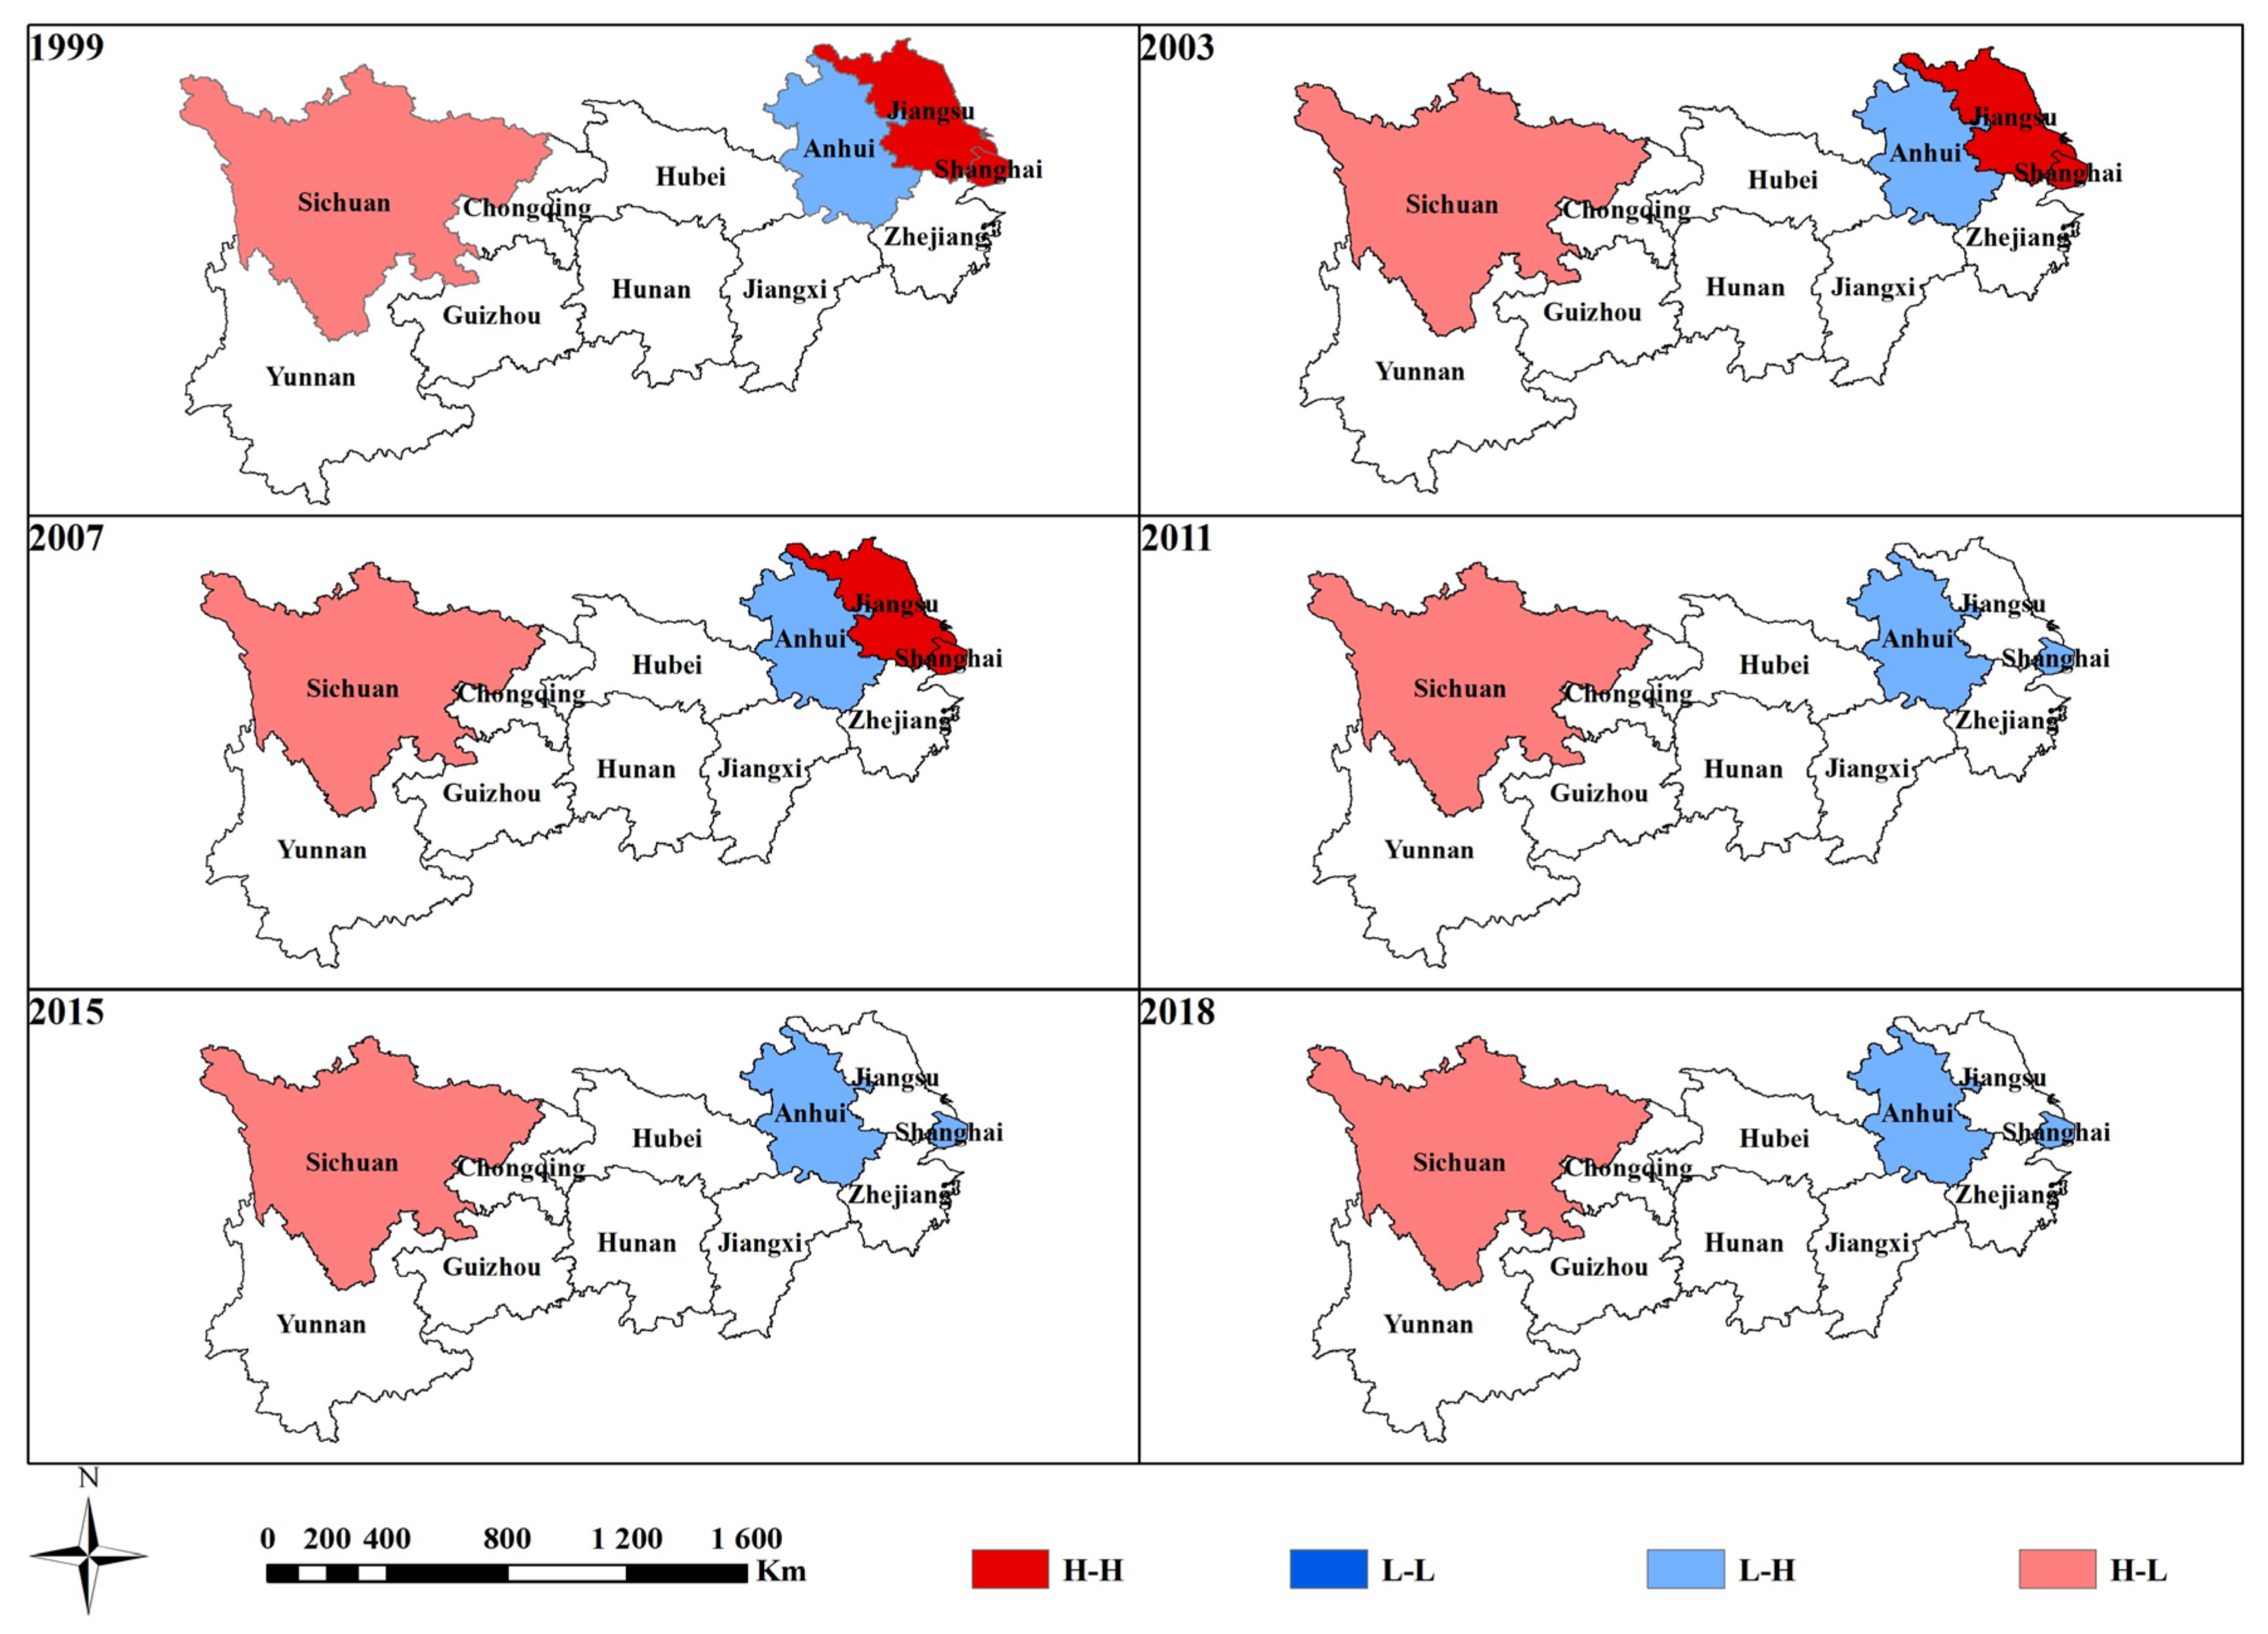
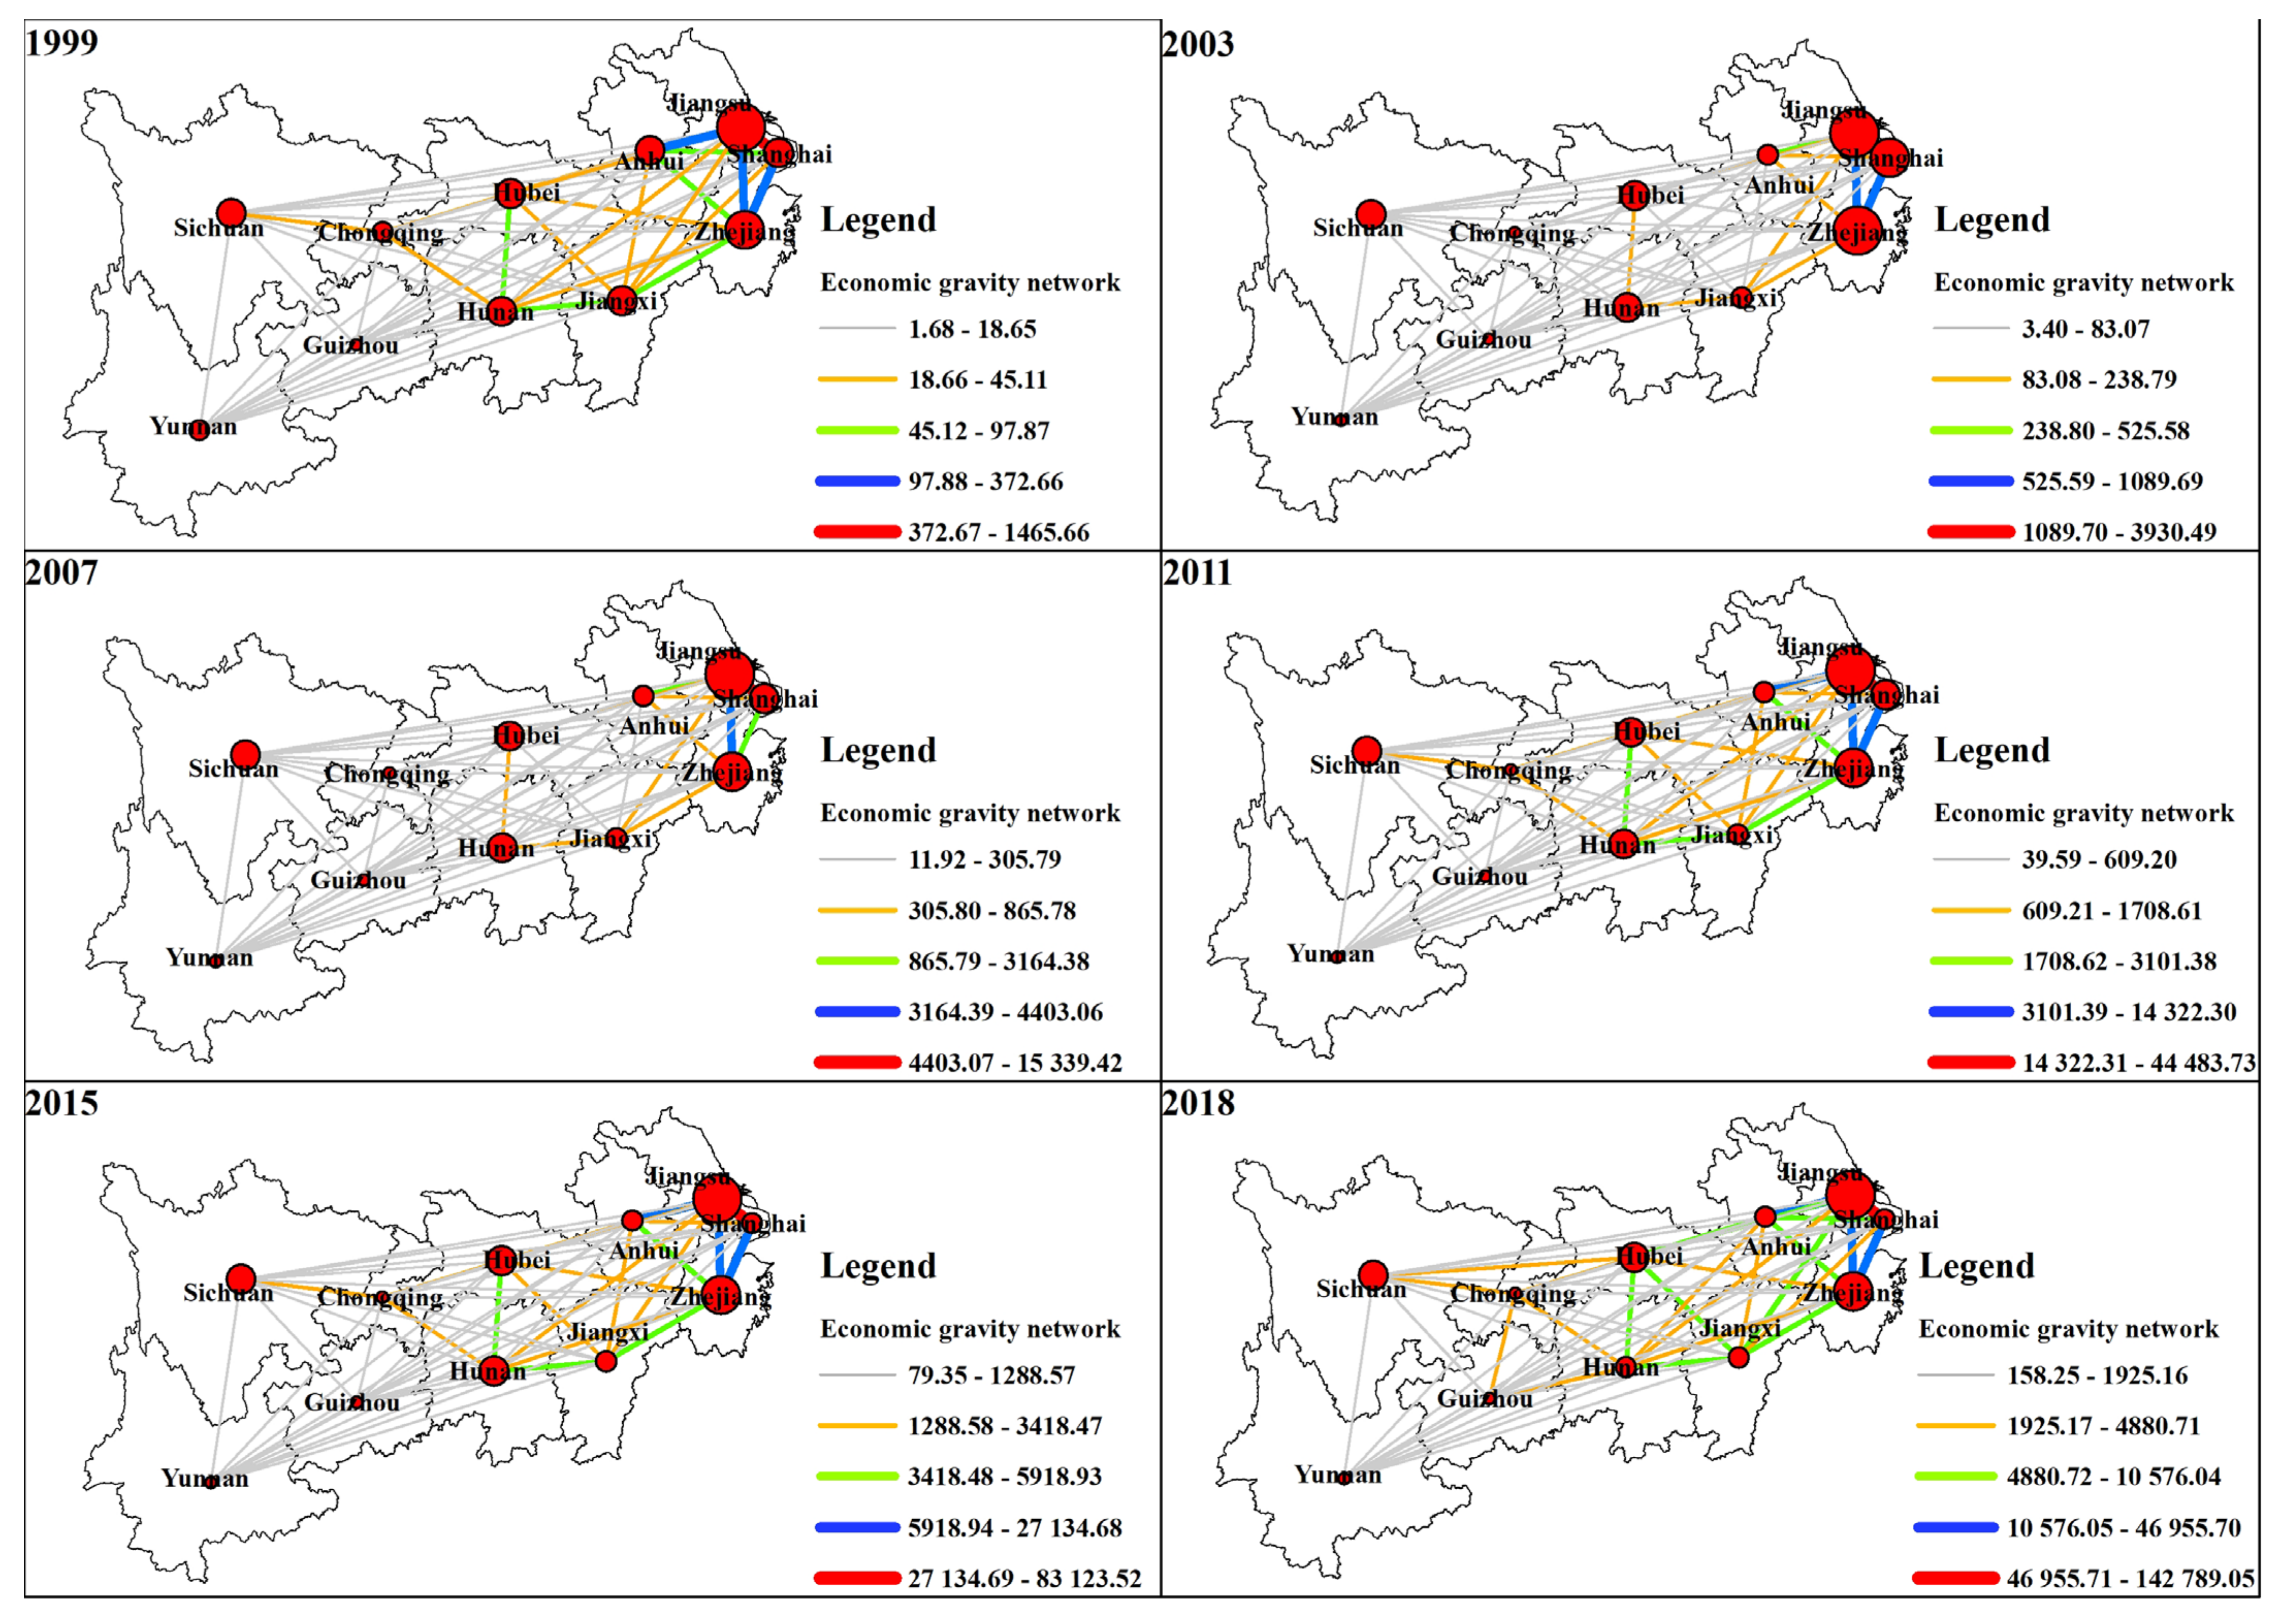
There is an increasing trend in the absolute differences in the total GDP of the 11 provinces, with the trend increasing from west to east. The 11 provinces’ combined GDP exhibits positive global autocorrelation and clear local spatial autocorrelation, but it has little effect on the surrounding areas due to radiation. The 11 provinces’ economic network is monocentric, with a focus on Shanghai and Jiangsu. The network’s structure gradually gets stronger from west to east, with the gravitational value growth rate in the western region being significantly higher than in the central and eastern regions;
(4)
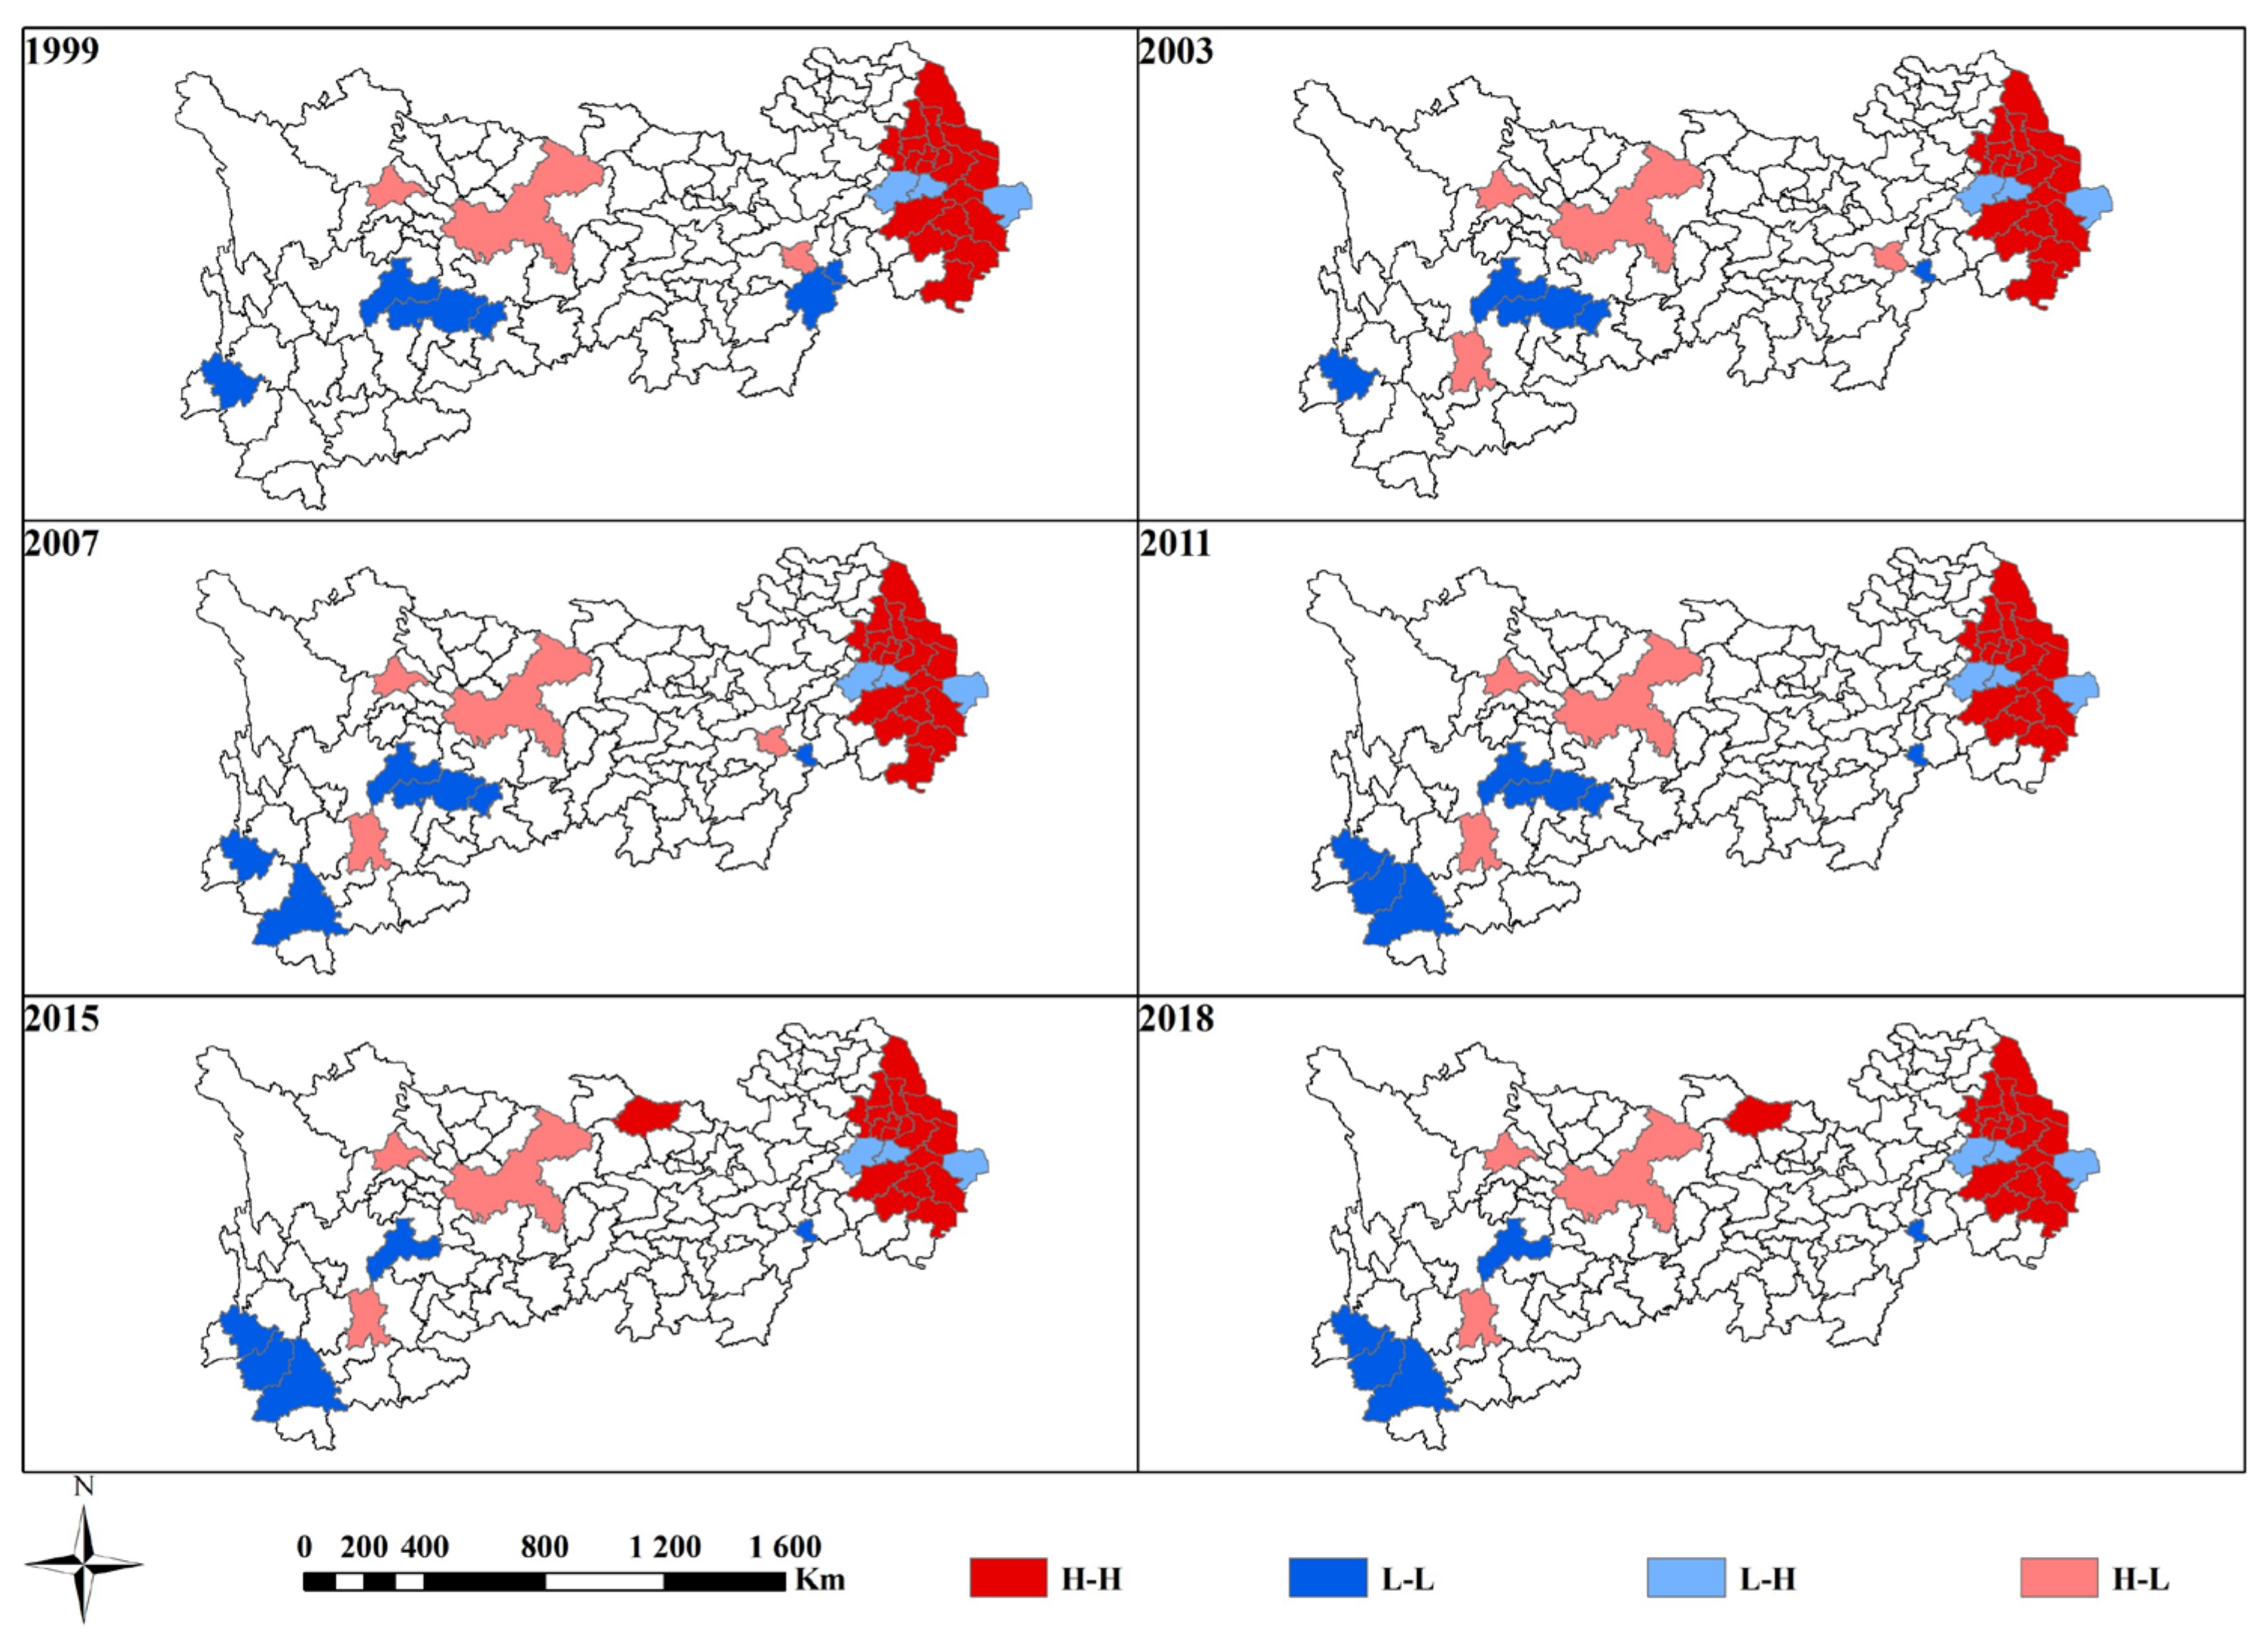
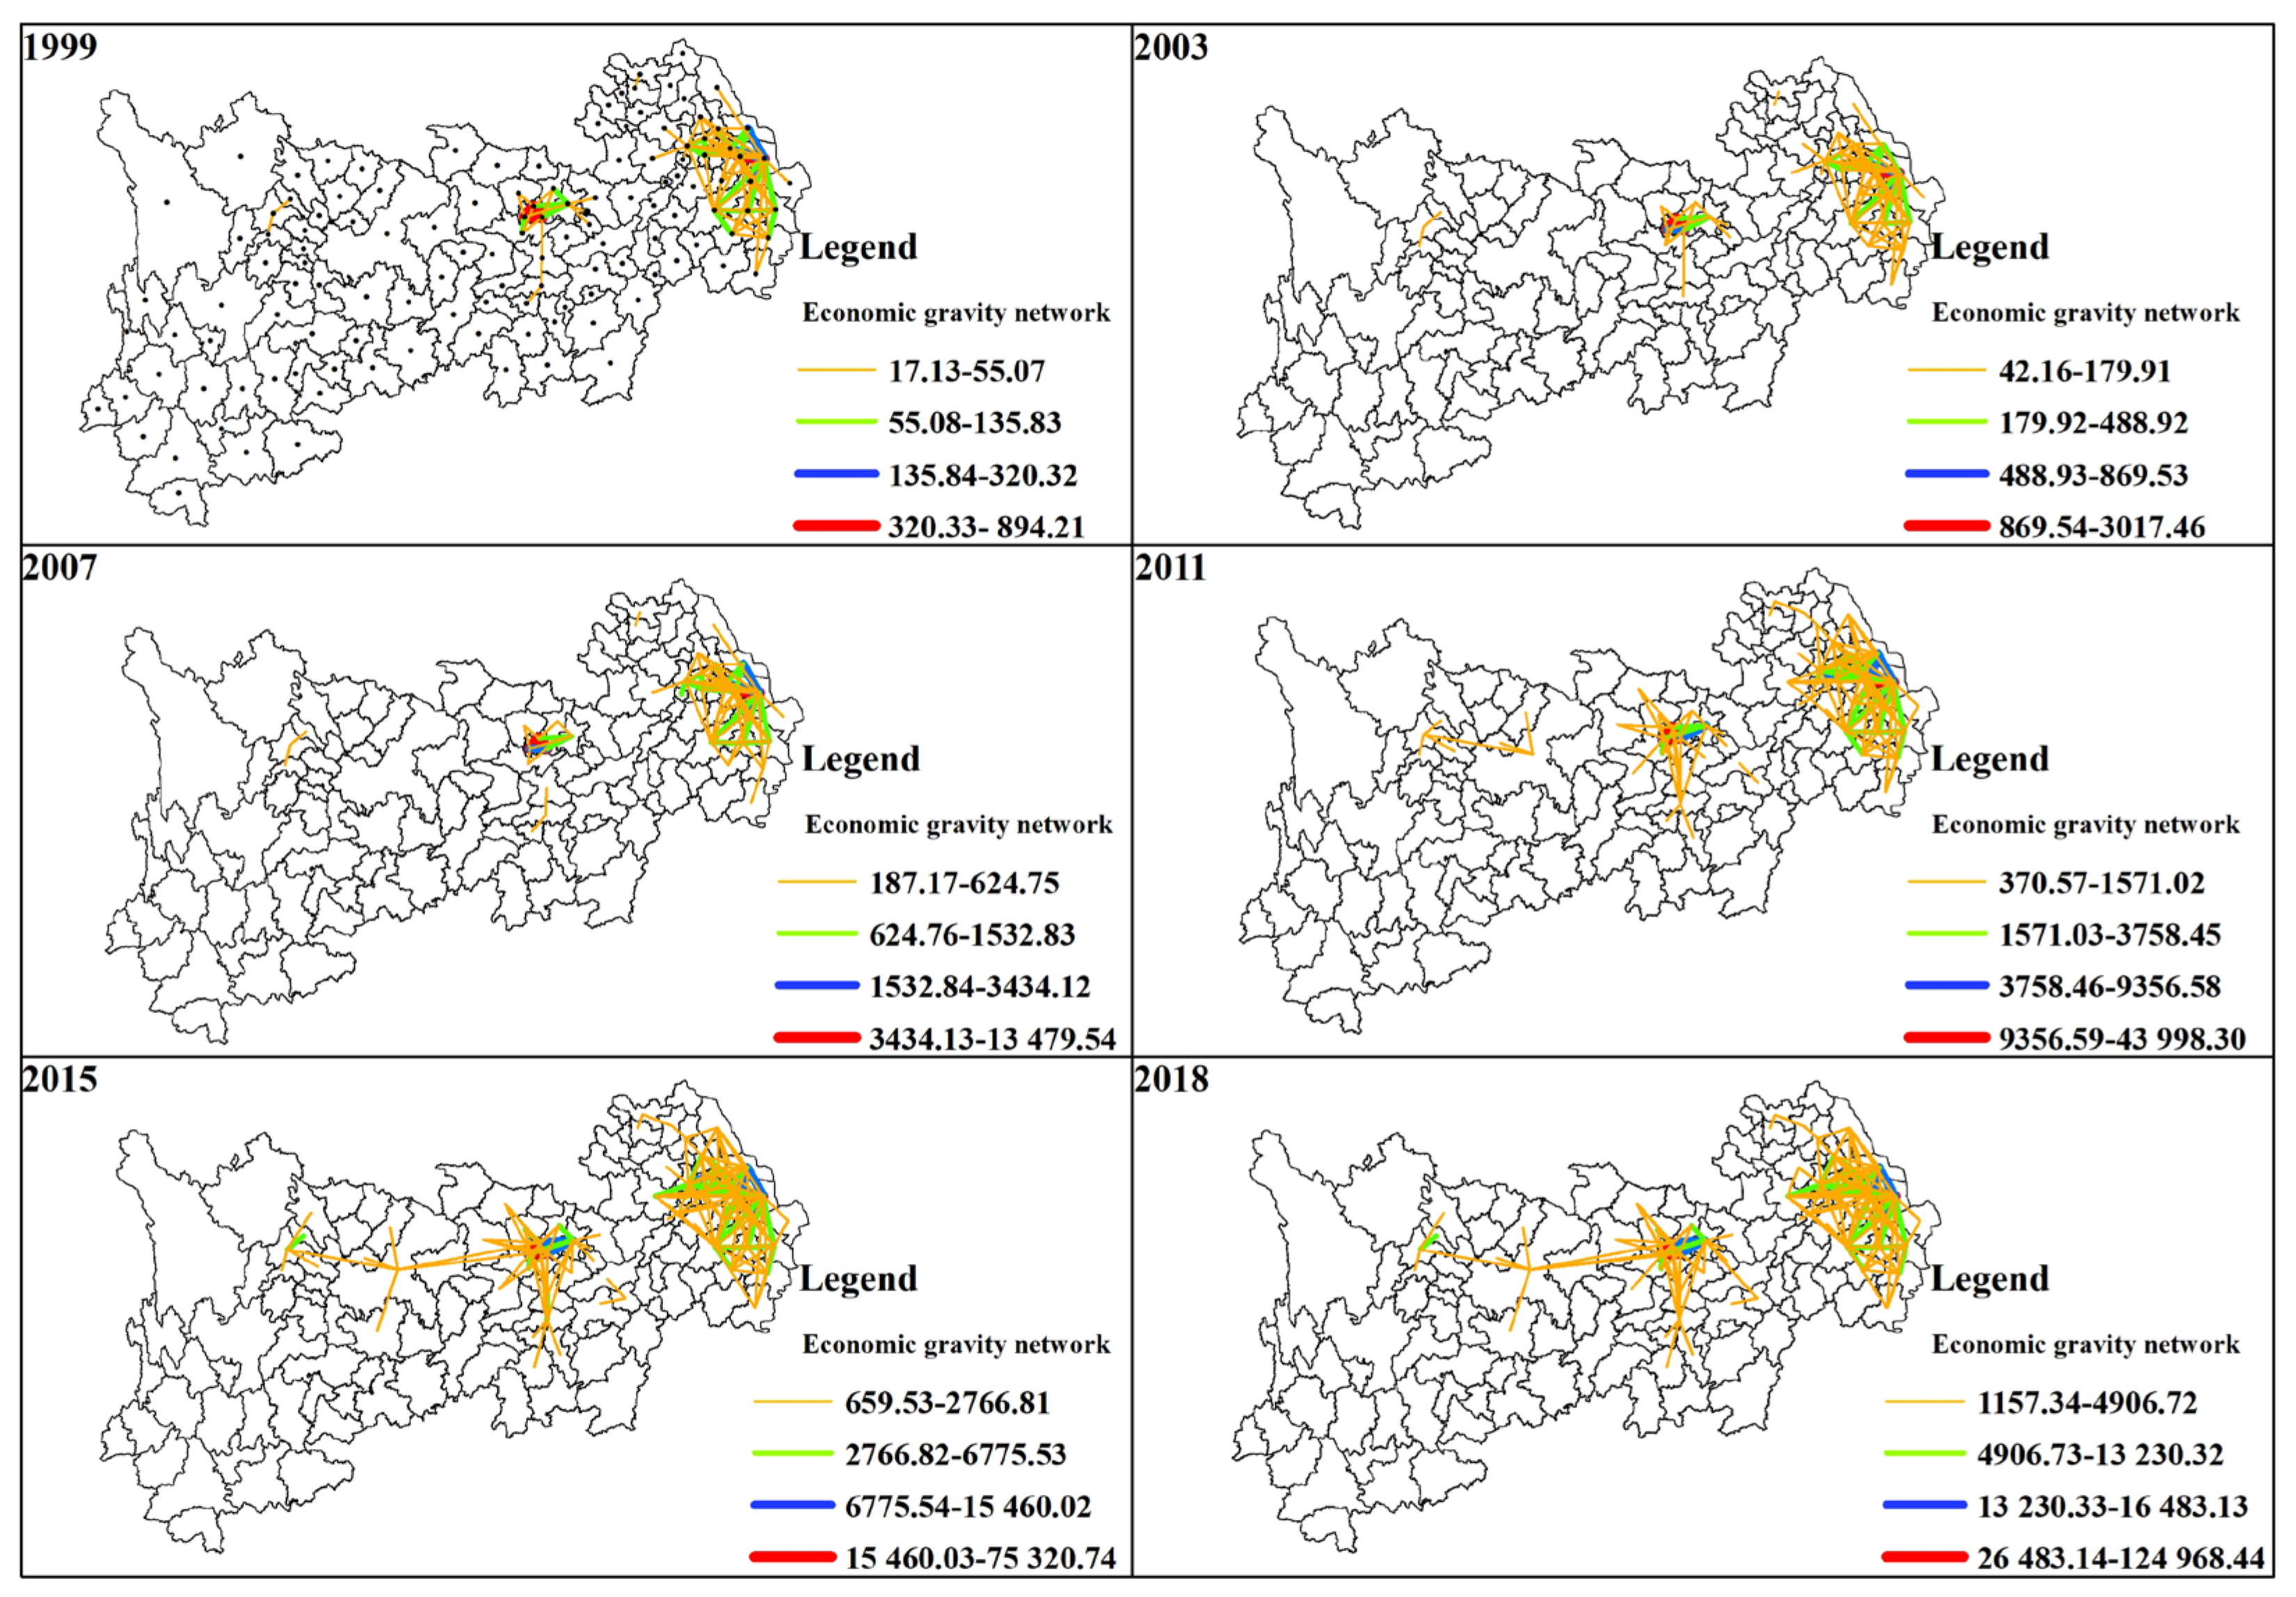
The 110 cities’ total GDP exhibits both clear local spatial autocorrelation and positive global autocorrelation; additionally, the spatial agglomeration impact is stronger at the province scale than it is at the city scale. The city clusters in the middle reaches of the Yangtze River and Chengdu–Chongqing city cluster act as the main bridges and links, and play a crucial role in the transmission of the graded radiation process of economic links. The economic network indicates that the radiation power from agglomeration to diffusion in the eastern region is gradually spreading to the central and western regions.

Author Contributions

Z.Z.: conceptualization, methodology, validation, data curation, formal analysis, investigation, software, visualization, writing—original draft, writing—review and editing. Y.C.: methodology, conceptualization, software. All authors have read and agreed to the published version of the manuscript.

Funding

This research was supported by the Qin Chuangyuan high-level innovation and entrepreneurship talent project (QCYRCXM-2022-242), Social Science Foundation of Shaanxi Province (2023R033), Natural Science Foundation of Shaanxi Province (2024JC-YBQN-0418), General project of Shaanxi Provincial Department of Education (23JK0215). Social Science Planning Foundation of Xi’an (24GL88).

Institutional Review Board Statement

Not applicable.

Informed Consent Statement

Not applicable.

Data Availability Statement

Data will be made available on request.

Acknowledgments

The authors would like to thank the editors and the anonymous reviewers for their crucial comments, which helped improve the quality of this manuscript.

Conflicts of Interest

The authors declare no conflicts of interest.

References

  1. Zheng, W. Research progress and development trend in urban economic network study based on complexity theory. Prog. Geogr. 2015, 34, 376–686. [Google Scholar]
  2. Smyth, H. Marketing the City: The Role of Flagship Developments in Urban Regeneration; Taylor & Francis: London, UK, 2005. [Google Scholar]
  3. Harris, C.D.; Ullman, E.L. The Nature of Cities. Ann. Am. Acad. Pol. Soc. Sci. 1945, 242, 7–17. [Google Scholar] [CrossRef]
  4. Ye, Q.; Qijiao, S.; Xiaofan, Z.; Shiyong, Q.; Lindsay, T. China’s New Urbanisation Opportunity: A Vision for the 14th Five-Year Plan; Coalition for Urban Transitions: London, UK, 2020. [Google Scholar] [CrossRef]
  5. Von Thünen, J.H. Der Isolierte Staat; BoD—Books on Demand: Norderstedt, Germany, 2022. [Google Scholar]
  6. Westlund, H. Gunnar Myrdal (1898–1987): Cumulative Causation Theory Applied to Regions. In Great Minds in Regional Science: Volume 1; Batey, P., Plane, D., Eds.; Springer International Publishing: Cham, Switzerland, 2020; pp. 121–134. [Google Scholar] [CrossRef]
  7. Akamatsu, K. A Theory of Unbalanced Growth in the World Economy. Weltwirtschaftliches Arch. 1961, 86, 196–217. [Google Scholar]
  8. Bunker, S.G. Staples, links, and poles in the construction of regional development theories. Sociol. Forum. 1989, 4, 589–610. [Google Scholar] [CrossRef]
  9. Friedmann, J. A General Theory of Polarized Development. 1967. Available online: https://repositorio.cepal.org/server/api/core/bitstreams/c91806cb-2cb4-4c60-b09e-cc6ada2cf15e/content (accessed on 22 April 2024).
  10. Hatton, T.J.; Williamson, J.G. What Drove the Mass Migrations from Europe in the Late Nineteenth Century? Popul. Dev. Rev. 1992, 20, 3. [Google Scholar] [CrossRef]
  11. Barbier, E.B. Economics, Natural-Resource Scarcity and Development (Routledge Revivals): Conventional and Alternative Views; Routledge: London, UK, 2013. [Google Scholar]
  12. Bai, J.F.; Zhang, H.J. Spatial-temporal analysis of economic growth in Central Plains Economic Zone with EOF and GRW methods. Geogr. Res. 2014, 33, 1230–1238. [Google Scholar]
  13. Jin, C.; Lu, Y.Q. Evolvement of Economic Development Diversity in the Changjiang River Delta Based on Spatial Variogram. Sci. Geogr. Sin. 2011, 31, 1329–1334+6. [Google Scholar]
  14. Schwarze, J. How Income Inequality Changed in Germany Following Reunification: An Empirical Analysis Using Decomposable Inequality Measures. Rev. Income Wealth 1996, 42, 1–11. [Google Scholar] [CrossRef]
  15. Podobnik, B.; Horvatic, D.; Pammolli, F.; Wang, F.; Stanley, H.E.; Grosse, I. Size-dependent standard deviation for growth rates: Empirical results and theoretical modeling. Phys. Rev. E 2008, 77, 056102. [Google Scholar] [CrossRef] [PubMed]
  16. Yeong, W.C.; Chuah, M.E.; Teoh, W.L.; Khoo, M.B.C.; Lim, S.L. The economic and economic-statistical designs of the coefficient of variation chart. Acad. J. Sci. 2015, 4, 57–72. [Google Scholar] [CrossRef]
  17. Murthy, N.R.V.; Ukpolo, V. A test of the conditional convergence hypothesis: Econometric evidence from African countries. Econ. Lett. 1999, 65, 249–253. [Google Scholar] [CrossRef]
  18. Yamamoto, D. Scales of regional income disparities in the USA, 1955–2003. J. Econ. Geogr. 2008, 8, 79–103. [Google Scholar]
  19. Lessmann, C. Fiscal Decentralization and Regional Disparity: Evidence from Cross-Section and Panel Data. Environ. Plan. Econ. Space 2009, 41, 2455–2473. [Google Scholar] [CrossRef]
  20. Lu, L.; Wei, Y.D. Domesticating Globalisation, New Economic Spaces and Regional Polarisation in Guangdong Province, China. Tijdschr. Voor Econ. Soc. Geogr. 2007, 98, 225–244. [Google Scholar] [CrossRef]
  21. Feuchtwang, S. Transforming China’s Economy in the Eighties: Vol. 1: The Rural Sector, Welfare and Employment; Routledge: London, UK, 2019. [Google Scholar]
  22. Head, K.; Mayer, T. Non-Europe: The magnitude and causes of market fragmentation in the EU. Rev. World Econ. 2000, 136, 284–314. [Google Scholar] [CrossRef]
  23. Zhong, Y.X.; Feng, X.H.; Wen, Y.Z. The Evolvement and Driving Mechanism of Economic Network Structure in the Changjiang River Economic Zone. Sci. Geogr. Sin. 2016, 36, 10–19. [Google Scholar]
  24. Meyer, D.R. The World System of Cities: Relations Between International Financial Metropolises and South American Cities. Soc. Forces 1986, 64, 553–581. [Google Scholar] [CrossRef]
  25. Ducruet, C.; Lugo, I. Cities and Transport Networks in Shipping and Logistics Research. Asian J. Shipp. Logist. 2013, 29, 145–166. [Google Scholar] [CrossRef]
  26. Choi, J.H.; Barnett, G.A.; Chon, B.-S. Comparing world city networks: A network analysis of Internet backbone and air transport intercity linkages. Glob. Netw. 2006, 6, 81–99. [Google Scholar] [CrossRef]
  27. Mahutga, M.C.; Ma, X.; Smith, D.A.; Timberlake, M. Economic Globalisation and the Structure of the World City System: The Case of Airline Passenger Data. Urban Stud. 2010, 47, 1925–1947. [Google Scholar] [CrossRef]
  28. Alderson, A.S.; Beckfield, J.; Sprague-Jones, J. Intercity Relations and Globalisation: The Evolution of the Global Urban Hierarchy, 1981–2007. Urban Stud. 2010, 47, 1899–1923. [Google Scholar] [CrossRef]
  29. Guimerá, R.; Amaral, L.A.N. Modeling the world-wide airport network. Eur. Phys. J. B 2004, 38, 381–385. [Google Scholar] [CrossRef]
  30. Zhao, Z.; Zhang, L.; Deng, C. Changes in net anthropogenic nitrogen and phosphorus inputs in the Yangtze River Economic Belt, China (1999–2018). Ecol. Indic. 2022, 145, 109674. [Google Scholar] [CrossRef]
  31. Bai, Y.L.; Guo, S. Temporal and Spatial Differences in Economic Strength of The Yangtze River Economic Belt: Comparison of the Along City. Reform 2015, 1, 99–108. [Google Scholar]
  32. Wu, C.Q.; Dong, X. Regional Disparity Analysis of Total Factor Productivity in the Yangtze River Economic Belt. Study Pract. 2014, 4, 13–20. [Google Scholar]
  33. Ding, H.Y.; Ren, Y.; Pu, K.M. Spatial Difference and lnfluential Factors of lndustrial Energy Efficiency in the Yangtze River Economic Belt. West Forum. 2016, 26, 27–34. [Google Scholar]
  34. Wang, W. Analysis of regional economic spatial-temporal changes in the Yangtze River Economic belt from 2004 to 2014. Mod. Manag. 2016, 36, 45–47. [Google Scholar]
  35. Fang, F.L. Analysis of regional economic differences based on Theil index: A case study of Yangtze River Economic Belt. Econ. Dev. Stud. 2015, 7, 50–55. [Google Scholar]
  36. Kong, Y.; He, W.; Yuan, L.; Zhang, Z.; Gao, X.; Degefu, D.M. Decoupling economic growth from water consumption in the Yangtze River Economic Belt, China. Ecol. Indic. 2021, 123, 107344. [Google Scholar] [CrossRef]
  37. Zhang, S.Y.; Ren, Z.Y. Spatial and temporal analysis on reginoal economic disparities in Sichuan Province inpast 10 years of China’s western development. Econ. Geogr. 2011, 31, 903–909+8. [Google Scholar]
  38. Wu, Y.M.; Xu, J.H. A Spatial Analysis on China’s Regional Economic Growth Clustering. Sci. Geogr. Sin. 2004, 6, 654–659. [Google Scholar]
  39. Tang, F.H.; Tang, H.; Sun, Q.; Tang, D.S. Analysis of the economic network structure of urban agglomerations in the middle Yangtze River. Acta Geogr. Sin. 2013, 68, 1357–1366. [Google Scholar]
  40. Ma, N.; Yao, Y.; Shen, T.Y. Differential Path of Urban Economic Cooperative Development in the Yangtze River Economic Belt. Econ. Geogr. 2023, 43, 79–90. [Google Scholar]
  41. Huang, Q.H.; Pan, T.; HU, J.F. Identification and influencing factors of China’s industrial technology progress direction under environmental constraints. China Popul. Resour. Environ. 2022, 32, 123–135. [Google Scholar]
  42. Liu, Y.B.; Yi, R.; Li, R.Z. New Features and Paths of Regional Coordinated Development in the Yangtze River Economic Belt. Study Pract. 2022, 5, 23–31+2. [Google Scholar]
Figure 1. Location of the administrative division of the Yangtze River economic belt.
Sustainability 16 05023 g001
Figure 2. The economic development trend (a) GDP, (b) GDP share, (c) GDP growth rate, (d) GDP per captia) of the eastern, central, and western regions in the Yangtze River economic belt from 1999 to 2018.
Sustainability 16 05023 g002
Figure 3. Local autocorrelation trend of GDP at provincial scale in the Yangtze River economic belt.
Sustainability 16 05023 g003
Figure 4. Spatiotemporal trend of regional economic connections at provincial scale in the Yangtze River economic belt.
Sustainability 16 05023 g004
Figure 5. Local autocorrelation trend of GDP at city scale in the Yangtze River economic belt.
Sustainability 16 05023 g005
Figure 6. Spatiotemporal trend of regional economic connections at city scale in the Yangtze River economic belt.
Sustainability 16 05023 g006
Table 1. Economic difference index of GDP from 1999 to 2018 in the Yangtze River economic belt.
YearGDP/TrillionStandard DeviationCoefficient of VariationTheil IndexMoran’s I
ProvinceCity
19993.730.1870.5510.1300.3410.131
20004.100.2120.5680.1380.3420.135
20014.530.2380.5770.1420.3650.134
20025.030.2720.5940.1490.3670.139
20035.800.3270.6200.1610.3730.152
20046.970.3940.6220.1620.3780.154
20058.150.4850.6540.1750.3440.159
20069.450.5690.6630.1790.3310.163
200711.370.6780.6560.1750.3180.162
200813.480.7900.6450.1680.2880.155
200914.940.8660.6380.1650.2690.149
201018.001.0410.6360.1650.2510.151
201121.621.2130.6170.1550.2210.144
201224.021.3110.6000.1460.1850.136
201326.631.4320.5920.1410.1700.131
201428.981.5450.5860.1370.1570.127
201531.051.6570.5870.1360.1500.124
201634.311.8240.5850.1350.1600.120
201737.802.0160.5870.1350.1520.121
201842.462.1290.5520.1210.1210.118
Table 2. Theil index and its contribution rate of GDP from 1999 to 2018 in the Yangtze River economic belt.
YearTheil IndexDecompositionContribution RateIntergroup
EasternCentralWesternEasternCentralWestern
19990.1300.0350.0030.1140.1230.0060.1910.680
20000.1380.0340.0040.1130.1140.0090.1750.702
20010.1420.0290.0040.1130.0980.0080.1670.727
20020.1490.0300.0040.1120.0980.0080.1570.737
20030.1610.0300.0040.1110.0940.0080.1410.757
20040.1620.0300.0040.1130.0940.0070.1410.759
20050.1750.0390.0050.1120.1130.0090.1280.750
20060.1790.0410.0060.1170.1170.0100.1310.742
20070.1750.0420.0070.1170.1220.0120.1340.731
20080.1680.0490.0080.1110.1440.0150.1360.705
20090.1650.0550.0080.1160.1610.0150.1440.680
20100.1650.0600.0080.1210.1760.0160.1510.657
20110.1550.0680.0080.1180.2030.0160.1610.620
20120.1460.0740.0080.1110.2310.0180.1650.586
20130.1410.0770.0080.1010.2470.0180.1590.575
20140.1370.0800.0090.0940.2580.0210.1530.568
20150.1360.0810.0100.0840.2660.0240.1390.571
20160.1350.0790.0090.0820.2620.0230.1360.579
20170.1350.0830.0080.0820.2730.0190.1380.570
20180.1210.0840.0070.0800.2960.0210.1570.527
Table 3. Standard deviation and coefficient of variation of the Yangtze River economic belt from 1999 to 2018.
ProvincesItems19992000200120022003200420052006200720082009201020112012201320142015201620172018
JiangsuSD0.0380.0400.0460.0540.0720.0880.1090.1280.1530.1810.1970.2330.2710.3030.3240.3420.3600.3810.4220.460
COV0.6680.6250.6440.6740.7450.7510.7530.7550.7530.7520.7330.7150.7050.6990.6750.6560.6420.6300.6240.634
ZhejiangSD0.0370.0420.0470.0540.0630.0750.0870.1010.1210.1390.1480.1750.2060.2270.2440.2660.2870.3200.3620.389
COV0.6760.6810.6960.6950.6970.6950.7090.7100.7110.7140.7160.7130.7130.7220.7150.7230.7350.7430.7670.759
AnhuiSD0.0070.0090.0080.0090.0100.0120.0220.0210.0270.0360.0430.0630.0780.0890.1000.1120.1220.1360.1510.169
COV0.4290.5240.4460.4540.4680.4540.6460.5660.5940.6630.7010.7910.7960.8110.8180.8400.8650.8800.8830.891
JiangxiSD0.0100.0110.0120.0140.0160.0210.0240.0290.0330.0390.0430.0510.0620.0690.0770.0850.0940.1030.1180.131
COV0.6420.6420.6520.6570.6510.6700.6720.6720.6500.6320.6190.5920.5880.5860.5920.5950.6110.6100.6440.653
HubeiSD0.0270.0310.0340.0390.0420.0480.0580.0700.0830.1070.1200.1450.1770.2100.2380.2650.2820.3080.3460.383
COV0.9291.0751.0931.3581.0991.1101.2201.2561.2591.2911.2701.2551.2101.2321.2401.2491.1751.1791.1941.216
HunanSD0.0120.0140.0160.0180.0210.0250.0340.0410.0500.0690.0880.1070.1320.1500.1670.1830.1990.2190.2400.258
COV0.4650.5150.5340.5470.5750.5830.6880.7080.7080.7930.8650.8640.8630.8600.8660.8620.8650.8700.9090.906
SichuanSD0.0250.0280.0320.0360.0400.0460.0500.0580.0700.0820.0950.1180.1480.1730.1940.2150.2300.2610.2990.331
COV1.2481.2801.3221.3341.3231.2871.2781.2731.2561.2351.2661.2911.3031.3291.3491.3651.3711.4321.4741.500
GuizhouSD0.0080.0090.0100.0110.0130.0150.0170.0190.0210.0250.0300.0350.0430.0520.0640.0760.0870.0950.1060.115
COV0.6430.6590.6780.6800.6720.6540.6180.6040.5820.5680.5790.5710.5740.5670.5820.5790.5710.5650.5620.569
YunnanSD0.0190.0200.0210.0230.0260.0300.0340.0380.0450.0510.0580.0670.0790.0940.1060.1140.1210.1310.1490.159
COV1.1141.1121.1321.1401.1541.1401.1121.0961.0791.0531.0551.0461.0271.0291.0231.0311.0311.0311.0521.063
Disclaimer/Publisher’s Note: The statements, opinions and data contained in all publications are solely those of the individual author(s) and contributor(s) and not of MDPI and/or the editor(s). MDPI and/or the editor(s) disclaim responsibility for any injury to people or property resulting from any ideas, methods, instructions or products referred to in the content.

