Article

Coupling Coordination Evaluation of Water and Soil Resource Matching and Grain Production, and Analysis of Obstacle Factors in a Typical Black Soil Region of Northeast China

1
College of Economics and Management, Jilin Agricultural University, Changchun 130118, China
2
Department of Agribusiness and Value Chain Management, Debre Markos University, Debre Markos P.O. Box 269, Ethiopia
*
Author to whom correspondence should be addressed.
Sustainability 2024, 16(12), 5030; https://doi.org/10.3390/su16125030
Submission received: 10 May 2024 / Revised: 11 June 2024 / Accepted: 11 June 2024 / Published: 13 June 2024

Abstract

:
The coordinated development of water and soil resource matching and grain production is essential to enhance integrated grain production capacity and promote sustainable development in agriculture. Based on the perspective of a water footprint, this article empirically evaluates the coupling coordination relationship between water and soil resource matching and grain production in typical black soil areas in Northeast China using the coupled coordination degree and the obstacle model and further analyzes the obstacle factors that affect the coordination between the two systems. The results indicate that the blue water footprint, green water footprint, and total water footprint of five grain crops are increasing year by year. Soybean has the largest water footprint per unit mass, tubers have the smallest, and rice has the largest water footprint among cereals. The overall matching degree of water and soil resources in the study area is steadily increasing. However, there are significant differences in the water and soil resource matching coefficients between regions, with the highest being observed in Hegang City and the lowest being observed in Jiamusi City. Coupling remains at a high level and coupling coordination shifts from a low–middle–high to a middle–high stage. The correlation between soil and water resource matching and grain production systems is of significant importance. The degree of matching between water and soil resources serves as the primary obstacle affecting the coupling and coordinated development of integrated systems, which fundamentally restricts the sustainable development of regional agriculture.

1. Introduction

As a fundamental element of agricultural production, water and soil resources are the key to stabilizing grain production and promoting the sustainable development of agriculture [1,2]. Throughout its development, China has been faced with the reality of the contradiction between the large area of freshwater land resources occupied by agriculture and the large amount of water and soil resources in total, the small amount per capita, uneven geographical distribution, and the small percentage of available high-quality arable land resources, which has seriously constrained the country’s agricultural development [3]. The northeast black soil region is the main grain-producing area and commercial grain production area in China. It has rich water and soil resources, and the climatic conditions of long sunshine hours and large temperature differences between day and night are conducive to high grain yields. However, water and soil resources are restricted under the pressure of the high burden of long-term grain production. From this, problems such as the degradation of black land and the irrational use of water and soil resources pose a serious threat to regional grain production and national food security [4]. The report of the 20th National Congress of the Communist Party of China emphasizes the need to “ensure the security of food, energy resources, and important industrial supply chains”. Enhancing the matching between regional water and soil resources and grain production is the primary prerequisite for improving production efficiency, easing the pressure on water and soil resources, and thus guaranteeing a stable supply of grain [5,6]. The matching of water and soil resources is expressed in the spatial and temporal distribution of water and arable land use at the regional level of agricultural production [7,8], which is directly related to the utilization efficiency of agricultural water resources and the grain productivity of cultivated land [9]. However, in order to assess the coupling coordination degree of regional water and soil resource matching with grain production, a scientific method for quantifying the amount of water and soil resources is required. The concept of the water footprint offers a new perspective for the comprehensive evaluation of agricultural water and soil resource allocation patterns. The water footprint quantifies the volume of water utilized directly or indirectly in the production or consumption of a product within a specific geographical area and timeframe, enabling a more precise and effective evaluation of water usage efficiency. Therefore, clarifying the matching status of water and soil resources in different regions and their coupling synergies with grain production is the key to coordinating the relationship between agricultural water and soil resources and grain production, so as to guarantee the effective supply of food and achieve sustainable regional agriculture.
In recent years, there have been fruitful research results on the matching of water and soil resources and grain production performed at the scale of watersheds [10,11,12], regions [13,14], typical mountainous areas [15,16], northwestern dry zones [17], and provinces [18,19], providing a reference for this study. The measurement of regional agricultural water and soil resource matching value, the analysis of the spatial and temporal matching patterns and changes in water and soil resources, and the formulation of regional regulatory programs for water and soil resource allocation are all important tasks. In terms of research methods, the Gini coefficient method [15,19], the water and soil resource matching coefficient method [13,16], the DEA model [20,21], and the comprehensive use of water and soil resource matching with the Gini coefficient [11,18] are commonly used.
Ref. [5] explored the spatiotemporal evolution of the matching characteristics of water and soil resources in farmland under different crop growth stages from the perspective of the supply and demand of farmland water resources. In addition, some scholars have studied the matching of water and soil resources from the perspective of the water footprint [22]. Ref. [23] used the matching coefficient method of water and soil resources and the economic growth model to empirically analyze the matching of agricultural water and soil resources in 11 provinces of the Yangtze River Economic Belt, as well as the impacts on agricultural economic growth. Ref. [24] accounted for the virtual water content of agricultural products between provinces in China to evaluate the environmental carrying capacity of regional water and soil resources. Regarding the study of grain production, scholars have mostly analyzed the changes in the spatial and temporal patterns of grain production based on indicators such as crop yield and sown areas [21,25]. Global grain production faces great challenges in the future. With a projected future world population of 9.6 billion by 2050, rising urbanization, socio-economic development, decreasing arable land, and weather extremes due to climate change, global agriculture is under pressure [26,27]. Production and productivity growth represent a sustainable solution to meet the grain demands of a population growing at an alarming rate. To achieve the ultimate goal of food security, some scholars have analyzed the characteristics of the evolution of the spatial and temporal patterns of grain and nutritional production in China [28], grain production and the self-sufficiency rate from a caloric perspective, and the balance between supply and demand [29]. Similarly, Ref. [30] analyzed the spatial and temporal evolution pattern of water and soil resource matching using virtual water for five crops in the Beijing–Tianjin–Hebei region. As a result, the spatial pattern of water and soil resource matching was closely related with the pattern of grain production.
Previous studies provide guidance on research methods and research ideas for this paper, but three limitations remain: firstly, in existing studies on the matching of water and soil resources, surface runoff is mostly used to characterize the regional agricultural water resources, but there is a lack of attention on the differences in water resource endowments among different regions. Therefore, fewer studies analyze water consumption during the reproductive period of crops from an agricultural water footprint perspective, which includes not only surface water and groundwater, but also the consumption of water resources in the evapotranspiration process of crops. In fact, the above calculation method of water resources is “rough”, which will essentially cause a large gap between the estimated value and the actual amounts of resources. Secondly, few studies pay attention to the correlation between grain production and water and soil resource allocation, and the related research on the coupling and coordination between regional water and soil resource matching and grain production is even rarer. If research on grain production and agricultural basic resource elements is separated, grain production and even food security will lose their resource foundations. Thirdly, in terms of the scope of the study, there are studies involving water and soil resource matching at different scales, but those at the regional level lack in-depth analyses of typical black soil areas in Northeast China. The typical black soil region in Northeast China is one of the only three black soil areas in the world. Ignoring this kind of research area is equivalent to losing the “code” for high grain yield.
In view of this, according to the current situation regarding grain production in Northeast China, there is generally a knowledge gap in relation to the above-mentioned ideas, so this article analyzes the coupling status of the two subsystems of regional water and soil resource matching and grain production through the coupling coordination degree model and the obstacle model. The water and soil resource matching of five grain crops (rice, wheat, maize, soybean, and tubers) was measured in the typical black soil region of Northeast China from 2005 to 2021 by using the water footprint accounting method and the water and soil resource matching coefficient method, so as to adjust the grain planting structure in the black soil region of Northeast China, make rational use of agricultural water and soil resources, and provide scientific guidance for improving the effective supply of regional grain and the utilization efficiency of water resources.

2. Materials and Methods

2.1. Theoretical Mechanism

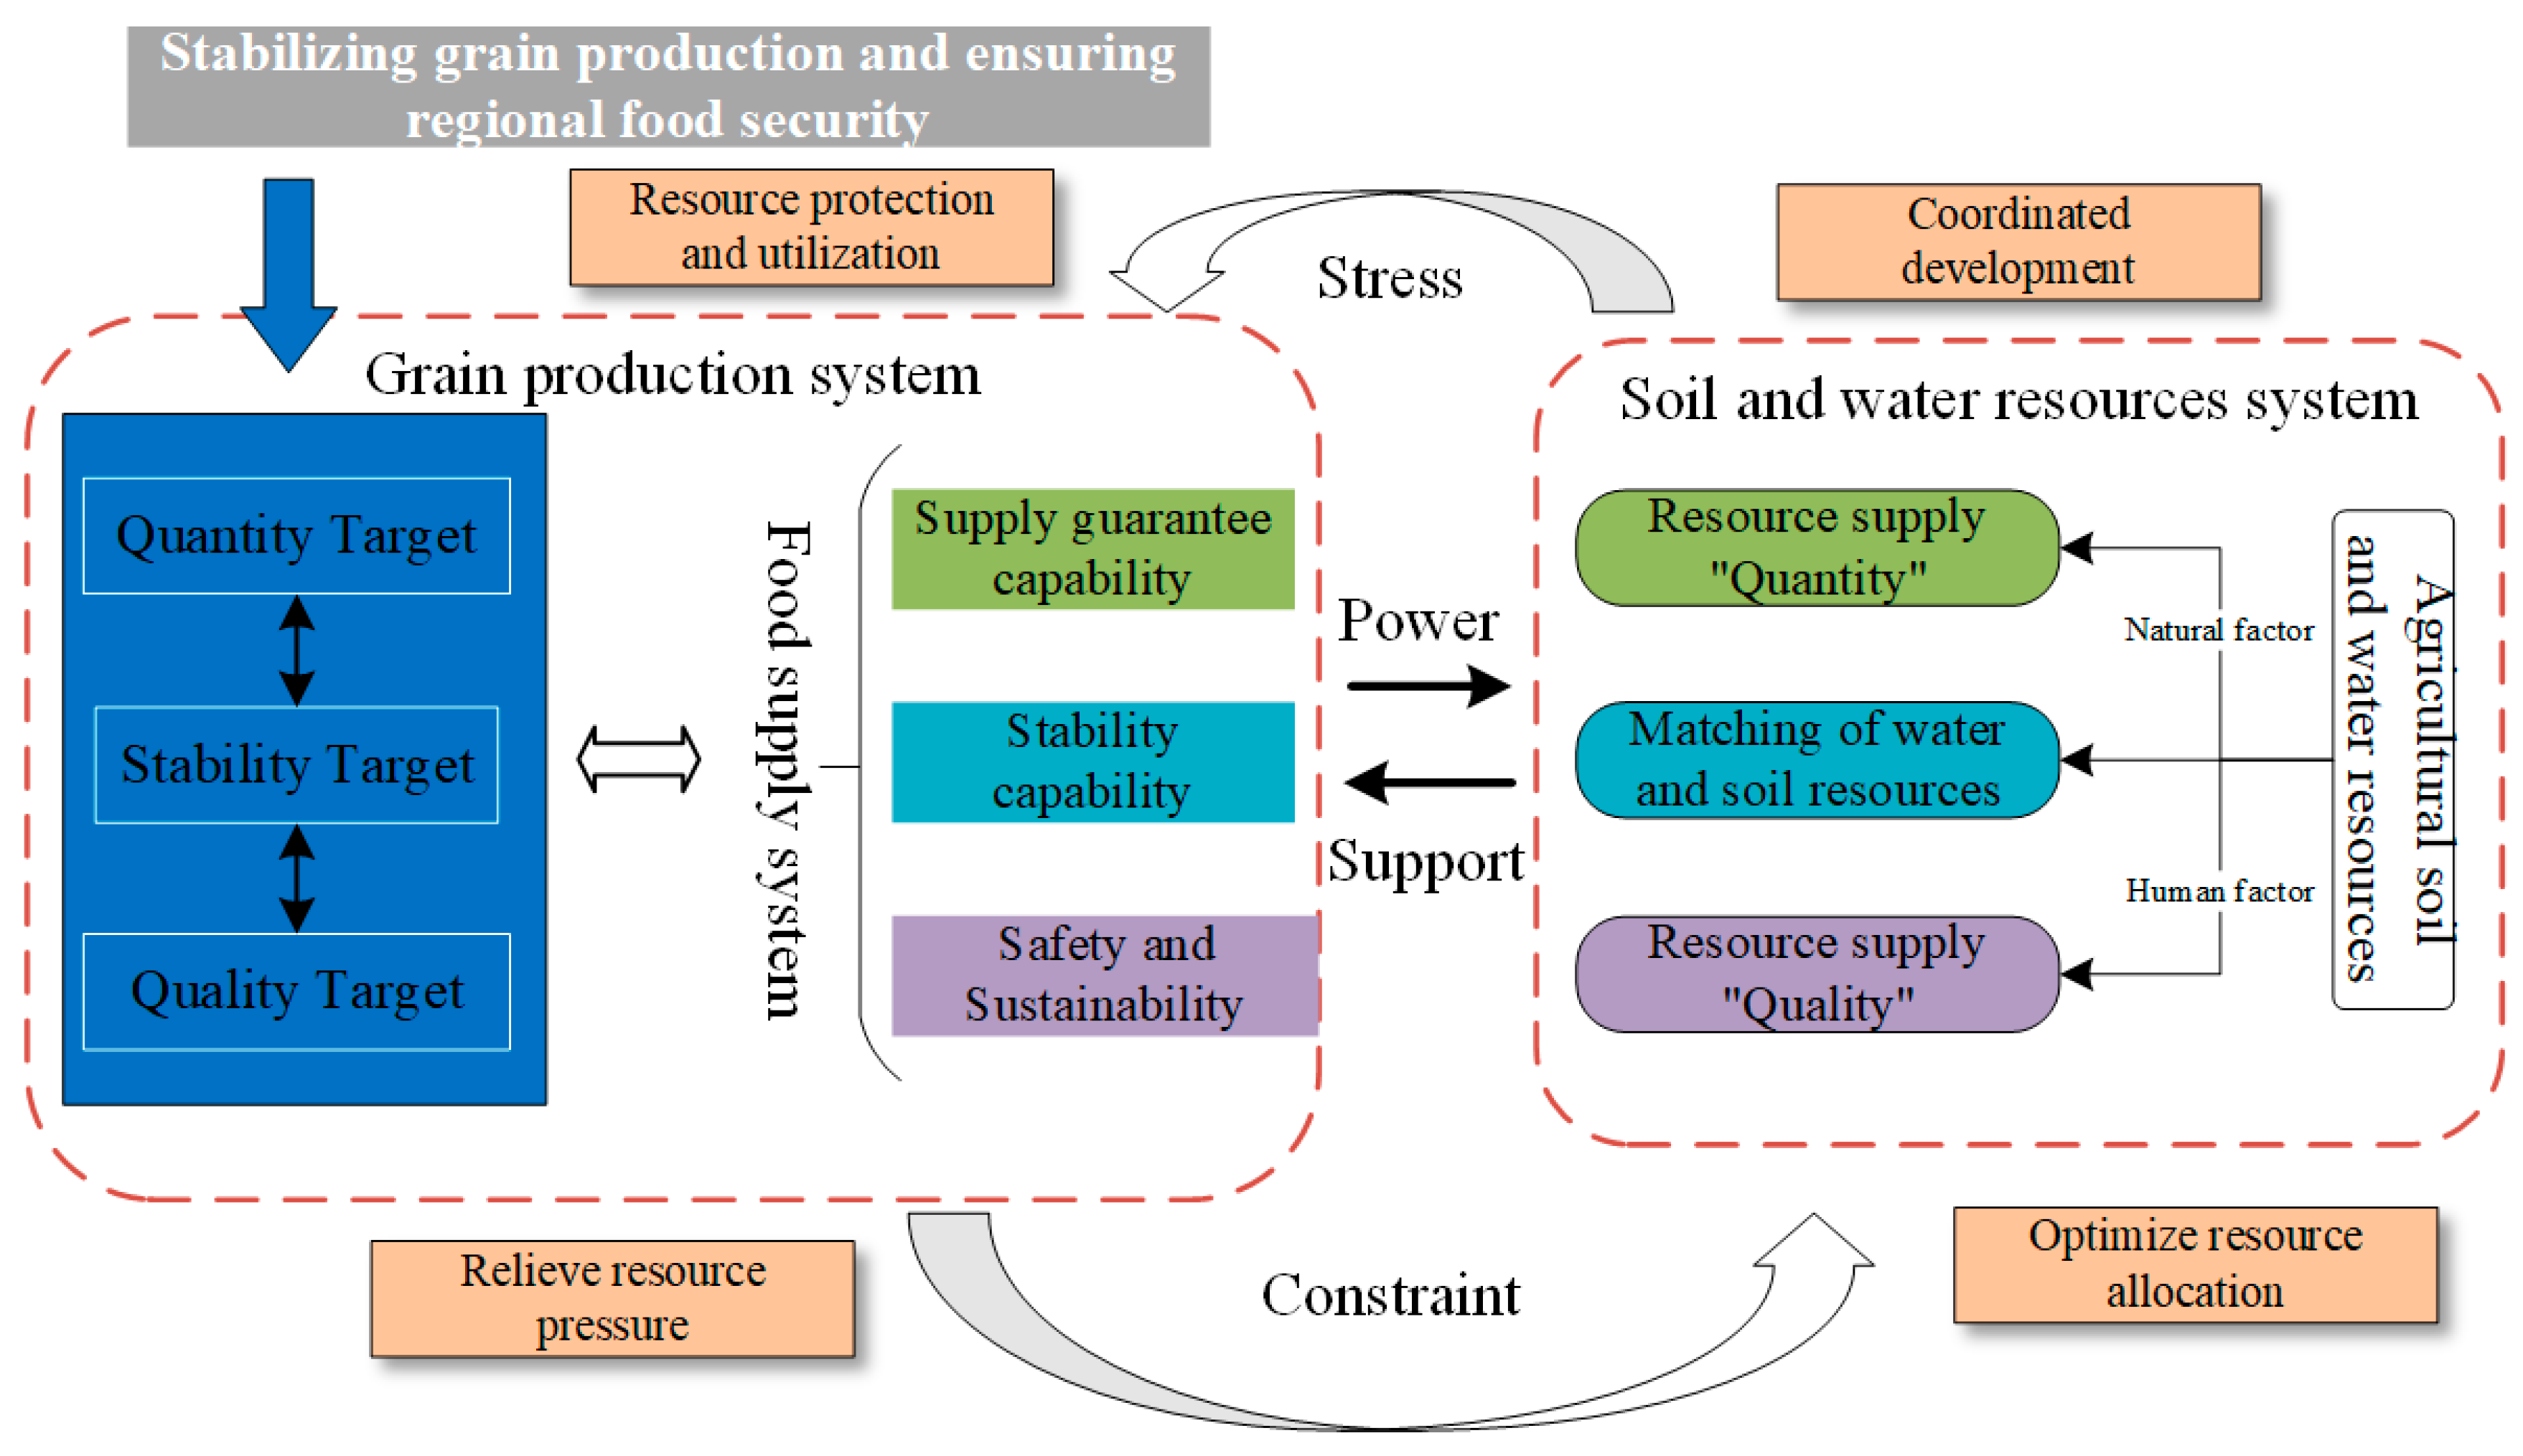
2.1.1. Logical Analysis of Water and Soil Resource Matching and Grain Production

Water and soil resources provide essential support for grain production. Agricultural water and land resources are the basic elements of grain production, and they are also the key to maintaining regional grain stability and even national food security. Based on the endowment of soil and water resources, it is of great significance to analyze the influence of factor input on grain production for further optimizing resource allocation [31]. Grain production needs the support of factor resources, and improving the efficiency of resource utilization can effectively provide a stable resource environment to reduce grain production losses [32]. The quantity and quality of agricultural resource factors directly affect the allocation of resources, and then affect whether the actual production of grain can be guaranteed. Therefore, this paper attempts to explore the coupling logic between agricultural water and soil resources and grain production from the perspective of resource endowment. Firstly, from the perspective of the quantity of the resource supply, grain production cannot be separated from soil and water resources, and water and arable land resources are the supply factors of agricultural production. However, with the continuous development of the economy, the core circle in the process of urbanization continues to expand to the periphery, and the encroachment of cities and industries exacerbates the current shortage of water and soil resources, leading to instability in food security [33]. In the process of grain production, if the water resources used for crop growth are insufficient, it will directly lead to a decrease in crop yield, and even cause crop death, which is not conducive to stabilizing regional grain production capacity. Secondly, from the perspective of the quality of the resource supply, the supply of water resources and arable land resources is more influenced by human factors. Based on the assumptions of a rational economic man, farmers tend to pay more attention to their own interests in agricultural production activities than environmental conditions. Unreasonable use of water and soil resources in the process of agricultural management will increase the pressure on cultivated land, resulting in weak grain production. In addition, agricultural non-point source pollution caused by agricultural waste not only reduces the quality of cultivated land, but also causes irreversible damage to the surrounding water and ecology, hindering the sustainable development of agriculture. From the above analysis, it can be seen that people engaged in agricultural production and management prefer to invest a sufficient quantity and a superior quality of resources to improve output, but the “quantity” and “quality” inputs of agricultural production resources need to be maintained in a dynamic balance.
Grain production provides an impetus for the protection and utilization of water and soil resources. The ultimate goal of grain production is to ensure food security, pursue an increase in yield while stabilizing grain production, and enhance grain supply capacity. To ensure grain production and regional food security, it is necessary to establish a “big food view” to achieve quantitative, qualitative, and stability goals, so that the grain supply system has the ability to ensure grain production and stability, and to further achieve sustainable agricultural development on the basis of quality and safety. Grain production is restricted by the endowment of factor resources, which in turn can provide power for the utilization of agricultural water and soil resources. The contrast between the large and continuously growing population base in China and the decreasing quantity and quality of arable land resources is constantly becoming starker, directly determining the changes in the quantity and quality of arable land per capita. The shortage of agricultural irrigation water directly affects the productivity of arable land [34]. With the introduction of various rules and regulations by the state, local governments are paying more attention to the protection of agricultural water and cultivated land within their jurisdiction and strengthening the awareness of farmers regarding the protection and utilization of water and soil resources.

2.1.2. Coupling Mechanism of Water and Soil Resource Matching and Grain Production

The theory of coupled coordination is based on the formation of a composite system by two or more independent systems influencing and interacting with each other through various channels. Within this composite system, multiple independent systems become subsystems, and these subsystems interact and permeate each other to promote the coordinated development of the subsystems. There is an interaction mechanism between agricultural water and soil resource matching and grain production, where they are interdependent, mutually supportive, but also have coercive and restrictive effects. Agricultural water and soil resources support grain production, while in turn, grain production provides an impetus for the coordinated use of agricultural water and soil resources. Firstly, agricultural water and soil resources are the foundation of grain production; they can increase grain productivity and ensure effective regional grain supply. Without adequate water and soil resources, grain production will face crises, leading to insecurity in the grain supply. Therefore, there is a mutual dependence between them. Efficiently using water resources and arable land in agricultural activities promotes the coordinated development of water and soil resources with grain production. Conversely, ensuring regional food security necessitates the continual enhancement of the grain supply capacity and levels, while effective grain provision relies on the rational allocation of agricultural land and water resources; these two aspects are mutually reinforcing. Secondly, the insufficiency in both the quantity and quality of agricultural water and soil resources will have an impact on grain production, leading to certain stresses on agricultural water and soil resources. The excessive utilization of resources not only leads to an increase in resource consumption, but also damages and pollutes water and cultivated land resources, leading to a decline in the quality of soil and water resources, as well as having adverse effects on grain production. When problems are exposed in grain production, administrative forces play a regulatory and restrictive role in the utilization of water and soil resources in the agricultural production process, promoting the scientific, rational, and efficient utilization of water and soil resources by agricultural production and operation entities and coordinating the development of agricultural water and soil resources with grain production. Finally, agricultural land and water resources provide factor support for agricultural production and ensure that the quantity target is met at the lowest level of grain production. To achieve the quality target and stability target, it is necessary to further adjust the resource mismatch caused by human factors and improve the coupling and coordination level of the two systems. At the same time, the sustainable development of grain production will provide a good ecological environment as a foundation for the natural resource system and improve agricultural production conditions, and grain production will in turn provide an impetus for the coordinated use of agricultural land and water resources.
This study mainly starts from the grain production side and clarifies the interaction mechanism between agricultural water and soil resource matching and grain production with the help of coupling coordination theory, which provides a solid theoretical basis for further system construction and empirical analysis. The theoretical framework of coupling agricultural soil and water resource matching with grain production is shown in Figure 1.

2.2. Study Area and Data Sources

According to scholars’ definition of the northeast black soil zone and the northeast typical black soil zone [35], the northeast black soil zone is an area with a high concentration of black soils, black calcareous soils, chestnut calcareous soils and gray forest soils. The northeastern typical black soil area is an area of concentrated black soil and black calcareous soil. In view of the fact that black soil and black calcareous soil have excellent soil properties and are more representative when applied to agricultural production, this paper selected the typical black soil area in Northeast China as the study area. The geographic coordinates of the typical black soil area in Northeast China are 39~54° N and 115~135° E. The cultivated land area is 18.53 million hectares, accounting for approximately 12% of the global black soil area. It is mainly distributed in Hulunbeier Grassland, Xing’an Mountains, Sanjiang Plain, Songnen Plain, parts of Liaohe Plain, and the Changbai Mountain area. The areas involved include Heilongjiang Province, Jilin Province, the north-central part of eastern Liaoning Province, and the four eastern leagues of the Inner Mongolia Autonomous Region. The typical black soil area in the northeast is located in the temperate continental climate and temperate monsoon climate zone, with cold and dry winters, hot and rainy summers, and an average annual rainfall of 400–700 mm, which makes the climate suitable for the growth of food crops (Figure 2).
Different sources of data were used for this article. To screen out the concentrated distribution areas of black soils and black calcareous soils to obtain the scope of the typical black soils in Northeast China, a 1:1 million soil map of the second national soil census released by the Center for Resource and Environmental Science and Data of the Chinese Academy of Sciences (CAS), Arcgis10.2 was used. We further screened out the specific cities in the study area by superimposing the boundaries of the provinces and cities. The study also collected data from 17 municipalities in the northeast typical black soil region for the period of 2005–2021. In this case, the data on crop blue water, green water evapotranspiration, and effective precipitation were obtained using CROPWAT8.0 software. Additional data were gathered from the national meteorological station from the Center for Resource and Environmental Science and Data of the Chinese Academy of Sciences (CRESD), including daily maximum and minimum temperature, hours of light, wind speed, and monthly average precipitation during the crop growth period. Crop regulation coefficients were derived from the relevant standards in the FAO database. Disasters and affected areas were sourced from the China Rural Statistical Yearbook (2005–2021). The indicators of effective irrigation area, production factor input, and agricultural output were sourced from the statistical yearbooks and statistical bulletins of relevant provinces and cities in Northeast China.

2.3. Research Methodology

A. Water footprint accounting. In 2004, Ref. [36] further developed the concept of the water footprint based on virtual water. This makes up for the inadequacy of traditional water accounting, which only emphasizes blue water and comprehensively describes the close connection between human consumption patterns and freshwater ecosystems. In grain production, the water footprint is the amount of water consumed during crop production and consists of the blue water footprint, green water footprint, and gray water footprint. In addition, in order to clarify the issue of water for agricultural production linked to rain-fed and irrigated agriculture, based on the core concepts of the global agricultural water use paradigm, Ref. [37] established a comprehensive analytical framework for agricultural water use in China, measuring the amount of water available for food crops in a broad sense with blue and green water. The focus of this paper was on accounting for crop water requirements during the reproductive period in order to optimize the planting structure of food crops and adjust the pattern of grain production. The gray water footprint is subject to greater human influence, so the blue water footprint (WFblue) and green water footprint (WFgreen) were chosen to measure the amount of water required for the production of regional food crops, and the gray water footprint was not considered for the time being. The blue water footprint represents the total amount of surface and groundwater consumed during crop production, and the green water footprint represents the amount of water stored in soil aquifers and consumed through crop evapotranspiration.
Considering the characteristics of the cultivation structure in the study area and the availability of data resources, the CROPWAT8.0 software embedded in the Penman–Menteith formula was used in this paper to measure the crop blue water and green water evapotranspiration as well as the effective precipitation. We modelled the water requirement per unit mass of a food crop with the help of crop evapotranspiration and calculated the water footprint per unit mass of different food crops. Furthermore, the blue water footprint, green water footprint, and total water footprint of regional food crop consumption were obtained. The specific calculation formula is as follows:
WFP = WFP green + WFP blue = ( 10 d = 1 lg P ET green ) / Y + ( 10 d = 1 lg P ET blue ) / Y
E T g r e e n = min ( E T c , P e f f )
E T b l u e = max ( 0 , E T c P e f f )
E T c = K c × E T 0
P e f f = { P × ( 125 0.6 × P ) , P 250 / 3 125 / 3 + 0.1 × P , P > 250 / 3
In the formula above, WFP is the water footprint per unit mass of the crop. WFgreen and WFblue are, respectively, the green water footprint and blue water footprint of crops per unit mass. The water requirement per unit area of the crop is equal to 10 times the cumulative evapotranspiration of the crop during the growth cycle, lgp is the number of days in the growing period of the crop, and Y is the yield per unit area of the crop. ETgreen is the crop green water evapotranspiration, taking the minimum of the total crop evapotranspiration ETc and the effective precipitation Peff during the crop’s reproductive period. The irrigation water requirement is derived from the difference between the crop’s water requirement and the effective precipitation amount. If the effective precipitation is greater than the crop’s water requirement, then the crop irrigation demand is 0 and ETblue takes 0. Kc denotes crop conditioning coefficients. ET0 represents the reference crop evapotranspiration, calculated using the standard Penman–Menteith formula recommended by the Food and Agriculture Organization of the United Nations (FAO). P denotes the amount of precipitation that falls during the crop’s reproductive period. Peff representing effective precipitation, was derived using calculations recommended by the USDA Soil Conservation Service.
Based on the water footprint per unit mass of the crops calculated in the above equation and combined with the regional production of each food crop, the total water footprint of the production of the five food crops in region i was obtained, WFi. In Equation (6), Y’ is the total regional grain crops production, i denotes the region, and j denotes the food crop.
W F i = i = 1 n W F P × Y i j
B. Coupled coordination degree model. The matching of water and soil resources is an important foundation for maintaining stable and coordinated grain production. On the one hand, a good match between water and soil resources facilitates the restructuring of the pattern of grain production, thereby increasing the integrated grain production capacity. On the other hand, a reasonable pattern of grain production can, to a certain extent, improve the state of regional water and soil resource allocation, promote water and soil conservation, and stabilize agro-ecology. Based on the above analysis, there is a correlation between water and soil resource matching and grain production. The coupled coordination degree model is widely used when exploring the coupled coordination relationship between two subsystems [38]. Therefore, this paper adopts the coupled coordination model to explore the relationship between water and soil resource matching and grain production in the typical black soil area of Northeast China.
We set the variable ui (i = 1,2,···,n) as the subsystem ordinal covariate for the two subsystems of water and soil resource matching and grain production. The value of the j th indicator for the ith ordinal covariate is Xij. Among them, xmax and xmin represent the maximum and minimum values of the ith order parameter, respectively. The normalized values of the positive and negative indicators are calculated as follows:
u ij = { ( X ij x min ) / ( x max x min ) , P o s i t i v e ( x max X ij ) / ( x max x min ) , Negative
In Equation (7), uij is the normalized value.
The degree of orderliness of the indicators within the subsystem of water and soil resource matching and grain production is further calculated.
u i = j = 1 n λ i j u ij , j = 1 n λ i j = 1
In Equation (8), ui is the ordering degree of the subsystem and λij is the weight of each evaluation index.
The coupling function reflects the degree of interdependence and interaction between systems. For the water and soil resource matching subsystem U1 and the grain production subsystem U2, the coupling degree function can be constructed in the following form.
C = 2 U 1 U 2 / ( U 1 + U 2 ) 2
The system coupling degree C ∈ [0, 1]. A larger value of the coupling degree C indicates that the two systems are better coupled and vice versa.
In order to further reflect the overall effect of the coordinated development between the systems and to make up for some of the deficiencies of the coupling degree function, the coupling coordination degree model is introduced. It is expressed as
D = C T , T = α U 1 + β U 2
In Equation (10), D is the degree of coupling coordination, and T is the composite reconciliation index between water and soil resource matching and grain production. α and β denote the weights of the two subsystems, water and soil resource matching and grain production, respectively, on the coordination effect of the total system. We set α = β = 0.5 to calculate the reconciliation index. Referring to the categorization criteria proposed by existing studies [38], the coupling degree C and coupling coordination degree D were divided into four stages using the uniform distribution function method (Table 1).
C. Obstacle model. In theory, the well-coordinated development of agricultural water and soil resources and grain production systems is the most ideal state, but in reality, in each subsystem, there will always be some indicators at a low level, pulling down the overall level of the system, becoming a “short board” restricting the overall coordinated development of the system; such factors are called obstacle factors. By identifying the low-level factors inside the system, the obstacle degree model uses the thinking of “making up for the shortcomings” to improve the level of obstacle factors, so as to realize the orderly utilization of resources inside the system and improve the level of grain production. Three basic variables, namely the obstacle degree (Oij), index deviation degree (Dij) and factor contribution degree (Fi), are introduced in the construction of the obstacle degree model. Among them, the factor contribution degree represents the contribution degree of the i index to the whole system, which is generally expressed by the indicator weight wi. The specific formula of the model is as follows:
O ij = D i j w i i = 1 m D i j w i
In Equation (11), the obstacle degree (Oij) represents the impact degree of the overall system of the i index of the j-th evaluation object and the index deviation (Dij) represents the difference between the actual value and the optimal value of index i of the j-th evaluation object. It is calculated according to the formula Dij = 1 − rij, where rij is the standardized processing value of each index. wi indicates the indicator weight.
Furthermore, the formula for calculating the obstacle degree of the u system of the j-th evaluation object is as follows:
O uj = u j = 1 u j O i j
In Equation (12), Ouj represents the obstacle degree of the u-th system of the j-th evaluation object, and ui is the number of indicators of the u-th system, u = 1, 2 in this paper.

2.4. Construction of Index System

Firstly, we established an indicator evaluation system to measure the matching of water and soil resources in agriculture. The water and soil resource matching coefficient is an important indicator tool to reflect the appropriateness of regional agricultural water and soil resources, which is used to describe the relationship between water resources and arable land resources in a certain region in terms of spatial and temporal quantities for agricultural production. The measurement of regional agricultural water use can be performed with the help of the water footprint methodology and the further calculation of generalized water and soil resource matching coefficients. The higher the soil–water resource matching coefficient, the higher the temporal coordination between agricultural water resources and cropland resources. In this paper, the generalized matching coefficient method was used to measure the matching degree of soil and water resources, and the matching coefficient (MR1) was used to characterize the allocation degree of agricultural soil and water resources system. The specific formula is as follows:
R i = W F i / L i
In Equation (13), Ri denotes the soil and water resource matching coefficient for region i. Li denotes the area of cultivated land in region i.
Secondly, it was necessary to establish an indicator system for the grain production system. Changes in grain production are influenced by regional resource endowments, factors of agricultural production inputs, and the value of agricultural output. The basic elements of agricultural production include water and arable land, and the amount of regional water resources determines the size of the effective irrigated agricultural area. Climatic factors in natural endowments are equally important in influencing grain production. Changes in climatic conditions affect localized damage to agricultural production, with corresponding changes in grain production. Therefore, effective irrigated area (NE1) and the proportion of disasters (NE2) (the ratio of disaster-affected areas to disaster-unaffected areas) were selected from the natural endowment as indicators for examining the pattern of food production [39,40]. Factor inputs into agricultural production mainly include land, labor, farm materials, and agricultural machinery affected by technological progress, etc. We selected cultivated land area (AF1), agricultural labor force (AF2), grain sowing area (AF3), fertilizer application rate (AF4), and total power of agricultural machinery (AF5) as evaluation indicators for agricultural production input factors. In addition, agricultural output reflects grain yield and agricultural economic value. As rational economic individuals, farmers will adjust their crop planting structure based on production costs and economic benefits. Therefore, unit yield (AO1) and gross agricultural output (AO2) were selected as measures of agricultural output.
To sum up, this study used soil and water resource matching to characterize the agricultural soil and water resource system, measured it with specific indicators of the soil and water resource matching coefficient, and constructed nine indicators to evaluate the grain production system based on the three dimensions of natural endowment, production factor input, and agricultural output. The evaluation index system of the agricultural soil and water resource system and the grain production system is shown in Table 2.

3. Results

3.1. Analysis of the Matching of Water and Soil Resources under the Water Footprint Perspective

The composition of the water footprint per unit mass and trends in the water footprint of major food crops are important factors to assess. The water footprint per unit mass measures the amount of water required to produce a unit weight of that food crop, reflecting both the degree of water consumption and the level of yields for that type of crop. The smaller the water footprint per unit mass of the crop, the less water is consumed to produce one unit of that food crop, and the higher the level of crop yields for a given amount of total water resources. From Table 3, the annual average unit mass water footprint of five grain products displays significant differences in the WFblue, WFgreen, and WFtotal of each crop’s unit mass. The results indicate that soybeans have the largest water footprint per unit mass, at 2.28 m3/kg, followed by rice, while tubers have the smallest water footprint per unit mass, at 0.5 m3/kg. Comparing the three major cereals, rice has the largest water footprint per unit mass at 1.75 m3/kg, and the WFblue per unit mass is higher than the WFgreen, reflecting the massive amounts of water consumed during rice production in the typical black soil region in Northeast China, requiring a large amount of surface water and a groundwater irrigation supply. This finding is in line with previous studies [41]. The smallest water footprint per unit mass is observed for maize, at 0.53 m3/kg, and the WFblue per unit mass is much lower than the WFgreen. This indicates that the northeast region, as the main maize-producing area, has a centralized and continuous large-scale planting structure that is unable to meet the conditions of good irrigation, and maize production in the region mainly relies on precipitation to supply water. Ref. [42] studied the production water footprints of major crops in the Beijing–Tianjin–Hebei region and concluded that maize is dominated by a green water footprint throughout its growth period, concluding that this finding is in line with previous studies. Compared with cereals, the water footprint per unit mass of soybean is 1.3, 3.2, 4.3, and 4.6 times larger than that of rice, wheat, maize, and tubers, respectively, reflecting the huge amounts of water consumed during soybean production and the low yields, making soybean less cost-effective to cultivate in comparison with other food crops.
We analyzed the temporal changes in the WFblue, WFgreen, and WFtotal of five food crops in the typical black soil zone of Northeast China from 2005 to 2021. Based on the results in Figure 3, taking 2005 as the base period, the average annual growth rates of the WFblue, WFgreen, and WFtotal of the five food crops in the region during the 16-year period were 4.48%, 3.68%, and 3.97%, respectively, with an overall upward trend (Figure 3I). Rice’s blue and green water footprints converged with the change in the total water footprint, experiencing a steady rise followed by a significant increase, peaking in 2019. This is due to the low percentage of crops affected in the northeast in 2019 and a significant increase in paddy production. This result is consistent with previous studies [43]. The water footprint changes of wheat, soybeans, and tubers all experienced two peaks. The water footprint of soybeans is highly fluctuating, which may be related to the local policy of adjusting the soybean planting area over time. If the market price of soybeans is high that year, the farmers will choose to expand their planting area; if the price falls, the planting area is significantly reduced. From Figure 3IV,V, it is clear that the water footprint of soybeans from 2009 to 2015 trends in the opposite direction to that of maize. This shows that while the soft and hard technologies of food cultivation have progressed, the adjustment to the national structure of grain cultivation has significantly reduced the proportion of the soybean planting area, and maize has become its main substitute. This finding is in line with previous studies [44]. The WFtotal of wheat and tubers has stabilized within 1.5 billion m3, and the WFblue and WFgreen of both crops display the same trend as the total water footprint, which reflects the low area of wheat cultivation in the northeast due to the poor match between climatic conditions in the region and the water requirements of wheat during its reproductive period. Among the five food crops examined in this study, only rice has a higher WFblue than WFgreen, while the other four crops have a lower WFblue than WFgreen. This indicates that rice occupies most of the irrigation water for grain crops and is the main irrigation crop in the study area. This result contradicts previous studies. Ref. [45] found that maize consumes the most water among the major crops in the three northeastern provinces. A possible explanation for this is that maize is widely grown in the region and therefore the total actual water consumption of maize is the largest, whereas the focus of this paper is on the water footprint per unit of mass. The difference between the total WFblue of maize and the total WFgreen is large, with the mean WFgreen (28.6 billion m3) being 3.81 times higher than the mean WFblue (7.5 billion m3), suggesting that local maize cultivation is less dependent on irrigation. Based on previous studies, the findings of this paper are confirmed [46].
The regional characteristics of and spatiotemporal differences in agricultural water and soil resource matching were assessed. According to the formula of the matching coefficient of water and soil resources in generalized agriculture, the matching degree of water and soil resources in each region of the typical black soil zone of Northeast China from 2005 to 2021 was calculated (Table 4). The overall result of the matching coefficient of agricultural water and soil resources shows a steadily increasing trend. When previous scholars studied the matching characteristics of soil and water resources for spring maize in Liaoning Province, they also came to the conclusion that the matching status of soil and water resources for regional agriculture is improving as a whole [47]. The coefficient reached its maximum value of 0.65 million m3/hm2 in 2019 and 2021 and its minimum value of 0.34 million m3/hm2 in 2007. The overall adaptability of regional agricultural water resources to arable land resources has slowly improved. Compared with 2005, the matching coefficient of water and soil resources of the northeast typical black soil region as a whole increased from 0.37 million m3/hm2 to 0.65 million m3/hm2 in 2021, representing a large increase. This reflects that the agricultural water resources in the region tend to be coordinated with the arable land resources. From a spatial perspective, there are significant differences in the matching coefficients of water and soil resources across regions. Tongliao, Qitaihe, Changchun, Songyuan, and other cities display relatively smooth changes in the matching coefficient of water and soil resources, and the extreme difference is lower than 0.2 million m3/hm2; meanwhile, Chifeng and Hegang cities display significant changes in the matching coefficient of agricultural water and soil resources, and the extreme difference is higher than 0.9 million m3/hm2. Based on the average level of the agricultural water and soil resource matching coefficient, the highest annual average water and soil resource matching coefficient is found to be 0.88 million m3/hm2 in Hegang City, while the lowest is 0.21 million m3/hm2 in Jiamusi City, with a range of 0.67 million m3/hm2, indicating a significant difference in the allocation of water and soil resources between regions. In the study area, only Hulunbeier, Chifeng, Harbin, Hegang, Suihua, Changchun, and Siping have an annual average soil–water resource matching coefficient that is higher than the overall average of 0.46 million m3/hm2 in the northeast typical black soil region. This indicates that the use of agricultural water and soil resources in the above regions is relatively reasonable, and able to meet the needs of agricultural production. The matching of agricultural water resources and arable land resources in most regions displays an improving tendency, but is still lower than the average level.

3.2. Analysis Coupling of Water and Soil Resource Matching and Grain Production

The first step is to conduct temporal evolution analysis in the typical black soil area of Northeast China for the period of 2005–2021. The agricultural water and soil resource matching ordinal covariate U1, the grain production ordinal covariate U2, the degree of coupling C, and the degree of coupling coordination D are shown in Figure 4. The temporal changes in the order parameters of each subsystem can be seen from 2005 to 2021. The matching order parameters of water and soil resources and the order parameters of grain production in the typical black soil areas of Northeast China show a steady growth trend. In addition to this, the degree of matching of water and soil resources is higher than that of grain production, and the benign allocation of regional agricultural water and soil resources drives grain production. Ref. [48] concluded that the degree of water–soil matching has a significant positive impact on the water use efficiency of grain production, which objectively reflects that a good degree of matching of water and soil resources can improve grain production. After 2018, the values of the ordinal covariates of grain production catch up with the values of the ordinal covariates of water and soil resource matching. This reflects that grain production is artificially adjusted in order to promote the coordinated use of water and arable land resources in local agriculture. In terms of the coupling relationship, the coupling degree values of agricultural water and soil resource matching and grain production during the period of 2005–2021 ranged from 0.9 to 0.96, with a high level of coupling. From the perspective of coupling coordination relationship, the coupling coordination degree value between agricultural water and soil resource matching and grain production increased from 0.39 in 2005 to 0.51 in 2021. The coupling coordination stage evolved from medium coupling to high coupling coordination but has not yet reached an optimal coupling coordination state.
The second step is to analyze the spatial differences in the coupling degree and coupling coordination degree of the two systems of agricultural water and soil resource matching and grain production in the cities of the typical black soil area in Northeast China between 2005 and 2021 (Table 5). Some scholars studied the matching patterns of agricultural water and soil resources in the northeast region for the period from 1997 to 2002, revealing that regional agricultural water and soil resources were poorly matched and varied greatly within the region [49]. However, as environmental issues have become more prominent, agro-ecological issues have been emphasized and further addressed. In the past fifteen years, the coupling and coordination between agricultural water and soil resource matching and grain production in various regions has significantly progressed, and regional differences have narrowed.
Specifically, in terms of the coupling degree, the coupling degree of water and soil resource matching and grain production in each region in 2005 and 2021 was generally at a high level. Jiamusi changed from a fly-down stage to a high-level coupling stage, and the significant improvement in the efficiency of local agricultural water and soil resources use contributed to grain production. Hegang degraded from a high-level coupling stage in 2005 to a break-in period. Combined with the previous analysis, it is not difficult to find that the coordination of water and soil resources in Hegang City was poor in the early period, meaning that it did not provide favorable conditions for grain production, and the mutual promotion of water and soil resources and agricultural production weakened in the later period. The result also indicates that based on the regional stage division of the coupling coordination degree, the areas in the low coupling coordination stage in 2005 were Jiamusi, Shuangyashan, and Heihe. Based on Table 5, there were 12 regions in the moderate coupling coordination stage, including Qitaihe and Hulunbeier, whereas Suihua and Harbin regions were in a high coupling coordination stage. In 2021, there were eight regions in the moderate coupling coordination stage, including Qitaihe, Hulunbeier, and Heihe, etc.; in the high coupling coordination stage, there were nine regions, including Songyuan, Baicheng, etc. Compared to 2005, in 2021, there were no regions in the low coupling coordination stage and significantly more in the high coupling coordination stage. Coupled coordination displays a shift from a low–middle–high to a middle–high stage. This indicates that the overall coupling and coordination situation in the typical black soil region of Northeast China displayed a trend of improvement, but no region has yet reached the stage of high-quality coupling coordination.

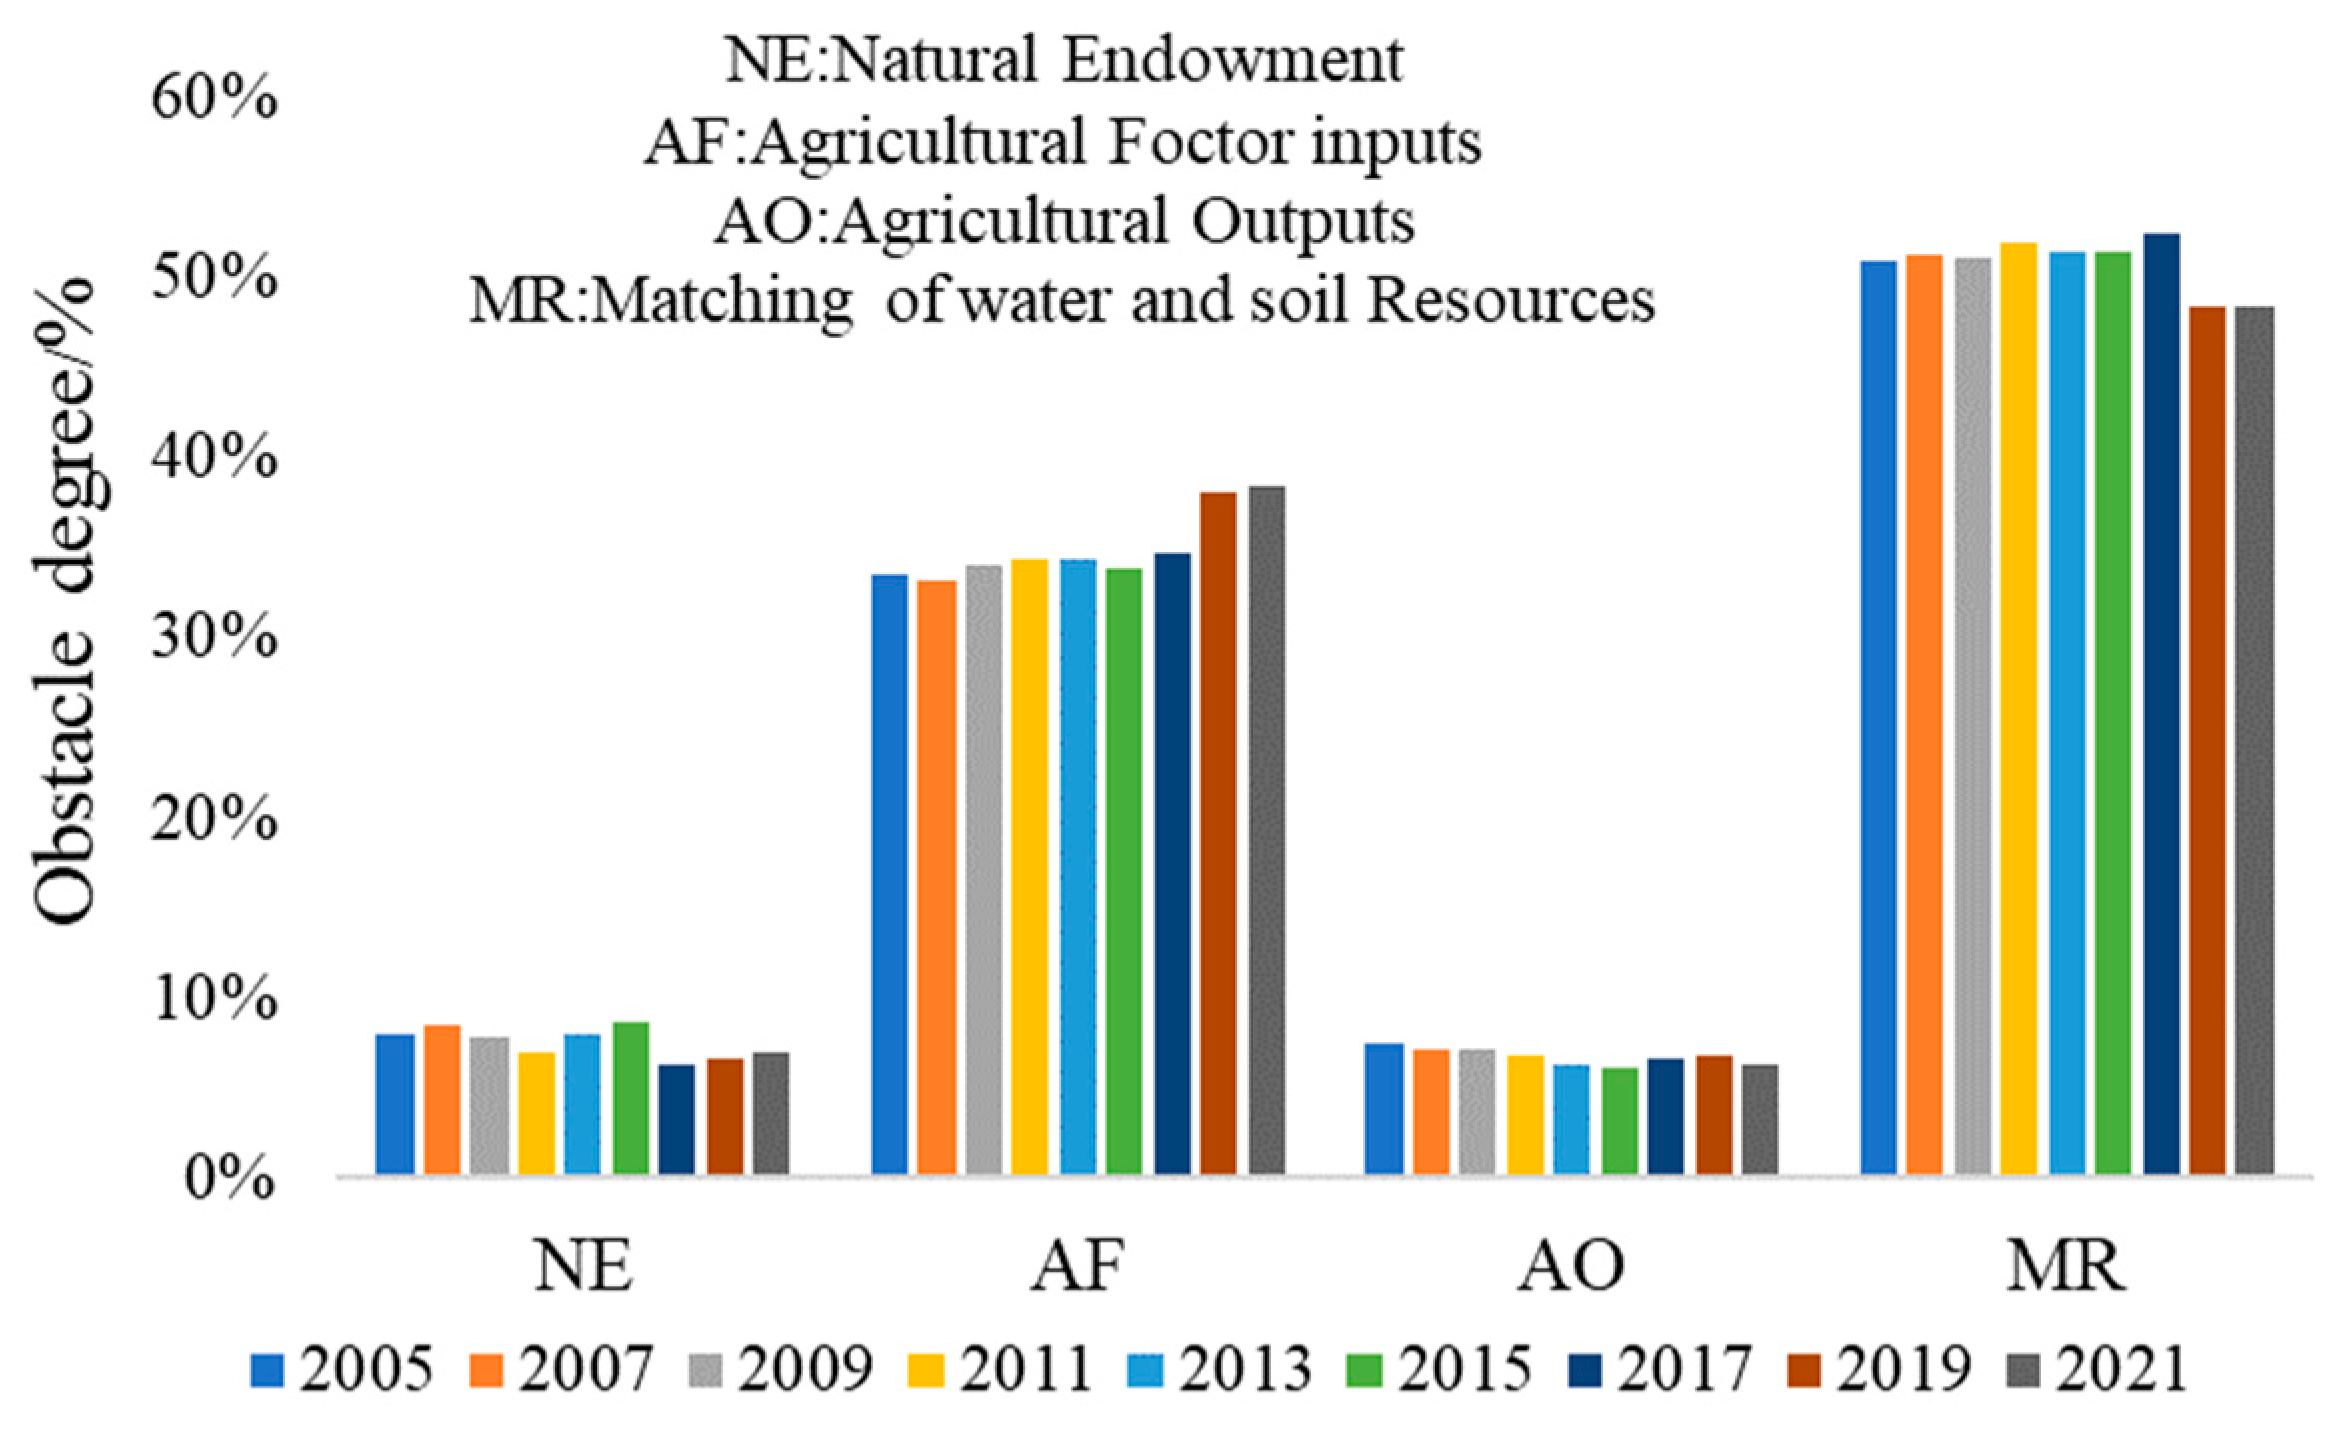
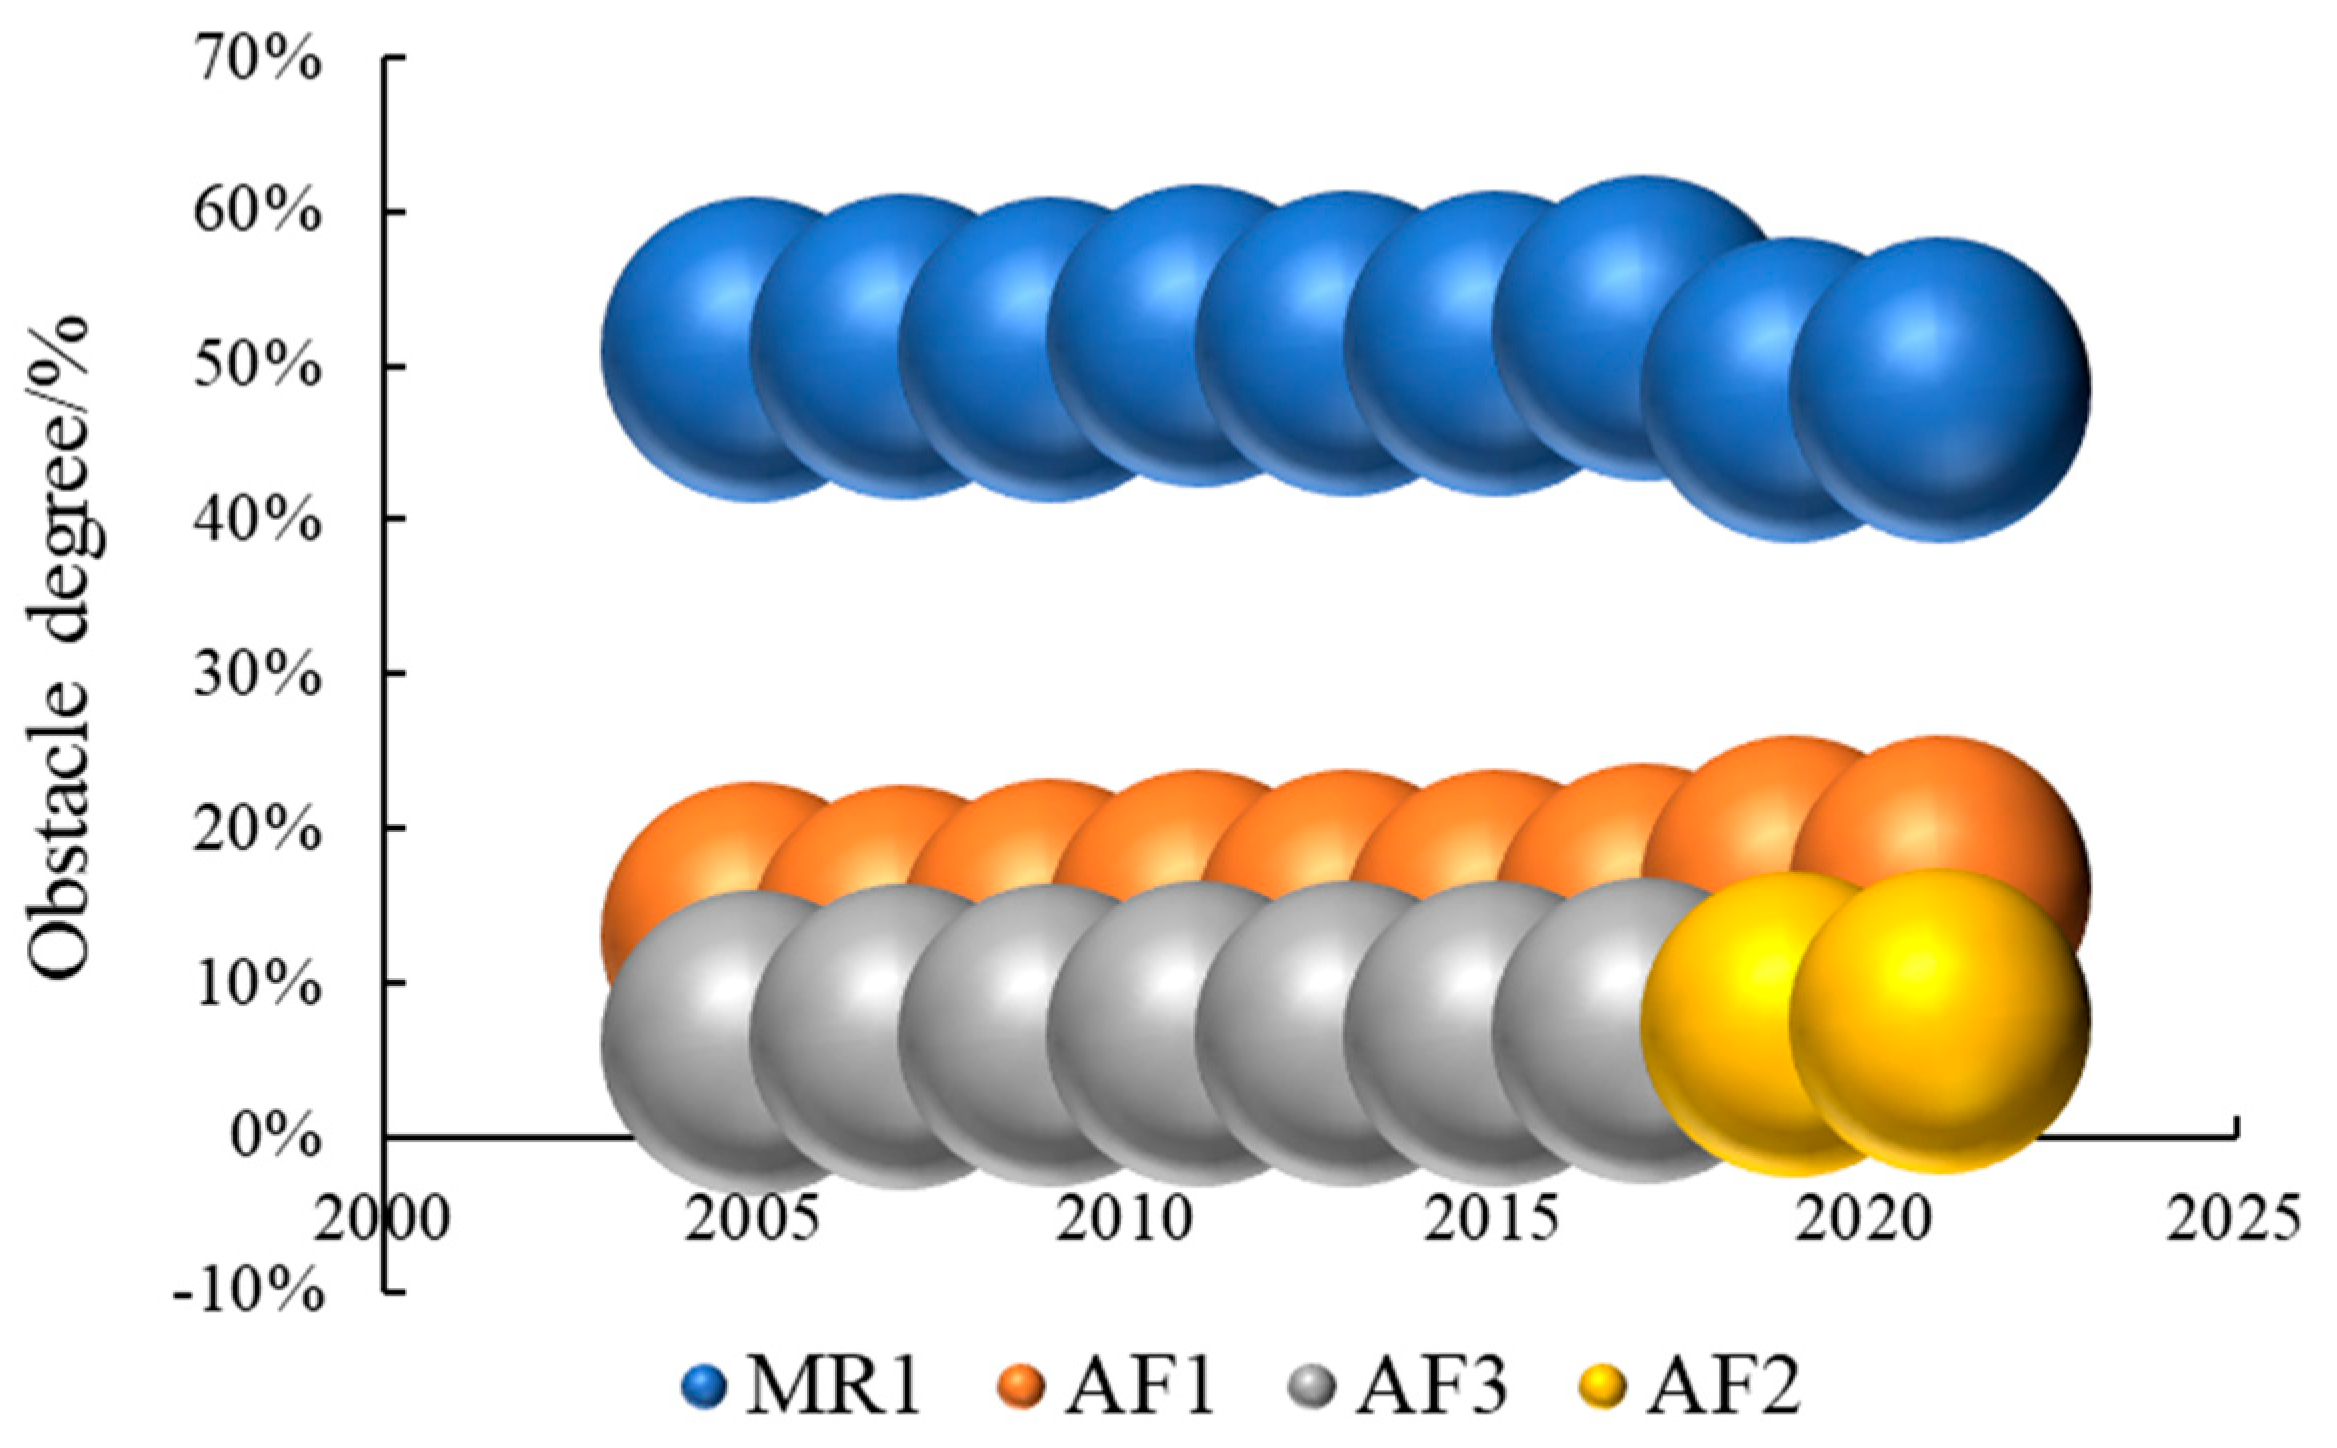
3.3. Obstacle Factors Identification

According to the above calculation of the soil and water resources system and the grain production system, it is found that the coupling and coordination relationships between the two systems show an upward trend, but the degree of coordination between regions is not strong, and all regions have not reached the high-level coupling stage of coordinated development of the system. In order to further explore the constraints affecting the overall coordinated development of the region, the obstacle factors of the coupling coordination between soil and water resource matching and grain production were identified and analyzed, and the results are shown in Figure 5. From the perspective of factor-level obstacle intensity, the matching degree of soil and water resources (MR) was always the main obstacle factor for the coupling and coordination of agricultural soil and water resources and grain production between 2005 and 2021. The overall obstacle degree was around 50%, reflecting that the allocation of soil and water resources plays a key role in the coupling and coordination of soil and water resources and grain production systems. Due to the poor matching degree of soil and water resources, the healthy development of the system may be hindered. However, the obstacle strength of the soil and water resource matching degree (MR) decreased from 51% to 48%, indicating that the constraint of the soil and water resource matching degree on the coupling and coordinated development of the system was weakened. At the same time, the obstacle degree of agricultural factor input (AF) increased year by year from 33% to 38%, becoming an important obstacle factor for the coupling and coordination of agricultural land and water resources and grain production. There is a phased change between production factor input and grain production. At the beginning, grain output increases and changes with the increase in production factor input, and then, continuous factor input slows down the agricultural production level, leading to a decrease, becoming an obstacle factor affecting the sustainable development of grain production. In addition, natural endowments (NE) and agricultural output (AO) have a small obstacle effect on the coupling and coordination of agricultural water and soil resources and grain production, and the obstacle degree is less than 10%, indicating that natural factors such as climate and agricultural output level do not restrict the agricultural water and soil resources and grain production system.
In order to clarify the feature differences of specific indicators that affect the coupling and coordinated development of the two systems, the obstacle degree of each indicator layer was calculated, and the top three obstacle factors were identified, as shown in Figure 6. Before 2018, the top three obstacle degree indexes were the matching degree of soil and water resources (MR1), the cultivated land area (AF1), and the grain sown area (AF3). After 2018, agricultural labor (AF2) replaced the grain sown area (AF3) and pushed it into fourth place, becoming one of the main obstacles for the coordinated development of the system. The input of agricultural production factors includes land, labor, capital and technology, etc. The changes in different factors have different impacts on output, while water and soil resources have always been the basic elements of agricultural production, and the allocation degree of water and soil resources is related to resource utilization efficiency and grain production capacity. The obstacle intensity of the matching degree of water and land resources (MR1) decreased slightly but remained high, indicating that irrational utilization and the misallocation of resources between water resources and cultivated land resources are still present in the process of agricultural production, restricting the improvements in grain productivity. The obstacle intensity of the cultivated land area (AF1) is between 10% and 20%, making it the second most significant obstacle factor hindering the coupling and coordination of soil and water resources and grain production. In the typical black soil area of Northeast China, the cultivated land area decreased from 32.795 million hectares in 2005 to 22.025 million hectares in 2021, a decrease of 10.77 million hectares, which hindered grain production. The third most significant obstacle factors affecting the coupling coordination of the two systems are the grain sown area (AF3) and the agricultural labor force (AF2), and the coupling degree is less than 10%. The sharp decline in cultivated land directly leads to a reduction in grain sown area. Under the dual structure of urban and rural areas, young people move to cities and old people stay behind, and the actual agricultural labor force is mainly middle-aged and old people. The decrease in the quantity and quality of the agricultural labor force is not conducive to the development of agriculture.

4. Discussion

The incoherence and mismatch of the water–soil–grain system are important factors constraining the sustainable development of grain production [50]. In addition, affected by the difference in regional water and soil resource endowment and human factors, Northeast China faces the burden of the high environmental carrying capacity of regional resources behind the high grain yield [51]. Previous studies have noticed the importance of water resources utilization [52] and land resources allocation [53,54]. However, there are few studies on water and soil resources and grain production in the literature, which undoubtedly lacks the methodological support of basic resource research in the field of agricultural production. How to stabilize the grain production capacity under hard environmental and resource constraints is of great significance to ensure grain supply in small areas and even national food security [55,56]. In light of this, this paper utilizes basic agricultural resources as a foundation to elucidate the intrinsic logic and extrinsic correlation between water and soil resources and grain production.
Therefore, stabilizing grain production capacity under hard environmental and resource constraints is of great significance for ensuring national food security. In this paper, the water footprint of five grain crops in the typical black soil area of Northeast China was measured. The results show that rice had the largest water footprint among the three grains, while maize had the smallest footprint, and soybean had a far larger water footprint than maize. Based on the water footprint characteristics of crops, the regional crop planting structure is further optimized [57]. According to the water consumption of each food crop, “water-suitable planting” can not only assist farmers in adjusting their original crop planting strategies, but also enable the government to develop more appropriate local scientific agricultural policies at a macro level. Secondly, the coupling coordination relationship and obstacle factors between agricultural water and soil resource matching and grain production systems are studied. The results show that the matching of water and soil resources and grain production in most regions promoted each other, but there were some regions where the coupling situation regressed. The most interesting discovery is that water and soil resources are the basic elements of agricultural production, but their matching status is the main obstacle factor affecting regional resources and agricultural production. In the early stage, the allocation of water and soil resources was determined by resource endowment conditions, and in the later stage, it was related to regional grain yield differences and the adjustment of crop planting structure. The regional crop planting structure and local resources, including water and soil conditions or excessive human intervention in the agricultural production process, are among the main factors causing the instability of grain production. In order to effectively address resource and production constraints in grain production, the solution should not only rely on technological innovation and progress, as well as increasing awareness of water conservation among stakeholders, but more importantly, provide effective policy support and facilitate technology diffusion [58]. However, this study is only theoretical scientific research. In the context of frequent natural disasters, the unstable international trade of agricultural products caused by local conflicts, and anti-globalization, there are differences between research results and actual agricultural production status. However, this is just a strategic arrangement for the future utilization of water and land resources, the adjustment of the grain production layout, and the optimization of agricultural structure, and has certain significance as a reference for improving national food security under the new scenario.
Compared with previous studies, this paper introduced grain production into the study of regional water and soil resource matching, and deeply analyzed the internal correlation mechanism between soil and water resource matching and grain production. From the perspective of agricultural production, this paper analyzes the allocation of water and soil resources of grain crops, the coupling effect of the two systems, and the obstacle factors. It further enriches the research content of water and soil resource matching and develops the research perspective to a certain extent. However, this paper still has some limitations. In its water footprint accounting, due to the limitations in data acquisition, the agricultural grey water footprint in the water footprint is not calculated. The agricultural pollution related to the agricultural grey water footprint is also worthy of attention and needs to be further explored by scholars.

5. Conclusions

In this paper, based on the perspective of the agricultural water footprint, the agricultural water footprint of five food crops is calculated with the help of CROPWAT software. We use the coupling coordination degree model and obstacle degree model to empirically analyze the coupling coordination relationship between the matching of agricultural water and soil resources and grain production in the typical black soil area in Northeast China. The following conclusions have been drawn: (1) The blue water footprint, green water footprint, and total water footprint of the five food crops increased annually during the period of 2005–2021. Of these, soybeans display the largest water footprint per unit mass, tubers display the smallest, and rice has the largest water footprint among the three major cereal crops. (2) The overall agricultural water and soil resource matching degree in the area shows a steady increase, and the degree of matching becomes better year by year. However, there are significant differences between regions, with the highest annual average matching coefficient of water and soil resources being observed in Hegang City and the lowest being observed in Jiamusi City. (3) From 2005 to 2021, the coupling degree between water and soil resource matching and grain production pattern remained at a high level, ranging from 0.9 to 0.96. The coupling coordination changed from a low–middle–high stage to the middle–high stage, but has not yet reached the stage of high quality. In addition, the matching degree of water and soil resources is the main obstacle factor affecting the coordinated development, and the amount of cultivated land resources, the grain sown area, and the agricultural labor force are the important obstacle factors.
In this regard, the following insights were gained. Firstly, decision makers should optimize governance by region and promote the coordinated development of water and soil resources and grain production. Harbin, Jiamusi, Hegang, Qiqihar, and Suihua rely on the Sanjiang Plain. The government should give full play to the advantages of regional agricultural production and promote the construction of high-quality farmland. The water resources for grain production in Qiqihar, Tongliao, and Siping are being excessively utilized. Therefore, it is essential to strengthen the control of the total amount of industry water use and develop an industrial layout plan that aligns with the carrying capacity of water resources. Secondly, decision makers should optimize the allocation of agricultural factors and consolidate the foundation of agricultural production. Focusing on the Jiamusi, Heihe, and Qitaihe areas with inadequate resource allocation, decision makers should aim to enhance agricultural water security and disaster prevention through the construction of farmland water conservancy facilities. It is important to develop and disseminate agricultural water-saving irrigation equipment and technologies and establish subsidies for the purchase of agricultural machinery in this field; then, the awareness of voluntary protection of agricultural water and cultivated land resources should be raised through village household publicity.

Author Contributions

Conceptualization, H.C.; methodology, H.C. and C.W.; software, H.C.; validation, H.C. and C.W.; formal analysis, H.C. and C.W.; investigation, H.C. and Y.L.; data curation, C.W.; writing—original draft preparation, H.C. and C.W.; writing—review and editing, G.W. and Y.L.; visualization, M.A.; supervision, G.W. and M.A.; funding acquisition, G.W. All authors have read and agreed to the published version of the manuscript.

Funding

This research was funded by the National Social Science Fund of China (Grant numbers [20BJY041]).

Institutional Review Board Statement

Not applicable.

Informed Consent Statement

Not applicable.

Data Availability Statement

The datasets used and/or analyzed during the current study are available from the corresponding authors upon reasonable request.

Acknowledgments

The authors would like to thank all contributors to this study.

Conflicts of Interest

The authors declare no conflicts of interest.

References

  1. Liu, X.; Xu, Y.; Sun, S.; Zhao, X.; Wang, Y. Analysis of the coupling characteristics of water resources and food security: The case of Northwest China. Agriculture 2022, 12, 1114. [Google Scholar] [CrossRef]
  2. Sun, B.; Luo, Y.; Yang, D.; Yang, J.; Zhao, Y.; Zhang, J. Coordinative management of soil resources and agricultural farmland environment for food security and sustainable development in China. Int. J. Environ. Res. Public Health 2023, 20, 3233. [Google Scholar] [CrossRef] [PubMed]
  3. Sun, Z.; Jia, S.F.; Yan, J.B.; Zhu, W.B.; Liang, Y. Study on the matching pattern of water and potential arable land resources in China. J. Nat. Resour. 2018, 33, 2057–2066. [Google Scholar]
  4. Liang, A.; Li, L.; Zhu, H. Protection and Utilization of Black Land and Making Concerted and Unremitting Efforts for Safeguarding Food Security Promoted by Sci-tech Innovation—Countermeasures in Conservation and Rational Utilization of Black Land. Bull. Chin. Acad. Sci. 2021, 36, 557–564. [Google Scholar]
  5. Yang, H.Y.; Zhao, H.F. Analysis of spatio-temporal characteristics and effects of land and water resources matching under cultivated land structure change: A case study of Heilongjiang province. J. Nat. Resour. 2022, 37, 2247–2263. [Google Scholar] [CrossRef]
  6. Zuniga-Teran, A.A.; González-Méndez, B.; Scarpitti, C.; Yang, B.; Murrieta Saldivar, J.; Pineda, I.; Peñúñuri, G.; Hinojosa Robles, E.; Irineo, K.S.; Müller, S.; et al. Green Belt Implementation in Arid Lands through Soil Reconditioning and Landscape Design: The Case of Hermosillo, Mexico. Land 2022, 11, 2130. [Google Scholar] [CrossRef]
  7. Gao, Y.; Li, P.; Hou, H.; Liang, Z.; Zhang, Y.; Qi, X. Evaluation of agricultural water and soil resource matching characteristics considering increased precipitation-derived “green water”: A case study in the Yellow River Basin, China. Mitig. Adapt. Strateg. Glob. Chang. 2023, 28, 6. [Google Scholar] [CrossRef]
  8. Xu, C.; Lin, J.; Song, M. Research on the spatial effects of water and soil matching degree on economic growth of regional agriculture based on empirical analysis during 2003–2013 in China. China Popul. Resour. Environ. 2016, 26, 153–158. [Google Scholar]
  9. Zhang, Y.; Lei, G.; Zhang, H.; Wang, H. Spatiotemporal Dynamics of Land and Water Resources Matching of Cultivated Land in Typical Basin of Sanjiang Plain—A case Study of Naoli River Basin. Chin. Agric. Resour. Reg. 2022, 43, 49–59. [Google Scholar]
  10. Abulizi, A.; Ren, Q.; Wang, Y.; Yu, J.; Long, A.; Zhang, J. Analysis on the matching characteristics and stability of oasis water and land resources in the Tarim river basin. J. China Inst. Water Resour. Hydropower Res. 2022, 20, 71–78. [Google Scholar]
  11. Gao, Y.; Qi, X.B.; Li, P.; Liang, Z.J.; Zhang, Y. Analysis on spatial-temporal matching characteristics of agricultural water and soil resources in the Yellow River Basin. J. Irrig. Drain. 2021, 40, 113–118. [Google Scholar]
  12. Wang, S.; Wang, L. Matching degree between agricultural water and land resources in the Xijiang River Basin under changing environment. Water 2023, 15, 827. [Google Scholar] [CrossRef]
  13. Jiang, Q.X.; Fu, Q.; Wang, Z.L.; Jiang, N. Spatial matching patterns of land and water resources in Sanjiang Plain. J. Nat. Resour. 2011, 26, 270–277. [Google Scholar]
  14. Zhang, Y.; Gao, C.; Liu, C.; Li, P.; Chen, X.; Liang, Z. Evaluation of agricultural water resources allocation efficiency and its influencing factors in the Yellow River Basin. Agronomy 2023, 13, 2449. [Google Scholar] [CrossRef]
  15. Peng, L.; Deng, W.; Tan, J.; Lin, L. Restriction of economic development in the Hengduan Mountains Area by land and water resources. Acta Geogr. Sin. 2020, 75, 1996–2008. [Google Scholar]
  16. Wang, J.; Xin, L.; Dai, E. Spatio-temporal variations of the matching patterns of agricultural land and water resources in typical mountainous areas of China. Geogr. Res. 2020, 39, 1879–1891. [Google Scholar]
  17. Nan, J.Q.; Wang, J.L.; Qin, A.Z.; Liu, Z.D.; Ning, D.F.; Zhao, B. Study on utilization potential of agricultural soil and water resources in northwest arid area. J. Nat. Resour. 2017, 32, 292–300. [Google Scholar]
  18. Hou, S.; Yuan, W.; Chen, J.; Wang, S.; Chen, Y.; Li, Q. Matching Pattern and Regional of Agricultural Water and Land Resources in Heilongjiang Province. Bull. Soil Water Conserv. 2022, 42, 150–157. [Google Scholar]
  19. Li, X.; Hao, J.; Chen, A. Time-space matching pattern and evaluation of agricultural water and soil resources in Shandong Province. J. China Agric. Univ. 2020, 25, 1–11. [Google Scholar]
  20. Huang, K.; Yuan, P.; Liu, G. Research on Water and Soil Resources Matching in Sichuan Province Based on DEA. China Rural Water Hydropower 2015, 10, 58–61. [Google Scholar]
  21. Yu, Y.; Wu, J.; Li, Z.; Hu, L. Spatial-temporal patterns variation of grain production and security evalution in Shandong Province. J. China Agric. Univ. 2020, 25, 176–186. [Google Scholar]
  22. Zhao, D.; Chen, X.; Han, Y.; Zhao, Y.; Men, X. Study on the matching method of agricultural water and land resources from the perspective of total water footprint. Water 2022, 14, 1120. [Google Scholar] [CrossRef]
  23. Fan, H.; Fu, W. Analysis of Water and Soil Resources Matching and Agricultural Economic Growth in China from the Percepective of Water Footprint—Taking the Yangtze River Economic Belt as an Example. Chin. J. Agric. Resour. Reg. Plan. 2020, 41, 193–203. [Google Scholar]
  24. Zhang, Y.; Li, X. Analyses of supply-demand balance of agricultural products in China and its policy implication. J. Nat. Resour. 2021, 36, 1573–1587. [Google Scholar] [CrossRef]
  25. Luan, J.; Wang, R.; Zhu, Z.; Li, T. Study on agricultural production pattern under the change of grain supply and demand in Shandong Province. Chin. J. Agric. Resour. Reg. Plan. 2021, 42, 201–209. [Google Scholar]
  26. Abbass, K.; Qasim, M.Z.; Song, H.; Murshed, M.; Mahmood, H.; Younis, I. A review of the global climate change impacts, adaptation, and sustainable mitigation measures. Environ. Sci. Pollut. Res. 2022, 29, 42539–42559. [Google Scholar] [CrossRef]
  27. Webb, R.; Buratini, J. Global challenges for the 21st century: The role and strategy of the agri-food sector. Anim. Reprod. 2018, 13, 133–142. [Google Scholar] [CrossRef]
  28. Qi, Y.; Qiang, W.; Ma, X. Spatiotemporal Pattern Evolution of Food and Nutrient Production in China. Foods 2023, 12, 3791. [Google Scholar] [CrossRef]
  29. Zhang, J.; Fang, Y.; Zheng, H.; Fan, S.; Du, T. The Spatio-Temporal Evolution of Food Production and Self-Sufficiency in China from 1978 to 2020: From the Perspective of Calories. Foods 2023, 12, 956. [Google Scholar] [CrossRef]
  30. Xia, W.; Zhang, B.; He, M.; Cui, X. The Matching pattern of water and soil resources of food crops in Beijing-Tianjin-Hebei counties from the perspective of water footprint. Chin. J. Agric. Resour. Reg. Plan. 2022, 43, 22–33. [Google Scholar]
  31. Liu, Y.; Liu, F.; Qin, A. Effects of Irrigation and Mechanical Inputs on Rice Production Efficiency Under Constraints of Water and Soil Resources. J. Huazhong Agric. Univ. 2023, 03, 67–78. [Google Scholar]
  32. Cui, N.; Liu, Z.; Dong, J. Internal Logic and Long—Term Mechanism Construction of Smart Agriculture for Reducing Losses of Grain Production. Issues Agric. Econ. 2023, 116–128. [Google Scholar] [CrossRef]
  33. Qu, L.; Li, Y.; Wang, J. Simulation and optimization of agricultural production scenarios in loess hilly and gully region. Geogr. Res. 2023, 42, 1647–1662. [Google Scholar]
  34. Liu, Y.S.; Wu, C.J. Situation of land-water resources and analysis of sustainable food security in China. J. Nat. Resour. 2002, 17, 270–275. [Google Scholar]
  35. Liu, B.; Zhang, G.; Xie, Y.; Shen, B.; Gu, Z.; Ding, Y. Delineating the black soil region and typical black soil region of northeastern China. Chin. Sci. Bull. 2021, 66, 96–106. [Google Scholar] [CrossRef]
  36. Hoekstra, A.; Chapagain, A.K.; Aldaya, M.M.; Mekonnen, M.M. The Water Footprint Assessment Manual: Setting the Global Standard; Routledge: Oxfordshire, UK, 2012. [Google Scholar]
  37. Li, B.; Huang, F. Defining the Baselines for China Agricultural Water Use in Green and Blue Water Approach. Sci. Agric. Sin. 2015, 48, 3493–3503. [Google Scholar]
  38. Luo, X.; Yuan, Q. Spatial-Temporal Coupling relationship between New Urbanization and Agricultural Technology Progress. J. South China Agric. Univ. 2017, 16, 19–27. [Google Scholar]
  39. Wang, S.; Mu, Y. Spatial pattern evolution of grain production and its impact on grain-land matching in China. J. China Agric. Univ. 2022, 27, 1–11. [Google Scholar]
  40. Yang, Z.; Cai, H.; Qin, C.; Liu, H. Analysis on the Spatial and Temporal Pattern of China’s Grain Production and Its Influencing Factors. J. Agric. Sci. Technol. 2018, 20, 1–11. [Google Scholar]
  41. Han, Y.; Li, X.; Huang, H.; Jia, D. Spatial and temporal distribution of water footprint of main crops and its influencing factors in Beijing-Tianjing-Hebei region. South-North Water Transf. Water Sci. Technol. 2018, 16, 26–34. [Google Scholar]
  42. Wang, Q.; Liu, J.; Zhao, D. Study on water footprint of main crop production in Jing-Jin-Ji Region. Water Resour. Prot. 2018, 34, 22–27. [Google Scholar]
  43. Liu, B.; Liu, Y.; Zheng, F.; Zhu, Y.; Guo, A.; Chen, D.; Yang, X.; Mei, X. Assessment Regional Grain Yield Loss Based on Re-Examination of Disaster-Yield Model in Three Northeastern Provinces. Chin. J. Agrometeorol. 2022, 43, 487–498. [Google Scholar]
  44. Chen, H.; Wang, H.; Qin, S. Study on Green Efficiency of Grain Water Resources in Heilongjiang Province from the Perspective of Water Footprint: Based on Three–stage Sbm–malmquist Index Analysis Method. Resour. Environ. Yangtze Basin 2020, 29, 2790–2804. [Google Scholar]
  45. Yin, Z.; Qin, X.; Li, C. Study on water consumption and deficiency of main crops in northeastern China. Sci. Technol. Rev. 2009, 13, 42–49. [Google Scholar]
  46. Li, B.; Niu, M.; Zhao, J.; Zheng, X.; Chen, R.; Ling, X.; Wang, Y. Agricultural Cultivation Structure in Arid Areas Based on Water–Carbon Nexus—Taking the Middle Reaches of the Heihe River as an Example. Land 2023, 12, 1442. [Google Scholar] [CrossRef]
  47. Cao, Y.; Zhang, R.; Feng, X. Matching characteristics of agricultural soil and water resources in Liaoning province based on spring corn water footprint. J. China Inst. Water Resour. Hydropower Res. 2022, 20, 295–305. [Google Scholar]
  48. Xu, Y.; Mu, Y.; Zhang, Z. The Influencing Factors and Spatial Spillover Effects of Water Use Efficiency of Grain Production in China. J. Huazhong Agric. Univ. 2022, 76–89. [Google Scholar] [CrossRef]
  49. Liu, Y.; Gan, H.; Zhang, F. Analysis of the Matching Patterns of Land and Water Resources in Northeast China. Acta Geogr. Sin. 2006, 61, 847–854. [Google Scholar]
  50. Nie, Y.; Li, X.; Jiang, W.; Liu, N. Planting structure optimization of three main grain crops in 10 northern China provinces based on water footprint method. Resour. Sci. 2022, 44, 2315–2329. [Google Scholar] [CrossRef]
  51. Cui, N.; Wang, X.; Yu, Z. Analysis Ecological Efficiency Evaluation and Influencing Factors of Cultivated Land of Grain Production in Northeast Main Production Area. Ecol. Econ. 2021, 37, 104–110. [Google Scholar]
  52. Wang, L.; Yan, C.; Zhang, W.; Zhang, Y. Water Footprint Assessment of Agricultural Crop Productions in the Dry Farming Region, Shanxi Province, Northern China. Agronomy 2024, 14, 546. [Google Scholar] [CrossRef]
  53. Geng, Q.; Liu, H.; He, X.; Tian, Z. Integrating Blue and Green Water to Identify Matching Characteristics of Agricultural Water and Land Resources in China. Water 2022, 14, 685. [Google Scholar] [CrossRef]
  54. Xu, C.; Hu, X.; Liu, Z.; Wang, X.; Tian, J.; Zhao, Z. Predicting the Evolution Trend of Water and Land Resource Carrying Capacity Based on CA–Markov Model in an Arid Region of Northwest China. Sustainability 2023, 15, 1269. [Google Scholar] [CrossRef]
  55. Luo, H.; Huang, Y.; Zhang, X. Major Challenges and Coping Strategies for Food Security in China in the New Era. Soc. Sci. Xinjiang 2023, 4, 31–43. [Google Scholar]
  56. Li, R.; Chen, J.; Xu, D. The Impact of Agricultural Socialized Service on Grain Production: Evidence from Rural China. Agriculture 2024, 14, 785. [Google Scholar] [CrossRef]
  57. Yu, A.; Cai, E.; Yang, M.; Li, Z. An Analysis of Water Use Efficiency of Staple Grain Productions in China: Based on the Crop Water Footprints at Provincial Level. Sustainability 2022, 14, 6682. [Google Scholar] [CrossRef]
  58. Shang, X.; Zhu, S.; Duan, J. Policy Supply Choice of National Food Security under Water Resources Restriction. Econ. Probl. 2019, 12, 81–88. [Google Scholar]
Figure 1. Theoretical framework diagram.
Sustainability 16 05030 g001
Figure 2. Location of typical black soil areas in Northeast China.
Sustainability 16 05030 g002
Figure 3. Trends in crop water footprint.
Sustainability 16 05030 g003
Figure 4. Change curves of coupling degree.
Sustainability 16 05030 g004
Figure 5. Factor layer obstacle degree.
Sustainability 16 05030 g005
Figure 6. The top three handicap indicators.
Sustainability 16 05030 g006
Table 1. Criteria for judging coupling degree and coupling coordination degree.
ProjectValue RangeStage
Coupling value C0 < C ≤ 0.3Low-level coupling stage
0.3 < C ≤ 0.5Fly-down stage
0.5 < C ≤ 0.8Break-in period
0.8 < C ≤ 1High-level coupling stage
Coupling harmonization value D0 < D ≤ 0.3Low coupling coordination
0.3 < D ≤ 0.5Moderate coupling coordination
0.5 < D ≤ 0.8High coupling coordination
0.8 < D ≤ 1Quality coupling coordination
Table 2. Water and soil resources and grain production system evaluation index system.
SubsystemFactor LayerIndex LevelExplanation of IndicatorsUnitCharacteristic
Agricultural land and water resources systemMatching of water and soil resources (MR)Matching coefficient of water and soil resources (MR1)Agricultural water and soil resource allocationm3/kgPositive
Grain production systemNatural endowment (NE)Effective irrigation area (NE1)Measuring regional agricultural water useThousand hectaresPositive
Disaster proportion (NE2)Measuring climate impacts on agriculturePercentNegative
Agricultural factor inputs (AF)Year-end cultivated land area (AF1)Land factor inputsHectaresPositive
Agricultural labor force (AF2)Labor factor inputsPersonPositive
Grain sown area (AF3)Measuring the amount of seed inputsHectaresPositive
Fertilizer application amount (AF4)Measuring fertilizer inputsTonPositive
Total power of agricultural machinery (AF5)Measuring agricultural machinery inputsKilowattPositive
Agricultural outputs (AO)Per capita yield of grain (AO1)Measuring crop yieldsKg/haPositive
Gross agricultural output (AO2)Measuring the value of food crop outputCNY 10,000Positive
Table 3. Water footprint per unit mass of grain crops (m3/kg).
Crop (per Unit Mass)RiceWheatMaizeSoybeanTubers
WFblue0.960.200.110.820.13
WFgreen0.790.510.421.460.37
WFtotal1.750.710.532.280.50
Table 4. Matching coefficient of agricultural water and soil resources.
RegionMatching Coefficient of Water and Soil Resources R (104 m3/hm2) R ¯
200520072009201120132015201720192021
Hulunbeier0.270.610.790.740.640.980.370.680.300.60
Xing’an League0.620.160.190.240.300.340.370.590.590.38
Tongliao0.230.270.250.230.270.340.330.410.430.31
Chifeng0.670.650.630.231.040.241.101.141.100.76
Harbin0.790.690.690.810.660.670.570.570.630.68
Qiqihar0.290.230.350.410.390.410.380.500.530.39
Hegang0.440.330.630.590.590.580.592.052.110.88
Shuangyashan0.150.150.390.200.200.200.210.690.720.32
Daqing0.200.220.350.510.480.480.420.460.480.40
Jiamusi0.030.030.040.090.080.080.070.730.760.21
Qitaihe0.350.240.290.290.220.270.260.290.290.28
Heihe0.160.120.260.220.180.210.200.330.330.22
Suihua0.400.430.560.650.530.550.500.500.500.51
Changchun0.580.560.470.490.550.560.580.530.670.55
Siping0.550.530.430.520.540.580.600.540.360.52
Songyuan0.360.330.410.400.400.480.520.500.520.44
Baicheng0.220.260.280.260.290.420.510.590.660.39
Typical black soil region0.370.340.410.400.430.430.450.650.650.46
Table 5. Coupling and coupling coordination measurements and hierarchies.
20052021
RegionCStageRegionDStageRegionCStageRegionDStage
Jiamusi0.304Fly-down stageJiamusi0.253Low coupling coordinationHegang0.599Break-in periodQitaihe0.318Moderate coupling coordination
Xing’an League0.873High-level coupling stageShuangyashan0.271Shuangyashan0.943High-level coupling stageHulunbeier0.413
Hegang0.902Heihe0.297Chifeng0.944Heihe0.424
Suihua0.910Qitaihe0.320Moderate coupling coordinationSuihua0.952Siping0.434
Qiqihar0.923Hulunbeier0.336Qiqihar0.957Daqing0.468
Qitaihe0.925Baicheng0.338Hulunbeier0.963Xing’an League0.480
Heihe0.941Daqing0.339Harbin0.964Shuangyashan0.485
Tongliao0.943Hegang0.353Tongliao0.969Tongliao0.496
Daqing0.946Tongliao0.373Heihe0.976Songyuan0.530High coupling coordination
Chifeng0.954Xing’an League0.407Qitaihe0.979Baicheng0.539
Baicheng0.973Songyuan0.431Songyuan0.983Suihua0.556
Shuangyashan0.974Qiqihar0.433Siping0.984Qiqihar0.567
Siping0.982Siping0.454Xing’an League0.987Hegang0.577
Songyuan0.988Chifeng0.475Changchun0.991Jiamusi0.588
Harbin0.996Changchun0.500Baicheng0.999Changchun0.593
Changchun0.999Suihua0.526High coupling coordinationJiamusi1.000Chifeng0.603
Hulunbeier0.999Harbin0.579Daqing1.000Harbin0.615
Disclaimer/Publisher’s Note: The statements, opinions and data contained in all publications are solely those of the individual author(s) and contributor(s) and not of MDPI and/or the editor(s). MDPI and/or the editor(s) disclaim responsibility for any injury to people or property resulting from any ideas, methods, instructions or products referred to in the content.

