Article

Analysis of Deforestation and Water Quality in the Talgua River Watershed (Honduras): Ecosystem Approach Based on the DPSIR Model

by
Selvin Antonio Saravia-Maldonado
1,2,
Luis Francisco Fernández-Pozo
3,*,
Beatriz Ramírez-Rosario
3 and
María Ángeles Rodríguez-González
3
1
Doctoral Program in Sustainable Territorial Development, International Doctoral School, Universidad de Extremadura—UEx, 06006 Badajoz, Spain
2
Faculty of Earth Sciences and Conservation, Universidad Nacional de Agricultura—UNAG, Catacamas 16201, Honduras
3
Environmental Resources Analysis (ARAM) Research Group, Universidad de Extremadura—UEx, 06006 Badajoz, Spain
*
Author to whom correspondence should be addressed.
Sustainability 2024, 16(12), 5034; https://doi.org/10.3390/su16125034
Submission received: 8 May 2024 / Revised: 7 June 2024 / Accepted: 10 June 2024 / Published: 13 June 2024
(This article belongs to the Special Issue Sustainable Development and Land Use Change in Tropical Ecosystems)

Abstract

:
With increasing urbanization and industrialization, soil and forest resources are facing considerable pressure, as well as the demand for water for domestic, agricultural, and industrial activities. Therefore, it is essential to conduct regular assessments of water quality and ensure that water is consistently maintained in the context of ecosystem services (ESs). Our objective was to apply the driving forces–pressures–state–impacts–responses (DPSIR) model to understand the cause–effect relationships and interactions with anthropogenic pressures on deforestation and water quality in the Talgua River watershed and associated valley and plain areas in central-eastern Honduras. Physicochemical and microbiological analyses were conducted to determine the water quality index (NSF–WQI) and other contamination indexes. The results identified high contamination by coliforms, up to 920.00 NPM/100 mL, and high levels of contamination by organic matter (ICOMO, 0.65), solids (ICOSUS, 0.79), mineralization (ICOMI, 0.99), and the presence of bacteria (BPI, 8.50), as well as the development of eutrophication processes (ICOTRO), resulting in generally low water quality. These problems were caused by the socio-demographic and economic growth of the area, as well as the high demand for water, vulnerability to climate change, and intense agro-livestock and industrial activity, which led to deforestation processes, changes in land use, and contamination of natural water bodies that impacted the overexploitation of aquifers. After applying the DPSIR model, strategies are proposed for the management and administration of the watershed aimed at preserving the water, soils, and forest resources, while promoting stakeholder, business, education sector, and public administration participation.

1. Introduction

Increasing urbanization and industrialization, combined with other factors, such as environmental stress, agricultural and industrial intensification, and inadequate waste management, have led to an increase in water demand. This growing demand for water hampers access to potable water and has a negative impact on both the hydrological cycle and water quality [1,2]. As a result, there has been a significant increase in groundwater abstraction, estimated at 15–25% per year [3]. In addition, inadequate wastewater treatment infrastructure and resources have resulted in more than 80% of wastewater being discharged directly into natural waters without prior treatment [4].
Numerous authors and international organizations have highlighted the high level of degradation of water resources and the associated increase in disease incidence and environmental degradation. For example, the World Health Organization (WHO) reports that at least 2 billion people, mainly in developing countries, are exposed to contaminated water, resulting in illness and even death [5,6], and they point to land-use change as one of the factors causing the degradation of aquatic ecosystems [4,7,8,9,10]. In line with these concerns, the 2030 Agenda [11] defines clean and safe water as “water that flows naturally from untreated sources, such as rivers, lakes and groundwater, and reflects a combination of natural and anthropogenic influences”.
This is why the sixth of the 17 Sustainable Development Goals (SDGs) [11] addresses freshwater quality, aiming to ensure sustainable management and sanitation by reducing pollution, eliminating discharges, and minimizing the release of harmful chemicals. However, significant challenges remain in achieving the proposed goals, particularly those related to public health, productivity, economic prosperity, and environmental sustainability [12,13], giving rise to the concept of ‘water security’ as an integral part of developing strategies to mitigate and solve global water problems ranging from water scarcity to resource quality and sustainable use [14]. Sadoff and Muller [15] define water security as the assurance of an adequate water supply in terms of quantity and quality to support health, the production of goods and services, and the means of subsistence [16].
Several indices are used to assess water quality: (1) the National Sanitation Foundation Water Quality Index (NSF–WQI) [16]; (2) the Dinius–WQI [17]; (3) the CCME–WQI proposed by the Canadian Government [18]; (4) the DWQI of the United Nations Environment Programme (UNEP) [19]; (5) the UWQI proposed by Boyacioglu [20]; or (6) the SWQI of Queralt [21]. Regarding specific pollution indices, Ramírez et al. [22] developed other indices: (i) organic pollution index (ICOMO), (ii) mineralization index (ICOMI), solids index (ICOSUS), and (iii) trophic index (ICOTRO). Subsequently, Ramirez et al. [23] proposed the index of contamination by pH (ICOpH) and by temperature (ICOTemp). In addition, Brink et al. [24] proposed the bacterial pollution index (BPI).
The NSF–WQI has been widely adopted and/or validated in numerous studies [25]. It integrates physicochemical parameters (pH, nitrates, phosphates, biological oxygen demand, dissolved oxygen, temperature, total dissolved solids, turbidity) and microbiological parameters (fecal coliforms) [26]. Many authors [27,28] consider it easy to use and interpret, while providing reliable results for both consumers and those responsible for water management and quality.
The impact of land-use change on soil resources, with negative consequences for ecosystem services (ESs), has been widely reported in the literature [29,30,31], suggesting an in-depth assessment, as pressure and demand for goods and services [32] have a direct impact on (a) agricultural and forestry production; (b) protection against erosion and flooding; (c) carbon and atmospheric nitrogen sequestration; (d) regulation of natural habitats; and (e) water storage and quality [33]. In developing countries, land-use change is increasing due to population growth and lifestyles [34].
These factors have been grouped under the term “drivers” and are part of the DPSIR conceptual framework [35]. This model is fundamental to environmental research because its structure is aligned with policy objectives, making it a tool for environmental management. On the other hand, it identifies relevant causal relationships between human activities and the environment [35] and suggests actions for both public and private management, facilitating the identification of those anthropogenic factors that cause environmental problems [36].
Pinto et al. [37] pointed out that the driving forces–pressures–state–impacts–responses (DPSIR) model has been widely used to study the processes of interaction between socio-environmental systems. Examples of the applicability of this approach include studies on ecosystem services [38], sustainability indicators [39], land degradation and desertification [40], remediation of contaminated sites [41], and agricultural policies [42]. Other studies focused on water use and quality [43], addressing issues such as the integration of spatial and social characteristics for sustainable watershed management [44]; the restoration of urban streams and wetlands [45]; the study of blue carbon in ecosystems [46]; the relationship between climate change, environment, and livelihoods in watersheds [47]; the study of freshwater ecosystems [48]; and the assessment of ecological security risks in watersheds [49]. It has even been used to study the impact of COVID-19 on workers [50].
The environmental characteristics of Central America, and Honduras in particular, place us in a tropical climate characterized by a wide range of microclimates, from dry tropical to humid tropical [51]. Honduras is one of the countries most vulnerable to climate variability and increased anthropogenic pressure on the ecosystem, resulting in increased vulnerability, with significant impacts on the hydrological cycle and water quality [52].
The Talgua River watershed is a primary forest zone located in the central-eastern region of Honduras. However, urban expansion and population growth have led to an intense deforestation process in this area, transforming the territory into zones intended for agriculture, cattle raising, and industry. In this work, the DPSIR model was applied to provide an integrated view of the effects that the deforestation of a primary forest and new land uses have on ESs, and more specifically, on water quality and its relationship with the origin of ESs.

2. Materials and Methods

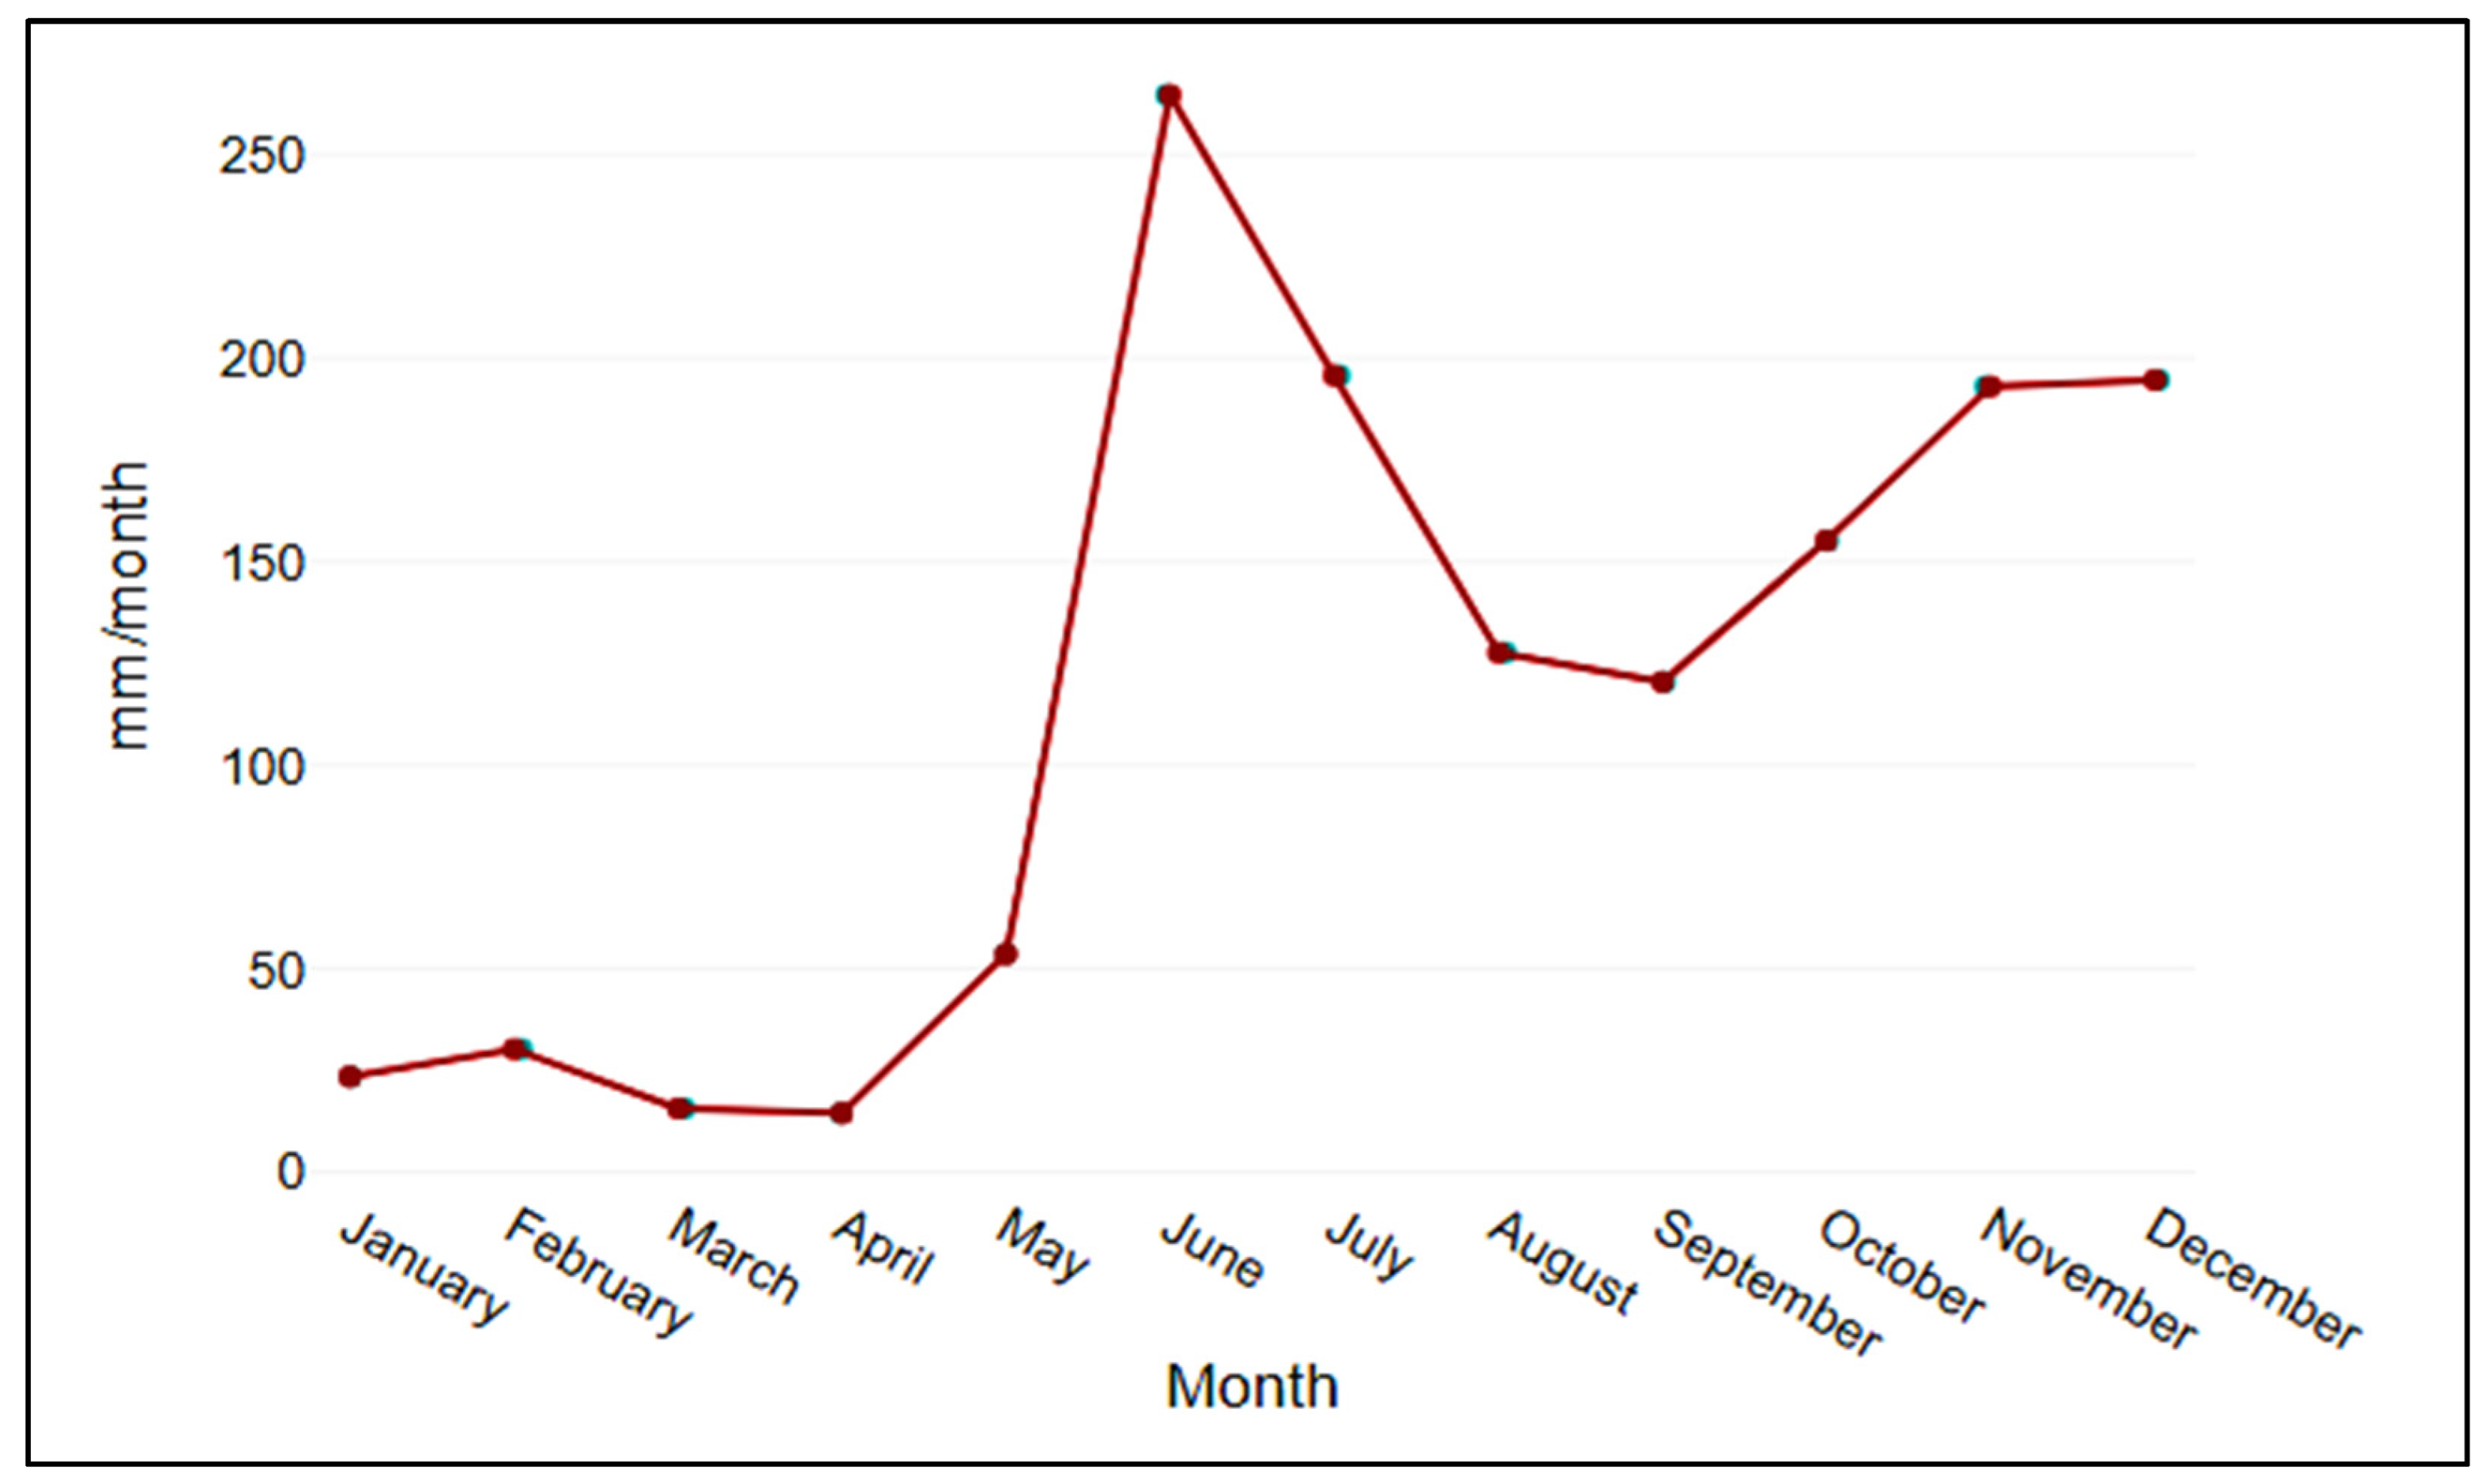
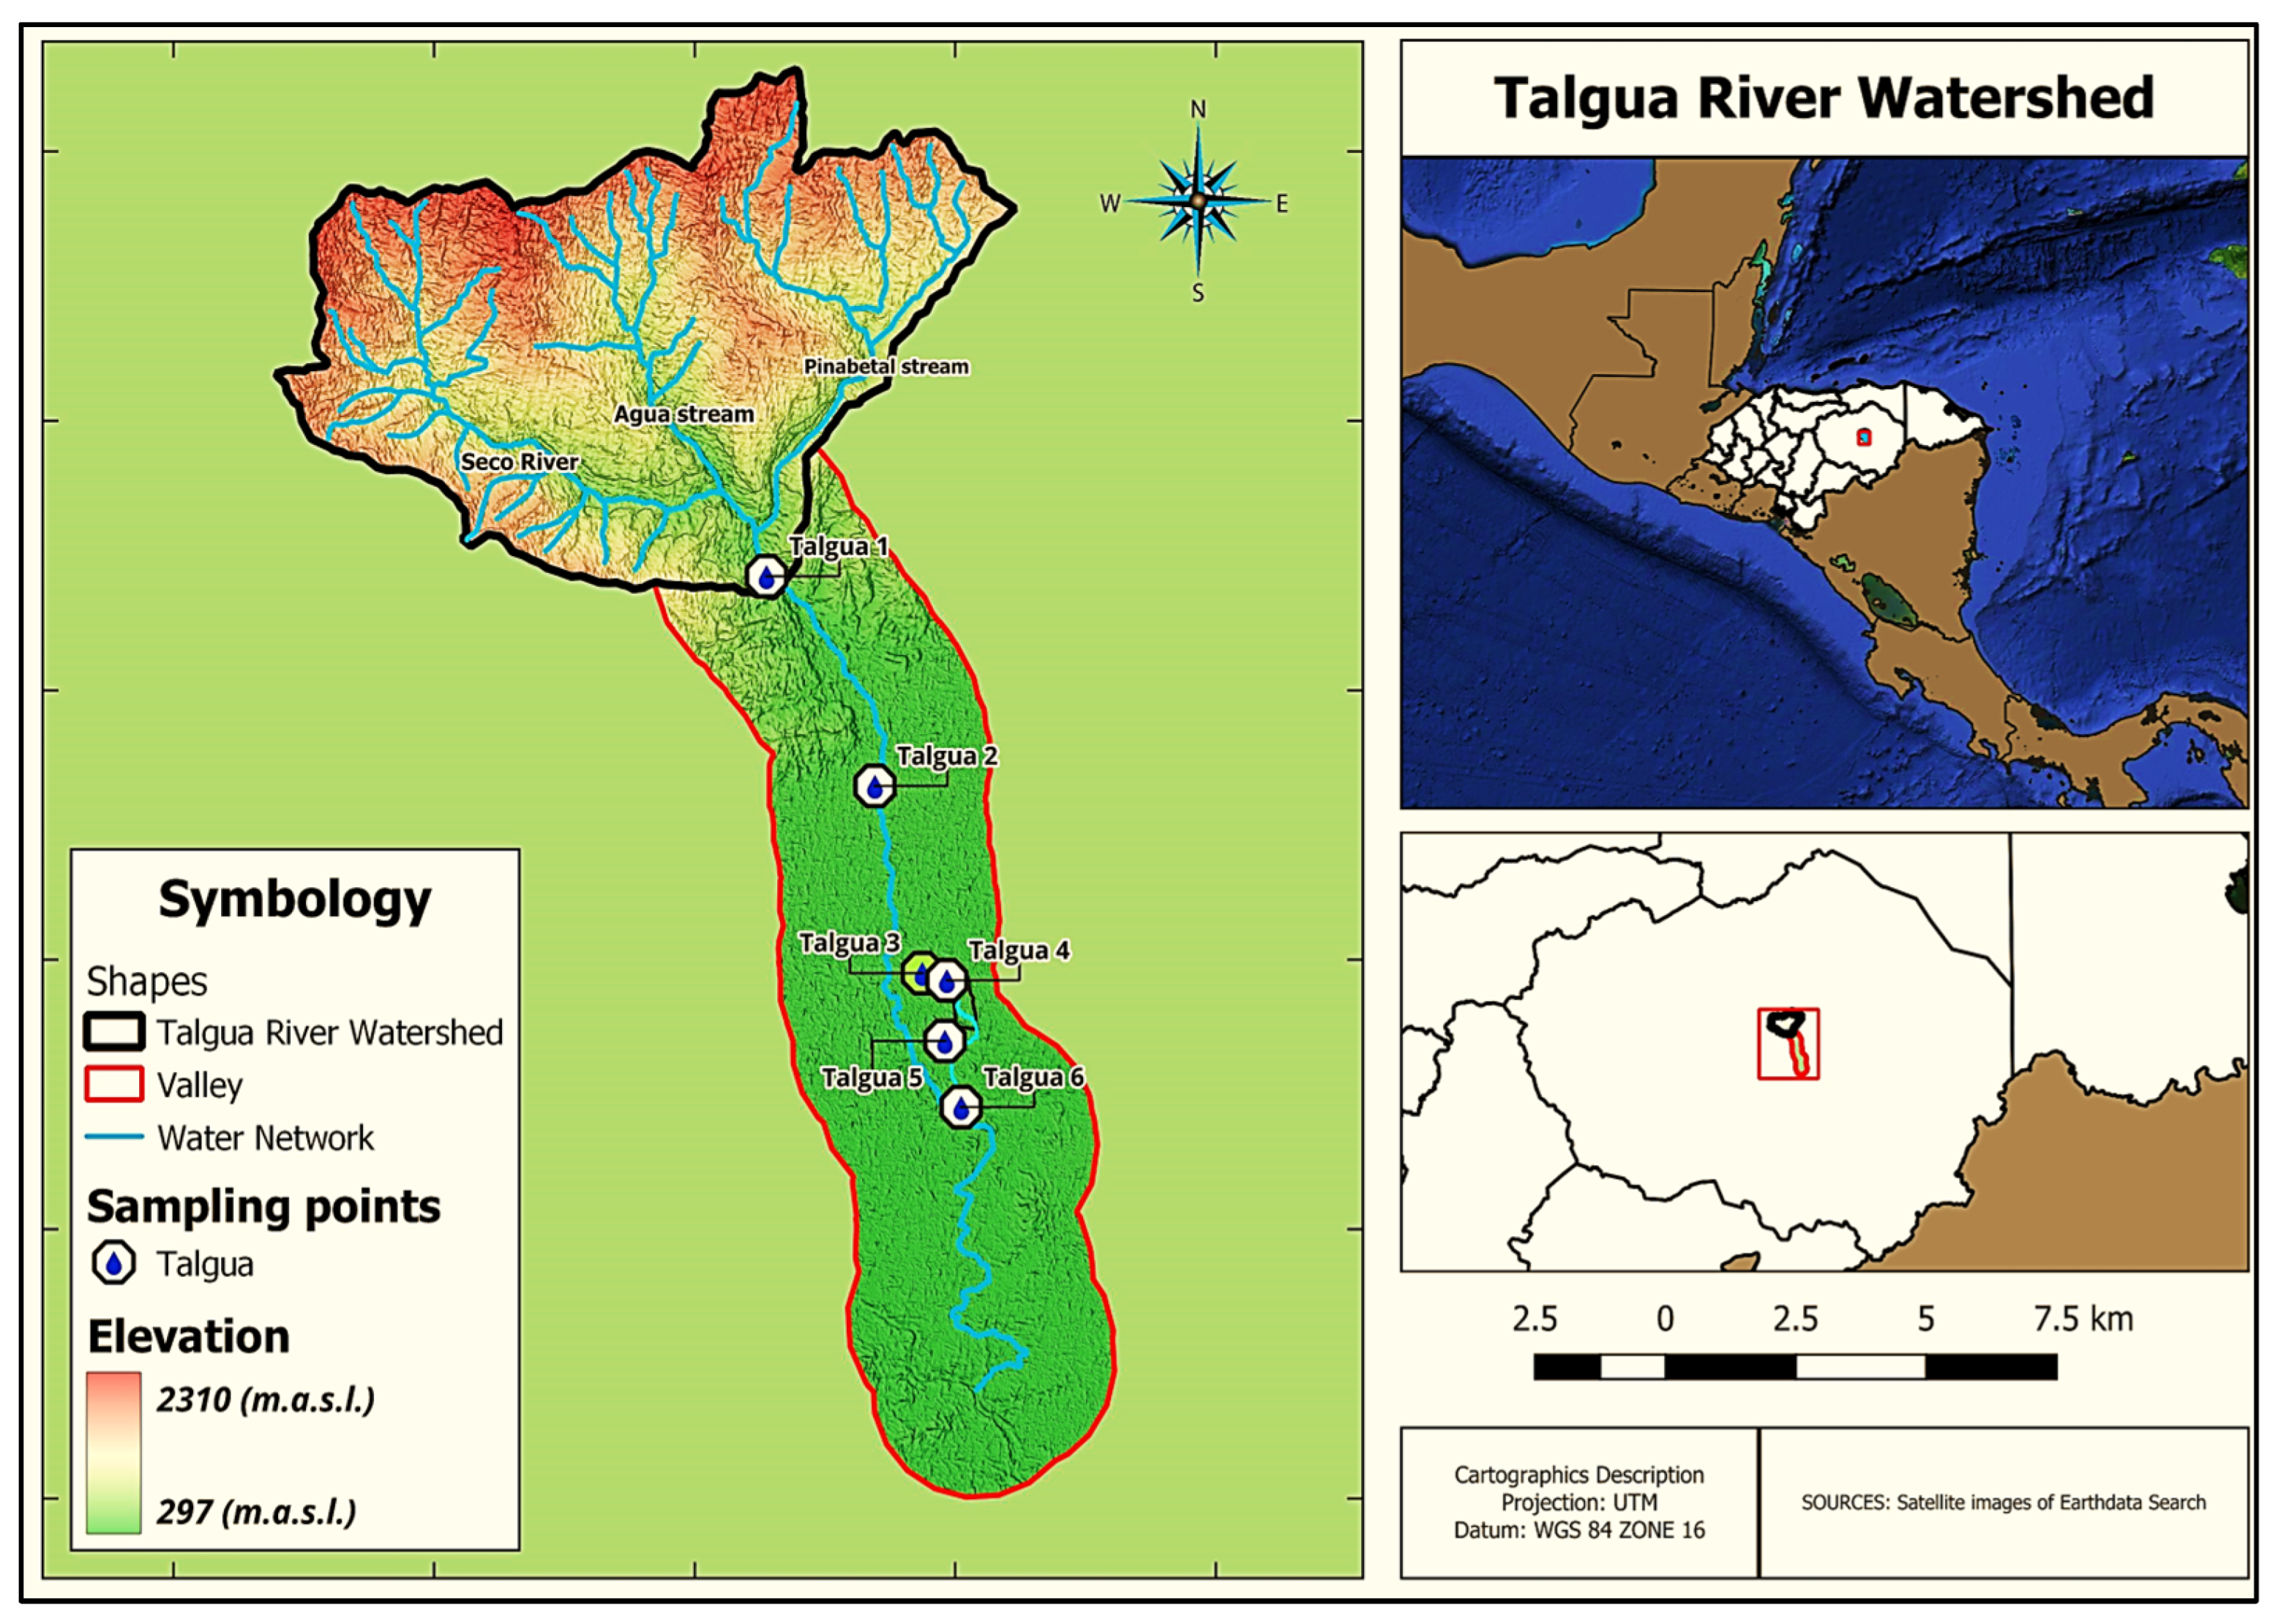
2.1. Characteristics of the Talgua River Watershed

The Talgua River watershed is in the municipality of Catacamas, in the central-eastern region of Honduras (Figure 1). This watershed is part of the Sierra de Agalta National Park (SANP) and covers altitudes ranging from 480 to 2350 m.a.s.l. Its geographical coordinates are between 14°58′–14°53′ N and 85°49′–85°57′ W, covering an area of approximately 80 km2 [53].
The geological formations present in the area belong mainly to the Honduras Group (JKhg) (73 km2) and are characterized by the presence of siliciclastic rocks and calcareous conglomerates. There are also Cretaceous intrusive rocks (KTi) (6.24 km2) [54]. These geological elements have led to the formation of soils over sedimentary and plutonic materials [55], classified as Kastanozem and Cambisol, respectively [56], on which a primary forest developed and was subjected to deforestation.
The climatic characteristics of the watershed are characterized by a variability in the annual rainfall of 1271 ± 209 mm (Figure 2 shows the distribution of precipitation over the year, taking 2023 as a reference year), and a temperature that varies between 22 and 28 °C throughout the year [53]. This climatic configuration causes well-defined dry and wet periods, resulting in the presence of very humid subtropical and low montane subtropical forests [51].
The relief ranges from moderately sloping to very steep, leading to the development of erosive and solifluction processes [57]. The hydrographic network has a dendritic morphology composed of streams and underground rivers. The runoff generated gives rise to the Talgua River (Figure 1), whose flow supplies water to approximately 7500 inhabitants and meets the agricultural, livestock, and industrial needs of the region. This river system is part of the Patuca River watershed, which flows directly into the Caribbean Sea [53].
Figure 2. Average rainfall data (mm/month) in the Talgua River watershed during the year 2023 [58].
Sustainability 16 05034 g002
Within the watershed, the forest zone occupies 72% of the total area; agricultural activities represent approximately 21% and include crops such as coffee (Coffea arabica), corn (Zea mays), beans (Phaseolus vulgaris), horticultural crops, sugarcane (Saccharum officinarum), bananas (Musa paradisiaca, M. balbisiana, M. acuminata × M. balbisiana), citrus (Citrus cinensis, C. limon), and avocado (Persea americana). In their management, weed control, agrochemicals in reduced quantities (insecticides, fungicides, herbicides), and occasional fertilization with NPK sources are carried out, and soil conservation practices are not applied. The remaining 7% is occupied by small areas of secondary wet deciduous vegetation and scattered trees outside the forest [53]. Regarding livestock, there is minimal presence of cattle on mainly natural pastures of jaraguá (Hyparrhenia rupha) and small plots with improved pastures of elephant grass (Pennisetum purpureum) and Brachiaria [59]. In addition, the watershed offers great ecotourism activity, including an eco-archeological park and a natural monument: Cuevas de Talgua.

2.2. Valley and Plains Zone Associated with the Watershed

The lowest point of the watershed corresponds to the village of Talgua Arriba, and considering a transect of approximately 10 km along the Talgua River, it is part of the valley and plains region, where the transformation of the primary forest to agro-livestock areas is expressed, which is a phenomenon that has intensified since the 1960s with the expansion of the agricultural frontier and the consequent socioeconomic and demographic growth of the area (Figure 1). The valley is dominated by alluvial plains [56], with intense rainfed and irrigated agricultural activity, oriented exclusively toward the commercialization of Zea mays, Phaseolus vulgaris, horticultural crops, and Persea americana. Soil preparation and the use of agrochemicals are typical agricultural practices. Irrigated areas employ gravity and flooding methods. Some plots have implemented drip irrigation systems to optimize water use. The remaining 50% is dedicated to livestock [60]. This sector implements extensive cattle systems with a low stocking rate (1–2 animal units/ha/year), with meat and/or milk production systems. Daily milk production is estimated at 5.0 L per cow, and the diet is mainly based on improved Brachiaria pastures, although in critical periods, forages such as hay, corn silage, cut grasses, and concentrated feed are used. On a smaller scale, there are pig and sheep farming, as well as aquaculture.

2.3. Water Sampling Collection and Preparation

Following the Water Quality Standard [61], water samples were collected and analyzed at 6 sampling stations (Figure 1). The first corresponded to Talgua 1, which represented the lower part of the watershed and transition zone to the valley and plains area. Downstream and to the south was Talgua 2, where a greater process of urbanization was taking place, and agricultural and industrial systems were being installed in the surrounding plains. Following the course of the river, water samples were obtained from a well (Talgua 3) that supplied domestic water and was drilled to a depth of 5 m. Samples were also taken from a stream (Talgua 4) located in a primary forest area affected by agriculture; livestock; and small meat, vegetable, and dairy processing plants that discharged directly into the stream. In addition, samples were taken from an artificial lake (Talgua 5) that was surrounded by agricultural areas and temporary pastures. Finally, Talgua 6 was located downstream of the Talgua River and was where the greatest pressures of urbanization, agricultural, and industrial areas were located.
For the physicochemical analysis, 3000 mL was collected in sterilized bottles, and for the microbiological analysis, 300 mL was collected using sterilized plastic bottles with airtight lids. The samples were stored at 3–4 °C and immediately transferred to the laboratory [62].

2.4. Determination of the NSF–QWI and Contamination Indexes

Physicochemical and microbiological parameters were analyzed following procedures according to Standard Methods 23rd Edition [63]. The biological oxygen demand (BOD₅) was measured by the seeding, dilution, incubation, and final measurement of the absorption rate of oxygen consumed over a period of 5 days at 20 °C. Equations (1)–(3) were used.
BOD₅ (mg O2/L) = ((DO consumed − Consumption of the strain)/Vm)) (V)
DO consumed = DOi − DOr
Consumption of the strain: DOi (Dilution Water + Strain) − DOr (Dilution Water + Strain)
where Vm is the aliquot volume of the sample affected by the dilution factor and V is the Winkler bottle volume.
For the fecal coliform counts (FCs), the multi-tube fermentation technique was used. This method is based on the microbial ability to ferment lactose with the production of acid, gas, or both when incubated in the presence of bile salts. The presence of gas is observed through Durhan’s bells, and the tubes are read using the most probable number (MPN) technique.
The total alkalinity (Alk) was analyzed by volumetry, and the concentration was calculated using Equation (4).
Total alkalinity (mg CaCO₃/L) = (A × t × 1000)/mL sample
where A is the volume of H2SO4 expended on titration and t is the concentration of H2SO4 acid.
The total hardness (Hd) was determined by complexometric volumetry and titration with EDTA and calculated using Equation (5).
Total hardness (mg CaCO₃/L) = ((A × B)/(mL sample)) (100091)
where A is the volume of EDTA spent on titration and B is the EDTA concentration.
Nitrates (NO3) and phosphates (PO43) were determined spectrophotometrically at 220 and 420 nm, respectively. Temperature (°C), pH, dissolved oxygen (DO), total dissolved solids (TDSs), turbidity (Td), and electrical conductivity (EC) were determined in situ using a previously calibrated multiparameter (HI98195®).
In the determination of the NSF–WQI (Equation (6)), 9 physicochemical and microbiological parameters were considered and obtained by means of a weighted arithmetic average. Each parameter was assigned a weighting factor (Table 1).
The evaluation of the contamination indices was also carried out using the methodology proposed by Ramírez et al. [23]. These include the index of pollution by pH (ICOpH), by mineralization (ICOMI), by organic matter (ICOMO), by temperature (ICOTemp), by solids (ICOSUS), and by eutrophication (ICOTRO). The bacterial pollution index (BPI) according to Brink et al. [24] was also evaluated. The NSF–WQI and contamination indices were calculated using the specialized software ICATest v1.0 [68].

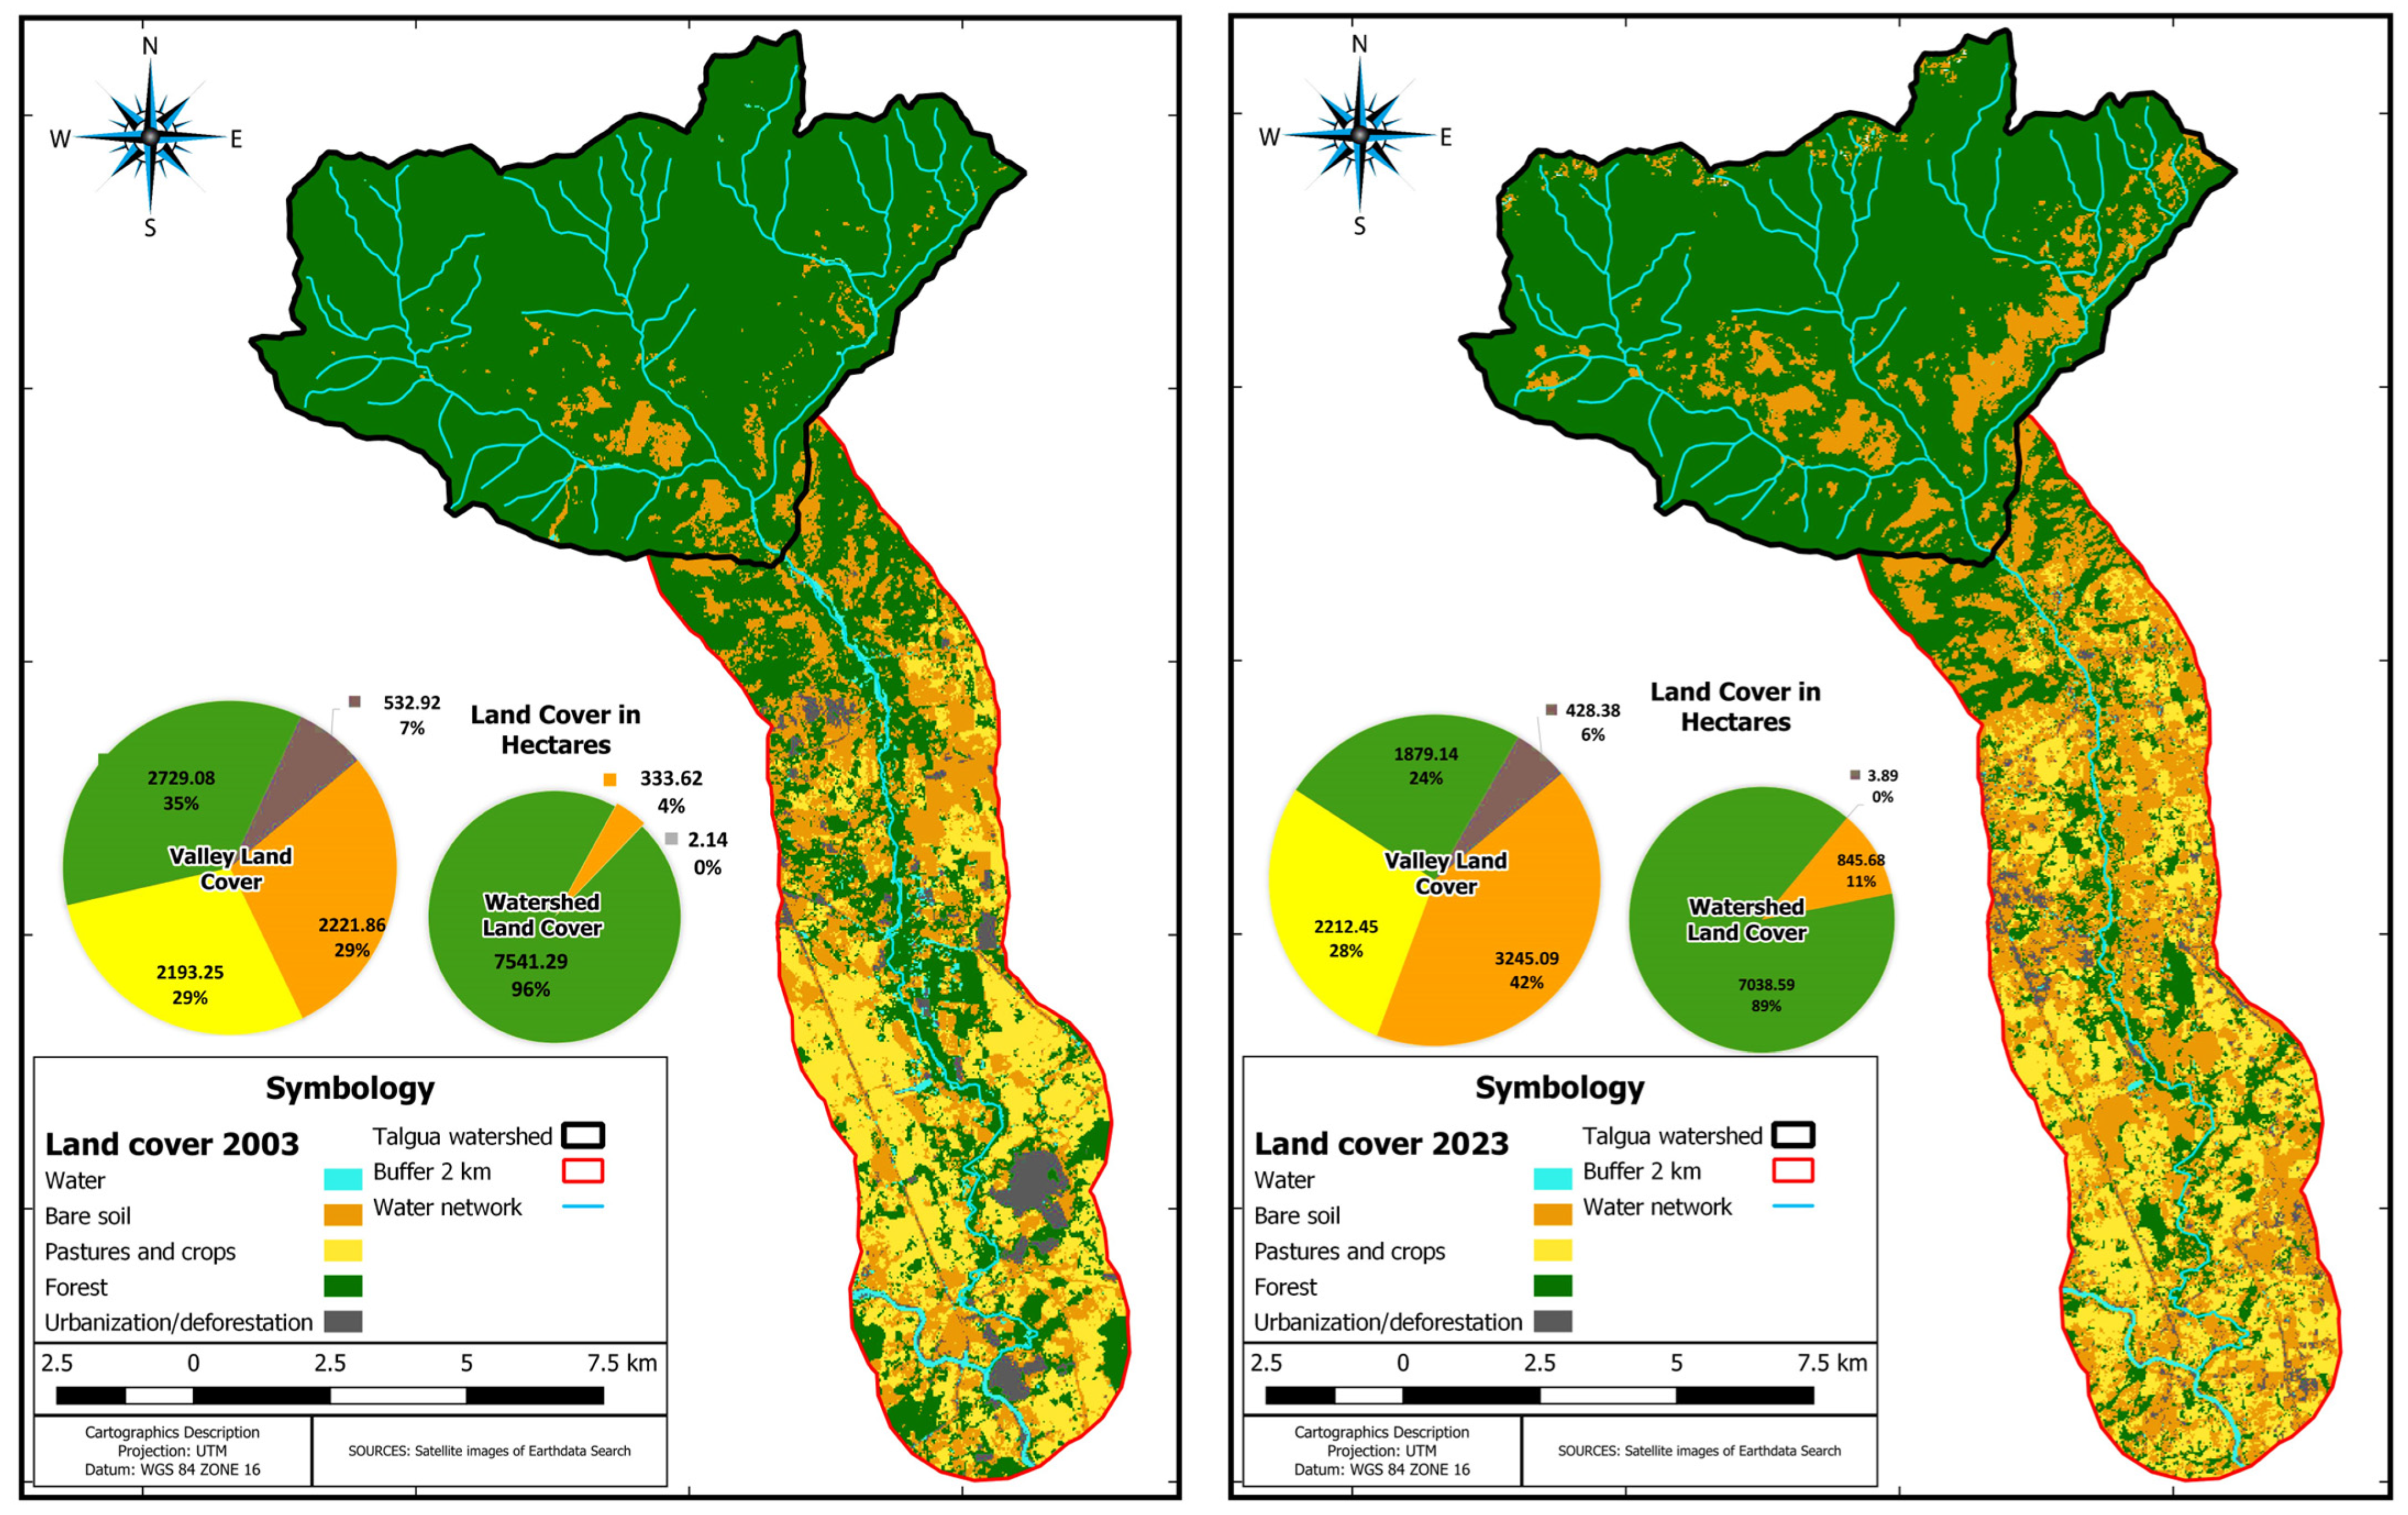
2.5. Satellite Imagery Geoprocessing

Use and cover maps were generated using Landsat-7 and Landsat-9 [69] satellite images from NASA’s Earthdata Search platform. RGB compositing was performed using QGI’s Semi-Automatic Classification Plugin. R5, G4, and B1 bands and filters from Landsat-7 satellite and R6, G5, and B2 bands from Landsat-9 were combined. The Dzeetsaka plug-in and a vector (shape) file were used. Polygons corresponding to the values of the satellite images were created in the studied areas in 5 classes. A panchromatic refinement band with a resolution of 15 m, an absolute radiometric calibration of 5%, and a thermal IR channel with a spatial resolution of 30 m were used. The processing was developed using QGIS 3.34 software [70].

2.6. Ecosystem Services (ESs)

The classification of ecosystem services (ESs) was based on the Common International Classification of Ecosystem Services (CICES V5.2), which considers both biotic and abiotic factors and classifies ESs into three categories: (i) provisioning, (ii) regulating and maintaining, and (iii) cultural [71].

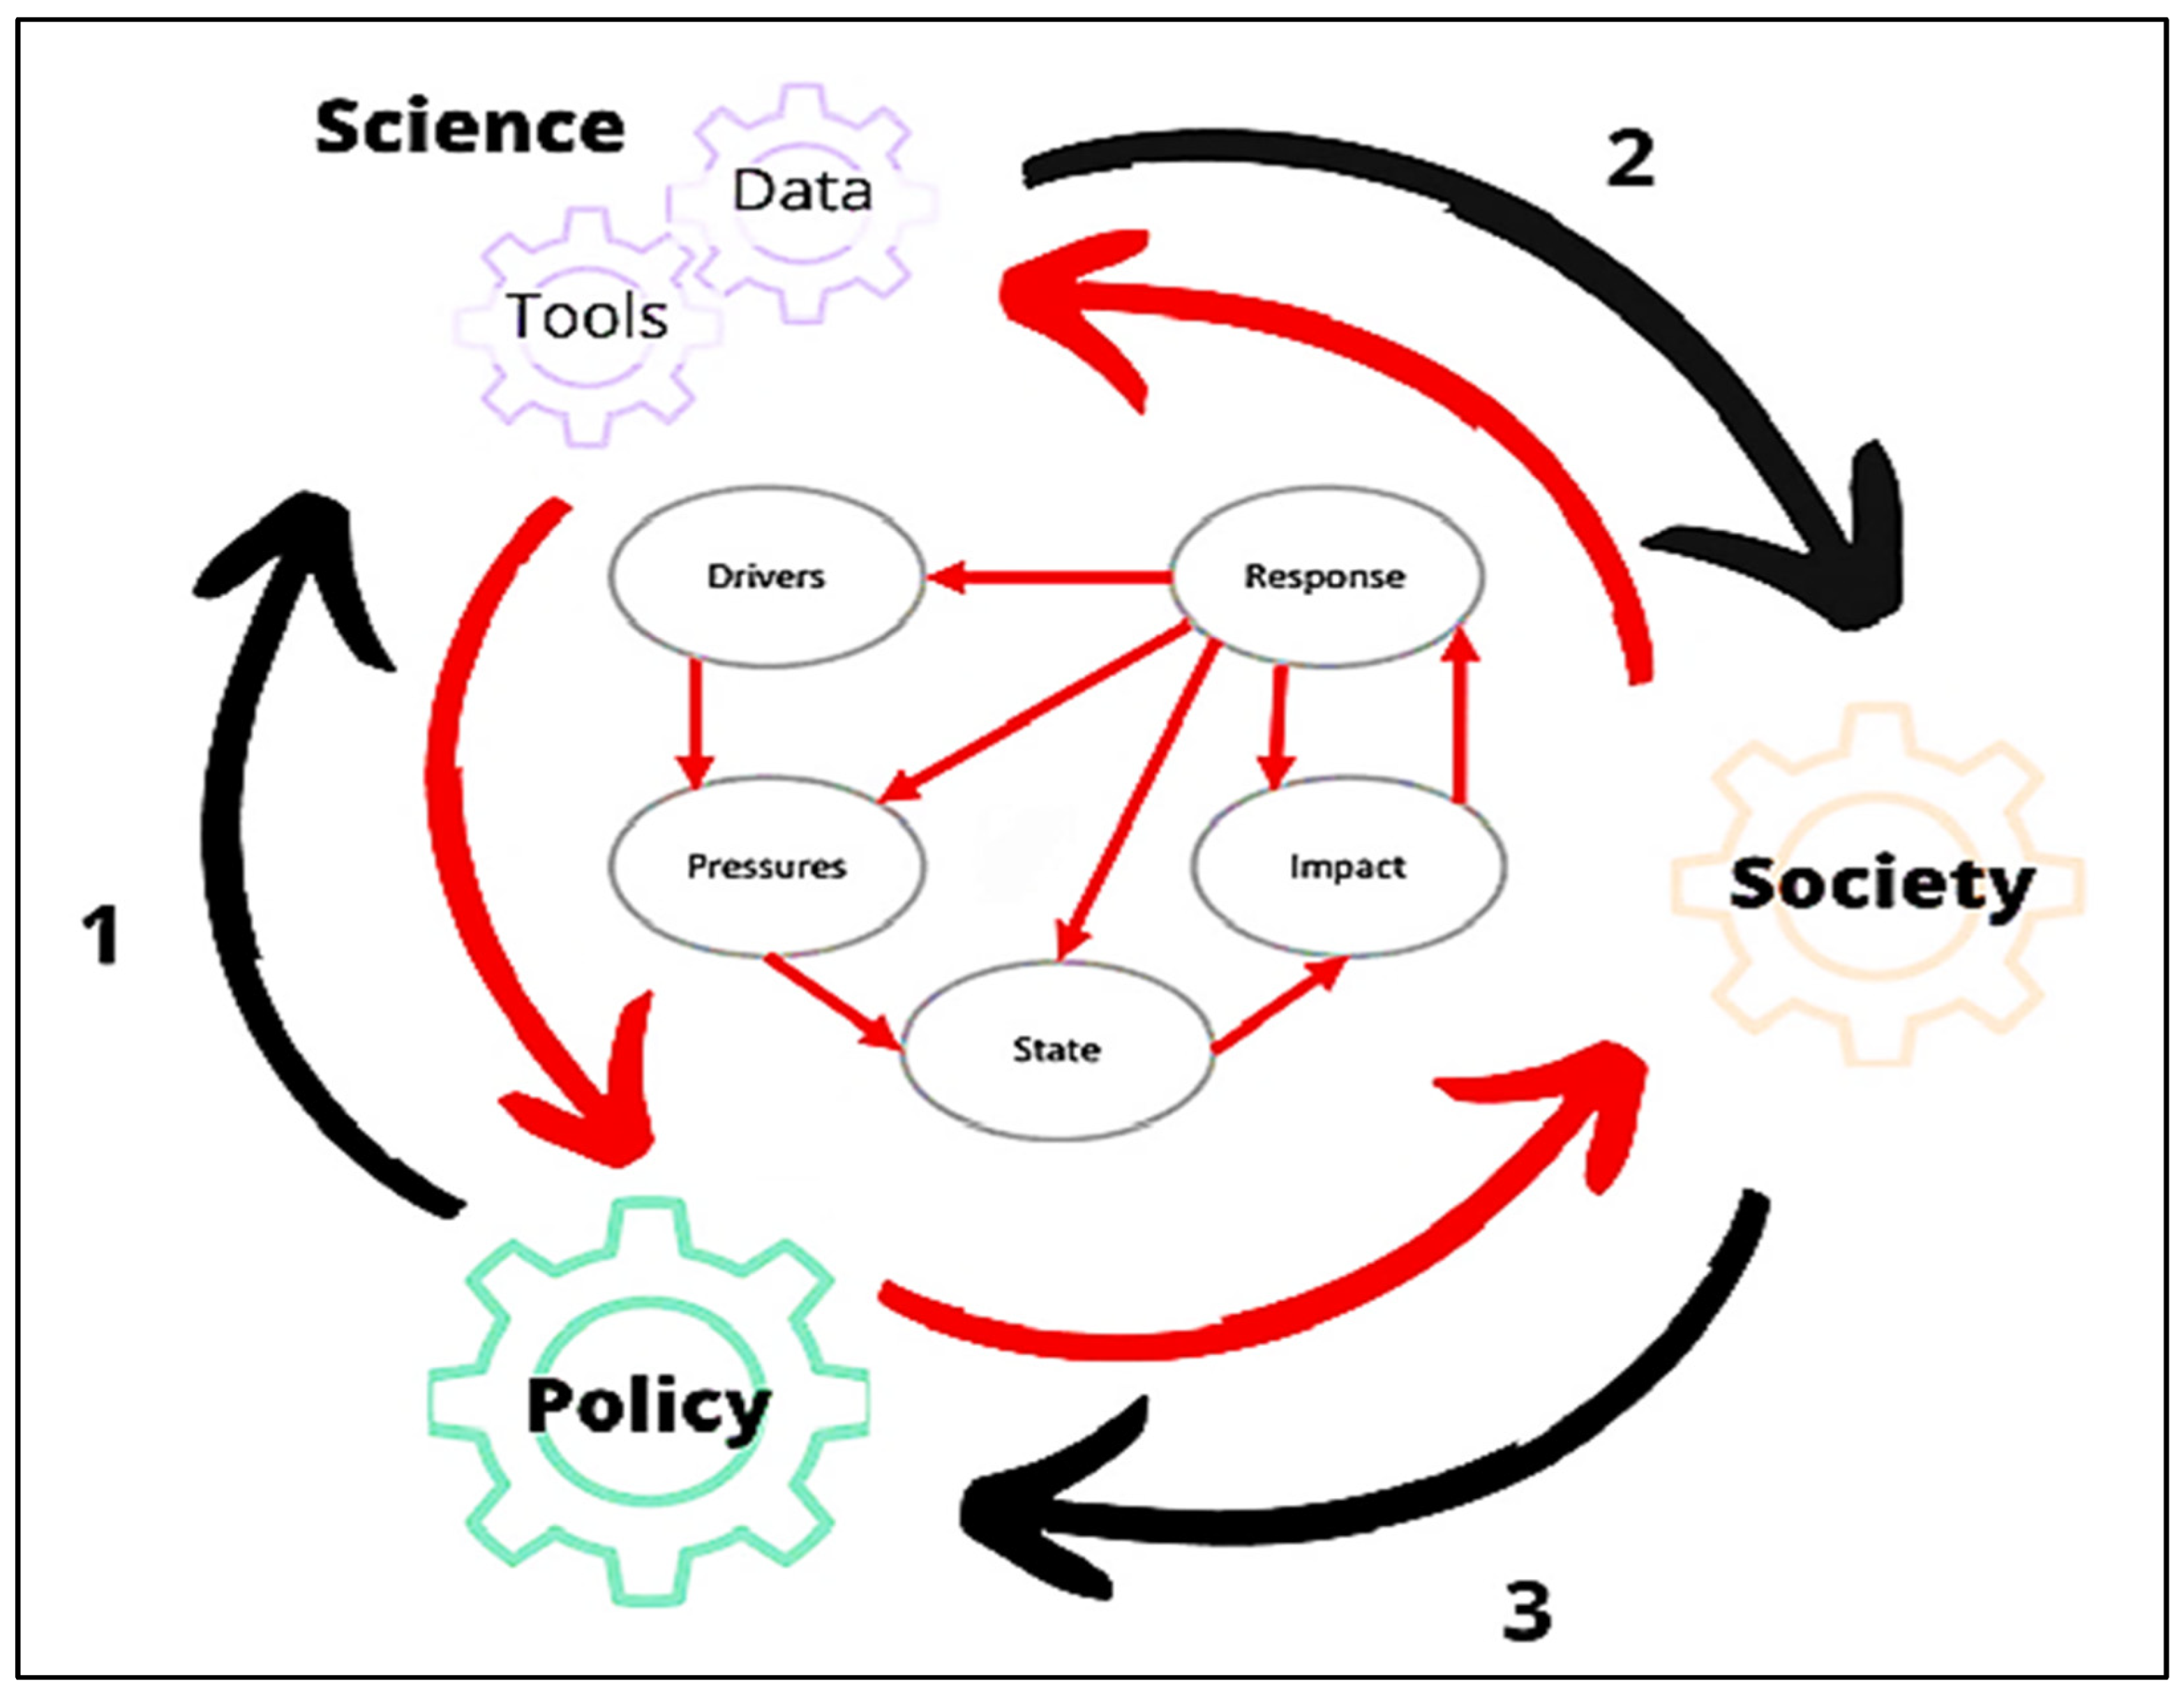
2.7. Structure of the DPSIR Model

Applying the DPSIR model (driving forces–pressures–state–impacts–responses) (Figure 3), the driving forces related to the anthropogenic activities developed in the study area, the pressures exerted on the territory, the state of water quality, and the impacts originated because of land use were defined. Finally, a set of proposals are proposed based on each indicator of the model.

3. Results and Discussion

3.1. Ecosystem Services (ESs) Provided by the Talgua River Watershed and Surrounding Areas

Table 2 shows the classifications made. It shows the ESs associated with primary forests and those affected by deforestation; new land uses; and the intensification of agricultural, livestock, and industrial activities.
The ESs affected by the deforestation process and subsequent land-use change are provisioning, regulating, maintaining, and cultural. In relation to biotic provisioning, the ESs are those related to native plants and animals used as food, energy sources, and transformation for commercialization, and the loss of plant and animal genetic biodiversity. Those regarding abiotic provisioning, related to water resources, have suffered a very significant negative impact, and are analyzed below.
In terms of regulation and maintenance, the biotic ESs most affected are filtration, nutrient sequestration and storage, odor reduction, noise attenuation and visual projection, erosion control, runoff management, and peak flow regulation, as well as mass movement buffering, flood control, wind and fire protection, pollination, seed dispersal, maintenance and regulation of habitats, refuges and feeding areas, pest and disease control, maintenance of soil structure, and regulation of water quality. The abiotic ESs are those related to the maintenance and regulation of physical, chemical, and abiotic water conditions.
Finally, biotic cultural ESs are those spaces that promote not only physical and mental health, but also research, education, cultural expression, and aesthetic experiences. They also include areas dedicated to entertainment and recreation. On the abiotic side are the direct and indirect interactions with geophysical systems (Table 2).
The social, economic, and environmental consequences of the processes of deforestation and land-use change (Section 3.2.1), pressures (Section 3.2.2), and water pollution (Section 3.2.3) have a direct impact (Section 3.2.4) on livelihoods, food security, and health, which is why the different administrations must play a predominant role in the control and environmental recovery of the Talgua River watershed and surrounding areas (Section 3.2.5).

3.2. DPSIR Model

The transformation of a primary tropical forest in Honduras into urban, agro-livestock, and industrial areas has led, among others, to a high demand for water and a decrease in its quality. In this section, we propose responses to address the driving forces, reduce pressures, improve the state, and mitigate the impacts of human activity (urbanism, livestock, agriculture, and industry) when deforesting primary tropical forests. Forests provide essential ESs, including the production of quality water for both human and ecosystem use, making it crucial to act on these issues using the DPSIR model as a reference (Figure 4).

3.2.1. Driving Forces on Ecosystem Services in the Talgua River Watershed and Surrounding Areas

The studied area consists of mountainous formations, valleys, and plains, and in certain areas, there is intense deforestation to be transformed into agro-livestock and/or industrial areas, some of which have been abandoned, causing the development of a secondary forest [73] (Figure 5). The location of the population centers is preferably in the valley areas, which suffer high infrastructure pressure in the urban and riverside areas, as well as that caused by tourism in the watershed. In this context, the constant population growth requires services: energy, housing, infrastructure, transport, sanitation, sewerage, and food, with these being the main driving forces identified, and repercussions mainly on land use and the availability of water resources.
The Talgua River currently provides water to approximately 7500 inhabitants, primarily for domestic use and for cultivating over 12 vegetable species and some fruit species, including the irrigation of some 1000 ha of farmland in the valley. Additionally, it serves as a water source for extensive livestock and, to a lesser extent, for subsistence and commercial agriculture, livestock, forestry, and fish farming. Tourism is a significant activity in the region and is steadily growing. It has an impact on socioeconomic and demographic factors, as evidenced by the increase in infrastructure development and industrial activity. However, it also puts pressure on water resources due to increased demand and generates more waste.
On the other hand, the increase in population in the watershed and its surrounding areas also brings with it the need for raw materials and the construction of housing and infrastructure. In this sense, the driving forces described above have a direct impact on the water bodies because of the socio-economic processes described above (Figure 4). These economic and social drivers are closely linked, and their significant influence is attributed to demographic expansion. People increasingly prefer to live in urbanized areas with access to water for drinking, agriculture, and industry.
The study of satellite imagery shows that the Talgua River watershed, valley, and plains have undergone continuous deforestation, particularly in the valley and plains areas, where approximately 2400 hectares were transformed into pastures, agricultural crops, and urban areas by 2003. Deforestation has continued at a slower rate over the last 21 years, with approximately 1000 hectares deforested in the valley and plains areas and about 500 hectares in the watershed (Figure 5).
Similarly, water availability in the valley and on the plains is decreasing significantly due to forest fragmentation (Figure 5). This alteration of the natural landscape also affects the water quality. In addition, the natural reservoirs have experienced a decrease in their production and storage capacity, resulting in less recharge of the Talgua River, which has a negative impact on both water flow and water availability.

3.2.2. Pressures on Ecosystem Services (Water) in the Talgua River Watershed and Surrounding Areas

Pressure on the use of water resources is given by population increase; irrigation systems, which are mostly inefficient as they are based on land flooding; industry, specifically the activity of vegetable, meat, and dairy processing plants; transportation; changes in the population’s lifestyle, as evidenced by consumption and production levels; and others related to social and political situations. In turn, water resources are exposed to environmental conditioning factors, such as the variability of precipitation and temperature, giving rise to stages of droughts or floods [74]. These pressures generate high demand and excessive water consumption, as well as the increase and release of substances with harmful effects on both human health and ecosystems.
Water demand in the study area is the main cause of the water deficit in the watershed since it was estimated that water flow represents 63% of the annual total and 80% of the total in the dry season [55]. According to Hanson et al. [75], the main cause of soil degradation is land-use change, and in our watershed, the conversion of primary forests into pastures and crops accelerates soil degradation, which affects surface runoff since hydraulic conductivities of 8 to 11 mm h−1 were observed, resulting in low flows when compared with those determined in native forests, which were estimated at about 840 mm h−1.
Sandoval et al. [76] identified other climate-related pressures in the Talgua River watershed (Figure 6). The livelihoods of farmers in the area have been affected by increased temperatures, reduced rainfall, heat waves, or heavy rains, resulting in economic losses of Coffea arabica, Zea mays, and Phaseolus vulgaris crops. In addition, these climatic conditions have led to the emergence of pests and diseases and have made it difficult for communities to transport and sell agricultural products, further exacerbating the situation in the region. At the same time, a decline in natural soil fertility has been observed, which was attributed to changes in land use and the action of erosive processes [59,76].
In 1998, 2005, and 2008, the study area was affected by high rainfall events caused by hurricanes Mitch, Beta, and tropical depression 16 (Figure 6), and more recently, in 2020, hurricanes Eta and Iota. These events resulted in significant damage to agricultural and livestock production, as well as infrastructure [76]. Nevertheless, and in close relation to climate change, the increase in the number of extreme events, as projected by scenarios for Honduras and more specifically for the Talgua River basin and surroundings, indicates that precipitation could increase by 2.7% for the year 2030, 5.1% for the year 2050, and 11.5% for the year 2080. In contrast, alternative scenarios predict a reduction in precipitation of approximately 3.8% for the same time periods. Regarding the mean annual temperature, increases of 2.1 °C by the year 2050 and 3.6 °C by the year 2080 are projected [77].
It is notable that there has been a discernible increase in groundwater extraction, which, when considered alongside the projections, could potentially result in a reduction in aquifer recharge and an increased risk of groundwater depletion, thereby intensifying the impact of climate change.

3.2.3. Status of the Ecosystem Services (Water) in the Talgua River Watershed and Surrounding Areas

Because of the pressures exerted, the state of water resources is presented in Table 3, Table 4 and Table 5. The pH of water indicates the presence of characteristics related to organoleptic or health properties in terms of acidity and solubility of metal ions (above 8.5 or below 6.5, respectively). In our case, the pH values were maintained in the neutral to basic ranges and within the optimal values established by the WHO. The pH at all sampling points corresponded to that of bicarbonate waters, and the variations may have an origin that resulted from natural hydrochemistry and consequent interaction with the geology of the area, water–rock relations, surrounding vegetation, and exposure to contaminating material or discharges; in our case, the lithological formations of the watershed consist of calcareous conglomerates [54].
Values higher than 8 mg/L for the biological oxygen demand (BOD₅) were observed in all the water bodies analyzed, except for the lower zone of the watershed and transition area to the valley and plains zone (Talgua 1). According to Ramalho [64], these values indicate the presence of contaminated waters due to the presence and oxidation of organic compounds through biological processes. Such contamination may be related to the discharge of domestic wastewater, human and animal wastes, and agricultural and/or industrial wastes loaded with organic compounds: fatty acids, proteins, carbohydrates, and detergents [78]. The dissolved oxygen (DO) showed values close to the minimum limit of <4 mg/L (Talgua 3, Talgua 5, and Talgua 4) and acceptable ≥ 6 mg/L (Talgua 1, Talgua 2, and Talgua 6), as established by the WHO (Table 3). According to Orozco et al. [79], the presence of organic compounds and high BOD5 generate an increase in oxygen demand due to the presence of particles, resulting in a decrease in DO levels due to water–sediment exchange.
Regarding NO3 anion concentrations (Table 3), the values found did not exceed the value of 40 mg/L, which was marked by the WHO to establish water potability. In the study area, the presence of this anion may be related to the use of nitrogen fertilizers, waste discharges and septic tanks, and even pesticides [80]. However, López et al. [81] suggested that values higher than 0.02 mg/L of N can cause eutrophication processes. The concentrations of PO43− were very high, especially in Talgua 4 (stream), Talgua 5 (lake), and Talgua 6. These contents are associated with the use of agrochemicals, manure, industrial discharges, and urban wastewater, far exceeding the critical concentrations for water eutrophication. In relation to human health, previous studies by Lavie et al. [67] and Meza [82] recommended values of up to 0.70 mg/L, and the continuous consumption of water containing phosphates is associated with cancer, neurodegenerative, renal diseases, and osteoporosis.
In the temperature records (Table 3), the results allow for inferring that temperature is influenced by the environment, with an average value of 25 °C, and is considered optimal according to the WHO. As for the total dissolved solids (TDSs) content, the established minimum limit of 200 mg/L was exceeded at both Talgua 4 (stream) and Talgua 5 (lake). In relation to human health, Castillo and Rodríguez [83] reported that TDSs can be unpleasant to the palate and cause unfavorable physiological reactions and gastrointestinal irritation. Its origin is established in the contributions of waste discharges, erosive processes, and by the reduction of water levels. On the other hand, Avalos and González [84] agreed that these circumstances will affect aquatic organisms and accumulated sediments destroying feeding or spawning sites, filling, and obstructing tributaries, and therefore, affect the diversity of the ecosystem.
As for turbidity (Td), values exceeding the minimum limit of 0.3 NTU were present [66]. In agreement with Chibinda et al. [85], the Td was fundamentally due to the presence of inorganic substances: sand, silt, clay, or organics, because of activities related to deforestation, changes in soil use, dumping of substances, infrastructure construction, or intensive agriculture. For electrical conductivity (EC), the WHO established a maximum value of 170 µS/cm. The values found indicate the presence of dissolved salts and make it possible to identify changes in the soil quality because of agricultural and industrial activities [86]. In relation to alkalinity (Alk), as an expression of CaCO₃ content, a minimum of 20 mg/L is considered to maintain aquatic life, and waters with lower alkalinities are prone to contamination since they do not have the capacity to buffer pH decreases [87]. In our study area, values above 120 mg/L were reached, which does not pose a risk in terms of decreased buffering capacity.
Regarding hardness (Hd), the sites studied show a classification of waters ranging from moderately hard (Talgua 1) to very hard at Talgua 3 (well), Talgua 4 (stream), and Talgua 5 (lake) [66]. Epidemiological studies by Escobedo et al. [88] indicated that the continuous consumption of these waters can cause problems of renal lithiasis. The Hd increased downstream because of human activity, as well as lithology. Finally, it was observed that the presence of a high load of fecal coliforms (FCs) was observed (Table 3), suggesting a condition caused by agricultural and livestock activity and wastewater discharge. However, the presence of FCs is not always related to fecal contamination in water since these microorganisms can also be found in animals, soil, plants, or effluents containing bottom sediments or organic matter [89].
Table 4 provides a numerical representation of the water quality according to the NSF–WQI index. It shows that only Talgua 1 had good water quality. We consider this point, free of human intervention, to be representative of the original water quality, while, thereafter, at Talgua 2, Talgua 3 (well), Talgua 5 (lake), and Talgua 6, the quality was average. Talgua 4 (stream), which crossed the primary forest, presented poor quality.
In summary, it is evident that there was a close correlation between the TDSs and EC, as evidenced by the fact that as the EC increased, so did the TDSs. These parameters describe the content of inorganic and organic substances. Conversely, BOD₅ was linked to DO, as this parameter represented the oxygen consumed by microorganisms to oxidize the organic matter. The elevated TDS and EC levels observed were the primary cause of the elevated BOD₅ levels, which, in turn, indicate the presence of total coliforms.
These results suggest that this decrease in quality had its origin in the socio-demographic and economic growth of the area, which has led to changes in land use: agriculture, cattle ranching, and industry, generating discharges and the dragging of substances. In addition, changes in climate, such as floods and droughts, also affect water quality. However, the results obtained by analyzing the water of Talgua 4 (stream), which receives the direct impact of the discharges, suggest that the soil was acting as a filter and, to some extent, ameliorated the anthropogenic effects. We are trying to verify this suspicion since we are conducting a study on the effect that the uses exert on the soil.
Table 5 presents contamination indexes, which reveal a high degree, as evidenced by the ICOMI, ICOTRO, and BPI. In addition, other indexes were identified that indicate medium-to-high levels of contamination, such as the ICOSUS and ICOMO, respectively.
The variations observed in the pH and T had no influence on the ICOpH and ICOTemp. However, a high rate of mineralization (ICOMI) was detected as one moved downstream and the urbanization, population, agro-livestock, and industrial activities increased. This was due to parameters such as EC, Hd, and Alk, which affect the carbonate, bicarbonate, and carbon dioxide system. Other parameters, namely, the BOD₅, DO, TDSs, and Td, which are related to the increase in the concentration of organic and inorganic material, altered the ICOMI, ICOMO, and ICOSUS and the pollutant load (BPI). Regarding the trophic pollution (ICOTRO), eutrophic and hypereutrophic processes were found due to high concentrations of nitrogenous nutrients, and specifically phosphates [23].
From the results obtained, we found that in the lower part of the watershed and transition zone, represented by Talgua 1, as well as at Talgua 3 (well), the lowest levels in the indexes were found. On the other hand, Talgua 2, Talgua 5 (lake), and Talgua 6 showed moderate-to-high levels, while Talgua 4 (stream) presented the highest levels in terms of contamination indexes, which reaffirmed the assumption made earlier regarding the filtering effect of the soils.
The state of water quality reflects anthropogenic activities. These activities have their origin in demographic and industrial expansion, the use of agrochemicals, waste disposal and lack of waste treatment, and changes in land use, as well as droughts, floods, and high erosion rates.

3.2.4. Impacts on Ecosystem Services (Water) in the Talgua River Watershed and Surrounding Areas

In this context, the transformation of natural areas into agricultural, livestock, and industrial zones was caused by socio-demographic development and to meet the needs of the population, resulting in a very intense deforestation process. In addition, the study area lacked infrastructure and sewage systems, which resulted in high levels of runoff into the Talgua River. Similarly, the watershed had a high erosion and solifluction potential due to its geology, vegetation cover, soil fragility, abundant rainfall, and slope, all of which had a significant impact on the water flow and quality.
The lower zone of the watershed (Figure 1 and Figure 5) had an alluvial fan in which an intense erosive process was observed. In this zone, represented by Talgua 1, there were the lowest values of the analyzed physicochemical and microbiological parameters, as well as the contamination indexes considered, giving the water a good quality (Table 3, Table 4 and Table 5). The pH was mainly influenced by the natural hydrochemistry and lithology, while the TDSs, Td, Alk, EC, Hd, NO3, and PO43− were influenced by the changes in land use, mainly agricultural and livestock activities.
In the downstream area, represented by Talgua 2, there was a greater process of urbanization and agro-livestock systems were installed in the surrounding plains, with a high use of agricultural inputs (Figure 1 and Figure 5). These factors caused notable changes in the parameters analyzed, such as an increase in the pH, organic compounds, TDSs, Td, EC, and Hd, as well as erosive processes because of changes in the soil use, as well as in the FC load from urban and livestock areas [90]. On the other hand, leachate from agrochemicals, especially PO43− and to a lesser extent NO3, and particles eroded by irrigation water, were returned to the river, stimulating eutrophication processes. The absence of infrastructure in the collection, sanitation, and treatment of wastewater in residential, industrial, and riparian areas increased the pollution of the flow, exceeding the self-purification capacity of the river.
The parameters analyzed in the Talgua 3 (well) water indicate alteration in the aquifers because of infiltration generated by agro-livestock and industrial activity, resulting in contamination due to the presence of organic and inorganic compounds, TDSs, NO3, PO43−, and FCs [91], as shown by the NSF–WQI index and those of contamination (Table 4 and Table 5). However, the low values also demonstrate the capacity presented by the soil in the study area to purify through filtration, degradation, detoxification, or immobilization processes already pointed out previously [92].
Industrial development requires land-use planning [93]. However, this study was an example of the absence of such planning since the primary forest area, which was isolated from the fragmentation of the processes of occupation and transformation, was crossed by a stream (Talgua 4), where the alteration and impacts of the pastures and agricultural lands located in the highlands and surrounding areas, and mainly by the establishment of small meat, vegetable, and dairy processing plants, congregated. All this caused the most extreme data to be observed in terms of organic and inorganic compound contents; pH decreases; and high values of TDSs, Alk, EC, Hd, NO3, and PO43−; as well as severe eutrophication. All this was because of wastewater discharges and the lack of effective treatments [94]; in addition, these conditions could be generating significant environmental impacts on groundwater, and consequently, on the entire primary forest zone.
Regarding the lake (Talgua 5) (Figure 1 and Figure 5), it was surrounded by areas that served a dual function in the surrounding areas, both for activities that use agricultural machinery and inputs, as well as for temporary use as pasture for livestock. These practices caused runoff loaded with particles that later sedimented in the lake. In addition, runoff from irrigation contributed organic and inorganic elements from Talgua 1 and Talgua 2, which caused a decrease in the pH, leaching of agrochemicals, especially nitrogen and phosphate fertilizers, as well as an increase in the bacterial load. These factors, added to the evapotranspiration, absorption, and filtration, were responsible for the deterioration in the lake’s water quality [95].
At Talgua 6 (Figure 1 and Figure 5), it can be seen that all the parameters evaluated increased as human intervention increased, mainly due to agricultural and livestock activities and waste discharges from the dragging of particles from Talgua 1 and 2. This caused increases in the pH, organic and inorganic materials, TDSs, Td, EC, Alk, and Hd, and a decrease in the DO, which compromised the ecosystem’s capacity to maintain aquatic life.
As shown in Table 3, there was a significant increase in the pH (7.30–8.40), BOD₅ (3.70–110.00 mg/L), NO3 (0.30–2.50 mg/L), PO43− (0.10–3.10 mg/L), TDSs (110.00–214.90 mg/L), Td (2.83–6.00 NTU), EC (213.00–393.00 μS/cm), Alk (123.00–200.00 mg/L), Hd (117.00–215.00 mg/L), and bacterial load (2.00–920.00 NMP/100 mL), while a decrease in the DO levels (6.70–4.30 mg/L) was recorded. These results confirm previous findings documented in studies by other authors [96,97,98]. On the other hand, because of the influence of urbanization and industrialization in the surrounding environment, a significant increase in the bacterial load was highlighted, with 920.00 NMP/100 mL, as well as in the concentrations of the NO3 (2.70 mg/L), PO43− (3.20 mg/L), TDSs (271.40 mg/L), Td (7.50 NTU), EC (469.00 mg/L), Alk (242.20 mg/L), and Hd (266.80 mg/L). At the same time there was a decrease in the pH (7.40) and DO (4.10 mg/L). These results agree with previous studies [99,100].

3.2.5. Responses Oriented to Driving Forces, Pressures, State, and Impacts in the Talgua River Watershed and Surrounding Areas

Tropical ecosystems are extremely fragile, as evidenced by the rapid turnover that takes place, and because of this, any impact has wide-ranging effects on the rest of the environmental elements. The deforestation of tropical forests to provide areas for pasture, crops, and settlement of population and industries causes, as an indirect effect, the pollution of river courses. Therefore, it is necessary to develop measures aimed at achieving a balance between meeting the needs of the population and the ecosystem, i.e., the adoption of measures aimed at achieving sustainable development.
The transformation of a primary tropical forest in Honduras into urban, agro-livestock, and industrial areas has led, among others, to a high demand for water and a decrease in its quality. In this section, we propose responses to address the driving forces, reduce pressures, improve the state, and mitigate the impacts of human activity (urbanism, livestock, agriculture, and industry) when deforesting primary tropical forests. Forests provide essential ecosystem services, including the production of quality water for both human and ecosystem use, making it crucial to act on these issues using the DPSIR model as a reference.
Action on the driving forces is based on the implementation of urbanization, soil management, and conservation policies, as well as land-use planning to regulate settlements. These policies should be the guiding axis that guarantees the sustainable management of water resources: the promotion of environmental education and prevention of diseases caused by the consumption of contaminated water.
In relation to the pressures exerted on the ecosystem, regarding the availability of water in quantity and quality, we suggest the adoption of efficient techniques of lower water consumption and less pollutants, as well as adapting the needs to the productive capacity of the ecosystem.
Regarding the state, we consider that the correct implementation of watershed management regulations—specifically in Honduras, the Forest Conservation Institute is responsible for the declaration, restoration, and administration of watersheds—will allow for maintaining the provision of ecosystem goods and services. Specifically, those related to the implementation of water infrastructures for water collection and treatment, the monitoring of physicochemical and microbiological parameters, or the adoption of agricultural and livestock farming practices aimed at soil and water conservation.
Regarding the impact, it is suggested to adopt more efficient irrigation systems, implement sustainable agriculture and smart cultivation, manage and recycle solid waste, and install infrastructures for the treatment and purification of grey water. Additionally, this section emphasizes strategies to reduce negative effects from a holistic approach.
To improve flood resilience, it is essential to raise awareness and educate stakeholders and institutions. This should be accompanied by knowledge generation, research, and effective communication. Additionally, restoring natural habitats, implementing territorial and urban planning, and reducing exposure in flood-prone areas are crucial steps.
The provided proposals are part of a comprehensive plan for protecting and managing the ecosystem. The plan considers socio-demographic, economic, technological, and tourism factors, and aims to ensure the conservation and sustainable use of ecosystem services, particularly in fragile areas, such as primary tropical forests.

4. Conclusions

The analysis using the DPSIR model of anthropogenic modification of ESs showed that deforestation and changes in land use, driven by the demographic growth and intensification of agricultural and industrial activities, had a negative impact on the water quality in the Talgua River watershed and adjacent areas.
Economic growth, demographic growth, the integration of the economy into markets, and the increase in the purchasing power of local communities have led to a rapid increase in agricultural, livestock, and industrial activities in the area such that the need for raw materials, energy, food, and water are the driving forces that act primarily on the ESs, and in particular, those related to the water supply, maintenance, and regulation. Increasing pressure on resources led to water quality degradation and scarcity. Only the upper part of the valley (sample Talgua 1) had good water quality conditions. Further south, and coinciding with the areas affected by deforestation, the impact on the ESs could be seen, resulting in the most polluted water bodies. The results indicate a decline in the ESs, as the current water production capacity in terms of quantity and quality is insufficient to guarantee the sustainable management of water resources in the medium to long term.
The analysis of the ESs, according to the DPSIR model, can be used to guide decisions on the development of proactive strategies for the responsible and appropriate use of water, soil, and forest resources. This implies the application and possible modification of legislation; the public and targeted dissemination of relevant information; and the monitoring of the ecosystem, with particular emphasis on maintaining its natural balance.
Considering the current state of the ecosystem and ESs of the Talgua River watershed and surrounding areas, the maintenance and even increase of pressures suggest responses related to soil, water, and forest management. These responses include the adaptation of current soil and water management practices to minimize the impact on resources and ESs, the development of land-use plans consistent with sustainable management of the territory, the restoration of aquatic habitats, and the application of environmental policies compatible with socio-economic development. The awareness and participation of the administrations and the population are key to sustainable management and governance.

Author Contributions

Conceptualization, formal analysis, funding acquisition, resources, visualization, S.A.S.-M., L.F.F.-P. and M.Á.R.-G.; project administration, L.F.F.-P. and M.Á.R.-G.; supervision, L.F.F.-P., B.R.-R. and M.Á.R.-G.; data curation, investigation, methodology, validation, writing—original draft, writing—review and editing, S.A.S.-M., L.F.F.-P., B.R.-R. and M.Á.R.-G. All authors have read and agreed to the published version of the manuscript.

Funding

This research received no external funding.

Institutional Review Board Statement

Not applicable.

Informed Consent Statement

Not applicable.

Data Availability Statement

The authors confirmed that the data supporting the findings of this study are available within the article and the raw data that support the findings are available from the corresponding author upon reasonable request.

Acknowledgments

The authors express their gratitude to the Universidad de Extremadura—UEx (Spain) and the Universidad Nacional de Agricultura—UNAG (Honduras).

Conflicts of Interest

The authors declare no conflicts of interest.

References

  1. Cai, J.; He, Y.; Xie, R.; Liu, Y. A footprint-based water security assessment: An analysis of Hunan province in China. J. Clean. Prod. 2020, 245, 118485. [Google Scholar] [CrossRef]
  2. Yin, B.; Guan, D.; Zhou, L.; Zhou, J.; He, X. Sensitivity assessment and simulation of water resource security in karst areas within the context of hydroclimate change. J. Clean. Prod. 2020, 258, 120994. [Google Scholar] [CrossRef]
  3. United Nations. United Nations World Water Development Report 2022. Groundwater: Making the Invisible Resource Visible; United Nations Educational, Scientific and Cultural Organization (UNESCO): Paris, France, 2022; Available online: https://unesdoc.unesco.org/ark:/48223/pf0000382894 (accessed on 5 April 2024).
  4. WWAP (UNESCO World Water Assessment Programme). United Nations World Water Development Report. Wastewater: The Untapped Resource; United Nations Educational, Scientific and Cultural Organization (UNESCO): Paris, France, 2017; Available online: https://unesdoc.unesco.org/ark:/48223/pf0000247647 (accessed on 10 April 2024).
  5. OMS/UNICEF (World Health Organization/United Nations Children’s Fund). Progress on Household Drinking Water, Sanitation and Hygiene 2000–2020: Five Years into the SDGs; OMS/UNICEF: Geneva, Switzerland, 2021; Available online: https://www.who.int/publications/i/item/9789240030848 (accessed on 1 April 2024).
  6. Zou, H.; Wang, L. The disinfection effect of a novel continuous-flow water sterilizing system coupling dual-frequency ultrasound with sodium hypochlorite in pilot scale. Ultrason. Sonochem. 2017, 36, 246–252. [Google Scholar] [CrossRef]
  7. Chaudhari, A.N.; Mehta, D.J.; Sharma, N.D. Coupled effect of seawater intrusion on groundwater quality: Study of South-West zone of Surat city. Water Supply 2022, 22, 1716–1734. [Google Scholar] [CrossRef]
  8. IPBES (Intergovernmental Platform on Biodiversity and Ecosystem Services). The Global Assessment Report on Biodiversity and Ecosystem Services: Summary for Policymakers; Díaz, J.S., Settele, E.S., Brondízio, H.T., Ngo, M., Guèze, J., Agard, A., Arneth, P., Balvanera, K.A., Brauman, S.H.M., Butchart, K.M.A., et al., Eds.; Secretaría de IPBES: Bonn, Germany, 2019; Available online: https://zenodo.org (accessed on 25 March 2024).
  9. Venieri, D.; Karapa, A.; Panagiotopoulou, M.; Gounaki, I. Application of activated persulfate for the inactivation of fecal bacterial indicators in water. J. Environ. Manag. 2020, 261, 110223. [Google Scholar] [CrossRef] [PubMed]
  10. Jia, X.; O’Connor, D.; Hou, D.; Jin, Y.; Li, G.; Zheng, C.; Ok, Y.S.; Tsang, D.C.W.; Luo, J. Groundwater depletion and contamination: Spatial distribution of groundwater resources sustainability in China. Sci. Total Environ. 2019, 672, 551–562. [Google Scholar] [CrossRef] [PubMed]
  11. United Nations. United Nations World Water Development Report 2023: Partnerships and Cooperation for Water; Informe de las Naciones Unidas sobre el Desarrollo de los Recursos Hídricos en el Mundo 2023|ONU-Agua; UNESCO: Paris, France, 2023; Available online: https://reliefweb.int/report/world/united-nations-world-water-development-report-2023-partnerships-and-cooperation-water-enit?gad_source=1&gclid=CjwKCAjwjqWzBhAqEiwAQmtgT4n5aOEmi9aq7F63v9Qn-lkBFe_d6JaLfsucUJjPJDXq7m4rb7djPxoCUNkQAvD_BwE (accessed on 20 March 2024).
  12. Alcamo, J. Water quality and its interlinkages with the Sustainable Development Goals. Curr. Opin. Environ. Sustain. 2019, 36, 126–140. [Google Scholar] [CrossRef]
  13. Rosati, F.; Faria, L.G.D. Addressing the SDGs in sustainability reports: The relationship with institutional factors. J. Clean. Prod. 2019, 215, 1312–1326. [Google Scholar] [CrossRef]
  14. Cook, C.; Bakker, K. Water security: Debating an emerging paradigm. Glob. Environ. Chang. 2012, 22, 94–102. [Google Scholar] [CrossRef]
  15. Sadoff, C.; Muller, M. La Gestión del Agua, la Seguridad Hídrica y la Adaptación al Cambio Climático: Efectos Anticipados y Respuestas Esenciales; TEC Background Papers; Global Water Partnership Comité Técnico: Stockholm, Sweden, 2010; Volume 14, pp. 1–108. Available online: https://gwp.org (accessed on 15 March 2024).
  16. Brown, R.; Macclelland, N.; Deininger, R.; Tozer, R. A Water Quality Index—Do We Dare? Water Sew. Work. 1970, 11, 339–343. [Google Scholar]
  17. Dinius, S.H. Design of a Index of Water Quality. J. Am. Water Resour. Assoc. 1987, 23, 833–843. [Google Scholar] [CrossRef]
  18. CCME. Canadian Drinking Water Quality Guidelines for the Protection of Aquatic Life; Winnipeg Technical Report, CCME Water Quality Index 1.0; CCME: Huntsville, ON, Canada, 2001; pp. 1–13. [Google Scholar]
  19. UNEP. Global Drinking Water Quality Index Development and Sensitivity Analysis Report. 2007. Available online: https://www.unep.org/resources/report/global-drinking-water-quality-index-development-and-sensitivity-analysis-report-0 (accessed on 15 March 2024).
  20. Boyacioglu, H. Development of a water quality index based on a European classification scheme. Water SA 2007, 33, 101–106. [Google Scholar] [CrossRef]
  21. Queralt, R. Calidad de las aguas de los ríos. Tecnol. Agua 1982, 4, 49–57. [Google Scholar]
  22. Ramírez, A.; Restrepo, R.; Viña, G. Cuatro índices de contaminación para caracterización de aguas continentales: Formulaciones y aplicación. Cienc. Tecnol. Futuro 1997, 1, 1–19. [Google Scholar]
  23. Ramírez, A.; Restrepo, R.; Cardeñosa, M. Índices de Contaminación para Caracterización de Aguas Continentales y Vertimientos. Formulaciones. Cienc. Tecnol. Futuro 1999, 1, 89–99. [Google Scholar]
  24. Brink, B.J.E.T.; Hosper, S.H.; Colijn, F. A Quantitative Method for Description & Assessment of Ecosystems: The AMOEBA-approach. Mar. Pollut. Bull. 1991, 23, 265–270. [Google Scholar] [CrossRef]
  25. Torres, P.; Cruz, C.H.; Patiño, P.J. Índices de calidad de agua en fuentes superficiales utilizadas en la producción de agua para consumo humano. Una revisión crítica. Rev. Ing. Univ. Medellín 2009, 8, 79–94. Available online: https://scielo.org.co (accessed on 10 March 2024).
  26. Nayak, J.G.; Patil, L.G.; Patki, V.K. Artificial neural network based water quality index (WQI) for river Godavari (India). Mater. Today Proc. 2023, 81, 212–220. [Google Scholar] [CrossRef]
  27. Mehta, D.J.; Yadav, S.M. Meteorological drought analysis in Pali District of Rajasthan State using standard precipitation index. Hydrol. Sci. Technol. 2022, 15, 1–10. [Google Scholar] [CrossRef]
  28. Yan, T.; Shen, S.L.; Zhou, A. Indices and models of surface water quality assessment: Review and perspectives. Environ. Pollut. 2022, 1, 119611. [Google Scholar] [CrossRef]
  29. Mendoza, M.E.; Granados, E.L.; Geneletti, D.; Pérez-Salicrup, D.R.; Salinas, V. Analysing land cover and land use change processes at watershed level: A multitemporal study in the Lake Cuitzeo Watershed, Mexico (1975–2003). Appl. Geogr. 2011, 31, 237–250. [Google Scholar] [CrossRef]
  30. Hasan, S.S.; Zhen, L.; Miah, M.G.; Ahamed, T.; Samie, A. Impact of land use change on ecosystem services: A review. Environ. Dev. 2020, 34, 100527. [Google Scholar] [CrossRef]
  31. Feng, H.; Wang, S.; Zou, B.; Nie, Y.; Ye, S.; Ding, Y.; Zhu, S. Land use and cover change (LUCC) impacts on Earth’s eco-environments: Research progress and prospects. Adv. Space Res. 2023, 71, 1418–1435. [Google Scholar] [CrossRef]
  32. Boerema, A.; Rebelo, A.J.; Bodi, M.B.; Esler, K.J.; Meire, P. Are Ecosystem Services Adequately Quantified? J. Appl. Ecol. 2017, 54, 358–370. [Google Scholar] [CrossRef]
  33. Durand, A.; Leglize, P.; Benizri, E. Are Endophytes Essential Partners for Plants and What Are the Prospects for Metal Phytoremediation? Plant Soil 2021, 460, 1–30. [Google Scholar] [CrossRef]
  34. Yu, R.; Deng, X.; Yan, Z.; Shi, C. Dynamic evaluation of land productivity in China. Popul. Resour. Environ. 2013, 11, 253–260. [Google Scholar] [CrossRef]
  35. Maxim, L.; Spangenberg, J.H.; O’Connor, M. An analysis of risks for biodiversity under the DPSIR framework. Ecol. Econ. 2009, 69, 12–23. [Google Scholar] [CrossRef]
  36. Niemeijer, D.; de Groot, R.S. Framing environmental indicators: Moving from causal chains to causal networks. Environ. Dev. Sustain. 2008, 10, 89–106. [Google Scholar] [CrossRef]
  37. Pinto, R.; de Jonge, V.N.; Neto, J.M.; Domingos, T.; Marques, J.C.; Patrício, J. Towards a DPSIR driven integration of ecological value, water uses and ecosystem services for estuarine systems. Ocean. Coast. Manag. 2013, 72, 64–79. [Google Scholar] [CrossRef]
  38. Ahmed, S.N.; Anh, L.H.; Schneider, P. A DPSIR Assessment on Ecosystem Services Challenges in the Mekong Delta, Vietnam: Coping with the Impacts of Sand Mining. Sustainability 2020, 12, 9323. [Google Scholar] [CrossRef]
  39. Santos, E.; Fonseca, F.; Santiago, A.; Rodrigues, D. Sustainability Indicators Model Applied to Waste Management in Brazil Using the DPSIR Framework. Sustainability 2024, 16, 2192. [Google Scholar] [CrossRef]
  40. Akbari, M.; Memarian, H.; Neamatollahi, E.; Shalamzari, M.J.; Noughani, M.A.; Zakeri, D. Prioritizing policies and strategies for desertification risk management using MCDM-DPSIR approach in northeastern Iran. Environ. Dev. Sustain. 2021, 23, 2503–2523. [Google Scholar] [CrossRef]
  41. Labianca, C.; de Gisi, S.; Todaro, F.; Notarnicola, M. DPSIR Model Applied to the Remediation of Contaminated Sites. A Case Study: Mar Piccolo of Taranto. Appl. Sci. 2020, 10, 5080. [Google Scholar] [CrossRef]
  42. Liu, S.; Deichmann, M.; Moro, M.A.; Andersen, L.A.; Li, F.; Dalgaard, T.; McKnight, U.S. Targeting sustainable greenhouse agriculture policies in China and Denmark: A comparative study. Land Use Policy 2022, 119, 106148. [Google Scholar] [CrossRef]
  43. Gari, S.R.; Guerrero, C.E.O.; Uribe, B.A.; Icely, J.D.; Newton, A. A DPSIR-analysis of water uses and related water quality issues in the Colombian Alto and Medio Dagua Community Council. Water Sci. 2018, 32, 318–337. [Google Scholar] [CrossRef]
  44. Agramont, A.; van Cauwenbergh, N.; van Griesven, A.; Craps, M. Integrating spatial and social characteristics in the DPSIR framework for the sustainable management of river basins: Case study of the Katari River Basin, Bolivia. Water Int. 2022, 47, 8–29. [Google Scholar] [CrossRef]
  45. Wantzen, K.M.; Alves, C.B.M.; Badiane, S.D.; Bala, R.; Blettler, M.; Callisto, M.; Cao, Y.; Kolb, M.; Kondolf, G.M.; Leite, M.F.; et al. Urban Stream and Wetland Restoration in the Global South—A DPSIR Analysis. Sustainability 2019, 11, 4975. [Google Scholar] [CrossRef]
  46. Quevedo, J.M.D.; Uchiyama, Y.; Kohsaka, R. A blue carbon ecosystems qualitative assessment applying the DPSIR framework: Local perspective of global benefits and contributions. Mar. Policy 2021, 128, 104462. [Google Scholar] [CrossRef]
  47. Obubu, J.P.; Odong, R.; Alamerew, T.; Fetahi, T.; Mengistou, S. Application of DPSIR model to identify the drivers and impacts of land use and land cover changes and climate change on land, water, and livelihoods in the L. Kyoga basin: Implications for sustainable management. Environ. Syst. Res. 2022, 11, 11. [Google Scholar] [CrossRef]
  48. Kosamu, I.B.M.; Makwinja, R.; Kaonga, C.C.; Mengistou, S.; Kaunda, E.; Alamirew, T.; Njaya, F. Application of DPSIR and Tobit Models in Assessing Freshwater Ecosystems: The Case of Lake Malombe, Malawi. Water 2022, 14, 619. [Google Scholar] [CrossRef]
  49. Wang, B.; Yu, F.; Teng, Y.; Cao, G.; Zhao, D.; Zhao, M. A SEEC Model Based on the DPSIR Framework Approach for Watershed Ecological Security Risk Assessment: A Case Study in Northwest China. Water 2022, 14, 106. [Google Scholar] [CrossRef]
  50. Nurbayani, S.; Dede, M. The Effect of COVID-19 on White-Collar Workers: The DPSIR Model and Its Semantic Aspect in Indonesia. Int. J. Soc. Cult. Lang. 2022, 10, 73–88. [Google Scholar] [CrossRef]
  51. Argeñal, F. Variabilidad Climática y Cambio Climático en Honduras. SERNA-PNUD. 2010. Available online: https://academia.edu (accessed on 5 January 2024).
  52. Sönke, K.; Eckstein, D.; Dorsch, L.; Fischer, L. Global Climate Risk Index 2016: Who Suffers most from Extreme Weather Events? Weather-Related Loss Events in 2014 and 1995 to 2014. In Think Tank & Research. 2015. Available online: http://www.germanwatch.org/en/cri (accessed on 20 February 2024).
  53. Sandoval, J.T.R.; Rodríguez, A.S. Análisis morfométrico y biofísico en la cuenca del río Talgua, Honduras. Cienc. Lat. Rev. Cient. Multidiscip. 2021, 5, 12024–12042. [Google Scholar] [CrossRef]
  54. CIAT (Centro Internacional de Agricultura Tropical). Mapa Geológico de Honduras. 1999. Available online: https://www.semanticscholar.org/paper/Mapa-Geologico-de-Honduras-Ciat/2e799cecc3308d3a4aa1360d0a968552fee909c3 (accessed on 15 March 2024).
  55. Sandoval, W.M.R. Landscape Heterogeneity and Complexity: Implications for Terrestrial Carbon and Water Cycles; North Carolina State University, Forestry and Environmental Resources: Raleigh, NC, USA, 2017; pp. 1–203. Available online: https://repository.lib.ncsu.edu/server/api/core/bitstreams/72a3645f-ae5a-4dae-af45-53fef0b4ddf4/content (accessed on 5 February 2024).
  56. WRB (IUSS Working Group). World Reference Base for Soil Resources. In International Soil Classification System for Naming Soils and Creating Legends for Soil Maps, 4th ed.; International Union of Soil Sciences (IUSS): Vienna, Austria, 2022; Available online: https://obrl-soil.github.io (accessed on 6 January 2024).
  57. FAO (Food and Agriculture Organization of the United Nations). Guía para la Descripción de Suelos, 4th ed.; FAO: Roma, Italy, 2009; ISBN 978-92-5-305521-0. Available online: https://www.fao.org/publications/card/en/c/0f070cdd-1b6d-53fa-add1-5c972fb299d2/ (accessed on 17 March 2024).
  58. NASA (National Aeronautics and Space Administration). 2024. Available online: https://power.larc.nasa.gov/beta/data-access-viewer/ (accessed on 5 June 2024).
  59. Sosa, S.I.K.; Samora, F.U.V. Evaluación Ecológico—Hidrológica del Plan de Manejo de la Microcuenca del Río Talgua, Olancho; Escuela Agrícola Panamericana: Zamorano, Honduras, 2006; pp. 1–53. Available online: https://bdigital.zamorano.edu/server/api/core/bitstreams/ceefd917-b74f-4d58-be35-31187f9a82f9/content (accessed on 10 April 2024).
  60. ICF (Instituto de Conservación Forestal). Mapa Cobertura Forestal. 2018. Available online: http://geoportal.icf.gob.hn/geoportal/main (accessed on 5 January 2024).
  61. BS EN ISO 5667-14:2016; Water Quality—Sampling—Guidance on Quality Assurance and Quality Control of Environmental Water Sampling and Handling. ISO: Geneva, Switzerland, 2014. [CrossRef]
  62. Mendoza, L.G.; Rosas, D.; Zamar, S.; Nickisch, M.B.; INTA (Instituto Nacional de Tecnología Agropecuaria). Protocolo de Muestreo, Transporte y Conservación de Muestras de Agua con Fines Múltiples (Consumo Humano, Abrevado Animal y Riego); Ministerio de Agricultura, Ganadería y Pesca: Montevideo, Uruguay, 2011; pp. 1–11. Available online: https://www.produccion-animal.com.ar/agua_bebida/107-Protocolo_Aguas_INTA.pdf (accessed on 5 January 2024).
  63. Rice, E.W.; Baird, R.B.; Eaton, A.D. Standard Methods for the Examination of Water and Wastewater, 23rd ed.; American Public Health Association: Washington, DC, USA; American Waterworks Association: Denver, CO, USA; Water Environment Federation: Alexandria, VA, USA, 2017; ISBN 9780875532875. [Google Scholar]
  64. Ramalho, R.S. Tratamiento de Aguas Residuales; Editorial Reverté, S.A.: Barcelona, Spain, 2003; pp. 1–284. [Google Scholar]
  65. Murrell, J.A.L.; Badía, M.M.R.; Álvarez, B.R.; Hernández, N.M.R.; Pérez, M.H. Bacterias indicadoras de contaminación fecal en la evaluación de la calidad de las aguas: Revisión de la literatura Revista CENIC. Cienc. Biol. 2013, 44, 24–34. Available online: http://www.redalyc.org/articulo.oa?id=181229302004 (accessed on 10 March 2024).
  66. WHO (World Health Organization). A Global Overview of National Regulations and Standards for Drinking-Water Quality, 2nd ed.; World Health Organization: Geneva, Switzerland, 2021; Available online: https://www.who.int/publications/i/item/9789241513760 (accessed on 5 February 2024).
  67. Lavie, E.; Bermejillo, A.; Morábito, J.A.; Filippini, M.F.; Salatino, S.E. Contaminación por fosfatos en el oasis bajo riego del río Mendoza. Rev. Fac. Cienc. Agrar. 2010, 42, 169–184. Available online: https://uncu.edu.ar (accessed on 3 March 2024).
  68. Fernández, N.; Ramos, G.; Solano, F. Una Herramienta para la Valoración de la Calidad del Agua; Vicerrectoria de Investigaciones—Unipamplona—Libros y Software; Universidad de Pamplona: Pamplona, Colombia, 2005. [Google Scholar]
  69. NASA/USGS (National Aeronautics and Space Administration/U.S. Geological Survey). Landsat 7|Servicio Geológico de EE. UU. 2024. Available online: https://usgs.gov (accessed on 2 March 2024).
  70. QGIS.org. QGIS 3.34 Geographic Information System. QGIS Association. 2024. Available online: http://www.qgis.org (accessed on 1 February 2024).
  71. Haines-Young, R.; Potschin-Young, M. Common International Classification of Ecosystem Services (CICES) V5.2 and Guidance on the Application of the Revised Structure. 2023. Available online: https://cices.eu/ (accessed on 8 April 2024).
  72. Carnohan, S.A.; Trier, X.; Liu, S.; Clausen, L.P.W.; Clifford-Holmes, J.K.; Hansen, S.F.; Benini, L.; McKnight, U.S. Next generation application of DPSIR for sustainable policy implementation. Curr. Res. Environ. Sustain. 2023, 5, 100201. [Google Scholar] [CrossRef]
  73. Forest Trens. Transformaciones del Paisaje Rural en Honduras: Explorando el Nuevo Mapa Forestal y de Cobertura de la Tierra del País y sus Implicaciones Políticas para REDD+ y AVA-FLEGT. 1–10. 2014. Available online: https://forest-trends.org (accessed on 2 April 2024).
  74. Tsakiris, G. Proactive Planning Against Droughts. Procedia Eng. 2016, 162, 15–24. [Google Scholar] [CrossRef]
  75. Hanson, D.L.; Steenhuis, T.S.; Walter, M.F.; Boll, J. Effects of soil degradation and management practices on the surface water dynamics in the Talgua river watershed in Honduras. Land Degrad. Dev. 2004, 15, 367–381. [Google Scholar] [CrossRef]
  76. Sandoval, J.T.R.; Rodríguez, A.S. Vulnerability to climate variability of productive livelihoods in the Talgua watershed, Honduras. Discov. Sustain. 2022, 3, 18. [Google Scholar] [CrossRef]
  77. Racines, C.E.N.; Rojas, F.A.M.; Herrera, L.L.L.; Bonilla, D.O.; Sánchez, J.M.C. Desarrollo de los Escenarios Climáticos de Honduras y Módulo Académico de Capacitación. CIAT-PNUD-Dirección Nacional de Cambio Climático de MiAmbiente. 2018; pp. 1–140. Available online: https://aguadehonduras.gob.hn/files/Reporte_Final_Escenarios3cncch_vFinal_lr.pdf (accessed on 2 May 2024).
  78. Barrenetxea, C.O.; Serrano, A.P.; Delgado, M.N.G.; Vidal, F.J.R.; Blanco, J.M.A. Contaminación Ambiental. Una Visión Desde la Química, 1st ed.; Editora Paraninfo S.A.: Madrid, Spain, 2011; pp. 1–590. [Google Scholar]
  79. Orozco, C.d.l.M.; López, H.E.F.; Chávez, A.D.; Corral, J.A.R. Cambio climático y el impacto en la concentración de oxígeno disuelto en el Lago de Chapala. Rev. Mex. Cienc. Agríc. 2011, 2, 381–394. Available online: https://scielo.org.mx (accessed on 2 March 2024).
  80. Alfaro, J.D.B.; Castro, G.C.; Araya, G.S. Determinación de nitritos, nitratos, sulfatos y fosfatos en agua potable como indicadores de contaminación ocasionada por el hombre, en dos cantones de Alajuela (Costa Rica). Tecnol. Marcha 2017, 30, 15–27. [Google Scholar] [CrossRef]
  81. López, M.E.P.; Sanchez-Martinez, M.G.; de la Rosa, M.G.V.; Leon, M.T. Eutrophication levels through San Pedro-Mezquital River Basin. J. Environ. Prot. 2013, 4, 45–50. [Google Scholar]
  82. Meza, L.J.G. Estandarización de las Técnicas de Fosfatos y Cloruros en Aguas Crudas y Tratadas para el Laboratorio de la Asociación Municipal de Acueductos Comunitarios (AMAC) en el Municipio de Dosquebradas; Universidad Tecnológica de Pereira: Pereira, Colombia, 2011; pp. 1–57. Available online: https://utp.edu.co (accessed on 2 April 2024).
  83. Castillo, A.G.P.; Rodríguez, A. Índice fisicoquímico de la calidad de agua para el manejo de lagunas tropicales de inundación. Rev. Biol. Trop. 2008, 56, 1905–1918. [Google Scholar]
  84. Avalos, G.A.T.; González, E.A.L. Disminución de sólidos de aguas grises mediante un proceso de aireación. Ra Ximhai 2017, 13, 393–404. Available online: https://www.redalyc.org/articulo.oa?id=46154070023 (accessed on 15 February 2024). [CrossRef]
  85. Chibinda, C.; de los Arada-Pérez, C.M.; Pérez-Pompa, N. Caracterización por métodos físico-químicos y evaluación del impacto cuantitativo de las aguas del Pozo la Calera. Rev. Cuba. Quím. 2017, 29, 303–321. [Google Scholar]
  86. Hernández, E.A.G.; Flores, G.C. Uso de suelo y calidad del agua. Caso de estudio: Reserva de la Biosfera Los Volcanes. Rev. Latinoam. Ambiente Cienc. 2017, 8, 41–67. Available online: https://buap.mx (accessed on 3 March 2024).
  87. Goyenola, G. Guía para la utilización de las Valijas Viajeras—Alcalinidad. Determinación de la Alcalinidad Total. Red de Monitoreo Ambiental Participativo de Sistemas Acuáticos. RED MAPSA. Versión 1.0. 2007. Available online: https://www.studocu.com/es-mx/document/universidad-autonoma-metropolitana/laboratorio-de-fisicoquimica-computacional/alcalinidad-alcalinidd/27653794 (accessed on 2 March 2024).
  88. Escobedo, M.M.; Zaidi, M.; Real-de León, E.; Rivadeneyra, S.O. Prevalencia y factores de riesgo en Yucatán, México para litiasis urinarias. Rev. Salud Pública 2022, 44, 541–545. Available online: https://www.insp.mx/salud/index.html (accessed on 5 March 2024).
  89. Ortega, L.M.R.; Vidal, L.A.; Vilardy, S.Q.; Díaz, L.S. Análisis de la contaminación microbiológica (coliformes totales y fecales) en la bahía de santa marta, caribe colombiano. Acta Biol. 2008, 13, 87–98. Available online: https://unal.edu.co (accessed on 27 February 2024).
  90. Chará, J.; Pedraza, G.; Giraldo, L.; Hincapié, D. Efecto de los corredores ribereños sobre el estado de quebradas en la zona ganadera del río La Vieja, Colombia. Agrofor. Am. 2006, 45, 72–78. Available online: https://repositorio.catie.ac.cr/handle/11554/7728 (accessed on 1 March 2024).
  91. Freeze, A.R.; Cherry, J.A. Groundwater, 1st ed.; Prentice-Hall: Hoboken, NJ, USA, 1979; pp. 1–624. [Google Scholar]
  92. Doran, J.W.; Parkin, T.B. Quantitave indicators of soil quality: A minimum data set. Methods for assessing soil quality. Soil Sci. Soc. Am. 1996, 49, 25–37. [Google Scholar] [CrossRef]
  93. Pérez, M.A.L. El impacto del Ordenamiento Territorial y Catastral en el Modelo Valuatorio de Honduras. Milímetro 2020, 6, 35–51. Available online: https://researchgate.net (accessed on 4 January 2024).
  94. Moreno, H.S.; Bolívar-Anillo, H.J.; Soto-Varela, Z.E.; Aranguren, Y.; Gonzaléz, C.P.; Daza, D.A.V.; Anfuso, G. Microbiological water quality and sources of contamination along the coast of the Department of Atlántico (Caribbean Sea of Colombia). Preliminary results. Mar. Pollut. Bull. 2019, 142, 303–308. [Google Scholar] [CrossRef] [PubMed]
  95. Yu, D.; Shi, P.; Liu, Y.; Xun, B. Detecting land use and water quality relationships from the view point of ecological restoration in an urban area. Ecol. Eng. 2013, 53, 205–216. [Google Scholar] [CrossRef]
  96. Mello, K.; Valente, R.A.; Randhir, T.O.; Santos, A.C.A.; Vettorazzi, C.A. Effects of land use and land cover on water quality of low-order streams in Southeastern Brazil: Watershed versus riparian zone. Catena 2018, 167, 130–138. [Google Scholar] [CrossRef]
  97. Molina, M.C.; Roa-Fuentes, C.A.; Zeni, J.O.; Casatti, L. The effects of land use at different spatial scales on instream features in agricultural streams. Limnologica 2017, 65, 14–21. [Google Scholar] [CrossRef]
  98. Cruz, M.A.S.; Gonçalves, A.A.; Aragâo, R.; Amorim, J.R.A.; Mota, P.V.M.; Srinivasan, V.S.; Garcia, C.A.B.; Figueiredo, E.E. Spatial and seasonal variability of the water quality characteristics of a river in Northeast Brazil. Environ. Earth Sci. 2019, 78, 68. [Google Scholar] [CrossRef]
  99. De Figueiredo, H.P.; de Figueiredo, C.R.P.; Barros, J.H.d.S.; Cosntantino, M.; Magalhães-Filho, F.J.C.; de Moraes, P.M.; da Costa, R.B. Water quality in an urban environmental protection area in the Cerrado Biome, Brazil. Environ. Monit. Assess. 2019, 191, 117. [Google Scholar] [CrossRef]
  100. Cunha, D.G.F.; Sabogal-Paz, L.P.; Dodds, W.K. Land use influence on raw surface water quality and treatment costs for drinking supply in Sao Paulo State (Brazil). Ecol. Eng. 2016, 94, 516–524. [Google Scholar] [CrossRef]
Figure 1. Talgua River watershed and sample points in the study area (Honduras). Author.
Sustainability 16 05034 g001
Figure 3. Schematic representation of the DPSIR model (extracted from [72]).
Sustainability 16 05034 g003
Figure 4. DPSIR model of the Talgua River watershed and associated areas of valleys and plains. Author.
Sustainability 16 05034 g004
Figure 5. Representation of land-use changes in the Talgua River watershed and associated valley and plains areas. Author.
Sustainability 16 05034 g005
Figure 6. Time series of mean rainfall recorded during the period 1998–2019 in the study area (extracted and adapted from research by [76]).
Sustainability 16 05034 g006
Table 1. Parameters, weights, and classification used in the determination of the water quality index (NSF–WQI).
IndexParameter (Unit)Weight aMinimum and Maximum Acceptable RangeAggregation FormulaNSF–WQI Classification
NSF–WQI
[16]
BOD5 (mg/L)0.113–8 mg/L [64]NSF–WQI = i = 1 n S u b i W i (6)91–100 = Excellent
71–90 = Good
51–70 = Medium
26–50 = Bad
0–25 = Very bad
FCs (NMP/100 mL)0.160–20 NMP/100 mL [65]
NO3 (mg/L)0.100–40 mg/L [66] c
PO43 (mg/L)0.100–0.7 mg/L [67]
T (°C)0.1015–34 °C [66] c
pH0.116.5–8.5 mg/L [66] c
DO (mg/L) b0.174–8 mg/L [66] c
TDSs (mg/L)0.07200–2500 mg/L [66]c
Td (NTU)0.080.3–25 NTU [66] c
Notes: a weighting factor; b dissolved oxygen was transformed to percent oxygen saturation; c values established by the World Health Organization (WHO); i: parameter evaluated; n: number of parameters considered in the assessment; Subi: quality of the i-th parameter, given as a number between 0 and 100, and obtained from the respective mean curve; Wi: corresponding relative weight for the i-th parameter, given as a number between 0 and 1.
Table 2. Ecosystem services (ESs) provided by primary forest in the Talgua River watershed according to the Common International Classification of Ecosystem Services (CICES V5.2) [71].
ESSectionGroup/Classification Codes for Classes
ProvisioningBiotic/
biophysical
Cultivated plants (terrestrial/aquatic) for nutrition, materials, or energy (1.1.1.1, 1.1.1.2, 1.1.2.1).
Animals (reared/aquatic) for nutrition, materials, or energy (1.1.3.2, 1.1.4.1).
Wild plants (terrestrial and aquatic) for nutrition, materials, or energy (1.1.5.1, 1.1.5.2) and (1.1.5.3) *
Wild animals (terrestrial and aquatic) for nutrition, materials, or energy * (1.1.6.1, 1.1.6.2).
Genetic material from animals, plants, algae, or fungi * (1.2.1.1, 1.2.1.3, 1.2.2.2).
Abiotic/
geophysical
Surface water used for nutrition, materials, or energy * (4.1.1.1, 4.1.1.2).
Ground water used for nutrition, materials, or energy * (4.1.2.1, 4.1.2.2).
Regulation and maintenanceBiotic/
biophysical
Reduction of nutrient load and mediation of wastes or toxic substances and nuisances of anthropogenic origin * (2.1.1.2, 2.1.2.1, 2.1.2.2, 2.1.2.3).
Erosion control; hydrological cycle and regulation of water flow and reference flows of extreme events * (2.2.1.1, 2.2.2.1, 2.2.2.2, 2.2.3.1).
Risk mitigation and life cycle maintenance, habitat, and gene pool protection * (2.2.3.2, 2.2.3.3, 2.2.3.4, 2.3.2.1, 2.3.2.2, 2.3.2.3, 2.3.2.4, 2.3.2.5).
Pest and disease control * (2.3.3.1, 2.3.3.2).
Regulation of soil quality and water conditions (2.3.4.1, 2.3.4.2) and (2.3.4.3, 2.3.5.1) *.
Composition and atmospheric conditions (2.3.6.1, 2.3.6.2).
Abiotic/
geophysical
Mediation of waste, toxic substances, and other nuisances by non-living and anthropogenic processes (5.1.1.2, 5.1.1.3, 5.1.1.4, 5.1.2.1).
Maintenance of physical, chemical, and abiotic conditions (5.2.2.1) * and (5.2.2.2).
CulturalBiotic/
biophysical
Direct, in situ, and external interactions with living systems that depend on presence in the environmental environment (3.1.1.1) and (3.1.1.2, 3.2.1.1, 3.2.1.2, 3.2.1.3, 3.2.1.4) *.
Indirect interactions with living systems * (3.3.1.1).
Elements of living systems that are indirectly appreciated and meaningful to people without their presence in the environmental environment and other biophysical characteristics appreciated in people’s own right (3.4.1.1, 3.4.1.2, 3.4.2.1, 3.4.2.2).
Abiotic/
geophysical
Direct, indirect, in situ, and external interactions with geophysical systems that depend on presence in the environmental environment and with geophysical systems * (6.1.1.1, 6.1.1.2, 6.2.1.1, 6.2.1.2, 6.2.1.3, 6.2.1.4, 6.3.1.1).
Elements of geophysical systems that are indirectly appreciated and important to people without their presence in the environment * (6.4.1.1, 6.4.1.2).
Other biophysical elements of species or ecosystems that are cherished in their own right by people (6.4.2.1, 6.4.2.2).
Note: * ecosystem services affected by deforestation and land-use change.
Table 3. Physicochemical and microbiological analyses in the different sample points.
SampleResults of Physicochemical and Microbiological Parameters
pHBOD5 (mg/L)DO (mg/L)NO3 (mg/L)PO43− (mg/L)T
(°C)
TDSs (mg/L)Td (NTU)EC (µS/cm)Alk (mg/L)Hd (mg/L)FCs (NMP/
100 mL)
Talgua 18.003.706.500.300.1022.40110.002.83213.00123.00117.00n.a
Talgua 28.229.506.650.530.5025.40164.004.90310.00147.00129.00920.00
Talgua 38.4018.204.700.500.1023.20192.201.04366.00190.00200.002.00
Talgua 47.4435.404.102.703.2024.80271.407.50469.00242.20266.80920.00
Talgua 57.30110.004.302.503.1026.10214.904.07393.00200.00215.00130.00
Talgua 68.4015.206.551.501.0024.50178.306.00326.00150.20160.00n.a
Notes: BOD5: biological oxygen demand; DO: dissolved oxygen; NO3: nitrates; PO43−: phosphates; T: temperature; TDSs: total dissolved solids; Td: turbidity; EC: electrical conductivity; Alk: alkalinity; Hd: hardness; FCs; fecal coliforms; n.a: not analyzed.
Table 4. NSF-WQI index at sample points.
SampleParameters and Values Considered in the Determination of the NSF–WQI
pHBOD₅OSNO3PO43−Δ°CTDSsTdFCsNSF–WQIClassification
Talgua 110.928.1613.5411.6011.5210.207.429.05-82.41Good
Talgua 28.383.9612.699.656.008.505.406.903.6565.13Medium
Talgua 37.681.564.809.659.608.505.157.6714.5669.17Medium
Talgua 410.210.552.829.152.008.504.436.483.6547.79Bad
Talgua 510.180.553.289.252.068.504.947.036.6652.45Media
Talgua 69.072.5513.7511.464.8010.206.788.40-67.01Media
Notes: WQI-NSF: National Health Foundation Water Quality Index; BOD₅: biological oxygen demand; OS: oxygen saturation, obtained from dissolved oxygen; NO3: nitrates; PO43−: phosphates; Δ°C: temperature difference; TDSs: total dissolved solids; Td: turbidity; FCs: fecal coliforms; -: data considered within the formula due to the lack of data in the analysis.
Table 5. Contamination indexes in sample points.
SamplesContamination Index
ICOpHICOMIICOMOICOTempICOSUSICOTROBPI
Talgua 10.030.700.340.000.31Eutrophicn.a
Talgua 20.060.830.390.000.47Eutrophic8.50
Talgua 30.110.900.480.000.56Eutrophic99.60
Talgua 40.000.990.650.000.79Hypereutrophic8.50
Talgua 50.000.920.560.000.71Hypereutrophic64.00
Talgua 60.110.830.550.000.52Eutrophicn.a
Notes: ICOMI: mineralization contamination index; ICOMO: organic matter contamination index; ICOpH: pH contamination index; ICOTemp: temperature contamination index; ICOSUS: solids contamination index; ICOTRO: trophic contamination index; BPI: bacterial contamination index. Values in blue (no contamination); green (low contamination); yellow (medium contamination); orange (high contamination); red (very high contamination); and n.a: not analyzed.
Disclaimer/Publisher’s Note: The statements, opinions and data contained in all publications are solely those of the individual author(s) and contributor(s) and not of MDPI and/or the editor(s). MDPI and/or the editor(s) disclaim responsibility for any injury to people or property resulting from any ideas, methods, instructions or products referred to in the content.

