


Ecolodge Tourism Dynamics: A Village-Level Analysis of Marketing and Policy Indicators in Iran’s Hawraman Region


 ,
,  ,
, 
Abstract
1. Introduction
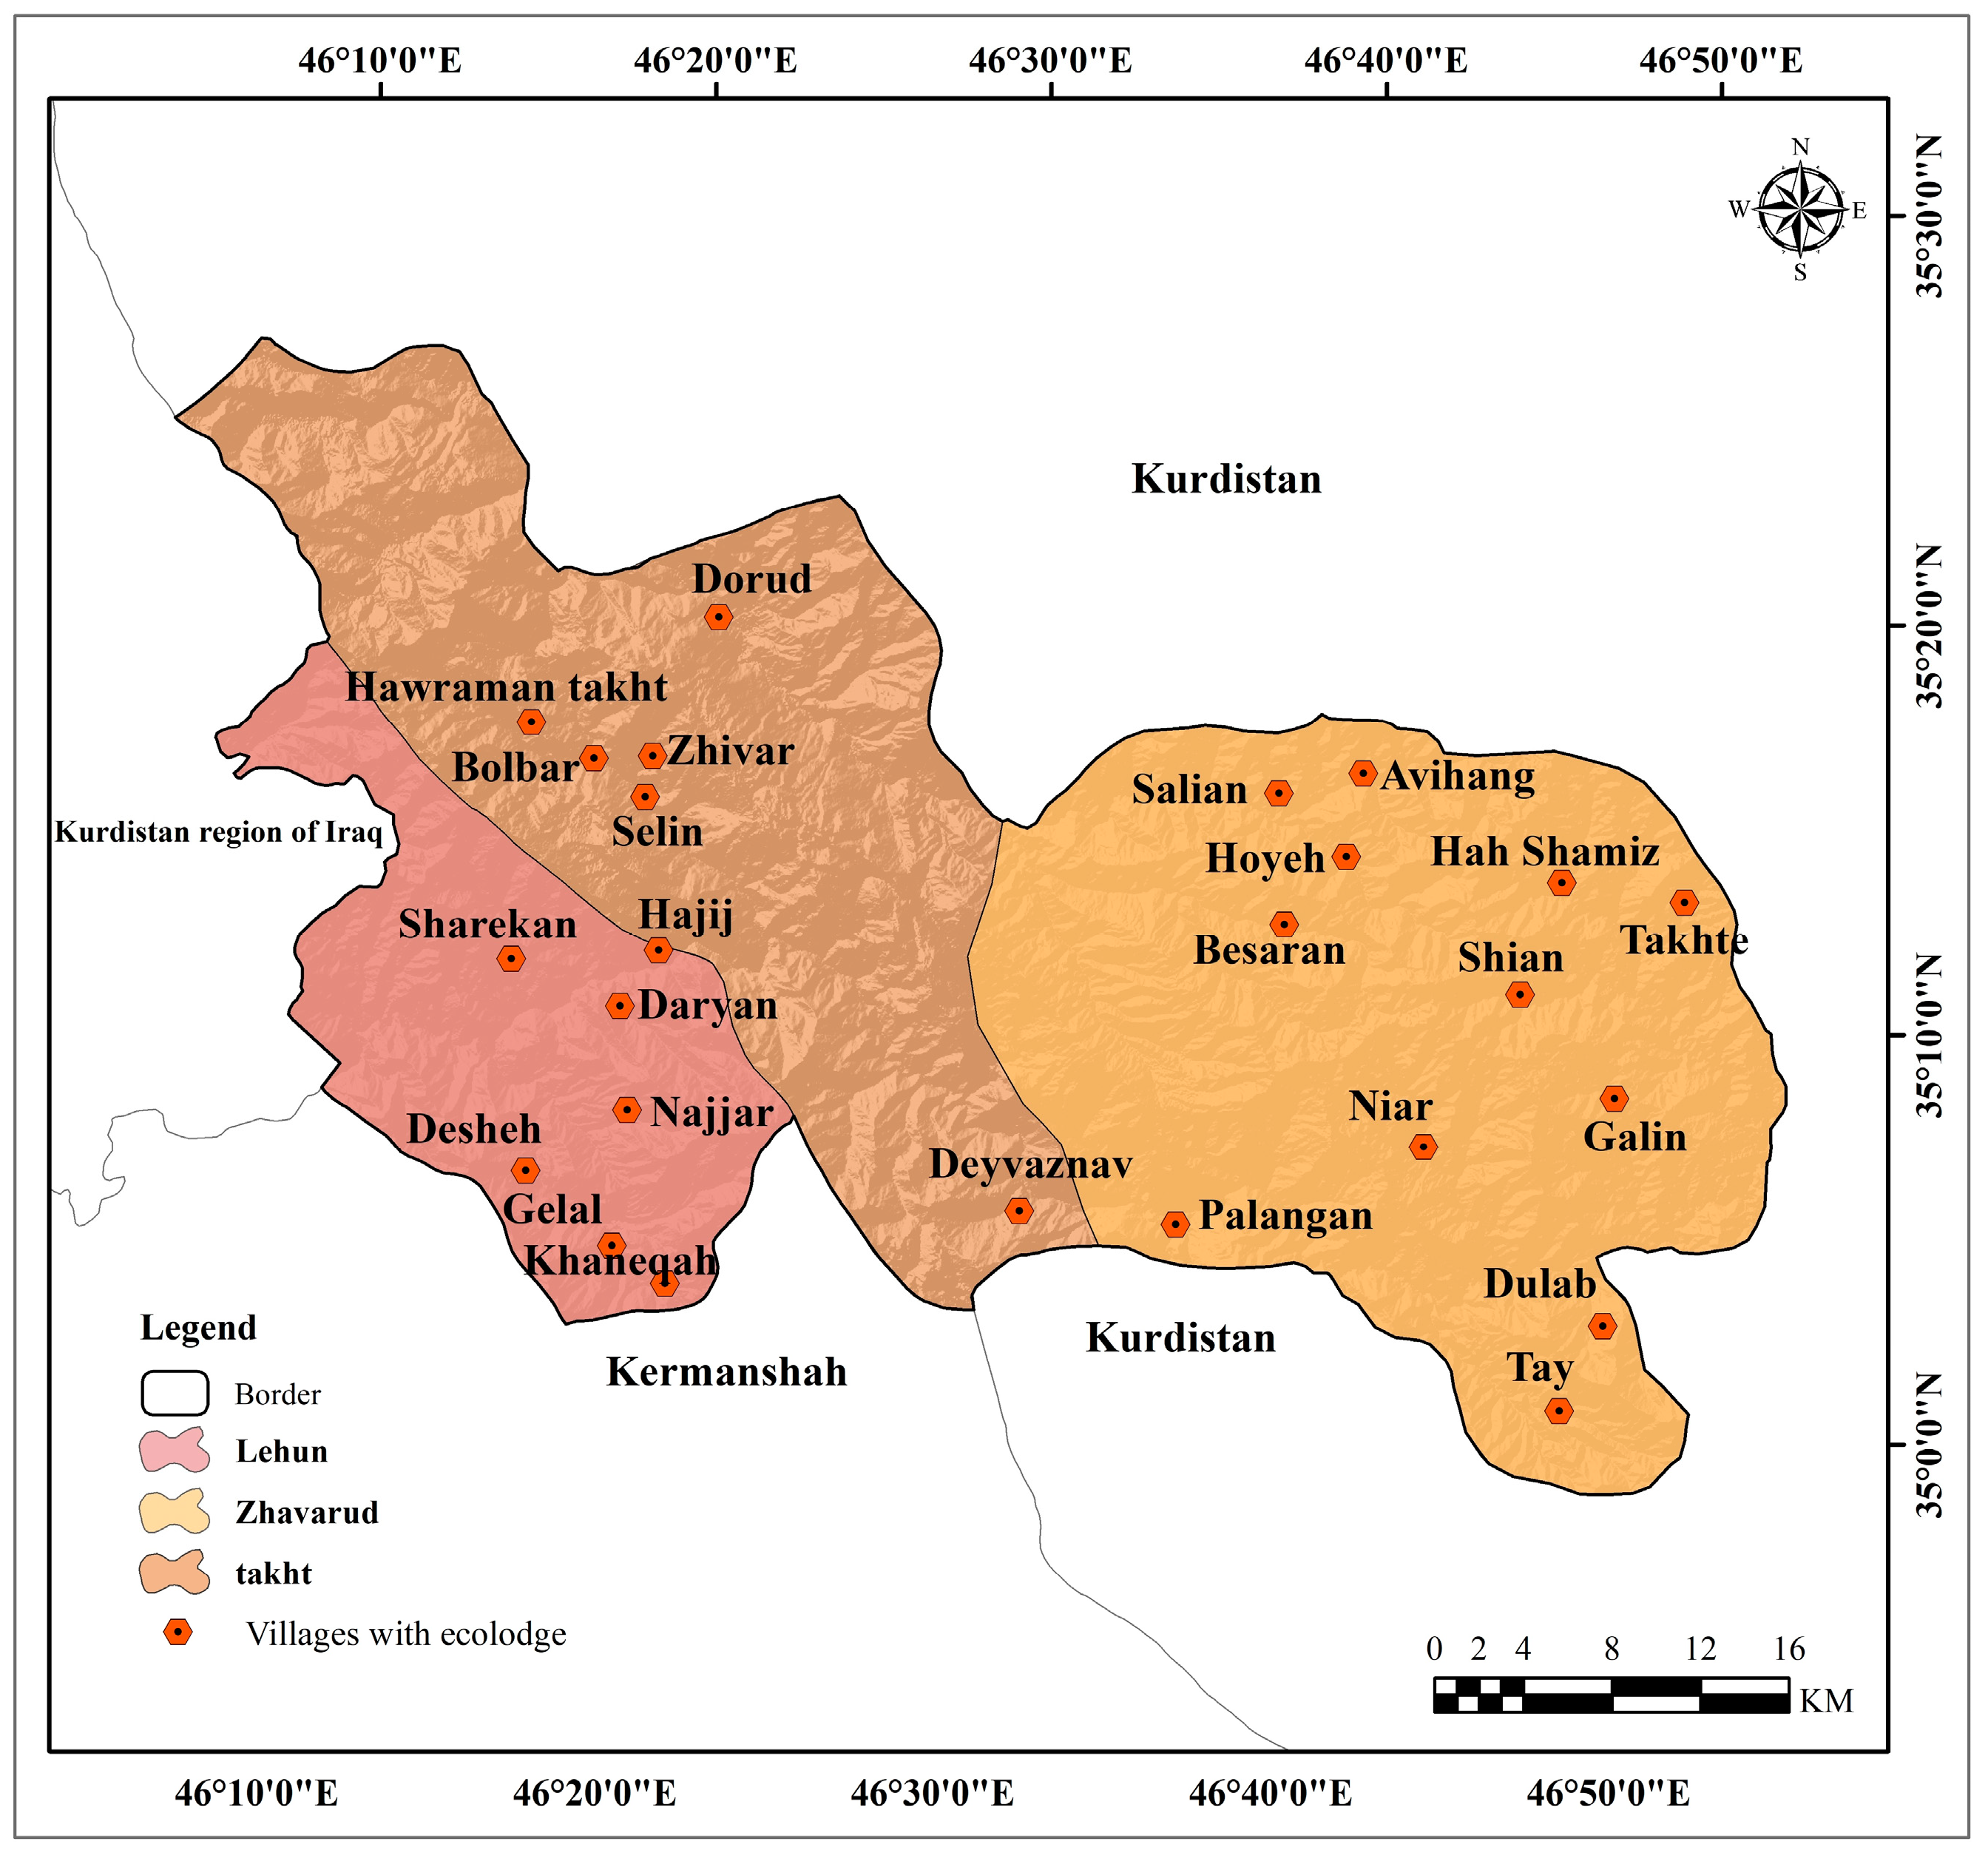
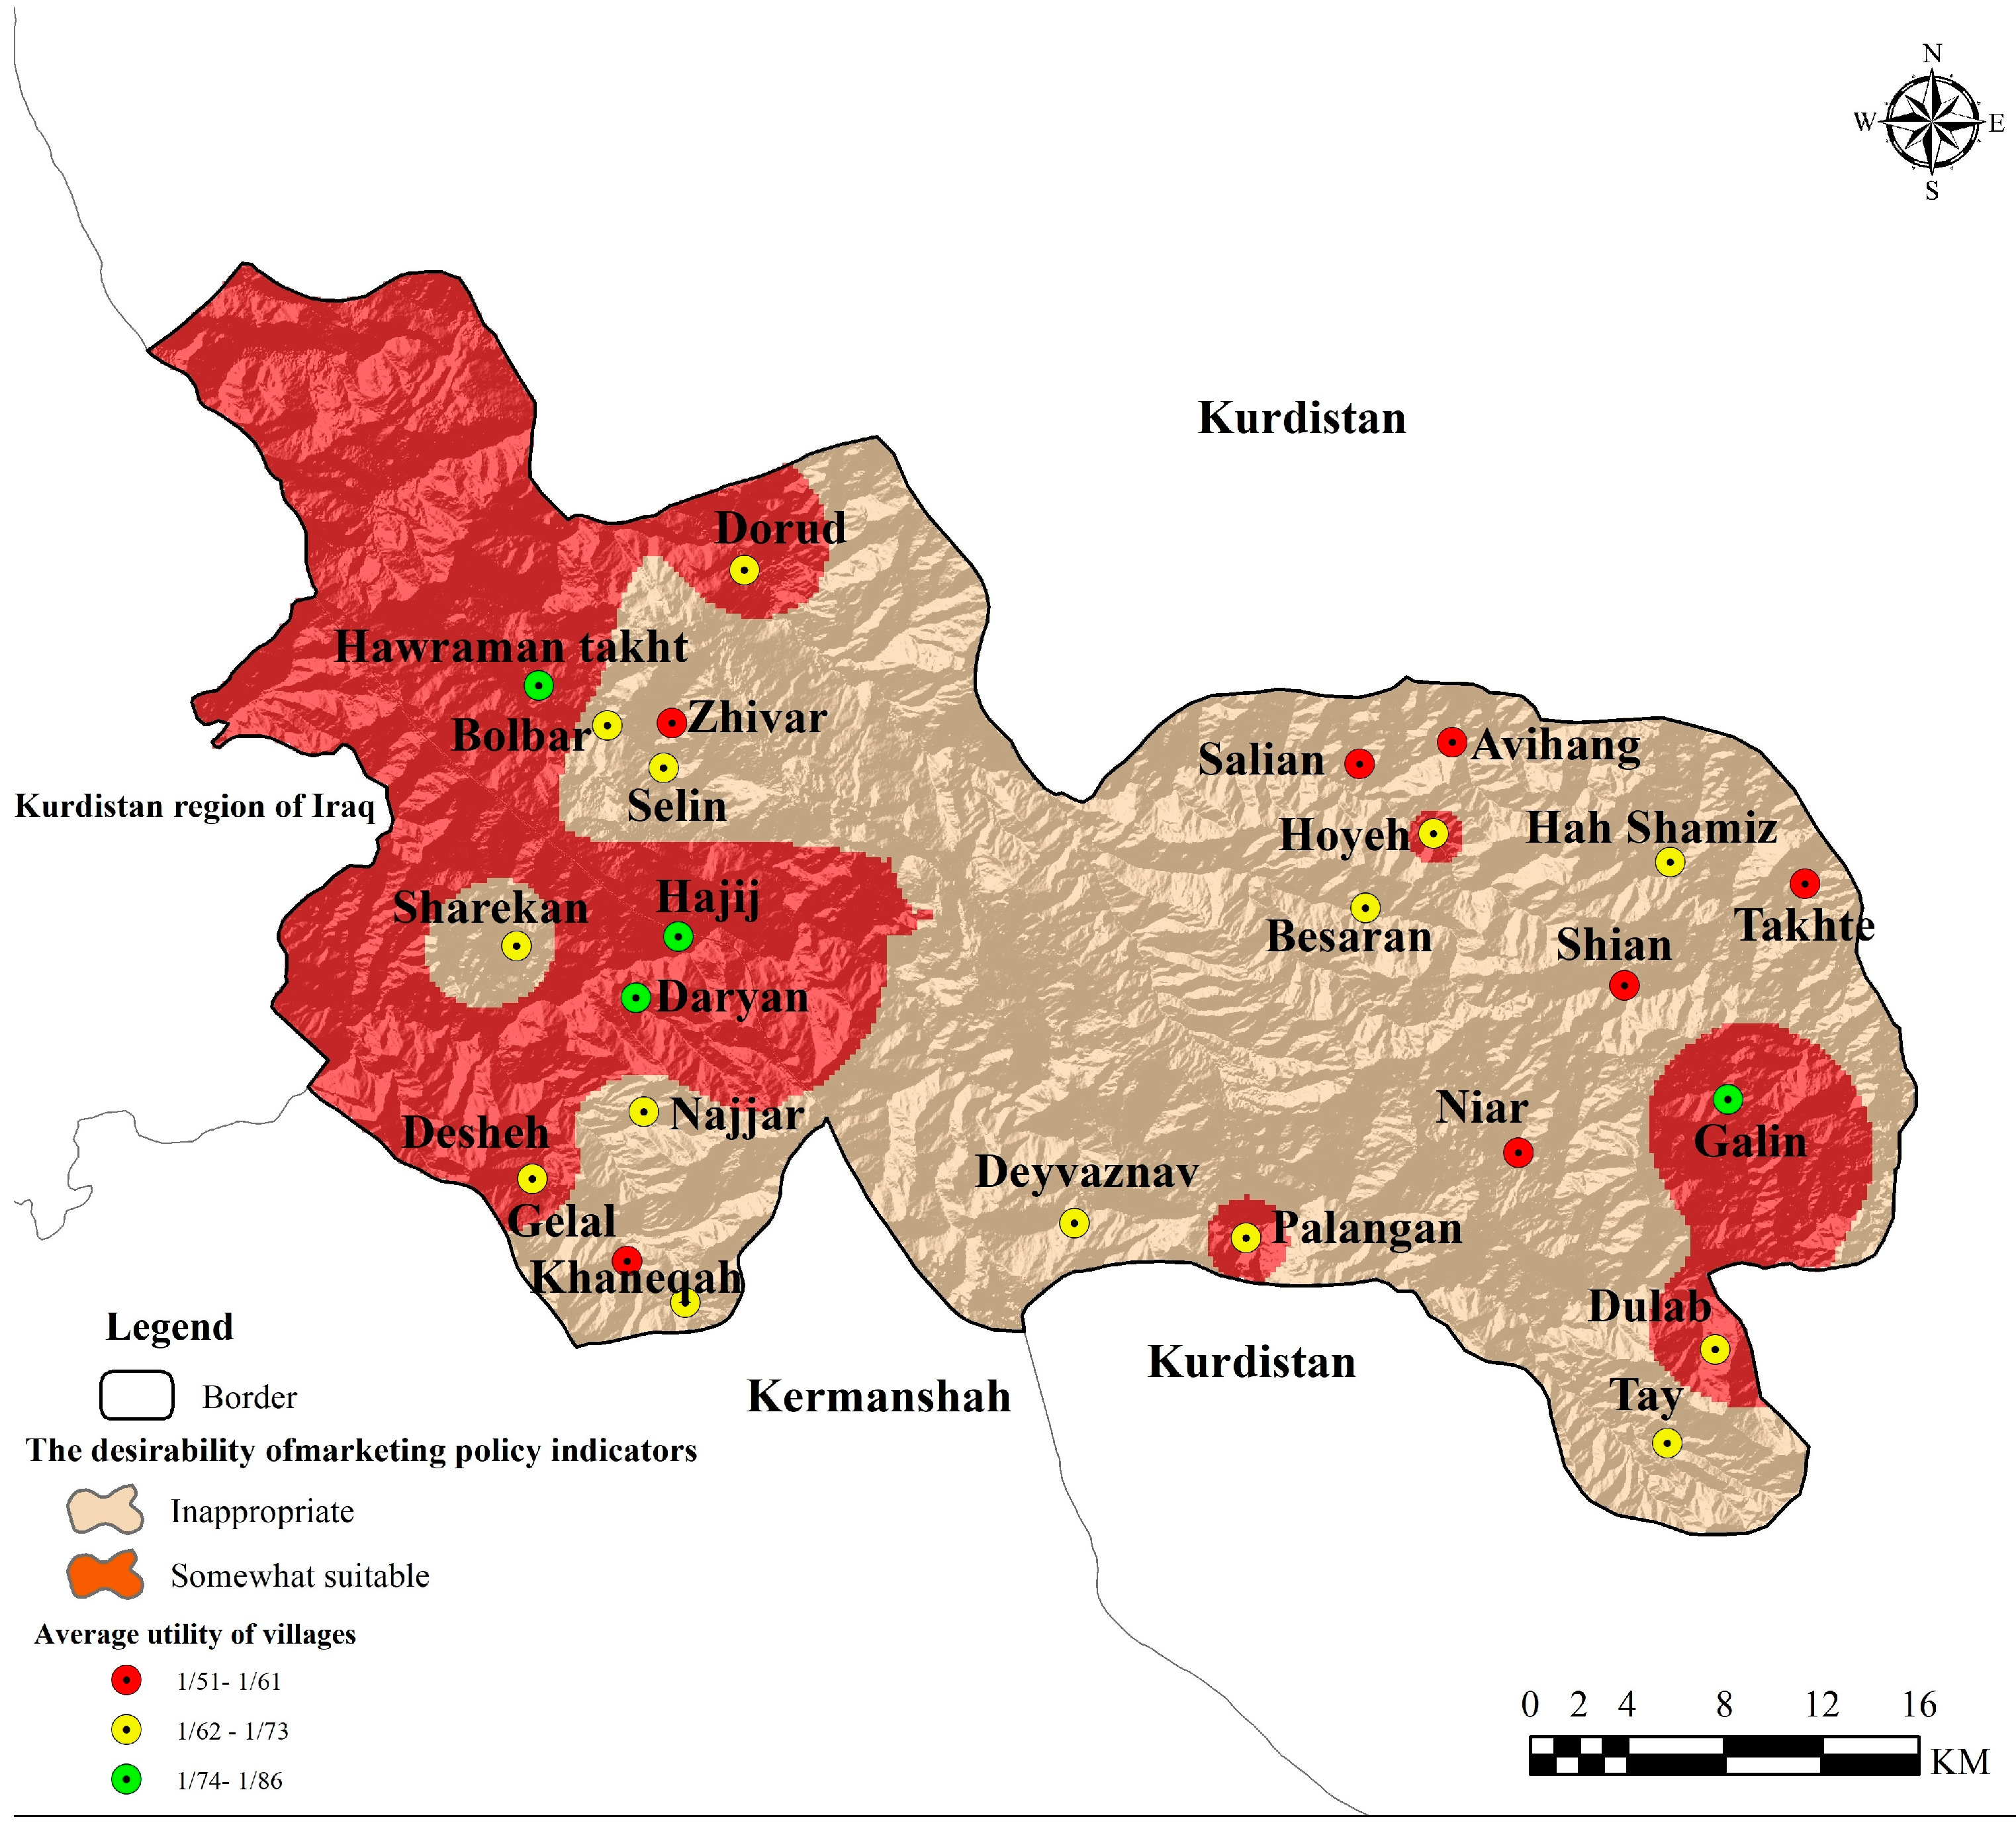
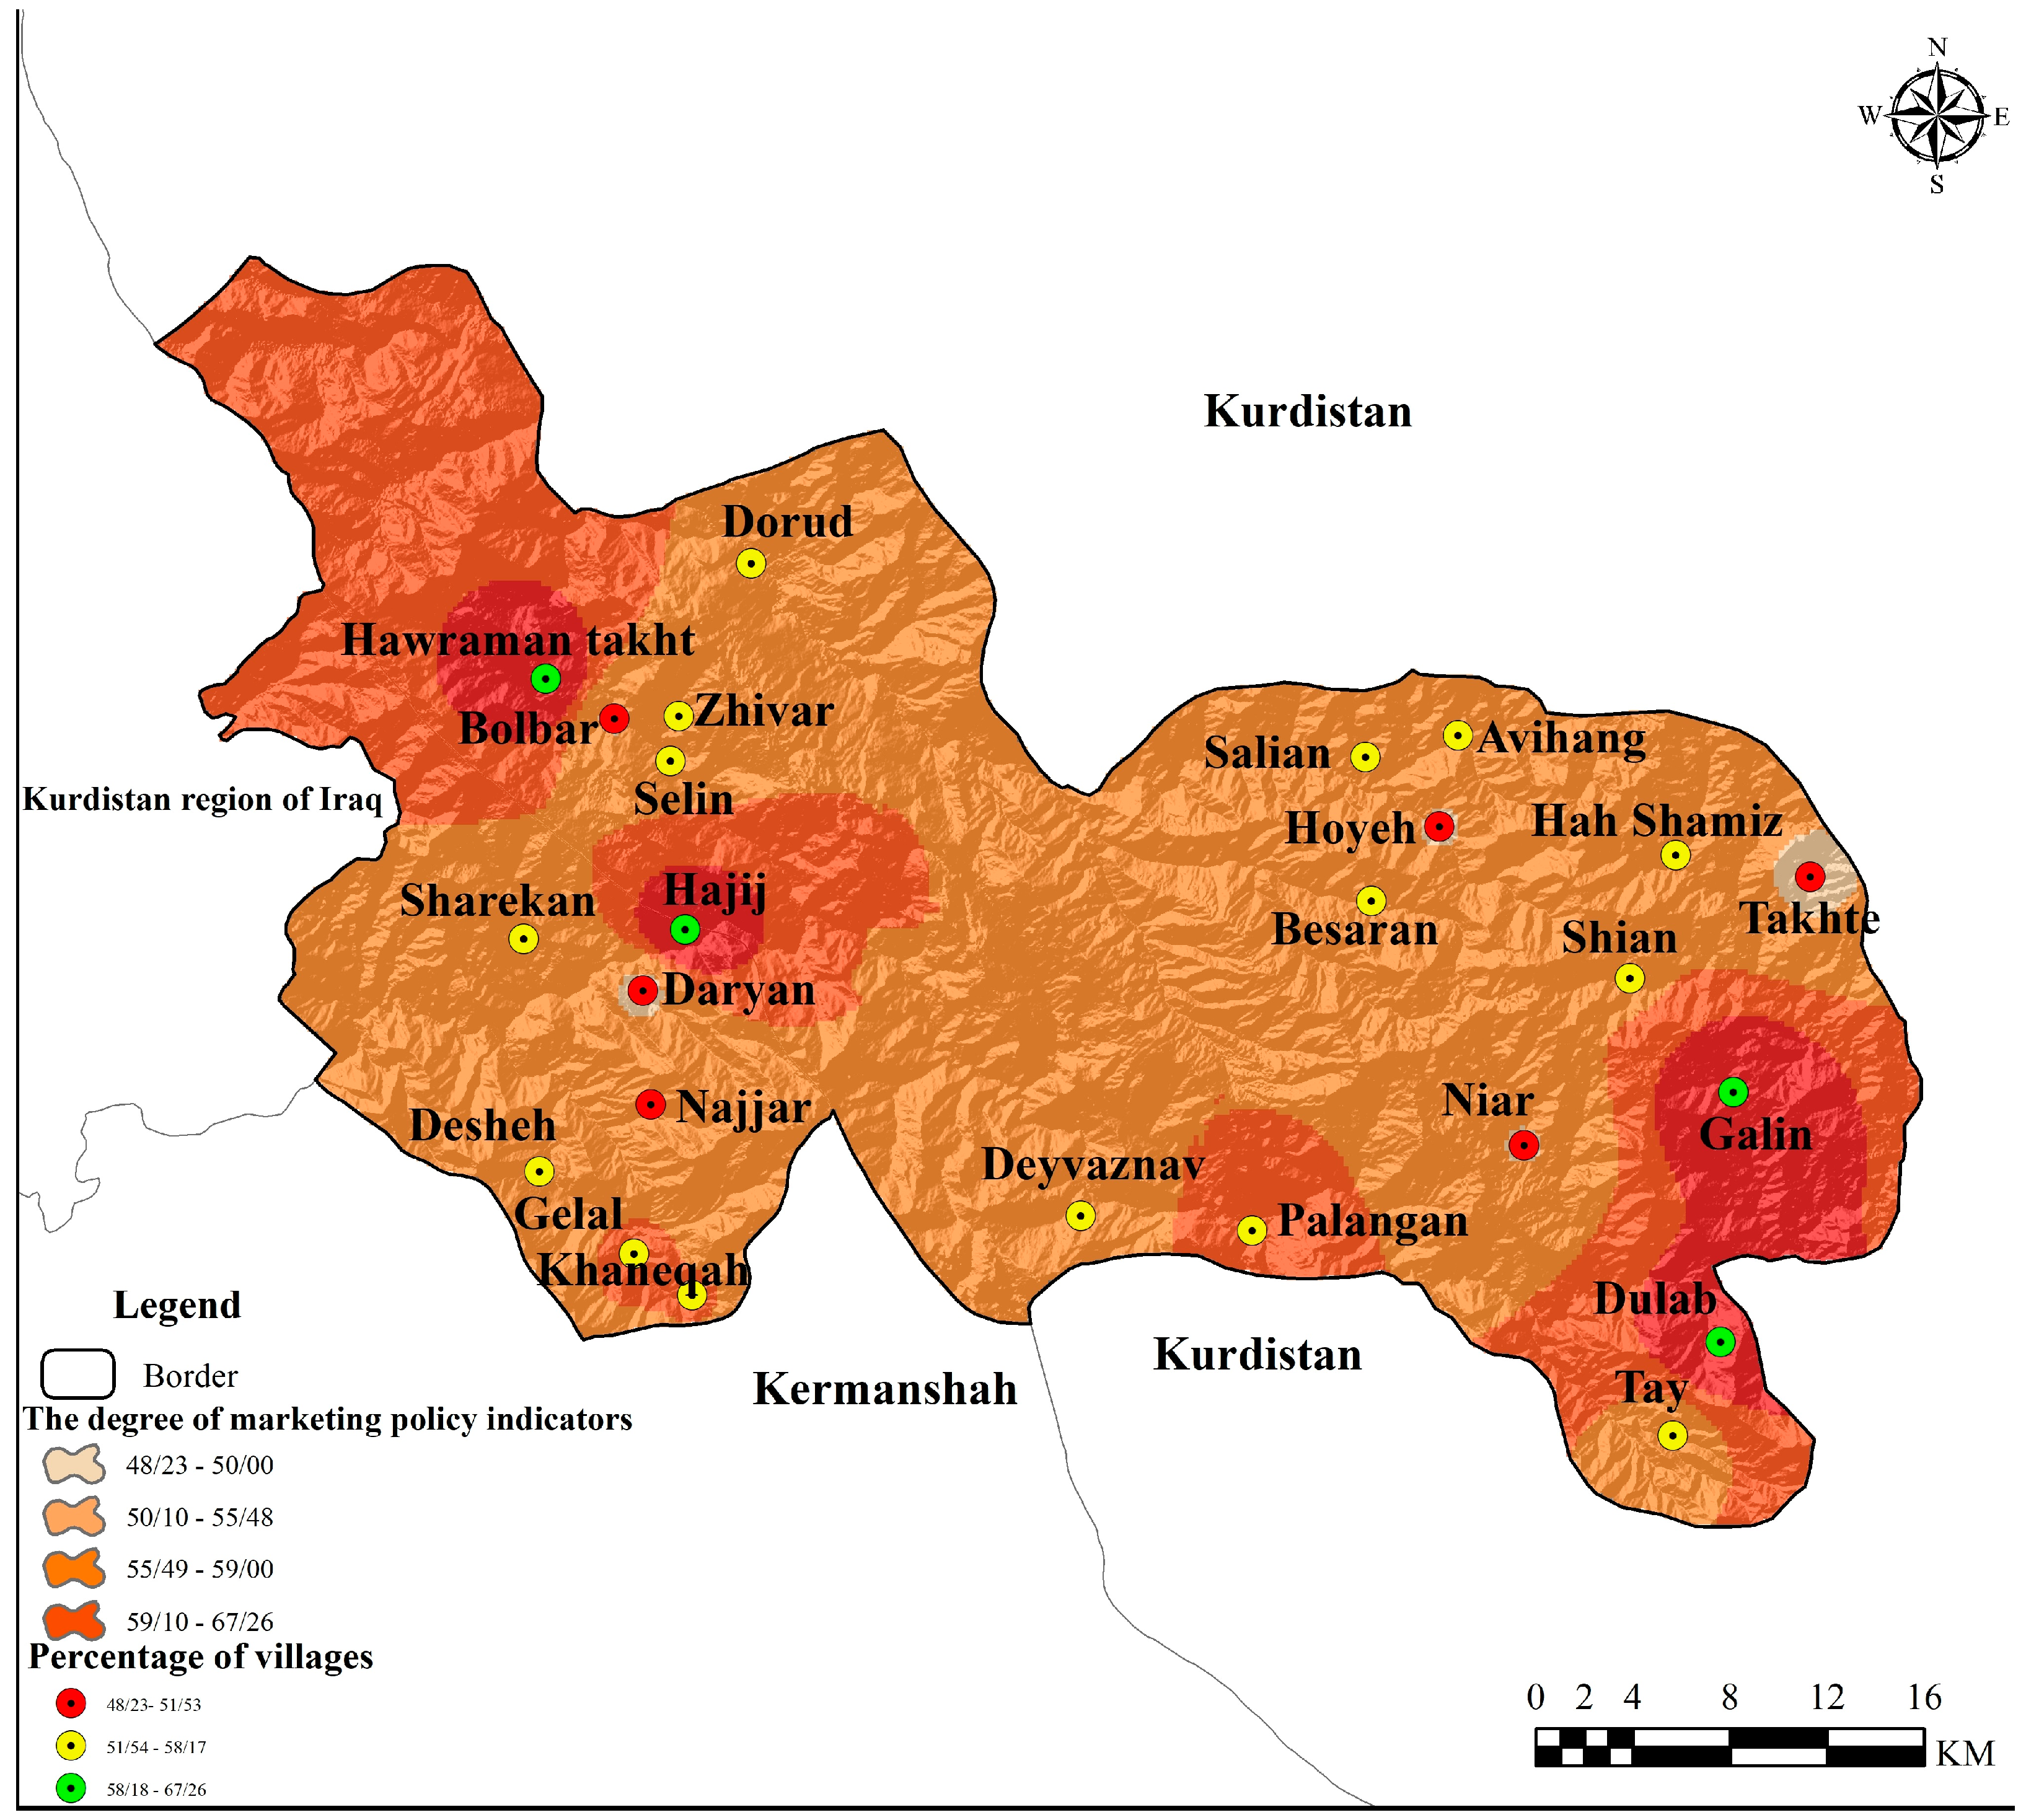
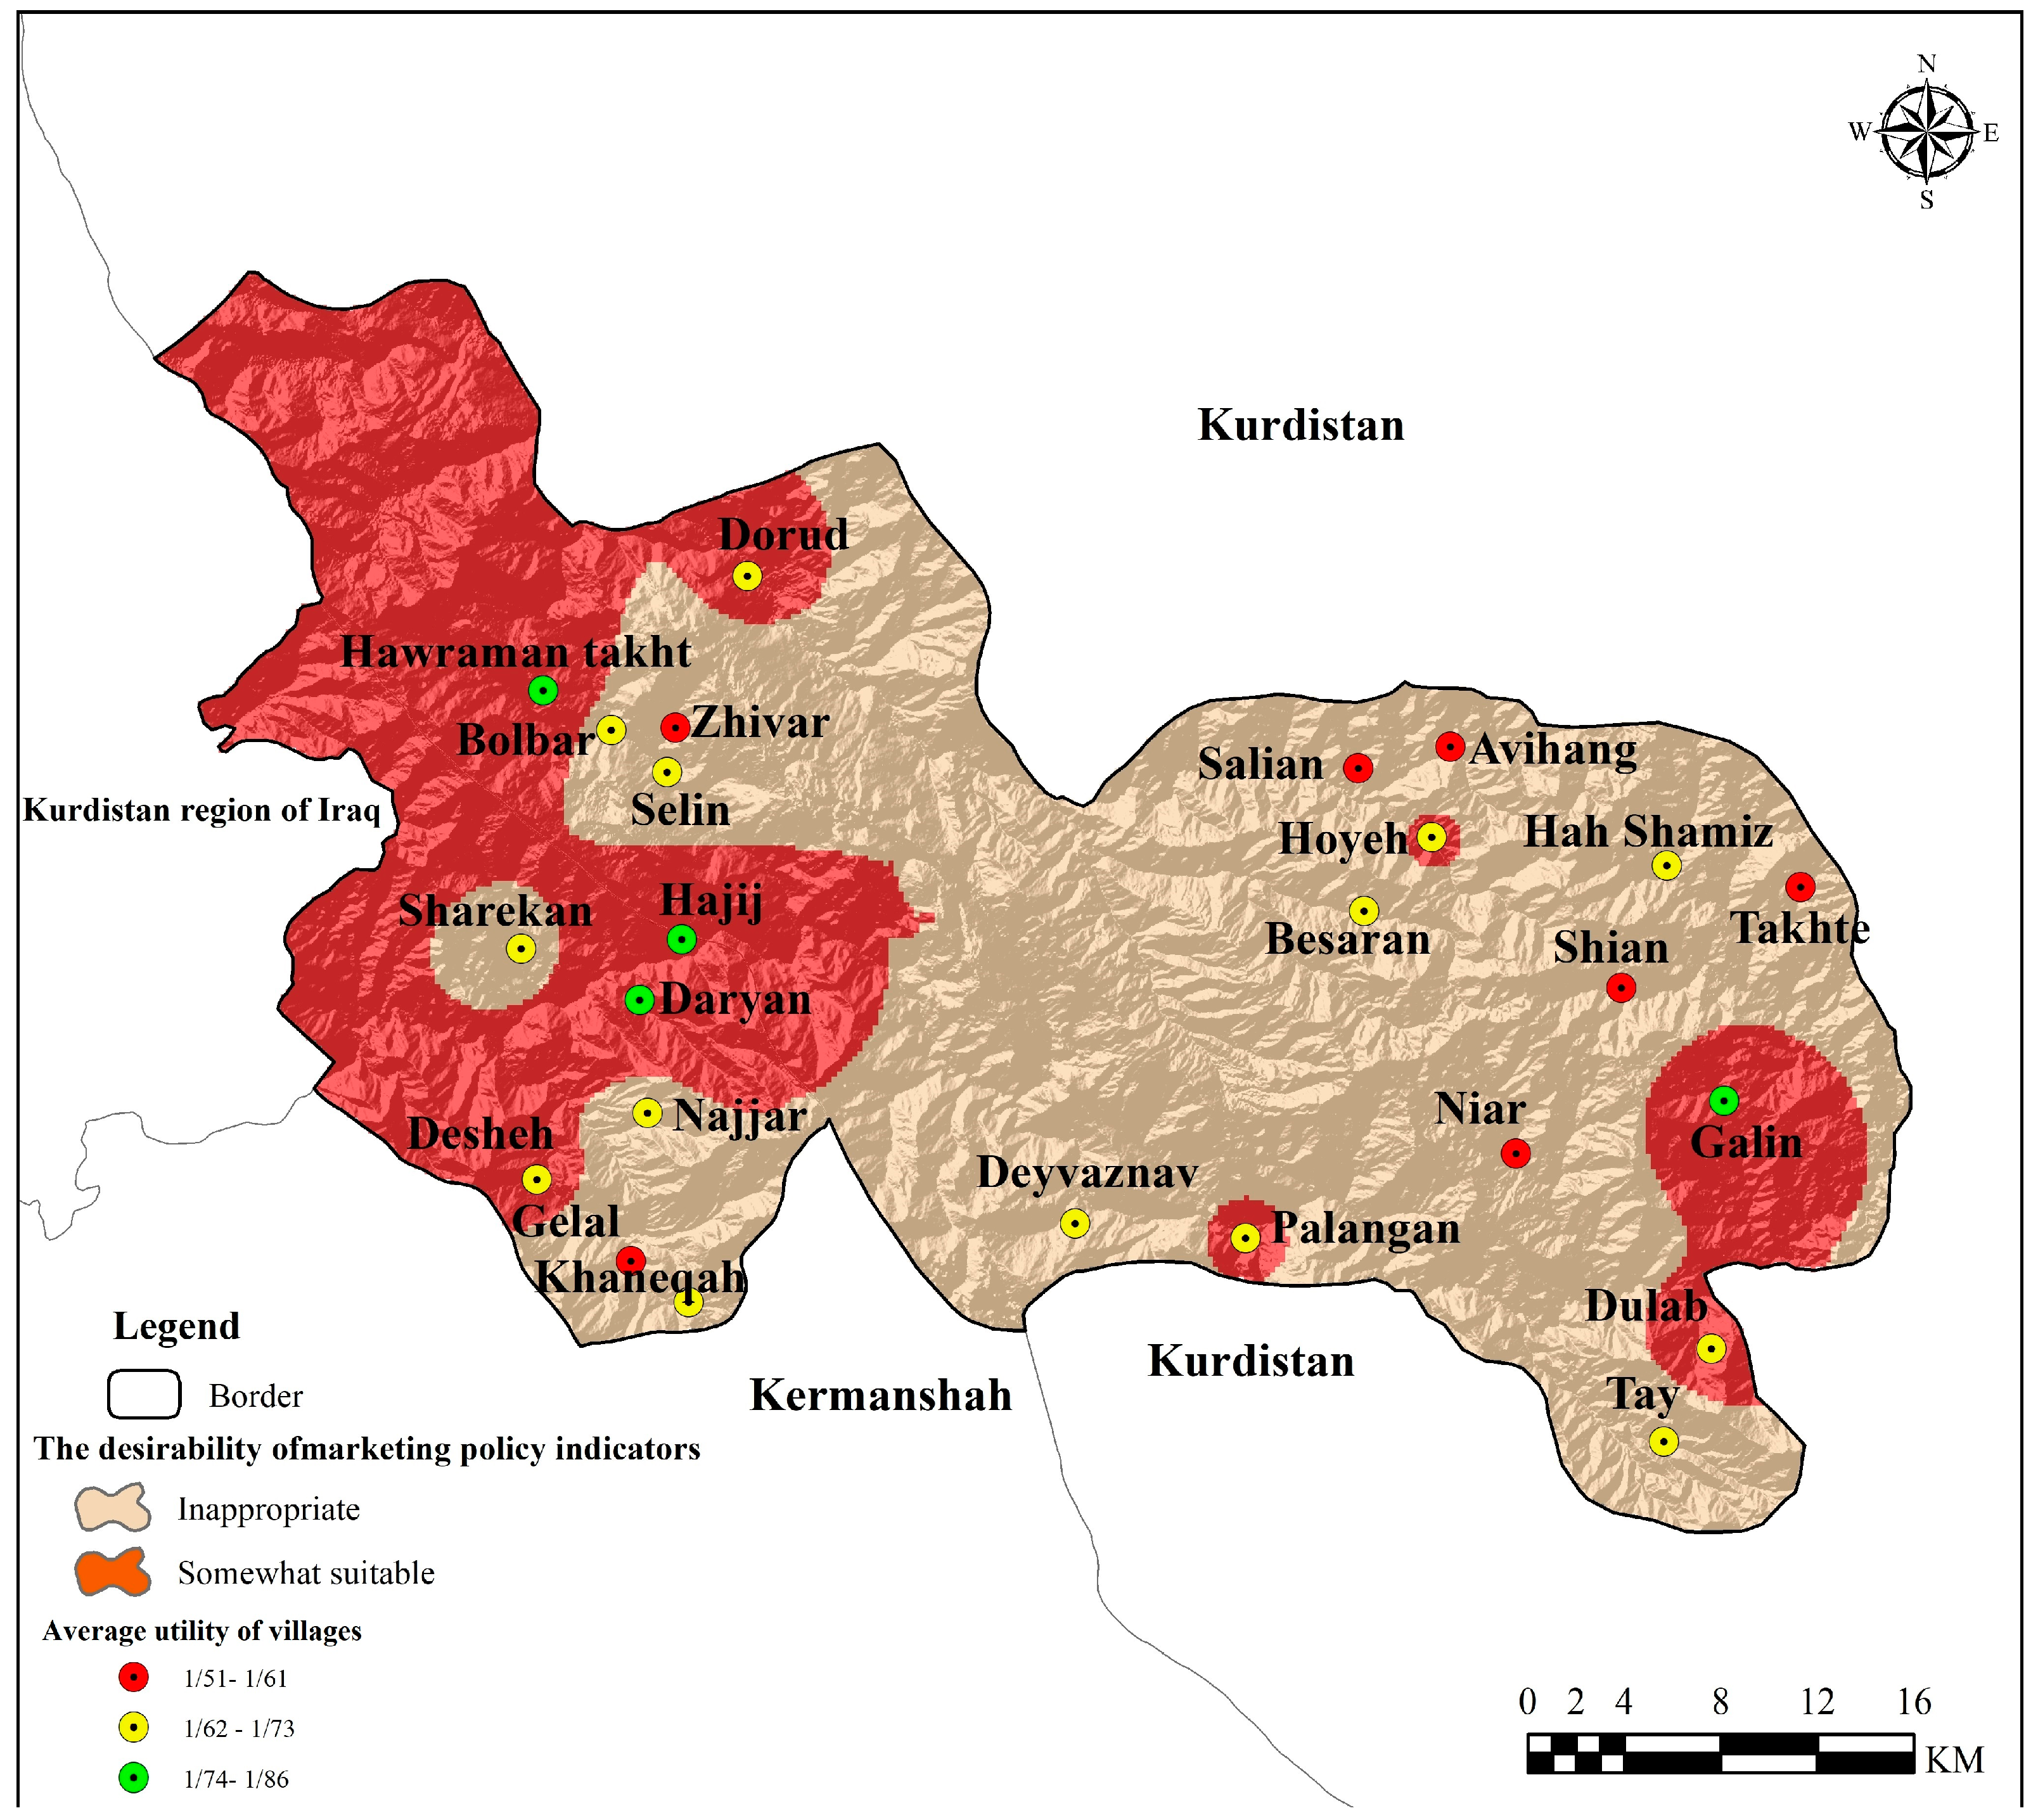
2. Study Area
- Hawraman Takht: The villages of Selin, Balbar, Durood, and Zhivar, as well as the village-city of Hawraman Takht (five ecolodges);
- Hawraman Zhavorud: The villages of Gelin, Dolab, Shian, Avihang, Salyan, Takhteh, Huyeh, Bisaran, Tay, Hashmiz, Nir, Divznau, and Palangan (27 ecolodges);
- Hawraman Lahon: The villages of Darian, Hajij, Shurkan, Gelal, Khaneqah, and Dashteh, which have 13 ecolodges.
3. Literature
4. Methods
5. Results
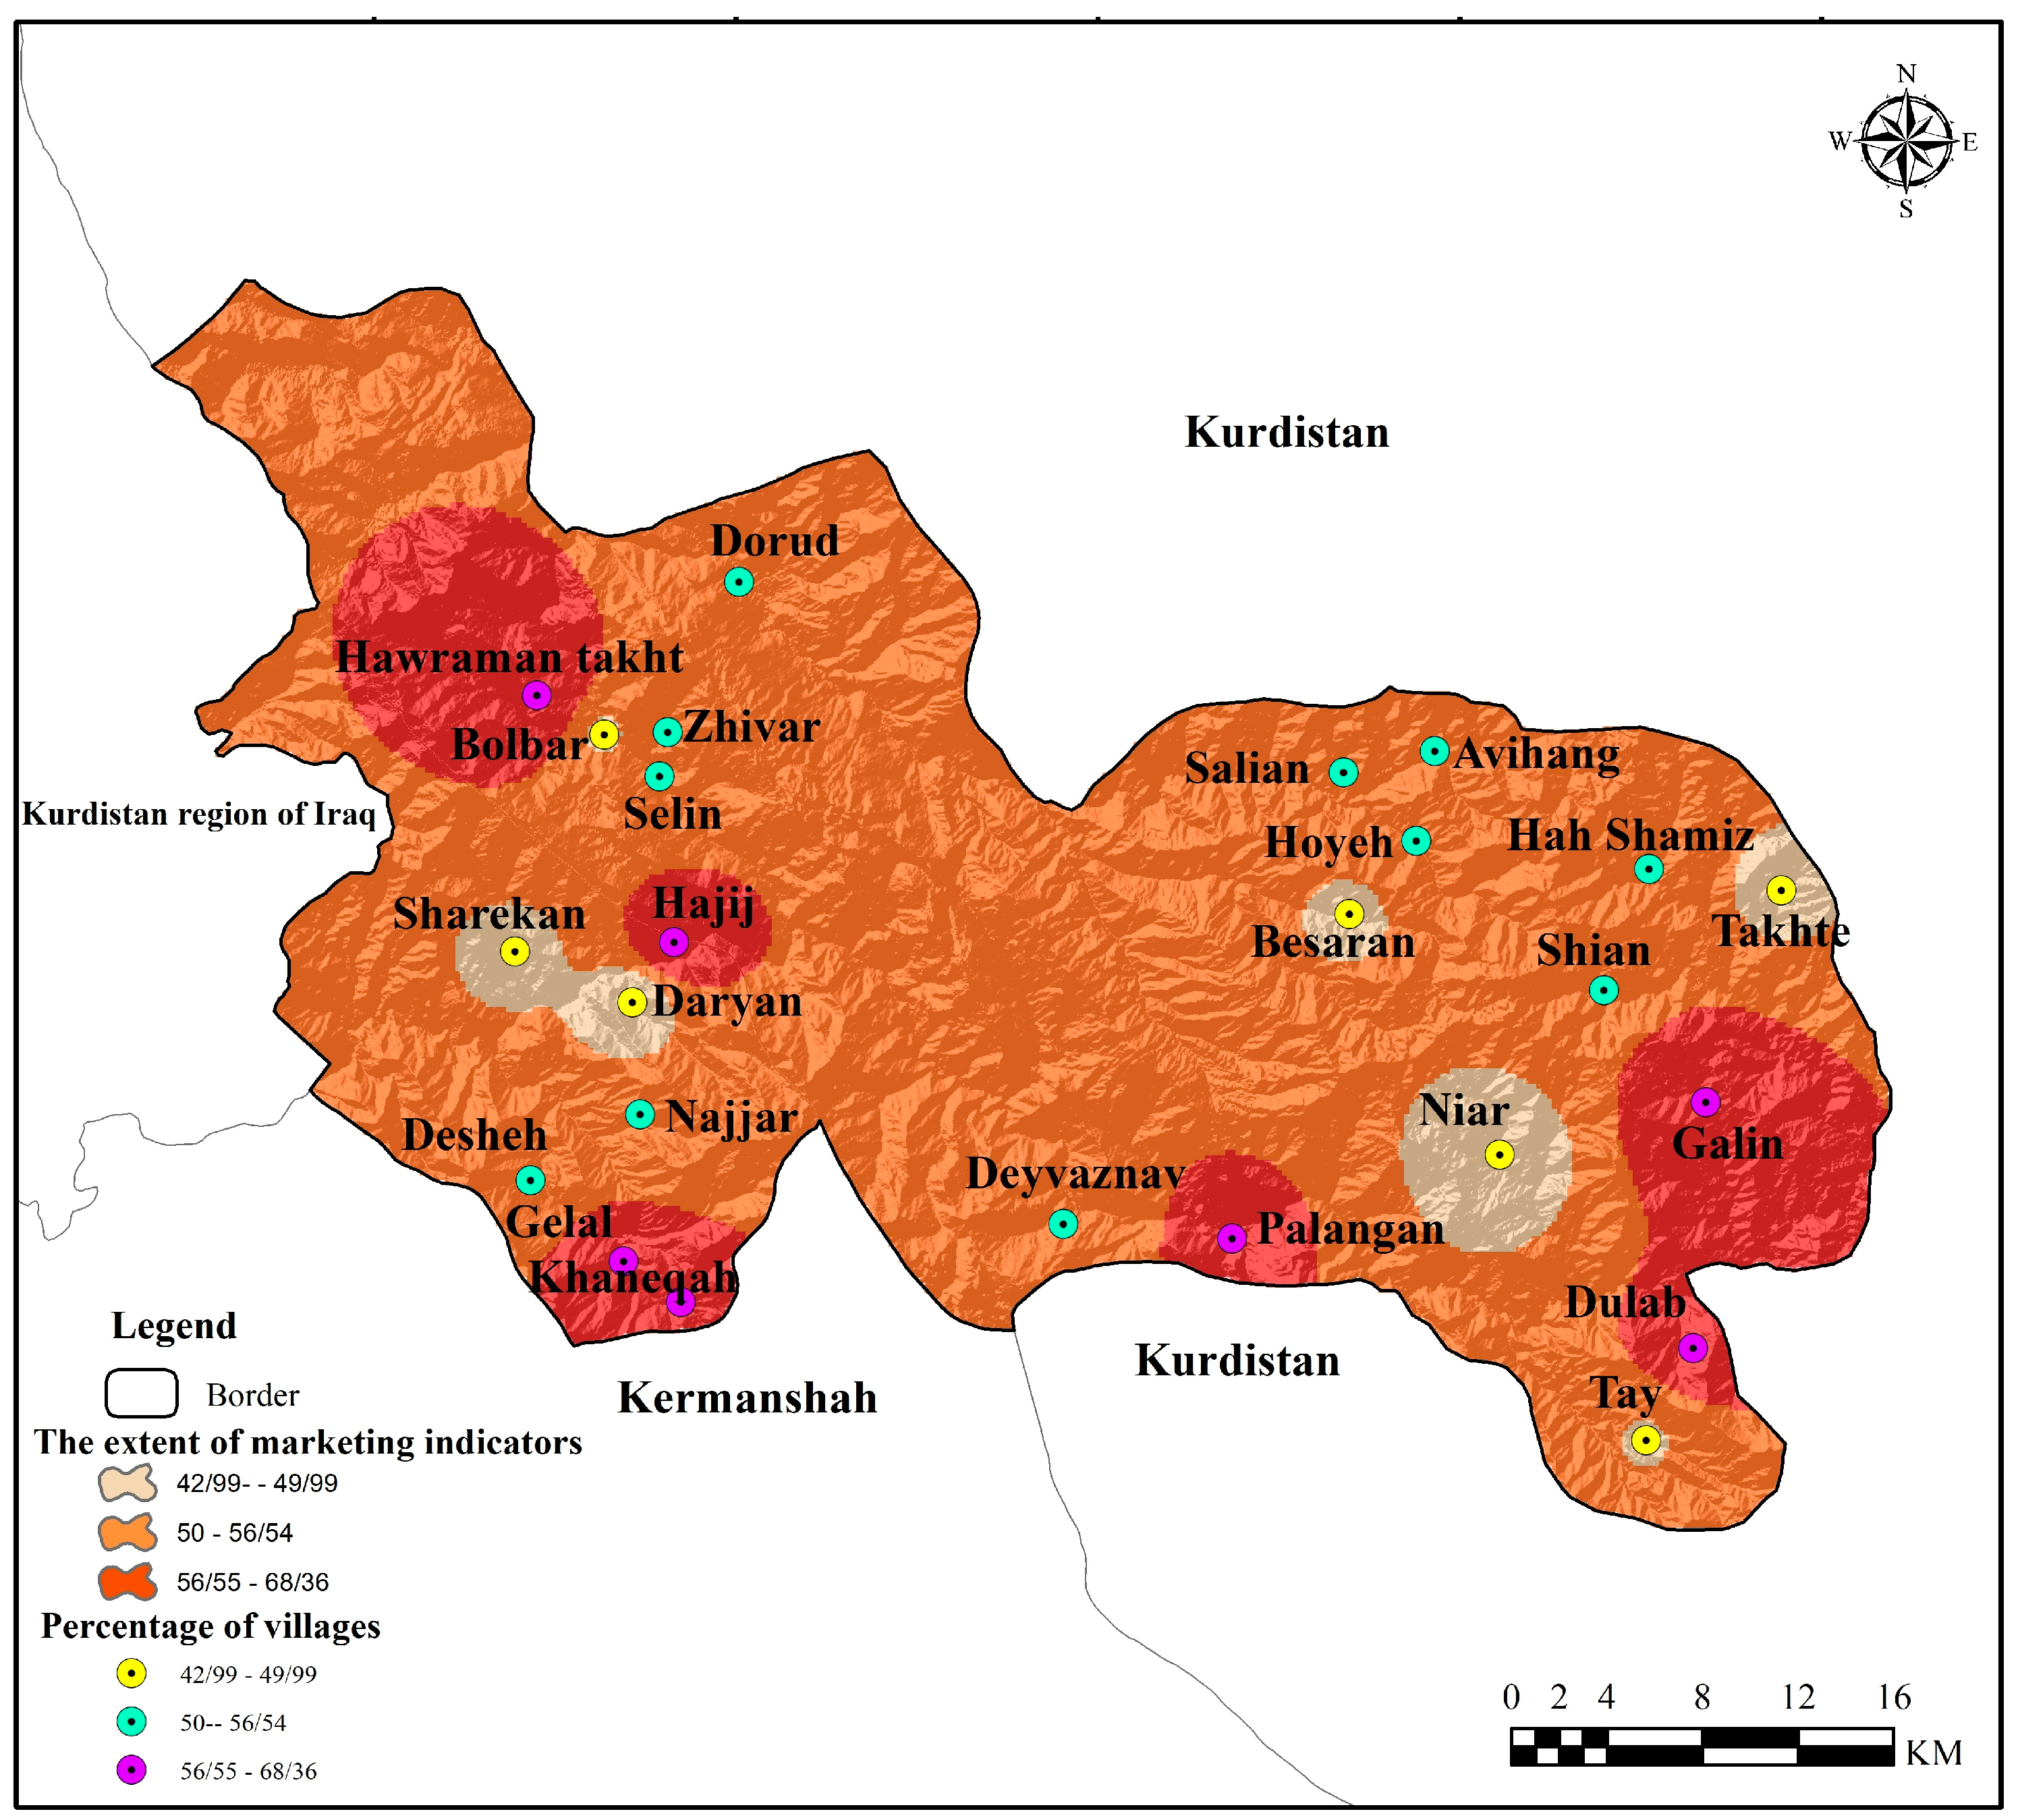
5.1. The Status of Availability and Desirability of Marketing Indicators
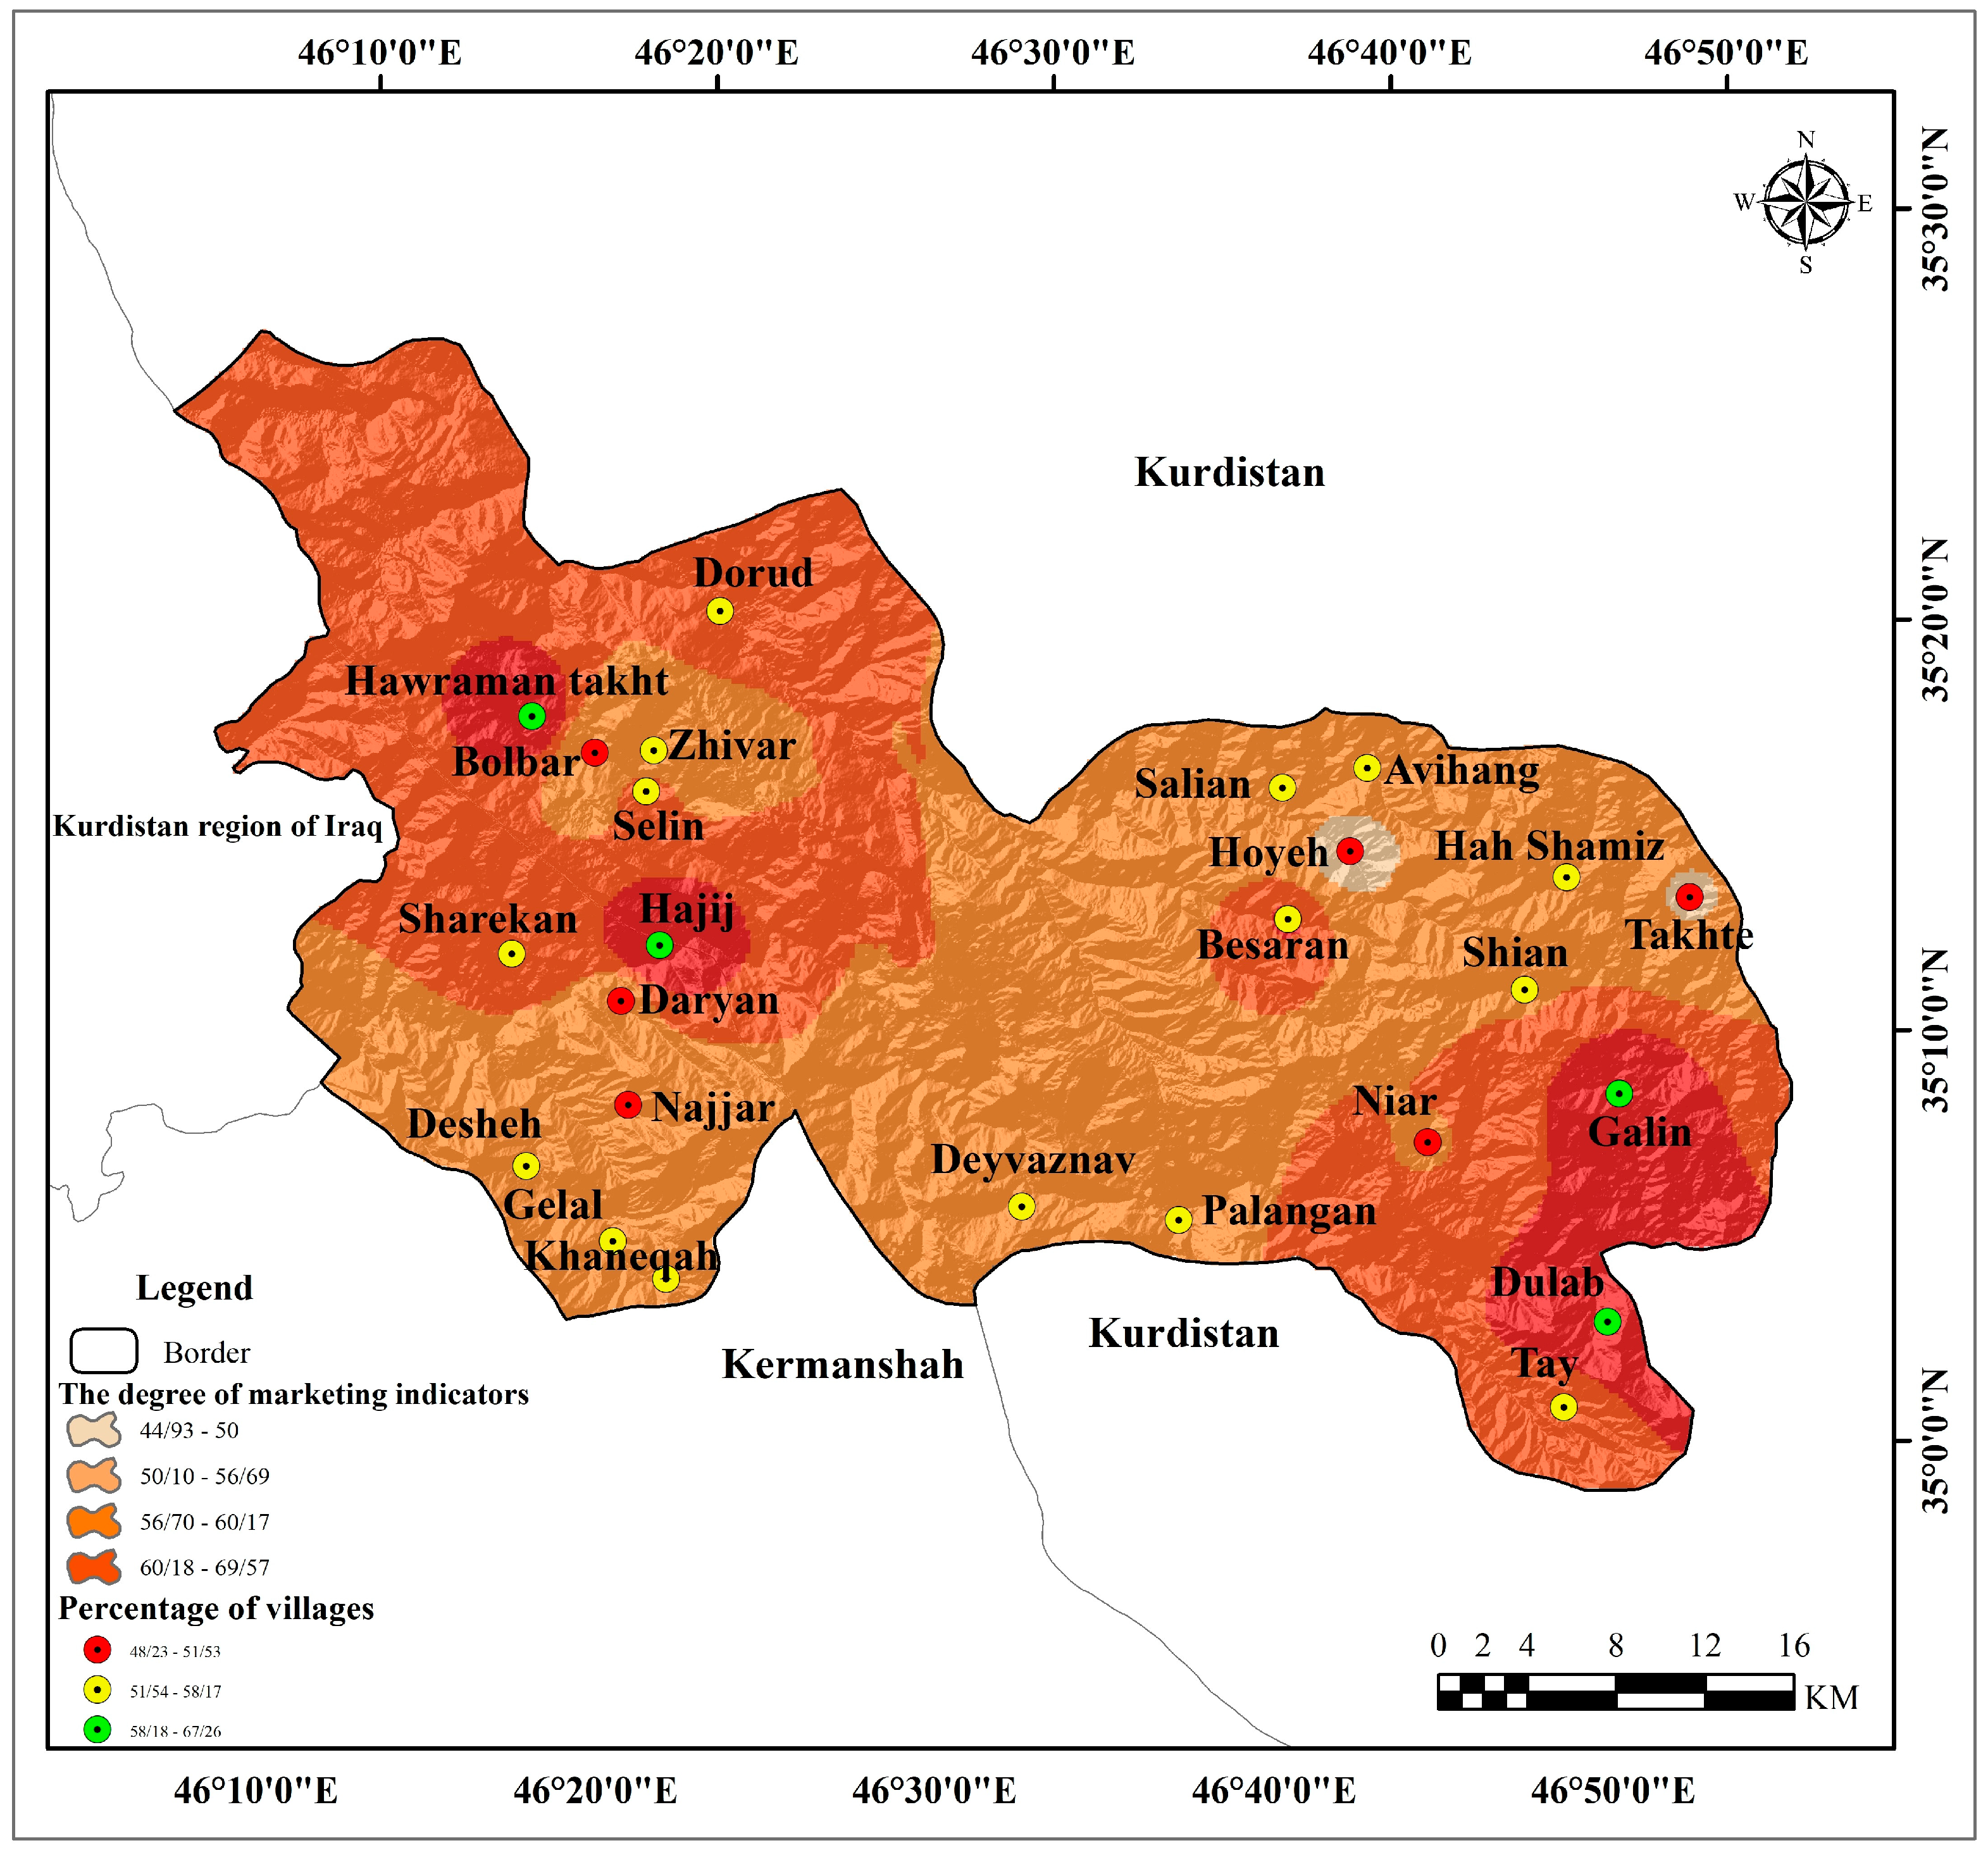
5.2. Availability and Desirability of Policy Indicators
5.3. Availability and Desirability of Marketing Policy Dimensions for Ecolodges
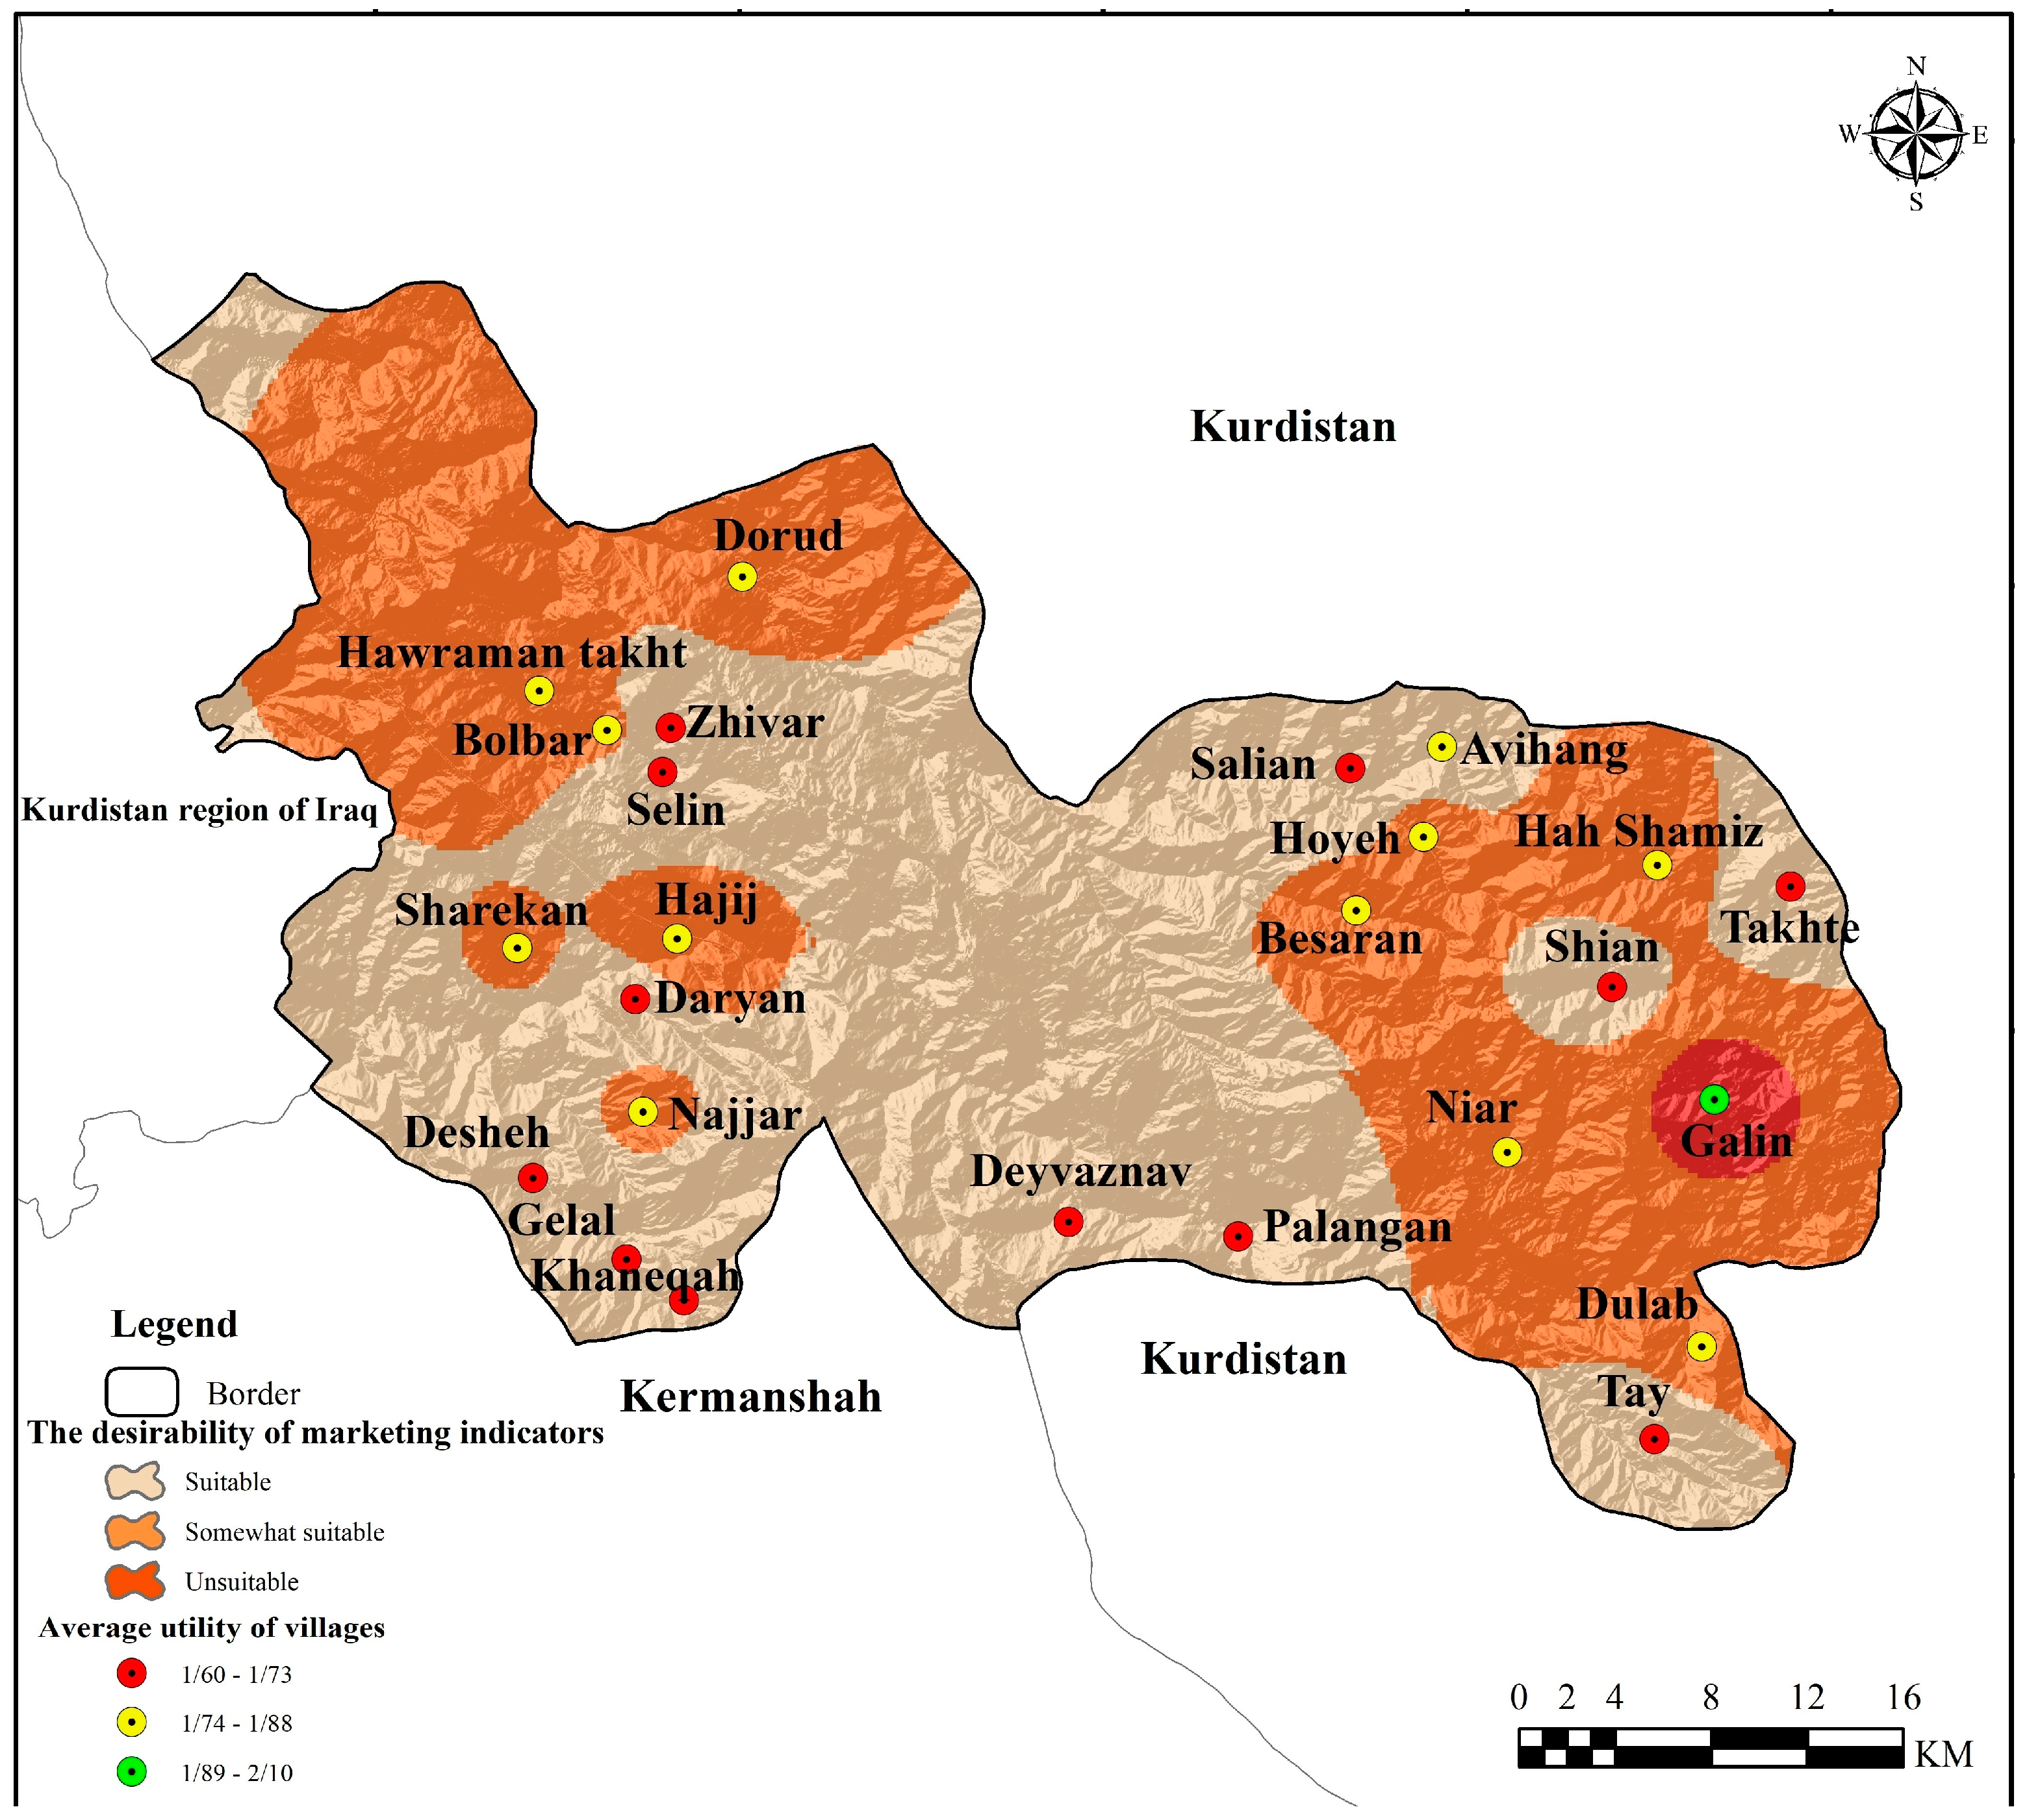
5.4. Evaluation and Ranking of Sample Villages Using the ARAS Technique
6. Discussion and Conclusions
6.1. Theoretical Implications
6.2. Practical and Management Implications
6.3. Research Limitations and Suggestions for Future Research
Author Contributions
Funding
Institutional Review Board Statement
Informed Consent Statement
Data Availability Statement
Acknowledgments
Conflicts of Interest
Appendix A
| The product | Total service product | Diversity and attractiveness of natural and native attractions |
| Branding and providing unique services to tourists | ||
| The level of tourists’ satisfaction with the services of ecotourism units | ||
| Diversification of services according to different seasons of the year | ||
| Original product | Events and festivals (for example, pomegranate, strawberry, Nowruz, etc.) | |
| Diversity of culture (e.g., clothes, language, celebrations, etc.) | ||
| Historical background (is the residence built in a place with a historical background) | ||
| Additional services | Gaining experience and training tourists from the local community | |
| Transferring experience and training to the local community | ||
| Music festival | ||
| Religious events | ||
| Historical events | ||
| Varied and quality foods | ||
| Variety of services (tours inside the village, accommodation, food, etc.) | ||
| Friendly dealings with tourists | ||
| Support services | How to access the residence | |
| The physical space of the residence and its traditionality | ||
| Quality and cleanliness of bed and sleep | ||
| Use a local guide | ||
| Souvenirs and handicrafts | ||
| Price | Cost | Reducing travel and accommodation costs for tourists from arrival to departure |
| Adopting a flexible pricing policy (offering discount codes for tours) | ||
| Controlling and recording the price of goods and services provided to tourists | ||
| Proportion of prices with the quality of goods and services offered to tourists | ||
| Based on the prevailing price in the market | ||
| Discount strategy (low price on non-peak days) | ||
| Based on customer needs | ||
| The operation | Low cost compared to competitors | |
| Penetration prices (introduction of services at a low price to capture the market) | ||
| Sales packages such as a combination of food and activities | ||
| Longer stay, lower cost (for example, a tourist who stays for several days should be charged for the second and third days at a lower cost) | ||
| Competition | Reduced rates for leaders and agencies | |
| Discount cards for tourists to reuse | ||
| Sales other than courier | ||
| Location | Location | Mental image of the tourist accommodation (to create a good mental image for tourists by reviving local and traditional values and hospitality) |
| The interior space and environment of Bogordi residence (built and decorated with local items) | ||
| Geographical location of the ecology unit | ||
| The body and the external physical space of the ecotourism residence | ||
| The health and quality of the place of ecotourism accommodation from pollution and insecurity | ||
| Access | The distance between ecotourism accommodation and tourist attractions | |
| The right time to travel to natural and historical villages | ||
| Creating a suitable space for tourists to gain experience from the local community | ||
| The distance between Bomgardi residence and the city center | ||
| Transportation services | The quality of the road and access ways to the ecotourism residence | |
| Ease of access to public transportation | ||
| Ease of access on foot | ||
| The quality of flooring in the residence area | ||
| Private parking lot of the resort | ||
| Electronic delivery | Tourists’ online shopping of products (handicrafts, herbal and edible medicines, etc.) produced in the ecotourism unit | |
| Tourists’ virtual visit to the tourist resort | ||
| The possibility of online reservation of the rooms at the resort | ||
| Promotion | Internal marketing | Advertising on local and national TV and radio |
| Publication of pamphlets, books, and brochures related to ecotourism accommodations | ||
| Tagging (recording the geographic location of the tourism unit in Google Maps) | ||
| Sharing photos and videos through YouTube and cameras | ||
| Direct marketing | Access to ecotourism enthusiasts through digital information sources to information about the food menu and accommodation environment, the address of the ecotourism unit, and even the grade and quality of food and local ingredients (mashup) | |
| Advertising and sharing content creation through blog and site | ||
| Using applications related to booking and introducing ecotourism accommodations | ||
| Sharing the production of tourism content through social media (Instagram, Telegram, WhatsApp, Twitter, Facebook, etc.) | ||
| Advertising | Selling or gifting a t-shirt or hat with the ecotourism logo to tourists | |
| Telling stories about cultural habits, social relations, village body, and special services in ecotourism (word of mouth advertising) | ||
| Personal communication with distribution channels of tours interested in rural tourism and ecotourism | ||
| Special discounts, for example, 80% for staying in an ecotourism unit for one day to increase customer awareness | ||
| Advertising method | Self-awareness and responsibility based on the culture of traveling to natural places | |
| Awareness based on the environment, the least negative impact in the places visited | ||
| Invitation to the participation of the local and host community | ||
| Participation in national and international tourism exhibitions | ||
| People | Customers | Respecting the rights of the host community |
| Responsible use of available resources | ||
| Respecting the customs and beliefs (national, religious) of the local community | ||
| Staff | Using local forces trained in the field of ecotourism for management, ceremonies, etc. in the ecotourism unit | |
| Using local and trained people to guide those interested in ecotourism (local leader) | ||
| Word-of-mouth advertising | ||
| Adhering to the proportionality of gender and age characteristics in the selection of employees | ||
| Development of human resources training in the activities of the ecotourism sector in order to provide efficient services | ||
| Training employees and turning them into skilled and active human resources | ||
| Continuous monitoring and evaluation of employees to improve the quality of providing services to tourists | ||
| Social interactions | Creating a platform for communication, transfer of experiences, and cultural exchange between the local community and tourists | |
| The cooperation of ecotourism residences with the local community to hold celebrations and charity events | ||
| The attitude of local people towards tourists | ||
| Communication with local authorities | ||
| Roles and relationships | Improving the general culture of local people in dealing with tourists | |
| Improving the morale and sense of belonging of local people towards tourists | ||
| Planning | Service design | Strategic plan for the sustainable development of the ecology unit (identification, segmentation, targeting, etc.) |
| Comprehensive program for interaction between local community and tourists | ||
| Analyzing the problems in the process of providing services to tourists and providing solutions | ||
| Standardization | Updating ecotourism services using the combination of new technologies and Indigenous knowledge | |
| Improving the monitoring of the performance of the existing departments in the eco-residence, such as (restaurants, crafts, rural museums, personnel, etc.) in order to support them | ||
| Ordering | Accurate identification of the problems and obstacles of ecotourism and efforts to solve them | |
| Compilation and implementation of a suitable travel plan according to the needs and wishes of tourists | ||
| Planning and policy-making to identify the goals of tourists from traveling to ecotourism accommodation | ||
| Operational efficiency | Dynamics of marketing information system for the development of ecotourism | |
| Coordination between different phases of providing services to tourists in ecotourism houses | ||
| Local community attraction and participation policies in the development of rural tourism with an emphasis on the mechanism of education | ||
| Physical evidence | Facilities and equipment | Physical appearances, environmental perspectives, color architecture, etc. in ecotourism |
| The cleanliness of the tourist accommodation | ||
| Appropriate spatial distribution of infrastructures and facilities needed for the well-being of tourists | ||
| Life and Antiquities | Reconstruction and improvement of historical monuments and their use for tourism accommodation | |
| Performance of historical and traditional shows | ||
| Symbols | The distinctiveness of the traditional architecture of the residence | |
| Beautification of ecotourism resort using traditional elements | ||
| Using tangible and intangible local and regional symbols | ||
| Compliance with the principles of furniture and physical spatial arrangement in ecotourism | ||
| Quality and productivity | Entertainment | Attractive, exciting, and energetic |
| Clean environment | ||
| Being experience-oriented (grabbing and teaching local activities to tourists) | ||
| Art and music | Original and traditional effects | |
| The sense of belonging and the amount of pleasure | ||
| Diversity and creativity (diversity of traditional arts and holding different Indigenous music) | ||
| Rich architecture | Diversity of native architecture is desirable | |
| Good access quality | ||
| Appropriate design and beauty of exterior and interior architecture | ||
| Having originality and tradition | ||
| Holding ancient and ritual celebrations | ||
| Culture of acceptance | Being family-oriented (is the resort managed by a family) | |
| Customer satisfaction (how much attention is paid to customer satisfaction in ecotours) | ||
| Statistical and information system | Comprehensiveness | Human resources and efficiently trained workforce in the tourism industry |
| Educational, employment, business, legal, and tourism business environments | ||
| Financing and expenses of the tourism industry | ||
| The private sector entrepreneur in the tourism industry with an emphasis on ecology | ||
| Information and communication technology infrastructure and physical infrastructure | ||
| Purposefulness | Local people’s participation and perspective on the development of tourism and ecology | |
| The length of stay and the amount spent by Kurdish tourists on tourism | ||
| The dynamics of experience-based attractions in ecotourism and education for tourists | ||
| Easy accessibility | Access to the Internet in attractive places tourism | |
| All people’s access to the services of ecotourism accommodations | ||
| Access to communication tools with ecotourism collections | ||
| Transfer speed | Using social media such as Instagram, WhatsApp, Facebook, etc. | |
| Existence of Internet sites for introduction and reservation of tourist accommodation | ||
| The presence of applications for introducing eco-friendly accommodations | ||
| Ruling bureaucracy | Flexibility | Creating a strong organizational culture in executive organizations |
| Training managers and experts training executives to implement tourism policies | ||
| Employing people who have appropriate and necessary experience in the implementation of tourism policies | ||
| Using information technology to implement tourism policies | ||
| Designing a system for evaluating the performance of tourism policies | ||
| Responsiveness | Providing effective information and advice to the private sector for the implementation of tourism policies | |
| Providing facilities to the private sector to invest in tourism | ||
| Creating a sense of responsibility in the performers | ||
| Creating awareness and correct understanding of the instructions by the executives | ||
| Simplicity | Decreasing the concentration in organizations implementing tourism policies (landscape) | |
| Reducing the complexity in organizations implementing tourism policies (landscape) | ||
| Reducing the size of the relevant organization | ||
| Coordination between parallel devices and multiple executive centers | ||
| Governing values | Select the target market | The degree of desirability of business relations between Iran and the country in question as a target market for tourism |
| The degree of desirability of relations between Iran and the country in question as a target market for tourism from a political point of view | ||
| The perception of the tourism place (tourism) can change from one person to another | ||
| The number of competitors and the state of competition in the tourism sector of the market | ||
| The amount of budget that should be spent to achieve ecotourism | ||
| Does ecotourism have enough growth potential? | ||
| Achieving sustainable development of ecology that includes responsible social and environmental behavior | ||
| Application of advanced technology strategy in the tourism industry | ||
| Determining the vision and strategic goals of the field of ecotourism | ||
| Ease of establishing business related to ecotourism | ||
| Improving the level of education of activists in the field of ecology | ||
| Improving productivity and evaluating the performance of ecotourism accommodations | ||
| Foresight | Diversifying attractions in tourist destinations (landscapes), creating complementary attractions | |
| Increasing the level of self-employment in tourism | ||
| Increasing the efficiency of ecotourism markets | ||
| Development of tourism business infrastructure | ||
| Making the labor market flexible | ||
| Power structure | Coherence in policy-making and planning | Developing comprehensive policies in the tourism industry with an emphasis on the ecotourism sector |
| Elaboration of tourism policies based on scientific and technical bases | ||
| Elaboration of tourism policies with the participation of executives | ||
| Developing tourism policies in harmony with the values of the local community | ||
| Clear formulation of the goals of tourism policies based on ecotourism | ||
| Developing tourism policies away from political conflicts | ||
| Independent and purposeful executive structure | Direct involvement of the government in investing in the tourism industry | |
| Applying effective laws and regulations for private sector investment in the tourism industry | ||
| Providing land to the private sector for investment in tourism | ||
| Providing effective information and advice to the private sector for the implementation of tourism policies | ||
| Using the market mechanism to implement tourism policies with an emphasis on the private sector | ||
| Teaching the benefits of tourism to families and society for the implementation of tourism policies | ||
| Policy implementation and monitoring | Constitution | Approval of guidelines and laws for the implementation of Article 44 of the constitution in the tourism industry |
| Long-term and short-term law | Approving appropriate laws to facilitate and remove visas for issuing visas | |
| Approval of easy laws for investment in ecotourism | ||
| Approving guidelines and rules for coordination between organizations’ regulations | ||
| Affecting the development of tourism (tourism) with the private sector and eliminating parallel work | ||
| Normal rules | Development of good relations with other countries | |
| Pursuing and continuing the de-escalation policy | ||
| Peaceful relations with neighboring Muslim countries | ||
| Entry and active activity in regional cooperation organizations and implementation of agreements | ||
| Regulations and directives | Activating embassies, cultural consultations, and setting up exhibitions in the countries of origin | |
| Uniform policies and non-discrimination between tourists | ||
| Political development inside the country | ||
| Accepting tourists from all countries |
References
- Thompson, B.S. Ecotourism anywhere? The lure of ecotourism and the need to scrutinize the potential competitiveness of ecotourism developments. Tour. Manag. 2022, 92, 104568. [Google Scholar] [CrossRef]
- Wondirad, A.; Tolkach, D.; King, B. Stakeholder collaboration as a major factor for sustainable ecotourism development in developing countries. Tour. Manag. 2020, 78, 104024. [Google Scholar] [CrossRef]
- Torabi, Z.-A.; Khavarian-Garmsir, A.R.; Hall, C.M.; Khatibi, N.B. Unintended Maladaptation: How Agritourism Development Policies in Iran Have Increased Vulnerability to Climate Change. Sustainability 2023, 15, 13003. [Google Scholar] [CrossRef]
- Hosseini, S.M.; Paydar, M.M.; Triki, C. Implementing sustainable ecotourism in Lafour region, Iran: Applying a clustering method based on SWOT analysis. J. Clean. Prod. 2021, 329, 129716. [Google Scholar] [CrossRef]
- Ghaderi, Z.; Abooali, G.; Henderson, J. Community capacity building for tourism in a heritage village: The case of Hawraman Takht in Iran. J. Sustain. Tour. 2018, 26, 537–550. [Google Scholar] [CrossRef]
- Ghaderi, Z.; Béal, L. Local impression of tourist photographing: A perspective from Iran. Tour. Manag. 2020, 76, 103962. [Google Scholar] [CrossRef]
- Mostafaei, A.; Taheri, K.; Parise, M.; Hashemi, S.M.; Khaledi, P. Hawraman Summer Camps: The Last Legacy of Water Scarcity Adaptation in the Western Zagros Karst Territory. In International Conference on Mediterranean Geosciences Union; Springer: Berlin/Heidelberg, Germany, 2021. [Google Scholar]
- Collignon, B. Karst Aquifers, a Strategic Tool for Mitigating the Impact of 100-Years Droughts Bernard Collignon and Fouzia Bensaoula. In Recent Research on Environmental Earth Sciences, Geomorphology, Soil Science, Paleoclimate, and Karst: Proceedings of the 1st MedGU, Istanbul 2021 (Volume 4); Springer: Berlin/Heidelberg, Germany, 2023; p. 217. [Google Scholar]
- Ghaderi, Z.; Henderson, J.C. Sustainable rural tourism in Iran: A perspective from Hawraman Village. Tour. Manag. Perspect. 2012, 2, 47–54. [Google Scholar] [CrossRef]
- Ghoddousi, S.; Pintassilgo, P.; Mendes, J.; Ghoddousi, A.; Sequeira, B. Tourism and nature conservation: A case study in Golestan National Park, Iran. Tour. Manag. Perspect. 2018, 26, 20–27. [Google Scholar] [CrossRef]
- Torabi, Z.-a.; Rezvani, M.R.; Badri, S.a. Tourism, poverty reduction and rentier state in Iran: A perspective from rural areas of Turan National Park. J. Policy Res. Tour. Leis. Events 2021, 13, 188–203. [Google Scholar] [CrossRef]
- Adom, D. The place and voice of local people, culture, and traditions: A catalyst for ecotourism development in rural communities in Ghana. Sci. Afr. 2019, 6, e00184. [Google Scholar] [CrossRef]
- Xiang, C.; Yin, L. Study on the rural ecotourism resource evaluation system. Environ. Technol. Innov. 2020, 20, 101131. [Google Scholar] [CrossRef]
- Torabi, Z.-A.; Rezvani, M.R.; Palouj, M. Comparing the Effect of Lecture and Jigsaw Teaching Strategies on Attitude and Environmentally Responsible Behavior: A Mixed-methods Approach. J. Qual. Assur. Hosp. Tour. 2022, 23, 1064–1087. [Google Scholar] [CrossRef]
- Gajić, T.; Ranjbaran, A.; Vukolić, D.; Bugarčić, J.; Spasojević, A.; Đorđević Boljanović, J.; Vujačić, D.; Mandarić, M.; Kostić, M.; Sekulić, D. Tourists’ Willingness to Adopt AI in Hospitality—Assumption of Sustainability in Developing Countries. Sustainability 2024, 16, 3663. [Google Scholar] [CrossRef]
- Bachri, S.; Sholeha, A.W.; Kurniawati, E.; Hakiki, A.R.; Hidiyah, T.M. Development Strategy for Special Interest Tourism (Sit) Through Community-Based Ecotourism (Cbet) in Perawan Beach To Promote a Sustainable Economy. Geo J. Tour. Geosites 2023, 48, 696–708. [Google Scholar]
- Bello, F.G. Community participation in tourism planning at majete wildlife reserve, Malawi. Quaest. Geogr. 2021, 40, 85–100. [Google Scholar] [CrossRef]
- Buckley, R.; Shekari, F.; Mohammadi, Z.; Azizi, F.; Ziaee, M. World heritage tourism triggers urban–rural reverse migration and social change. J. Travel Res. 2020, 59, 559–572. [Google Scholar] [CrossRef]
- Dennis, M.; Barlow, D.; Cavan, G.; Cook, P.A.; Gilchrist, A.; Handley, J.; James, P.; Thompson, J.; Tzoulas, K.; Wheater, C.P. Mapping urban green infrastructure: A novel landscape-based approach to incorporating land use and land cover in the mapping of human-dominated systems. Land 2018, 7, 17. [Google Scholar] [CrossRef]
- Amerta, I.M.S.; Sara, I.M.; Bagiada, K. Sustainable tourism development. Int. Res. J. Manag. IT Soc. Sci. 2018, 5, 248–254. [Google Scholar] [CrossRef]
- Sen, V.; Walter, P. Community-based ecotourism and the transformative learning of homestay hosts in Cambodia. Tour. Recreat. Res. 2020, 45, 323–336. [Google Scholar] [CrossRef]
- Altassan, A. Sustainability of Heritage Villages through Eco-Tourism Investment (Case Study: Al-Khabra Village, Saudi Arabia). Sustainability 2023, 15, 7172. [Google Scholar] [CrossRef]
- Doosti-Irani, M.; Basouli, M. Demand of an eco-lodge based on understanding its benefits for the destination and the tourist’s mental norms: An emphasis on the need for spiritual marketing (Case study: Eco-Lodges of Yazd City). J. Tour. Plan. Dev. 2021, 10, 125–144. [Google Scholar]
- Fennell, D.A. Ecotourism; Routledge: London, UK, 2014. [Google Scholar]
- Ronizi, S.R.A.; Mokarram, M.; Negahban, S. Utilizing multi-criteria decision to determine the best location for the ecotourism in the east and central of Fars province, Iran. Land Use Policy 2020, 99, 105095. [Google Scholar] [CrossRef]
- Hatma Indra Jaya, P.; Izudin, A.; Aditya, R. The role of ecotourism in developing local communities in Indonesia. J. Ecotourism 2024, 23, 20–37. [Google Scholar] [CrossRef]
- Osland, G.E.; Mackoy, R. Ecolodge performance goals and evaluations. J. Ecotourism 2004, 3, 109–128. [Google Scholar] [CrossRef]
- Gohar, A.; Kondolf, G.M. How Eco is Eco-Tourism? A systematic assessment of resorts on the Red Sea, Egypt. Sustainability 2020, 12, 10139. [Google Scholar] [CrossRef]
- Wight, P.A. Ecotourism accommodation spectrum: Does supply match the demand? Tour. Manag. 1997, 18, 209–220. [Google Scholar] [CrossRef]
- Tsaur, S.-H.; Lin, Y.-C.; Lin, J.-H. Evaluating ecotourism sustainability from the integrated perspective of resource, community and tourism. Tour. Manag. 2006, 27, 640–653. [Google Scholar] [CrossRef]
- Xu, L.; Ao, C.; Liu, B.; Cai, Z. Ecotourism and sustainable development: A scientometric review of global research trends. Environ. Dev. Sustain. 2023, 25, 2977–3003. [Google Scholar] [CrossRef] [PubMed]
- Gössling, S. Ecotourism: A means to safeguard biodiversity and ecosystem functions? Ecol. Econ. 1999, 29, 303–320. [Google Scholar] [CrossRef]
- Kwan, P.; Eagles, P.F.; Gebhardt, A. A comparison of ecolodge patrons’ characteristics and motivations based on price levels: A case study of Belize. J. Sustain. Tour. 2008, 16, 698–718. [Google Scholar] [CrossRef]
- Nair, V.; Hamzah, A. Successful community-based tourism approaches for rural destinations: The Asia Pacific experience. Worldw. Hosp. Tour. Themes 2015, 7, 429–439. [Google Scholar] [CrossRef]
- Stronza, A.; Gordillo, J. Community views of ecotourism. Ann. Tour. Res. 2008, 35, 448–468. [Google Scholar] [CrossRef]
- Charnley, S. From nature tourism to ecotourism? The case of the Ngorongoro Conservation Area, Tanzania. Hum. Organ. 2005, 64, 75–88. [Google Scholar] [CrossRef]
- Krüger, O. The role of ecotourism in conservation: Panacea or Pandora’s box? Biodivers. Conserv. 2005, 14, 579–600. [Google Scholar] [CrossRef]
- Cobbinah, P.B. Contextualising the meaning of ecotourism. Tour. Manag. Perspect. 2015, 16, 179–189. [Google Scholar] [CrossRef]
- Das, M.; Chatterjee, B. Ecotourism: A panacea or a predicament? Tour. Manag. Perspect. 2015, 14, 3–16. [Google Scholar] [CrossRef]
- Stem, C.J.; Lassoie, J.P.; Lee, D.R.; Deshler, D.D.; Schelhas, J.W. Community participation in ecotourism benefits: The link to conservation practices and perspectives. Soc. Nat. Resour. 2003, 16, 387–413. [Google Scholar] [CrossRef]
- Catibog-Sinha, C.; Wen, J. Sustainable tourism planning and management model for protected natural areas: Xishuangbanna biosphere reserve, South China. Asia Pac. J. Tour. Res. 2008, 13, 145–162. [Google Scholar] [CrossRef]
- Deery, M.; Jago, L.; Fredline, L. Rethinking social impacts of tourism research: A new research agenda. Tour. Manag. 2012, 33, 64–73. [Google Scholar] [CrossRef]
- Büyüközkan, G.; Güler, M. Smart watch evaluation with integrated hesitant fuzzy linguistic SAW-ARAS technique. Measurement 2020, 153, 107353. [Google Scholar] [CrossRef]
- Leick, B.; Lang, T. Re-Thinking Non-Core Regions: Planning Strategies and Practices Beyond Growth; Taylor & Francis: Abingdon, UK, 2018; Volume 26, pp. 213–228. [Google Scholar]
- Dubois, A. Transnationalising entrepreneurship in a peripheral region–The translocal embeddedness paradigm. J. Rural. Stud. 2016, 46, 1–11. [Google Scholar] [CrossRef]
- Malesky, E.J.; Hutchinson, F.E. Varieties of disappointment: Why has decentralization not delivered on its promises in Southeast Asia? J. Southeast Asian Econ. 2016, 33, 125–163. [Google Scholar] [CrossRef]
- Bohlin, M.; Brandt, D.; Elbe, J. Spatial concentration of tourism—A case of urban supremacy. Tour. Plan. Dev. 2022, 19, 392–412. [Google Scholar] [CrossRef]
- Fernández-Morales, A.; Cisneros-Martínez, J.D.; McCabe, S. Seasonal concentration of tourism demand: Decomposition analysis and marketing implications. Tour. Manag. 2016, 56, 172–190. [Google Scholar] [CrossRef]
- Saarinen, J.; Rogerson, C.M.; Hall, C.M. Geographies of tourism development and planning. In Tourism Planning and Development; Routledge: London, UK, 2019; pp. 1–11. [Google Scholar]
- Hampton, M.P.; Jeyacheya, J.; Long, P.H. Can tourism promote inclusive growth? Supply chains, ownership and employment in Ha Long Bay, Vietnam. J. Dev. Stud. 2018, 54, 359–376. [Google Scholar] [CrossRef]
- DeMicco, F.J. A disney approach to medical tourism and wellness. In Medical Tourism and Wellness: Hospitality Bridging Healthcare (H2H); Apple Academic Press: New York, NY, USA, 2017; pp. 95–101. [Google Scholar]

| Village | The Product | Price | People | Promotion | Place | Planning | Physical Evidence | Quality and Productivity | Total Marketing Indicators |
|---|---|---|---|---|---|---|---|---|---|
| Selin | 65 | 21.43 | 56.25 | 56.25 | 47.06 | 27.27 | 55.56 | 92.31 | 52.64 |
| Zhivar | 60 | 35.71 | 62.50 | 5.0 | 52.94 | 27.27 | 66.67 | 92.31 | 55.93 |
| Bolbar | 50 | 28.57 | 50 | 56.25 | 64.71 | 27.27 | 55.56 | 53.85 | 48.28 |
| Dorud | 50 | 35.71 | 68.75 | 68.75 | 52.94 | 27.27 | 66.67 | 38.46 | 51.07 |
| Hawraman takht | 80 | 42.86 | 75.0 | 81.25 | 64.71 | 36.36 | 66.67 | 100 | 68.36 |
| Galin | 60 | 57.14 | 81.25 | 75.0 | 64.71 | 45.45 | 77.78 | 76.92 | 76.28 |
| Dulab | 65 | 42.86 | 62.50 | 75.0 | 58.82 | 27.27 | 66.67 | 92.31 | 61.30 |
| Shian | 55 | 50 | 56.25 | 56.25 | 41.18 | 27.27 | 55.56 | 92.31 | 54.23 |
| Avihang | 60 | 42.86 | 62.50 | 62.50 | 41.18 | 18.18 | 66.67 | 69.23 | 52.89 |
| Salian | 50 | 50 | 62.50 | 50 | 64.71 | 27.27 | 55.56 | 92.31 | 56.45 |
| Hoyeh | 55 | 57.14 | 50 | 56.25 | 52.94 | 36.36 | 66.67 | 53.85 | 53.53 |
| Besaran | 45 | 35.71 | 50 | 50 | 58.82 | 27.27 | 66.67 | 53.85 | 48.42 |
| Tay | 35 | 42.86 | 62.50 | 56.25 | 35.29 | 27.27 | 66.67 | 69.23 | 49.38 |
| Palangan | 75 | 42.86 | 81.25 | 62.50 | 58.82 | 18.18 | 66.67 | 67.92 | 60.28 |
| Niar | 55 | 35.71 | 43.75 | 50 | 52.94 | 9.09 | 66.67 | 30.77 | 42.99 |
| Hah Shamiz | 45 | 42.86 | 50 | 43.75 | 47.06 | 27.27 | 66.67 | 92.31 | 51.86 |
| Takhteh | 45 | 57.14 | 50 | 50 | 29.41 | 27.27 | 55.56 | 69.23 | 47.95 |
| Deyvaznav | 55 | 28.57 | 43.75 | 56.25 | 47.06 | 18.18 | 66.67 | 92.31 | 50.97 |
| Daryan | 45 | 28.57 | 56.25 | 56.25 | 47.06 | 18.18 | 66.67 | 30.77 | 43.59 |
| Hajij | 85 | 57.14 | 75.0 | 68.75 | 70.59 | 45.45 | 66.67 | 53.85 | 65.31 |
| Sheekean | 45 | 42.86 | 37.50 | 68.75 | 58.82 | 18.18 | 77.78 | 30.77 | 47.46 |
| Desheh | 65 | 57.14 | 56.25 | 62.50 | 47.06 | 27.27 | 66.67 | 53.85 | 54.47 |
| Gelal | 60 | 50 | 62.50 | 68.75 | 64.71 | 18.18 | 66.67 | 92.31 | 60.39 |
| Najjar | 65 | 42.86 | 62.50 | 56.25 | 58.82 | 27.27 | 66.67 | 30.77 | 51.27 |
| Khaneqah | 65 | 57.14 | 56.25 | 56.25 | 58.82 | 18.18 | 66.67 | 92.31 | 58.83 |
| Village | The Product | Price | People | Promotion | Place | Planning | Physical Evidence | Quality and Productivity | Total Marketing Indicators |
|---|---|---|---|---|---|---|---|---|---|
| Selin | 1.92 | 1.0 | 1.33 | 2.0 | 1.88 | 1.0 | 1.80 | 1.57 | 1.63 |
| Zhivar | 1.92 | 1.60 | 1.30 | 1.88 | 2.0 | 1.33 | 1.33 | 1.57 | 1.68 |
| Bolbar | 2.0 | 2.0 | 1.25 | 2.20 | 2.18 | 1.67 | 1.60 | 1.57 | 1.80 |
| Dorud | 1.80 | 1.80 | 1.64 | 2.45 | 2.0 | 1.67 | 1.67 | 1.80 | 1.83 |
| Hawraman takht | 2.38 | 1.67 | 1.58 | 2.31 | 1.91 | 1.50 | 1.83 | 1.77 | 1.88 |
| Galin | 2.17 | 1.50 | 1.62 | 2.33 | 1.73 | 1.60 | 2.71 | 2.40 | 2.20 |
| Dulab | 2.0 | 1.50 | 1.70 | 2.17 | 1.50 | 2.33 | 2.33 | 1.92 | 1.81 |
| Shian | 1.82 | 1.29 | 1.56 | 2.0 | 1.71 | 1.33 | 2.0 | 1.75 | 1.70 |
| Avihang | 1.83 | 1.67 | 1.60 | 2.0 | 1.57 | 1.50 | 1.67 | 2.0 | 1.75 |
| Salian | 1.50 | 1.57 | 1.50 | 2.13 | 1.91 | 1.67 | 1.80 | 1.92 | 1.70 |
| Hoyeh | 1.73 | 2.50 | 1.50 | 1.78 | 1.67 | 1.25 | 1.83 | 2.0 | 1.79 |
| Besaran | 1.67 | 1.60 | 2.0 | 1.63 | 2.20 | 1.33 | 1.67 | 1.86 | 1.79 |
| Tay | 1.86 | 1.83 | 1.80 | 2.0 | 2.0 | 1.67 | 1.50 | 1.67 | 1.71 |
| Palangan | 2.33 | 1.50 | 1.54 | 2.60 | 1.70 | 1.0 | 1.33 | 1.30 | 1.73 |
| Niar | 1.64 | 1.60 | 1.71 | 2.13 | 2.0 | 1.50 | 2.0 | 1.75 | 1.77 |
| Hah Shamiz | 1.78 | 1.83 | 1.50 | 2.14 | 2.13 | 1.33 | 2.0 | 1.75 | 1.85 |
| Takhteh | 1.67 | 1.63 | 1.50 | 1.88 | 2.0 | 1.67 | 1.60 | 1.67 | 1.62 |
| Deyvaznav | 1.82 | 2.0 | 1.29 | 2.20 | 1.88 | 1.0 | 1.33 | 1.92 | 1.67 |
| Daryan | 1.56 | 1.25 | 1.78 | 1.78 | 1.50 | 1.0 | 2.33 | 2.0 | 1.70 |
| Hajij | 2.20 | 1.38 | 2.20 | 2.27 | 1.92 | 1.40 | 1.67 | 2.14 | 1.88 |
| Sheekean | 1.67 | 2.0 | 1.83 | 1.91 | 1.80 | 1.50 | 1.86 | 1.50 | 1.78 |
| Desheh | 1.69 | 1.75 | 1.89 | 2.20 | 1.88 | 1.67 | 1.33 | 1.71 | 1.68 |
| Gelal | 1.75 | 2.0 | 1.50 | 1.73 | 1.91 | 1.0 | 1.50 | 1.58 | 1.66 |
| Najjar | 1.46 | 2.17 | 1.70 | 1.89 | 2.0 | 1.33 | 2.0 | 1.75 | 1.81 |
| Khaneqah | 1.54 | 1.75 | 1.89 | 2.20 | 1.90 | 1.50 | 1.83 | 1.75 | 1.60 |
| Village | Statistical and Information System | Ruling Bureaucracy | Governing Values | Power Structure | Implementation and Monitoring of Policies | A Set of Policy Indicators |
|---|---|---|---|---|---|---|
| Selin | 71.43 | 46.15 | 70.59 | 58.33 | 46.15 | 59.42 |
| Zhivar | 57.14 | 46.15 | 58.82 | 41.67 | 38.46 | 49.28 |
| Bolbar | 71.43 | 30.77 | 41.18 | 58.33 | 46.15 | 49.28 |
| Dorud | 78.57 | 53.85 | 58.82 | 58.33 | 46.15 | 59.42 |
| Hawraman takht | 78.57 | 61.54 | 82.35 | 66.67 | 38.46 | 66.67 |
| Galin | 78.57 | 53.85 | 70.59 | 75.0 | 46.15 | 65.22 |
| Dulab | 78.57 | 46.15 | 76.47 | 83.33 | 53.85 | 68.12 |
| Shian | 64.29 | 30.77 | 64.71 | 58.33 | 61.54 | 56.52 |
| Avihang | 71.43 | 30.77 | 52.94 | 66.67 | 53.85 | 55.07 |
| Salian | 71.43 | 30.77 | 47.06 | 66.67 | 46.15 | 52.17 |
| Hoyeh | 71.43 | 30.77 | 35.29 | 50 | 38.46 | 44.93 |
| Besaran | 71.43 | 61.54 | 64.71 | 58.33 | 46.15 | 60.87 |
| Tay | 71.43 | 46.15 | 52.94 | 66.67 | 46.15 | 56.52 |
| Palangan | 64.29 | 38.46 | 64.71 | 66.67 | 46.15 | 56.52 |
| Niar | 64.29 | 53.85 | 58.82 | 66.67 | 38.46 | 56.52 |
| Hah Shamiz | 71.43 | 38.46 | 38.46 | 83.33 | 38.46 | 55.07 |
| Takhteh | 71.43 | 23.08 | 47.06 | 66.67 | 38.46 | 49.28 |
| Deyvaznav | 71.43 | 46.38 | 52.94 | 66.67 | 38.46 | 53.62 |
| Daryan | 71.43 | 23.08 | 64.71 | 66.67 | 38.46 | 53.62 |
| Hajij | 78.57 | 61.54 | 76.47 | 83.33 | 46.15 | 69.57 |
| Sheekean | 71.43 | 53.85 | 64.71 | 50 | 46.15 | 57.97 |
| Desheh | 71.43 | 23.08 | 47.06 | 50 | 61.54 | 50.72 |
| Gelal | 64.29 | 38.46 | 52.94 | 50 | 53.85 | 52.17 |
| Najjar | 71.43 | 30.77 | 52.94 | 50 | 53.85 | 52.17 |
| Khaneqah | 71.43 | 23.08 | 47.06 | 58.33 | 61.54 | 52.29 |
| Village | Statistical and Information System | Ruling Bureaucracy | Governing Values | Power Structure | Implementation and Monitoring of Policies | A Set of Policy Indicators |
|---|---|---|---|---|---|---|
| Selin | 1.90 | 2.0 | 2.50 | 1.86 | 1.33 | 1.72 |
| Zhivar | 1.63 | 1.0 | 1.40 | 1.40 | 1.20 | 1.33 |
| Bolbar | 1.90 | 1.57 | 1.43 | 1.43 | 1.17 | 1.53 |
| Dorud | 2.18 | 1.43 | 1.60 | 1.29 | 1.50 | 1.60 |
| Hawraman takht | 2.20 | 2.0 | 1.93 | 1.75 | 1.40 | 1.83 |
| Galin | 2.20 | 1.86 | 1.58 | 1.1 | 1.17 | 1.65 |
| Dulab | 2.20 | 1.67 | 1.69 | 1.70 | 1.14 | 1.66 |
| Shian | 1.56 | 1.0 | 1.64 | 1.57 | 1.25 | 1.40 |
| Avihang | 1.30 | 1.75 | 1.67 | 1.25 | 1.14 | 1.42 |
| Salian | 1.60 | 1.75 | 1.25 | 1.13 | 1.33 | 1.41 |
| Hoyeh | 1.70 | 1.75 | 1.83 | 1.67 | 1.40 | 1.67 |
| Besaran | 2.0 | 1.63 | 1.36 | 1.14 | 1.33 | 1.46 |
| Tay | 2.20 | 1.67 | 1.56 | 1.0 | 1.67 | 1.62 |
| Palangan | 2.44 | 1.40 | 1.82 | 1.38 | 1.33 | 1.67 |
| Niar | 1.56 | 1.86 | 1.20 | 1.38 | 1.0 | 1.40 |
| Hah Shamiz | 1.70 | 1.0 | 2.0 | 1.60 | 1.0 | 1.46 |
| Takhteh | 1.70 | 1.33 | 1.63 | 1.63 | 1.20 | 1.50 |
| Deyvaznav | 1.70 | 2.0 | 1.67 | 1.38 | 1.20 | 1.59 |
| Daryan | 2.20 | 2.0 | 2.0 | 1.88 | 1.20 | 1.84 |
| Hajij | 2.20 | 1.63 | 2.23 | 1.80 | 1.17 | 1.78 |
| Sheekean | 1.60 | 1.43 | 2.0 | 1.83 | 1.0 | 1.57 |
| Desheh | 1.50 | 2.0 | 1.88 | 1.83 | 1.63 | 1.77 |
| Gelal | 2.0 | 1.0 | 1.56 | 1.67 | 1.57 | 1.56 |
| Najjar | 1.70 | 1.75 | 1.67 | 1.33 | 1.29 | 1.55 |
| Khaneqah | 1.80 | 1.67 | 1.88 | 2.0 | 1.38 | 1.74 |
| The Extent of Marketing | The Extent of Policy | The Extent of Marketing | Village |
|---|---|---|---|
| 52.64 | 59.42 | 55.59 | Selin |
| 55.93 | 49.28 | 52.19 | Zhivar |
| 48.28 | 49.28 | 48.92 | Bolbar |
| 51.7 | 59.42 | 55.11 | Dorud |
| 68.36 | 66.67 | 66.94 | Hawraman takht |
| 76.28 | 65.22 | 66.6 | Galin |
| 61.30 | 68.12 | 64.49 | Dulab |
| 54.23 | 56.52 | 55.8 | Shian |
| 52.89 | 55.7 | 54.1 | Avihang |
| 56.45 | 52.17 | 54.48 | Salian |
| 53.53 | 44.93 | 49.36 | Hoyeh |
| 48.42 | 6.87 | 54.42 | Besaran |
| 49.38 | 56.52 | 53.3 | Tay |
| 60.28 | 56.52 | 58.17 | Palangan |
| 42.99 | 56.52 | 49.70 | Niar |
| 51.86 | 55.7 | 53.81 | Hah Shamiz |
| 47.95 | 49.28 | 48.65 | Takhteh |
| 50.97 | 53.62 | 52.28 | Deyvaznav |
| 43.59 | 53.62 | 48.23 | Daryan |
| 65.31 | 69.57 | 67.26 | Hajij |
| 47.46 | 57.97 | 52.34 | Sheekean |
| 54.47 | 50.72 | 52.54 | Desheh |
| 60.39 | 52.17 | 56.15 | Gelal |
| 51.27 | 52.17 | 51.53 | Najjar |
| 58.83 | 52.29 | 55.56 | Khaneqah |
| The Extent of Marketing | The Extent of Policy | The Extent of Marketing | Village |
|---|---|---|---|
| 1.63 | 1.72 | 1.67 | Selin |
| 1.68 | 1.33 | 1.50 | Zhivar |
| 1.80 | 1.53 | 1.67 | Bolbar |
| 1.83 | 1.60 | 1.72 | Dorud |
| 1.88 | 1.83 | 1.86 | Hawraman takht |
| 2.10 | 1.65 | 1.83 | Galin |
| 1.81 | 1.66 | 1.73 | Dulab |
| 1.70 | 1.40 | 1.55 | Shian |
| 1.75 | 1.42 | 1.59 | Avihang |
| 1.70 | 1.41 | 1.55 | Salian |
| 1.79 | 1.67 | 1.73 | Hoyeh |
| 1.79 | 1.46 | 1.64 | Besaran |
| 1.71 | 1.62 | 1.66 | Tay |
| 1.73 | 1.67 | 1.70 | Palangan |
| 1.77 | 1.40 | 1.58 | Niar |
| 1.85 | 1.46 | 1.65 | Hah Shamiz |
| 1.62 | 1.50 | 1.56 | Takhteh |
| 1.67 | 1.59 | 1.63 | Deyvaznav |
| 1.70 | 1.84 | 1.77 | Daryan |
| 1.88 | 1.78 | 1.83 | Hajij |
| 1.78 | 1.57 | 1.68 | Sheekean |
| 1.68 | 1.77 | 1.72 | Desheh |
| 1.66 | 1.56 | 1.61 | Gelal |
| 1.81 | 1.55 | 1.68 | Najjar |
| 1.60 | 1.74 | 1.67 | Khaneqah |
| Marketing | Policy Making | Village | Marketing | Policy Making | Village |
|---|---|---|---|---|---|
| 0.059 | 0.478 | Selin | 0.275 | 0.556 | Palangan |
| 0.167 | 0 | Zhivar | 0.345 | 0.229 | Niar |
| 0.400 | 0.461 | Bolbar | 0.504 | 0.429 | Shamiz |
| 0.469 | 0.601 | Dorud | 0.040 | 0.152 | Takhteh |
| 0.566 | 0 | Hawraman takht | 0.141 | 0.353 | Deyvaznav |
| 1 | 0.166 | Galin | 0.205 | 0.746 | Daryan |
| 0.418 | 0.468 | Dulab | 0.573 | 0.933 | Hajij |
| 0.212 | 0.142 | Shian | 0.364 | 0.488 | Sheekean |
| 0.307 | 0.236 | Avihang | 0.170 | 0.625 | Desheh |
| 0.199 | 0.145 | Salian | 0.132 | 0.305 | Gelal |
| 0.390 | 0.644 | Hoyeh | 0.422 | 0.494 | Najjar |
| 0.376 | 0.385 | Besaran | 0 | 0.472 | Khaneqah |
| 0.220 | 0.451 | Tay | |||
| Marketing | policy making | ||||
| 7.93 | Total | 11.14 | Total | ||
| 0.317 | xi | 0.446 | xi | ||
| 0.214 | standard deviation | 0.247 | standard deviation | ||
| 0.678 | Cv | 0.553 | Cv | ||
| 0.549 | Weight | 0.451 | Weight | ||
| Village | The Level of Desirability | Degree of Desirability | Rank | Village | The Level of Desirability | Degree of Desirability | Rank |
|---|---|---|---|---|---|---|---|
| Selin | 0.0398 | 0.845 | 13 | Palangan | 0.0406 | 0.862 | 9 |
| Zhivar | 0.0361 | 0.766 | 25 | Niar | 0.0381 | 0.808 | 21 |
| Bolbar | 0.0399 | 0.848 | 12 | Shamiz | 0.0398 | 0.844 | 14 |
| Dorud | 0.0411 | 0.872 | 7 | Takhteh | 0.0372 | 0.790 | 24 |
| Hawraman takht | 0.0441 | 0.941 | 1 | Deyvaznav | 0.0389 | 0.826 | 18 |
| Galin | 0.0440 | 0.935 | 2 | Daryan | 0.0421 | 0.893 | 4 |
| Dulab | 0.0414 | 0.880 | 5 | Hajij | 0.0438 | 0.930 | 3 |
| Shian | 0.0373 | 0.791 | 23 | Sheekean | 0.0401 | 0.825 | 11 |
| Avihang | 0.0414 | 0.808 | 20 | Desheh | 0.0411 | 0.872 | 8 |
| Salian | 0.0393 | 0.791 | 22 | Gelal | 0.0385 | 0.817 | 19 |
| Hoyeh | 0.0379 | 0.879 | 6 | Najjar | 0.0402 | 0.845 | 10 |
| Besaran | 0.0406 | 0.834 | 17 | Khaneqah | 0.0379 | 0.834 | 15 |
| Tay | 0.0381 | 0.835 | 16 |
Disclaimer/Publisher’s Note: The statements, opinions and data contained in all publications are solely those of the individual author(s) and contributor(s) and not of MDPI and/or the editor(s). MDPI and/or the editor(s) disclaim responsibility for any injury to people or property resulting from any ideas, methods, instructions or products referred to in the content. |
© 2024 by the authors. Licensee MDPI, Basel, Switzerland. This article is an open access article distributed under the terms and conditions of the Creative Commons Attribution (CC BY) license (https://creativecommons.org/licenses/by/4.0/).
Share and Cite
Pourtaheri, M.; Torabi, Z.-A.; Khavarian-Garmsir, A.R.; Sajadi, S.; Hall, C.M. Ecolodge Tourism Dynamics: A Village-Level Analysis of Marketing and Policy Indicators in Iran’s Hawraman Region. Sustainability 2024, 16, 5072. https://doi.org/10.3390/su16125072
Pourtaheri M, Torabi Z-A, Khavarian-Garmsir AR, Sajadi S, Hall CM. Ecolodge Tourism Dynamics: A Village-Level Analysis of Marketing and Policy Indicators in Iran’s Hawraman Region. Sustainability. 2024; 16(12):5072. https://doi.org/10.3390/su16125072
Chicago/Turabian StylePourtaheri, Mehdi, Zabih-Allah Torabi, Amir Reza Khavarian-Garmsir, Saeed Sajadi, and Colin Micheal Hall. 2024. "Ecolodge Tourism Dynamics: A Village-Level Analysis of Marketing and Policy Indicators in Iran’s Hawraman Region" Sustainability 16, no. 12: 5072. https://doi.org/10.3390/su16125072
APA StylePourtaheri, M., Torabi, Z.-A., Khavarian-Garmsir, A. R., Sajadi, S., & Hall, C. M. (2024). Ecolodge Tourism Dynamics: A Village-Level Analysis of Marketing and Policy Indicators in Iran’s Hawraman Region. Sustainability, 16(12), 5072. https://doi.org/10.3390/su16125072