Abstract
Research on the tourism carrying capacity (TCC) serves as the scientific basis for ensuring the sustainable development of tourism and is vital for the establishment of tourism corridors. From the novel perspective of the space of flows, in this study, we conducted a set of evaluations of the TCCs of tourism corridors using the methods of space–time consumption and linear programming in operational research. Through empirical investigation of the five tourism corridors in the Qinghai–Tibet Plateau, we arrived at the following conclusions: (i) The traffic carrying capacity of the tourism corridors amounts to 2,463,600 people/day. (ii) Under the constraints of urban reception service facilities and tourist attraction capacity, the traffic carrying capacity of each section is only 1,782,400 people/day. The research results scientifically reflect the current carrying capacity of tourism traffic in different corridors and sections, as well as the state of road traffic and the urban tourism infrastructure along corridors experiencing overload. This paper not only verifies the feasibility of the proposed theoretical method but also provides an optimization plan and theoretical support for enhancing the sustainable development of the tourism industry on the Qinghai–Tibet Plateau.
1. Introduction
In recent times, the issue of periodic overload in tourist destinations due to holiday systems has become increasingly apparent [1]. This temporary surge poses significant challenges for both visitor experiences and the sustainable development of these destinations. Du Cros and Kong (2020) documented that urban areas in Macao, China have experienced significant congestion resulting from an overwhelming influx of visitors [2]. This highlights the challenge posed by the overloading of local tourism resources. Such situations can lead to irreversible outcomes, including resident dissatisfaction, compromised tourist experiences, strain on infrastructure, and the degradation of natural and cultural heritage sites. Therefore, investigating the maximum tourist capacity of destinations holds both scientific and practical importance for preserving local resources and the environment, optimizing tourism infrastructure, and guiding sustainable tourism development.
The tourism carrying capacity (TCC) denotes the maximum number of individuals who can utilize an area without causing detrimental alterations to the natural environment or compromising the quality of the tourist experience [3]. Over the past four decades, research on the TCC has emerged as a focal point in tourism management [4], contributing significantly to the sustainable development of tourist destinations. The TCC is a comprehensive concept, which involves society, culture, psychology, resources, and the environment [1]. Many scholars have estimated the TCC through different methods [5]. For example, Shi et al. (2014) developed the planimetry method to assist in measuring the tourism ecological carrying capacity of natural scenic spots [6]. Alexis Saveriades (2000) established the social TCC of the east coast of the Republic of Cyprus according to sociological capacity thresholds [7]. Mansfeld and Jonas (2006) evaluated the sociocultural carrying capacity of rural tourism communities using the value stretch model [8].
With the widespread adoption of self-driving tours, the development of linear recreational spaces centered around tourism corridors has emerged as a crucial strategic initiative for the transformation and enhancement of tourism and the optimization of spatial tourism patterns across various countries and regions [9]. The concept of tourism corridors initially evolved from the development of linear national areas designated for natural and cultural preservation with recreational objectives. Notable examples of tourism corridors include linear spaces of natural significance and historical value, such as national park roads, national rivers, national wild and scenic rivers, and national scenic trails within the U.S. National Park System dating back to the early 19th century [10]. Other examples include UNESCO-designated linear cultural heritage sites, cultural routes, heritage canals, heritage corridors, and other trans-regional heritage sites. These areas reflect the integrity and continuity of both natural and human landscapes, showcasing the dynamic characteristics of social, economic, and cultural development throughout various historical periods [11]. In the second half of the 19th century, the concept of the “scenic byway” was first proposed in the United States, to emphasize the recreational aspects of linear national park traffic roads. This concept gradually gave rise to a scenic byway system comprising nationally designated scenic byways, state and federally designated scenic byways, and local scenic byways [12]. Subsequently, numerous countries have undertaken tourism corridor planning initiatives, exemplified by projects such as the German Romantic Road, China’s Sichuan–Tibet Highway, the U.S. Route 66, and the Blue Ridge Scenic Byway.
The Qinghai–Tibet Plateau, known as the world’s third pole, is the highest plateau in the world. After 40 years of development, tourism has become one of the most important human activities in the Qinghai–Tibet Plateau [13]. In 2023, Tibet received 55.1697 million tourists, equivalent to 15 times the local population, and the number is on the rise. Owing to the large area of the Qinghai–Tibet Plateau and the scattered towns, villages, and scenic spots, the self-driving tour has become the most important mode of touristic activities [14,15]. In recent years, with the continuous enhancement of the road infrastructure, several tourism corridors have gradually emerged, such as the Sichuan–Tibet route, the Qinghai–Tibet route, and the Xinjiang–Tibet route [16]. However, the issue of seasonal congestion in tourism corridors has become increasingly problematic. In 2017, a traffic congestion incident on the Qinghai–Tibet route extended over 200 km, leaving tourists stranded for 90 h. Hence, the scientific estimation of the TCCs of these corridors holds significant importance for optimizing the tourism infrastructural layout and enhancing tourists’ overall experience.
At present, academic research on the TCC is characterized by the following: (i) The research primarily targets tourist attractions or specific regions, concentrating on spatial and facility carrying capacities within the region. The maximum carrying capacities of scenic spots are determined according to actual conditions [17,18]. (ii) The research methods encompass evaluations based on index systems [1,19], multi-objective optimization algorithms [20], neural networks [21], and information monitoring [22]. (iii) The research focuses on the impact of human activities on the surrounding environment of the region [23], with relatively little attention given to the behavioral characteristics and sensory experiences of tourists during their activities. Owing to the unique nature of self-driving tour activities, the evaluation of the TCCs for tourism corridors must consider not only the capacity of road traffic but also the influence of surrounding landscapes, tourist attractions, and tourism infrastructure [24]. Thus, existing TCC assessment methods may not be entirely applicable. Accordingly, in this study, we aimed to develop a set of theoretical models for evaluating the TCC of tourism corridors and to test the applicability of these models through a case analysis of the Tibetan Plateau. The findings are intended to provide a scientific basis for the development of sustainable tourism on the Tibetan Plateau.
2. Tourism Corridor System from a Flow Space Perspective
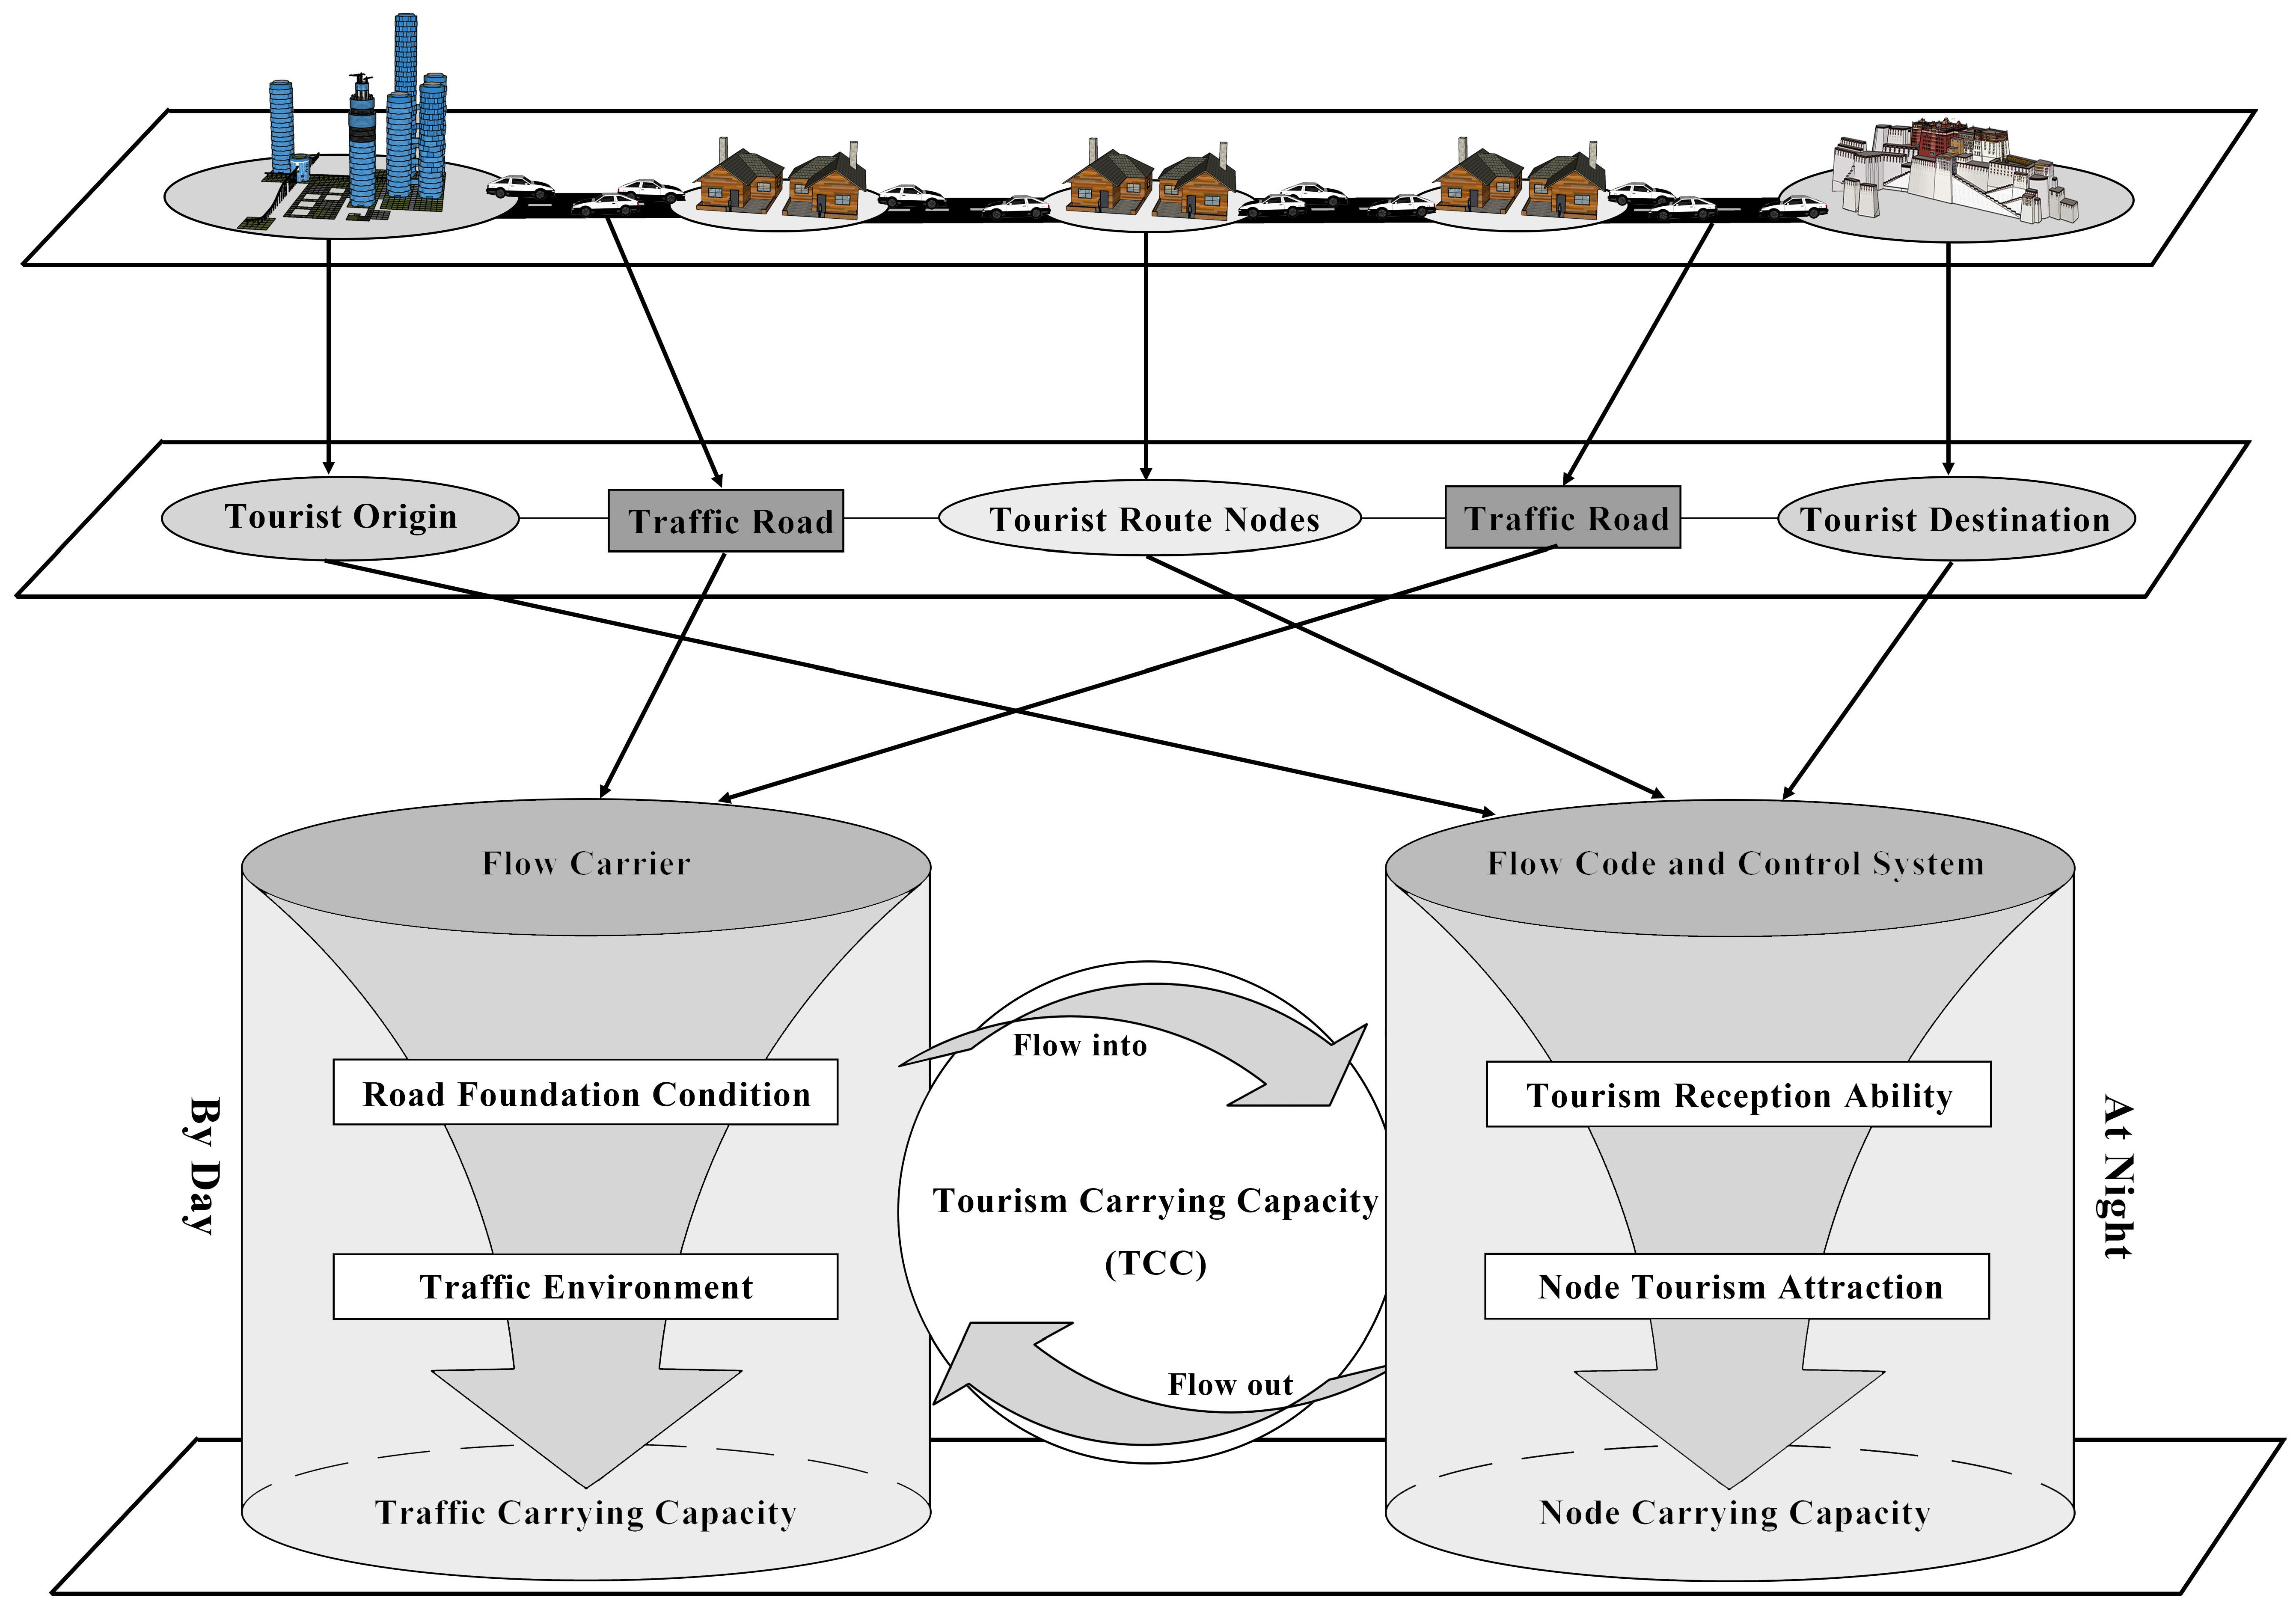
According to the definitions of environmental traffic capacity and the TCC [25,26], the TCC of a tourism corridor refers to the maximum number of tourists that the entire corridor can accommodate within a given period. This is limited by the specific traffic infrastructure, availability of tourism service facilities, and capacity of attractions in the towns along the route. According to this definition, we constructed a framework for tourism corridor systems (Figure 1). From the temporal perspective, the self-driving tour primarily involves traffic-related activities during the day and leisure and rest around core tourist attractions at night. This cyclic pattern of “travel” during the day and “rest” at night characterizes the “station-like” nature of self-driving tour activities [27]. From the spatial perspective, according to the theory of three elements of tourism [28], the self-driving tour involve tourists traveling from one tourist node to the next along traffic roads, ultimately reaching the tourist destination. Hence, the tourism corridor comprises several tourist nodes and traffic roads, and the road traffic capacity and the reception capacity of tourist nodes collectively determine the TCC of the corridor.
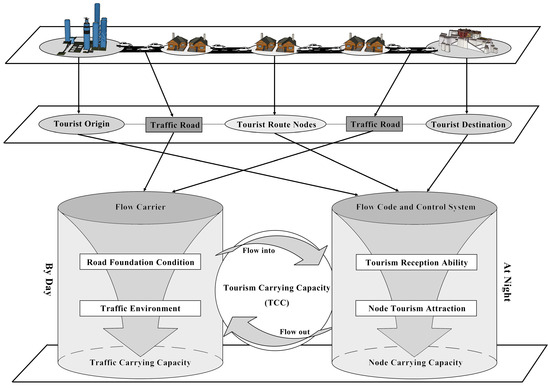
Figure 1.
Realistic model, theoretical model, and flow space model of tourism corridor system. Own processing.
However, understanding the operational mechanism of the tourism corridor system requires examining the system from the perspective of flow space components, which include flow elements, flow carriers, flow nodes, and control systems [29]. This framework also applies to the tourism corridor: Flow elements represent the movement of tourists, information, materials, and energy guiding tourists with similar demands. Flow carriers are the road traffic within the corridor, influenced by the road quality and traffic conditions. Flow nodes denote points with supportive capacity along the corridor. The control systems encompass the capacity of tourist attractions surrounding the town. Therefore, the following fundamental insights can be made regarding the interaction between traffic roads and tourist route nodes during the daytime: (1) Tourist traffic roads serve as the fundamental carriers of the tourist flow, determining the maximum tourist throughput between towns each day. (2) Tourist route nodes function as both tourist origins and destinations, attracting and dispersing tourism flows to and from neighboring nodes. The threshold for flow absorption and release depends on the capacity of the urban tourism infrastructure. (3) The upper limit for flow absorption and release depends on the capacity of the node tourism infrastructure. The capacity of tourist attractions around the node determines the rate at which the node absorbs and releases tourism flows. Therefore, the TCC of tourism corridors is the maximum tourism flow capacity of the corridors under the dual constraints of traffic roads and tourism route nodes.
3. TCC of Tourism Corridor Evaluation Method
3.1. TCC Evaluation Model
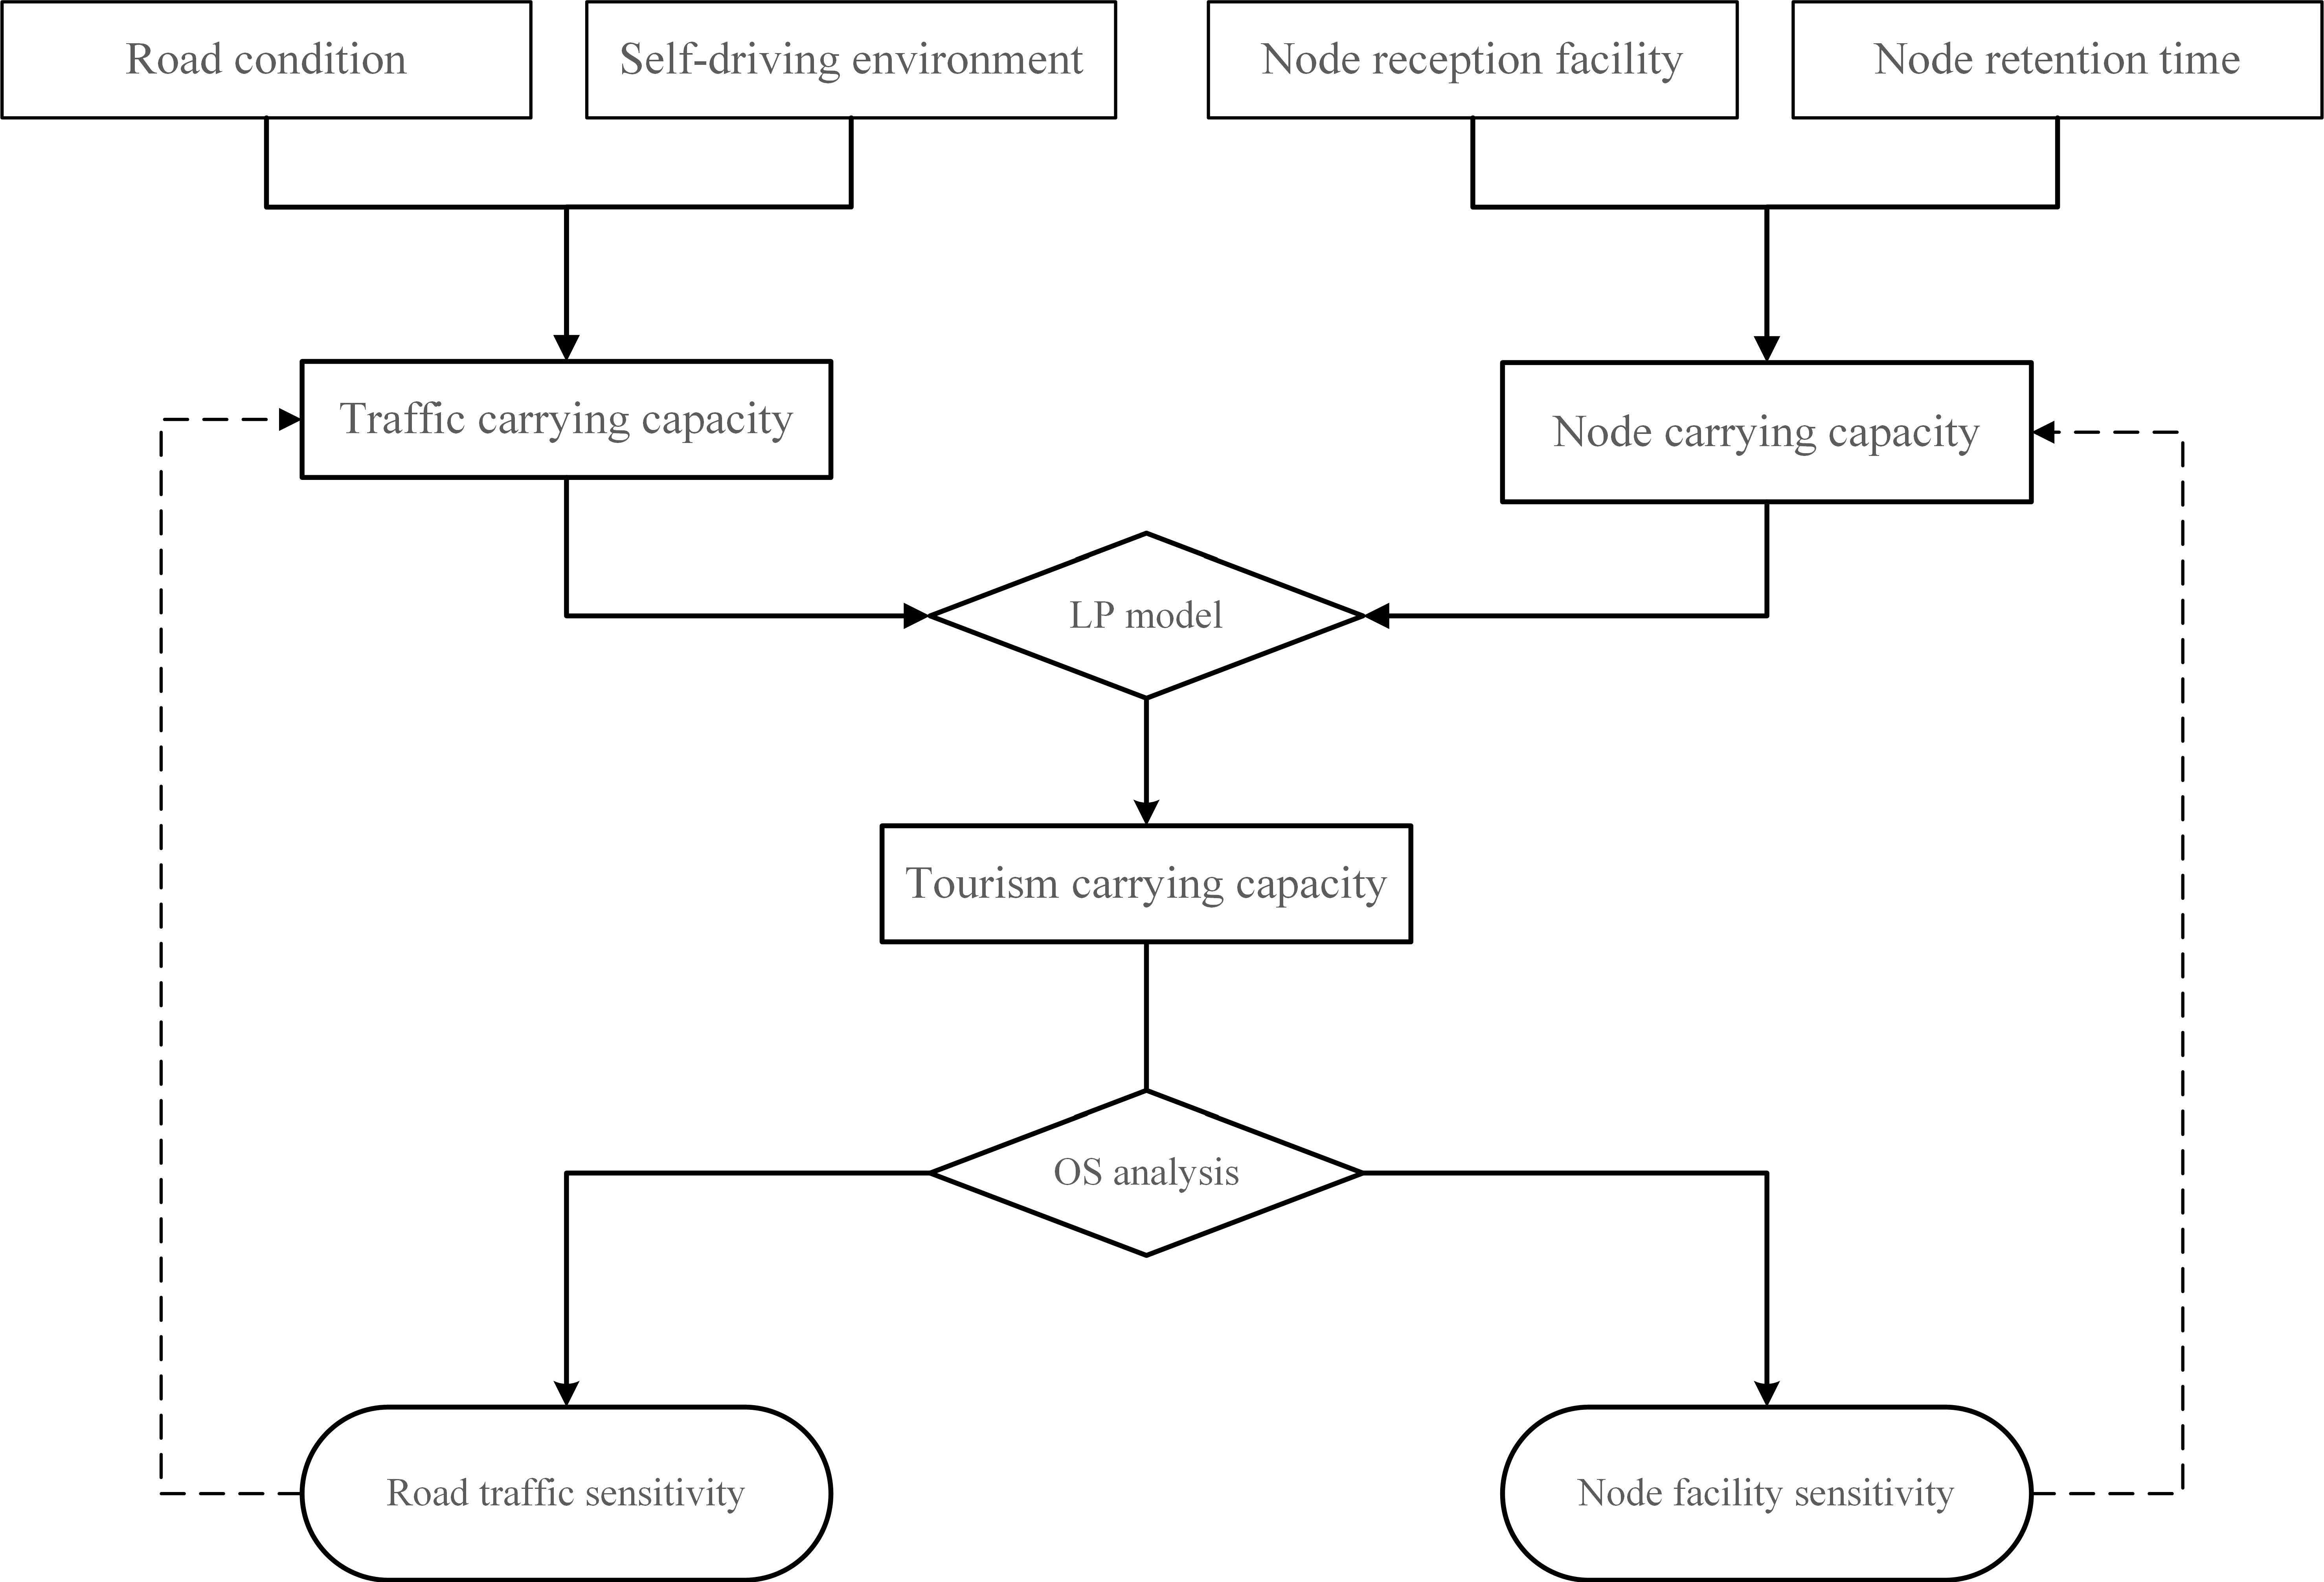
According to the above framework, the evaluation model of the TCC of the tourism corridor was constructed, as shown in Figure 2. First, the traffic carrying capacity () and node carrying capacity () are evaluated separately. Second, the TCC is calculated under the condition of mutual constraints between the and using a linear programming (LP) model. Third, an overload scenario (OS) analysis is conducted to calculate the road traffic sensitivity and node facility sensitivity and consequently identify the tourism corridor components most susceptible to overloading during the peak tourist season. Finally, the TCC evaluation result is compared with the ideal carrying capacity, and optimization suggestions for the tourism corridor are provided.
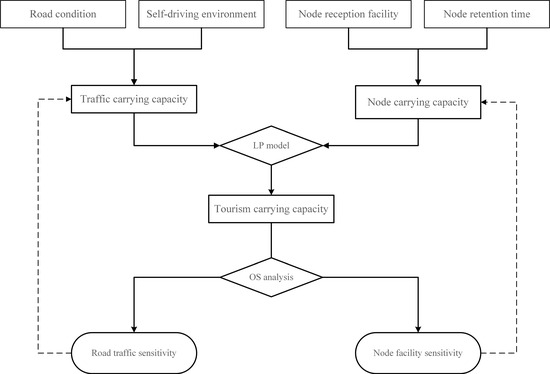
Figure 2.
Tourism corridor TCC evaluation model. Own processing.
3.2. Methodology
3.2.1. Space–Time Consumption Method of
The classic generalized is used in the space–time consumption method [30]. We consider the safety risk, driving experience, and landscape value associated with self-driving activities [24,31] and optimize the model. The specific formula is shown in Equations (1)–(5).
where is the traffic carrying capacity; n is the number of people in a single tourist-driven car; constitutes the total spatiotemporal resources of roads; is the road area in space, which is the product of the total length of the road () and the number of lanes (); is the service time of the road; is the proportion of resources served by a self-driving tour after accounting for the occupancy of other social vehicles; is the space–time occupied by a single tourist-driven car; is the vehicle safety distance, which is obtained according to the deceleration safety distance model in the braking process; is the travel time of tourist-driven cars; is the driving speed of the tourist-driven car, generally determined according to the road’s design speed; is the braking delay time; is the maximum deceleration of the rear vehicle; and is the distance between the front vehicle and the rear vehicle after the brake stops. is the traffic environment index, where , , and represent the safety risk, driving experience, and landscape value along the route, respectively, weighted via the entropy weight method.
3.2.2. Evaluation Method of
The node carrying capacity () is the number of visitors each node can receive per day. Nodes within the tourism corridor typically denote towns and villages where tourists can lodge and explore during their visit. The focus of is to evaluate the reception facilities of nodes and the tourist attractions available for exploration.
The node reception capacity can be measured according to the accommodation facilities within a certain range of nodes [32], and the average number of beds in hotels is taken as the estimation index, as shown in Formula (6).
where is node reception capacity, denotes all types of accommodation sites in the city, represents the number of type accommodation sites, and is the average number of beds in type i accommodation sites.
Numerous studies have investigated the durations of stays in tourist destinations, with the resource background of these destinations emerging as a decisive factor influencing tourists’ lengths of stay [33,34]. We calculate the node residence time according to the number of tourist attractions. The specific formula is shown in Formula (7).
where is the node retention time (per day), is the number of tourist attractions owned by the city, and is the maximum stay duration of a self-driving tour.
Finally, the node carrying capacity () is obtained using Equation (8).
At > 1, < , because some tourists attracted by the numerous tourist attractions extend their stay for more than one day at the node, thereby utilizing the available reception facilities at the node.
3.2.3. LP Model for TCC
The TCC needs to be comprehensively solved considering the aforementioned two types of carrying capacities. The LP model is a mathematical optimization tool employed to maximize or minimize an objective function under linear constraints [35]. In the field of transportation, LP is widely used in traffic flow management, transportation planning, and route selection to achieve optimal utilization of resources and effective management of transportation systems [36,37].
According to the source and sink theory [38], the key to solving the TCC is ensuring that the daily outflow of tourists from nodes is absorbed by other nodes through tourism routes, establishing an “in–out balance”, which forms the core of establishing an LP model. When the outgoing passenger flow from nodes surpasses the of surrounding roads, congestion arises owing to the restricted of surrounding roads. If the is not exceeded, the upper limit of the is constrained by the . According to the above limitations, the LP model is constructed as Equations (9) and (10):
where is the number of sections in the tourism corridor; is the traffic carrying capacity of section i; is the number of towns around the section that tourists may use for transportation purposes; and is the node carrying capacity of node j.
3.2.4. OS Analysis
The road traffic sensitivity index () measures the carrying capacities of different sections of the tourism corridor under the condition that the nodes are fully loaded. From the viewpoint of the carrying capacity, roads can be categorized into four states: road-insensitive, entry-sensitive, return-sensitive, and two-way-sensitive. The Ir is determined according to the ratio of the comprehensive carrying capacity of roads to the carrying capacity of road traffic, with the formula shown in Equation (11):
between 100% and 80% indicates high sensitivity, while one between 80% and 60% indicates moderate sensitivity, and less than 60% indicates low sensitivity. In a highly sensitive state, the passenger flow released by the surrounding towns approaches or exceeds the carrying capacity of the surrounding roads, resulting in traffic jams. In a low-sensitivity state, the daily passenger transport flow from surrounding towns falls significantly below the surrounding traffic carrying capacity, indicating that the road traffic resources remain underutilized even when the town is at full capacity.
Node facility sensitivity () refers to the ratio of the maximum number of tourists that a node may receive to its own urban carrying capacity when road traffic is at full capacity and the surrounding nodes ensure the maximum outflow. The specific formula is shown in Equation (12):
where represents the node’s ideal carrying capacity; and denotes the number of nodes that may reach this node, sorted according to the distance from the target town.
If the passenger flow through the section exceeds its own TCC, then the section TCC represents the passenger flow that can move into the target town through the section. Otherwise, the section TCC is the sum of the passenger flows that may move out of the town.
4. Study Area
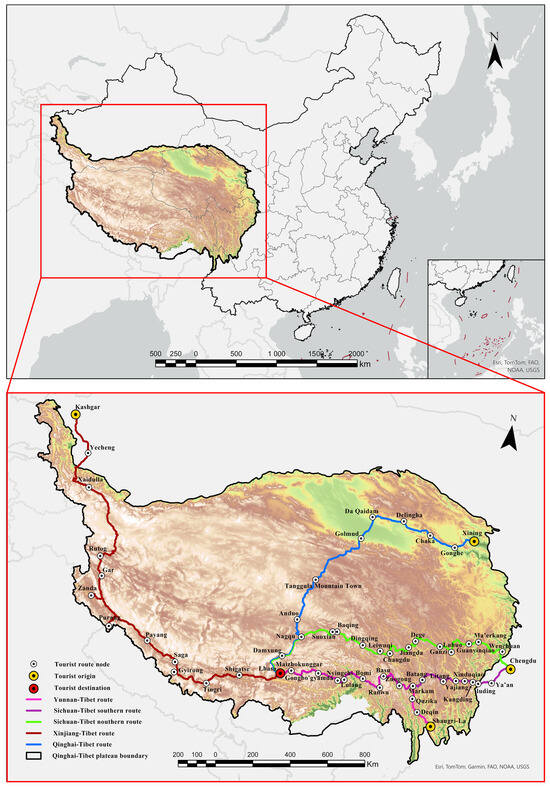
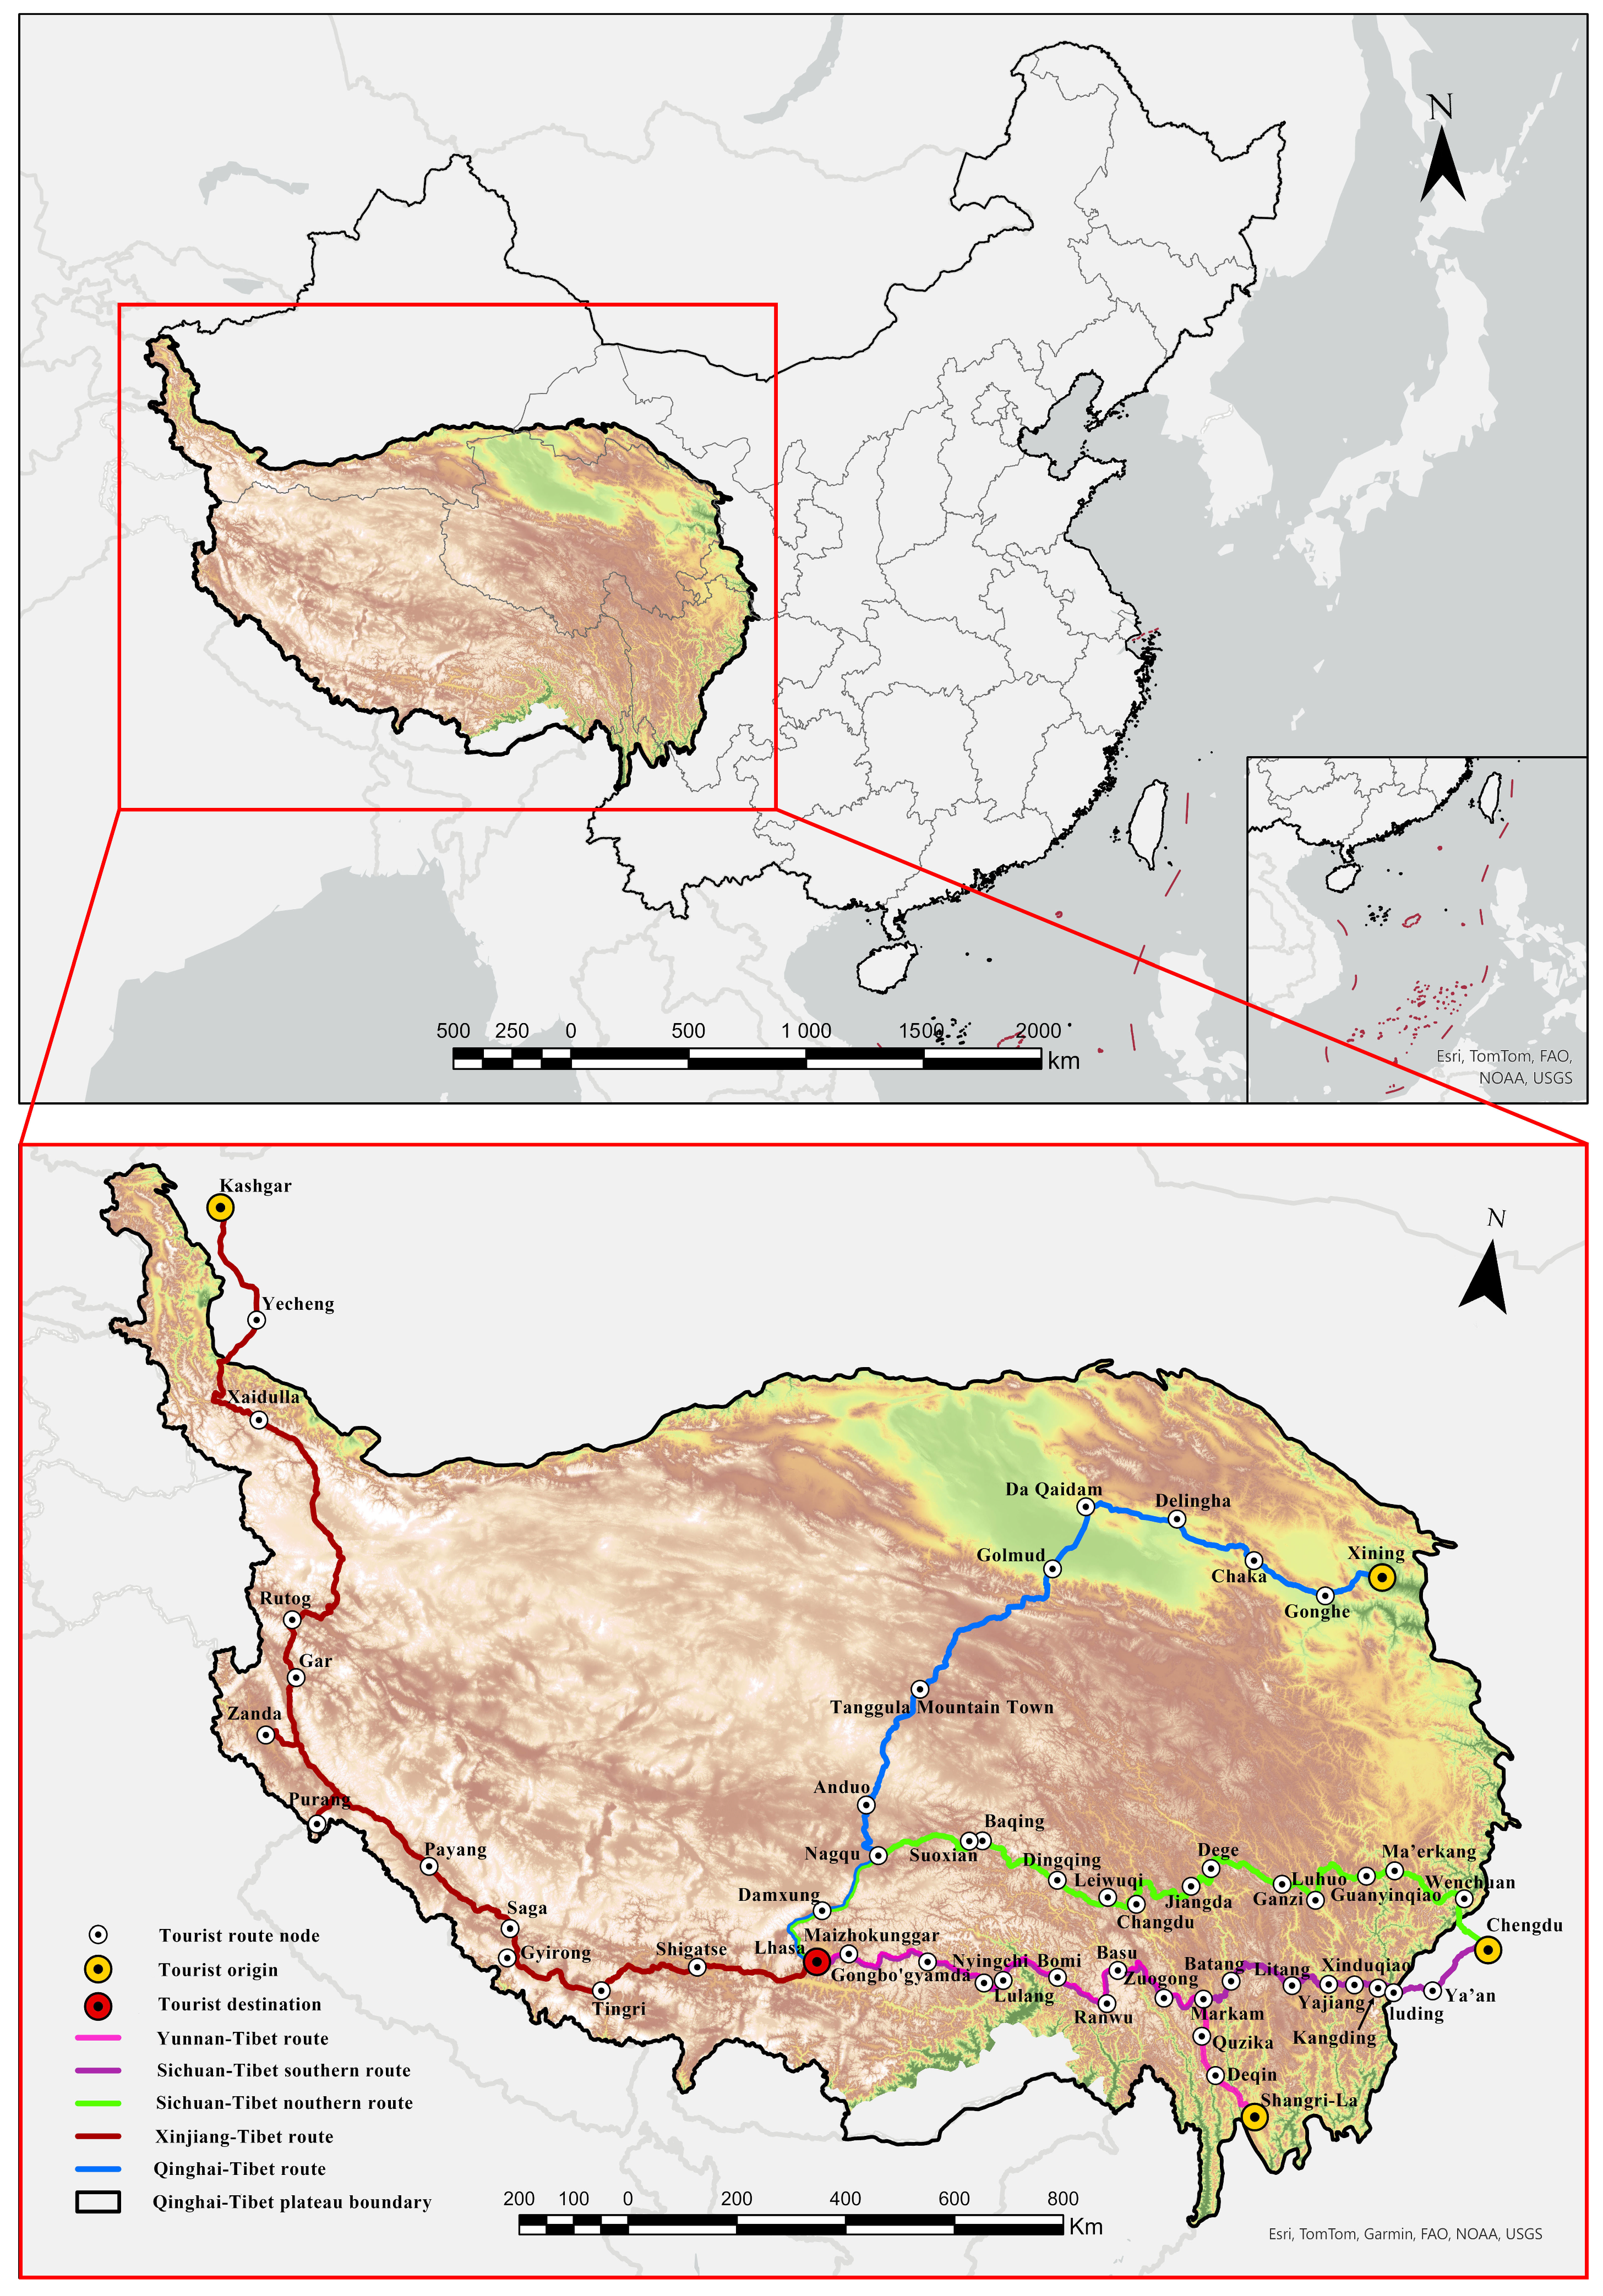
The Qinghai–Tibet Plateau is the largest plateau in China and the highest in the world, with a total area of 2,500,000 km2 and an average altitude of more than 4000 m. After 70 years of planning and construction, the infrastructure [39] and road traffic conditions [40] on the Qinghai–Tibet Plateau have gradually improved. With the rise of the self-driving tour, the tourist route from surrounding tourism origins to Lhasa has become the most popular tourist-driven route, attracting tens of millions of tourists every year. This trend has driven the development of five tourism corridors across the Qinghai–Tibet Plateau, characterized by diverse landscapes and well-established infrastructure (Scheme 1). These five tourism corridors are illustrated in Figure 3. (i) The Sichuan–Tibet southern route starts from Chengdu and traverses Ya’an, Kangding, Litang, Bomi, Nyingchi, and other destinations before reaching Lhasa. With a total length of 2489.5 km, this route follows the 30th parallel north and is renowned as “China’s most beautiful landscape avenue”. (ii) The Xinjiang–Tibet route commences from Kashgar and passes through Yecheng, Zhongba, Sagar, Shigaze, and other locations en route to Lhasa. Extending over 2772.9 km, this route encompasses sacred mountains and lakes such as Mansarugar, Kailash Peak, Pangong Lake, and Mount Qomolangma, along with border ports such as Yadong, Zhangmu, Jilong, and Burang. It serves as a vital conduit for the development of western China. (iii) The Qinghai–Tibet route originates from Xining and traverses Chaka, Delingha, Golmud, Tanggula Mountain Town, and Nagqu before reaching Lhasa. This route passes through notable geographic features such as the Huangshui Valley, Qaidam Basin, Kunlun Mountains, Tanggula Mountains, Hoh Xil Depopulated Zone, and Qiangtang Grassland. It runs parallel to the Qinghai–Tibet Railway, renowned as the “world’s highest-altitude railway”. (iv) The Yunnan–Tibet route starts from Shangri-La and travels through Deqin, Mangkang, Nyingchi, and other locations en route to Lhasa. With a total length of 1596.1 km, this route constitutes a significant segment of the Asian Corridor in Heaven. (v) The Sichuan–Tibet northern route starts from Chengdu and passes through Wenchuan, Markang, Garze, Qamdo, and Suiwuqi before reaching Lhasa. This route is along the G317 National Highway and has a length of 1888.6 km, serving as a crucial segment of the Sichuan–Tibet Highway.
Scheme 1.
Case studies. Own processing in ArcGIS Pro.
5. Data Source and Main Parameter Settings
The data used in this study mainly comprise natural geographical environment data, social and economic development data, point of interest (POI) data, and scientific investigation data for the transportation corridor of the Qinghai–Tibet Plateau. The data can be divided into the following: (i) Primary data, which mainly originate from field scientific investigations on the Qinghai–Tibet Plateau and include the following: (1) Questionnaire survey data: These data mainly provide information on the psychological cognition and behavioral characteristics of tourists on self-driving tours on the plateau. (2) On-site discussion and interview data: These include discussions with relevant local departments to gather social, economic, and tourism development statistics of tourism route nodes along the five tourism corridors. (3) Field exploration data. These encompass information on road quality, environmental conditions, tourism resource development and utilization, tourism infrastructure, and other aerial and on-site investigation data. (4) Web crawler data. These consist of POI data of tourist attractions and accommodation points in the API database of Amap in 2022 (https://lbs.amap.com/, accessed on 31 December 2022), collected using Python code. The data include latitude and longitude coordinates, administrative divisions, major categories, and medium categories. (ii) Secondary data. (1) Natural geographic information data: These include data obtained from the Center for Resources and Environmental Sciences and Data, Chinese Academy of Sciences (https://www.resdc.cn/, accessed on 28 July 2022). (2) Social and economic development data: These include transportation network data, data on A-level scenic spots, and data on beds in the accommodation industry. The data sources are the National Statistical Yearbook 2022 and the official website of the Ministry of Culture and Tourism, PRC (https://zwgk.mct.gov.cn/zfxxgkml/, accessed on 2 June 2023). The primary data were collected from July to September 2022, and the secondary data were obtained from the official website in 2022.
Various parameters of the evaluation model are set according to field research and empirical values from the relevant literature. When calculating road resources, the road service time is set at 8–10 h/day. The daily travel time is limited to 6–8 h, according to tourists’ activity habits and traffic awareness from questionnaire responses. The proportion of road resources allocated to self-driving tours ranges from 50% to 80%, increasing with the distance from the tourist source. When calculating the vehicle safety distance, v0 represents the driving speed of the tourist-driven car, determined according to the road’s design speed. The braking delay time is set between 1.2 and 2.0 s [41]. The maximum deceleration value of the rear car is 6–8 m/s2. The distance between the front and rear vehicles after braking is 5 m [42]. The reduction factor of the traffic environment is between 0.6 and 0.8. The residence time of a node is generally between 1 and 4 days, according to the characteristics of tourist-driven car activities [43].
Determination of parameters related to the traffic environment index: The safety risk index is based on the digital elevation model raster data of the Qinghai–Tibet Plateau, and ArcGIS Pro 3.3, a 3D analysis tool, is employed to transform the data into a relief raster for measurement. The driving experience index is determined by the ratio of the actual road distance to the straight distance, known as tortuosity. The landscape value index is calculated using the Shannon diversity index, which considers the types, areas, and quantities of landforms within the visual range around the road.
6. Results
6.1. Traffic Carrying Capacity
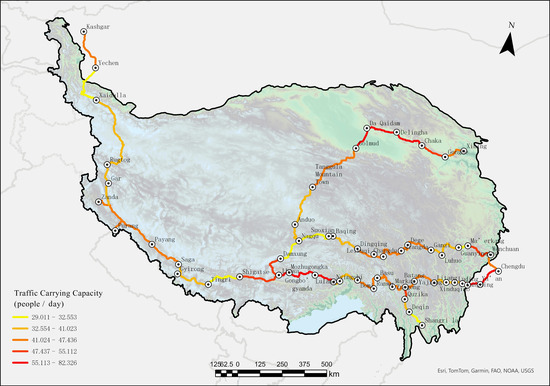
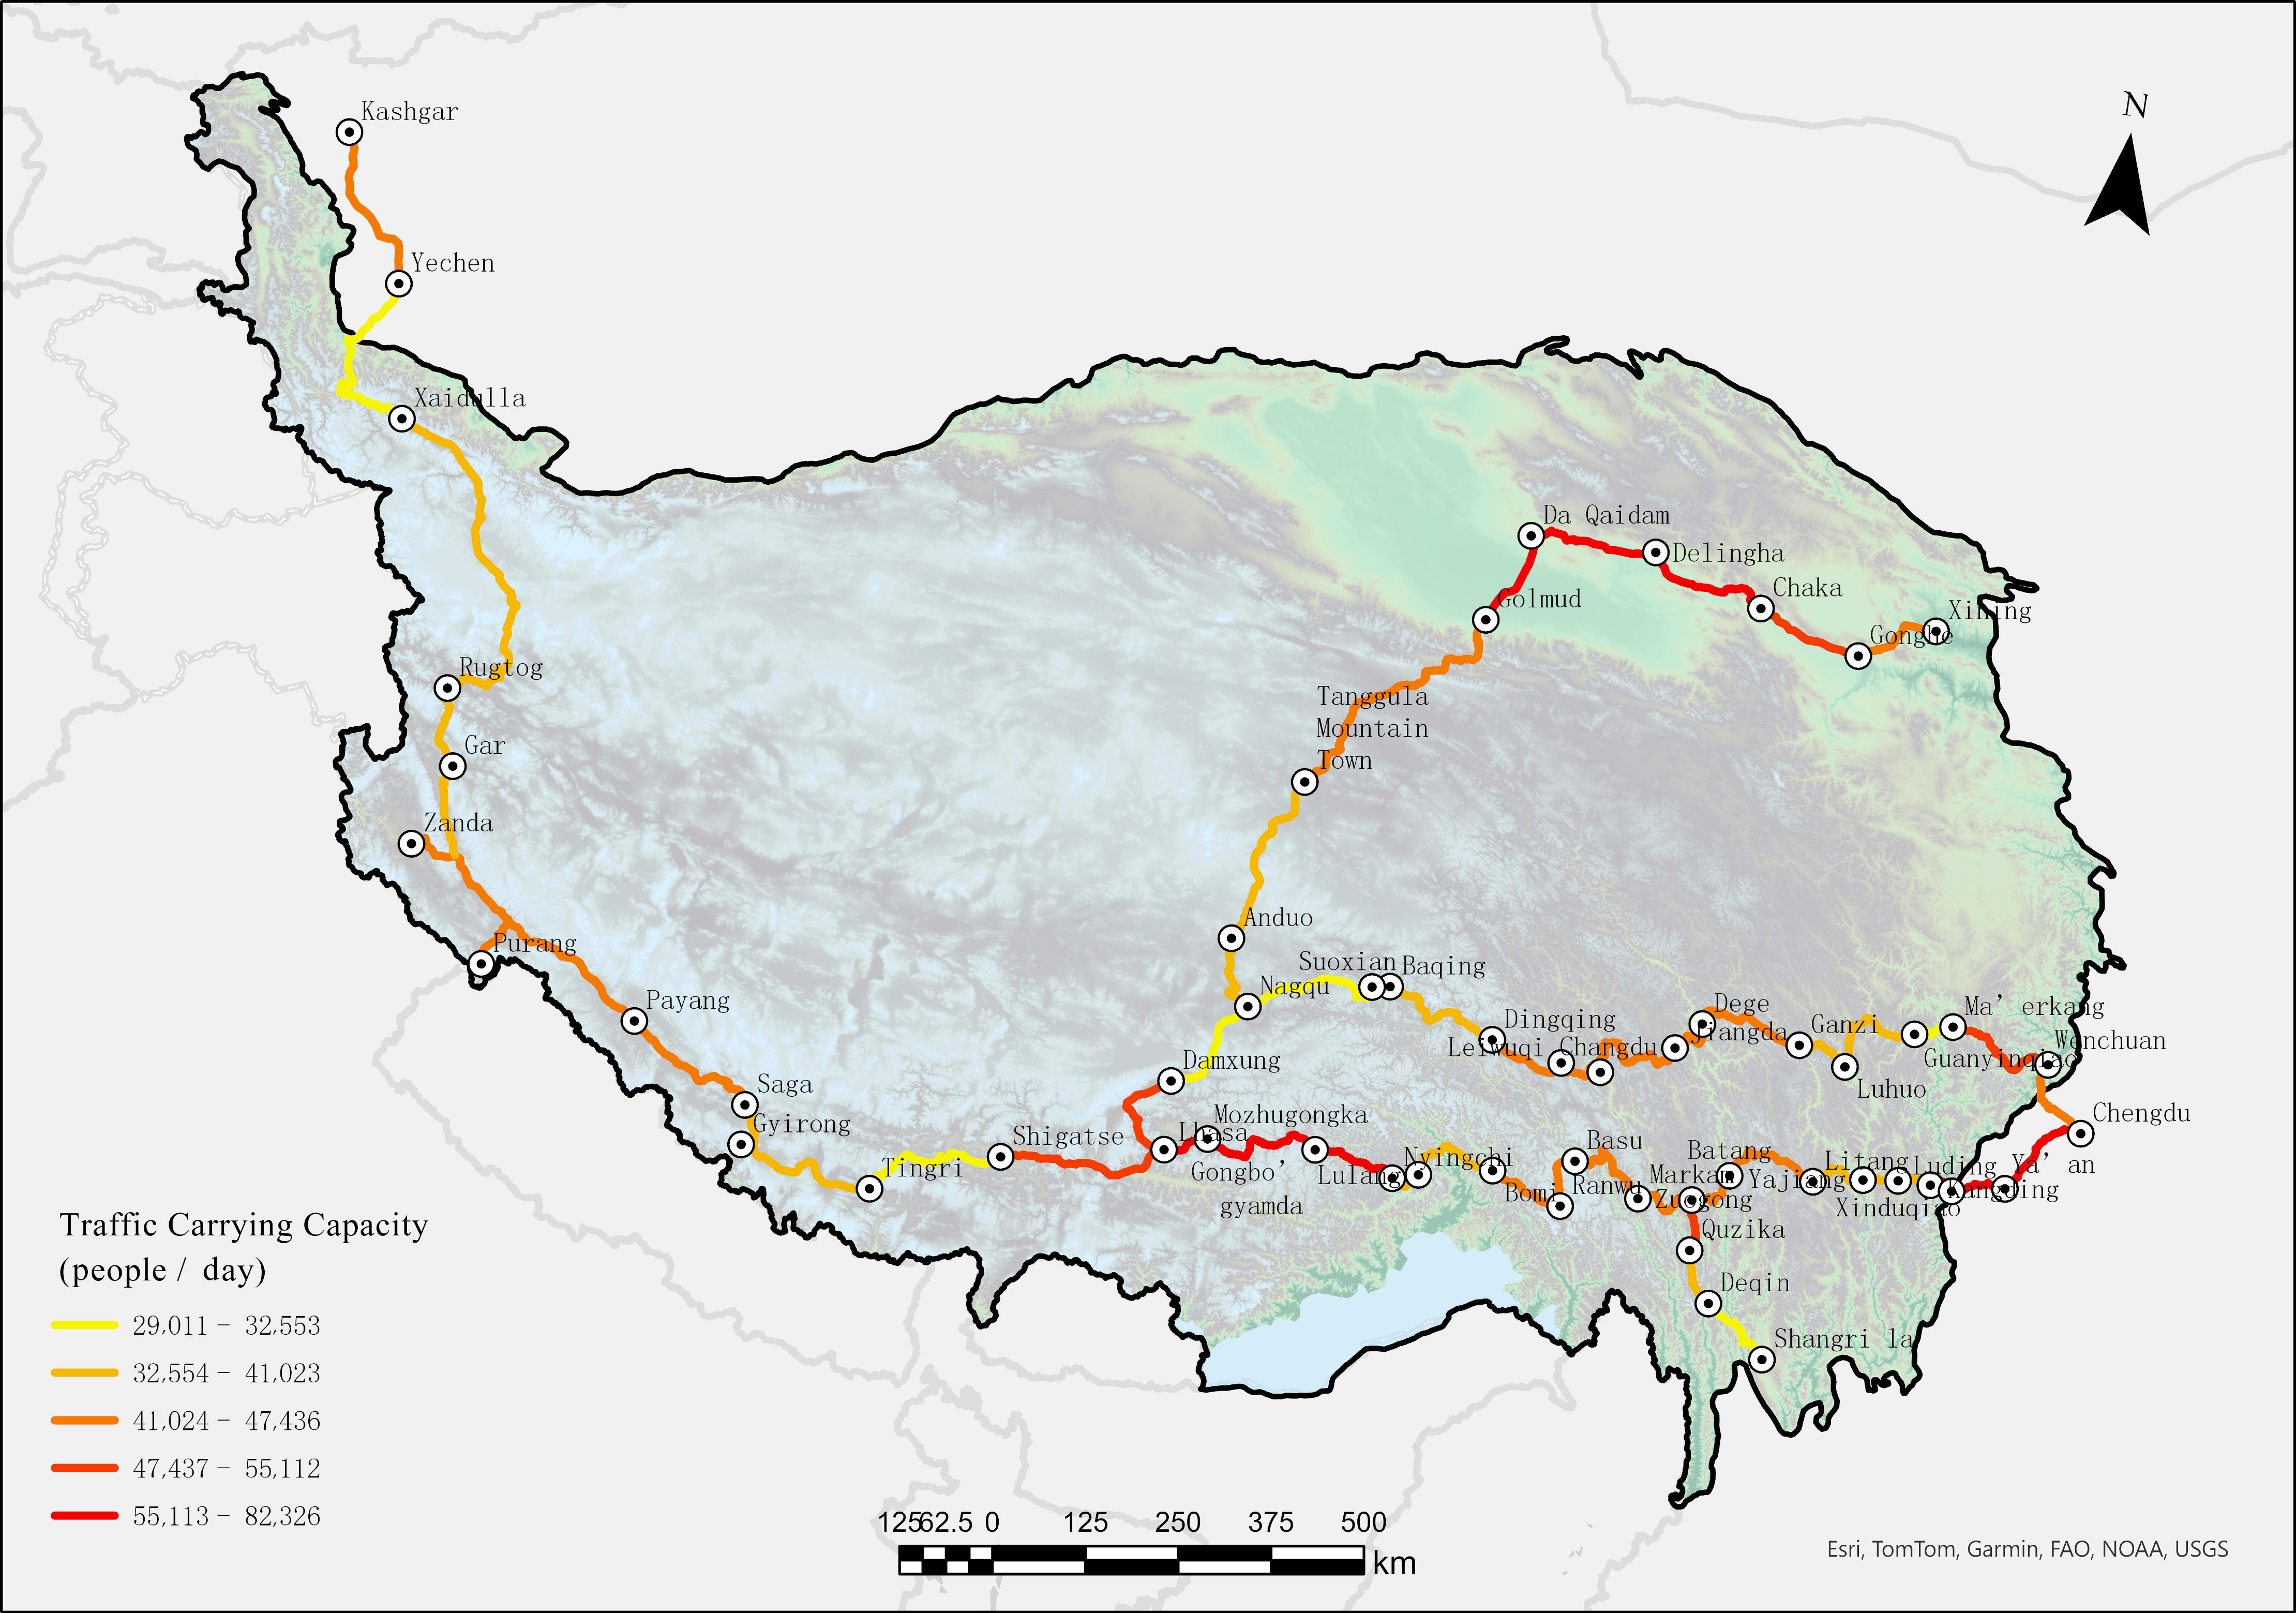
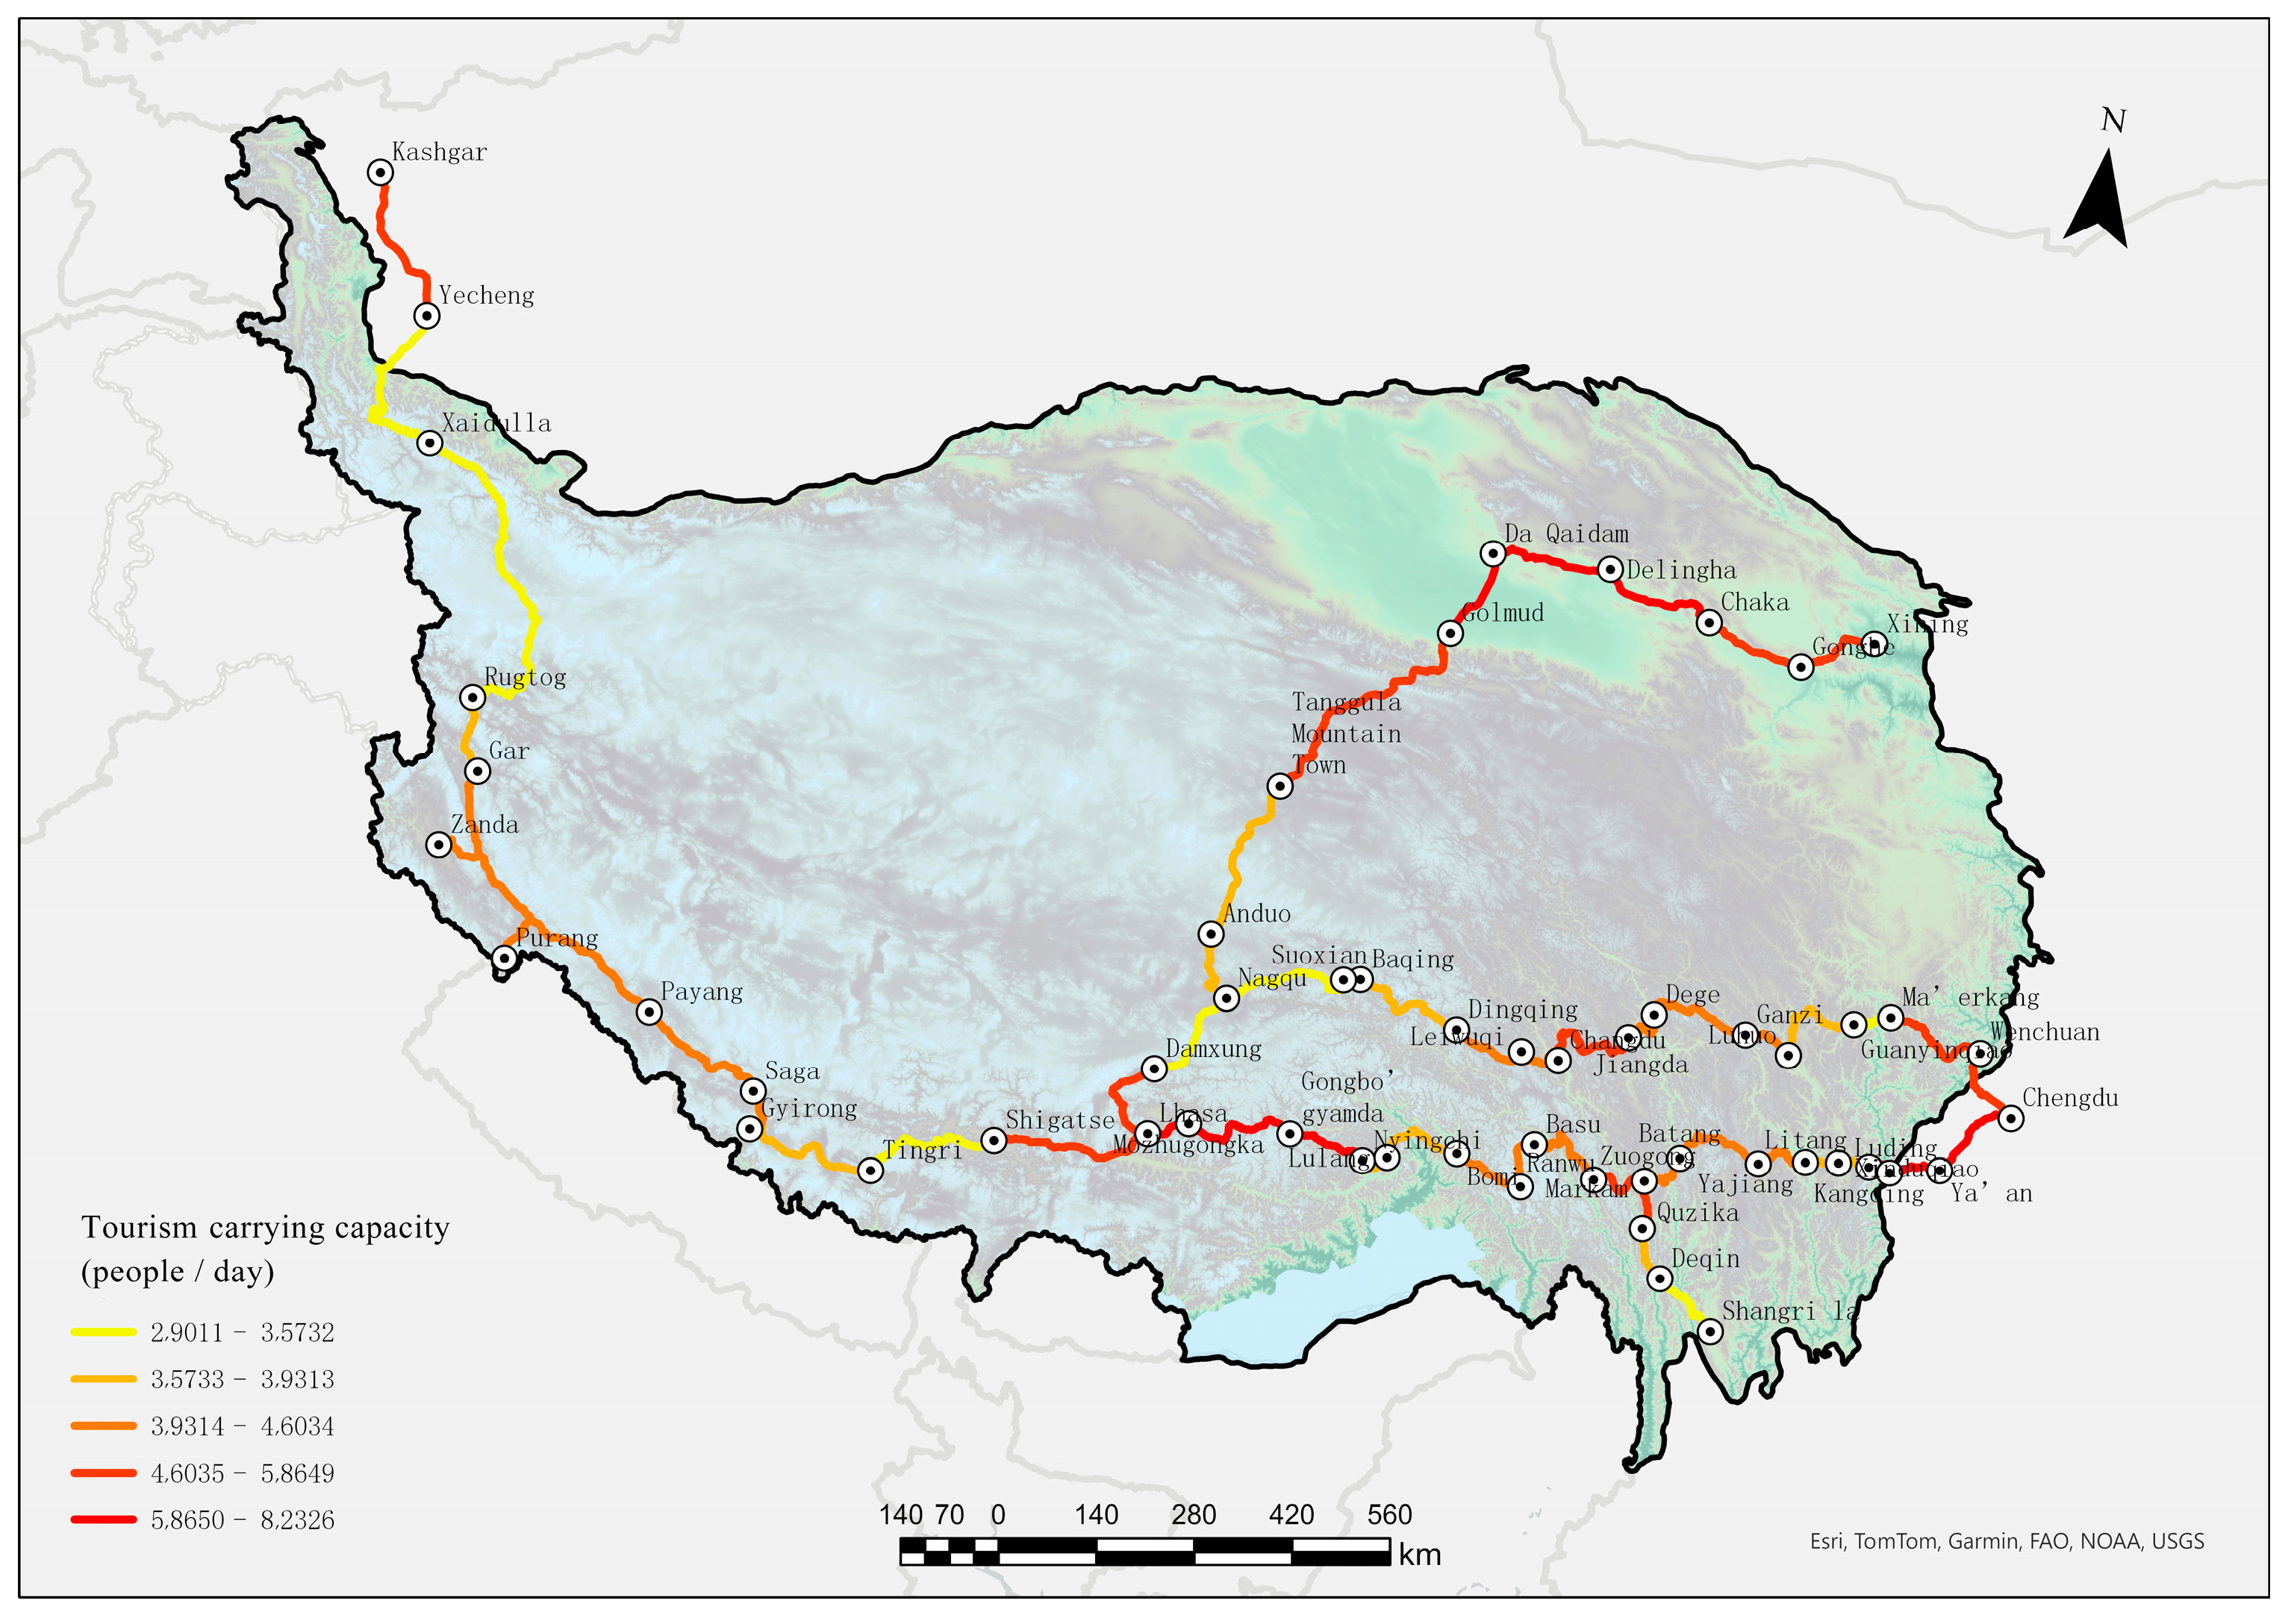
The results are depicted in Scheme 2 and Table 1: (i) The mean value of the traffic environment index across all roads is 0.70, with no significant difference among the mean values of the five tourism corridors. The sections with low values are the Mangkang–Batang section, Lulang–Bomi section, Gonghe–Chaka section, Yajiang–Xinduqiao section, Jiangda–Changdu section, and Zuogong–Markam section. In terms of spatial distribution, the Sichuan–Tibet southern route and Sichuan–Tibet northern route traffic environment index exhibit a trend of “high–low–high”. Conversely, the Yunnan–Tibet route and Qinghai–Tibet route traffic environment index demonstrate a declining trend with an increasing distance from Lhasa, while the Xinjiang–Tibet route exhibits little variation in the traffic environment. Notably, the traffic environments of the Lasha–Ranwu section and the Lasha–Baqing section display significant differences and considerable fluctuations, whereas the traffic environments of other sections change gradually. (ii) From a road infrastructure perspective, in terms of total road resources, the ranking is as follows: the Xinjiang–Tibet route > Qinghai–Tibet route > Sichuan–Tibet northern route > Sichuan–Tibet southern route > Yunnan–Tibet route. This order generally aligns with the length of each corridor. However, in terms of the amount of road resources per kilometer, the order is as follows: the Qinghai–Tibet route > Sichuan–Tibet southern route > Yunnan–Tibet route > Sichuan–Tibet northern route > Xinjiang–Tibet route. This order is largely consistent with the current corridor construction status. (iii) The total of the five tourism corridors is 2,463,600 people/day, and the order of is as follows: the Sichuan–Tibet southern route (841,600 people/day) > Sichuan–Tibet northern route (619,300 people/day) > Yunnan–Tibet route (551,700 people/day) > Qinghai–Tibet route (507,900 people/day) > Xinjiang–Tibet route (459,600 people/day). The sections with higher capacities are the Chaca–Golmud section, Lasha–Nyingchi section, Wenchuan–Malkam section, and Chengdu–Kangding section, while the TCC of the Xinjiang–Tibet route is generally low.
Scheme 2.
Traffic carrying capacity of each section. Own processing in ArcGIS Pro.

Table 1.
, , and f(β,γ,δ……) of each section of the tourism corridor.
6.2. Node Carrying Capacity
The results on the node carrying capacity are depicted in Figure 3 and Scheme 3. (i) From the perspective of node reception facilities, the total number of tourist route nodes along the five tourism corridors is 2,466,600 people/day. Excluding the tourist origins and destinations, the node reception capacity is only 646,500 people/day, among which 25 nodes have a capacity of more than 10,000 people. The values for Chengdu, Xining, Lhasa, and Shangri-La are notably higher than those of other nodes, while the capacities of Xaidulla, Tanggula Mountain Town, Gongbo’gyamda, Mozhugongka, and Leiwuqi are fewer than 2000 people/day. (ii) Regarding the node retention time capacity, the average value is 1.21 days. The high-value nodes include Chengdu, Ya’an, Wenchuan, Xining, and Lhasa, whereas Suoxian, Ando, Baqing, and Xaidulla have a value of 1.00, indicating a lack of recreational activities for tourists around these areas. (iii) From the perspective of , the total value is 1,194,100 people/day, with the Sichuan–Tibet southern route (669,500 people/day) > Sichuan–Tibet northern route (508,000 people/day) > Qinghai–Tibet route (386,500 people/day) > Yunnan–Tibet route (277,800 people/day) > Xinjiang–Tibet route (208,900 people/day). In terms of spatial distribution, the nodes with high values of are mainly distributed along Chengdu–Ganzi, Chengdu–Litang, and Xining–Golmu, while the nodes along the Sichuan–Tibet northern route and the Xinjiang–Tibet route generally have low values.

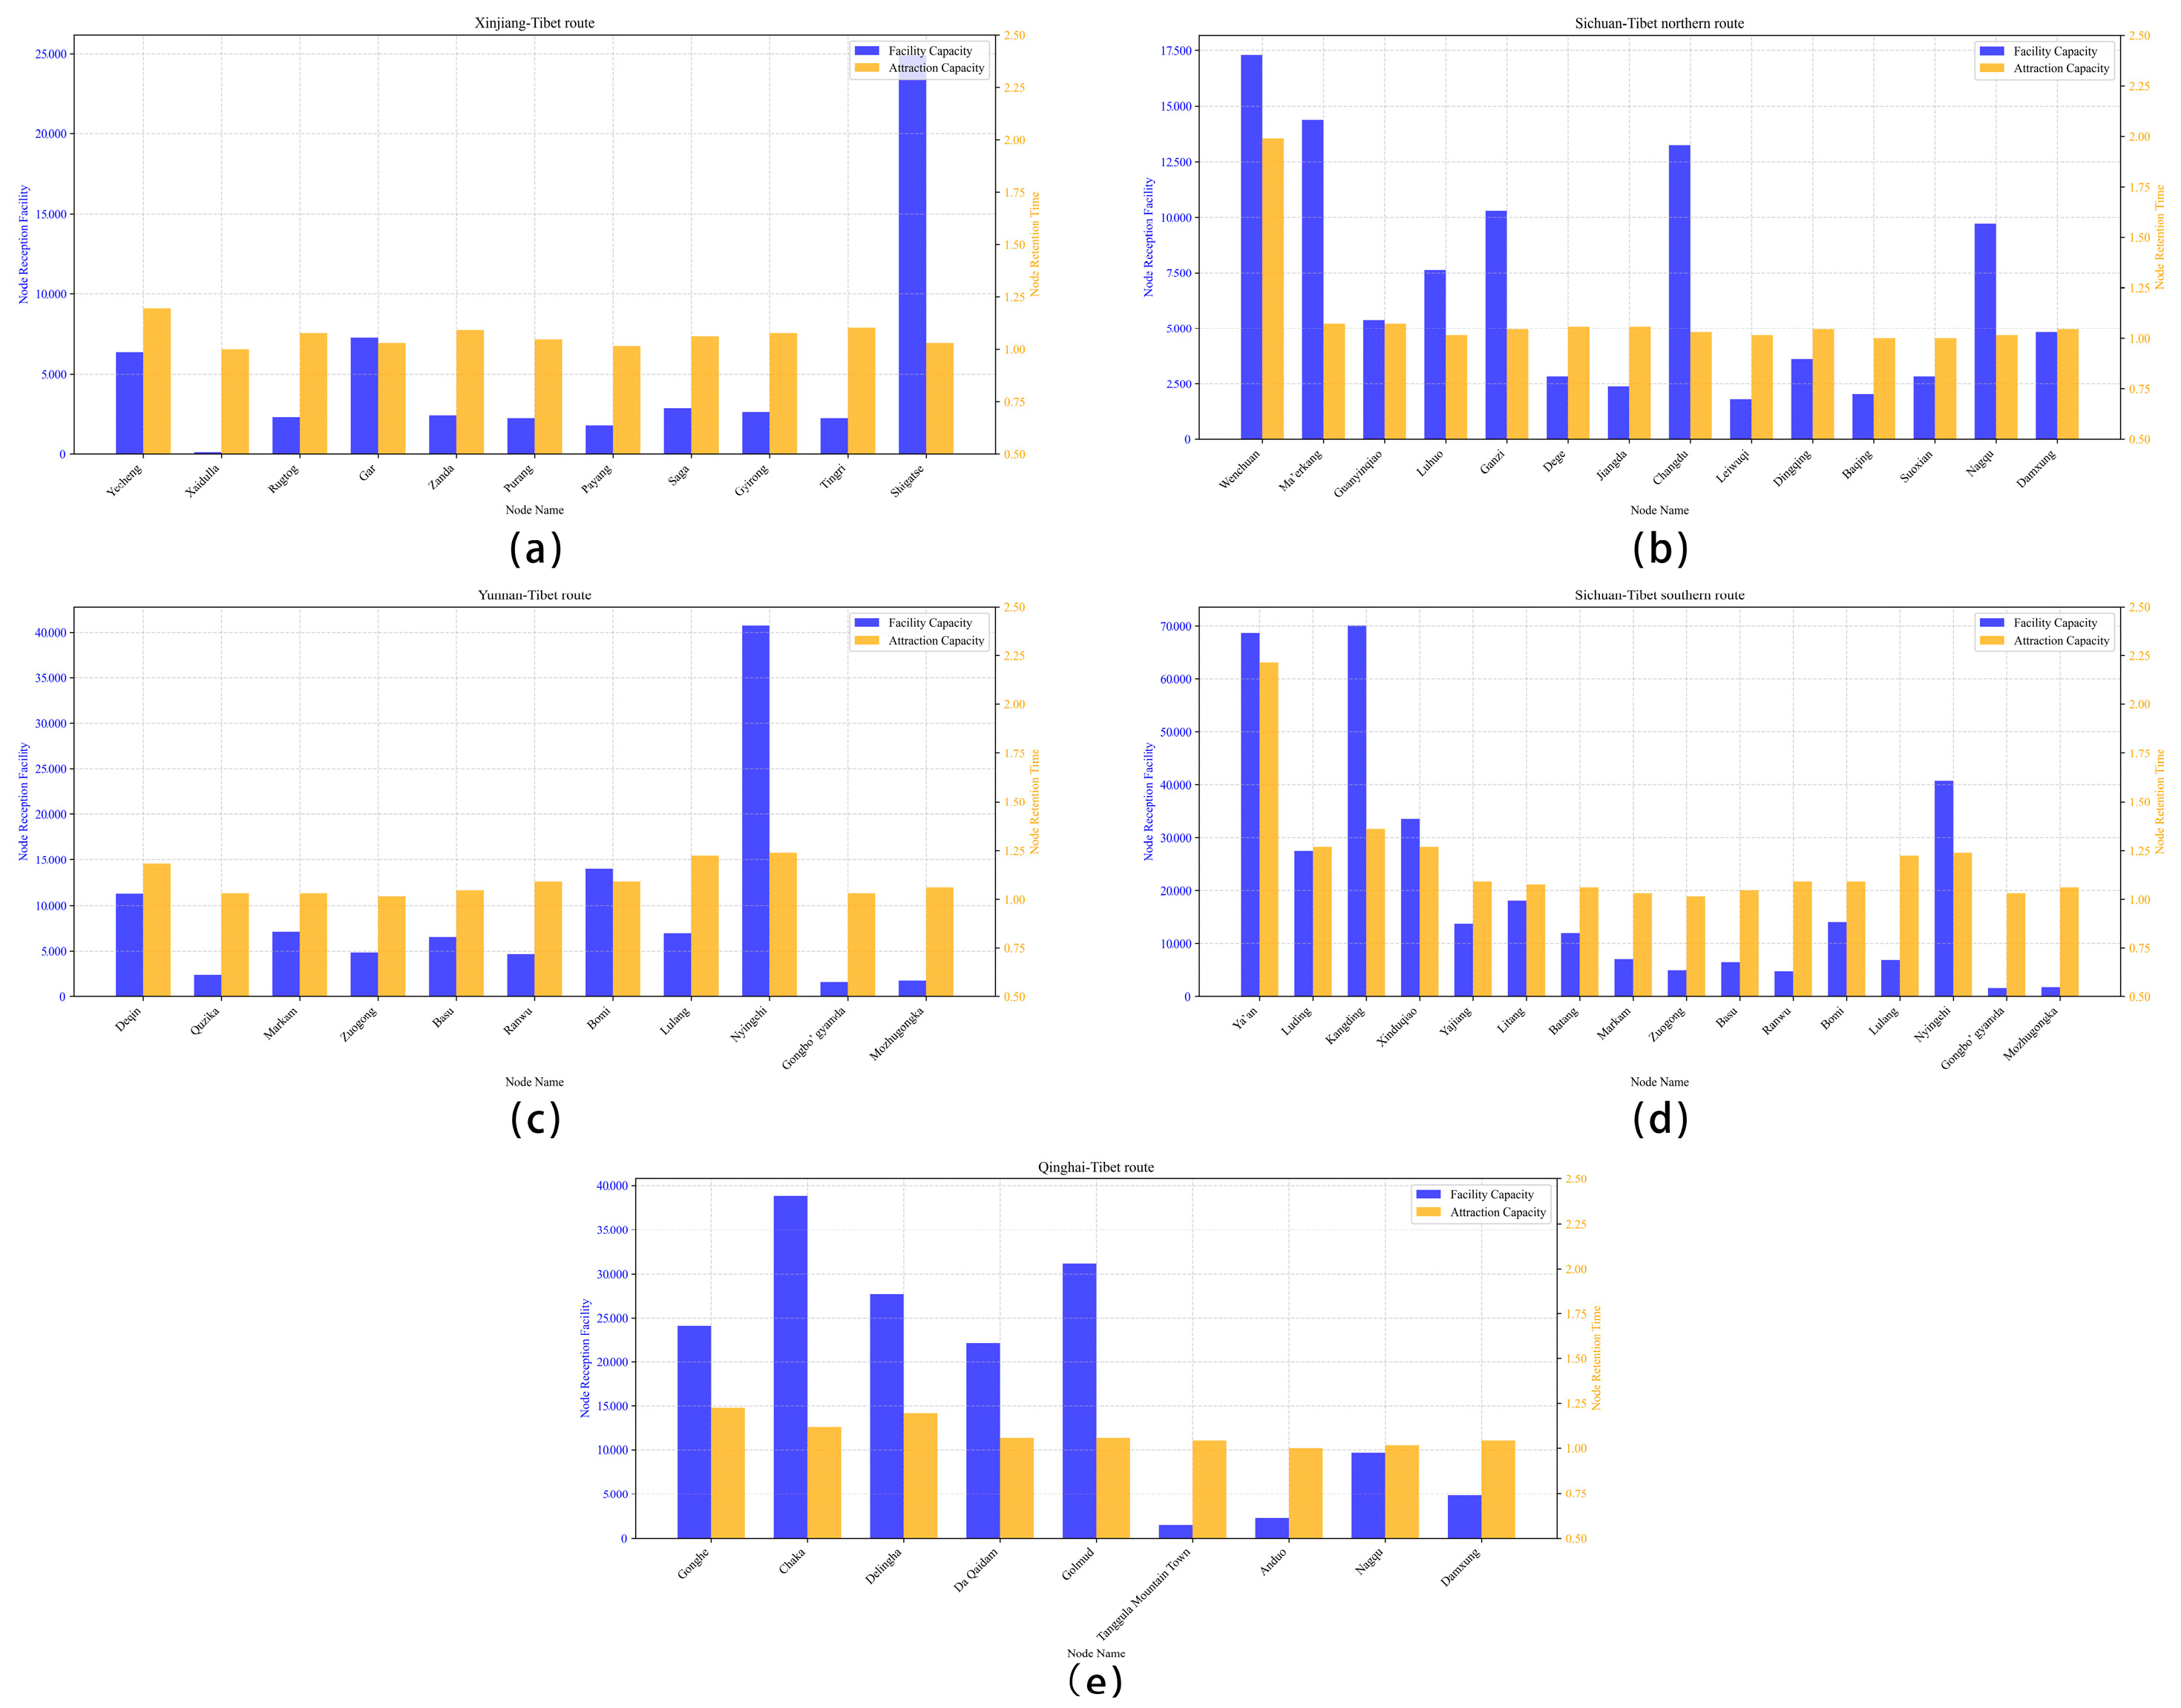
Figure 3.
Tourist route node reception facility and retention time in five tourism corridors. (a) Xinjiang–Tibet route; (b) Sichuan–Tibet northern route; (c) Yunnan–Tibet route; (d) Sichuan–Tibet southern route; (e) Qinghai–Tibet route. Own processing in Python.
Figure 3.
Tourist route node reception facility and retention time in five tourism corridors. (a) Xinjiang–Tibet route; (b) Sichuan–Tibet northern route; (c) Yunnan–Tibet route; (d) Sichuan–Tibet southern route; (e) Qinghai–Tibet route. Own processing in Python.
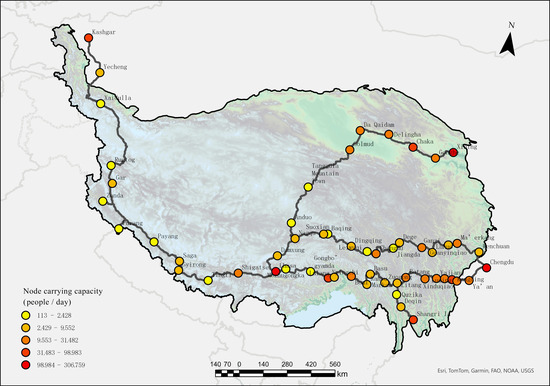
Scheme 3.
Node carrying capacity in the Qinghai–Tibet Plateau. Own processing in ArcGIS Pro.
6.3. Tourism Carrying Capacity
The TCCs of tourism corridors are illustrated in Scheme 4. (i) Overall, the total TCC of the five tourism corridors is 1,782,400 people/day, with the following order: the Sichuan–Tibet southern route (758,800 people/day) > Yunnan–Tibet route (455,500 people/day) > Sichuan–Tibet northern route (449,700 people/day) > Qinghai–Tibet route (423,100 people/day) > Xinjiang–Tibet route (127,900 people/day). (ii) Specifically, the TCCs of all sections of the Sichuan–Tibet southern route and the Yunnan–Tibet route, except for the Basu–Zuogong section, exceed 25,000 people/day. The Sichuan–Tibet northern route shows a trend of “high in the east and low in the west”. The Chengdu–Ganzi section has a high TCC value, and the Ganzi–Nagqu section generally reaches 15,000 to 25,000 people/day. The TCC of the Qinghai–Tibet route varies greatly between the sections. The Xining–Golmu section features a TCC of 45,000 people/day, while the Tanggula Mountain Town–Ando section features a TCC of only 13,000 people/day. The TCC of each section of the Xinjiang–Tibet route is generally fewer than 15,000 people/day, among which the Tingri–Gyirong section, Paryang–Zanda section, and Rutog–Xaidulla section feature values of fewer than 5000 people/day. (iii) According to the National Bureau of Statistics of China, the total number of tourists in the 219 districts and counties of the Qinghai–Tibet Plateau in 2019 was 525,962,400. With 80% of these tourists traveling by self-driving, the average daily tourist reception was 1,152,794 individuals, representing only 64.7% of the tourism carrying capacity. However, considering the extreme climatic conditions of the Qinghai–Tibet Plateau, there is a one-third tourism off-season each year. Excluding this period, the average daily reception volume increases to 1,729,428, which aligns closely with the assessed tourism carrying capacity.
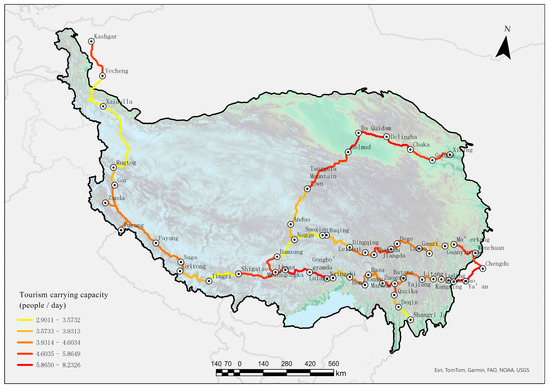
Scheme 4.
TCC in Qinghai–Tibet Plateau. Own processing in ArcGIS Pro.
6.4. Road Traffic and Node Facility Sensitivity Index
The road traffic sensitivity trend is described as follows (see Figure 4): (i) Each section of the five tourism corridors from Lhasa roughly exhibits a trend of “sensitive outbound from Tibet—insensitive in both directions—sensitive inbound to Tibet—sensitive in both directions”. Two-way insensitive sections of the Xinjiang–Tibet route account for 69.23%, indicating a surplus of traffic road resources. (ii) According to the road traffic sensitivity index, the ranking of sensitivity is as follows: the Sichuan–Tibet southern route (0.89, high sensitivity) > Yunnan–Tibet route (0.81, high sensitivity) = Qinghai–Tibet route (0.81, high sensitivity) > Sichuan–Tibet northern route (0.73, moderate sensitivity) > Xinjiang–Tibet route (0.30, low sensitivity). This distribution includes 29 highly sensitive sections, 18 medium-sensitivity sections, and 19 low-sensitivity sections.
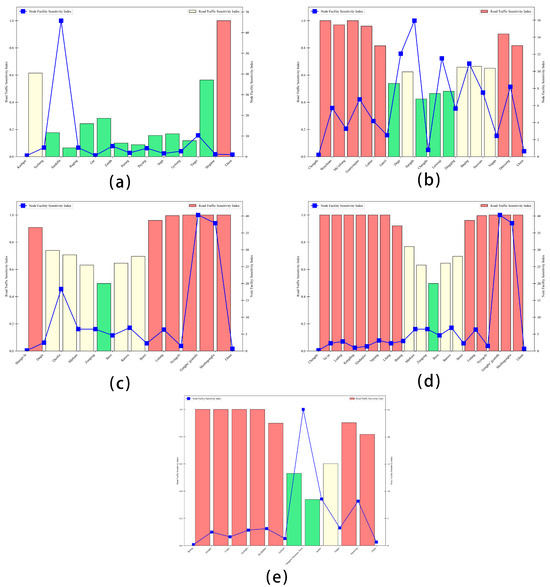
Figure 4.
Road traffic sensitivity and node facility sensitivity of each route. (a) Xinjiang–Tibet route; (b) Sichuan–Tibet northern route; (c) Yunnan–Tibet route; (d) Sichuan–Tibet southern route; (e) Qinghai–Tibet route. The bars in red are high-sensitivity sections, in yellow are moderate-sensitivity sections, and in green are low-sensitivity sections. Own processing in Python.
The node facility sensitivity trend is described as follows: (i) The mean values of node facility sensitivity across the five tourism corridors are ordered as follows: the Yunnan–Tibet route (10.34) > Sichuan–Tibet southern route (7.19) > Xinjiang–Tibet route (7.94) > Sichuan–Tibet northern route (6.19) > Qinghai–Tibet route (5.21). (ii) The sensitivity distribution of nodes varies among the tourism corridors, with all nodes along the Xinjiang–Tibet route except for Xaidulla and Tingri County exhibiting a low-sensitivity state. The nodes in the Xining–Golmud section of the Qinghai–Tibet route exhibit low sensitivity, while the towns in the Tanggula Mountain Town–Lhasa section demonstrate high sensitivity. Along the Sichuan–Tibet northern route, the sensitivity of nodes fluctuates greatly, with high-value towns and low-value towns alternately distributed. In the Sichuan–Tibet southern route, the sensitivity of the Chengdu–Batang section is low, while the Zuogong–Lhasa section generally presents high sensitivity. The sensitivity of the Yunnan–Tibet route is generally high, with Mozugongka, Gongbujiangda, and Quzika being significantly more sensitive than other towns. This indicates that when surrounding roads experience overload, these nodes may struggle to absorb the passenger flow released by neighboring nodes, leading to overloaded tourism facilities.
7. Conclusions
From the perspective of the space of flows, according to the fundamental characteristics of self-driving tour activities and the theoretical frameworks of space–time consumption and LP modeling in operations research, we developed a TCC evaluation model for tourism corridors suitable for evaluation at the inter-provincial scale. Additionally, we establish methods to measure the sensitivity of each element of tourism corridors. The methods were applied for the empirical study of the Qinghai–Tibet Plateau tourism corridor, and the results showed the following:
- (i)
- The of the tourism corridor on the Qinghai–Tibet Plateau amounts to 2,463,600 people/day. Regarding the self-driving tour environment, sections with higher scores are concentrated around Lhasa and Chengdu, while those with poorer conditions include the Markam–Batang, Lulang–Bomi, Gonghe–Chaka, Yajiang–Xinduqiao, Jiangda–Changdu, and Zuogong–Markam sections. In terms of road infrastructure, the Sichuan–Tibet southern route and the Qinghai–Tibet route feature the highest density of road resources per kilometer on average, while the Sichuan–Tibet northern route and Xinjiang–Tibet route feature the lowest road resource density.
- (ii)
- The on the Qinghai–Tibet Plateau is 1,194,100 people/day. The total node reception capacity along the five corridors is 2,466,600 people/day, with an average retention time of 1.21 days.
- (iii)
- The TCC of the Qinghai–Tibet Plateau is 1,782,400 people/day. The Xining–Golmud section of the Qinghai–Tibet route exceeds 45,000 people/day, while each section of the Xinjiang–Tibet route generally falls below 15,000 people/day.
- (iv)
- When the tourism corridors are fully loaded, the five tourism corridors from Lhasa exhibit a pattern of “sensitive outbound from Tibet—insensitive in both directions—sensitive inbound to Tibet—sensitive in both directions”. The road traffic sensitivity index ranks as follows: the Sichuan–Tibet southern route (0.89, high sensitivity) > Yunnan–Tibet route (0.81, high sensitivity) = Qinghai–Tibet route (0.81, high sensitivity) > Sichuan–Tibet northern route (0.73, moderate sensitivity) > Xinjiang–Tibet route (0.30, low sensitivity). The sensitivity index ranking of node towns across the five tourism corridors is as follows: the Yunnan–Tibet route (10.34) > Sichuan–Tibet southern route (7.19) > Xinjiang–Tibet route (7.94) > Sichuan–Tibet northern route (6.19) > Qinghai–Tibet route (5.21).
8. Discussion
The regional carrying capacity is a critical subject in the field of sustainable development. Classical economic theory classifies human society into hunting, nomadic, agricultural, and commercial stages. At each stage of development, the sustainability of the socio-economic system hinges on the alignment of governmental structures, institutions, and policies with the prevailing supply–demand dynamic [44]. Particularly when society reaches a “static state”, characterized by long-term economic equilibrium, it is imperative to prioritize the optimization of spatial resources and the enhancement of quality of life, matching the description of sustainable cities and communities in SDG 11 [45]. Thus, evaluating the carrying capacity of regional human activities offers not only an assessment of the supply–demand relationships posited by classical economics but also constitutes a fundamental basis for addressing the human demand for a high-quality life, specifically in terms of “recreational demand”.
From the perspective of the tourism area life cycle theory, a tourist destination will experience four stages, of exploration, start-up, development, and stabilization, in which the match between tourism activity intensity and tourism infrastructure determines the recovery or decline of the tourist destination in the future [46]. Therefore, exploring the TCC is key to realizing the sustainable development of regional tourism.
With the emergence of mass tourism [47,48] and the self-driving tour [49], the planning and construction of tourism corridors have become crucial strategic measures for national and local tourism development. These initiatives are also reshaping the spatial patterns of tourism on both national and local scales. Different from traditional tourist attractions, tourism corridors leverage established transportation infrastructure as the backbone to connect towns, villages, and tourist destinations along the route. This represents a significant shift from the conventional role of roads solely for “tourism transportation” to offering linear tourism products and services under the concept of “transportation tourism”. Based on the attributes of traffic passing through and the recreational features of roads, the focus of ascertaining the traffic carrying capacity shifts toward addressing the challenge associated with constructing major tourism destinations, which may impact the overall tourism experience if achieved. Especially in the era of the self-driving tour, the rhythmic nature of tourism activities, stemming from significant differences between off-season and peak seasons due to holiday scheduling, poses numerous challenges in regard to tourism corridor construction. Optimizing the tourism corridor layout and addressing deficiencies in the transportation infrastructure and urban tourism reception capabilities require prioritizing the TCC as a crucial evaluation criterion.
In this study, we selected the TCCs of five significant tourism corridors on the Qinghai–Tibet Plateau as the research focuses, primarily for the following reasons: First, in accordance with the national main functional zone planning and territorial spatial planning, numerous fragile and ecologically sensitive areas with considerable tourism appeal on the Qinghai–Tibet Plateau have been protected by strict ecological red lines [50]. Some tourism activities may impact the ecological environment and the scenic spots, such as Nianbao Yuze and Qinghai Lake Bird Island, which are essentially closed for ecological restoration. Second, transportation tourism has emerged as the predominant form of tourism on the Qinghai–Tibet Plateau. Notably, National Roads 318 and 219 have evolved into China’s most frequented tourism corridors, with tourism activities confined strictly to their vicinity, thereby limiting the ecological impact of tourism activities on the broader Qinghai–Tibet Plateau. Managing transportation tourism in such a highly sensitive area has emerged as a significant challenge in developing tourism destinations on the Qinghai–Tibet Plateau. The uptake of self-driving tours on the plateau exhibits pronounced seasonal patterns, primarily peaking from July to September. This seasonal influx often leads to localized or widespread overload during peak tourism periods and specific regional characteristics. The findings of this study also demonstrate that important tourism corridors are currently facing a significant mismatch between the tourism traffic capacity and urban tourism reception capacity. This mismatch leads to the “uneven drought and flood” phenomenon, characterized by overloading at both ends and underutilization in the middle section of the tourism corridor during peak seasons. In this context, optimizing the spread of urban tourism reception facilities may effectively improve the traffic carrying capacity of these tourism corridors and ensure the efficient utilization of all resources under high-intensity tourism flows.
This study addressed a research gap by constructing an evaluation model for the TCC of tourism corridors based on flow space theory. We took into account the basic behavioral pattern of self-driving tour activities on the Qinghai–Tibet Plateau, characterized by “travel” during the day and “rest” at night, within the context of the region’s high-altitude natural environment. Our research findings scientifically and objectively reflect the current status of the tourism corridor capacity on the Qinghai–Tibet Plateau.
Currently, there is a notable lack of research assessing the tourism carrying capacities (TCCs) of tourism corridors, indicating significant room for improvement in both model construction mechanisms and relevant parameter settings. The TCC is a comprehensive concept that encompasses not only the social and economic dimensions of a region but also the ecological carrying capacity of the tourist destination concerning tourism activities. However, given the unique organizational mode of tourism on the Qinghai–Tibet Plateau, where tourism activities are strictly confined to the vicinity of the tourism corridors, the environmental impact on the broader region was not addressed here, with this study excluding the environmental carrying capacity from its assessment scope. In the future, when this research method is applied to a wider range of study areas, it must be further optimized according to the local conditions.
Author Contributions
Conceptualization, S.Y. and J.X.; Software, S.Y. and Z.L.; Validation, S.Y.; Formal analysis, Z.L.; Data curation, S.Y. and Z.L.; Writing—original draft, S.Y.; Writing—review & editing, J.X.; Visualization, S.Y.; Supervision, S.Y. and Z.L.; Project administration, S.Y.; Funding acquisition, J.X. All authors have read and agreed to the published version of the manuscript.
Funding
This study was supported by the Second Comprehensive Scientific Investigation and Study on the Qinghai-Tibet Plateau, grant number 2019QZKK1004.
Institutional Review Board Statement
The study did not require ethical approval.
Informed Consent Statement
Not applicable.
Data Availability Statement
Data is contained within the article.
Conflicts of Interest
The authors declare no conflict of interest.
References
- He, H.; Shen, L.; Wong, S.W.; Cheng, G.; Shu, T. A “load-carrier” perspective approach for assessing tourism resource carrying capacity. Tour. Manag. 2023, 94, 104651. [Google Scholar] [CrossRef]
- Du Cros, H.; Kong, W.H. Congestion, popular world heritage tourist attractions and tourism stakeholder responses in Macao. Int. J. Tour. Cities 2020, 6, 929–951. [Google Scholar] [CrossRef]
- WTO. Saturation of Tourist Destinations: Report of the Secretary General (Madrid); WTO: Geneva, Switzerland, 1981. [Google Scholar]
- Sousa, R.C.D.; Pereira, L.C.C.; Costa, R.M.D.; Jiménez, J.A. Management of estuarine beaches on the Amazon coast though the application of recreational carrying capacity indices. Tour. Manag. 2017, 59, 216–225. [Google Scholar] [CrossRef]
- Fernández-Villarán, A.; Espinosa, N.; Abad, M.; Goytia, A. Model for measuring carrying capacity in inhabited tourism destinations. Port. Econ. J. 2020, 19, 213–241. [Google Scholar] [CrossRef]
- Shi, L.; Zhao, H.; Li, Y.; Ma, H.; Yang, S.; Wang, H. Evaluation of Shangri-La County’s tourism resources and ecotourism carrying capacity. Int. J. Sustain. Dev. World Ecol. 2014, 22, 103–109. [Google Scholar] [CrossRef]
- Saveriades, A. Establishing the social tourism carrying capacity for the tourist resorts of the east coast of the Republic of Cyprus. Tour. Manag. 2000, 21, 147–156. [Google Scholar] [CrossRef]
- Mansfeld, Y.; Jonas, A. Evaluating the socio-cultural carrying capacity of rural tourism communities: A ‘value stretch’ approach. Tijdschr. Voor Econ. En Soc. Geogr. 2006, 97, 583–601. [Google Scholar] [CrossRef]
- Eby, D.W.; Molnar, L.J. Importance of scenic byways in route choice: A survey of driving tourists in the United States. Transp. Res. Part A 2000, 36, 95–106. [Google Scholar] [CrossRef]
- Zube, E.H. Greenways and the US National Park System. Landsc. Urban Plan. 1995, 33, 17–25. [Google Scholar] [CrossRef]
- Ruiz, R.; Rodríguez, J.; Coronado, J.M. Modern roads as UNESCO World Heritage sites: Framework and proposals. Int. J. Herit. Stud. 2017, 23, 362–374. [Google Scholar] [CrossRef]
- Kelley, W.J. National Scenic Byways—Diversity contributes to success. Transp. Res. Rec. J. Transp. Res. Board 2004, 1880, 174–180. [Google Scholar] [CrossRef]
- Hu, L.; Xu, J.; Bao, C.; Pei, T. Influential Factor Detection for Tourism on the Qinghai-Tibet Plateau Based on Social Media Data. ISPRS Int. J. Geo-Inf. 2021, 10, 579. [Google Scholar] [CrossRef]
- Yang, L.; Sun, J.; Liu, M.C.; Min, Q.W. Agricultural production under rural tourism on the Qinghai-Tibet Plateau: From the perspective of smallholder farmers. Land Use Policy 2021, 103, 105329. [Google Scholar] [CrossRef]
- Ye, S.; Xi, J. Identification and evaluation of tourism corridor: A case study of Qinghai-Tibet Plateau. Acta Geogr. Sin. 2023, 78, 2630–2644. [Google Scholar] [CrossRef]
- Wang, D.C.; Wang, K.J.; Wang, Z.H.; Fan, H.K.; Chai, H.; Wang, H.Y.; Long, H.; Gao, J.S.; Xu, J.C. Spatial-Temporal Evolution and Influencing Mechanism of Traffic Dominance in Qinghai-Tibet Plateau. Sustainability 2022, 14, 11031. [Google Scholar] [CrossRef]
- Rios-Jara, E.; Galvan-Villa, C.M.; Rodriguez-Zaragoza, F.A.; Lopez-Uriarte, E.; Munoz-Fernandez, V.T. The tourism carrying capacity of underwater trails in Isabel Island National Park, Mexico. Environ. Manag. 2013, 52, 335–347. [Google Scholar] [CrossRef]
- Wang, J.; Huang, X.; Gong, Z.; Cao, K. Dynamic assessment of tourism carrying capacity and its impacts on tourism economic growth in urban tourism destinations in China. J. Destin. Mark. Manag. 2020, 15, 100383. [Google Scholar] [CrossRef]
- Tang, C.; Zheng, Q.; Ng, P. A Study on the Coordinative Green Development of Tourist Experience and Commercialization of Tourism at Cultural Heritage Sites. Sustainability 2019, 11, 4732. [Google Scholar] [CrossRef]
- Tan, Q. Research on sustainable carrying capacity of urban tourism environment based on multi objective optimization algorithm. Results Eng. 2023, 19, 101344. [Google Scholar] [CrossRef]
- Zhou, Y. Prediction of tourist carrying capacity of scenic spots based on Neural Network. Procedia Comput. Sci. 2023, 228, 798–807. [Google Scholar] [CrossRef]
- Zhang, Y.; Yang, H.; Wang, G. Monitoring and management of high-end tourism in protected areas based on 3D sensor image collection. Displays 2021, 70, 102089. [Google Scholar] [CrossRef]
- Jurado, E.N.; Tejada, M.T.; García, F.A.; González, J.C.; Macías, R.C.; Peña, J.D.; Gutiérrez, F.F.; Fernández, G.G.; Gallego, M.L.; García, G.M.; et al. Carrying capacity assessment for tourist destinations. Methodology for the creation of synthetic indicators applied in a coastal area. Tour. Manag. 2012, 33, 1337–1346. [Google Scholar] [CrossRef]
- Wu, M.Y.; Pearce, P.L.; Li, Q.C. Chinese behind the wheel: Factors affecting their satisfaction with international self-drive holidays. J. Destin. Mark. Manag. 2018, 9, 12–19. [Google Scholar] [CrossRef]
- Wang, X.X.; Fu, H.; Lu, J.F.; Han, S. Study on road section environmental traffic capacity model and algorithm under double constraints. Transp. Res. Part D—Transp. Environ. 2016, 48, 14–19. [Google Scholar] [CrossRef]
- Zelenka, J.; Kacetl, J. The Concept of Carrying Capacity in Tourism. Amfiteatru Econ. 2014, 16, 641–654. [Google Scholar]
- Wu, X.B.; Guan, H.Z.; Han, Y.; Ma, J.Q. A tour route planning model for tourism experience utility maximization. Adv. Mech. Eng. 2017, 9, 1687814017732309. [Google Scholar] [CrossRef]
- Leiper, N. The framework of tourism: Towards a definition of tourism, tourist, and the tourist industry. Ann. Tour. Res. 1979, 6, 390–407. [Google Scholar] [CrossRef]
- Castells, M. Grassrooting the space of flows. Urban Geogr. 1999, 20, 294–302. [Google Scholar] [CrossRef]
- Gao, Y.; Qu, Z.; Song, X.; Yun, Z. Modeling of urban road network traffic carrying capacity based on equivalent traffic flow. Simul. Model. Pract. Theory 2022, 115, 102462. [Google Scholar] [CrossRef]
- Denstadli, J.M.; Jacobsen, J.K.S. The long and winding roads: Perceived quality of scenic tourism routes. Tour. Manag. 2011, 32, 780–789. [Google Scholar] [CrossRef]
- Li, G.L.; Zhang, Y.; Wang, Y.Q.; Wang, Y.H.; Tian, J. Evaluation and analysis of tourism resources and environmental carrying capacity (TRECC) of 278 cities in China: A pressure-support perspective. J. Clean. Prod. 2023, 420, 138359. [Google Scholar] [CrossRef]
- Adongo, C.A.; Badu-Baiden, F.; Boakye, K.A.A. The tourism experience-led length of stay hypothesis. J. Outdoor Recreat. Tour.—Res. Plan. Manag. 2017, 18, 65–74. [Google Scholar] [CrossRef]
- Martínez-Garcia, E.; Raya, J.M. Length of stay for low-cost tourism. Tour. Manag. 2008, 29, 1064–1075. [Google Scholar] [CrossRef]
- Reich, D. A linear programming approach for linear programs with probabilistic constraints. Eur. J. Oper. Res. 2013, 230, 487–494. [Google Scholar] [CrossRef]
- Angelelli, E.; Morandi, V.; Savelsbergh, M.; Speranza, M.G. System optimal routing of traffic flows with user constraints using linear programming. Eur. J. Oper. Res. 2021, 293, 863–879. [Google Scholar] [CrossRef]
- Coll, P.; Factorovich, P.; Loiseau, I.; Gómez, R. A linear programming approach for adaptive synchronization of traffic signals. Int. Trans. Oper. Res. 2013, 20, 667–679. [Google Scholar] [CrossRef]
- Watkinson, A.R.; Sutherland, W.J. Sources, Sinks and Pseudo-Sinks [Note]. J. Anim. Ecol. 1995, 64, 126–130. [Google Scholar] [CrossRef]
- Fu, S.J.; Zhang, X.X.; Kuang, W.H.; Guo, C.Q. Characteristics of Changes in Urban Land Use and Efficiency Evaluation in the Qinghai-Tibet Plateau from 1990 to 2020. Land 2022, 11, 757. [Google Scholar] [CrossRef]
- Gao, X.C.; Li, T.; Cao, X.S. Spatial Fairness and Changes in Transport Infrastructure in the Qinghai-Tibet Plateau Area from 1976 to 2016. Sustainability 2019, 11, 589. [Google Scholar] [CrossRef]
- Schweitzer, N.; Apter, Y.; Ben-David, G.; Liebermann, D.G.; Parush, A. A field study on braking responses during driving. II. Minimum driver braking times. Ergonomics 1995, 38, 1903–1910. [Google Scholar] [CrossRef]
- Hoffmann, E.R. Accelerator-to-brake movement times. Ergonomics 1991, 34, 277–287. [Google Scholar] [CrossRef]
- Liu, Y.; Zhang, Y.; Nie, L. Patterns of self-drive tourists: The case of Nanning City, China. Tour. Manag. 2012, 33, 225–227. [Google Scholar] [CrossRef]
- Manioudis, M.; Meramveliotakis, G. Broad strokes towards a grand theory in the analysis of sustainable development: A return to the classical political economy. New Political Econ. 2022, 27, 866–878. [Google Scholar] [CrossRef]
- Meramveliotakis, G.; Manioudis, M. History, Knowledge, and Sustainable Economic Development: The Contribution of John Stuart Mill’s Grand Stage Theory. Sustainability 2021, 13, 1468. [Google Scholar] [CrossRef]
- Butler, R. Tourism destination development: The tourism area life cycle model. Tour. Geogr. 2024, 1–9. [Google Scholar] [CrossRef]
- Vainikka, V. Rethinking Mass Tourism. Tour. Stud. 2013, 13, 268–286. [Google Scholar] [CrossRef]
- Xu, H.G.; Zhu, D.; Bao, J.G. Sustainability and nature-based mass tourism: Lessons from China’s approach to the Huangshan Scenic Park. J. Sustain. Tour. 2016, 24, 182–202. [Google Scholar] [CrossRef]
- Zhou, Y.; Huang, X.J. Aspects of Lifestyle Change in China: Motivations for Self-Drive Travel—A Chinese Domestic Market Perspective. J. Travel Tour. Mark. 2016, 33, 912–928. [Google Scholar] [CrossRef]
- Hu, T.; Peng, J.; Liu, Y.X.; Wu, J.S.; Li, W.F.; Zhou, B.B. Evidence of green space sparing to ecosystem service improvement in urban regions: A case study of China’s Ecological Red Line policy. J. Clean. Prod. 2020, 251, 119678. [Google Scholar] [CrossRef]


Disclaimer/Publisher’s Note: The statements, opinions and data contained in all publications are solely those of the individual author(s) and contributor(s) and not of MDPI and/or the editor(s). MDPI and/or the editor(s) disclaim responsibility for any injury to people or property resulting from any ideas, methods, instructions or products referred to in the content. |
© 2024 by the authors. Licensee MDPI, Basel, Switzerland. This article is an open access article distributed under the terms and conditions of the Creative Commons Attribution (CC BY) license (https://creativecommons.org/licenses/by/4.0/).