Article

The Effect of Fuel Quality on Cavitation Phenomena in Common-Rail Diesel Injector—A Numerical Study

by
Luka Kevorkijan
1,
Ignacijo Biluš
1,
Eloisa Torres-Jiménez
2 and
Luka Lešnik
1,*
1
Faculty of Mechanical Engineering Maribor, University of Maribor, 2000 Maribor, Slovenia
2
Department of Mechanical and Mining Engineering, University of Jaén, Campus las Lagunillas, s/n, 23071 Jaén, Spain
*
Author to whom correspondence should be addressed.
Sustainability 2024, 16(12), 5074; https://doi.org/10.3390/su16125074
Submission received: 25 April 2024 / Revised: 4 June 2024 / Accepted: 11 June 2024 / Published: 14 June 2024
(This article belongs to the Section Energy Sustainability)

Abstract

:
Plastic is one of the most widely used materials worldwide. The problem with plastic arises when it becomes waste, which needs to be treated. One option is to transform plastic waste into synthetic fuels, which can be used as replacements or additives for conventional fossil fuels and can contribute to more sustainable plastic waste treatment compared with landfilling and other traditional waste management processes. Thermal and catalytic pyrolysis are common processes in which synthetic fuels can be produced from plastic waste. The properties of pyrolytic oil are similar to those of fossil fuels, but different additives and plastic stabilizers can affect the quality of these synthetic fuels. The quality of fuels and the permissible particle sizes and number density are regulated by fuel standards. Particle size in fuels is also regulated by fuel filters in vehicles, which are usually designed to capture particles larger than 4 μm. Problems can arise with the number density (quantity) of particles in synthetic fuels compared to that in fossil fuels. The present work is a numerical study of how particle size and number density (quantity) influence cavitation phenomena and cavitation erosion (abrasion) in common-rail diesel injectors. The results provide more information on whether pyrolysis oil (synthetic fuel) from plastic waste can be used as a substitute for fossil fuels and whether their use can contribute to more sustainable plastic waste treatments. The results indicate that the particle size and number density slightly influence cavitation phenomena in diesel injectors and significantly influence abrasion.

1. Introduction

The world is facing the problem of energy consumption growth, which is increasing by 1% on average per year in all sectors of energy consumption (industry, household, and transport). In 2022, 81.8% of global energy was still obtained from fossil fuels, of which the largest share was obtained from oil (31.6%), followed by coal (26.7%) and natural gas (23.5%) [1,2]. Internal combustion engines and fossil fuels are still the primary propulsion engines and fuels used in the transport sector. Biofuels are a suitable replacement for fossil fuels in transportation, but their wider usage is limited because they coincide with our food chain [3,4,5].
Another significant problem facing the world is the issue of waste, especially plastic waste. Waste and plastic waste have a high energy potential, meaning that they can be used to obtain raw materials with the potential to partially replace fossil fuels [6,7]. Synthetic fuel can be obtained using different processes like hydrolysis and pyrolysis. Pyrolysis, also called thermal degradation of plastic, is a very promising method for creating synthetic fuels. Pyrolysis is the process by which plastic’s long-chain polymers break down into simpler, smaller molecules at high temperatures without the presence of oxygen. The raw materials can be in a liquid, gaseous, or solid state. [8] Liquid synthetic fuels have the greatest potential for use in existing heat engines owing to their high calorific value. [9] The physical–chemical compositions of synthetic fuels are often affected by inhomogeneity in the composition of the raw materials used for their production, various additives (stabilizers, flame retardants, dyes, etc.), and their production processes. Therefore, it is necessary to check their properties (compositions) and their influence on the processes inside heat engines before their usage [10]. One option for managing diesel engine emissions when fuel quality changes is presented in [11].
Faisal et al. [12] used mixed plastic waste to produce pyrolytic oil. The oil obtained in the thermal pyrolysis process had properties similar to those outlined in the Australian standard for diesel fuel. The properties of PO have been further improved using distillation and hydrotreatment processes. Faisal et al. [13] also performed experimental testing on a 15% blend of hydrotreated PO with diesel fuel in a four-cylinder, four-stroke Kubota diesel engine. Their results indicate a reduction in CO2 and NOx emissions with a simultaneous increase in engine-rated brake power. Jahirul et al. [14] applied a further treatment, a distillation process, to pyrolytic oils. They used high-density polyethylene (HDPE), polypropylene (PP), and polystyrene (PS) to produce pyrolytic oil in a batch pyrolysis reactor. The authors concluded that the properties of the resulting diesel and gasoline fuels were very similar to those of conventional fuel. Ravi et al. [15] used mixed plastic waste to produce pyrolytic oil. This oil was further mixed with hexanol to reduce smoke emission during combustion in a single-cylinder four-stroke engine.
Fuel properties influence conditions like velocity and pressure inside the injection nozzle, which can further influence cavitation formation and spray development [16]. The studies on the influence of fuel properties on flow conditions inside fuel injectors can be performed experimentally, as in the work of Wei et al. [17], and/or numerically, as in the work of Kumar et al. [18].
Fuel injectors achieve high injection pressure through a narrow injection hole where high flow rates (or velocities) are present. Across the entrance of the injection hole from the SAC volume, a pressure drop occurs. If the pressure drop is large enough, cavitation can form at the entrance of the injection hole. Cavitation formation in fuel injectors can be studied experimentally, as in the work of Wei et al. [17], where string cavitation was observed, and the effect of needle lift on cavitation formation and spray development was determined. Cao et al. observed string cavitation using high-speed video and determined the influence of the fuel temperature on cavitation formation [19].
With progress in Computational Fluid Dynamics (CFD), the focus has shifted to numerical modeling (predicting) cavitation formation. Kumar et al. [18] studied cavitation formation in diesel and biodiesel fuels inside a Bosch diesel injector, adopting the RANS (Reynolds-averaged Navier–Stokes) approach to model turbulent flow and the Zwart–Gerber-Belamri cavitation model to model cavitation. By comparing a 15× scaled-up replica of an injection nozzle, they found good agreement between the experimental and numerical results. Similarly, Balz et al. [20] found good agreement between their experimental and simulation results for a marine diesel injector; they also adopted the RANS approach, but the multiphase flow, including cavitation, was modeled using the Homogeneous Relaxation Model (HRM). Different studies by Yu et al. [21], Torelli et al. [22], and Jiang et al. [23] determined the effect of fuel viscosity on cavitation formation, wherein a higher probability or larger extent of cavitation was found for fuels with lower viscosity owing to lower friction in the flow and, therefore, higher flow velocities. A similar finding has been observed in other studies [24,25].
Modeling cavitation erosion is an ongoing research area, and only recently has the focus shifted to phenomenologically accurate models instead of simpler cavitation erosion indicators. Fortes-Patella et al. [26] related the initial potential energy of cavitation structures to the final energy received by a solid surface and used this model to predict cavitation erosion on a hydrofoil [27]. Later, Schenke et al. [28] further modeled the energy transfer to capture energy focusing more accurately during cavitation collapse, and they successfully applied this approach to ship propellers [29]. Similarly, Arabnejad et al. [30] also considered cavitation erosion from an energy transfer point of view; however, they proposed a different approach to determine kinetic energy in the liquid surrounding cavitation structures instead of their potential energy. Owing to the increasing complexity of the above-mentioned models, particularly in implementing them for use with dynamic meshing, simpler cavitation erosion risk indicators have been used in studies of cavitation erosion in fuel injectors where simulations involve dynamic mesh. Santos et al. [31] used three different erosion risk indicators to predict cavitation erosion in a dynamic mesh simulation of a GDI injector. They found that maximum pressure locations on the surface—often used as simple cavitation erosion risk indicators—provide insufficient qualitative predictions of cavitation erosion locations when compared with experimental results. However, they found better agreement for the accumulated total derivative of pressure and the accumulated potential energy of cavitation. In another study [24], the accumulated potential energy of cavitation was also used to predict cavitation erosion in a diesel fuel injector. On the one hand, this approach is a more convenient way to model cavitation erosion; on the other hand, it avoids the complexity of previously described models by Schenke et al. [28] and Arabnejad et al. [30].
In addition to cavitation, particles in flows also present an erosion risk, referred to as abrasion. Particle abrasion has long been studied experimentally either in gas flows or liquid flows. Based on experimental observations, it has been found that the main influencing parameters on particle abrasion are particle impact velocity and particle impact angle [32]. Other parameters, such as the material properties of particles, solid surfaces impacted by particles, the shape of particles, etc., can be captured by one or several empirical coefficients in empirical particle abrasion models. Finnie [32] proposed a single empirical coefficient to capture the properties of sand particles and a steel wall. Ahlert [33] separately considered the influence of the Brinell hardness of a steel wall and the shape of particles; however, they lumped the sand particle properties into one empirical coefficient. A more detailed separation of influencing parameters was achieved in a model by Oka et al. [34,35], where wall density, the wall Vickers hardness, particle diameter, and several particle properties in combination with wall properties were presented using multiple coefficients.
Typically, particle abrasion on surfaces in liquid flows is encountered in pipe elbows, particularly in the oil industry, owing to the presence of sand in the oil transported from the well. Therefore, this is an oft-studied example of numerical predicting particle abrasion in liquid flows. Peng and Cao [36] tested different particle abrasion models, and by comparing them to experimental results, they found that the best prediction was obtained using the Ahlert model [33] with McLaury coefficients [37].
To the best of our knowledge, no studies involving numerical simulations of particle abrasion using the methodology adopted for pipe elbows—as in the work of Peng and Cao [36]—have been adopted for diesel fuel injectors. The raw material used to produce pyrolytic oil (PO) from plastic waste varies, which can further influence the quality and purity of these synthetic fuels. Using different additives and plastic stabilizers in plastic product (waste) production can further influence the quality of pyrolytic oil (synthetic fuel). The size of particles in fuels is normally regulated by fuel filters in vehicles, which are usually designed to capture particles larger than 4 μm. The present work focuses on numerically testing how particle size and quantity influence cavitation phenomena and cavitation erosion (abrasion) in common-rail diesel injectors. This study assumes (proposes) that different particle sizes and particle quantities present in fuel can occur during pure fuel filter maintenance (replacement) and/or malfunctions. This can increase the size of particles present in fuels, and the number of particles in fuels can be influenced by PO. In the present work, 5 μm and 10 μm particles were considered in two different amounts for 1 × e6 m−3 and 1 × e7 m−3 particle number densities. The present work addressed this subject numerically using the Ansys FLUENT computational program under actual engine operating conditions, considering full needle movement, the Reynolds Averaged Navier Stokes approach (RANS), the Zwart–Gerber–Belamri (ZGB) cavitation model, and the realizable k-epsilon turbulent model. Simulations were performed for pure diesel fuel and pyrolytic oil from HDPE and low-density polyethylene (LDPE) usage in a Denso model 7H150 common-rail diesel injector. The results indicate that fuel properties, particle size, and number density influence cavitation development, cavitation erosion, and abrasion in common-rail diesel injectors. Cavitation erosion is significantly influenced by cavitation development inside injection nozzles, which is, in turn, influenced by fuel properties, while the abrasion caused by particles is mostly influenced by particle size and density. The results indicate that a higher particle density in fuel can cause the deformation of injection nozzles, which can lead to pure spray development and atomization and further influence combustion and emission formation. This study also confirms the possible use of numerical simulations to distinguish between cavitation erosion and abrasion caused by particles, which is more difficult to test experimentally.

2. Materials and Methods

2.1. Plastic Material
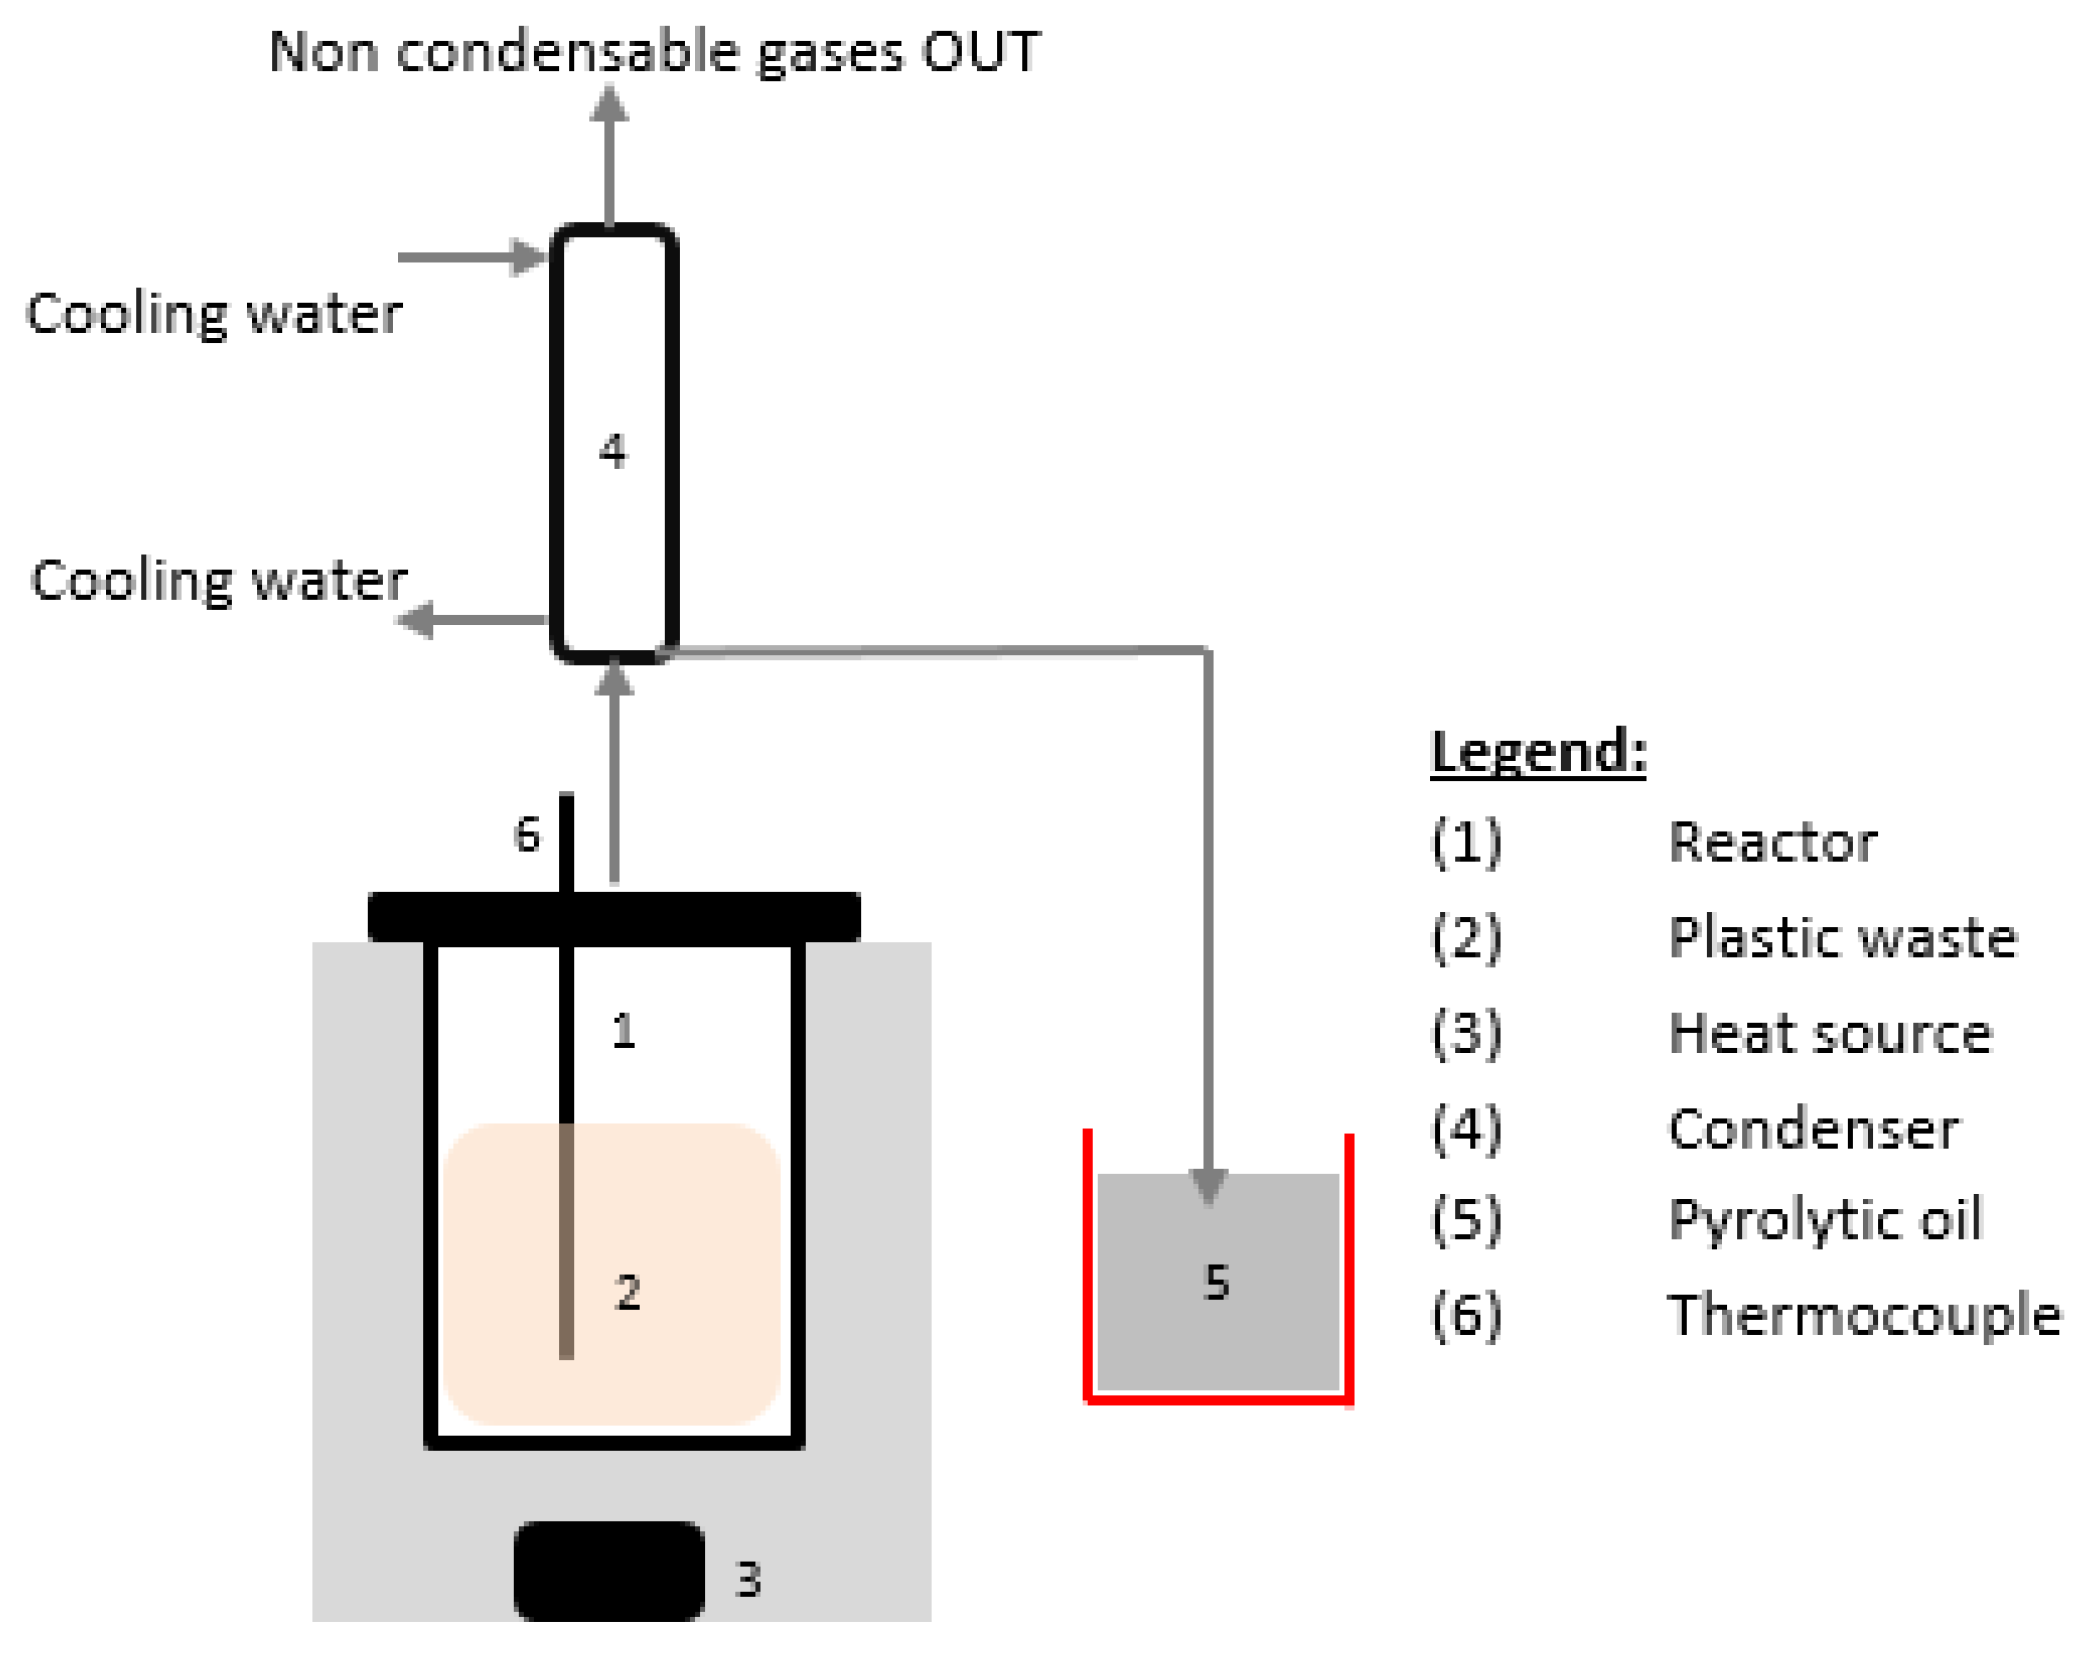
Municipal plastic waste was collected to produce pyrolytic oil. First, the plastic was separated into different types, of which only HDPE and LDPE plastics were used for further work. The selected plastic was washed and cut into small pieces before it was used for pyrolysis.

2.2. Pyrolysis

Next, the plastic waste was placed in a fixed-bed batch-type pyrolysis reactor. A schematic of the reactor is presented in Figure 1. In each batch, 100 g of cut plastic was used. The reactor was heated up to 400 °C using a hot air electrical heater. The plastic vapor (gas) produced was fed into a condenser, where condensable fractions turned into PO, and non-condensable gases were released into the atmosphere.

2.3. Fuel Properties for Simulations

The pyrolytic oils obtained from the experiment were further tested and analyzed to obtain the properties required for numerical simulations: fuel density, surface tension, kinematic viscosity, and saturation pressure. The fuel density was determined using a Mettler Toledo Density2Go meter, which can determine density in the range of 0–3 g/cm3 with an accuracy of 0.001 g/cm3. The surface tension was determined using a Krüss EasyDyne K20 tensiometer. A tensiometer can measure temperature in the range of 15–30 °C and a measuring range of 1 to 999 mN/m with a resolution of 0.1 nN/m. The properties are presented in Table 1. The saturation pressure for all fuels was set to 1000 Pa based on our previous work [24] and work by other authors [38]. All experimental measurements were repeated three times. The average (mean) values of the parameters (quantities) are presented below.

3. Numerical Model

The injector under consideration has seven injection holes, which are positioned axis-symmetrically. Owing to this configuration and to reduce computation time, only one-seventh of the whole injector (one injection hole) was considered in all simulations. First, a three-dimensional geometric model of the fluid domain was prepared with the three-dimensional Computer-Aided Design (CAD) software ANSYS SpaceClaim 2021 R2. Then, the computational domain was meshed with ANSYS Meshing 2021 R2 software. In Figure 2, both the three-dimensional model and the mesh at the cross-section of the injector nozzle are shown.

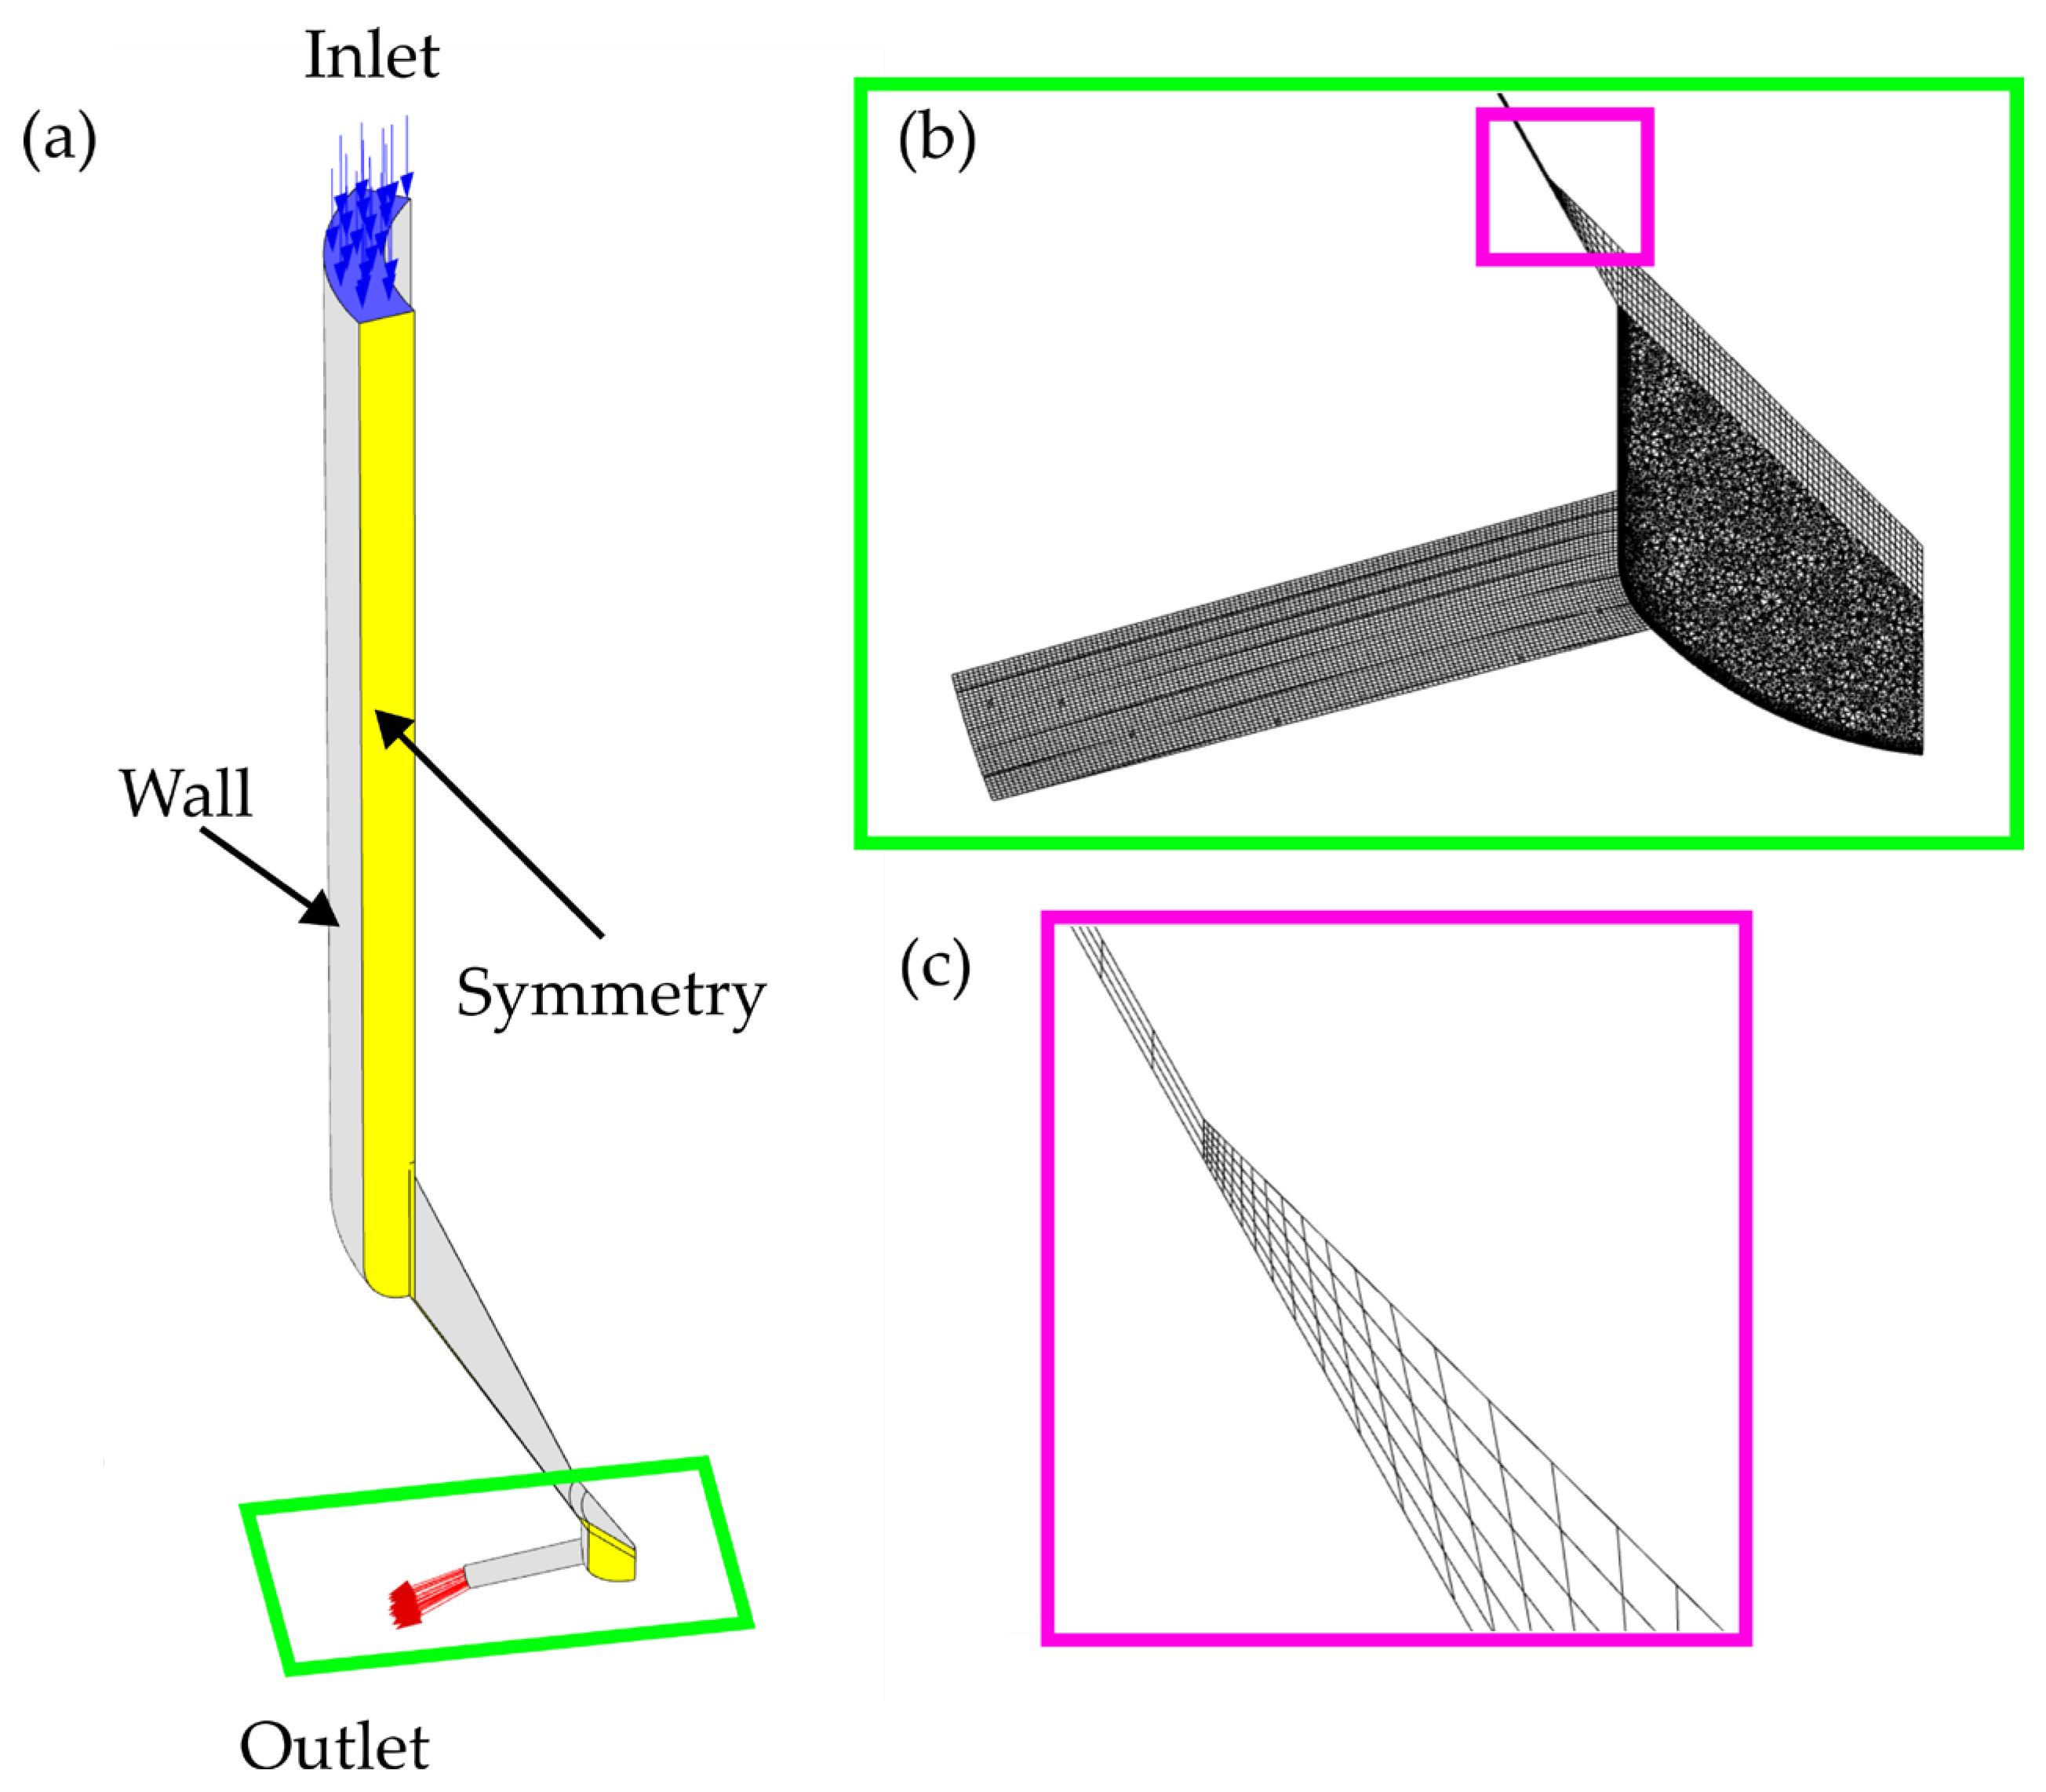
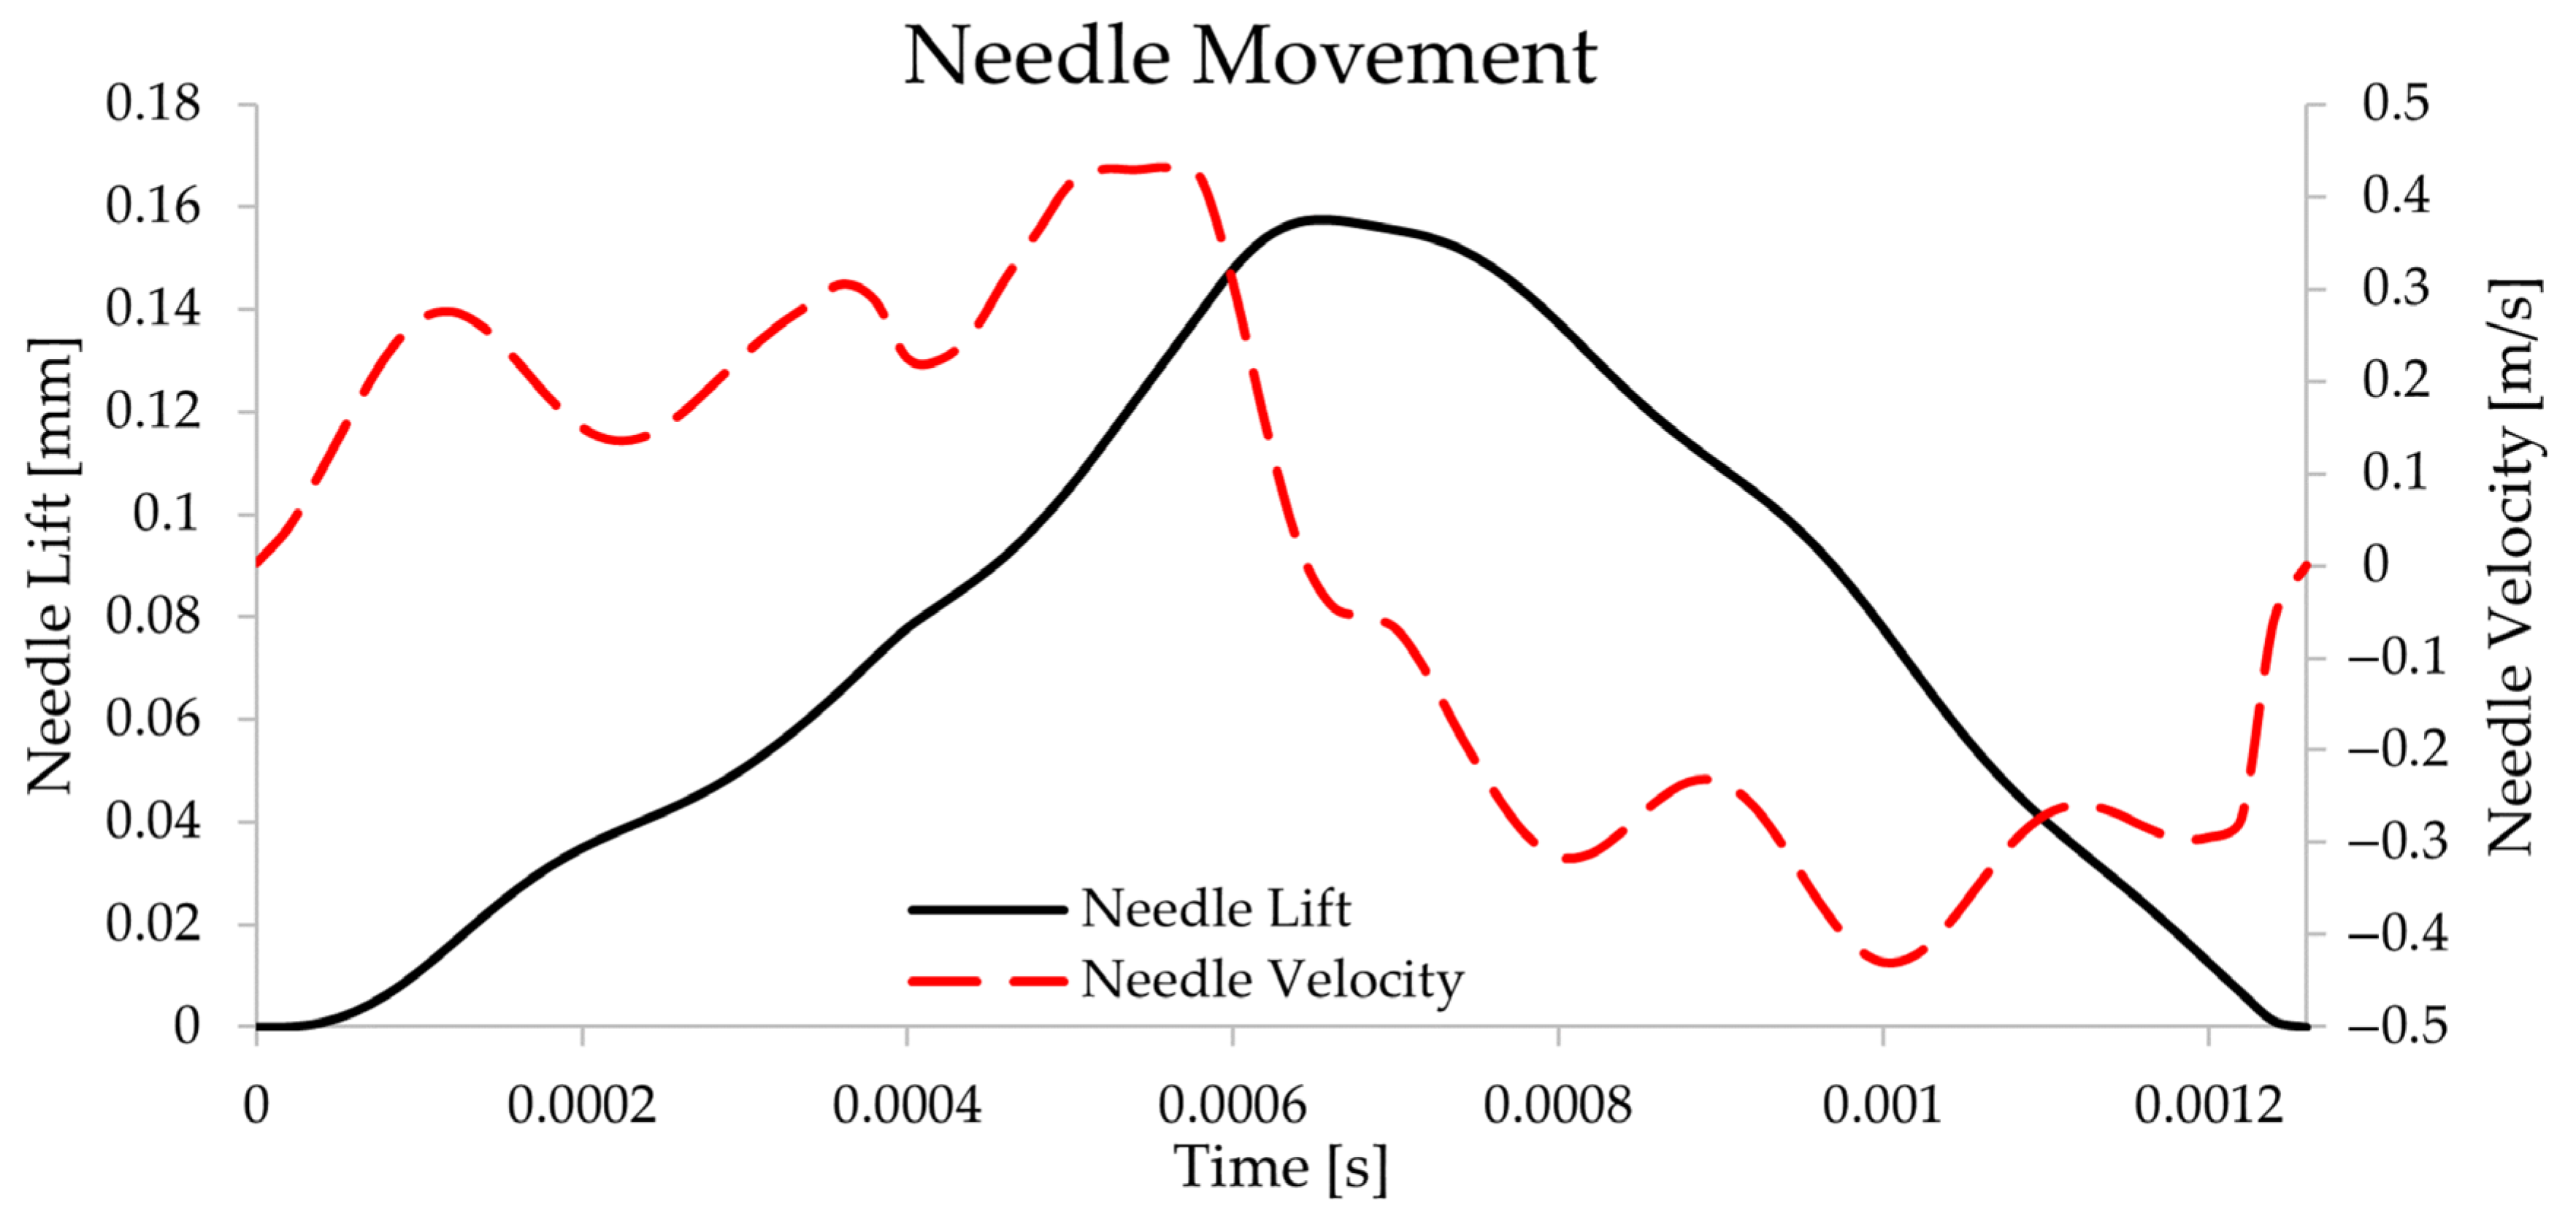
3.1. Simulation Set-Up

Simulations were set up in the commercial CFD software ANSYS Fluent 2023 R2. Governing equations were solved with a pressure-based solver using a coupled algorithm for pressure–velocity coupling. For pressure interpolation, a PRESTO interpolation scheme was used. Face values for momentum, volume fraction, turbulent kinetic energy, and turbulent kinetic energy dissipation rates were interpolated with a QUICK scheme. To calculate gradients, the least squares cell-based method was selected. To integrate the transient terms in the equations, the second-order implicit method was used.
Since transient effects caused by needle motion were considered, the simulations were also set up as transient and thus involved needle movement, which was achieved through dynamic meshing. Within ANSYS Fluent, different dynamic meshing approaches are available; in the present study, the dynamic layering mesh update approach was selected. Needle movement was defined with a needle velocity profile, which was calculated as the time derivative of experimentally determined [39] needle positions over time, as shown in Figure 3.
Since the dynamic layering method requires at least one cell layer at the beginning of the simulation, a small 1 µm gap between the needle and the body of the injector was considered the initial state of the injector for simulations.
Figure 2 shows the boundary conditions; at the inlet, an 845-bar injection pressure was prescribed, and at the outlet, a 60-bar in-cylinder back pressure was prescribed. Other injector surfaces were considered no-slip walls, and the side surfaces, resulting from cutting out 1/7 of the injector, were prescribed the symmetry boundary condition.
One injection cycle spanned 1.26 × 10⁻³ s, as shown in Figure 3, which was discretized with a timestep of 1 × 10⁻⁷ s, resulting in a calculation duration of 12,600 timesteps. At each timestep, the iterative solution of the governing equations was achieved when scaled residuals of 10−3 were obtained.
The mesh selection and timestep selection followed the authors’ previous work [24], wherein mesh independence and timestep independence studies were performed. A detailed description of the selected operating regime (injection pressure and back pressure), injection duration, etc., is provided in [25,39].

3.2. Mathematical Models

The governing equations for modeling multiphase flow, turbulence, cavitation, cavitation erosion, particle motion, and particle abrasion are presented below. Table 2 is an overview of the models used to describe each physical phenomenon with necessary modeling assumptions or limitations. In addition to the models already implemented in ANSYS Fluent, a cavitation erosion risk indicator (ERI) had to be implemented using a user-defined function written in the C programming language.
Multiphase flow with cavitation consists of liquid and vapor phases. In the homogeneous mixture model, the liquid and vapor phases are considered a single liquid mixture with an assumption of equal pressure and velocity between phases. The mixture properties of the liquid within ANSYS Fluent are determined with a mixing rule, which is written for density and dynamic viscosity as follows [40]:
ρ = α v ρ v + 1 α v ρ l  
μ = α v μ v + 1 α v μ l  
where ρ l and ρ v are the liquid and vapor density, respectively, and μ l and μ v are the liquid and vapor dynamic viscosity. Since only the volume fractions of the liquid ( α l ) and vapor ( α v ) are considered, the following holds [40]:
α l + α v = 1  
The continuity and momentum equations for the mixture are then as follows [40]:
ρ t + · ρ u = 0
ρ u t + · ρ u u = p + · τ
where u is the mixture velocity, p is the pressure of the mixture, and τ is the mixture shear stress tensor.
Additionally, the vapor mass equation is solved to obtain the vapor volume fraction [40]:
α v ρ v t = · α v ρ v u = R e R c  
where R e and R c are the mass transfer source and sink terms, respectively, which represent evaporation and condensation.

3.3. Turbulence Modeling

To model turbulent flow, the URANS (unsteady Reynolds-averaged Navier–Stokes [40]) approach was adopted. Subdivisions of URANS include two-equation turbulence models, of which the realizable k ε model [41] was chosen based on recommendations found in the literature [18,42], wherein the Enhanced Wall Treatment (EWT), which is y+ insensitive, is recommended. The realizable k ε model introduces an additional transport equation for the turbulent kinetic energy ( k ) [41],
ρ k t + · ρ k u = · μ + μ t σ k k + G k ρ ε  
and an additional transport equation for the turbulent kinetic energy dissipation rate ( ε ) [41],
ρ ε t + · ρ ε u = · μ + μ t σ ε ε + ρ C 1 S ε ρ C 2 ε 2 k + υ ε  
where μ t is turbulent viscosity and G k represents the generation of turbulent kinetic energy. σ k is the turbulent Prandtl number for k , with a value of 1.0; σ ε is the turbulent Prandtl number for ε , with a value of 1.2, and C 2   is a model constant with a value of 1.9. C 1 is calculated as follows:
C 1 = max 0.43 ,   η η + 5
η = S k ε  
S = 2 S S  
where S is the mean rate of the strain tensor. The turbulent viscosity is calculated in the same way as in the standard k ε model, as follows [40]:
μ t = ρ C μ k 2 ε  
where C μ is a function of the mean strain and rotation rates, the turbulent kinetic energy, and the turbulent kinetic energy dissipation rate. For conciseness, the equations used to calculate C μ [40,43] and G k [40,41] are omitted here and are available in the referenced literature.

3.4. Cavitation Modeling

The mass transfer cavitation models are based on a simplified version of the Rayleigh–Plesset equation from which the dynamics of a growing or collapsing bubble can be expressed via the bubble radius ( R B ) as follows [40]:
d R B d t = 2 3 p v p ρ l  
where p is the far-field pressure, which is replaced with the local pressure ( p ) in the cell center for practical purposes.
The Zwart–Gerber–Belamri cavitation model assumes that the liquid-vapor mixture consists of equally sized bubbles in a liquid. Zwart, Gerber, and Belamri expressed the total interphase mass transfer rate per unit volume as follows [44]:
R = N B d m B d t = N B 4 π R B 2 ρ v d R B d t = 3 α v ρ v R B 2 3 p v p ρ l  
where N B is the number of bubbles per unit volume of the fluid mixture, and the vapor volume fraction is expressed as follows [44]:
α v = V B N B = 4 3 π R B 3 N B  
Equation (14) was derived for the bubble growth phase; a general form to include condensation is expressed as follows [44]:
R = 3 α v ρ v R B 2 3 p v p ρ l   s i g n p v p
The authors of [44] noticed that this model worked well for condensation but was numerically unstable and physically incorrect for vaporization. To account for the decrease in nucleation site density with an increasing vapor volume fraction, α v in Equation (14) was replaced with α n u c ( 1 α v ) . The final form of the ZGB cavitation model is as follows:
If p p v , then
R e = F v a p 3 α n u c 1 α v ρ v R B 2 3 p v p ρ l  
If p > p v , then
R c = F c o n d 3 α v ρ v R B 2 3 p p v ρ l  
where F v a p and F c o n d are empirical calibration coefficients for vaporization and condensation, respectively. The authors of [44] reported the following model parameters: R B = 10 6   m , α n u c = 5 × 10 4 , F v a p = 50 , and F c o n d = 0.01 .

3.5. Cavitation Erosion Risk Indicators

Predicting cavitation erosion coupled with numerical simulations of cavitating flow is an ongoing and important topic in research of cavitation, particularly from an engineering perspective if this kind of research can be applied to real-world applications, such as diesel fuel injectors. In the past, various approaches to predict cavitation erosion have been proposed and evaluated. Based on previous studies, an erosion risk indicator (ERI) was chosen to compare predicted cavitation erosion locations for different fuels contaminated with differently sized particles present in different concentrations.
For a given vapor structure, the potential energy per unit volume can be expressed as follows [26]:
e p o t = α v p d p v
where p d is the pressure driving the cavity collapse. By taking a total derivative, we can obtain the radiated power [28]:
e ˙ r a d = D e p o t D t = D α v D t p d p v
where D α v D t means that only the negative values of the total derivative are considered, which corresponds to the modeling assumption that only the collapse stage should be considered.
Melissaris et al. [29] considered two additional formulations for D α v D t and found that the most accurate formulation was the one where the total derivative of vapor volume fraction was replaced with the relation to the cavitation sink term. Considering this, the radiated cavitation power can be written as follows [29]:
e ˙ r a d = ρ ρ l R c ρ v p d p v
and by integrating throughout the injection cycle, from t = 0   s to t = 1.26 × 10 3   s , we can express ERI as follows:
E R I = 0 t e ˙ r a d d t  

3.6. Discrete Phase Model for Particle Tracking

To track the motion of particles in the flow, a Lagrangian tracking approach was adopted, which is called the discrete phase model within ANSYS Fluent [40]. The motion of point particles is governed by forces acting on these particles, which can be expressed as particle acceleration [40]:
d v d t = ρ ρ p 1 ρ p + ν 2 u + 18 μ ρ p d p 2 C D R e p 24 u v + 1 2 ρ ρ p D u D t d v d t
where ρ p is the particle density, ν is the fluid kinematic viscosity, d p is the particle diameter, and C D is the particle drag coefficient. In Equation (23), three forces are considered: the pressure gradient force (in the first term on the right side of the equation), the drag force term (the second term on the right-hand side), and the virtual mass term (the third term on the right-hand side). The drag force term is expressed with the drag coefficient and the particle Reynolds number. The particle Reynolds number is defined as follows [40]:
R e p = ρ p d p u v μ
and the particle drag coefficient can then be obtained by using a correlation by Morsi and Alexander [45]:
C D = a 1 + a 2 R e p + a 3 R e p 2
where a 1 , a 2 , and a 3 are fitting curve constants.
By integrating Equation (23) over time, the particle position at any given time can be obtained. Owing to the presence of the particles and the fluid acting on the particles, the particles also act back on the fluid. Two-way coupling is then considered, where the effect of the particles is described by adding a source term to the fluid momentum Equation (5) [40]:
S M = p 18 μ ρ p d p 2 C D R e p 24 u v + ρ ρ p 1 ρ p + ν 2 u + 1 2 ρ ρ p D u D t d v d t m p
where the source term in each cell is made up of a partial contribution of all particles, p , in a cell with a particle mass, m p .
When particles impact a wall, a reflection boundary condition is imposed. However, owing to this particle–wall interaction, some of the particle momentum is lost, which can be described with two coefficients of restitution, one in the wall-normal direction ( e n ) and one in the wall-tangential direction ( e t ). Empirical relations created by Grant and Tabakoff [46] can be used, where coefficients of restitution are provided as a function of the particle–wall impact angle ( α ):
e n = 0.993 1.76 α + 1.56 α 2 0.49 α 3
e t = 0.988 1.76 α + 1.56 α 2 0.49 α 3
The particle velocity after the particle reflects off the wall can be written in the normal direction
v n , 2 = e n v n , 1
and in the tangential direction
v t , 2 = e n v t , 1
where index 1 represents the particle velocity before impacting the wall, and index 2 represents the particle velocity after impacting the wall.

3.7. Particle Abrasion Modeling

Ahlert [33] proposed an empirical particle abrasion model based on his experimental work. Particle abrasion is expressed as the erosion rate:
E R = A F s f α v 1,73
where A is an empirical constant related to the Brinell hardness of the wall material, F s is the particle shape factor (1.0 for spherical particles), and f α is a function of the particle–wall impact angle, which is written as follows [33]:
f α = a α 2 + b α x cos 2 α sin w α + y sin 2 α + z ; i f   α α 0 ; i f   α > α 0
For the flow of sand particles in water impacting a steel sample (wall), McLaury et al. [37] proposed slightly different empirical coefficient values compared with this in the model by Ahlert [33]. For this reason, this particle abrasion model is called the McLaury model in ANSYS Fluent. McLaury model coefficient values are presented in Table 3.

4. Results

The following section presents results for cavitation development, cavitation erosion, and abrasion caused by particles.

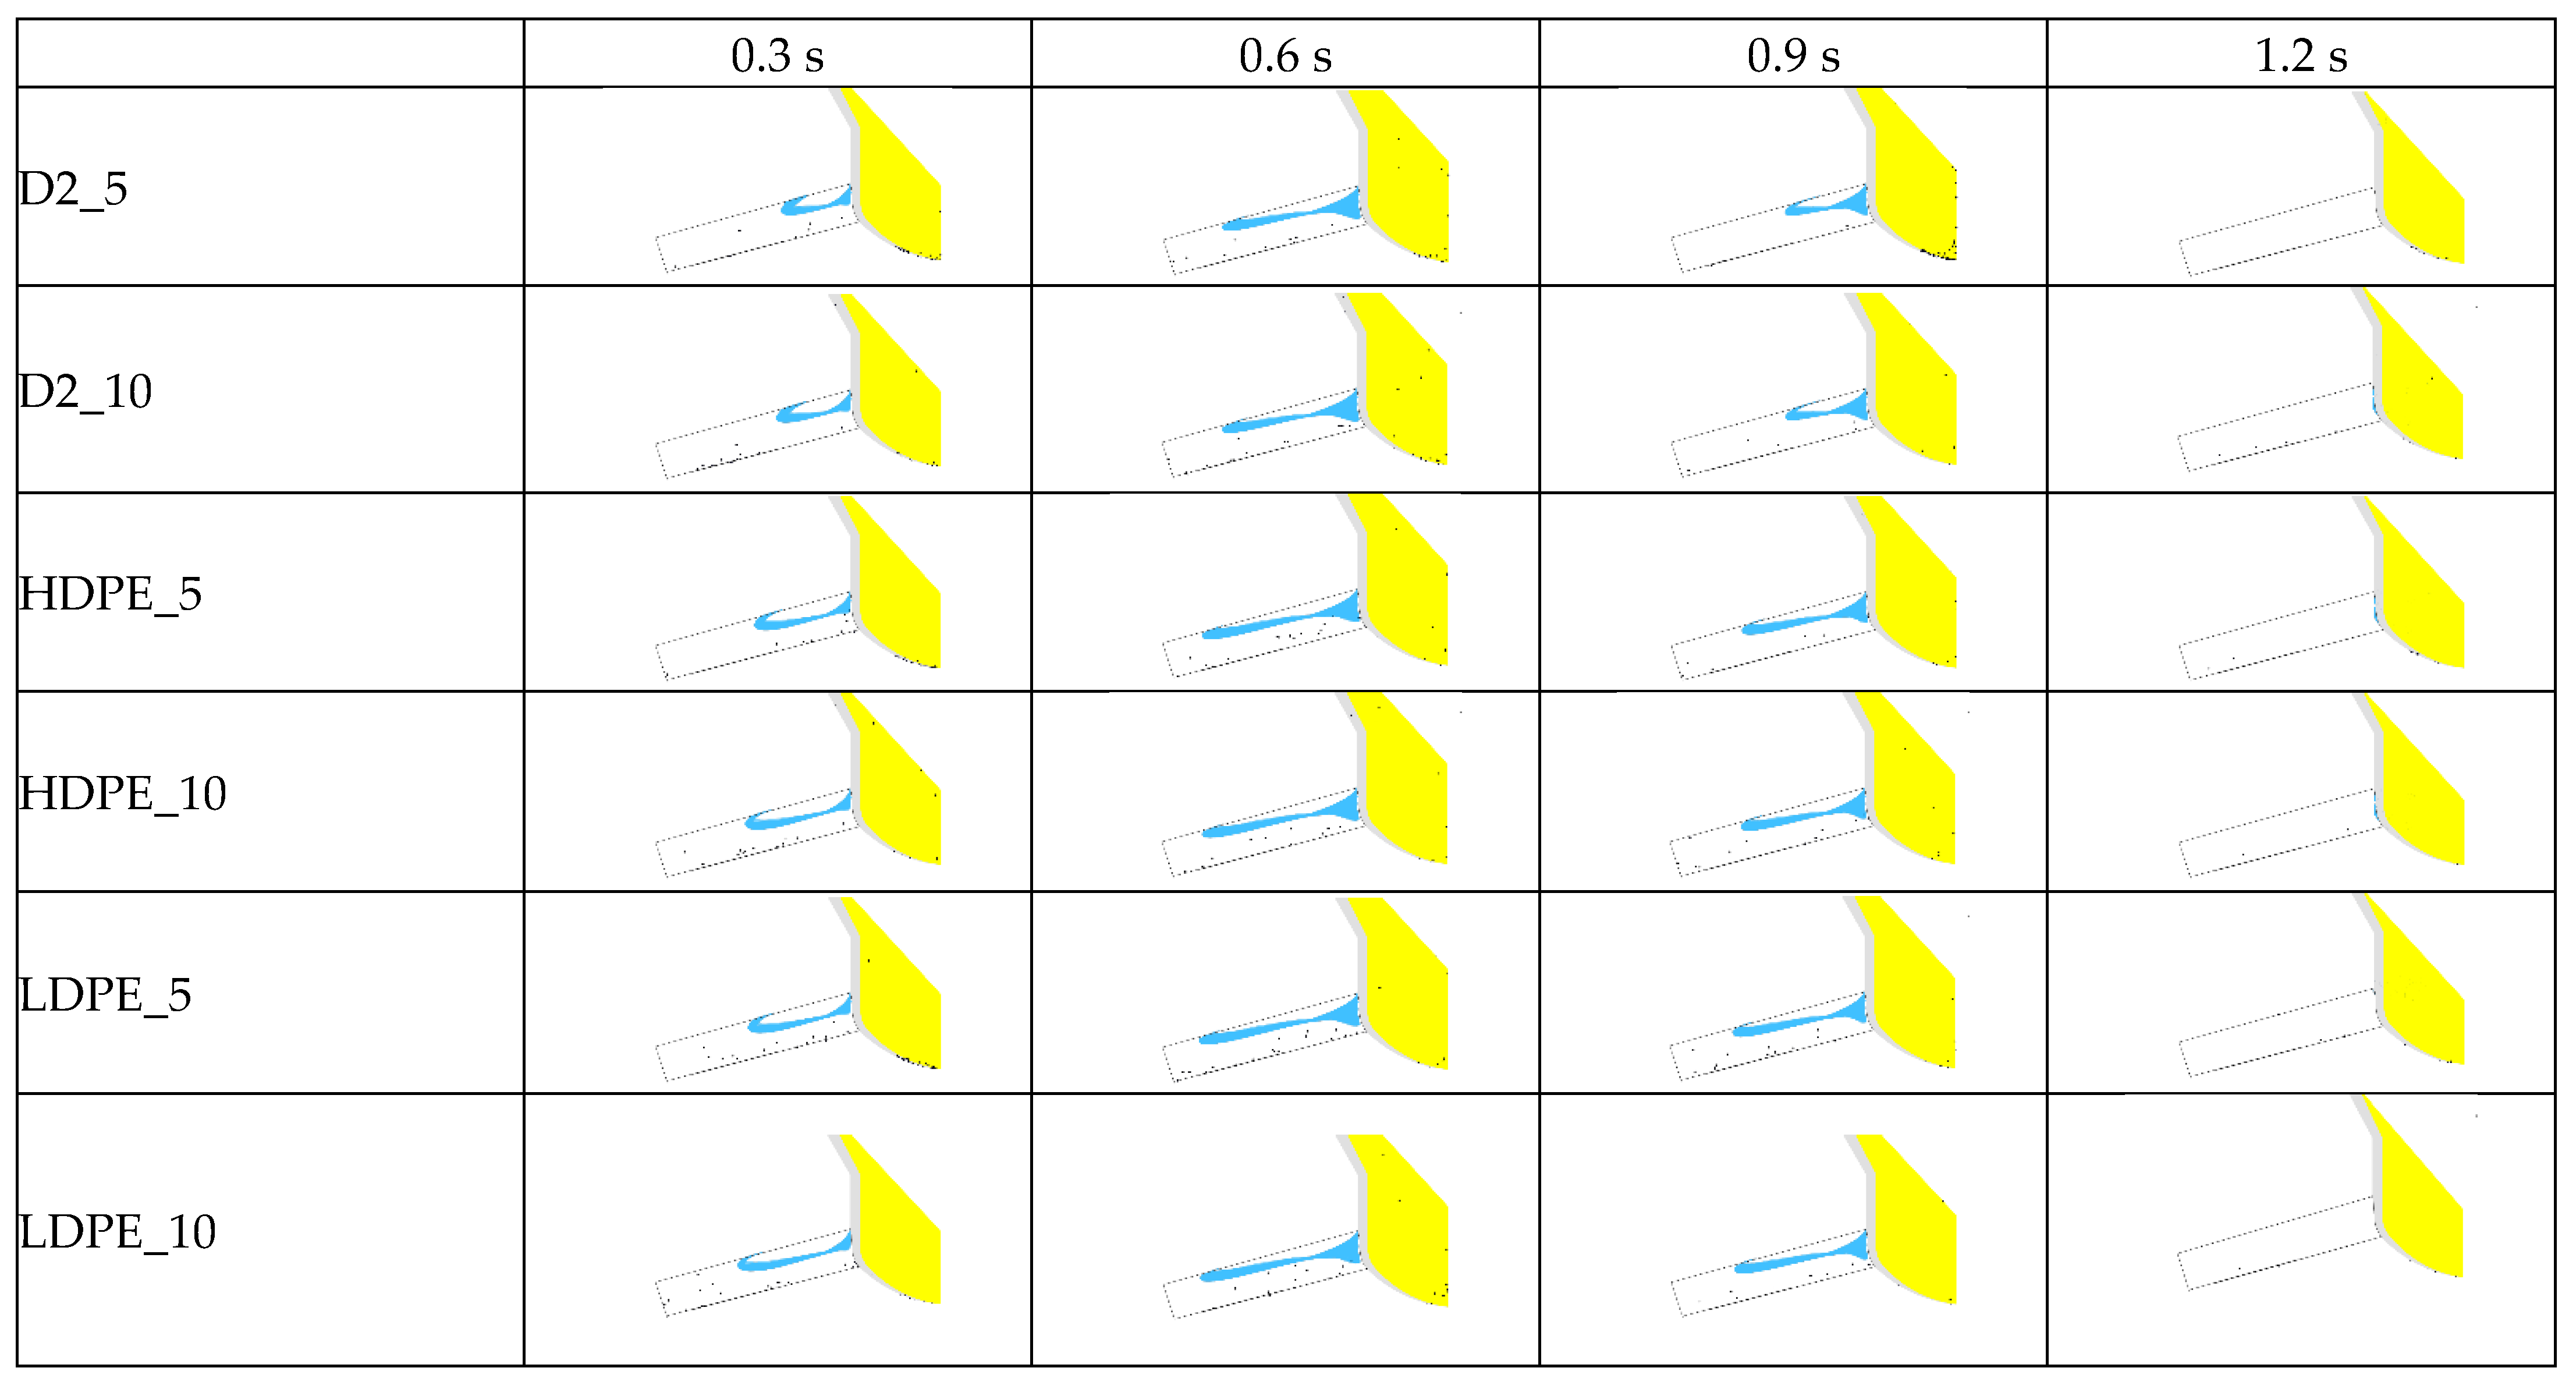
4.1. Cavitation Development

The results regarding cavitation development in the injection hole are presented in Figure 4 and Figure 5. The blue color in Figure 4 and Figure 5 represents an iso-surface of 20% vapor volume fraction, while the yellow color indicates a symmetry plane. The black dots in Figure 4 and Figure 5 represent particles.
Figure 4 presents the results for a particle number density of 1 × e6, where the notation _5 indicates results for a particle size of 5 μm and _10 indicates those for 10 μm for different fuels (D2—diesel fuel, HDPE, and LDPE).
The cavitation development results show that in all tested fuels, an attached cavitation cloud is formed on the upper side of the injection hole entrance. In this section, the fuel flow undergoes the largest changes in flow direction, forming an area with influence on cavitation and low pressure. The cavitation structures are longer for both POs compared with diesel fuel. The longest cavitation structures were obtained for the LDPE PO, which had the lowest density and viscosity of all the fuels used. Lower fuel density and viscosity reduce fuel flow resistance and disturbance created by needle opening and closing, which results in higher fuel velocity (lower pressure) and increases cavitation formation.
Comparing the results for different particle sizes, there are some differences in the dynamic behavior of cavitation fluctuation inside the injection nozzle. In some presented times, larger particles influence cavitation structure length, while in others, the length of the cavitation structures is more or less the same (0.6 and 0.9 s).
The results for a number density of 1 × e7 are presented in Figure 5.
The results for the higher particle number density are similar to those for the lower number density. The length of cavitation structures is again influenced by fuel properties and is the longest for LDPE pyrolytic oil and lowest for diesel fuel.
Particle size influences slightly longer cavitation structure for all fuels at all selected times.
Since particles influence flow, just as flow influences the motion of particles, some differences in flow behavior are expected when comparing differently sized particles present at different number densities. In our modeling approach, this effect is captured by the two-way coupling between the fuel liquid phase and the particulate discrete phase, where particles influence flow via momentum exchange. Larger particles present in higher quantities (number density) exchange more momentum with the fuel, leading to a larger pressure drop in the injection hole over a larger zone. This is then reflected in the fact that longer cavitation clouds can be seen in Figure 4 and Figure 5 when comparing cases with 5 μm particles and 10 μm particles.

4.2. Cavitation Erosion

The cavitation erosion prediction results are presented by ERI contours on the surface of the injection hole in Figure 6, calculated using Equation (22). There are two distinct regions of cavitation erosion in the diesel injector, marked A and B in Figure 6, in which indices 1 × e6 and 1 × e7 indicate results for different particle number densities (1 × 10⁶ and 1 × e7 m−3); the notation _5 indicates results for particle sizes of 5 μm and the notation _10 indicates those for 10 μm in different fuels.
The smaller region, A, is located at the injection hole entrance and is in the same position for all fuel and particle combinations. The shape and size of cavitation erosion region A are identical for all tested combinations. In this region, maximal ERI values were obtained in all simulations.
Region B of the cavitation erosion is significantly larger for all fuel and particle combinations compared with region A. Region B is located on the upper side of the injection hole. For diesel fuel, the location of region B is at the center of the injection hole’s length, and the region is shifted toward the exit of the injection hole for both the HDPE and LDPE fuels. Region B was relocated downstream for the pyrolytic oils because the cavitation structures (cavities) are longer in pyrolytic oil usage. The locations of both erosion regions can be explained by the location of a closure line on the attached cavitation structure in the injection hole. In this area, a stagnation point forms, in which the pressure rises from vapor pressure to stagnation pressure, causing further fuel flow separation. Owing to high pressure in the stagnation point, small cavitation structures violently collapse, which results in cavitation erosion.
The ERI values were further integrated across the entire surface of the injection hole. The integral values were further normalized and are presented in Figure 7, where the notation _5 indicates results for particle sizes of 5 μm and _10 indicates those for 10 μm in different fuels (D2—diesel fuel, HDPE, and LDPE).
Increasing the particle number density from 1 × e6 m3 to 1 × e7 m3 only slightly influences the normalized cavitation erosion values on the injection hole surface. The highest cavitation erosion values were predicted for the LDPE fuel and lower-density particles with sizes of 5 μm. The lowest value was obtained for diesel fuel and particles with sizes of 5 μm and densities of 1 × e7 m3.

4.3. Abrasion

The numerical abrasion results are presented in Figure 8, where the bottom surface of the injection hole and the nozzle SAC volume are presented for all fuels, particle sizes, and number densities.
Figure 8 shows that particle size and number density have a significant influence on the occurrence of abrasion.
The location of the highest abrasion is at the entrance of the injection hole, which coincides with the main changes in fuel flow. Owing to a high-pressure drop in the upper part of the entrance, a cavitation is formed, which forms vena contracta. This change in fuel flow concentrates particles close to the bottom part of the injection hole and further influences abrasion in this area. The abrasion area pattern is similar for all fuels and particles. It has a distinct H shape that extends downstream. The length of abrasion areas coincides with the length of the cavitation structures (Figure 4 and Figure 5). It is the longest for LDPE PO, where cavitation structures also extend further downstream compared with HDPE PO and diesel fuel.
The time-integrated erosion rates resulting from Equation (31) were further integrated across the entire surface of the injection hole. The integral values were further normalized and are presented in Figure 9, where notation _5 again indicates results for particle sizes of 5 μm and _10 indicates those for 10 μm for D2, HDPE, and LDPE fuels.
The normalized abrasion values indicate that particle number density has a dominant influence on abrasion compared with particle size. This can be explained by the number of particle–wall collisions, where the higher particle number density (higher number of particles) results in more collisions, which can spread over a larger area, but—more importantly for the overlapping collisions—higher maximum abrasion values are obtained. The highest abrasion values were obtained for LDPE fuel with a particle size of 10 μm and a particle density of 1 × e7. The lowest time-integrated erosion rate values for both tested particle densities were for diesel fuel, indicating that fuel properties also influence abrasion. This can again be explained by the lower density and viscosity of pyrolytic oil compared with diesel fuel; these properties increase fuel flow velocity and further influence higher abrasion (Figure 8 and Figure 9).

5. Conclusions

The present work focused on the possible uses of plastic waste for the production of pyrolytic oil and its potential for use in a common-rail diesel injector. First, HDPE and LDPE plastic waste were collected and used to produce pyrolytic oils via thermal pyrolysis in a batch pyrolytic reactor. The pyrolytic oils were further characterized to obtain the properties necessary for numerical simulations. Second, a numerical model of a common-rail injector was created in the ANSYS Fluent program. The fuel properties and cavitation erosion and abrasion models were further implemented in the FLUENT program and used for numerical study. The main conclusions of the present work are as follows:
-
Waste from high-density and low-density polyethylene is a suitable raw material for producing pyrolytic oil using thermal pyrolysis;
-
The pyrolytic oils in this study have properties that are similar to those of conventional diesel fuel;
-
Cavitation formations inside injection nozzles spread more rapidly with pyrolytic oil usage because of its lower viscosity and density, which further influences the length of cavitation structures;
-
The length of cavitation structures influences the location of stagnation points, which further influences the location of predicted cavitation erosion:
-
With the applied methodology, particle abrasion was considered in addition to cavitation erosion for fuels contaminated with particles, and a distinct particle abrasion zone was found, separate from the cavitation erosion zone:
-
The zone of particle abrasion is believed to be influenced by cavitation formation owing to vena contracta formation, which redirects the flow of particles toward the bottom of the injection hole:
-
Cavitation erosion and abrasion area patterns were similar for all fuels under consideration, indicating that cavitation erosion and abrasion mechanisms are the same for all fuels, particle sizes, and particle densities.
The results indicate that fuel properties significantly influence flow conditions inside injection nozzles, which coincides with the findings presented in our previous paper [22]. The conditions are further influenced by the particle size and number density, which both affect cavitation erosion and abrasion. The influence of the particle size and number density on cavitation erosion is small, but their influence on abrasion is significant. This was expected since the particles are rather small and do not significantly influence fuel flow patterns. This further indicates that the pure maintenance of engines and oil filters with a combination of pyrolytic oils can potentially impact fuel spray formation, break-up, combustion, emission formation, etc. This indicates that plastic waste can be used as a fuel in internal combustion engines and contribute to more sustainable uses of plastic, although some disadvantages are possible. Transforming plastic waste into fuel or fuel additives influences the sustainable use of plastic, as this process reduces the amount of plastic sent to landfills, which subsequently reduces the release of toxic gasses into the atmosphere and the potential for underground water contamination with microplastics.
The present work considers only numerical results under one operating regime for a common-rail injection nozzle with two particle sizes and two particle number densities. Further studies (numerical and experimental) are needed to explore the real extent of particles’ influence on fuel flow conditions, cavitation formation, cavitation-induced erosion, and cavitation-induced abrasion in modern common-rail injectors. The authors are working on building an experimental section that will test common-rail injectors. This will provide us with a tool for experimentally testing fuels with different contaminations and their impact on cavitation erosion and abrasion.

Author Contributions

E.T.-J.: Visualization, Writing—review & editing. I.B.: Writing—review & editing, Supervision, Project administration. L.K.: Conceptualization, Methodology, Investigation, Project administration, Writing—Original Draft, Visualization. L.L.: Conceptualization, Methodology, Investigation, Resources, Writing—Original Draft, Visualization, Supervision. All authors have read and agreed to the published version of the manuscript.

Funding

The authors wish to thank the Slovenian Research Agency (ARRS) for its financial support in the framework of Research Program P2-0196 in Power, Process, and Environmental Engineering. The authors also thank the Spanish Ministry of Science, Innovation, and Universities for the financial support obtained through Project RECUPERA-TE (RTI2018-095923-B-C21).

Data Availability Statement

Data can be supplied upon request.

Conflicts of Interest

The authors declare no conflict of interest.

References

  1. Wright, V.P. World Energy Outlook. In Energy Systems for the 21st Century; ASCE: Reston, VA, USA, 1986; pp. 23–28. [Google Scholar]
  2. Energy Institute. Statistical Review of World Energy; Energy Institute: London, UK, 2023. [Google Scholar]
  3. Ran, Z.; Hadlich, R.R.; Yang, R.; Dayton, D.C.; Mante, O.D.; Assanis, D. Experimental investigation of naphthenic biofuel surrogate combustion in a compression ignition engine. Fuel 2022, 312, 122868. [Google Scholar] [CrossRef]
  4. Dhiman, S.; Mukherjee, G. Utilization of food waste for biofuel production: A biorefining perspective. Mater. Today Proc. 2022. [Google Scholar] [CrossRef]
  5. Sachin Powar, R.; Singh Yadav, A.; Siva Ramakrishna, C.; Patel, S.; Mohan, M.; Sakharwade, S.G.; Choubey, M.; Kumar Ansu, A.; Sharma, A. Algae: A potential feedstock for third generation biofuel. Mater. Today Proc. 2022, 63, A27–A33. [Google Scholar] [CrossRef]
  6. Anika, O.C.; Nnabuife, S.G.; Bello, A.; Okoroafor, E.R.; Kuang, B.; Villa, R. Prospects of low and zero-carbon renewable fuels in 1.5-degree net zero emission actualisation by 2050: A critical review. Carbon Capture Sci. Technol. 2022, 5, 100072. [Google Scholar] [CrossRef]
  7. Cheng, F.; Luo, H.; Jenkins, J.D.; Larson, E.D. The value of low- and negative-carbon fuels in the transition to net-zero emission economies: Lifecycle greenhouse gas emissions and cost assessments across multiple fuel types. Appl. Energy 2023, 331, 120388. [Google Scholar] [CrossRef]
  8. King, S.; Locock, K.E.S. A circular economy framework for plastics: A semi-systematic review. J. Clean. Prod. 2022, 364, 132503. [Google Scholar] [CrossRef]
  9. Sallevelt, J.L.H.P.; Pozarlik, A.K.; Brem, G. Numerical study of pyrolysis oil combustion in an industrial gas turbine. Energy Convers. Manag. 2016, 127, 504–514. [Google Scholar] [CrossRef]
  10. Hahladakis, J.N.; Velis, C.A.; Weber, R.; Iacovidou, E.; Purnell, P. An overview of chemical additives present in plastics: Migration, release, fate and environmental impact during their use, disposal and recycling. J. Hazard. Mater. 2018, 344, 179–199. [Google Scholar] [CrossRef]
  11. Milojević, S.; Savić, S.; Marić, D.; Stopka, O.; Krstić, B.; Stojanović, B. Correlation between Emission and Combustion Characteristics with the Compression Ratio and Fuel Injection Timing in Tribologically Optimized Diesel Engine. Teh. Vjesn. 2022, 29, 1210–1219. [Google Scholar] [CrossRef]
  12. Faisal, F.; Rasul, M.G.; Jahirul, M.I.; Chowdhury, A.A. Waste plastics pyrolytic oil is a source of diesel fuel: A recent review on diesel engine performance, emissions, and combustion characteristics. Sci. Total Environ. 2023, 886, 163756. [Google Scholar] [CrossRef]
  13. Faisal, F.; Rasul, M.G.; Chowdhury, A.A.; Jahirul, M.I.; Hazrat, M.A. Performance and emission characteristics of a CI engine with post-treated plastic pyrolysis oil and diesel blend. Energy Rep. 2023, 9, 87–92. [Google Scholar] [CrossRef]
  14. Jahirul, M.I.; Faisal, F.; Rasul, M.G.; Schaller, D.; Khan, M.M.K.; Dexter, R.B. Automobile fuels (diesel and petrol) from plastic pyrolysis oil—Production and characterisation. Energy Rep. 2022, 8, 730–735. [Google Scholar] [CrossRef]
  15. Ravi, S.; Karthikeyan, A. Performance and emissions characteristics of a direct injection c.I engine fuelled with waste plastic oil and diesel concoction. Int. J. Veh. Struct. Syst. 2021, 13, 351–356. [Google Scholar] [CrossRef]
  16. Feng, S.; Zhang, S.; Zhang, H.; Shi, J. Effect of nozzle geometry on combustion of a diesel-methanol dual-fuel direct injection engine. Fuel 2024, 357, 129734. [Google Scholar] [CrossRef]
  17. Wei, Y.; Fan, L.; Zhang, H.; Gu, Y.; Deng, Y.; Leng, X.; Fei, H.; He, Z. Experimental investigations into the effects of string cavitation on diesel nozzle internal flow and near field spray dynamics under different injection control strategies. Fuel 2022, 309, 122021. [Google Scholar] [CrossRef]
  18. Kumar, A.; Ghobadian, A.; Nouri, J. Numerical simulation and experimental validation of cavitating flow in a multi-hole diesel fuel injector. Int. J. Engine Res. 2022, 23, 958–973. [Google Scholar] [CrossRef]
  19. Cao, T.; He, Z.; Si, Z.; EL-Seesy, A.I.; Guan, W.; Zhou, H.; Wang, Q. Optical experimental study on cavitation development with different patterns in diesel injector nozzles at different fuel temperatures. Exp. Fluids 2020, 61, 185. [Google Scholar] [CrossRef]
  20. Balz, R.; Nagy, I.G.; Weisser, G.; Sedarsky, D. Experimental and numerical investigation of cavitation in marine Diesel injectors. Int. J. Heat Mass Transf. 2021, 169, 120933. [Google Scholar] [CrossRef]
  21. Yu, W.; Yang, W.; Zhao, F. Investigation of internal nozzle flow, spray and combustion characteristics fueled with diesel, gasoline and wide distillation fuel (WDF) based on a piezoelectric injector and a direct injection compression ignition engine. Appl. Therm. Eng. 2017, 114, 905–920. [Google Scholar] [CrossRef]
  22. Torelli, R.; Som, S.; Pei, Y.; Zhang, Y.; Traver, M. Influence of fuel properties on internal nozzle flow development in a multi-hole diesel injector. Fuel 2017, 204, 171–184. [Google Scholar] [CrossRef]
  23. Jiang, G.; Zhang, Y.; Wen, H.; Xiao, G. Study of the generated density of cavitation inside diesel nozzle using different fuels and nozzles. Energy Convers. Manag. 2015, 103, 208–217. [Google Scholar] [CrossRef]
  24. Kevorkijan, L.; Palomar-Torres, A.; Torres-Jiménez, E.; Mata, C.; Biluš, I.; Lešnik, L. Obtaining the Synthetic Fuels from Waste Plastic and Their Effect on Cavitation Formation in a Common-Rail Diesel Injector. Sustainability 2023, 15, 15380. [Google Scholar] [CrossRef]
  25. Lešnik, L.; Palomar-Torres, A.; Torres-Jiménez, E.; Mata, C.; Volmajer Valh, J.; Kevorkijan, L.; Biluš, I. The effect of HDPE and LDPE pyrolytic oils on cavitation formation in a common-rail diesel injector. Fuel 2022, 330, 125581. [Google Scholar] [CrossRef]
  26. Fortes Patella, R.; Reboud, J.-L. A Phenomenological and Numerical Model for Scaling the Flow Agressiveness in Cavitation Erosion. In EROCAV Work. 2004. Available online: https://repository.tudelft.nl/islandora/object/uuid%3Acf841677-f923-4cef-9284-59b55bdf92d4 (accessed on 4 March 2024).
  27. Leclercq, C.; Archer, A.; Fortes-Patella, R.; Cerru, F. Numerical cavitation intensity on a hydrofoil for 3D homogeneous unsteady viscous flows. Int. J. Fluid Mach. Syst. 2017, 10, 254–263. [Google Scholar] [CrossRef]
  28. Schenke, S.; Melissaris, T.; Van Terwisga, T.J.C. On the relevance of kinematics for cavitation implosion loads. Phys. Fluids 2019, 31, 052102. [Google Scholar] [CrossRef]
  29. Melissaris, T.; Schenke, S.; Bulten, N.; van Terwisga, T.J.C. On the accuracy of predicting cavitation impact loads on marine propellers. Wear 2020, 456–457, 203393. [Google Scholar] [CrossRef]
  30. Arabnejad, M.H.; Svennberg, U.; Bensow, R.E. Numerical assessment of cavitation erosion risk using incompressible simulation of cavitating flows. Wear 2021, 464–465, 203529. [Google Scholar] [CrossRef]
  31. Gomez Santos, E.; Shi, J.; Venkatasubramanian, R.; Hoffmann, G.; Gavaises, M.; Bauer, W. Modelling and prediction of cavitation erosion in GDi injectors operated with E100 fuel. Fuel 2021, 289, 119923. [Google Scholar] [CrossRef]
  32. Finne, I. Erosion of surfaces. Wear 1960, 3, 87–103. [Google Scholar] [CrossRef]
  33. Ahler, K.R. Effects of Particle Impingement Angle and Surface Wetting on Solid Particle Erosion of AISI 1018 Steel. Ph.D. Thesis, University of Tulsa, Tulsa, OK, USA, 1994. [Google Scholar]
  34. Oka, Y.I.; Okamura, K.; Yoshida, T. Practical estimation of erosion damage caused by solid particle impact: Part 1: Effects of impact parameters on a predictive equation. Wear 2005, 259, 95–101. [Google Scholar] [CrossRef]
  35. Oka, Y.I.; Yoshida, T. Practical estimation of erosion damage caused by solid particle impact: Part 2: Mechanical properties of materials directly associated with erosion damage. Wear 2005, 259, 102–109. [Google Scholar] [CrossRef]
  36. Peng, W.; Cao, X. Numerical simulation of solid particle erosion in pipe bends for liquid-solid flow. Powder Technol. 2016, 294, 266–279. [Google Scholar] [CrossRef]
  37. McLaury, B.S.; Shirazi, S.A.; Shadley, J.R.; Rybick, E. Modeling Erosion in Chokes. In Proceedings of the ASME Fluids Engineering Division Summer Meeting, San Diego, CA, USA, 7–11 July 1966; pp. 773–782. [Google Scholar]
  38. Schwarz, P.; Blume, M.; Weiß, L.; Wensing, M.; Skoda, R. 3D simulation of a ballistic direct injection cycle for the assessment of fuel property effects on cavitating injector internal flow dynamics and primary breakup. Fuel 2022, 308, 121775. [Google Scholar] [CrossRef]
  39. Lešnik, L.; Kegl, B.; Torres-Jiménez, E.; Cruz-Peragón, F.; Mata, C.; Biluš, I. Effect of the in-cylinder back pressure on the injection process and fuel flow characteristics in a common-rail diesel injector using gtl fuel. Energies 2021, 14, 452. [Google Scholar] [CrossRef]
  40. ANSYS Inc. Ansys Fluent Theory Guide; ANSYS Inc.: Canonsburg, PA, USA, 2021; pp. 724–746. [Google Scholar]
  41. Shih, T.-H.; Liou, W.W.; Shabbir, A.; Yang, Z.; Zhu, J. A new k-ϵ eddy viscosity model for high reynolds number turbulent flows. Comput. Fluids 1995, 24, 227–238. [Google Scholar] [CrossRef]
  42. Kumar, A. Investigation of in-nozzle flow characteristics of fuel injectors of ic engines. Ph.D. Thesis, University of London, London, UK, 2017. [Google Scholar]
  43. Launder, B.E.; Shima, N. Second-moment closure for the near-wall sublayer: Development and application. AIAA J. 1989, 27, 1319–1325. [Google Scholar] [CrossRef]
  44. Zwart, P.J.; Gerber, A.G.; Belamri, T. A two-phase flow model for predicting cavitation dynamics. In Proceedings of the 5th International Conference on Multiphase Flow, Yokohama, Japan, 30 May 30–3 June 2004. Paper No. 152. [Google Scholar]
  45. Morsi, S.A.; Alexander, A.J. An investigation of particle trajectories in two-phase flow systems. J. Fluid Mech. 1972, 55, 193–208. [Google Scholar] [CrossRef]
  46. Grant, G.; Tabakoff, W. Erosion prediction in turbomachinery resulting from environmental solid particles. J. Aircr. 1975, 12, 471–478. [Google Scholar] [CrossRef]
Figure 1. Experimental set-up for the pyrolysis process.
Sustainability 16 05074 g001
Figure 2. Injector nozzle model: (a) three-dimensional CAD model of geometry under consideration in numerical simulations; (b) mesh in the midline cross-section; (c) detailed view of the mesh at the minimum distance between the injector needle and the body.
Sustainability 16 05074 g002
Figure 3. Needle lift and needle velocity.
Sustainability 16 05074 g003
Figure 4. Results regarding cavitation in an injection hole (iso-surface of 20% vapor volume fraction) for a particle number density of 1 × e6 m−3.
Sustainability 16 05074 g004
Figure 5. Results regarding cavitation in an injection hole (iso-surface of 20% vapor volume fraction) for a particle number density of 1 × e7 m−3.
Sustainability 16 05074 g005
Figure 6. Cavitation erosion prediction results—contours of ERI.
Sustainability 16 05074 g006
Figure 7. Normalized cavitation erosion values.
Sustainability 16 05074 g007
Figure 8. Abrasion prediction results—erosion rate contours.
Sustainability 16 05074 g008
Figure 9. Normalized values of abrasion.
Sustainability 16 05074 g009
Table 1. Fuel properties used in the simulations.
Fuel PropertiesD2HDPELDPE
Density at 15 °C [kg/m3]830788.4787.4
Surface tension [mN/m]26.826.225.7
Kin. Viscosity [mm2/s]2.142.081.96
Table 2. Overview of the models used.
Physical PhenomenaModel UsedAssumption/Limitation
Multiphase flowMixtureAssumed equal pressure and velocity between the phases.
TurbulenceURANS realizable k–εAssumed fully turbulent flow and isotropic and homogeneous turbulence.
CavitationZwart–Gerber–BelamriAssumed simplified bubble dynamics (surface tension, viscosity, and non-condensable gas, and second-order effects are neglected) and homogeneous liquid–vapor mixture consisting of bubbles that have the same size.
Cavitation erosionERI Only the collapse stage of vapor in direct contact with the wall (first cell layer) is considered to be erosive.
Particle motionDiscrete phase methodAssumed no interaction between particles, which are assumed to be point particles.
Particle abrasionMcLaury modelEmpirical model, limited to sand particles in water flow.
Table 3. McLaury coefficient values [37].
CoefficientValue
A 1.997 · 10 7
a 13.3
b 7.85
x 1.09
y 0.125
z Calculated such that α 0 = 15 °
w 1.0
α 0 15 °
Disclaimer/Publisher’s Note: The statements, opinions and data contained in all publications are solely those of the individual author(s) and contributor(s) and not of MDPI and/or the editor(s). MDPI and/or the editor(s) disclaim responsibility for any injury to people or property resulting from any ideas, methods, instructions or products referred to in the content.

