Article

Interrelationships between Urbanization and Ecosystem Services in the Urban Agglomeration around Poyang Lake and Its Zoning Management at an Integrated Multi-Scale

College of Land Resources and Environment, Jiangxi Agricultural University, Nanchang 330045, China
*
Authors to whom correspondence should be addressed.
Sustainability 2024, 16(12), 5128; https://doi.org/10.3390/su16125128
Submission received: 29 April 2024 / Revised: 30 May 2024 / Accepted: 31 May 2024 / Published: 16 June 2024
(This article belongs to the Section Social Ecology and Sustainability)

Abstract

:
The detrimental effects of accelerated urbanization on ecosystem services underscore the necessity of investigating the interactive coercion between the two. This paper employs multi-source data to analyze the urbanization subsystems and modified equivalent factors in order to calculate the urbanization level (UL) and ecosystem service value (ESV) of the Poyang Lake urban agglomeration (PYLUA) from 2005 to 2020 at the administrative, watershed, and grid scales. Bivariate spatial autocorrelation, multi-scale geographically weighted regression (MGWR), and others are applied to explore the interrelationships and impact effects between the two and to conduct zoning management studies. The results indicate that (1) the UL has significantly increased from 2005 to 2020, with a marginal expansion in its spatial distribution, while the ESV shows a generally smooth trend, with high-value and low-value areas present around Poyang Lake and in the metropolitan area, respectively; (2) the UL and ESV are negatively correlated at all the scales, and this negative effect has increased significantly over time; (3) in the OLS model, only land urbanization and population urbanization negatively affect the ESV at the 1% level of significance, while in the MGWR, all the urbanization subsystems negatively affect the ESV at the 1% level of significance and have their own optimal scales; and (4) the UL and ESV are interrelated and divide the PYLUA into five zones: Coordinated Development Zone, Co-Loss Zone, Development Lag Zone, Ecological Loss Zone and Development Potential Zone. These zones identify areas where negative effects are more pronounced and propose corresponding management strategies for each subzone. These results can serve as a foundation for coordinating regional urbanization and preserving the environment.

1. Introduction

As the scholar Chuanglin Fang indicates [1], mainland China’s urbanization process has been extensive over the past 40 years. Since China’s reform and opening up in 1978, the urbanization rate has grown significantly, reaching 63.89% in 2020, and the urban population has experienced substantial growth, expanding from 170 million to 900 million. Moreover, as Wu et al. [2] note, a 20-fold increase in the urban built-up area (BUA) has also occurred, and urban economies have grown more than 10% annually on average. When diving into the complexity of China’s urbanization process, as Chen et al. note [3], it is not a one-dimensional development but rather a profound transition encompassing a wide variety of demographic, geographical, and economic factors. The rapid development of urban areas, as Navarro et al. indicate [4], facilitates the movement of regional production factors, upgrades the material level and industrial structure, enhances the economy and infrastructure, and provides people with improved economic conditions and material well-being. However, in the process of urban expansion and excessive economic growth, land-use patterns and ecosystem functions have been negatively affected [2,5,6], resulting in significant damage to regional ecosystems and an increase in ecological risks [7,8]. Therefore, examining the coordination and interaction mechanisms between urbanization and ecosystems is crucial [9,10]. Based on this research, risk management and policy formulation can be carried out in a time- and place-specific manner. This is of critical importance for the sustainable growth of the region [11], the establishment of an eco-civilized society, and the enhancement of human well-being [12,13].
The different forms of well-being that ecosystems either directly or indirectly offer to humans are referred to as ecosystem services [14,15], and the strength of their capacity represents the health or otherwise of regional ecosystems [16], which are categorized into four types of services—namely, provisioning, regulating, supporting, and cultural—in mainstream academia [17,18,19]. Currently, the principal methodologies for evaluating ecosystem services encompass energy-value analysis [20], value-quantity assessment [21], and physical-quantity assessment [22]. Physical-quantity assessment is based on the ecological model used to quantify ecosystem processes and functions, but it cannot directly obtain the total value of various types of ecosystems. For example, Xue et al. [23] used it to assess the ecological service function of the Fenhe watershed. Value-quantity assessment is represented by the equivalent factor table of the terrestrial ecosystem service value in China by Xie et al. [24,25], which has comprehensive coverage and relatively objective results, making it widely used, such as the studies by Quan et al. [26]. Numerous scholars have adapted and improved the equivalent factor method (EFM) to suit local conditions; for example, Wen et al. [27] and Wei et al. [28], respectively, corrected the Poyang Lake area. Within the framework of a novel form of urbanization where people coexist peacefully with the environment [29], the relationship between urbanization and ecosystem services is a topic of current interest; for example, Tu et al. [30] analyzed the coupled coordination and spatio-temporal heterogeneity of the two in the Yangtze River Economic Zone in China. Domestic and international scholars have broadly outlined the measurement of urbanization as a single indicator strategy centered on the urbanization rate [31], an urban expansion index based on land-use change [32,33], a comprehensive indicator system integrating demographic, social and economic indicators [34,35], incorporating evening lighting data from multivariate remote sensing [36,37], etc. At the methodological level, scholars have widely used the PSR model [38], gray correlation model [39], correlation analysis [10,40], Kuznets curve model [41], spatial autocorrelation model [10,42], coupled coordination model [43,44], and spatial metrics model [45,46] to analyze the interrelationships between urbanization and ecosystem services. At the scale level, it includes the whole country [39,47], provinces [48], urban agglomerations [2,32,38], cities and counties [9,44,46], watersheds [42,49,50], etc. As Chen et al. point out [51], the regional scale is the focus of the research to explore the spatial and temporal evolution characteristics, change direction and scale, interactive coupling relationship, the interactive coupling mode of the two [52,53], etc.
In general, the existing studies have achieved a lot [54], but as Hasan et al. [6] and Wang et al. [55] note, there are still some limitations. Firstly, in terms of the study area, most of the studies focus on highly developed urban areas [2,45,56], and there is not enough research on ecologically fragile and sensitive areas as well as those with development potential. Secondly, as for research methods, as Yang et al. [10] point out, discussions of urbanization and ecosystem services have mostly focused on a single urbanization or a few ecosystem services, with the overall interactions between the two parties remaining poorly articulated. Thirdly, with regard to the research scale, existing studies are seldom conducted using a multi-scale approach, and there is insufficient exploration of the scale transformations, scale effects and optimal scales. Fourthly, in the application of research, most of the studies concentrate on the interactive relationship between the two, with a paucity of contributions to the zoning management and policy formulation of the region in accordance with the time and place at the practical level.
The Poyang Lake area is essential to ecological preservation and agricultural development since it is the center of influence for China’s largest freshwater lake [57]. Rapid urbanization, a high concentration of land use, a diversity of biological functions, and environmental sensitivity are its defining characteristics. These traits have a direct bearing on the socioeconomic well-being of the Great Lakes area and are crucial to the preservation of the global and Yangtze River Basin ecosystems. Based on the deficiencies in existing studies and the extreme importance of the Poyang Lake area, this study starts from the three dimensions of land, population, and economy [2,10,58], and it then focuses on six prefecture-level cities situated around Poyang Lake. The specific research objectives are: (1) to analyze the spatial and temporal characteristics of the urbanization level (UL) and ecosystem service value (ESV) in the urban agglomeration around Poyang Lake (PYLUA) from 2005 to 2020; (2) to reveal the spatial interaction relationship between the UL and ESV over the past 15 years at an integrated multi-scale; (3) to explore the effects of urbanization subsystems on the ESV at optimal scales; and (4) to reveal the spatial relationship and impact effects of the whole system of urbanization and the ESV and then implement localized sub-regional control in order to propose targeted recommendations. The overarching objective is to assist policymakers in elucidating the mechanisms by which urbanization interacts with ecosystem services, propose a variety of sensible countermeasures and applications, and lay the groundwork for coordinating the ecological environment and urbanization of the PYLUA while advancing regional sustainable development.

2. Materials and Methods

2.1. Study Area

The urban agglomeration around Poyang Lake (PYLUA) comprises six cities surrounding China’s largest freshwater lake—namely, Nanchang (NC), Jiujiang (JJ), Jingdezhen (JDZ), Shangrao (SR), Fuzhou (FZ), and Yingtan (YT). The area is mainly composed of plains, with a dense water network and numerous lakes (Figure 1). The PYLUA is one of the urban agglomerations located in the middle reaches of the Yangtze River. As the most developed region in the underdeveloped Jiangxi Province, the PYLUA is an essential component of the national development strategy known as the ‘Rise of Central China’. The Poyang Lake region is an essential ecological function reserve in China, with endowments to facilitate the integrated advancement of ecology and the economy. However, the haphazard development of urbanization has damaged the ecological environment. Urgent action is needed to upgrade the quality of urban development and improve the regional ecological environment through locally adapted, zoned, and categorized management measures, as well as controlling the spatial land use.

2.2. Data Sources and Processing

The research data include natural attribute data and socioeconomic data.
Among the natural attribute data, NDVI data and DEM data were obtained from the Geospatial Data Cloud Platform (https://www.gscloud.cn/, accessed on 22 November 2023). The NPP data utilized to revise the value coefficients of ecosystem services and measure the average vegetation index were crawled from Google Earth Engine (GEE) (https://developers.google.cn/earth-engine/, accessed on 22 November 2023). Land-use data at five-time nodes in 2000, 2005, 2010, 2015, and 2020 were downloaded from the Geospatial Data Cloud Platform (http://www.gscloud.cn/, accessed on 17 May 2022) with a resolution of 30 m. The data underwent various processing steps, including radiometric and atmospheric correction, geometric correction, image cropping, and classification. Ultimately, accuracy verification was performed to make sure the data were accurate and reliable. The confusion matrix was used to calculate the overall classification accuracy and Kappa coefficient of the remote-sensing images, with Google Earth’s high-resolution image data serving as a reference. The study area’s five phases yielded remote-sensing photos with an overall accuracy of over 85%, which met the research requirements.
Socioeconomic data were collected from various sources. Population density data were used to measure the population urbanization, and per capita GDP data were utilized to measure the economic urbanization and corrected ecosystem service value coefficients, all obtained from the Resource and Environmental Science Data Center of the Chinese Academy of Sciences Platform (https://www.resdc.cn/, accessed on 22 November 2023). The road traffic data utilized to measure the mileage of main roads were obtained from the OpenStreetMap (OSM) open-source platform (https://www.openstreetmap.org/, accessed on 22 November 2023). The data on agricultural product prices, yields, and sown areas of crops for rice, corn, and soybeans, the major food crops in the study area, were obtained from the Jiangxi Provincial Statistical Yearbook for all the years and from the Compendium of Agricultural Product Price and Yield Data for the previous years. For the possible inaccuracies in the socioeconomic data, this study also used the county statistical yearbooks of Jiangxi Province in the past years for verification (http://tjj.jiangxi.gov.cn/col/col38595/index.html, accessed on 16 January 2024).
In order to facilitate spatial data processing, the various types of raster data were unified in a projection coordinate system as WGS_1984_Alberts, and the spatial resolution was unified as 30 m × 30 m.

2.3. Methodological Framework

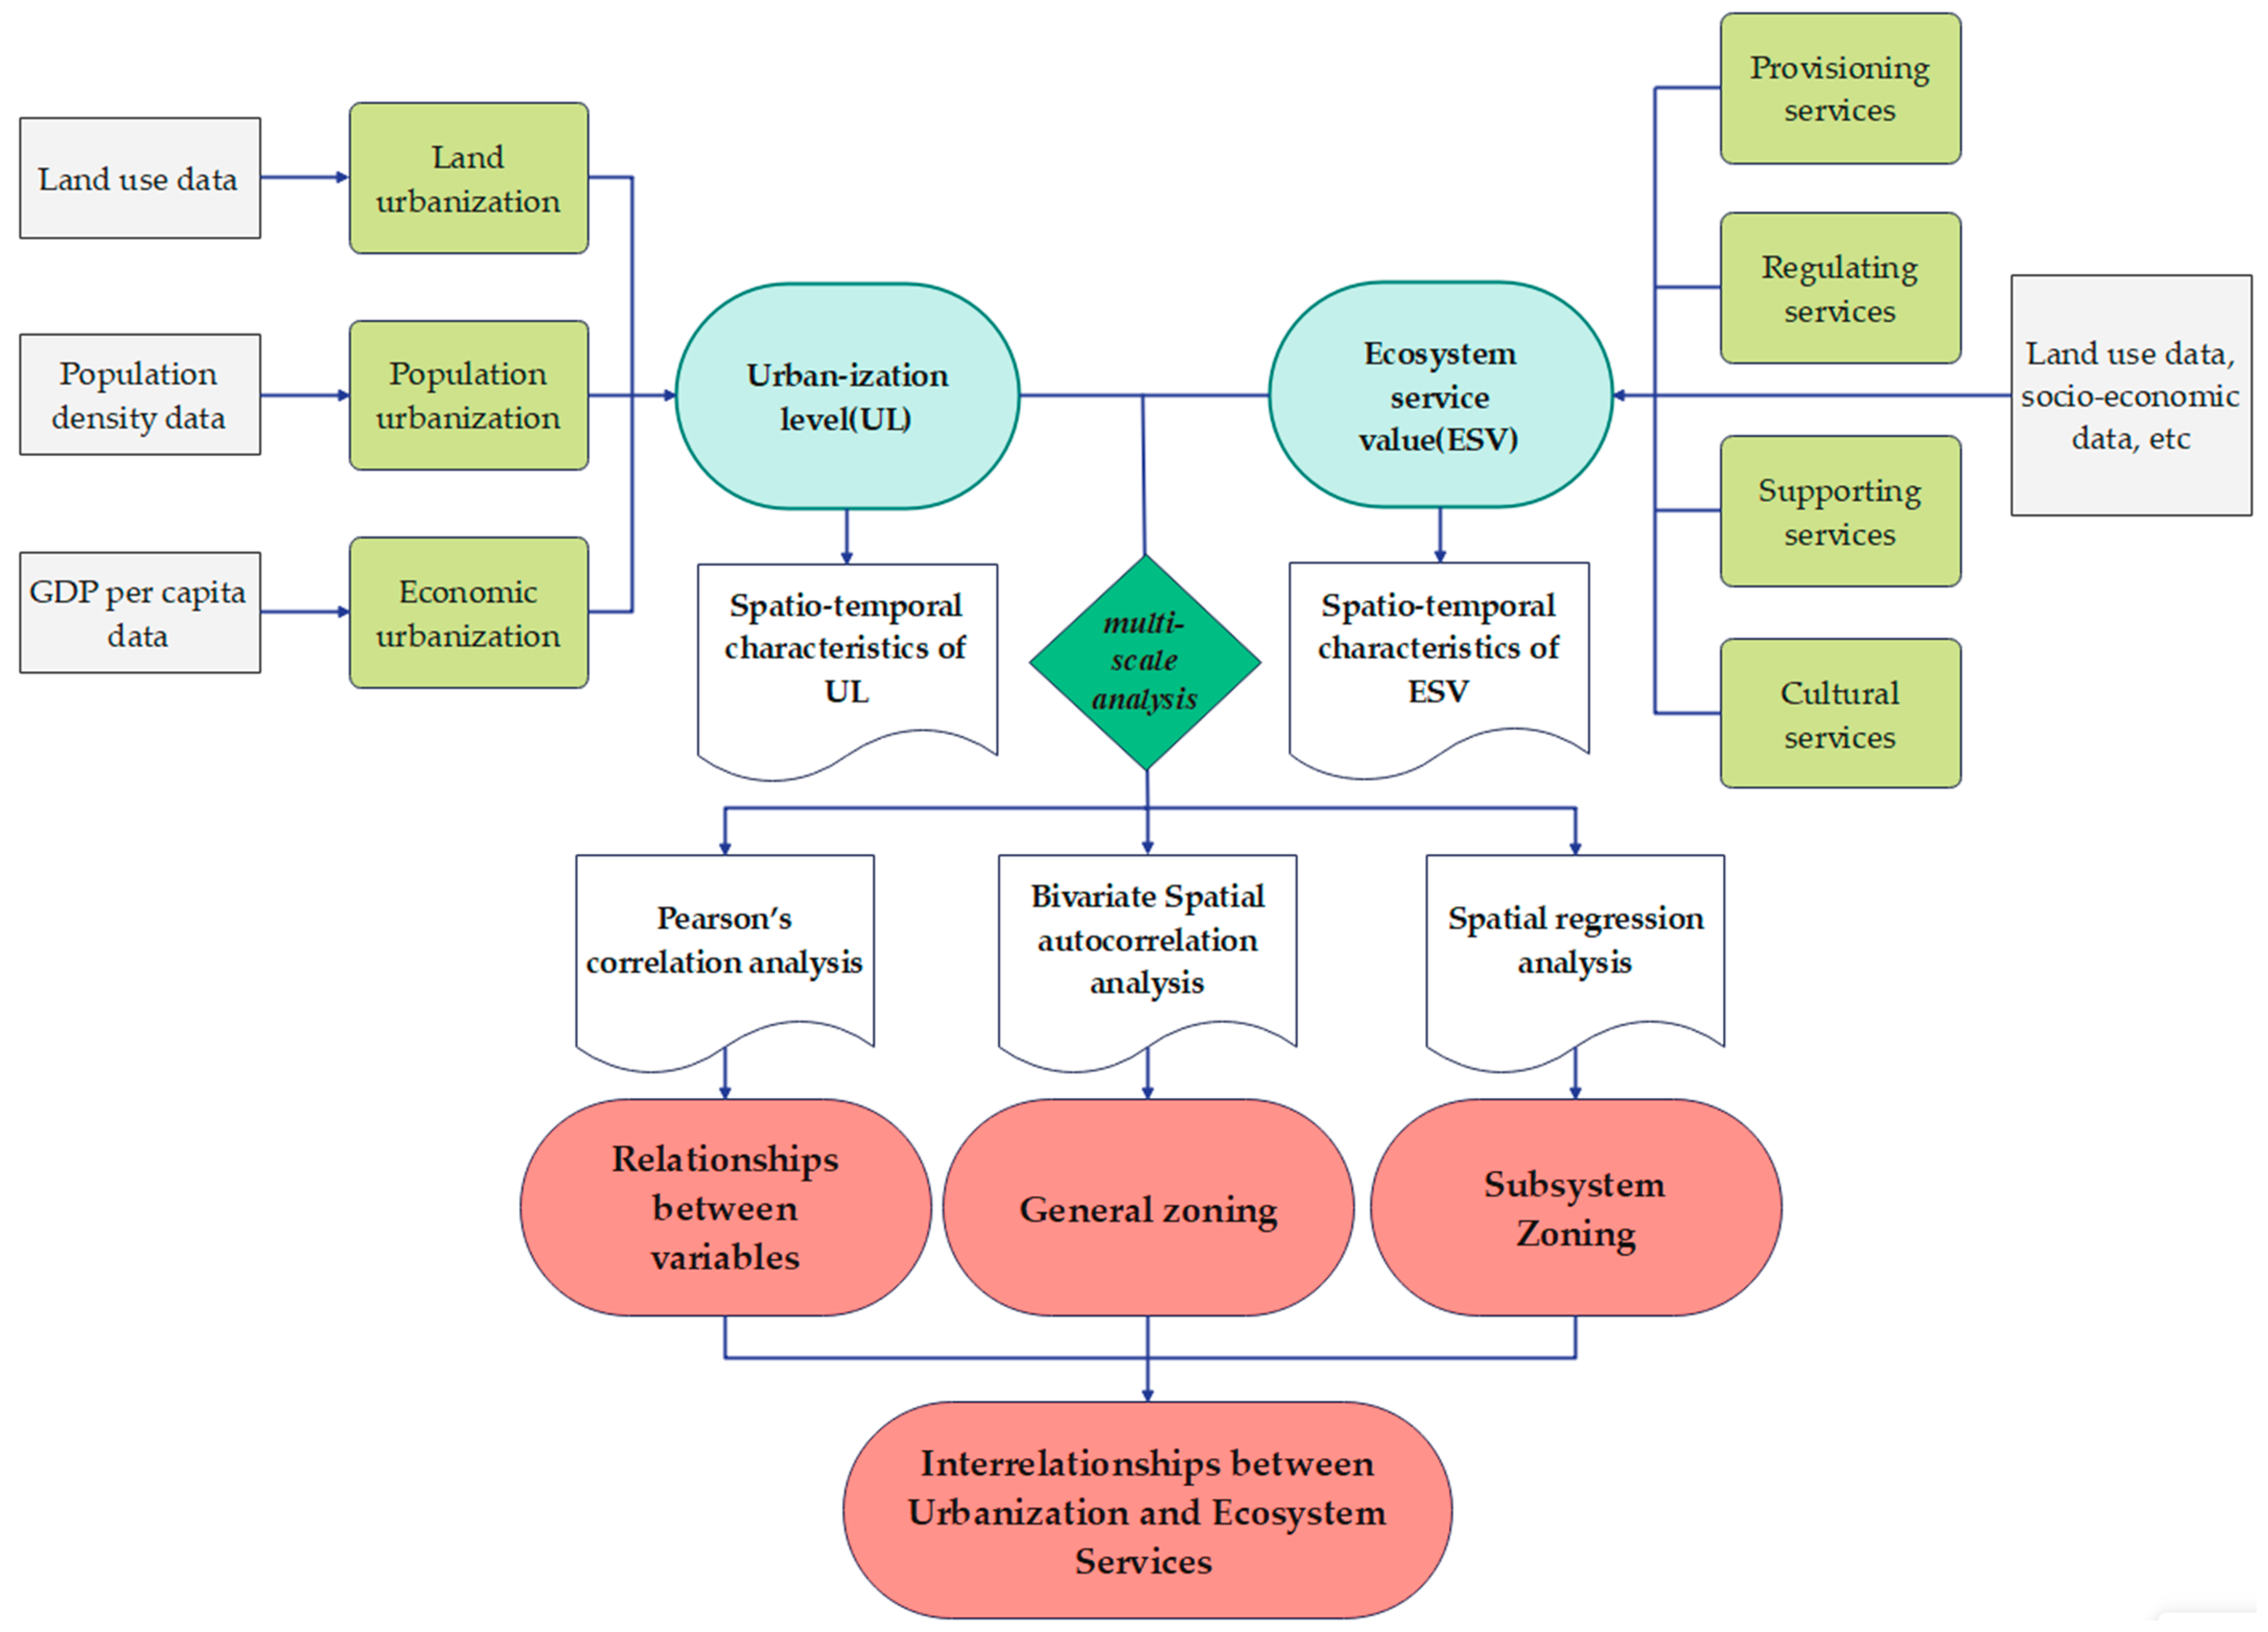
Figure 2 displays the broad framework and technical flow of this paper, including the data processing and method utilization. The spatial and temporal evolution characteristics of urbanization and the ESV were analyzed using multi-source data. This involved the use of correlation analysis, bivariate spatial autocorrelation analysis, and multi-scale weighted regression analysis to investigate the interrelationships between urbanization and the ESV at an integrated multi-scale.

2.3.1. Measurement of Urbanization Level

From the perspective of multi-dimensional urbanization, this study comprehensively measures the urbanization development level of the PYLUA by analyzing the subsystem of urbanization, which mainly includes the three dimensions of land, population, and economy [2,10,58]. The population density variation (POPDV) index was employed to express the population urbanization, while the GDP density variation (GDPDV) index was utilized to express the economic urbanization. Finally, the construction land expansion rate (CER) index was employed to express the land urbanization. The level of urbanization (UL) of the PYLUA was expressed as the combined value of the spatially normalized population density variation, GDP density variation, and construction land expansion rate.
C E R = C i j C i 1 j S i j × 100
where C i j   is the area of construction land to be built in unit j, phase i; C i 1 j   is the area of construction land in unit j, phase (i − 1); and S i j is the total area of land use in phase i of unit j. This study uses a five-year phase.
U i j = U i j U i j , m i n U i j , m a x U i j , m i n
U L = i = 1 3 U i j × W i
where U i j   is the standardized value in unit j of the ith urbanization subsystem; U i j   i s the value in unit j of the ith urbanization subsystem; U i j , m i n is the minimum value in unit j of the ith urbanization subsystem; U i j , m a x   i s the maximum value in unit j of the ith urbanization subsystem; and W i is the weight of the urbanization subsystem, which is set to 1/3 in this study.

2.3.2. Ecosystem Service Value

This study was based on the EFM per unit area proposed by Costanza et al. [18] and Xie et al. [24,25], where the per unit equivalent value refers to the monetary value of the average annual grain yield of 1 hm2 of cultivated land [59], and combining it with the actual production capacity of the PYLUA. In this study, the grain yield correction method was used and revised by applying the socioeconomic conditions and the NPP of the PYLUA [15,28]. According to the actual conditions of the PYLUA, the main grain crops were identified as rice, corn, and soybean, and the benchmark was adjusted to reflect the average grain yield of cultivated land in the PYLUA rather than the national average. It was assumed that the true worth of the grain yield was seven times greater than the economic value provided by natural ecosystems without human inputs. Based on the average values of production, the sown area of major grain crops in Jiangxi Province from 2005 to 2020, and the purchase price of major grain crops in Jiangxi Province in 2020, we finally arrived at the amount of the monetary value of per unit equivalent factor in the PYLUA as 2404.25 CNY/(hm2·a).
E S V = i = 1 n S i × C i
C = a × b × 1 7 × d
d = N P P N P P c n × G D P G D P c n
where S i   is the area of land-use type i (hm2); C i   is the value coefficient of ecosystem services per unit area of land-use type i (CNY/hm2·a); a is the production of major food crops; b is the average price of agricultural commodities; d is the correction coefficient; N P P a n d   G D P   are the mean value of the NPP and GDP in the PYLUA; and N P P c n   a n d   G D P c n are the NPP and GDP for the whole country.
The six land-use types identified through remote sensing were associated with six types of ecosystem services: farmland, forest, grassland, wetland, water, and desert. These were compared with the results of geographically similar research areas in the study area [27,28], and the value coefficient of the ecosystem services of the various land-use types differed by 5% or less, which indicated that the results obtained in this study were more reasonable and scientific. The corrected value coefficients of the ecosystem services per unit area of each land-use type in the PYLUA are shown in Table 1.

2.3.3. Correlation Analysis

Within the data analysis framework, correlation analysis is a method of in-depth exploration of two or more variable elements. This type of analysis aims to accurately assess the closeness of the correlation between these variables. It is worth noting that some form of association or statistical likelihood must exist between these variables for a valid correlation analysis to be conducted. In order to better explain the potential association between urbanization and the ESV, this study first used Pearson’s correlation analysis to explore the interrelationships between the two, as Pearson’s correlation analysis method can better explain continuous data variables compared to other correlation analysis methods.

2.3.4. Spatial Autocorrelation Analysis

To clarify the spatial relationship between the UL and ESV, bivariate spatial autocorrelation was applied in the analysis, and the spatial relationship was represented by calculating the bivariate Global Moran’s I and plotting the bivariate Local Moran’s I. The value of the Moran’s index ranges from −1 to 1. Negative values indicate that the trends of the ESV in the focal area and the UL of the surrounding areas show opposite characteristics, while positive values indicate that the trends of the ESV in the focal area and the UL of the surrounding areas show similar characteristics, and the closer the absolute value is to 1, the more significant the relationship is in the spatial context. When the Moran’s I converges to 0, it indicates that the relationship between them is randomly distributed in the spatial context. According to the bivariate Local Moran’s I, in the calculation results, High–High (H-H) represents high urbanization and high ecosystem service functional areas, High–Low (H-L) represents high urbanization and low ecosystem service functional areas, Low–Low (L-L) represents low urbanization and low ecosystem service functional areas, and Low–High (L-H) represents low urbanization and high ecosystem service functional areas [42]. The calculations were performed using GeoDa 1.20 software, and the geographic weight matrix used was based on the first-order queen or rook contiguity. The formulas [60,61,62,63] are as follows:
I x y = i j w i j ( x j x ¯ ) j w i j ( y j y ¯ ) i x i x ¯ 2 i y i y ¯ 2
I x y = n i w i j ( x j x ¯ ) i w i j ( y j y ¯ ) i x i x ¯ 2 i y i y ¯ 2
where I x y is the bivariate Global Moran’s I; I x y is the bivariate Local Moran’s I; x i is the observation value of x variable on space unit i; y i is the observation value of y variable on space unit j; n is the total number of zones; w i j is spatial weighting; and x ¯ and y ¯ are the averages of the observations of the x and y variables.

2.3.5. Scale Selection Analysis

Through many experiments, the bivariate Moran’s index of the UL and ESV at different grid scales was calculated, with the granularity ranging from 1 km × 1 km to 13 km × 13 km. The closer the Moran’s index is to 0, the weaker the spatial autocorrelation, and the closer the absolute value of Moran’s index is to 1, the higher the spatial agglomeration and the more obvious the spatial differentiation. The construction of the weight matrix includes the queen contiguity and rook contiguity. Given that the relationship between urbanization and ecosystem services is negatively correlated in the trend [10,42,47], it can be concluded that the smaller the bivariate Moran’s index, the stronger the correlation between them, the more pronounced the spatial differentiation, and the stronger the explanation for this study. Consequently, the smallest bivariate Moran’s index in each period was the optimal grid scale in this study. As shown in Figure 3, the optimal grid scale in 2005 was 3 km × 3 km, and that in 2020 was 7 km × 7 km, and adopting these scales for the study maximized the demonstration of the differentiation characteristics of the data at the spatial scale.

2.3.6. Spatial Regression Analysis

The assumption of traditional ordinary least squares (OLS) is that the errors are random and the model residuals are irrelevant, but the relationship between spatial data always has spatial heterogeneity and spatial autocorrelation, which violates the use principle of the OLS model. Using the geographically weighted regression (GWR) model from a global perspective, the influence between things according to the distance between the weight, in line with the first law of geography, is a local linear regression method based on the modeling of spatially varying relationships, which can be a good explanation of the local spatial relationship of the variables and spatial heterogeneity. The modeling is more accurate and is a common choice for spatial regression analysis.
Multi-scale geographically weighted regression (MGWR) [47] is an improved method that relies on GWR, which further considers the spatial scale differences of various spatial factors. The main content of the improvement is the neighborhood range of the target element when constructing the local linear regression model, which is also called ‘bandwidth’. This paper explores the spatial relationships and impact effects of the three subsystems of urbanization and the ESV at different scales through MGWR analysis. The general expression formula is as follows:
G i = β 0 x i , y i + k = 1 m β k x i , y i v i k , b + ε i
where G i is the value of the dependent variable at position i; k = 1 m v i k , b is the value of the independent variable at position i when the bandwidth value is b; x i , y i is the coordinate of the regression analysis point; β 0 x i , y i is intercept term; β k x i , y i is for regression analysis coefficient; and ε i is a random error term.
The control variables for this analysis were determined by referring to relevant papers [64,65,66] based on the availability and comprehensiveness of the data, and the selected indicators included the mileage of main roads per unit area (C1), the average elevation per unit area (C2), the average vegetation index per unit area (C3), the average net primary productivity per unit area (C4), and the geological disaster level (C5).

3. Results

3.1. Spatial-Temporal Evolution of Urbanization

By analyzing the urbanization in the three different dimensions of land, population, and economy, the comprehensive urbanization level value (between 0 and 1) of the PYLUA was obtained (Figure 4). From the time dimension, the UL has shown an increasing upward trend from year to year over the past 15 years, and the fastest increase was recorded in the period 2005–2010. From the perspective of spatial differentiation, it spreads outward to the surrounding areas, showing the characteristics of marginal expansion. The high-value areas of the UL are primarily situated in the central urban area of Nanchang. Additionally, the main urban areas of Xunyang District, Lianxi District, Zhushan District, Changjiang District, Xinzhou District, Yuehu District, and Linchuan District, among other prefectural-level municipalities, have higher UL values compared to the surrounding areas. From the perspective of the urbanization subsystem, the spillover effect of land urbanization is evident. There has been a shift from single-point expansion to multi-point expansion, a steady increase in population density, and a trend of spreading to the periphery. Additionally, there has been a significant reduction in the disparity in economic growth between regions.

3.2. Temporal and Spatial Changes in the ESV

The ecosystem service value (ESV) of the PYLUA was measured based on the monetary value of the ecosystem services (Table 2). From the perspective of temporal evolution, the highest value of the ESV in the PYLUA increased from CNY 76.7 billion in 2005 to CNY 78.6 billion in 2020, with a peak around 2010. The ESV levels were categorized into four classes by the natural breakpoint method—namely, very high, high, medium, and low—which generally maintained a smooth trend over the past 15 years (Figure 5e). From the perspective of the spatial distribution, the high-value areas are mainly situated in Poyang County, Duchang County, and Yongxiu County, where the Poyang Lake system is located, and the ESVs of Yugean County, Xinjian District, Lushan City, Nanchang County, Wuning County and Xiushui County, which are the counties around the Poyang Lake system, are also higher than those of the neighboring areas. The low-value areas are primarily located in urbanized regions where the land designated for construction is intensively developed (Figure 5a–d).

3.3. Results of Correlation Analysis

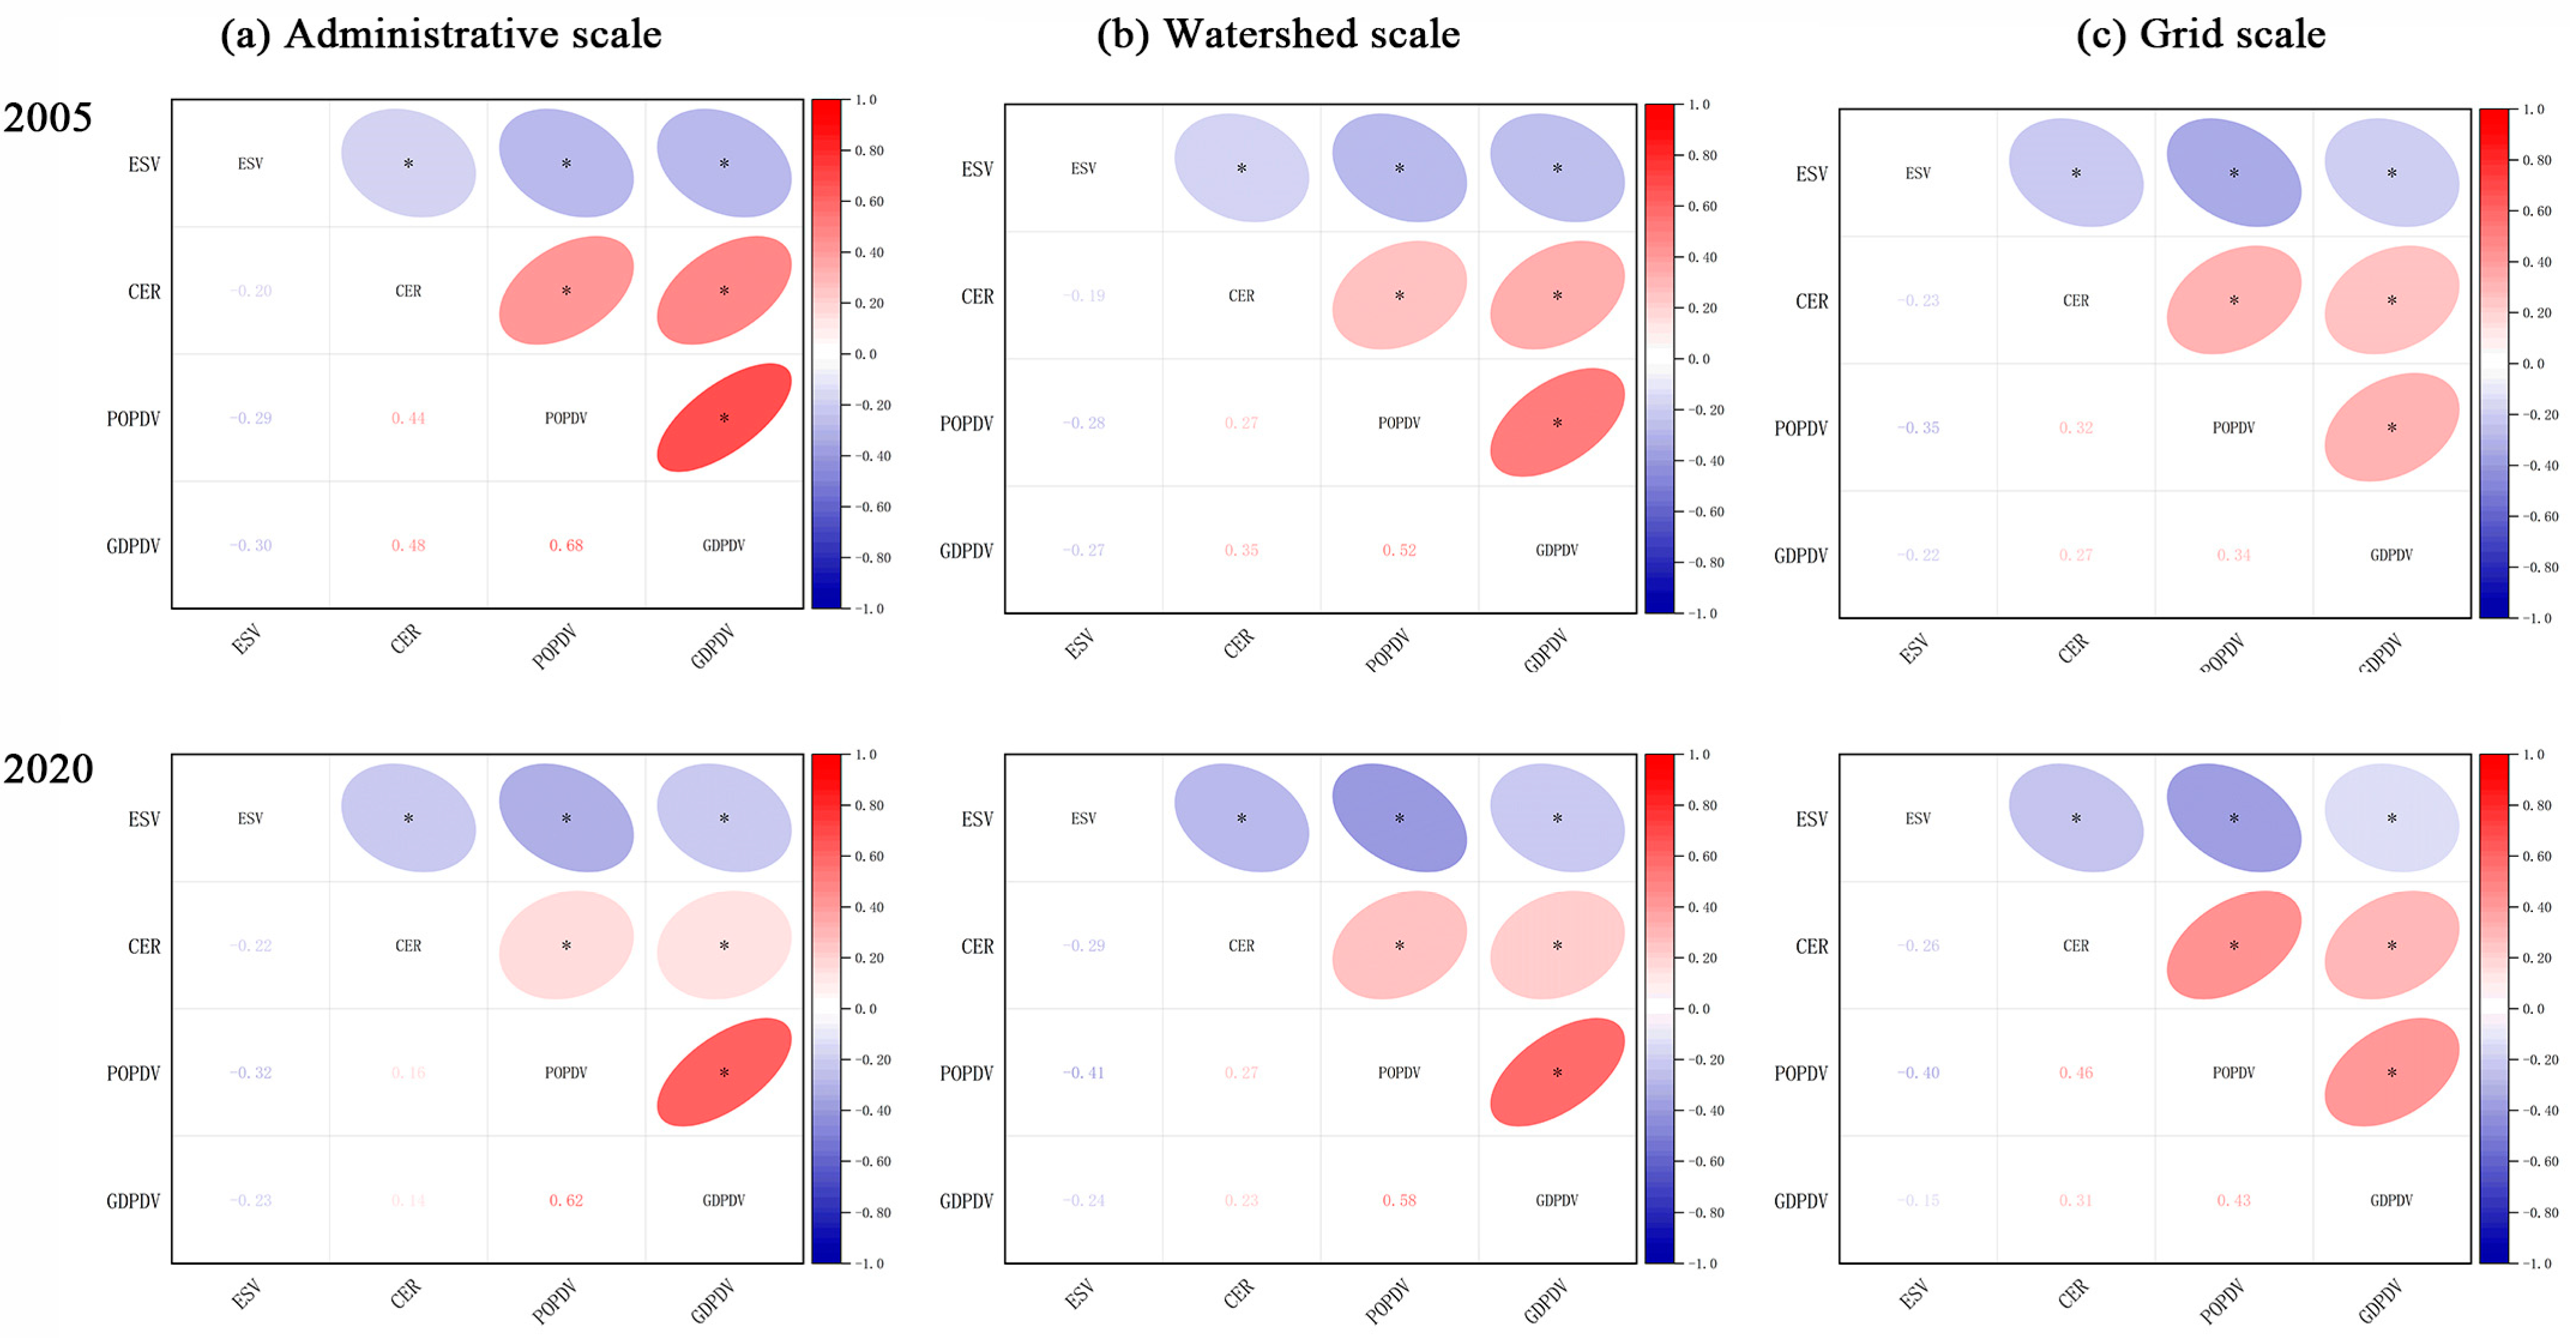
Pearson’s correlation analysis was used to explore the interrelationships between the urbanization subsystems and the ESV at different scales. As shown in Figure 6, the urbanization subsystems have significantly negative correlations with the ESV at all the scales. The negative correlation between other urbanization subsystems and the ESV has increased over time, except for economic urbanization. Further analysis shows that the POPDV has the strongest correlation with the ESV at all the scales. This indicates a stronger correlation between the two and implies that population urbanization may have a negative impact on the ESV. Additionally, the positive correlation between urbanization subsystems reveals the close relationship between different aspects of urbanization. When one subsystem is improved, it often leads to improvements in other subsystems.

3.4. Results of Spatial Autocorrelation Analysis

In the past 15 years, as shown in the 6 scatter plots of Figure 7, after calculating the bivariate Global Moran’s I of the comprehensive UL and ESV of the PYLUA, it was concluded that there is a significant negative correlation between them, regardless of whether it is at the administrative scale, watershed scale, or grid scale. Over time, the values at the three scales have become closer to −1, indicating a significant increase in the negative impact of urbanization on the ESV.
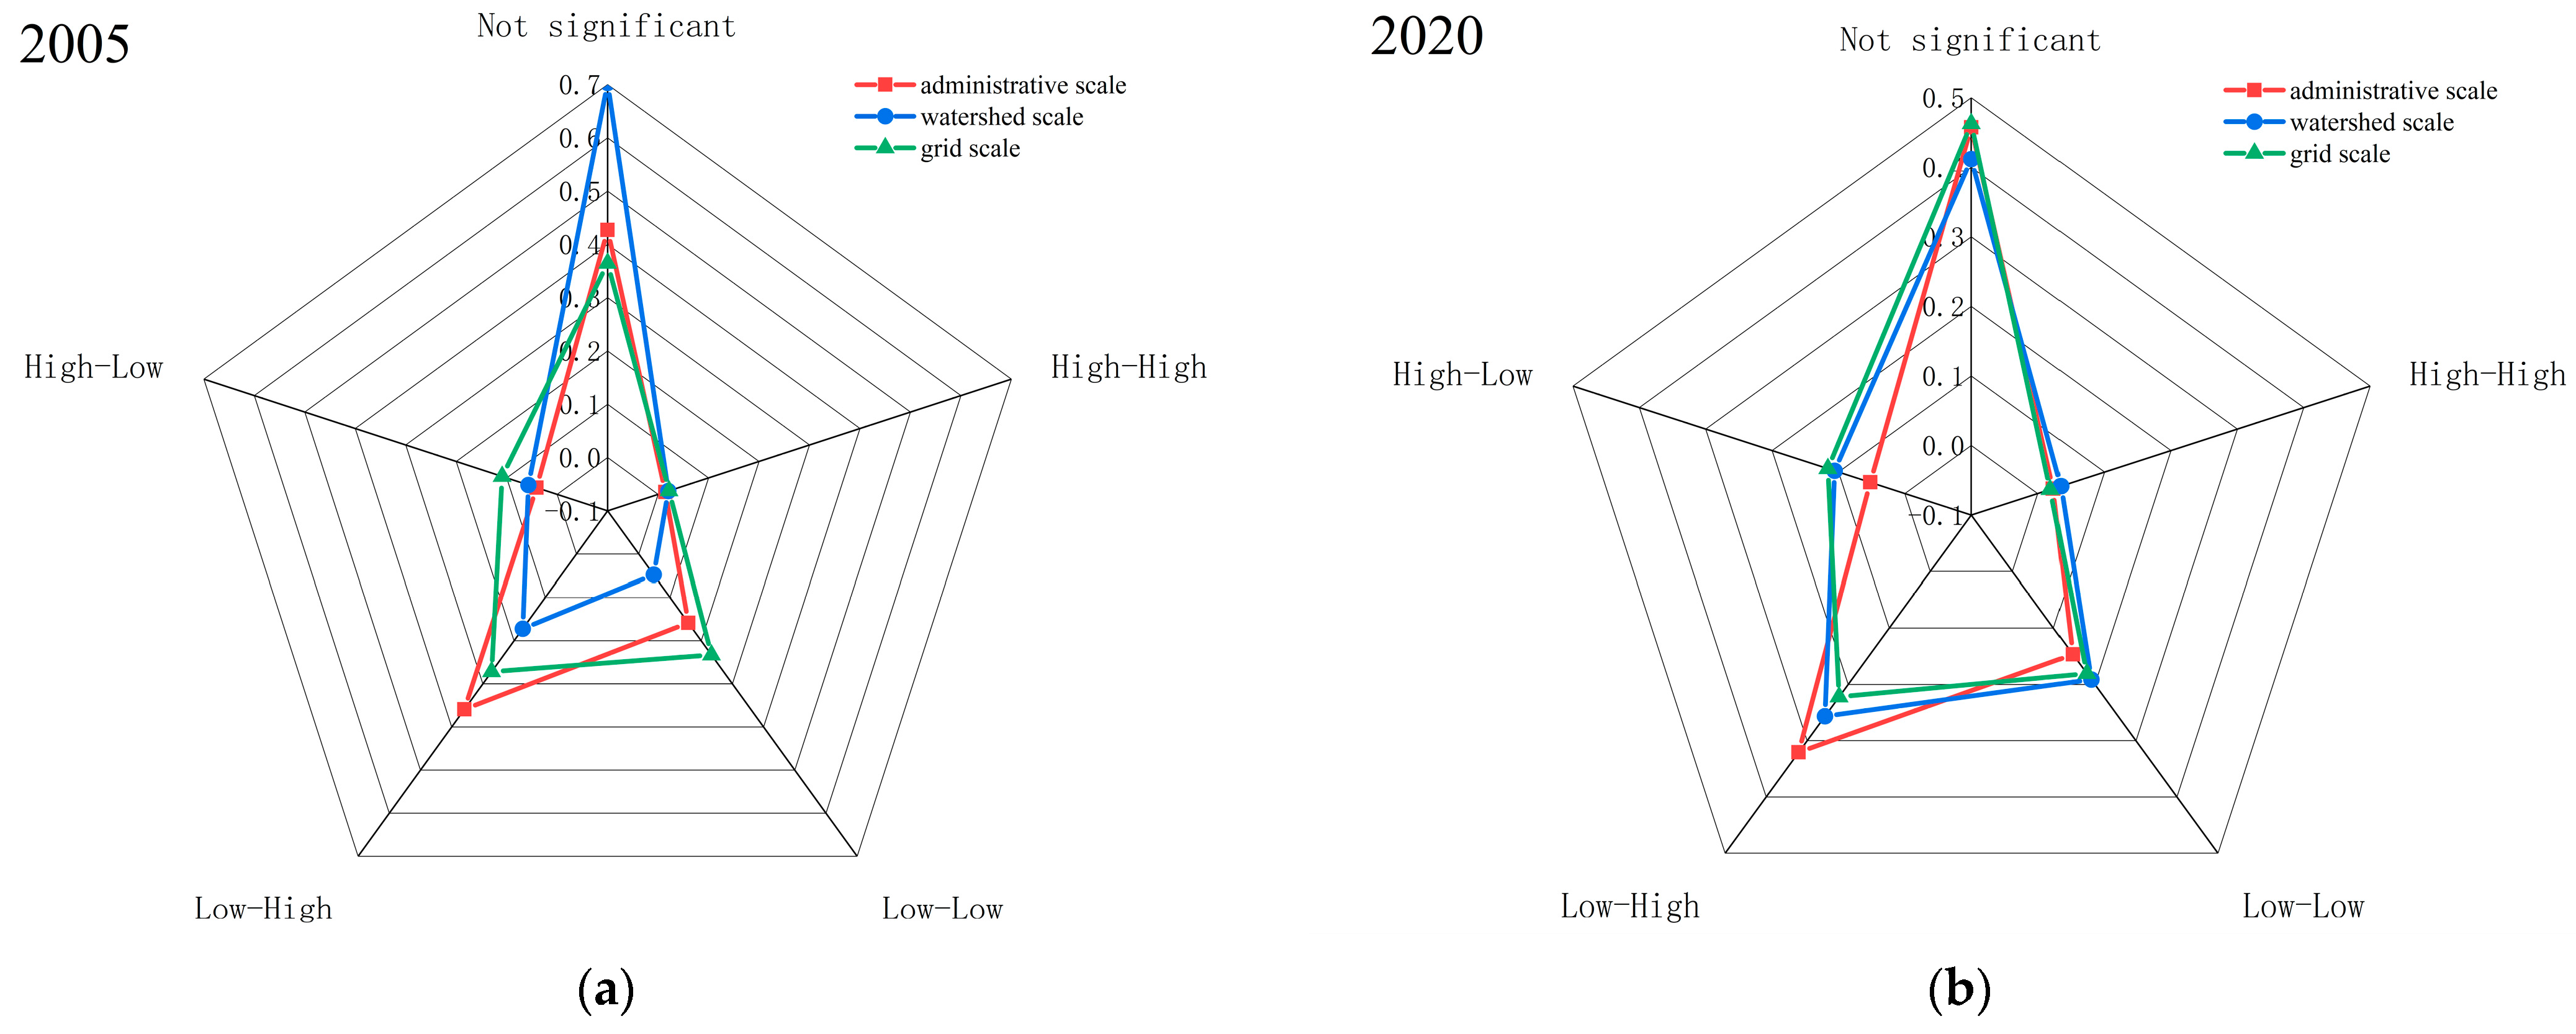
The bivariate Local Moran’s map of the study area was obtained through spatial autocorrelation analysis, and the percentage of the distribution of its spatial relationship in each period is shown in Figure 8. Over the past 15 years, the proportion of the distribution of the non-significance of the spatial relationship between the UL and ESV has decreased at the administrative scale and grid scale. This indicates that the negative spatial correlation between urbanization and the ESV becomes stronger. Furthermore, the proportion of the spatial distribution of H-H and H-L has increased at all the scales, while the proportion of the spatial distribution of L-L and L-H has decreased at all the scales.
In terms of the specific distribution of the spatial relationship between the UL and ESV in the study area (Figure 9), H-H is sporadically distributed and has the minor distribution, but it has expanded at various scales over the past 15 years. The L-L distribution is the most and widest, but at the administrative scale, grid scale, and comprehensive scale, its distribution tends to shrink in the time dimension. H-L is mainly distributed in economically developed areas, such as in the southwestern part of the PYLUA around the Greater Nanchang Metropolitan Area and the centers of counties and cities. With the passage of time, its spatial distribution has changed from a centralized distribution to a multi-point decentralized distribution. L-H is primarily situated in central and eastern areas that are covered with water and forested land, and its spatial distribution has been contracting at the administrative, grid, and integrated scales.

3.5. Results of Spatial Regression Analysis

The traditional non-spatial OLS model was applied to regress the impact of the urbanization subsystem on the ESV by incorporating a series of control variables. As shown in Table 3, at the three scales, land urbanization and population urbanization significantly affect their ecosystem service value at the significant level of 1%, and the impact effect is negative. At the watershed scale, the impact of land urbanization on the ESV has the largest absolute value of the regression coefficients, indicating that its impact effect is stronger. The regression coefficient values of population urbanization are all large at the three scales, which shows that the negative effect of population urbanization on the ESV is the strongest, and the impact effect at the grid scale is stronger. In the regression results of the OLS model, the impact effect of economic urbanization on the ESV is not significant, perhaps because the spatial effect is not added.
In the MGWR model, the impact of urbanization on the ESV [67] was calculated, as shown in Table 4. By adding a series of control variables, the R2 and adjusted R2 are both greater than 0.8, indicating that the fitting effect is good and the results are reliable. By analyzing the regression results, most of the effects of urbanization subsystems on the ESV at the maximum, median, and minimum values at the three scales showed significant correlations, demonstrating that the results obtained by MGWR have good performance and effects. The regression coefficients of the urbanization subsystems on the ESV are overwhelmingly negative, indicating a significant negative effect.
Using the MGWR results, box plots are drawn by analyzing the local significance p-values of each urbanization subsystem at different scales to observe the scale at which each urbanization subsystem has a better interpretability of its impact on the ESV (Figure 10). Since p < 0.05 is only statistically significant in mainstream academia, it is clear from the observation that land urbanization, population urbanization, and economic urbanization are better interpreted in terms of their impacts on the ESV at the administrative and grid scales, respectively. From the spatial distribution of the impact of urbanization subsystem on the ESV, land urbanization negatively affects the ecosystem service in the whole area of the PYLUA, indicating that the expansion of construction land will inhibit the stability of the regional ecosystem, and the impact effect is stronger around the economically developed Greater Nanchang metropolitan area. Population urbanization has a significant effect on the ESV in the watershed of Poyang Lake, Fuzhou, and Yingtan, and the regression coefficient is negative in most areas. Economic urbanization negatively affects the ESV in mineral resource cities such as Shangrao and Yingtan in the eastern part of the PYLUA.

3.6. Zoning Management of the Urban Agglomeration around Poyang Lake

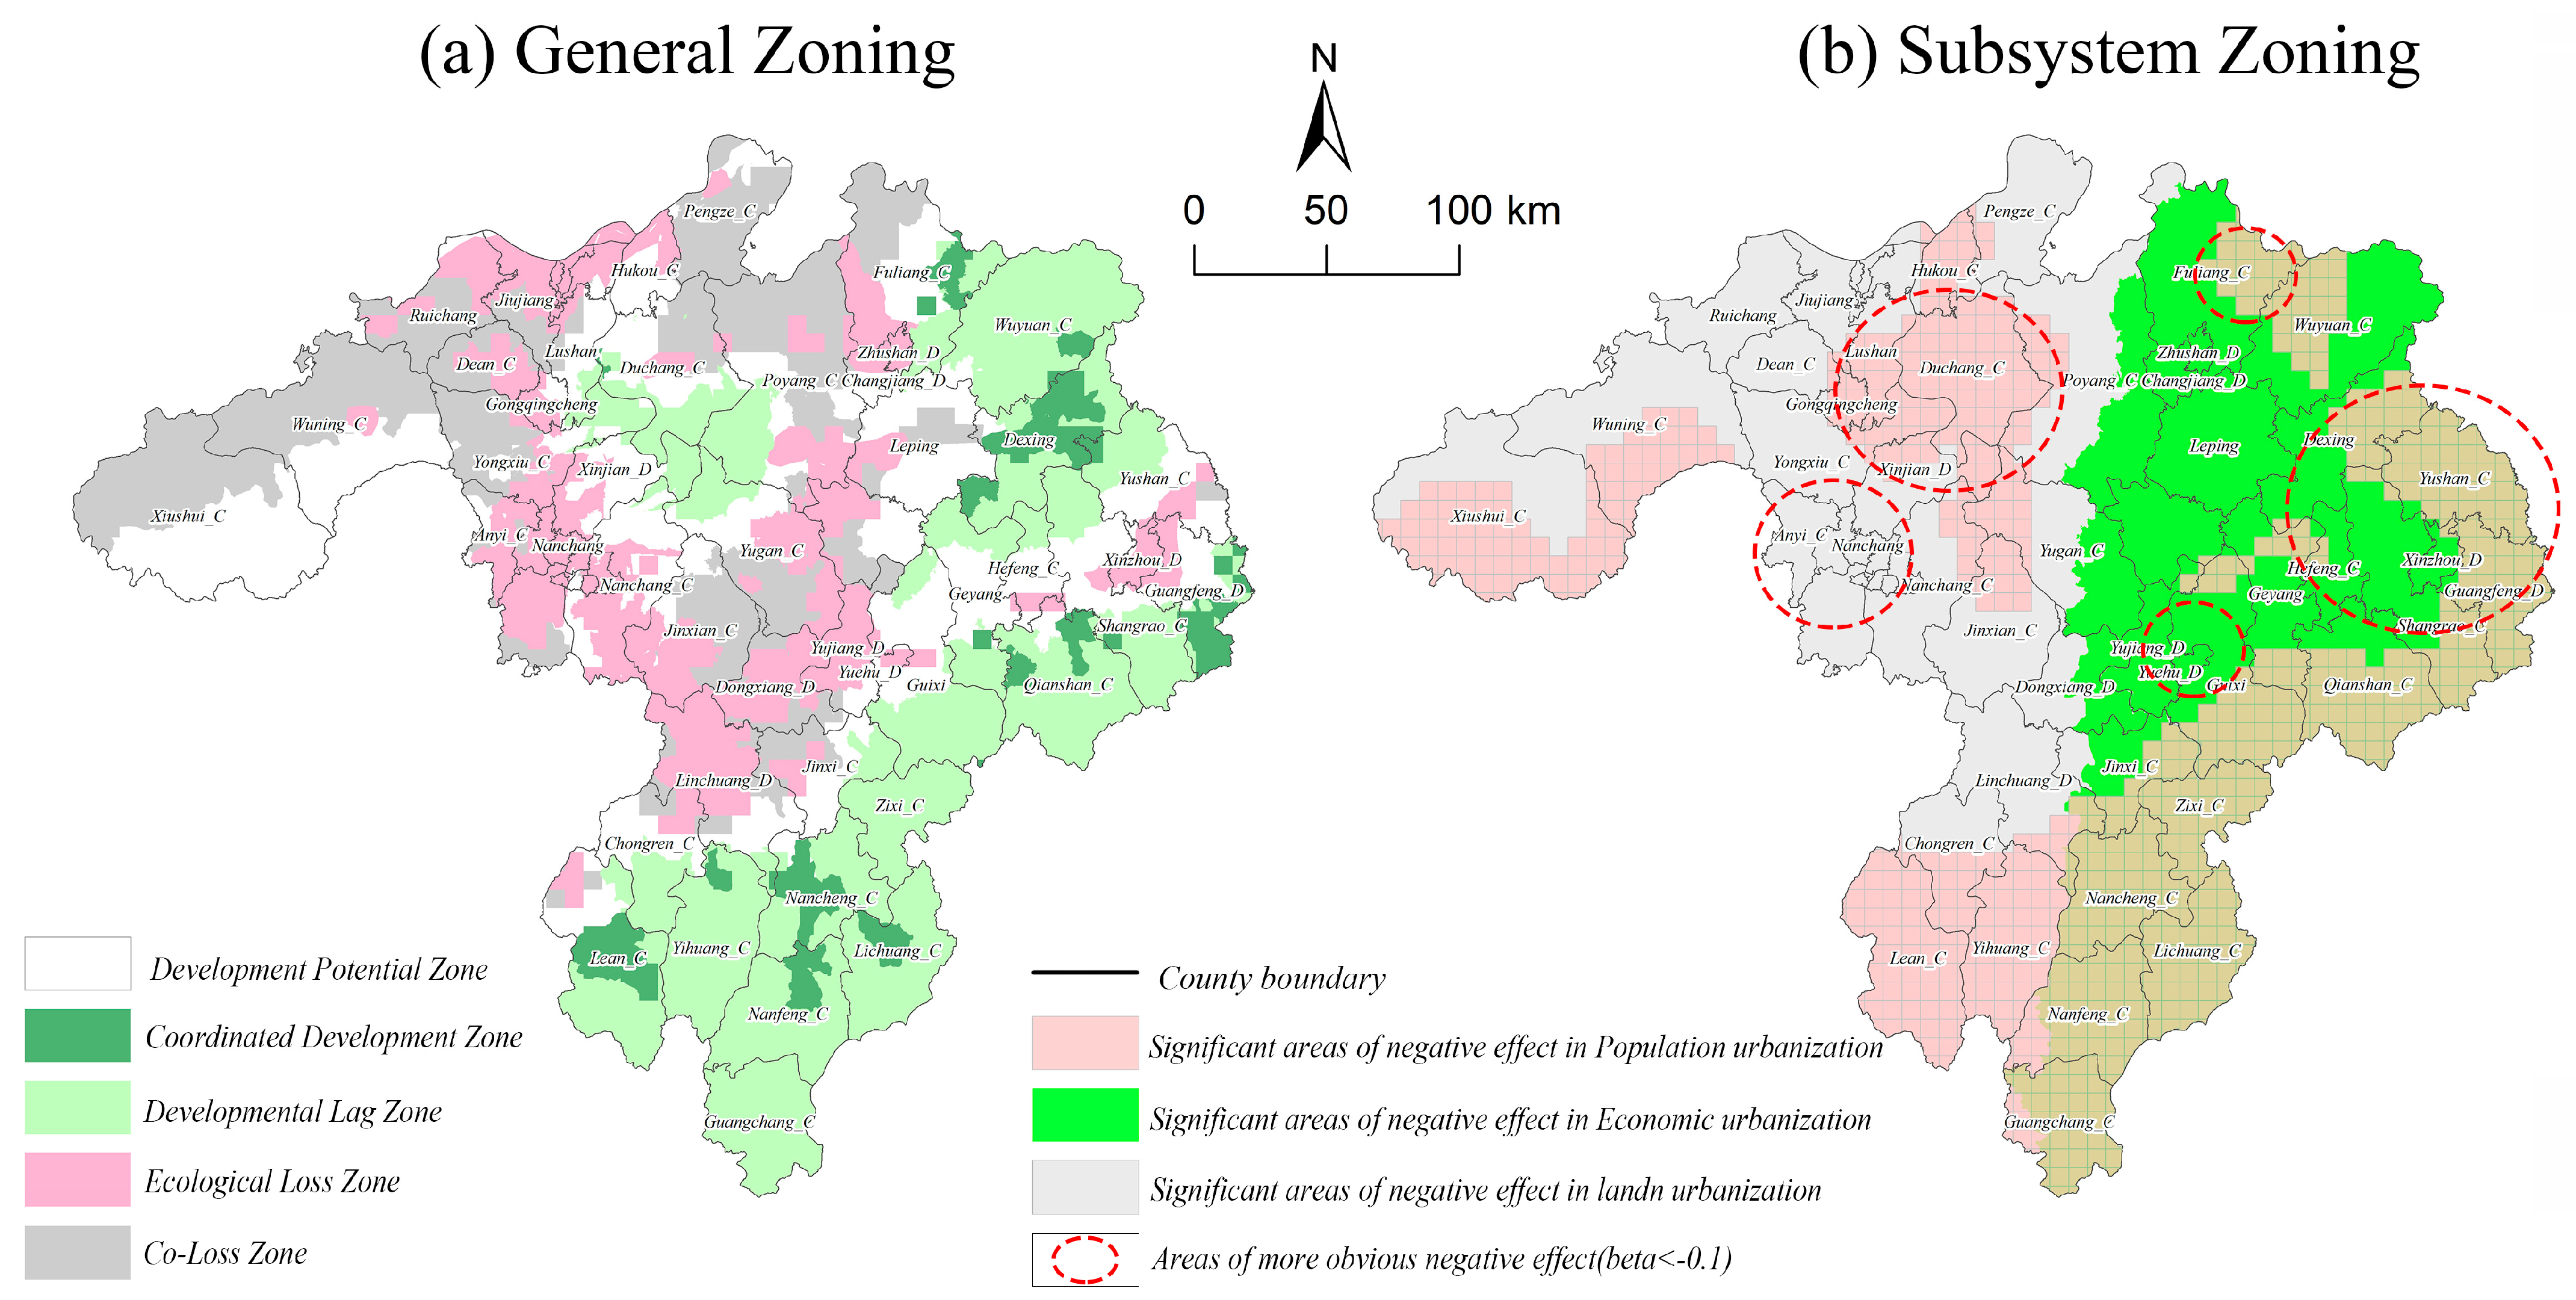
Through the bivariate Local Moran’s I, the spatial interaction between urbanization and the ESV at different scales was described (Figure 9). Based on this, the spatial patterns of H-H, L-L, L-H, and H-L are classified into the Coordinated Development Zone, Co-Loss Zone, Development Lag Zone, and Ecological Loss Zone [42], and the areas where urbanization and the ESV are not significant in space are set as the Development Potential Zone. By analyzing the spatial impact effects of urbanization subsystems on the ESV (Figure 10), the PYLUA was divided into zones with significant areas of negative effect in population urbanization, significant areas of negative effect in economic urbanization, and significant areas of negative effect in land urbanization. Additionally, areas of more pronounced negative effect were identified.
The spatial interactions between urbanization and the ESV present a variety of types, with significant differences among them, as shown in Figure 11a. The Coordinated Development Zones are few and predominantly situated in the east of the PYLUA, and the negative effect of the urbanization subsystem is obvious in the surrounding areas. It should focus on utilizing its advantages of ecological and economic harmonization and its leading role as a model, driving industrial transformation and green economic development in the surrounding areas and alleviating the contradiction between population and land. The Development Lag Zone is widely distributed in the economically underdeveloped counties and districts of Fuzhou and Shangrao. The government should increase infrastructure construction and improve the public service system, as well as formulate relevant policies and economic incentives to provide support for and guarantee the construction of districts. The Ecological Loss Zone is concentrated in the periphery of the Greater Nanchang metropolitan area and the city centers at various levels. It should vigorously implement the ecological protection and compensation mechanism and promote the recycling economy and the green development of industries. Considering that the negative impact of the land urbanization subsystem in this area is particularly significant, it should strictly control land use, reduce blind expansion, and rationally develop land. The Co-Loss Zone is mainly distributed in Xiushui County, Wuning County, Jinxian County, and other counties where the ecological conditions and economic development are not prominent. The development and protection of these regions must be placed in an important position, and the protection of ecological resources and sustainable use of land should be strengthened through land consolidation, land reclamation, rational development of unused land, and exploration of ecological utilization models. The development of cities and towns in the development potential area has little impact on its regional ecology, and while focusing on ecological protection, they can increase development efforts and accelerate the development process of regional urbanization.
As shown in Figure 11b, the negative effect of the population urbanization subsystem in the counties around the Poyang Lake Basin is particularly significant. To alleviate the negative impacts of ecosystem instability caused by population increases, it is important to rationally arrange the population relocation. It is crucial to address these issues. Economic urbanization in Shangrao, Yingtan, and other places in the east also has significant negative effects. Given the abundance of mineral resources in these areas, economic growth at the regional level may lead to ecological damage. Consequently, it is imperative to prioritize the enhancement of the safeguarding and recuperation of their ecosystems. This can be achieved by promoting the construction of a circular green economy, building eco-industrial parks, encouraging enterprises to carry out cleaner production, and improving the efficiency of resource utilization.

4. Discussion

4.1. The Evolution of Urbanization and the ESV

The purpose of this paper is to study the spatial relationships and impact effects of urbanization and ecosystem services at multiple scales in the PYLUA from 2005 to 2020. By using specific indicators (GDPDV, POPDV, and CER) [2,10,58] to analyze its urbanization in various dimensions, this general features of quick land expansion, rapid economic development, and demographic changes in the process of urbanization development were found. This study also found that no matter which level, the urbanization is centered on a single (multiple) extremely high-value area at the beginning, and it evolves into more extremely high-value areas to spread to the periphery at the end, showing a tendency to expand at the edges while the difference between regions is shrinking. Extremely high-value areas are distributed around the provincial capital city of Nanchang, which is the basis of the reality of the provincial government’s efforts to promote the creation of the Greater Nanchang Metropolitan Area Plan. This plan aims to build a coordinated regional development pattern, comprehensively buttress the Belt and Road, integrate into the Yangtze River Economic Belt, and promote the integration of Nanchang–Jiujiang and Nanchang–Fuzhou. These phenomena reflect the general characteristics of new urbanization; that is, while urbanization is advancing rapidly, development pays more attention to sustainability, regional equity, and urban–rural integration, which also verifies the inevitable law of the urbanization process.
The ecosystem services studied in this paper take into account the actual situation of the PYLUA, use the grain yield correction method, and integrate socioeconomic conditions with the NPP and GDP [15,28] to modify, which can reduce the errors brought about by the EFM. By comparing the ESV of this study with the results of geographically similar research areas [27,28], the difference in the ecosystem service value coefficient of each land-use type is within 5%, indicating that the results are more reasonable and scientific. In the context of the rapid urbanization of the area, the overall level of the ESV in the PYLUA has remained high and relatively stable over the past 15 years. This is particularly evident in the vicinity of Poyang Lake, which may be attributed to the implementation of a comprehensive ecosystem protection and management system. The government has proposed a plan to protect the fields, lakes, and grasslands in the Poyang Lake Basin. Furthermore, the construction of an ecological compensation mechanism for the Poyang Lake Basin has been steadily advanced over the past 15 years, which contributed to the stable and positive development of the ecosystem in the area.

4.2. The Interaction between Urbanization and the ESV

This research found that the urbanization of the PYLUA has a negative effect on the ESV, whether in the correlation analysis, bivariate spatial autocorrelation analysis, or MGWR model, which is of great significance nationwide [10,47]. During the study period, the spatial distributions of H-H and H-L both accounted for a significant increase, demonstrating the rapid development of urbanization in the study area over the past 15 years. The proportion of the distribution of the non-significance of the spatial relationship between the UL and ESV was significantly reduced at both the administrative and grid scales, indicating that the spatial correlation between urbanization and the ESV became stronger. Additionally, the correlation was negative and the value of the bivariate Global Moran’s I of the UL and ESV was reduced at each scale. This suggests that the negative correlation between the UL and ESV was significantly increased, indicating a lack of coordination between development and conservation in the PYLUA. This phenomenon must be emphasized by the relevant authorities.
The phenomenon of expansion of the urban build-up area [6,68] has a significant negative impact on the ESV in the whole study area, and the impact effect is particularly strong in the Greater Nanchang metropolitan area. The primary cause of this phenomenon is the excessive expansion of urban areas, which has transformed the original ecological land into construction land. This has exacerbated the contradiction between urbanization and ecological protection, leading to the degradation of regional ecosystem functions and the subsequent weakening of ecosystem service supply capacity [53,69]. This is a cautionary note for the natural resources sector, indicating that measures such as strengthening land-use master planning and strict land-use control should not be delayed.
In general, there is a widespread consensus that there is a negative correlation between city development and environmental sustainability at a global scale [42], but this is not always true in certain areas. As shown in Figure 10b, the impact of population growth on the ESV is not all negative, and in fact, in some regions, it has a positive impact. One potential explanation for this phenomenon is that the speed of population growth is within an acceptable range and does not exceed a certain threshold. Additionally, the implementation of ecological restoration projects in these regions has yielded positive outcomes. This suggests that the coordination and trade-off between urban development and ecological protection is expected to be resolved, and that policymakers should prioritize attention to the population density in both urban and rural areas [2]. The negative impact area of population urbanization on the ESV is mainly around Poyang Lake basin. These counties should pay attention to household registration management and arrange population migration reasonably to alleviate the negative impact of population increases on ecosystem instability.
The rapid economic growth has a great negative impact on the ESV in Shangrao, Yingtan and other counties and municipalities. The main reason may be that its industrial mineral resources, such as copper, nickel, and cadmium, are abundant. While the exploitation of mineral resources may contribute to the regional economy, it also has the potential to cause a series of ecological and environmental concerns. These include the destruction of vegetation, damage to land and soil erosion, which could have a detrimental impact on the regional ecosystem. Priority must be assigned to improving its industrial development system, establishing eco-industrial parks, strengthening ecosystem conservation and restoration, and promoting the circular green economy.

4.3. Policy Recommendations and Implications

According to the results of this study, a series of nuanced and context-specific measures and policy recommendations are suggested [70]. First of all, the increase in the level of the ESV is closely related to the land use. It is therefore recommended that the diversity of the land use be increased [47] and that the land-use structure be optimized. This can be achieved. Relevant departments can collect in-depth data on the current land-use situation in the target region, including the land-use types, area, distribution, utilization intensity, etc. Then, these data can be systematically analyzed to formulate a detailed land-use plan based on the actual situation of the region and future development needs, specifying the scale, layout and functions of various types of land use; for example, by integrating a wider range of natural and man-made landscapes. It is recommended that landscapes, such as flowers, trees, green corridors, and wetlands, be incorporated into urban areas, and a mix of land use suitable for the regional situation should be promoted to enhance the ecological system’s stability and balance in the urban space.
Additionally, there should be controls on the overdevelopment issue and population density in both urban and rural areas, especially in ecologically sensitive areas. The urbanization process can essentially be profiled as the displacement of economic benefits for ecological benefits, and policymakers should take local conditions into full consideration when formulating economic and environmental development strategies. The development model with economic growth as the core inhibits ecosystem health. Research calls for a reduction in the mindless expansion of built-up land and irrational human activities due to their potential negative impacts on ecosystem services. In addition to rigorous land-use control, the delineation of ecological protection red lines, and the implementation of ecological restoration projects, the relevant departments can also enhance social supervision, encourage public participation, and implement a system of rewards and penalties. For instance, developers who adhere to legal and regulatory frameworks and prioritize ecological environmental protection throughout the development process should be incentivized and supported through policy and financial instruments. Conversely, those who engage in illicit development or cause ecological harm should be subject to legal penalties to serve as an effective deterrent.
Last but not least, by exploring the scale effect and the optimal scale, this study suggests that policymakers should be brave enough to break the administrative barriers. From the perspective of multi-scale data, especially the natural watershed level, we should strengthen regional cooperation between policy formulation and territorial space control and promote the high-quality urban management and ecological protection of the PYLUA. The government can take the lead in setting up a joint committee with the participation of relevant regional administrations to formulate a framework for cooperation in information sharing, policy coordination, resource deployment, and environmental protection. This committee would also be responsible for the management of land, water resources and the ecological environment within the watershed, so as to enhance the overall level of development in the region.
The findings of this research can be utilized as a reference point and a basis for decision-making by urban managers in the zoning of territorial spatial planning and the formulation of ecological environmental protection policies. However, this study also has some limitations. For example, the calculation of ecosystem services mainly depends on its land-use type, and the interpretation of ecosystem services may be one-sided. Urbanization includes not only land, population, and economy [64,71], and there may be inaccuracies in characterizing the level of urbanization solely based on the population density, GDP changes, and expansion of construction land. The calculation of the urbanization stage and the trend of the urban expansion probability in the future also need to be studied. There is also room for further improvement in the discussion of the spatial relationship and impact effect of urbanization and the ESV. In the future, we can consider the discussion of the interactive coupling mechanism between the two.

5. Conclusions

In this study, the UL and ESV of the PYLUA from 2005 to 2020 were measured by analyzing the urbanization subsystem and the modified EFM combined with the actual situation. The complex spatial relationship between the two was explored by using bivariate spatial autocorrelation and multi-scale geographically weighted regression to explore the differentiated management of the area at the optimal scale and under the specific zoning management scheme. The main conclusions are as follows.
(1)
From 2005 to 2020, the UL in the PYLUA has significantly increased, and the land urbanization has shifted from single-point expansion to multi-point expansion. The change in population density showed a steady growth and spread to the surrounding areas, and the gap in economic growth between regions was significantly reduced.
(2)
The ESV generally maintained a stable trend. The high-value areas were majorly situated around the Poyang Lake waters, and the low-value areas were majorly situated in urbanized areas with dense construction land.
(3)
Pearson’s correlation analysis revealed that the ESV and urbanization subsystems have shown a significant negative correlation over the past 15 years, regardless of the scale, and that population urbanization has more negative correlation with the ESV, while there is a certain degree of positive correlation between the urbanization subsystems.
(4)
There is a significant spatial negative correlation between the UL and ESV at all the scales in the PYLUA, and the negative effect is significantly enhanced over time. The distribution of H-H is sporadic and the least, and the distribution of L-L is wide. H-L is mainly distributed in economically developed areas such as the Great Nanchang metropolitan area in the southwest and the centers of counties and cities. L-H is mainly distributed in the central and eastern waters and woodland areas.
(5)
By adding a series of control variables, according to the OLS model regression results, land urbanization and population urbanization have a negative impact on their ESVs at the 1% significant level, and the impact of economic urbanization on the ESV is not significant. In the MGWR model regression results, land urbanization, population urbanization, and economic urbanization have better explanatory effects on the ESV at administrative scale and grid scale, respectively.
(6)
Through the study of the spatial interaction between urbanization and the ESV at different scales, the study area is divided into the Coordinated Development Zone, Co-Loss Zone, Development Lag Zone, Ecological Loss Zone, and Development Potential Zone. By analyzing the spatial effect of urbanization subsystem on the ESV, significant areas of negative effect in population urbanization, significant areas of negative effect in economic urbanization, significant areas of negative effect in land urbanization, and areas of more pronounced negative effect were identified. Ultimately, according to the situation of each zone, the corresponding management strategy is proposed.
(7)
It is proposed that certain pertinent measures be implemented in analogous geographic regions. First, land use should be planned to allow for different types of land use. Second, over-exploitation can be regulated through social supervision, public participation, and penalties. Third, policy should be made to break down administrative barriers.

Author Contributions

Funding acquisition, Z.L.; conceptualization, Z.L. and X.Y.; methodology, X.Y.; formal analysis, X.Y.; writing—original draft preparation, Z.L. and X.Y.; writing—review and editing, Z.L. and X.Y.; supervision, Z.L. All authors have read and agreed to the published version of the manuscript.

Funding

This research was supported by the Humanities and Social Sciences Research Planning Foundation of the Ministry of Education of China “Research on Spatial Coupling and Optimization Control of Urban Land Expansion and Ecological Network Protection Based on Game theory” (Grant No. 19YJAZH061), and by the National Natural Science Foundation of China “Research on Spatio-temporal Coupling and Optimization Control of Urban Expansion and Ecological Network Protection Based on Game theory” (Grant No. 41961042).

Institutional Review Board Statement

Not applicable.

Informed Consent Statement

Not applicable.

Data Availability Statement

The data are available from the corresponding author on request.

Conflicts of Interest

The authors declare no conflicts of interest.

References

  1. Fang, C. Important progress and prospects of China’s urbanization and urban agglomeration in the past 40 years of reform and opening-up. Econ. Geogr. 2018, 38, 1–9. [Google Scholar]
  2. Wu, Y.; Wu, Y.; Li, C.; Gao, B.; Zheng, K.; Wang, M.; Deng, Y.; Fan, X. Spatial relationships and impact effects between urbanization and ecosystem health in urban agglomerations along the Belt and Road: A case study of the Guangdong-Hong Kong-Macao Greater Bay Area. Int. J. Environ. Res. Public Health 2022, 19, 16053. [Google Scholar] [CrossRef] [PubMed]
  3. Chen, M.; Liu, W.; Tao, X. Evolution and assessment on China’s urbanization 1960–2010: Under-urbanization or over-urbanization? Habitat Int. 2013, 38, 25–33. [Google Scholar] [CrossRef]
  4. Navarro, M.; D’Agostino, A.; Neri, L. The effect of urbanization on subjective well-being: Explaining cross-regional differences. Socio-Econ. Plan. Sci. 2020, 71, 100824. [Google Scholar] [CrossRef]
  5. Sannigrahi, S.; Zhang, Q.; Joshi, P.K.; Sutton, P.C.; Keesstra, S.; Roy, P.S.; Pilla, F.; Basu, B.; Wang, Y.; Jha, S.; et al. Examining effects of climate change and land use dynamic on biophysical and economic values of ecosystem services of a natural reserve region. J. Clean. Prod. 2020, 257, 120424. [Google Scholar] [CrossRef]
  6. Hasan, S.S.; Zhen, L.; Miah, M.G.; Ahamed, T.; Samie, A. Impact of land use change on ecosystem services: A review. Environ. Dev. 2020, 34, 100527. [Google Scholar] [CrossRef]
  7. Wang, M.E.; Chen, W.P.; Peng, C. Urban ecological risk assessment: A review. Chin. J. Appl. Ecol. 2014, 25, 911–918. [Google Scholar]
  8. Ai, Z.; Yao, Y.; Dang, X.; Li, X.; Hou, M.; Deng, Y.; Xiao, L.; Li, T.; Wang, T. Study on the trade-off/synergy between ecosystem services and human well-being based on land use in Weinan City, China. Environ. Sci. Pollut. Res. 2024, 31, 13549–13562. [Google Scholar] [CrossRef] [PubMed]
  9. Wang, X.; Yao, W.; Luo, Q.; Yun, J. Spatial relationship between ecosystem health and urbanization in coastal mountain city, Qingdao, China. Ecol. Inform. 2024, 79, 102458. [Google Scholar] [CrossRef]
  10. Yang, M.; Gao, X.; Siddique, K.H.M.; Wu, P.; Zhao, X. Spatiotemporal exploration of ecosystem service, urbanization, and their interactive coercing relationship in the Yellow River Basin over the past 40 years. Sci. Total Environ. 2023, 858, 159757. [Google Scholar] [CrossRef]
  11. Chien, H.; Saito, O. Evaluating social–ecological fit in urban stream management: The role of governing institutions in sustainable urban ecosystem service provision. Ecosyst. Serv. 2021, 49, 101285. [Google Scholar] [CrossRef]
  12. Qiu, J.J.; Liu, Y.H.; Chen, C.J.; Huang, Q.Y. Spatial structure and driving pathways of the coupling between ecosystem services and human well-beings: A case study of Guangzhou. J. Nat. Resour. 2023, 38, 760–778. [Google Scholar]
  13. Yee, S.H.; Paulukonis, E.; Simmons, C.; Russell, M.; Fulford, R.; Harwell, L.; Smith, L.M. Projecting effects of land use change on human well-being through changes in ecosystem services. Ecol. Model. 2021, 440, 109358. [Google Scholar] [CrossRef] [PubMed]
  14. Yang, J.; Ma, X.; Zhao, X.; Li, W. Spatiotemporal of the coupling relationship between ecosystem services and human well-being in Guanzhong plain urban agglomeration. Int. J. Environ. Res. Public Health 2022, 19, 12535. [Google Scholar] [CrossRef]
  15. Wang, C.; Wang, X.; Wang, Y.; Zhan, J.; Chu, X.; Teng, Y.; Liu, W.; Wang, H. Spatio-temporal analysis of human wellbeing and its coupling relationship with ecosystem services in Shandong province, China. J. Geogr. Sci. 2023, 33, 392–412. [Google Scholar] [CrossRef]
  16. Zeng, C.; Cheng, Y.J.; Lyu, T.Y. Research on land-space ecological restoration zoning based on ecosystem health: Acase study of the urban agglomeration in the middle reaches along the Yangtze River. J. Nat. Resour. 2022, 37, 3118–3135. [Google Scholar] [CrossRef]
  17. Zhao, S.D.; Zhang, Y.M. Concepts, Contents and Challenges of Ecosystem Assessment—Introduction to “Ecosystems and Human Well-being: A Framework for Assessment”. Adv. Earth Sci. 2004, 19, 650–657. [Google Scholar]
  18. Costanza, R.; D’Arge, R.; De Groot, R.; Farber, S.; Grasso, M.; Hannon, B.; Limburg, K.; Naeem, S.; O’Neill, R.V.; Paruelo, J. The value of the world’s ecosystem services and natural capital. Nature 1997, 387, 253–260. [Google Scholar] [CrossRef]
  19. Chee, Y.E. An ecological perspective on the valuation of ecosystem services. Biol. Conserv. 2004, 120, 549–565. [Google Scholar] [CrossRef]
  20. Zhang, C.; Su, B.; Beckmann, M.; Volk, M. Emergy-based evaluation of ecosystem services: Progress and perspectives. Renew. Sustain. Energy Rev. 2024, 192, 114201. [Google Scholar] [CrossRef]
  21. Ouyang, Z.Y.; Wang, X.K.; Miao, H. Aprimary study on Chinese terrestrial ecosystem services and their ecological-economic values. Acta Ecol. Sin. 1999, 19, 607–613. [Google Scholar]
  22. Li, P.; Zhang, R.; Wei, H.; Xu, L. Assessment of physical quantity and value of natural capital in China since the 21st century based on a modified ecological footprint model. Sci. Total Environ. 2022, 806, 150676. [Google Scholar] [CrossRef] [PubMed]
  23. Xue, Z.; Meng, X.; Liu, B. Spatiotemporal evolution and driving factors of ecosystem services in the upper Fenhe watershed, China. Ecol. Indic. 2024, 160, 111803. [Google Scholar] [CrossRef]
  24. Xie, G.D.; Zhen, L.; Lu, C.X.; Xiao, Y.; Chen, C. Expert Knowledge Based Valuation Method of Ecosystem Services in China. J. Nat. Resour. 2008, 23, 911–919. [Google Scholar]
  25. Xie, G.D.; Zhang, C.X.; Zhang, L.M.; Chen, W.H.; Li, S.M. Improvement of the Evaluation Method for Ecosystem Service Value Based on Per Unit Area. J. Nat. Resour. 2015, 30, 1243–1254. [Google Scholar]
  26. Quan, L.A.; Jin, S.; Chen, J.; Li, T. Evolution and Driving Forces of Ecological Service Value in Anhui Based on Landsat Land Use and Land Cover Change. Remote Sens. 2024, 16, 269. [Google Scholar] [CrossRef]
  27. Wen, Y.L.; Zhang, X.L.; Wei, J.H.; Wang, X.L.; Cai, Y.J. Temporal and Spatial Variation of Ecosystem Service Value and Its Trade-offs and Synergies in the Peripheral Region of the Poyang Lake. Sci. Geogr. Sin. 2022, 42, 1229–1238. [Google Scholar]
  28. Wei, J.H.; Wen, Y.L.; Gong, Z.J.; Wang, X.L.; Cai, Y.J. Land use changes and ecosystem service value in the buffer zone of Poyang Lake in recent 30 years. Acta Ecol. Sin. 2022, 42, 9261–9273. [Google Scholar]
  29. Li, H.; de Jong, M. Citizen participation in China’s eco-city development. Will ‘new-type urbanization’ generate a breakthrough in realizing it? J. Clean. Prod. 2017, 162, 1085–1094. [Google Scholar] [CrossRef]
  30. Tu, D.; Cai, Y.; Liu, M. Coupling coordination analysis and spatiotemporal heterogeneity between ecosystem services and new-type urbanization: A case study of the Yangtze River Economic Belt in China. Ecol. Indic. 2023, 154, 110535. [Google Scholar] [CrossRef]
  31. Sato, Y.; Yamamoto, K. Population concentration, urbanization, and demographic transition. J. Urban Econ. 2005, 58, 45–61. [Google Scholar] [CrossRef]
  32. Zhou, L.; Tang, J.J.; Liu, X.K.; Dang, X.W.; Mu, H.W. Effects of urban expansion on habitat quality in densely populated areas on the Loess Pla-teau: A case study of Lanzhou, Xi’an-Xianyang and Taiyuan, China. Chin. J. Appl. Ecol. 2021, 32, 261–270. [Google Scholar]
  33. Jiao, L.; Mao, L.; Liu, Y. Multi-order Landscape Expansion Index: Characterizing urban expansion dynamics. Landsc. Urban Plan. 2015, 137, 30–39. [Google Scholar] [CrossRef]
  34. Chen, M.J.; Wang, Q.R.; Bai, Z.K.; Xie, L.J.; Zhang, B.S.; Hao, M. Land use transition of resource-based cities in the Yellow River Basin and its impact on ecosystem services. Acta Ecol. Sin. 2023, 43, 9459–9470. [Google Scholar]
  35. Chu, N.C.; Zhang, P.Y.; Li, H.; Li, X. Measurement and Spatial Differentiation of Urbanization Development in the Siberian and Far East Federal Districts in Russia. Sci. Geogr. Sin. 2018, 38, 1069–1078. [Google Scholar]
  36. Zhang, Q.; Seto, K.C. Mapping urbanization dynamics at regional and global scales using multi-temporal DMSP/OLS nighttime light data. Remote Sens. Environ. 2011, 115, 2320–2329. [Google Scholar] [CrossRef]
  37. Shen, J. The Measurement of Urban Concentration in China and the Study of Its Spatial Differentiation Characteristics: Based on DMSP-OLS Nighttime Light Data. Econ. Geogr. 2021, 41, 46–56. [Google Scholar]
  38. Li, S.; Liu, C.; Ge, C.; Yang, J.; Liang, Z.; Li, X.; Cao, X. Ecosystem health assessment using PSR model and obstacle factor diagnosis for Haizhou Bay, China. Ocean. Coast. Manag. 2024, 250, 107024. [Google Scholar] [CrossRef]
  39. Liu, Y.L.; Li, R.D.; Song, X.F. Grey Associative Analysis of Regional Urbanization and Eco-environment Coupling in China. Acta Geogr. Sin. 2005, 60, 237–247. [Google Scholar]
  40. Zhang, H.; Deng, W.; Zhang, S.; Peng, L.; Liu, Y. Impacts of urbanization on ecosystem services in the Chengdu-Chongqing Urban Agglomeration: Changes and trade-offs. Ecol. Indic. 2022, 139, 108920. [Google Scholar] [CrossRef]
  41. Grossman, G.M.; Krueger, A.B. Economic growth and the environment. Q. J. Econ. 1995, 110, 353–377. [Google Scholar] [CrossRef]
  42. Zhang, X.; Liu, Y.; Wang, Y.; Yuan, X. Interactive relationship and zoning management between county urbanization and ecosystem services in the Loess Plateau. Ecol. Indic. 2023, 156, 111021. [Google Scholar] [CrossRef]
  43. Zhang, J.T.; Jiao, W.X.; Han, B.L. Characteristics of coordination changes and spatial coupling relationship between urbanization and ecosystem services. Acta Ecol. Sin. 2020, 40, 3271–3282. [Google Scholar]
  44. Yang, C.; Zeng, W.; Yang, X. Coupling coordination evaluation and sustainable development pattern of geo-ecological environment and urbanization in Chongqing municipality, China. Sustain. Cities Soc. 2020, 61, 102271. [Google Scholar] [CrossRef]
  45. Deng, Z.B.; Zong, S.W.; Su, C.W.; Chen, Z. Research on Coupling Coordination Development between Ecological Civilization Construction and New Urbanization and Its Driving Forces in the Yangtze River Economic Zone. Econ. Geogr. 2019, 39, 78–86. [Google Scholar]
  46. Li, H.; Peng, J.; Yanxu, L.; Na, H.Y. Urbanization impact on landscape patterns in Beijing City, China: A spatial heterogeneity perspective. Ecol. Indic. 2017, 82, 50–60. [Google Scholar] [CrossRef]
  47. Wu, K.; Wang, D.; Lu, H.; Liu, G. Temporal and spatial heterogeneity of land use, urbanization, and ecosystem service value in China: A national-scale analysis. J. Clean. Prod. 2023, 418, 137911. [Google Scholar] [CrossRef]
  48. Liu, H.L.; Ding, Y.F.; Wang, Y.F.; Wang, W.Q.; Guo, X.J. Analysis of Temporal-spatial Correlation and Spatial Effect between Urbanization and Ecosystem Services in Shanxi Province. J. Soil Water Conserv. 2022, 36, 124–134. [Google Scholar]
  49. Chen, L.; Liu, Y.; Li, J.; Tian, P.; Zhang, H. Surface water changes in China’s Yangtze River Delta over the past forty years. Sustain. Cities Soc. 2023, 91, 104458. [Google Scholar] [CrossRef]
  50. Liu, C.; Liu, D.; Li, P.; Li, X.; Liu, Z.; Zhao, Y. Assessment of occupation of natural habitat by urban expansion and its impact on crucial ecosystem services in China’s coastal zone. Ecol. Indic. 2023, 154, 110682. [Google Scholar] [CrossRef]
  51. Chen, W.; Chi, G. Urbanization and ecosystem services: The multi-scale spatial spillover effects and spatial variations. Land Use Policy 2022, 114, 105964. [Google Scholar] [CrossRef]
  52. Fang, C.; Liu, H.; Wang, S. The coupling curve between urbanization and the eco-environment: China’s urban agglomeration as a case study. Ecol. Indic. 2021, 130, 108107. [Google Scholar] [CrossRef]
  53. Chen, W.; Wang, G.; Gu, T.; Fang, C.; Pan, S.; Zeng, J.; Wu, J. Simulating the impact of urban expansion on ecosystem services in Chinese urban agglomerations: A multi-scenario perspective. Environ. Impact Assess. Rev. 2023, 103, 107275. [Google Scholar] [CrossRef]
  54. Tian, P.; Liu, Y.; Li, J.; Pu, R.; Cao, L.; Zhang, H. Spatiotemporal patterns of urban expansion and trade-offs and synergies among ecosystem services in urban agglomerations of China. Ecol. Indic. 2023, 148, 110057. [Google Scholar] [CrossRef]
  55. Wang, S.J.; Kong, W.; Ren, L.; Zhi, D.D.; Dai, B.T. Research on misuses and modification of coupling coordination degree model in China. J. Nat. Resour. 2021, 36, 793–810. [Google Scholar] [CrossRef]
  56. Liu, G.L.; Zhang, L.C.; Zhang, Q. Spatial and temporal dynamics of land use and its influence on ecosystem service value in Yangtze River Delta. Acta Ecol. Sin. 2014, 34, 3311–3319. [Google Scholar]
  57. Mu, S.; Yang, G.; Xu, X.; Wan, R.; Li, B. Assessing the inundation dynamics and its impacts on habitat suitability in Poyang Lake based on integrating Landsat and MODIS observations. Sci. Total Environ. 2022, 834, 154936. [Google Scholar] [CrossRef] [PubMed]
  58. Li, J.; Xie, B.; Dong, H.; Zhou, K.; Zhang, X. The impact of urbanization on ecosystem services: Both time and space are important to identify driving forces. J. Environ. Manag. 2023, 347, 119161. [Google Scholar] [CrossRef] [PubMed]
  59. Ye, Y.; Bryan, B.A.; Connor, J.D.; Chen, L.; Qin, Z.; He, M. Changes in land-use and ecosystem services in the Guangzhou-Foshan Metropolitan Area, China from 1990 to 2010: Implications for sustainability under rapid urbanization. Ecol. Indic. 2018, 93, 930–941. [Google Scholar] [CrossRef]
  60. Ding, X.; Shu, Y.; Tang, X.; Ma, J. Identifying Driving Factors of Basin Ecosystem Service Value Based on Local Bivariate Spatial Correlation Patterns. Land 2022, 11, 1852. [Google Scholar] [CrossRef]
  61. Song, W.; Wang, C.; Chen, W.; Zhang, X.; Li, H.; Li, J. Unlocking the spatial heterogeneous relationship between per Capita GDP and nearby air quality using bivariate local indicator of spatial association. Resour. Conserv. Recycl. 2020, 160, 104880. [Google Scholar] [CrossRef]
  62. Lee, S. Developing a bivariate spatial association measure: An integration of Pearson’s r and Moran’s I. J. Geogr. Syst. 2001, 3, 369–385. [Google Scholar] [CrossRef]
  63. Anselin, L.; Syabri, I.; Smirnov, O. Visualizing multivariate spatial correlation with dynamically linked windows. In Proceedings of the CSISS Workshop on New Tools for Spatial Data Analysis, Santa Barbara, CA, USA, 10–11 May 2002; pp. 1–20. [Google Scholar]
  64. Xue, C.; Chen, X.; Xue, L.; Zhang, H.; Chen, J.; Li, D. Modeling the spatially heterogeneous relationships between tradeoffs and synergies among ecosystem services and potential drivers considering geographic scale in Bairin Left Banner, China. Sci. Total Environ. 2023, 855, 158834. [Google Scholar] [CrossRef] [PubMed]
  65. Hu, B.; Kang, F.; Han, H.; Cheng, X.; Li, Z. Exploring drivers of ecosystem services variation from a geospatial perspective: Insights from China’s Shanxi Province. Ecol. Indic. 2021, 131, 108188. [Google Scholar] [CrossRef]
  66. Tran, D.X.; Pearson, D.; Palmer, A.; Lowry, J.; Gray, D.; Dominati, E.J. Quantifying spatial non-stationarity in the relationship between landscape structure and the provision of ecosystem services: An example in the New Zealand hill country. Sci. Total Environ. 2022, 808, 152126. [Google Scholar] [CrossRef]
  67. Cheng, Y.; Kang, Q.; Liu, K.; Cui, P.; Zhao, K.; Li, J.; Ma, X.; Ni, Q. Impact of Urbanization on Ecosystem Service Value from the Perspective of Spatio-Temporal Heterogeneity: A Case Study from the Yellow River Basin. Land 2023, 12, 1301. [Google Scholar] [CrossRef]
  68. Ouyang, X.; Tang, L.; Wei, X.; Li, Y. Spatial interaction between urbanization and ecosystem services in Chinese urban agglomerations. Land Use Policy 2021, 109, 105587. [Google Scholar] [CrossRef]
  69. Zhang, Z.; Xia, F.; Yang, D.; Huo, J.; Wang, G.; Chen, H. Spatiotemporal characteristics in ecosystem service value and its interaction with human activities in Xinjiang, China. Ecol. Indic. 2020, 110, 105826. [Google Scholar] [CrossRef]
  70. Wen, Y.; Zhang, Z.; Liang, D.; Xu, Z. Rural residential land transition in the Beijing-Tianjin-Hebei region: Spatial-temporal patterns and policy implications. Land Use Policy 2020, 96, 104700. [Google Scholar] [CrossRef]
  71. Yushanjiang, A.; Zhou, W.; Wang, J.; Wang, J. Impact of urbanization on regional ecosystem services—A case study in Guangdong-Hong Kong-Macao Greater Bay Area. Ecol. Indic. 2024, 159, 111633. [Google Scholar]
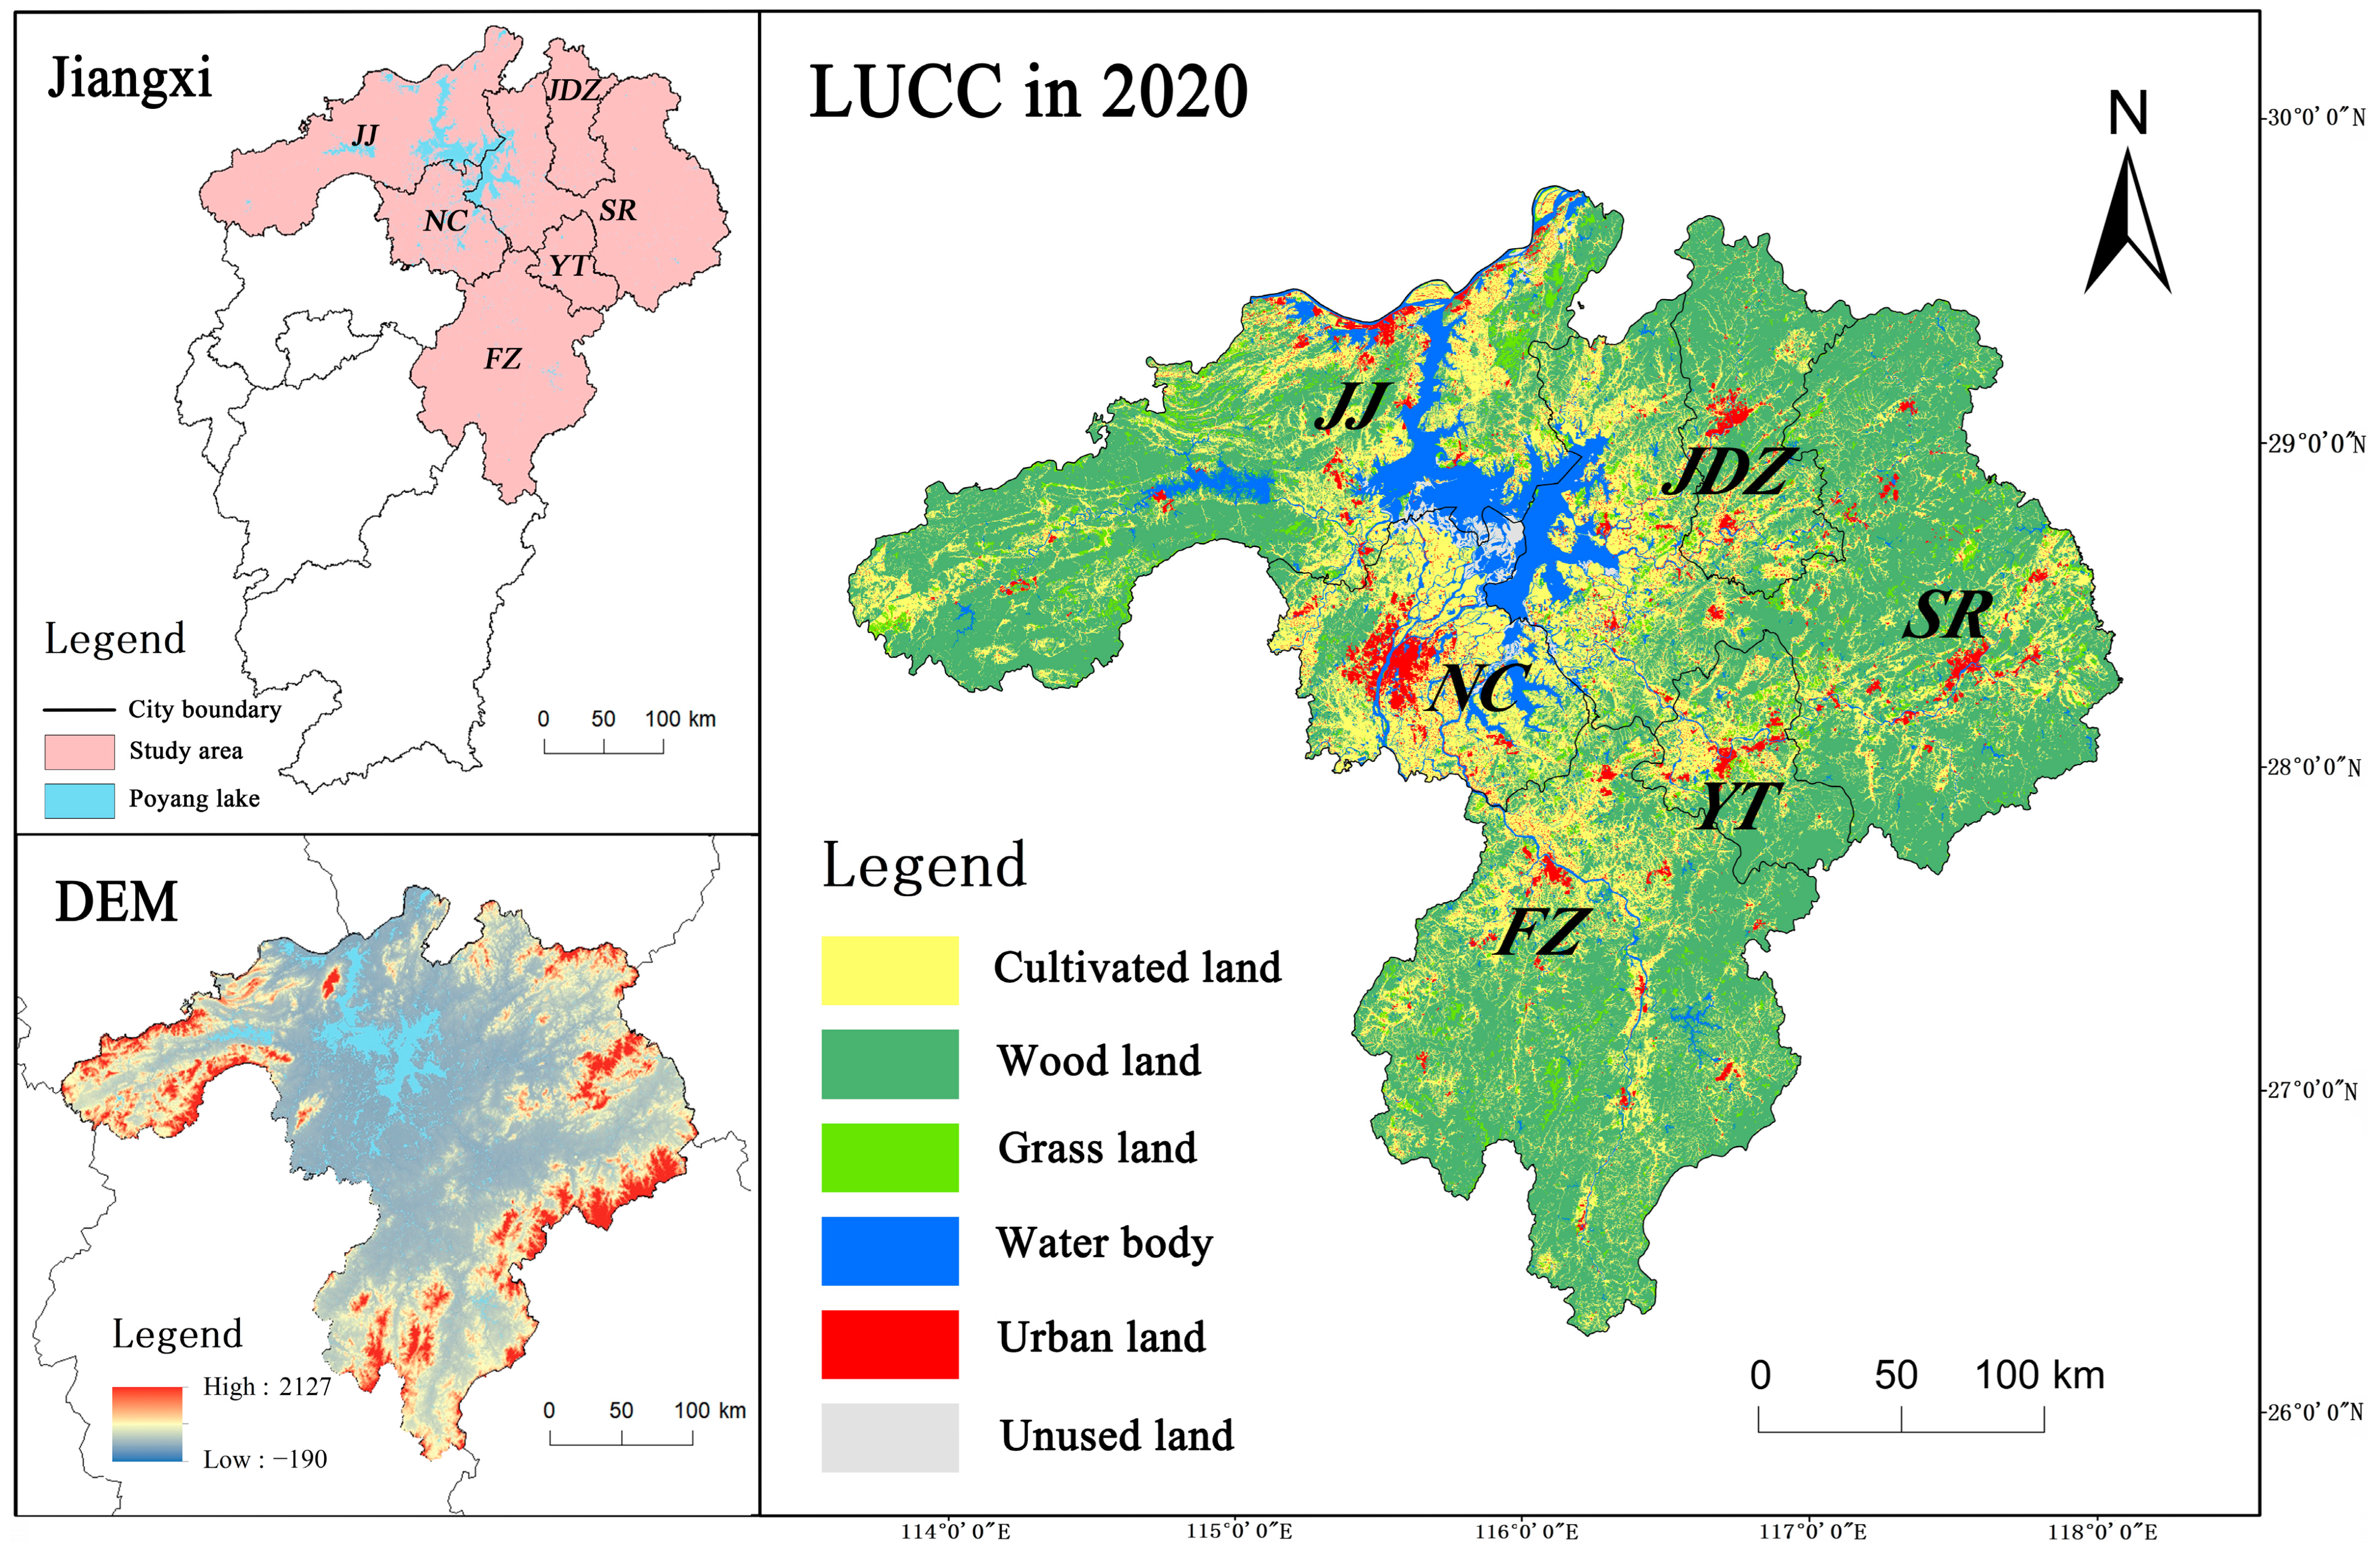
Figure 1. Location map of the PYLUA. (Note: LUCC is land use and land cover change).
Sustainability 16 05128 g001
Figure 2. The overall framework and technical flowchart.
Sustainability 16 05128 g002
Figure 3. Selection of the optimal grid scale.
Sustainability 16 05128 g003
Figure 4. The temporal and spatial evolution map of urbanization in the PYLUA from 2005 to 2020.
Sustainability 16 05128 g004
Figure 5. The temporal and spatial changes map of the ESV in the PYLUA from 2005 to 2020.
Sustainability 16 05128 g005
Figure 6. Correlation plot between the ESV and urbanization system (* indicates p < 0.05).
Sustainability 16 05128 g006
Figure 7. The bivariate Global Moran’s I of the comprehensive UL and ESV of the PYLUA during 2005–2020.
Sustainability 16 05128 g007
Figure 8. The proportion of the bivariate Local Moran’s I of the comprehensive UL and ESV of the PYLUA during 2005–2020. (a) Radar diagram of the spatial correlation between the UL and ESV in 2005. (b) Radar diagram of the spatial correlation between the UL and ESV in 2020.
Sustainability 16 05128 g008
Figure 9. The distribution of the bivariate Local Moran’s I of the comprehensive UL and ESV of the PYLUA during 2005–2020.
Sustainability 16 05128 g009
Figure 10. The MGWR model regression results diagram of the impact of urbanization subsystems on the ESV.
Sustainability 16 05128 g010
Figure 11. Zoning management map of the PYLUA. (Note: D is district; C is county).
Sustainability 16 05128 g011
Table 1. The value coefficients of the ecosystem services per unit area of various land-use types/CNY(hm2·a)−1.
First ClassificationSecondary ClassificationCultivated LandWood
Land
Grass
Land
Water BodyConstruction LandUnused Land
Provisioning servicesFood production2656.70633.12913.611574.780.000.00
Raw material production589.041442.551346.38877.550.000.00
Water supply−3137.55745.32745.3213,079.120.000.00
Regulating servicesGas regulation2139.784752.404736.373209.670.0048.08
Climate regulation1117.9814,233.1612,526.147080.510.000.00
Purification of the environment324.574167.374135.3110,999.440.00240.42
Hydrology3594.359296.439184.23152,032.710.0072.13
Supporting servicesSoil conservation1250.215794.245770.203894.880.0048.08
Maintaining nutrient cycles372.66440.78432.76300.530.000.00
Biodiversity408.725273.325241.2612,526.140.0048.08
Cultural servicesAesthetic landscape180.322316.092308.087958.070.0024.04
Table 2. The value of various ecosystem services in the PYLUA from 2005 to 2020 (108 CNY).
ESVNanchangJingdezhenJiujiangYingtanFuzhouShangrao
2005Provisioning services22.116712.045766.99177.613243.268465.9736
Regulating services271.1167145.0660786.688293.6892523.2290784.4114
Support services42.274046.9354174.020728.8698168.3624205.5660
Cultural services12.94659.558144.33645.928834.292547.1196
2010Provisioning services21.414911.998468.55327.586743.415965.6020
Regulating services263.5089803.8165803.816593.3243524.8049780.3705
Support services41.324328.6038175.241128.6038167.9769204.3301
Cultural services12.566234.315345.09635.893234.315346.8493
2015Provisioning services21.411811.969668.56457.539443.363765.4673
Regulating services263.1805144.2731803.420692.7221524.0308778.6550
Support services41.123046.4811174.796528.4072167.6864203.8037
Cultural services12.54769.487745.06145.855234.266946.7436
2020Provisioning services21.494611.912668.48477.508343.281865.3029
Regulating services263.5514143.4800801.997992.2261522.7648776.4433
Support services40.815546.1822174.268428.1918167.2288202.9100
Cultural services12.55569.434144.97965.821734.185546.5889
Table 3. The OLS model regression results table of the impact of urbanization subsystems on the ESV.
OLSAdministrative ScaleWatershed ScaleGrid Scale
CER−0.080 **−0.165 **−0.153 **
(−3.68)(−4.69)(−5.69)
POPDV−0.258 **−1.326 **−1.643 **
(−2.62)(−5.46)(−10.98)
GDPDV−0.0720.019−0.065
(−1.50)−0.230(−1.17)
C10.0000.0000.000
−1.570−1.280−0.910
C20.001 **0.000 **0.000 **
−12.150−3.280−10.970
C3−0.000 **−0.000 **−0.000 **
(−5.25)(−3.20)(−5.48)
C4−0.0010.008 **0.009 **
(−0.57)−2.200−3.500
C50.034 **0.060 **0.013 **
−4.480−5.460−2.810
Constant0.239 **0.388 **0.480 **
−6.620−5.190−9.160
N8755451749
R20.3740.3140.280
Adj.R20.3680.3030.277
F64.62028.49087.810
Note: ① the values of t are in parentheses; ② the symbol for significance testing: ** p < 0.01.
Table 4. The MGWR model regression results table of the impact of urbanization subsystems on the ESV.
MGWRAdministrative ScaleWatershed ScaleGrid Scale
CERMin−0.048 *−0.069 *−0.041 **
Median−0.016−0.038−0.039 **
Max0.0190.025 **−0.039 **
POPDVMin−0.638 **−0.537 **−0.674 **
Median−0.053−0.144−0.104
Max0.638 **0.569 **0.175 *
GDPDVMin−0.087 **−0.048−1.308 **
Median−0.038−0.021−0.113
Max−0.0210.101 **0.877 **
AIC670.381486.36746.067
AICc787.808535.0271032.834
R20.9200.9020.945
Adj.R20.8970.8970.927
Note: * indicates p < 0.05, ** indicates p < 0.01.
Disclaimer/Publisher’s Note: The statements, opinions and data contained in all publications are solely those of the individual author(s) and contributor(s) and not of MDPI and/or the editor(s). MDPI and/or the editor(s) disclaim responsibility for any injury to people or property resulting from any ideas, methods, instructions or products referred to in the content.