Abstract
A hazard zoning map is the most essential tool during the crisis management cycle’s prevention and risk reduction phase. In this study, a geographic information system (GIS) is applied to the crisis management of ports through the preparation of a risk zoning map in Jazan Port, Saudi Arabia, using a novel integrated model of the fuzzy hierarchical analysis process and emotional artificial neural network (FAHP-EANN). The objective is to more accurately identify the highly potential risk zones in the port through hybrid techniques, which mitigates the associated life and financial damages through proper management during a probable hazard. Prior to creating the risk zoning map, every potential port accident is identified, categorized into six criteria, and assigned a weight through the utilization of a machine learning algorithm. The findings indicate that the three most effective criteria for the risks of Jazan Port are land fires, pollution and dangerous substances, and human behavior, respectively. A zoning map of all risks in Jazan Port was generated by using the weights obtained for each of the major accidents. This map may be utilized in the development of crisis prevention measures for the port and in the formation of crisis management units.
1. Introduction
Ports are essential arteries of global trade and commerce, serving as lifelines for economies worldwide [1,2,3,4]. Beyond their economic significance, ports are strategic assets critical to national security and resilience [5,6,7]. However, their significance also encompasses inherent risks, as they are susceptible to various unforeseen events and crises that can disrupt operations and pose significant challenges to management and recovery efforts [8]. The ability to comprehensively assess and evaluate these risks is paramount in effective crisis management and mitigation strategies. By mitigating or eliminating these risks, ports will become more efficient [9,10]. Given that the owners of goods request expedited passage through ports, as well as lower tariffs and transportation fees, ports have the capacity to meet these demands efficiently. Efficient and safe ports provide prompt and dependable services to their customers, resulting in increased revenue, customer attraction, satisfaction, and the ability to offer lower-cost services [11,12,13].
In today’s society, where increasingly complex systems are being implemented, system failures or accidents can cause disruptions at multiple levels and may be interpreted as societal threats. This is why all individuals within the system remain safe and the risk of harm is low [14]. The activity in ports exposes them to a multitude of risks, ranging from natural disasters to human-induced accidents [15,16,17]. The consequences of such events extend far beyond the confines of a port, impacting supply chains, regional economies, and even national security [18].
By assessing the liability for major accidents in specific regions of a port, researchers seek to delineate zones of extreme risk, high risk, medium risk, and low risk, providing decision makers with a nuanced understanding of the spatial distribution of vulnerabilities [19]. In recent years, the integration of soft computing techniques and geographic information system (GIS)-based models has emerged as a promising approach to enhance the effectiveness of spatial analysis and risk evaluation in port management [20,21]. Soft computing encompasses computational methodologies inspired by human cognition, such as fuzzy logic, neural networks, and genetic algorithms, which excel in handling uncertainty, complexity, and imprecision inherent in real-world data and decision-making processes [22]. Coupled with a GIS, which provides powerful spatial data management and visualization capabilities, these techniques offer a comprehensive framework for assessing and mitigating port-related risks [23].
A wide range of hazards and risks may arise during various operational procedures at each of the port terminals [24]. Terminal operators can ultimately improve service quality and productivity by effectively reducing losses and controlling tangible and intangible costs by implementing risk assessment and management practices at their facilities [25,26]. As a result, terminal operators are currently engaged in intense competition to determine the most effective method of mitigating the risks associated with managing the aforementioned operating systems and related activities [27]. Spatial analysis and risk evaluation are fundamental components of proactive port crisis management [28]. Spatial analysis enables the examination of geographic data to uncover patterns, relationships, and trends pertinent to port operations and vulnerabilities [29]. Meanwhile, risk evaluation entails the systematic assessment of potential threats and their likelihood of occurrence, as well as the severity of their consequences [30].
The complexity and dynamic nature of port operations necessitate the creation of a reliable framework for predicting and managing risks. Such a framework should be robust and adaptable and able to integrate various risk factors to provide accurate and actionable insights [31]. Consequently, it is imperative to assess potential risks and areas with high risk potential in ports using dependable methods to develop a comprehensive risk assessment model that enhances the operational efficiency and flexibility of ports.
In the context of port management, GIS technologies have emerged as key spatial analysis tools, providing valuable insights into the geographical distribution of risk and vulnerability. By integrating GIS and soft computing techniques, a novel approach can be used to improve the accuracy and efficiency of risk assessment processes. This study uses the fuzzy analytic hierarchical process (FAHP) and an emotional artificial neural network (EANN) to identify high-risk areas based on the primary causes of accidents. The objective of this study is to identify the most significant risks and hazards in the operational systems of Jazan Port in Saudi Arabia, followed by the presentation of risk management strategies. Moreover, another goal is to more accurately identify the port’s high potential risk zones, thereby reducing the associated life and financial losses through proper management during a potential hazard. Based on port experts’ opinions, a list of the main criteria and sub-criteria related to potential risks in ports is established. The weight of these criteria and sub-criteria is extracted using the proposed model. Finally, the port risk zoning map is presented using a GIS model.
The remainder of this paper is organized as follows: Section 2 provides a review of the relevant literature on spatial analysis, risk evaluation, and crisis management in port environments. Section 3 describes the methodology adopted for this study, including data collection, modeling techniques, and analytical procedures. Section 4 presents the results of the soft computing model and spatial analysis and risk evaluation conducted for Jazan Port, discusses the implications of these findings and offers recommendations for enhancing port crisis management practices. Finally, Section 5 concludes the paper with a summary of the key findings and suggestions for future research directions.
2. Literature Review
A risk assessment is a process that ranks or compares the results of risk analyses against predetermined decision-making objectives [32]. Prior to taking appropriate action, the risk assessment procedure establishes the evaluation criteria and determines the relative importance of each identified risk. Following the risk assessment process, control measures to reduce or eliminate risks should be implemented. The process of risk identification and prioritization is an essential component of risk management [33].
Mokhtari et al. [34] stated that the primary issue confronting port experts is a lack of appropriate methodological and evaluation techniques to support the risk management cycle. Therefore, in order to resolve ambiguities and ensure continuous risk control in port industries, they used fuzzy set theory to describe and evaluate risk factors in terminal management and port operations. An exploration case was utilized to implement their proposed framework, in addition to a general methodology and a risk assessment model. In conclusion, they asserted that their proposed model would facilitate decision support and risk assessments in any port. Using a new analytical tool for evaluating construction projects, Taylona et al. [35] demonstrated that their overall risks are imperfect and uncertain. This study identifies the key risk criteria for construction projects at King Abdulaziz University and evaluates these criteria using integrated hybrid methods. The proposed hybrid approach began with a survey to gather information. The relative importance index method was used to prioritize project risks based on the information gathered. The construction projects were then classified using fuzzy hierarchical analysis and fuzzy construction. The fuzzy hierarchy analysis process was used to generate desirable weights for fuzzy linguistic variables representing the overall risks of construction projects. Fuzzy construction methods are ideal for solving group decision-making problems in a fuzzy environment. Finally, the results show that this method can evaluate the overall risks of construction projects and select the project with the lowest risk using the relative importance index.
According to John et al. [36], port operations are fraught with uncertainty, with risk assessments being particularly difficult to carry out. Because a large portion of the existing data related to system operations are anonymous and ambiguous, a flexible but robust approach to moving quantitative and qualitative data is needed; it is necessary to update the existing information so that new data can become available. Their study also states that traditional risk modeling methods are deemed insufficient and inappropriate due to their inflexibility and inappropriate structure for dealing with system risks. In this study, the authors proposed a new fuzzy risk assessment approach to eliminate uncertainty in port operations and facilitate effective optimization in a systematic manner. This method combines the FAHP, an intuitive reasoning approach, fuzzy set theory, and demand preference. The FAHP is used to break down and analyze the complex structure of port operations, as well as to identify risk factors, and their synthesis is based on intuitive reasoning. This method provides a strong mathematical framework for joint system modeling as well as a systematic breakdown and analysis. According to Valdor et al. [37], pollution from oil spills is a widespread problem in the port area. Their paper describes a method for assessing the temporal and spatial bio-environmental risks of oil-handling equipment in the port area. They applied the K -means technique to large meteorological and oceanographic database acquisition groups, defining the most probable environmental conditions around offshore structures. Finally, numerical models and associated probabilities were used to estimate the bio-environmental risks for a specific discharge point as well as a chosen bio-environmental risk breakdown and analysis scenario. Lee et al. [38] conducted an investigation employing a scenario-driven hazard analysis, vulnerability assessments, and risk evaluations. Employing the GIS methodology, they constructed spatial data of the affected area and conducted a hazard analysis of an explosion incident integrated with three-dimensional explosion modeling. Bilașco and Ma [39] implemented a comprehensive methodology focusing on a spatial analysis model grounded in the AHP. Utilizing an array of spatial datasets, this model delineates the geographic dispersion and attributes of traffic incidents to ascertain their cumulative national repercussions and pinpoint high-risk zones. The spatial repository, housing traffic accident data, is developed through geocoding methods and amalgamated via network analysis to assess impact relative to distance. The AHP framework is deployed to scrutinize impact across five principal dimensions: accident severity, occurrence patterns, prevailing weather conditions, traffic regulations, and road signage. This multi-tiered AHP evaluation not only identifies high-risk clusters but also validates the efficacy of the proposed spatial model.
The existing literature on port crisis management and risk assessment demonstrates significant progress in the application of various analytical and computational techniques. Moreover, studies have successfully employed fuzzy set theory and hierarchical analysis to address risk factors and prioritize project risks, respectively. These studies have further extended the application of fuzzy logic to environmental risk assessments in port operations, highlighting the necessity for flexible and robust approaches. Despite these advancements, there remains a notable gap in integrating these methods within a comprehensive GIS-based framework to enhance spatial risk evaluations. This study addresses this gap by combining the FAHP and EANN within a GIS context to create a nuanced risk zoning map for Jazan Port. This integrated approach not only improves the accuracy of risk identification but also facilitates practical applications in port crisis management, thereby contributing both methodologically and practically to the field. This study made an effort to answer the following question: how can integrating soft computing techniques with a GIS improve the identification and management of high-risk zones in port environments, specifically in Jazan Port, Saudi Arabia?
3. Case Study Area Description
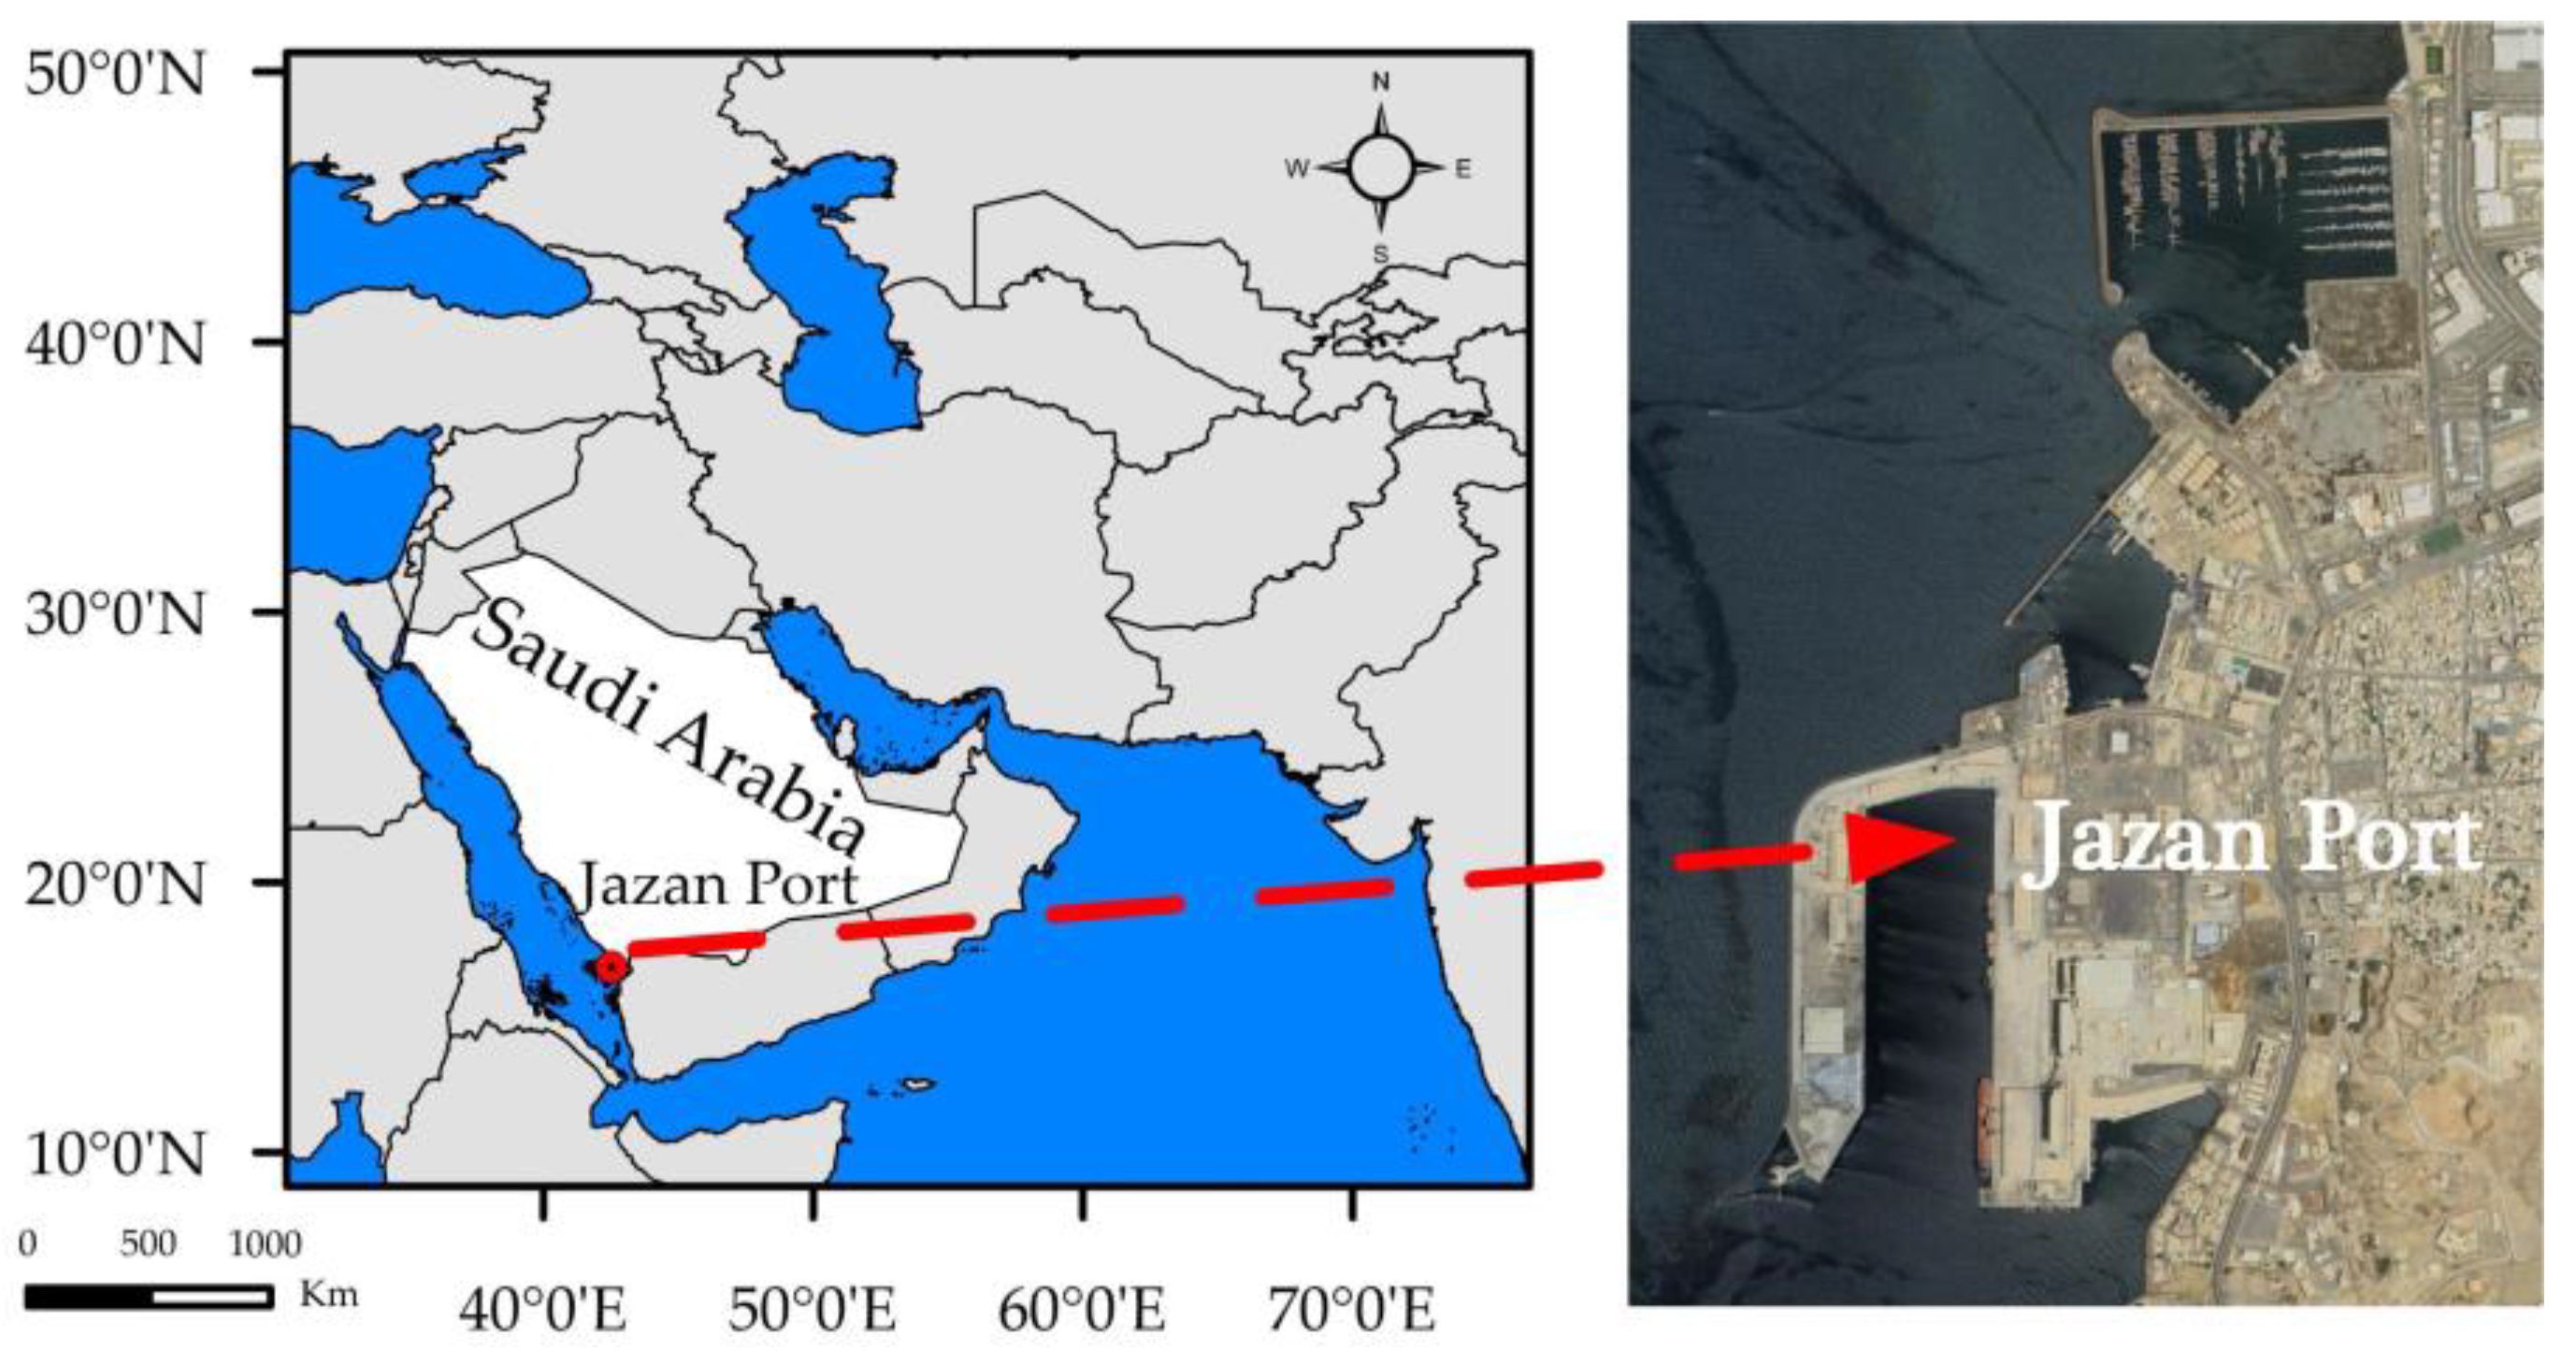
This study focused on Jazan Port, located on the southwestern coast of Saudi Arabia [40]. Jazan Port stands as a critical maritime gateway connecting the Kingdom to international trade routes and serving as a pivotal hub for regional economic development initiatives [41]. Established to support the burgeoning industrial sector in the Jazan region, the port plays a multifaceted role in facilitating the import and export of goods, supporting the energy sector, and fostering economic diversification efforts [42]. Strategically located at the crossroads of key shipping lanes in the Red Sea and the Arabian Sea, Jazan Port boasts a prime geographic position that enables it to serve as a vital conduit for trade between Asia, Africa, Europe, and the Middle East. Its proximity to major maritime routes, including the Suez Canal and the Bab-el-Mandeb Strait, positions it as an essential transshipment hub for cargo destined for the Arabian Peninsula and beyond (Figure 1).
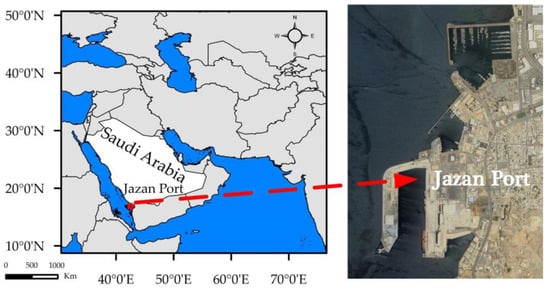
Figure 1.
Study Area Jazan Port in Saudi Arabia.
Jazan Port encompasses a comprehensive array of infrastructure and facilities tailored to meet the diverse needs of modern maritime commerce. The port features multiple terminals specializing in containerized cargo, bulk commodities, and general cargo, equipped with state-of-the-art handling equipment and storage facilities. Additionally, the port is home to specialized terminals catering to the petrochemical industry, supporting the export of refined petroleum products and petrochemical derivatives produced by the nearby Jazan refinery and associated industrial complexes. With a strategic vision to enhance its operational capabilities and accommodate growing trade volumes, Jazan Port has undergone significant expansion and modernization initiatives in recent years. Investments in dredging, berth infrastructure, and logistical support systems have bolstered the port’s capacity to handle larger vessels and increased cargo throughput, positioning it as a key player in the global maritime trade landscape. Despite its strategic importance and substantial investments in infrastructure development, Jazan Port faces a range of challenges and vulnerabilities that pose risks to its operational efficiency and resilience. Situated in a region marked by geopolitical tensions and security risks, Jazan Port is exposed to potential disruptions stemming from regional conflicts, maritime piracy, and geopolitical rivalries. The port’s coastal location renders it susceptible to natural hazards such as tropical cyclones, storm surges, and coastal erosion, which can affect port operations and infrastructure integrity. Limited hinterland connectivity and inadequate transportation infrastructure pose logistical challenges for cargo movement to and from the port, hindering its competitiveness and efficiency in the global market [43,44].
4. Methodology
Implementing zoning regulations to partition the port into distinct zones and conducting risk assessments for major incidents within each zone can significantly contribute to accident prevention. Consequently, addressing this matter may yield outcomes grounded in scientific hypotheses and furnish the port department with a general framework for implementation. Furthermore, the port is assessed with respect to geopolitical parameters. This is achieved through the utilization of GIS functionalities and the novel soft computing model, which enables the identification of high-risk regions based on the primary determinants.
This FAHP-EANN-based study was conducted in 2022 with the assistance of twenty-four specialists in the field of ports and coastlines. A comprehensive literature review, the development of a risk assessment questionnaire, and the creation of a novel method integrating soft computing and GIS-based model risk assessments for ports comprised the study’s methodology. The average age and work experience of the 24 experts involved in this study were 38.89 ± 8.12 and 13.21 ± 8.18 years, respectively. In addition, 16 of these individuals held master’s degrees, while 8 held doctoral degrees. The questionnaire questions are listed in Appendix A.
4.1. Fuzzy Analytic Hierarchical Process (FAHP)
The AHP is one of the most famous multi-criteria decision-making methods. This method is used when there are several options and several quantitative or qualitative criteria for decision making. In this method, on the basis of a certain goal and by using different criteria or metrics and giving weight to each of them, it is possible to choose the best or superior option for a specific goal from among different options, and other options are also based on the overall weight they gain is rated. Fuzzy logic is a very useful tool for measuring fuzzy concepts related to subjective judgments [45,46].
The fundamental framework for this approach was formulated as an inquiry-based system to assess the environmental efficacy of ports. During the final phase, the questionnaires pertaining to the analytic hierarchical process (AHP) were initially distributed to the experts [47]. Subsequently, these questionnaires were gathered and examined for validity. To identify invalid questionnaires, the inconsistency rate was computed on the pairwise comparison matrices and questionnaires. In the third step, the fuzzy weights of each of the six factors and their corresponding parameters in the developed questionnaire were established, utilizing the AHP. In light of this, the tool and method for assessing environmental performance in ports through the FAHP were developed by assigning weights to each parameter.
A variety of methods are presented for ranking and weighting criteria and sub-criteria through the use of fuzzy logic and the AHP [48]. This investigation was carried out utilizing the approach outlined by Chang [49] due to its straightforward implementation compared to alternative methodologies and its consistent provision of precise outcomes. Triangular fuzzy numbers are the most practical shape among the various varieties of fuzzy numbers. The notation A= (l, m, u) represents a triangular fuzzy number, where l, m, and u denote the attributes of a fuzzy set, respectively. The upper limit denoted by u represents the maximum possible values for the fuzzy number A. The minimum value is denoted by l. The most probable value of a fuzzy number is denoted by m [50]. Notably, discrepancies and errors that arise during the comparison and assessment of the relative significance of options and indicators distort the final result of the calculations; therefore, it is imperative to validate the answers and data provided by the specialists. The validity of the answers and data provided by experts was assessed using this method, which relied on the rate of inconsistency. A consistency rate of 0.1 or lower signifies comparison consistency, thereby confirming the validity of the respondents. Consequently, the rate of inconsistency was computed for each matrix containing pairwise comparisons, and responses deemed invalid were omitted from the research [49]. Following the collection of information and expert opinions and the verification of the information’s reliability, a total pairwise comparison matrix is generated for each level. This matrix’s entry is determined by averaging the opinions of the experts. Various methods are employed to determine the average matrix and the relative weights of the criteria and sub-criteria. These methods include the geometric mean, arithmetic mean, row sum, and column sum. The geometric mean method is implemented in this study. Before calculating the weights of the options using this method, the geometric mean and normalization of the rows of the standard matrix are obtained. Following the calculation of the relative weights of general and sub-criteria, the factors and sub-factors that are most effective are determined. The determination of the final weight of the options in a hierarchical process involves multiplying the weight of the options by the importance of the criteria. In pursuit of this objective, the ‘hierarchical combination’ principle is implemented, resulting in a priority vector that takes into account all evaluations across all hierarchical tiers [51].
4.2. Emotional Artificial Neural Network (EANN)
The EANN model derives from the emotional behavior of humans [52,53,54,55]. The EANN finds utility across a multitude of applications, owing to the distinctive attributes attributed to this cerebral region. Among these characteristics are its rapid response to stimuli resulting from the presence of short paths and a component that functions as a modifier for inappropriate responses and reactions [56,57]. The EANN comprises the orbito-amygdala, frontal thalamus, and sensory cortex. In response to stimuli or inputs, the model follows two paths: the direct path is quick and has a low information load, while the indirect path has a greater information load. The EANN is based on the emotional learning of the brain. The number of nodes in each section of this model is equivalent to the number of inputs, with the exception of the amygdala, which contains an extra node. In addition, the final output of the model is computed using Equation (1).
where and are the amygdala and orbitofrontal outputs, which are defined as Equations (2) and (3):
where v and w are the respective weights and b is the bias. In addition, S, which is actually the extension link between the thalamus and the amygdala, is calculated as Equation (4).
The existence of the max operator does not make it suitable for system identification. The model cannot be derived, so it is inapplicable for system identification applications such as model-based control methods. By correcting this section, the model can be used to identify systems. The proposed method for fixing the expansion link is described by Equation (5):
Therefore, the output of the model is rewritten as Equations (6) and (7):
where is the weight associated with the expansion link or the amygdala’s n + 1 input, as calculated from Equation (5), so the model is ready to model complex non-linear systems. In fact, by determining appropriate weights, the model is able to detect non-linear behavior in systems and processes. During the training phase, the goal is to find the optimal weights.
EANN models feature a synthetic sensing mechanism that can secrete hormones to modulate the activity of neurons or nodes. The hormone’s weight value adjusts based on the input and output values of the network’s nodes. Each node in the EANN is capable of generating dynamic hormones Hoa, Hob, and Hoc, facilitating the continuous exchange of information between input and output components via a dynamic hormone generator.
During the initial training phase, the coefficients are aligned based on the correlation between inputs and outputs. This alignment is then refined through iterative processes. Hormonal coefficients influence node components such as the activation function, net function, and weights. The output of the EANN model, incorporating the hormones Hoa, Hob, and Hoc, is expressed as shown in Equation (8).
In this context, h, i, and j correspond to the input neurons, hidden layers, and output layers, respectively. The function denotes an activation function. Equation (9) quantifies hormones. The statistical neural weight and the harmonic weight are applied to . The second and third components are associated with the applied weights. The net function and the input value are determined by neuron j in the preceding layer. The fourth component includes the bias of the network function, which encompasses neuronal and hormonal weights , , , , and . These parameters regulate the hormone level (Hoh) for each hormone. The neuron’s output () provides hormonal feedback to the system, as described in Equations (9) and (10). Proper calibration of the EANN’s glandity throughout the training phase is crucial to ensure that the gland receives the appropriate hormone levels [58].
4.3. Integrated FAHP-EANN-GIS Model
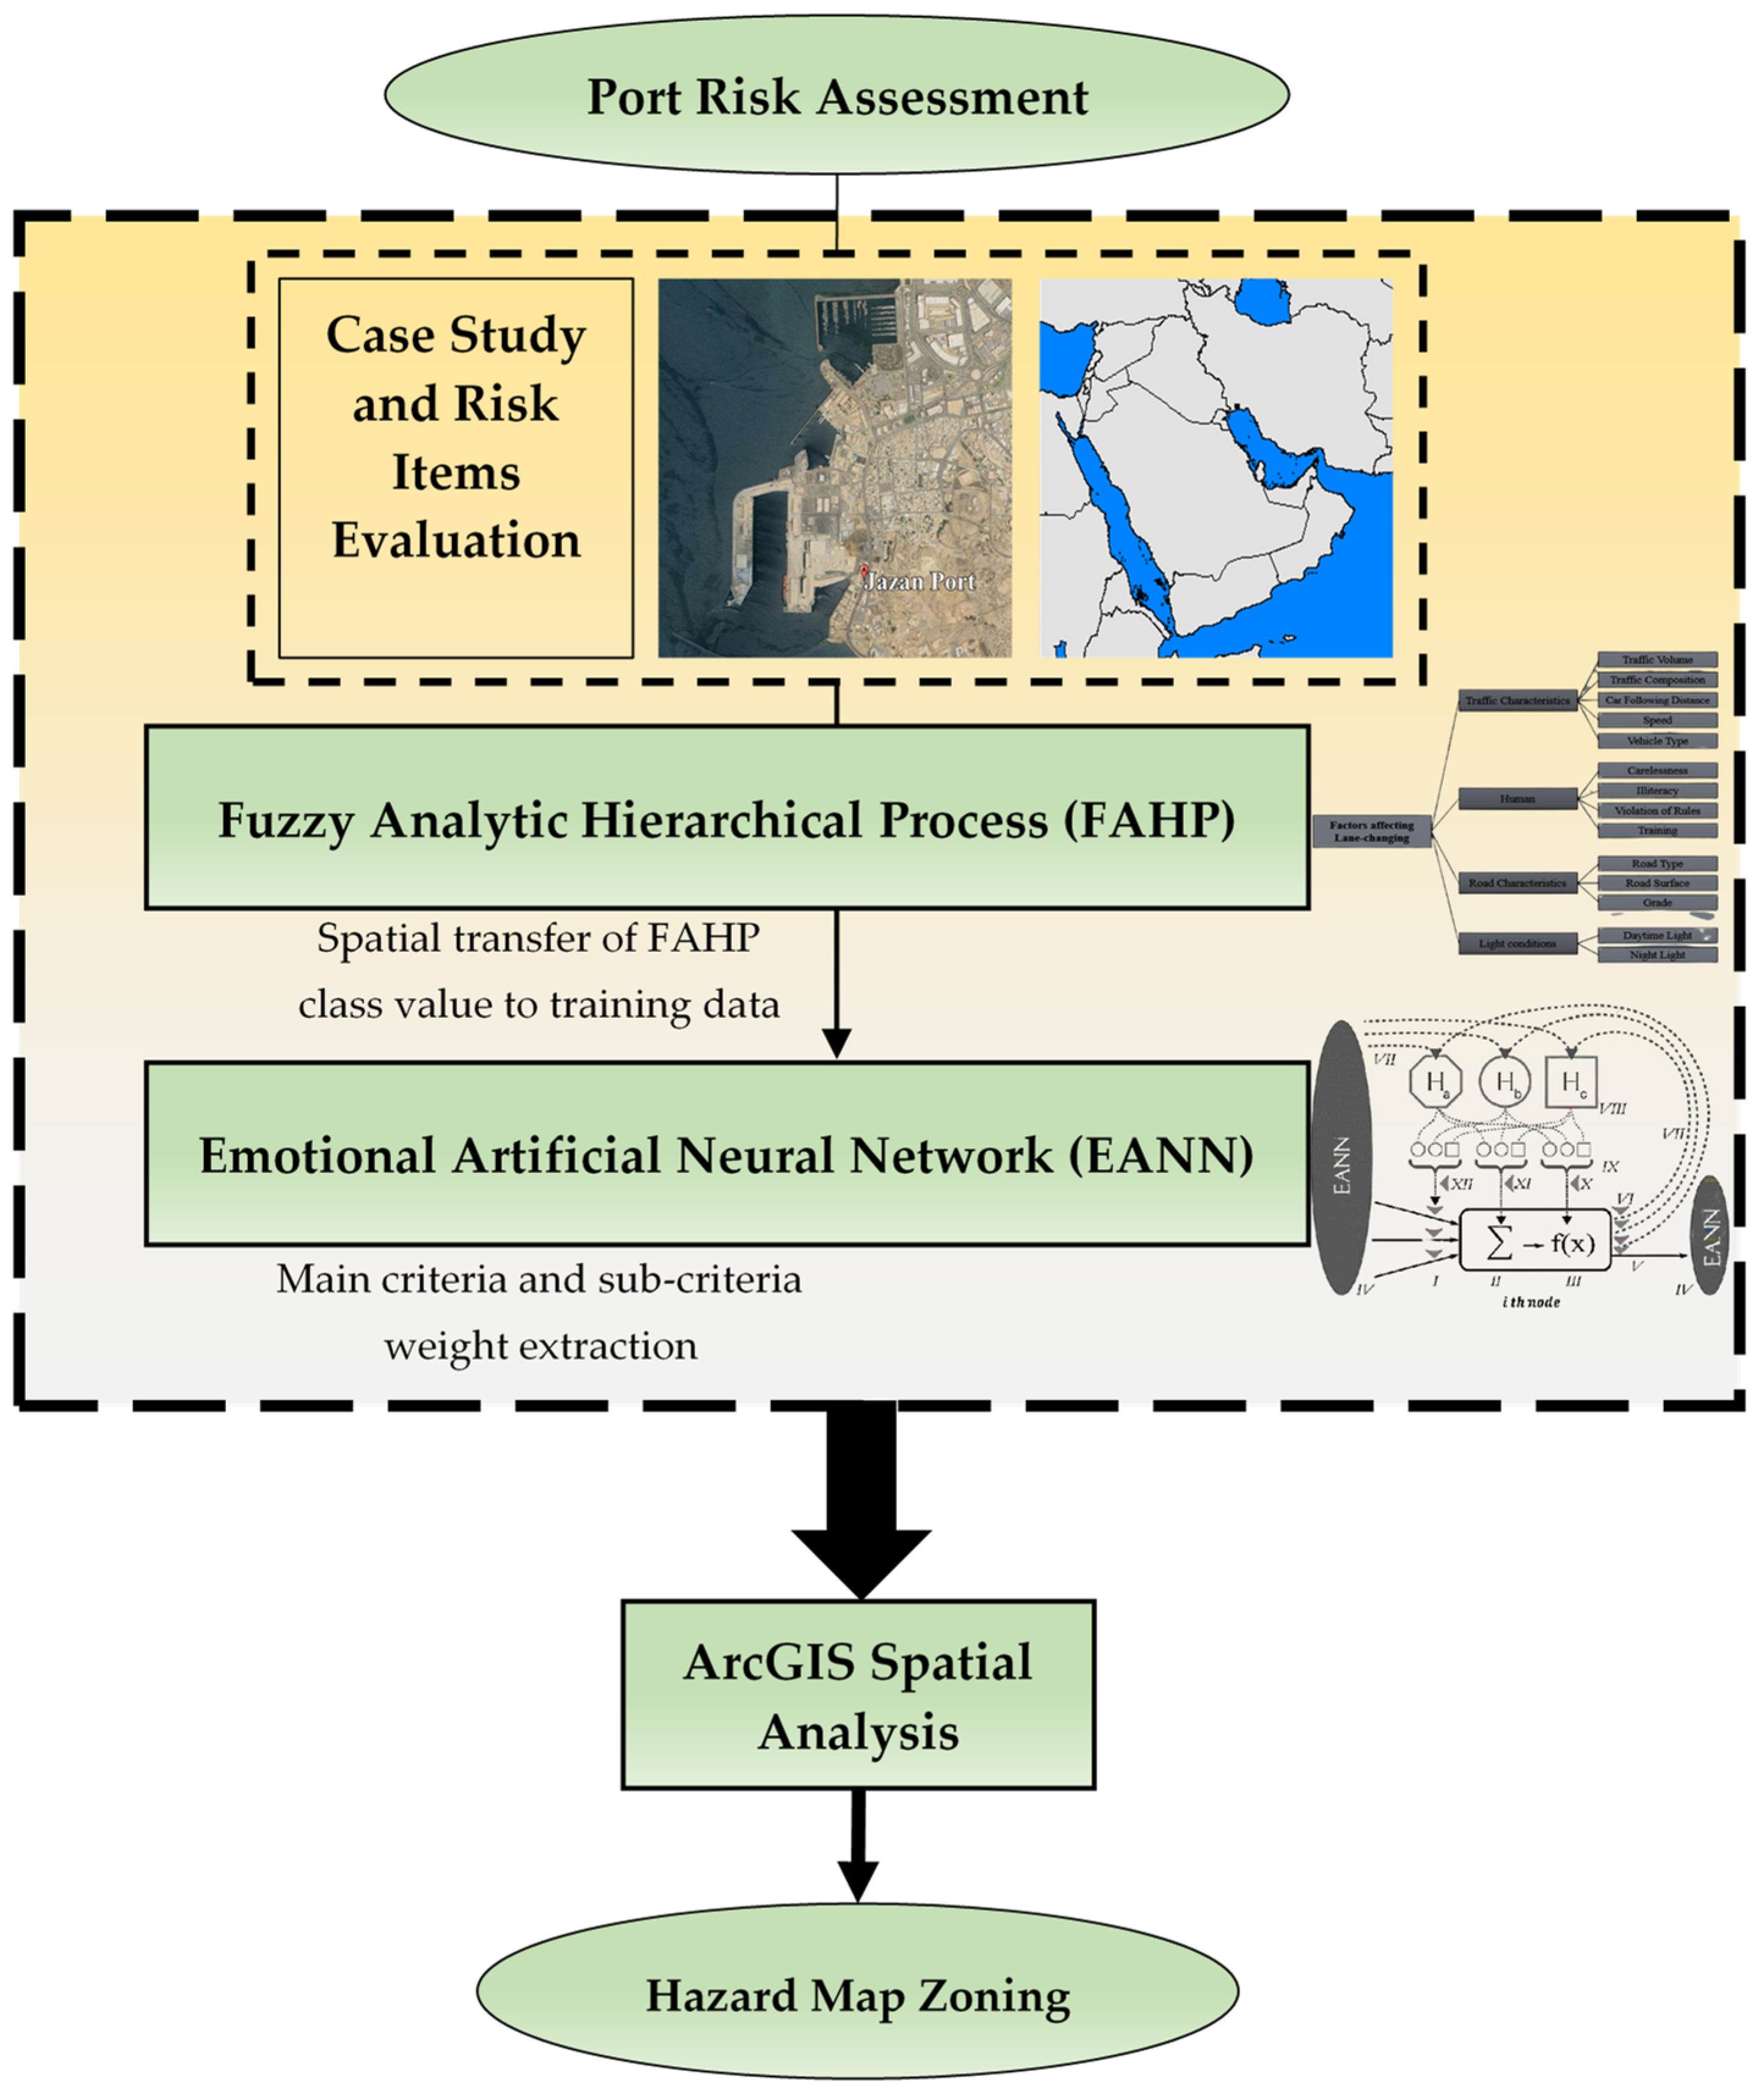
This study hypothesizes that the integration of the FAHP and an EANN within a GIS framework will provide a more precise identification of high-risk zones in port environments. The EANN model can produce more reliable results using less data. Molajou et al. [58] findings show that the EANN model can achieve better results with less data than the classic ANN model. The methodology involves collecting data on various risk factors, applying the FAHP-EANN model to assess these risks, and using GIS tools to visualize and analyze the spatial distribution of these risks within Jazan Port. The EANN model consists of general units of function and input calculations. Each input is assigned a weight, which indicates how it affects the overall output. The weights can be optimized to minimize the error function using the back propagation algorithm. The model structure includes default values that, for whatever reason, may not be appropriate for the researcher’s desired model and goal, resulting in an incomplete and incorrect implementation or output. Furthermore, model design is critical to reducing complexity while maintaining acceptable accuracy. Regularization techniques, such as generalization and interference immunity, can improve network stability by summarizing the model by increasing the number of training data (the FAHP model is used in this study) and using organizing techniques to protect the model from overfitting. Figure 2 shows the framework of the proposed model based on the FAHP and EANN.
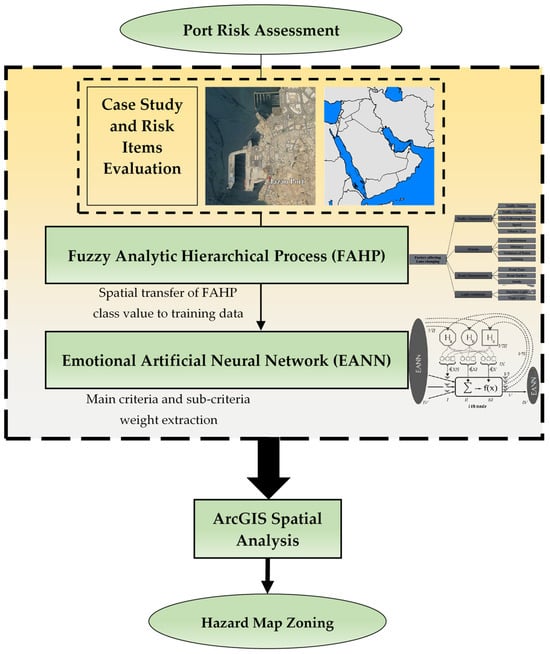
Figure 2.
Framework of the proposed model based on FAHP-EANN and GIS spatial analysis.
The integration of the FAHP and EANN leads to more precise and actionable risk assessments, the EANN can continuously learn and adapt based on the structured inputs from the FAHP. Compared to traditional risk assessment methods, the FAHP-EANN approach offers several advantages. The combined method enhances the precision of risk identification and prediction by continuously learning from new data and expert input. By considering both qualitative and quantitative factors, the method provides a more comprehensive assessment of risks. The approach is scalable and can be applied to various port environments and logistics scenarios, adapting to different conditions and requirements.
5. Results
The risk assessment questionnaire regarding ports includes six factors of land accidents, natural disasters, land fires, pollution and dangerous substances, facilities and infrastructures, and human behavior. Meanwhile, there are 35 sub-factors in the risk assessment of the port. Falling from a height, objects falling on people, vehicle accidents, electrocution, cuts and limb defects, burns, the inhalation of toxic gases, employee conflicts, and employee diseases were all considered when evaluating human behavior. Electricity interruption, communication system interruption, alarm system failure, data system failure, and port software failure are all factors that affect facilities and infrastructure. Pollution and hazardous substances include drinking water contamination, noise pollution, waste pollution, air pollution, toxic gas emissions, and oil pollution emissions. Land fire includes fire caused by electricity, fires of waste materials, car fires as a result of accidents, fires of goods, fires of flammable materials, building fires, and fires of oil tanks. Natural disasters include earthquakes, severe storms, thunderbolts, waves, tides, and floods. Land accidents include vehicles falling into water, vehicle accidents, and land equipment accidents. Table 1 shows all the criteria and sub-criteria.

Table 1.
Research criteria and sub-criteria based on expert option.
5.1. Weight Determination for Criteria and Sub-Criteria
There are two stages to determining weight in the EANN model. In the first stage, weights are chosen at random. To train better and faster, all of the network’s weights are randomly assigned between −0.50 and 0.50. Others are randomly assigned initial weights between −0.2 and 0.2. In the second step, the software determines the final weight of each factor in the EANN model. During the network’s learning stage, weight values are changed in each repetition using Equations (11)–(17) to achieve the desired weight values.
where, wij, is the weights between the processor units and oi is the output of the ith processor unit, which is obtained from Equation (12).
where f, the active function, is typically a nonlinear function that transfers the set of output weights from one layer to the next. The model error (E) rate for a specific input pattern is a function of the desired output vector (d) and the actual output vector (o), as shown in Equation (13).
The process of the forward and post propagation of the error is repeated until the time when the error of the entire network is minimized or reaches the desired value. The error propagation algorithm is used to determine the weights of each factor, and we use these data for classification. The importance of the output, which is the output of each node of the output layer, is obtained from Equation (14).
This equation yields both positive and negative results. If the size of the effects is arbitrary, the importance (weight) of the processor unit and its proportionality to the other processor unit oi in the hidden layer can be calculated as a ratio of the absolute value of the derivative of Equation (14) (Equation (15)).
The results calculated via Equation (15) for a specific processor unit in the output layer show that the relative weight of a processor unit in the hidden layer is a ratio of the absolute value of the connection weight between the hidden layer’s processor unit and the output layer when the network includes output layers with multiple processor units. Then, Equation (15) can not be used to compare two processor units in the hidden layer; instead, Equations (16) and (17) are used when there are multiple processor units in the output layer.
According to the results of the proposed model, the weight of each risk was obtained. The results of these factors are presented in Table 2.
Table 2.
Calculated weight of possible risks in port using EANN model.
5.2. Port Risk Assessment
Ports are thought to be locations where various types of goods, such as bulk goods, petroleum, and dangerous goods, are transported. On the other hand, the port area’s heavy traffic of goods transportation vehicles and related equipment makes it a high-risk area for accidents and incidents. To create a risk distribution map in the port, we identify areas with a higher risk of accidents. The table depicts the main accident risk in the six investigated regions (Table 3).
Table 3.
The risk rating of possible major accidents in the six zones of Jazan Port, Saudi Arabia.
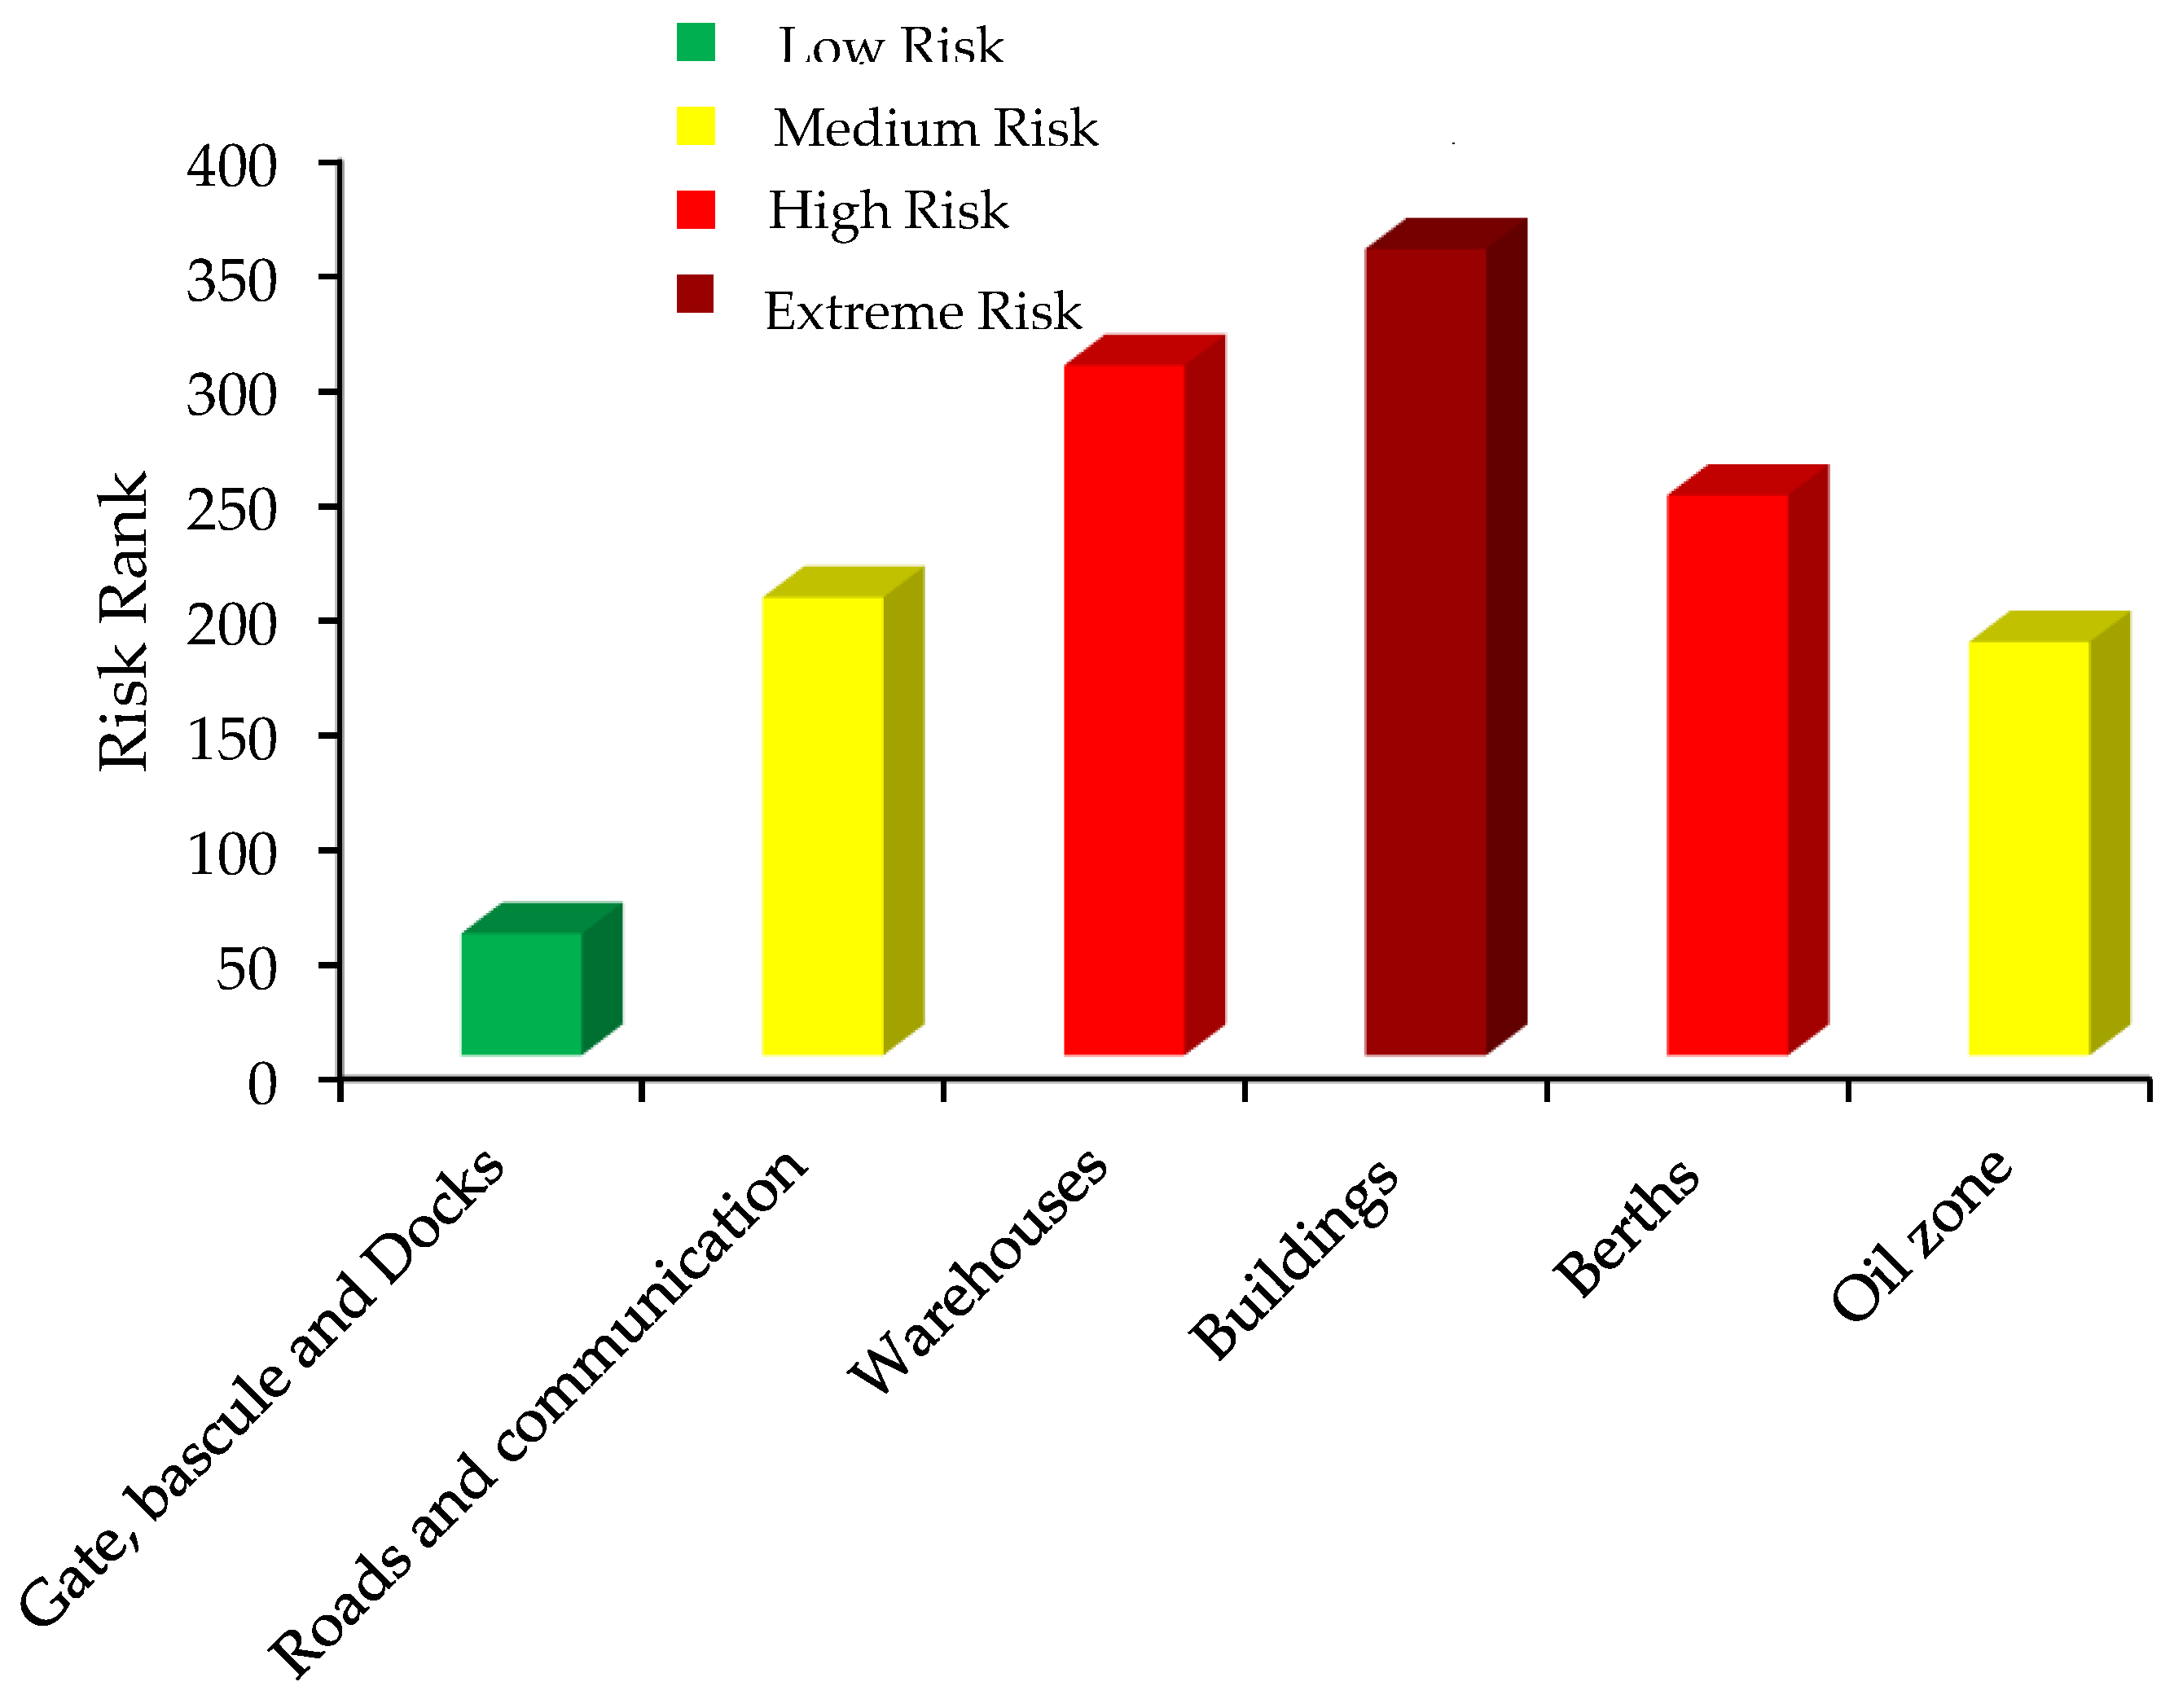
William Fine’s method was used for the risk assessment. This method considers risk as a function of the probability of the occurrence of danger, its consequences, and the level of contact with danger. In this study, areas with a rank greater than 350 are considered extreme-risk zones, zones with a rank between 201 and 350 are considered high-risk zones, zones with a rank between 91 and 200 are considered medium-risk zones, and zones with a rank less than 90 are classified as low-risk zones (Table 4).
Table 4.
Risk ranking and necessary measures to eliminate the risk.
According to the total weight and rank of possible partial accidents in the port and the ranks of the general categories of accidents that were extracted using this score, it is possible to prepare maps for each of the general categories of the score in different areas of the port. As a general danger zone, Jazan Port was prepared by using the specified weights. The preparation of this map is of great help to the crisis management in the phase of crisis prevention and gives a general view of the dangerous and risky areas of the port at the disposal of the decision makers of Jazan Port crisis management. The score of each of the spatial data layers is calculated according to the mentioned method and given in Figure 3.

Figure 3.
Risk ranking for various zones in Jazan Port, Saudi Arabia.
According to the risk ranking map of different areas in Jazan Port, which is obtained from the proposed model, it is possible to draw the risk zoning of the port with the help of the spatial information system tool as a comprehensive science with a holistic view and taking into account the influencing factors and risks. The risk zoning map of Jazan Port is given in Figure 4. This map is expected to be an effective tool to help the managers and decision makers of the Jazan Port safety field and is can be used in planning for the allocation or relocation of safety equipment to high-risk locations.
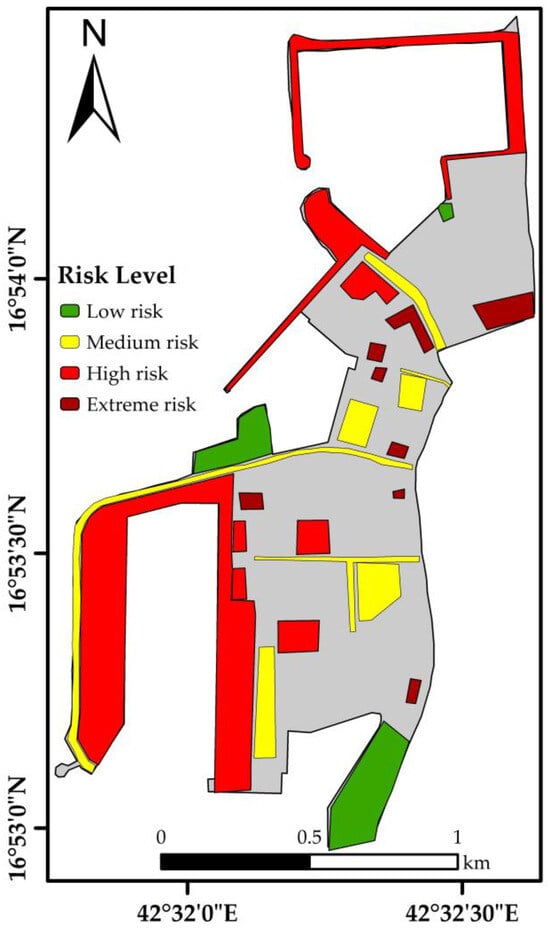
Figure 4.
Risk zoning map of Jazan Port in Saudi Arabia.
6. Discussion
Table 1 and Table 2 illustrated the weighted importance of various risk factors affecting port operations. The highest weights are assigned to factors such as ‘natural disasters’ and industrial accidents, indicating their significant impact on port safety and operational continuity. This prioritization aligns with previous studies that emphasize the vulnerability of ports to extreme weather events and human-induced hazards [59,60,61,62]. While novel hybrid prediction models have been presented in recent scientific research [63], the proposed model in this study produced reliable results. The relatively lower weights for factors like ‘cyber threats’ suggest that, while important, they are perceived as less immediate threats compared to physical risks. This weighting informs our risk mitigation strategies, suggesting a focus on enhancing infrastructure resilience and emergency preparedness.
Table 3 indicates that different zones within Jazan Port have varying levels of risk associated with potential major accidents. The highest risks are observed in zones handling critical operations such as oil, buildings, and warehouses, highlighting the need for focused risk mitigation strategies in these areas. The significant variability within zones underscores the importance of localized risk assessments and tailored safety measures to address specific vulnerabilities. This comprehensive risk rating framework provides valuable insights for port authorities to prioritize safety interventions and enhance overall port safety and resilience. The risk ratings in gate, bascule, and dock zones vary significantly, with the highest risk recorded at 119.6 and the lowest at 4.9. The average high rating of 95.6 indicates a critical need for stringent safety measures and frequent monitoring, especially considering the zone’s role as an entry point and hub for docked vessels. The relatively lower ratings in some areas suggest targeted risk factors, possibly less intense activities or better safety practices in place. Buildings within the port exhibit the highest variability in risk ratings, ranging from 5.7 to 1460.9. The extremely high rating of 1460.9 signifies a substantial risk of major accidents, potentially due to high occupancy, valuable assets, or complex operations. This necessitates urgent risk mitigation strategies, such as enhanced structural safety measures and emergency preparedness drills. The lower end of the spectrum, with ratings around 5.7, indicates some buildings are either less critical or have better safety protocols. Road and communication zones also shows a broad range of risk ratings, with the highest at 817.2 and the lowest at 2.8. The high risk associated with roads and communication infrastructure (817.2 and 322.3) suggests significant exposure to accidents, likely due to high traffic volumes and the critical nature of communication networks. The lower ratings indicate areas where traffic is less dense or where better traffic management practices are in place.
Warehouses demonstrate substantial risk variability, with ratings from 38.4 to 890.06. The highest rating of 890.06 reflects considerable risk, possibly due to the storage of hazardous materials or high-value goods, necessitating robust safety and security measures. The middle-range ratings (e.g., 184.9) suggest moderate risks, possibly from the type of goods stored or operational practices, requiring regular safety audits and risk assessments. The berth zone presents a wide range of risk ratings, from 14.8 to 584.6. High-risk ratings in this zone (e.g., 584.6) indicate significant accident potential, likely due to vessel docking operations, cargo handling, and proximity to the water. This underscores the need for strict adherence to safety regulations and the continuous monitoring of berth activities to prevent accidents. Lower ratings indicate areas with potentially less hazardous operations or effective risk management practices. The oil zone exhibits high variability in risk ratings, with a peak of 730.5 and a low of 14.3. The highest risk rating (730.5) highlights the severe potential for major accidents, possibly due to the volatile nature of stored materials and the complex handling processes involved. This calls for the implementation of stringent safety protocols and emergency response plans. The lower risk ratings suggest areas where safety measures are more effective or the risk factors are less pronounced.
Based on Figure 3 and Figure 4, the extreme-risk and high-risk zones, particularly buildings, warehouses, and berths, require focused attention and the immediate implementation of enhanced safety measures. The extreme-risk rating for buildings may be due to the dense concentration of personnel, valuable assets, and critical operations housed within the buildings. The berth zone indicates significant vulnerabilities due to activities such as vessel docking, cargo handling, and proximity to the water. The warehouse zone falls into the high-risk category, reflecting the substantial hazards associated with the storage of various goods, including hazardous materials.
Medium-risk zones such as roads and communication and the oil zone also necessitate ongoing monitoring and improvements in risk management strategies. Low-risk areas like gate, bascule, and docks demonstrate effective risk management but should not be neglected to ensure they remain secure. This detailed analysis provides a comprehensive understanding of the risk distribution within Jazan Port, guiding port authorities in prioritizing safety interventions and resource allocation to enhance the overall port safety and resilience.
7. Conclusions
Based on the methodology implemented in this study, integrating zoning regulations within the port and conducting risk assessments for major incidents in each zone can significantly contribute to accident prevention. This approach provides a scientific framework for implementing preventive measures and effectively addressing port crises. Utilizing GIS functionalities and a novel soft computing model, the port’s risk assessment considers geopolitical parameters, enabling the identification of high-risk regions based on primary determinants.
The methodology encompassed a comprehensive literature review, the development of a risk assessment questionnaire, and the creation of a method integrating soft computing and GIS-based models for port risk assessments. The integration of FAHP and EANN models within a GIS provides a holistic approach to port risk assessment, determining the weights for each risk factor and identifying high-risk areas within the port. By considering factors such as human behavior, facilities and infrastructure, pollution, natural disasters, land fires, and land accidents, the study generated a comprehensive risk assessment framework.
The risk assessment results were used to rank and categorize potential major accidents within different zones of Jazan Port, Saudi Arabia. Risk reduction measures were proposed based on the severity of risks, ranging from extreme- to low-risk levels. The spatial analysis conducted using GIS tools enabled the preparation of risk zoning maps, providing decision makers with valuable insights for crisis management and preventive planning. The risk assessment framework can be directly applied by port authorities to prioritize safety measures and allocate resources effectively. For instance, the high-risk ratings in the building and berth zones suggest an immediate need for structural reinforcements, advanced monitoring systems, and comprehensive emergency preparedness plans. The medium-risk zones, such as roads and communication and the oil zone, can benefit from enhanced traffic management systems and regular safety audits. Implementing these recommendations can significantly reduce the likelihood of major accidents and enhance overall port resilience.
This study has several limitations that should be considered. Firstly, the research relies heavily on specific data sets from Jazan Port, which may limit the generalizability of the findings to other ports with different data characteristics. Secondly, the integration of the FAHP and EANN within a GIS framework necessitates significant computational resources and expertise, potentially posing challenges for their implementation in ports with limited technological infrastructure.
Despite these limitations, the implications of our research are substantial. Practically, the integrated FAHP-EANN-GIS framework provides a powerful tool for port authorities to accurately identify high-risk zones and implement effective crisis management strategies. This approach can lead to significant reductions in both life and financial losses during port-related crises. This study advances the field of risk assessment and spatial analysis by demonstrating the potential of soft computing techniques to improve the precision and efficiency of crisis management efforts. The integration of soft computing techniques with a GIS should be further refined to ensure broader applicability, and the application of this model should be investigated in various port settings in future research.
Author Contributions
Conceptualization, M.H.A. and B.M.A.; methodology, M.H.A. and A.F.A.; software, M.H.A. and B.M.A.; validation, M.H.A. and H.T.S.; formal analysis, A.F.A. and H.T.S.; investigation, H.T.S. and A.F.A.; resources, B.M.A.; data curation, M.H.A. and B.M.A.; writing—original draft preparation, M.H.A.; writing—review and editing, B.M.A.; visualization, A.F.A. All authors have read and agreed to the published version of the manuscript.
Funding
This research received no external funding.
Institutional Review Board Statement
Not applicable.
Informed Consent Statement
Not applicable.
Data Availability Statement
The raw data supporting the conclusions of this article will be made available by the authors on request.
Acknowledgments
This project was funded by the Deanship of Scientific Research (DSR), King Abdulaziz University, Jeddah, under grant no. (G: 252-980-1442). The authors, therefore, acknowledge with thank the DSR technical and financial support.
Conflicts of Interest
The authors declare no conflicts of interest.
Appendix A. Questionnaire
Appendix A.1. General Information
- Name of the Assessor:
- Work Experiences
- Age:
- Date of Assessment:
- Zone Being Assessed (e.g., Buildings, Roads, Warehouses, Berths, Oil Zone):
- Weather Conditions During Assessment:
Appendix A.2. Criteria and Sub-Criteria Evaluation
- A.
- Human Factors
- 1.
- Occupancy Levels
- ➢
- On average, how many people are present daily?
- ○
- Less than 10
- ○
- 10–50
- ○
- 51–100
- ○
- More than 100
- ➢
- Importance of this factor?
- ○
- Very low
- ○
- Low
- ○
- Moderate
- ○
- High
- ○
- Very high
- 2.
- Training and Awareness
- ➢
- How often are safety training sessions conducted?
- ○
- Monthly
- ○
- Quarterly
- ○
- Annually
- ○
- Never
- ➢
- What percentage of personnel are trained?
- ○
- 0–25%
- ○
- 26–50%
- ○
- 51–75%
- ○
- 76–100%
- ➢
- What types of safety drills are conducted?
- ○
- Fire drills
- ○
- Evacuation drills
- ○
- Equipment handling drills
- ○
- Other: ___________
- ➢
- Importance of this factor?
- ○
- Very low
- ○
- Low
- ○
- Moderate
- ○
- High
- ○
- Very high
- B.
- Facilities and Infrastructure
- 3.
- Structural Integrity
- ➢
- When was the last structural audit conducted?
- ○
- Less than 6 months ago
- ○
- 6 months to 1 year ago
- ○
- 1–2 years ago
- ○
- More than 2 years ago
- ➢
- What were the major findings from the last audit?
- ○
- No issues
- ○
- Minor issues
- ○
- Moderate issues
- ○
- Major issues
- ○
- Critical issues
- ➢
- What actions have been taken to address audit findings?
- ○
- None
- ○
- Some issues addressed
- ○
- Most issues addressed
- ○
- All issues addressed
- ➢
- Importance of this factor:
- ○
- Very low
- ○
- Low
- ○
- Moderate
- ○
- High
- ○
- Very high
- 4.
- Maintenance Practices
- ➢
- How often is routine maintenance conducted?
- ○
- Daily
- ○
- Weekly
- ○
- Monthly
- ○
- Annually
- ➢
- Are maintenance activities properly documented?
- ○
- Yes
- ○
- No
- ➢
- Are there any outstanding maintenance issues that need immediate attention?
- ○
- Yes
- ○
- No
- ➢
- Importance of this factor:
- ○
- Very low
- ○
- Low
- ○
- Moderate
- ○
- High
- ○
- Very high
- C.
- Pollution and Environmental Impact
- 5.
- Pollution Levels
- ➢
- What types of pollutants are monitored?
- ○
- Air
- ○
- Water
- ○
- Soil
- ○
- Noise
- ➢
- What have been the pollution levels over the past 6 months?
- ○
- Below standard limits
- ○
- At standard limits
- ○
- Above standard limits
- ○
- Significantly above standard limits
- ➢
- What measures are in place to control pollution?
- ○
- Air filters
- ○
- Water treatment
- ○
- Noise barriers
- ○
- Other: __________
- ➢
- Importance of this factor:
- ○
- Very low
- ○
- Low
- ○
- Moderate
- ○
- High
- ○
- Very high
- 6.
- Waste Management
- ➢
- What methods are used for waste disposal?
- ○
- Incineration
- ○
- Landfill
- ○
- Recycling
- ○
- Composting
- ➢
- How frequently is waste collected and disposed of?
- ○
- Daily
- ○
- Weekly
- ○
- Monthly
- ○
- As needed
- ➢
- What percentage of waste is recycled?
- ○
- 0–25%
- ○
- 26–50%
- ○
- 51–75%
- ○
- 76–100%
- ➢
- Importance of this factor:
- ○
- Very low
- ○
- Low
- ○
- Moderate
- ○
- High
- ○
- Very high
- D.
- Natural Disasters
- 7.
- Vulnerability to Natural Disasters
- ➢
- What types of natural disasters is the area prone to?
- ○
- Earthquakes
- ○
- Floods
- ○
- Hurricanes
- ○
- Other: __________
- ➢
- Is there historical data available on past natural disasters in the area?
- ○
- Yes
- ○
- No
- ➢
- What preparedness measures are in place to mitigate the impact of natural disasters?
- ○
- Emergency kits
- ○
- Evacuation plans
- ○
- Safety drills
- ○
- Other: __________
- ➢
- Importance of this factor:
- ○
- Very low
- ○
- Low
- ○
- Moderate
- ○
- High
- ○
- Very high
- 8.
- Emergency Response
- ➢
- Are there dedicated emergency response teams available on site?
- ○
- Yes
- ○
- No
- ➢
- How often are emergency response drills conducted?
- ○
- Monthly
- ○
- Quarterly
- ○
- Annually
- ○
- Never
- ➢
- Are there clearly defined evacuation plans in place?
- ○
- Yes
- ○
- No
- ➢
- How effective are the current emergency response measures?
- ○
- Very effective
- ○
- Effective
- ○
- Moderately effective
- ○
- Not effective
- ➢
- Importance of this factor:
- ○
- Very low
- ○
- Low
- ○
- Moderate
- ○
- High
- ○
- Very high
- E.
- Operational Risks
- 9.
- Cargo Handling and Storage
- ➢
- What types of cargo are handled at the facility?
- ○
- General cargo
- ○
- Hazardous materials
- ○
- Perishable goods
- ○
- Other: __________
- ➢
- Are there established protocols for the storage of hazardous materials?
- ○
- Yes
- ○
- No
- ➢
- How often are safety inspections conducted for cargo handling and storage?
- ○
- Daily
- ○
- Weekly
- ○
- Monthly
- ○
- Annually
- ➢
- Importance of this factor:
- ○
- Very low
- ○
- Low
- ○
- Moderate
- ○
- High
- ○
- Very high
- 10.
- Traffic and Communication
- ➢
- What is the traffic density in the area during peak hours?
- ○
- Low
- ○
- Moderate
- ○
- High
- ○
- Very high
- ➢
- Are there traffic management systems in place to control the flow of vehicles?
- ○
- Yes
- ○
- No
- ➢
- How reliable is the communication network for coordinating operations?
- ○
- Very reliable
- ○
- Reliable
- ○
- Unreliable
- ○
- Very unreliable
- ➢
- Importance of this factor:
- ○
- Very low
- ○
- Low
- ○
- Moderate
- ○
- High
- ○
- Very high
Appendix A.3. Risk Ratings
For each of the following factors, rate the risk level on a scale of 1 to 5 (1 being very low risk and 5 being very high risk).
- ➢
- Human Factors:
- ○
- 1
- ○
- 2
- ○
- 3
- ○
- 4
- ○
- 5
- ➢
- Facilities and Infrastructure:
- ○
- 1
- ○
- 2
- ○
- 3
- ○
- 4
- ○
- 5
- ➢
- Pollution and Environmental Impact:
- ○
- 1
- ○
- 2
- ○
- 3
- ○
- 4
- ○
- 5
- ➢
- Natural Disasters:
- ○
- 1
- ○
- 2
- ○
- 3
- ○
- 4
- ○
- 5
- ➢
- Operational Risks:
- ○
- 1
- ○
- 2
- ○
- 3
- ○
- 4
- ○
- 5
Appendix A.4. Mitigation Measures
- Current Risk Mitigation Strategies
- List existing measures: __________
- ➢
- Rate the effectiveness of these measures (1–5):
- ○
- 1
- ○
- 2
- ○
- 3
- ○
- 4
- ○
- 5
- Identify areas needing improvement: __________
- Proposed Risk Mitigation Strategies
- What new measures are planned to be implemented? __________
- What is the expected impact of these new measures? __________
Appendix A.5. Additional Comments
Any other observations or recommendations: __________
References
- Mojtahedi, A.; Beiragh, M.S.; Farajpour, I.; Mohammadian, M. Investigation on Hydrodynamic Performance of an Environmentally Friendly Pile Breakwater. Ocean Eng. 2020, 217, 107942. [Google Scholar] [CrossRef]
- Glavinović, R.; Vukić, L.; Peronja, I. Analysis of Management Models of Regional Ports in the Republic of Croatia. J. Mar. Sci. Eng. 2023, 11, 332. [Google Scholar] [CrossRef]
- Somoza-Medina, X.; Monteserín-Abella, O. The Sustainability of Industrial Heritage Tourism Far from the Axes of Economic Development in Europe: Two Case Studies. Sustainability 2021, 13, 1077. [Google Scholar] [CrossRef]
- Zhang, Z.-Y.; Peng, F.-L.; Ma, C.-X.; Zhang, H.; Fu, S.-J. External Benefit Assessment of Urban Utility Tunnels Based on Sustainable Development. Sustainability 2021, 13, 900. [Google Scholar] [CrossRef]
- Vukić, L.; Lai, K. Acute Port Congestion and Emissions Exceedances as an Impact of COVID-19 Outcome: The Case of San Pedro Bay Ports. J. Shipp. Trade 2022, 7, 25. [Google Scholar] [CrossRef]
- Jugović, A.; Sirotić, M.; Peronja, I. Sustainable Development of Port Cities from the Perspective of Transition Management. Trans. Marit. Sci. 2021, 10, 466–476. [Google Scholar] [CrossRef]
- Jugović, A.; Jardas Antonić, J.; Aksentijević, D. Overview of Criteria and Scenarios Relevant for Development of Seaports of County and Local Importance in the Republic of Croatia. Trans. Marit. Sci. 2023, 12, 1–12. [Google Scholar] [CrossRef]
- Banan-Dallalian, M.; Shokatian-Beiragh, M.; Golshani, A.; Abdi, A. Use of a Bayesian Network for Storm-Induced Flood Risk Assessment and Effectiveness of Ecosystem-Based Risk Reduction Measures in Coastal Areas (Port of Sur, Sultanate of Oman). Ocean Eng. 2023, 270, 113662. [Google Scholar] [CrossRef]
- Jugović, A.; Sirotić, M.; Poletan Jugović, T. Identification of Pivotal Factors Influencing the Establishment of Green Port Governance Models: A Bibliometric Analysis, Content Analysis, and DPSIR Framework. J. Mar. Sci. Eng. 2022, 10, 1701. [Google Scholar] [CrossRef]
- Chen, G.; Yang, Q.; Chen, X.; Huang, K.; Zeng, T.; Yuan, Z. Methodology of Urban Safety and Security Assessment Based on the Overall Risk Management Perspective. Sustainability 2021, 13, 6560. [Google Scholar] [CrossRef]
- Gumede, S.; Chasomeris, M. Pricing Strategy and Tariff Structure for a Port Authority: A Case Study of South Africa. Marit. Policy Manag. 2018, 45, 756–769. [Google Scholar] [CrossRef]
- Xiao, G.; Wang, T.; Shang, W.; Shu, Y.; Biancardo, S.A.; Jiang, Z. Exploring the Factors Affecting the Performance of Shipping Companies Based on a Panel Data Model: A Perspective of Antitrust Exemption and Shipping Alliances. Ocean Coast. Manag. 2024, 253, 107162. [Google Scholar] [CrossRef]
- Xiao, G.; Wang, T.; Luo, Y.; Yang, D. Analysis of Port Pollutant Emission Characteristics in United States Based on Multiscale Geographically Weighted Regression. Front. Mar. Sci. 2023, 10, 1131948. [Google Scholar] [CrossRef]
- Clancy, T.; Addison, B.; Pavlov, O.; Palmer, E.; Saeed, K. Systemic Innovation for Countering Violent Radicalization: Systems Engineering in a Policy Context. Syst. Eng. 2024, 1–22. [Google Scholar] [CrossRef]
- López-Saavedra, M.; Martí, J. Reviewing the Multi-Hazard Concept. Application to Volcanic Islands. Earth-Sci. Rev. 2023, 236, 104286. [Google Scholar] [CrossRef]
- Bastos, M.I.; Roebeling, P.C.; Alves, F.L.; Villasante, S.; Magalhães Filho, L. High Risk Water Pollution Hazards Affecting Aveiro Coastal Lagoon (Portugal)—A Habitat Risk Assessment Using InVEST. Ecol. Inform. 2023, 76, 102144. [Google Scholar] [CrossRef]
- Golshani, A.; Banan-Dallalian, M.; Shokatian-Beiragh, M.; Samiee-Zenoozian, M.; Sadeghi-Esfahlani, S. Investigation of Waves Generated by Tropical Cyclone Kyarr in the Arabian Sea: An Application of ERA5 Reanalysis Wind Data. Atmosphere 2022, 13, 1914. [Google Scholar] [CrossRef]
- Alamoush, A.S.; Ballini, F.; Ölçer, A.I. Ports, Maritime Transport, and Industry: The Immediate Impact of COVID-19 and the Way Forward. Marit. Technol. Res. 2021, 4, 250092. [Google Scholar] [CrossRef]
- Banan-Dallalian, M.; Shokatian-Beiragh, M.; Golshani, A.; Mojtahedi, A.; Lotfollahi-Yaghin, M.A.; Akib, S. Study of the Effect of an Environmentally Friendly Flood Risk Reduction Approach on the Oman Coastlines during the Gonu Tropical Cyclone (Case Study: The Coastline of Sur). Eng 2021, 2, 141–155. [Google Scholar] [CrossRef]
- Rezvani, S.M.H.S.; Falcão, M.J.; Komljenovic, D.; de Almeida, N.M. A Systematic Literature Review on Urban Resilience Enabled with Asset and Disaster Risk Management Approaches and GIS-Based Decision Support Tools. Appl. Sci. 2023, 13, 2223. [Google Scholar] [CrossRef]
- Raihan, A. A Comprehensive Review of the Recent Advancement in Integrating Deep Learning with Geographic Information Systems. Res. Briefs Inf. Commun. Technol. Evol. 2023, 9, 98–115. [Google Scholar] [CrossRef]
- Hasani, S.S.; Mojtahedi, A.; Reshadi, M.A.M. Development of a Novel Fuzzy Logic-Based Wetland Health Assessment Approach for the Management of Freshwater Wetland Ecosystems. Wetlands 2021, 41, 100. [Google Scholar] [CrossRef]
- Mohan, S.; Giridhar, M.V.S.S. A Brief Review of Recent Developments in the Integration of Deep Learning with GIS. Geomat. Environ. Eng. 2022, 16, 21–38. [Google Scholar] [CrossRef]
- Žgaljić, D.; Tijan, E.; Jugović, A.; Poletan Jugović, T. Implementation of Sustainable Motorways of the Sea Services Multi-Criteria Analysis of a Croatian Port System. Sustainability 2019, 11, 6827. [Google Scholar] [CrossRef]
- Mikuličić, J.Ž.; Kolanović, I.; Jugović, A.; Brnos, D. Evaluation of Service Quality in Passenger Transport with a Focus on Liner Maritime Passenger Transport—A Systematic Review. Sustainability 2024, 16, 1125. [Google Scholar] [CrossRef]
- Vrakas, G.; Chan, C.; Thai, V.V. The Effects of Evolving Port Technology and Process Optimisation on Operational Performance: The Case Study of an Australian Container Terminal Operator. Asian J. Shipp. Logist. 2021, 37, 281–290. [Google Scholar] [CrossRef]
- Min, H.; Ahn, S.-B.; Lee, H.-S.; Park, H. An Integrated Terminal Operating System for Enhancing the Efficiency of Seaport Terminal Operators. Marit. Econ. Logist. 2017, 19, 428–450. [Google Scholar] [CrossRef]
- Wang, N.; Wu, M.; Yuen, K.F. Assessment of Port Resilience Using Bayesian Network: A Study of Strategies to Enhance Readiness and Response Capacities. Reliab. Eng. Syst. Saf. 2023, 237, 109394. [Google Scholar] [CrossRef]
- Xin, X.; Liu, K.; Loughney, S.; Wang, J.; Li, H.; Ekere, N.; Yang, Z. Multi-Scale Collision Risk Estimation for Maritime Traffic in Complex Port Waters. Reliab. Eng. Syst. Saf. 2023, 240, 109554. [Google Scholar] [CrossRef]
- Gonçalves, A.; Marques, M.C.; Loureiro, S.; Nieto, R.; Liberato, M.L.R. Disruption Risk Analysis of the Overhead Power Lines in Portugal. Energy 2023, 263, 125583. [Google Scholar] [CrossRef]
- Xiao, G.; Yang, D.; Xu, L.; Li, J.; Jiang, Z. The Application of Artificial Intelligence Technology in Shipping: A Bibliometric Review. J. Mar. Sci. Eng. 2024, 12, 624. [Google Scholar] [CrossRef]
- Čuljak, M.; Tomić, B.; Žiković, S. Benefits of Sectoral Cryptocurrency Portfolio Optimization. Res. Int. Bus. Financ. 2022, 60, 101615. [Google Scholar] [CrossRef]
- Olaniyi, O.O.; Olabanji, S.O.; Abalaka, A.I. Navigating Risk in the Modern Business Landscape: Strategies and Insights for Enterprise Risk Management Implementation. J. Sci. Res. Rep. 2023, 29, 103–109. [Google Scholar] [CrossRef]
- Mokhtari, K.; Ren, J.; Roberts, C.; Wang, J. Decision Support Framework for Risk Management on Sea Ports and Terminals Using Fuzzy Set Theory and Evidential Reasoning Approach. Expert Syst. Appl. 2012, 39, 5087–5103. [Google Scholar] [CrossRef]
- Taylan, O.; Bafail, A.O.; Abdulaal, R.M.S.; Kabli, M.R. Construction Projects Selection and Risk Assessment by Fuzzy AHP and Fuzzy TOPSIS Methodologies. Appl. Soft Comput. 2014, 17, 105–116. [Google Scholar] [CrossRef]
- John, A.; Paraskevadakis, D.; Bury, A.; Yang, Z.; Riahi, R.; Wang, J. An Integrated Fuzzy Risk Assessment for Seaport Operations. Saf. Sci. 2014, 68, 180–194. [Google Scholar] [CrossRef]
- Valdor, P.F.; Gómez, A.G.; Puente, A. Environmental Risk Analysis of Oil Handling Facilities in Port Areas. Application to Tarragona Harbor (NE Spain). Mar. Pollut. Bull. 2015, 90, 78–87. [Google Scholar] [CrossRef] [PubMed]
- Lee, J.-J.; Ham, T.-Y.; Jeong, W.-S. Economic Risk Assessment of Ammonium Nitrate Explosions at the Busan Port by Determining the Building Damage Using a 3D Explosion Simulation. Heliyon 2022, 8, e12285. [Google Scholar] [CrossRef] [PubMed]
- Bilașco, Ș.; Man, T.-C. GIS-Based Spatial Analysis Model for Assessing Impact and Cumulative Risk in Road Traffic Accidents via Analytic Hierarchy Process (AHP)—Case Study: Romania. Appl. Sci. 2024, 14, 2643. [Google Scholar] [CrossRef]
- Alharbi, O.A.; Rangel-Buitrago, N. Landscape Degradation in the Jazan Coastal Desert: Understanding the Impact of Human Activities. Mar. Pollut. Bull. 2023, 190, 114874. [Google Scholar] [CrossRef]
- Sohaib, M.; Al-Barakah, F.N.I.; Migdadi, H.M.; Alyousif, M.; Ahmed, I. Ecological Assessment of Physico-Chemical Properties in Mangrove Environments along the Arabian Gulf and the Red Sea Coasts of Saudi Arabia. Egypt. J. Aquat. Res. 2023, 49, 9–16. [Google Scholar] [CrossRef]
- Singh, M.K. China and the United States in the Middle East: Between Dependency and Rivalry. In The Great Power Competition Volume 1; Springer International Publishing: Cham, Switzerland, 2021; pp. 369–395. ISBN 9783030644734. [Google Scholar]
- Yang, Z.; Du, L.; Ding, L. The China-Saudi Arabia (Jizan) Industrial Park under the Belt and Road Initiative. Asian J. Middle East. Islam. Stud. 2020, 14, 528–537. [Google Scholar] [CrossRef]
- Agius, D.A.; Cooper, J.P.; Semaan, L.; Zazzaro, C.; Carter, R. Remembering the Sea: Personal and Communal Recollections of Maritime Life in Jizan and the Farasan Islands, Saudi Arabia. J. Marit. Archaeol. 2016, 11, 127–177. [Google Scholar] [CrossRef]
- Peng, G.; Han, L.; Liu, Z.; Guo, Y.; Yan, J.; Jia, X. An Application of Fuzzy Analytic Hierarchy Process in Risk Evaluation Model. Front. Psychol. 2021, 12, 715003. [Google Scholar] [CrossRef] [PubMed]
- Omair, M.; Noor, S.; Tayyab, M.; Maqsood, S.; Ahmed, W.; Sarkar, B.; Habib, M.S. The Selection of the Sustainable Suppliers by the Development of a Decision Support Framework Based on Analytical Hierarchical Process and Fuzzy Inference System. Int. J. Fuzzy Syst. 2021, 23, 1986–2003. [Google Scholar] [CrossRef]
- Panchal, S.; Shrivastava, A.K. Landslide Hazard Assessment Using Analytic Hierarchy Process (AHP): A Case Study of National Highway 5 in India. Ain Shams Eng. J. 2022, 13, 101626. [Google Scholar] [CrossRef]
- Liu, Y.; Eckert, C.M.; Earl, C. A Review of Fuzzy AHP Methods for Decision-Making with Subjective Judgements. Expert Syst. Appl. 2020, 161, 113738. [Google Scholar] [CrossRef]
- Chang, D.-Y. Applications of the Extent Analysis Method on Fuzzy AHP. Eur. J. Oper. Res. 1996, 95, 649–655. [Google Scholar] [CrossRef]
- Mohammadfam, I.; Mirzaei Aliabadi, M.; Soltanian, A.R.; Tabibzadeh, M.; Mahdinia, M. Investigating Interactions among Vital Variables Affecting Situation Awareness Based on Fuzzy DEMATEL Method. Int. J. Ind. Ergon. 2019, 74, 102842. [Google Scholar] [CrossRef]
- Saaty, T.L. What Is the Analytic Hierarchy Process? Math. Models Decis. Support 1988, 109–121. [Google Scholar] [CrossRef]
- Nourani, V.; Molajou, A.; Najafi, H.; Danandeh Mehr, A. Emotional ANN (EANN): A New Generation of Neural Networks for Hydrological Modeling in IoT; Springer: Berlin/Heidelberg, Germany, 2019; pp. 45–61. [Google Scholar]
- Nourani, V.; Molajou, A.; Uzelaltinbulat, S.; Sadikoglu, F. Emotional Artificial Neural Networks (EANNs) for Multi-Step Ahead Prediction of Monthly Precipitation; Case Study: Northern Cyprus. Theor. Appl. Climatol. 2019, 138, 1419–1434. [Google Scholar] [CrossRef]
- Kuznetsov, S.V.; Siswanto, W.A.; Sabirova, F.M.; Pustokhina, I.G.; Melnikova, L.A.; Zakieva, R.R.; Nomani, M.Z.M.; Rahman, F.F.; Husein, I.; Thangavelu, L. Emotional Artificial Neural Network (EANN)-Based Prediction Model of Maximum A-Weighted Noise Pressure Level. Noise Mapp. 2022, 9, 1–9. [Google Scholar] [CrossRef]
- Sharghi, E.; Nourani, V.; Molajou, A.; Najafi, H. Conjunction of Emotional ANN (EANN) and Wavelet Transform for Rainfall-Runoff Modeling. J. Hydroinform. 2019, 21, 136–152. [Google Scholar] [CrossRef]
- Mojtahedi, A.; Dadashzadeh, M.; Azizkhani, M.; Mohammadian, A.; Almasi, R. Assessing Climate and Human Activity Effects on Lake Characteristics Using Spatio-Temporal Satellite Data and an Emotional Neural Network. Environ. Earth Sci. 2022, 81, 61. [Google Scholar] [CrossRef]
- Salele, B.; Dodo, Y.A.; Sani, D.A.; Abuhussain, M.A.; Sayfutdinovna Abdullaeva, B.; Brysiewicz, A. Run-off Modelling of Pervious and Impervious Areas Using Couple SWAT and a Novel Machine Learning Model in Cross-Rivers State Nigeria. Water Sci. Technol. 2023, 88, 1893–1909. [Google Scholar] [CrossRef] [PubMed]
- Molajou, A.; Nourani, V.; Afshar, A.; Khosravi, M.; Brysiewicz, A. Optimal Design and Feature Selection by Genetic Algorithm for Emotional Artificial Neural Network (EANN) in Rainfall-Runoff Modeling. Water Resour. Manag. 2021, 35, 2369–2384. [Google Scholar] [CrossRef]
- Ilyas, M.; Jin, Z.; Ullah, I.; Jafri, A.A. Investigation of Risk Factors Influencing the Safety of Maritime Containers Supply Chain: In the Period of the Pandemic. Sustainability 2023, 15, 8803. [Google Scholar] [CrossRef]
- Costas, R.; Carro, H.; Figuero, A.; Peña, E.; Sande, J. A Decision-Making Tool for Port Operations Based on Downtime Risk and Met-Ocean Conditions Including Infragravity Wave Forecast. J. Mar. Sci. Eng. 2023, 11, 536. [Google Scholar] [CrossRef]
- Dhahri, M.; Elmsalmi, M.; Aljuaid, A.M.; Hachicha, W. Seaport Terminals Risks Prioritization Using a Structural Modeling-Based Approach: A Real Case Study. J. Mar. Sci. Eng. 2022, 10, 217. [Google Scholar] [CrossRef]
- Zampeta, V.; Chondrokoukis, G. An Empirical Analysis for the Determination of Risk Factors of Work-Related Accidents in the Maritime Transportation Sector. Risks 2022, 10, 231. [Google Scholar] [CrossRef]
- Guo, J.; Wang, Z.; Li, H.; Yang, Y.; Huang, C.-G.; Yazdi, M.; Kang, H.S. A Hybrid Prognosis Scheme for Rolling Bearings Based on a Novel Health Indicator and Nonlinear Wiener Process. Reliab. Eng. Syst. Saf. 2024, 245, 110014. [Google Scholar] [CrossRef]

Disclaimer/Publisher’s Note: The statements, opinions and data contained in all publications are solely those of the individual author(s) and contributor(s) and not of MDPI and/or the editor(s). MDPI and/or the editor(s) disclaim responsibility for any injury to people or property resulting from any ideas, methods, instructions or products referred to in the content. |
© 2024 by the authors. Licensee MDPI, Basel, Switzerland. This article is an open access article distributed under the terms and conditions of the Creative Commons Attribution (CC BY) license (https://creativecommons.org/licenses/by/4.0/).