Article

Spatio-Temporal Evolution and Driving Factors of Tourism Economic Resilience in the Yili River Valley

School of Geographical Science and Tourism, Xinjiang Normal University, Urumqi 830054, China
*
Author to whom correspondence should be addressed.
Sustainability 2024, 16(12), 5141; https://doi.org/10.3390/su16125141
Submission received: 13 May 2024 / Revised: 6 June 2024 / Accepted: 14 June 2024 / Published: 17 June 2024

Abstract

:
The tourism economy plays an essential role in supporting and driving tourism development. Therefore, studying its resilience is crucial for promoting sustainable and high-quality tourism development. The purpose of this study is to construct a tourism economic resilience evaluation index system and assess the tourism economic resilience of 10 counties and cities in the Ili River Valley from 2010 to 2019 using the entropy weight TOPSIS method. The results show that (1) the tourism economic resilience shows a “W”-shaped time-series dynamic development trend, especially a decline in 2012–2013 and 2015–2016; (2) the spatial pattern shows a non-equilibrium characteristic, with the northwestern part of the valley represented by Yining City showing a high level of resilience, and the central to southeastern counties and cities showing a lower level of resilience; (3) the spatio-temporal evolution steadily points to “northwest–southeast”, and there are five toughness convergence clubs, with obvious stability and neighborhood effects; (4) and the analysis of the driving factors shows that the number of employees in the tertiary industry, especially the input of high-quality talents, is crucial to improving the quality of services, strengthening the ability to withstand risks and the potential for development, and its impact is significant. These results provide an important reference for the formulation of tourism development strategies and promote the sustainable development of tourism.

1. Introduction

Tourism is a comprehensive, cross-sectoral and cross-regional industry with wide radiation, strong interaction and great influence. China’s tourism industry has been booming since the 20th century and has become an important engine of economic growth. However, the industry has suffered a huge shock following the outbreak of COVID-19, highlighting its vulnerability to unexpected events. The Ministry of Culture and Tourism (MCT) has emphasized the importance of dealing with risks and challenges and has advocated for greater awareness and preparedness. The Fourteenth Five-Year Plan further emphasizes the importance of accurately grasping changes in the face of uncertainty and adopting scientific contingency strategies to turn crises into opportunities. Current research on the linkages between tourism and climate change, natural disasters, political instability, conflict, and terrorism [1,2,3,4] has further revealed the indirect vulnerability of tourism, as well as laying bare the high elasticity and low resilience of tourism. Tourism economy is a complex system; economic attributes are the essential attributes of tourism [5], but its own vulnerability and sensitivity is the root cause of instability in the tourism economy. As a place rich in tourism resources in China, the Yili River Valley is accelerating the construction of a world-class tourist destination, and “resilience”, as an important characteristic to express or describe how things cope with uncertainty, provides a good research perspective to understand and analyze how the tourism industry in the Yili River Valley copes with internal and external shocks [6]. In addition, it provides an important theoretical framework and practical guidance for better understanding and promoting tourism development due to its unique contributions to tourism economic research including crisis management, community engagement, sustainability, innovation, and policy development. While previous studies have explored tourism resilience, there are few studies focusing on the spatio-temporal dynamics and drivers of the Yili River Valley. The aim of this paper is to further enrich the theoretical studies and frameworks related to sustainable tourism resilience enhancement by adopting advanced methods, such as entropy weight TOPSIS and Markov chain analysis, to gain a comprehensive understanding of the resilience characteristics and their intrinsic driving factors.

2. Literature Review

Resilience was originally proposed by Holling to understand and measure ecological resilience, i.e., the ability of an ecosystem to remain in its original state in the face of disturbance or change [7]. In recent years, the theory of resilience has received attention from the economics community and has become a research hotspot in the fields of regional economics and economic geography [8]. Economic resilience focuses on emphasizing the ability of an economic system to withstand or recover from external shocks, and is a key attribute for ensuring long-term, sustained upliftment of that economic system [9]. The core discussion of resilience focuses on the ability of a system to return to a steady state after a disturbance. In this context, it is important for a vulnerable industry such as tourism to study how it absorbs the impact of sudden crisis events and achieves rapid recovery while maintaining its core functions. According to domestic and foreign researchers, there are two main methods for measuring economic resilience: one is the key variable method [10], which uses a single indicator such as gross domestic product, the unemployment rate, etc.; the other is the method of constructing a system of evaluation indicators [11], which measures regional economic resilience by selecting a number of indicators.
Tourism economic resilience, as the key to sustaining the stable development of the tourism system [12], refers to the resilience of the tourism economic system to external shocks and threats as well as structural changes and new developments [13]. The study of economic resilience in the tourism industry has attracted much attention and discussion with the shift from an economic to a risk-based society and the ongoing exploration of the concept of resilience. For example, Cai et al. deepened the understanding of the theory of economic elasticity of tourism by using the resistance index, Thiel index and spatial autocorrelation analysis for the sustainable development of the tourism industry [14]. Wang Qian et al. established a tourism economic resilience evaluation index system from the four dimensions of resilience, recovery, reconstruction and renewal, and quantitatively analyzed the spatio-temporal development characteristics and influencing factors of the tourism economy in 31 provinces and cities in China [15]. Other researchers have explored the relationship between tourism sustainability and the sustainable development of the tourism economy as well as the high-quality development of the tourism economy. For example, Zhang et al. assessed the spatial and temporal evolution characteristics of China’s tourism economic resilience in terms of resistance and influencing factors and found that the type of tourism economic resilience in China has shown a centralized and continuous development trend, with obvious zonal distribution characteristics, dominated by the autonomous tourism economic resilience zones, but the tourism industry in most areas has not yet formed stable economic resilience [16].
Despite the progress that has been made in the study of tourism economic resilience, there are still some shortcomings. In terms of research content, existing studies lack an in-depth understanding of the resilience mechanism, and there is a lack of a unified framework and standard for measuring the level of resilience of the tourism economy, and at the same time, due to the spatial heterogeneity of the indicator system, it is difficult for the existing framework to be effectively applied to the development practice of the resilience of the local tourism economy. On the other hand, in terms of research scales, most of the existing studies are quantitative studies at the macro scale such as national provinces and regions, and there are few studies at the river valley scale; in this area, tourism economic resilience is under-represented in the existing tourism disciplines, and the studies are still fragmented. How can tourism economic resilience be quantified in the Valley region? How does tourism economic resilience evolve over time and space? All these issues need further research. Accordingly, this paper takes toughness theory and sustainable development theory as a guide, constructs the tourism economic toughness evaluation index system, calculates the tourism economic toughness index of the counties in the Yili River Valley through the entropy weight TOPSIS model, and analyzes the spatial dynamic evolution of the tourism toughness level of the counties in the Yili River Valley by using the Markov chain model. Finally, gray correlation is used to explain the driving factors affecting the toughness level of the tourism economy in the Yili River Valley, and countermeasure suggestions to improve the toughness level of the tourism economy are put forward from the perspective of sustainable development, so as to provide reference value for the promotion of high-quality and sustainable development of the tourism economy.

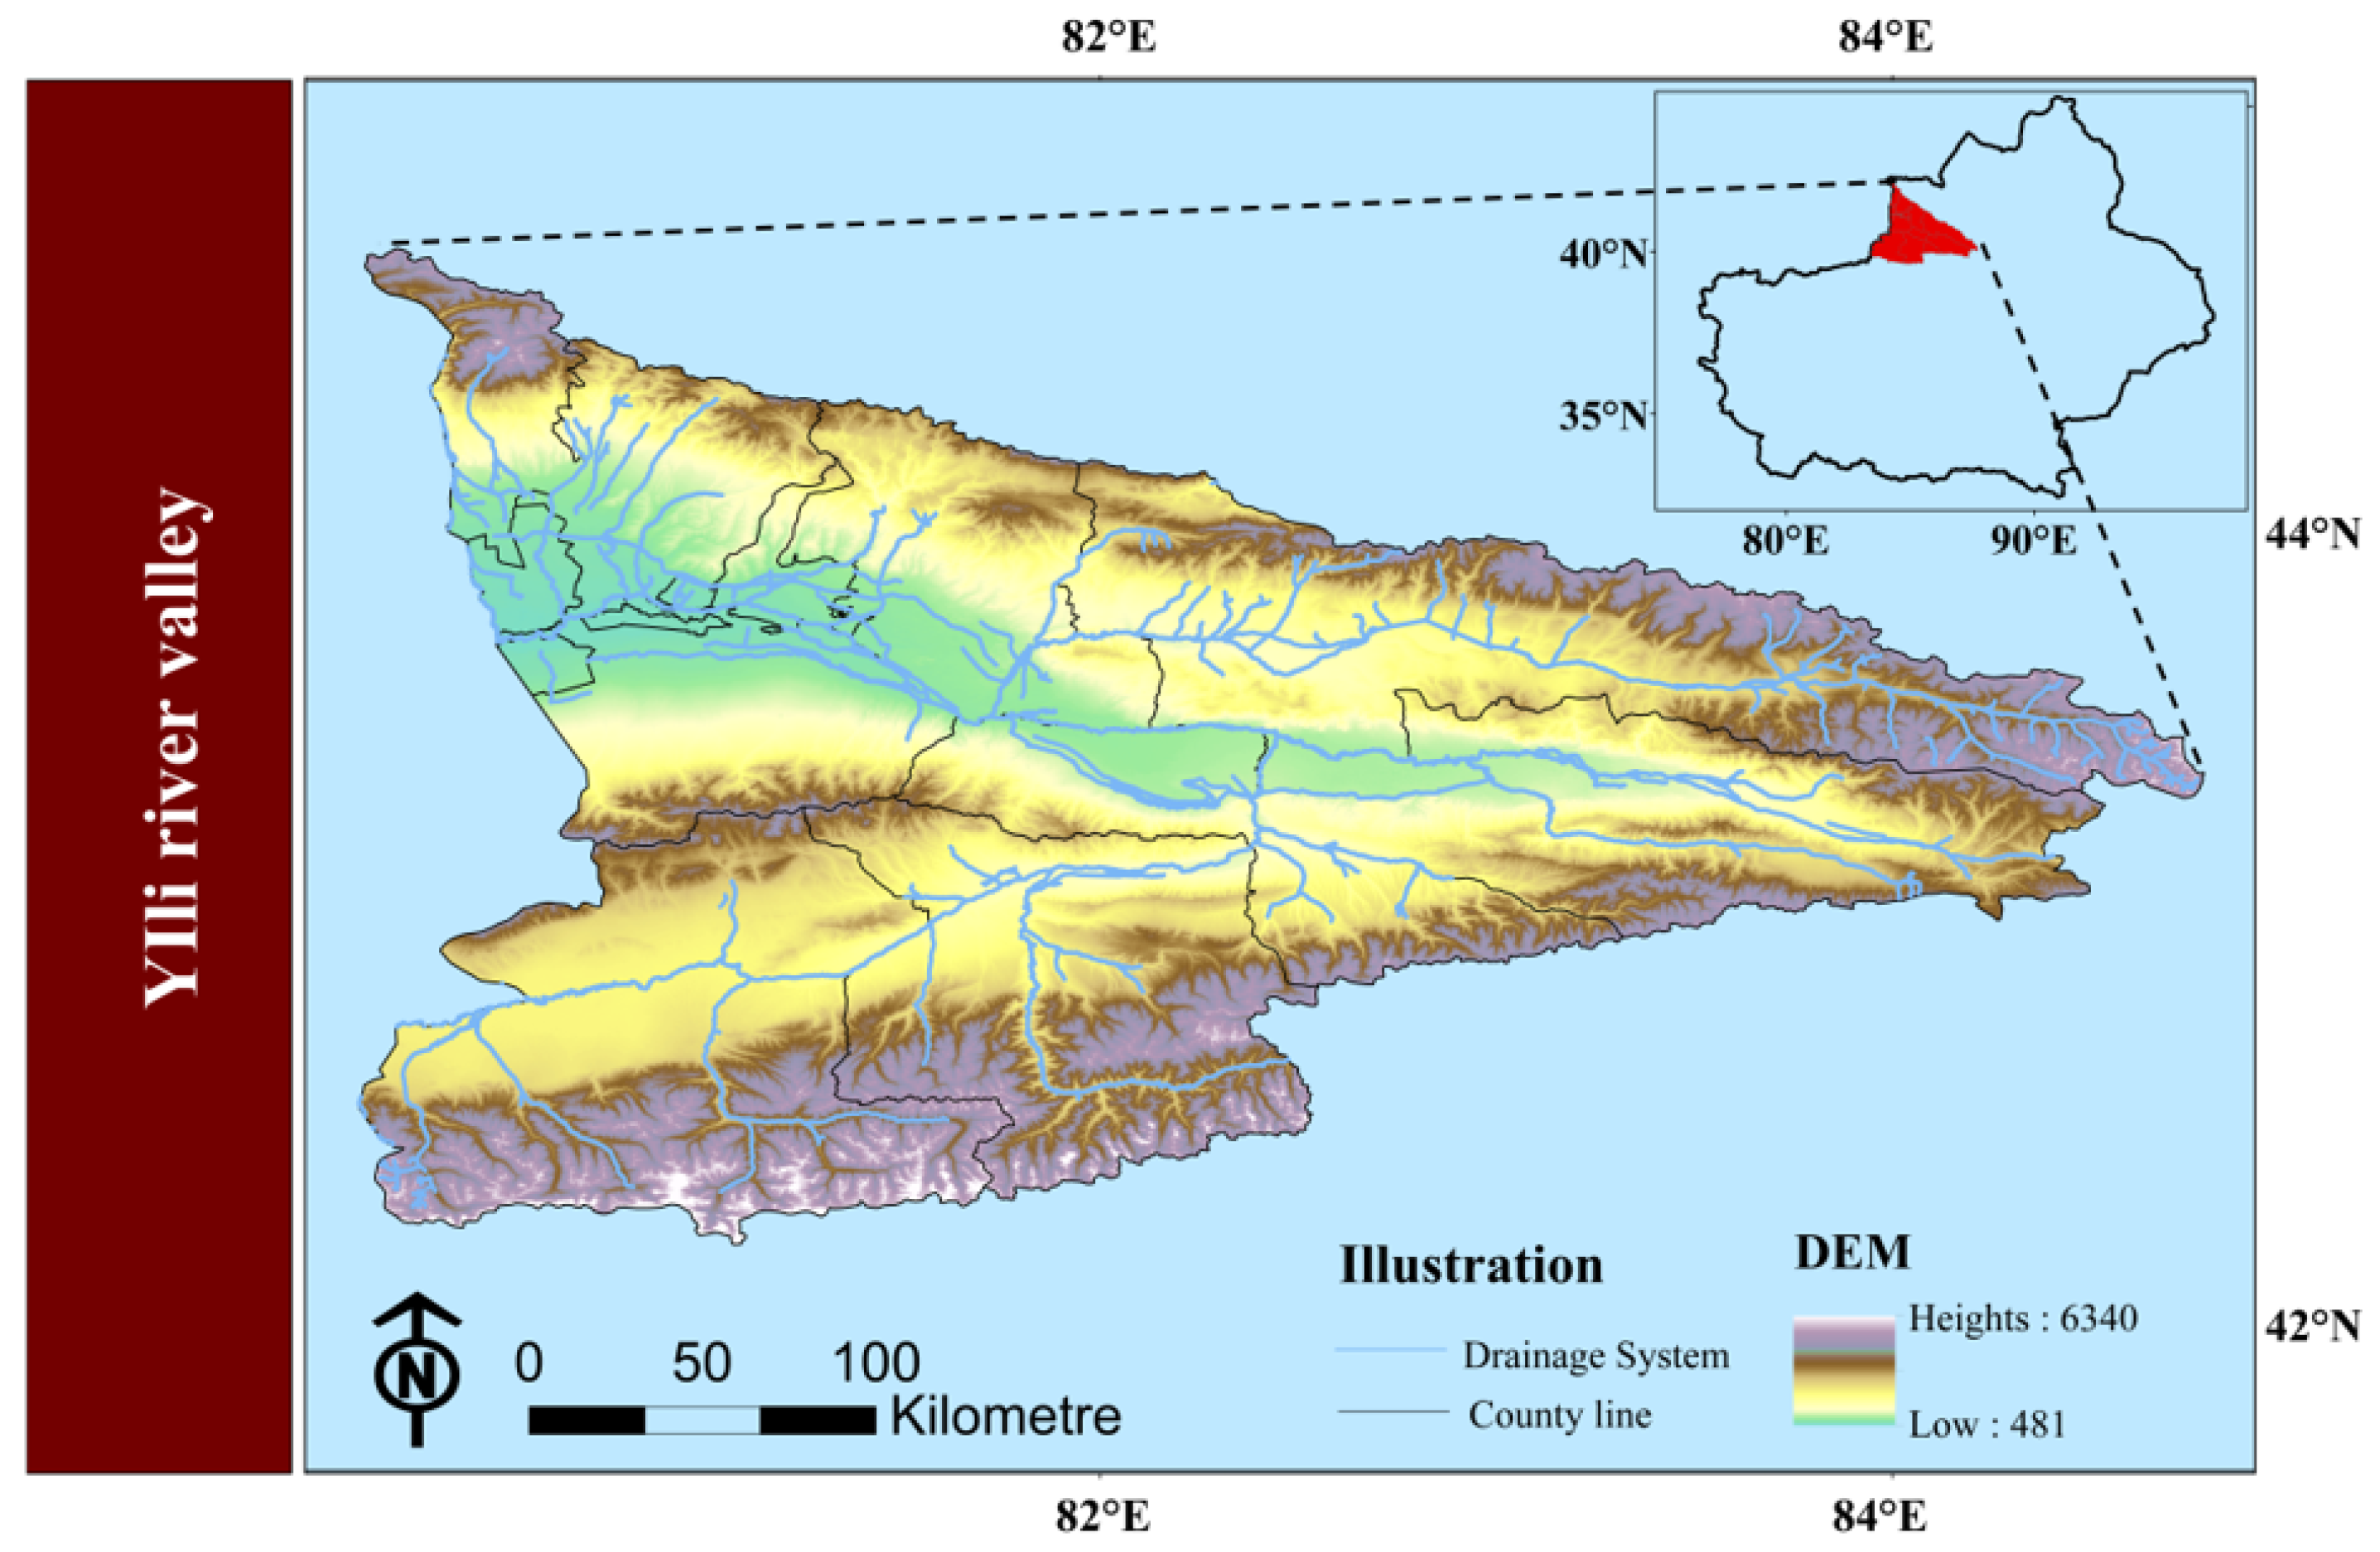
3. Overview of the Research Area

The Yili River Valley (80°09′~84°56′ W, 42°14′~44°53′ N) is located in the Yili Kazakh Autonomous Prefecture of the Xinjiang Uygur Autonomous Region, which is situated in the northern part of the Tianshan Mountains, and borders the Republic of Kazakhstan to the west, with an outstanding geographic advantage. The Yili River Valley is under the jurisdiction of eight counties and two cities—Yining City, Horgos City, Yining County, Nilek County, Xinyuan County, Gongliu County, Tekes County, Zhaosu County, Chabchuchaer Xibo Autonomous County (hereafter referred to as Cha County), and Huocheng County [17]—with a length of 360 km from east to west, a width of 275 km from north to south, and an area of 56,400 km2, as shown in Figure 1. Tourism, as an important strategic pillar industry in the Yili River Valley, has become an important engine for high-quality economic and social development in Yili. The region is rich in natural as well as historical and humanistic tourism resources, with 79 Class A scenic spots (2 Class 5A, 23 Class 4A, 33 Class 3A and 21 Class 2A) such as Nalati Scenic Spot and Kerala Scenic Spot. As of December 2022, the Yili River Valley received 38,293,700 tourists, with tourism revenue amounting to CNY 20.12 billion, accounting for 16.8% of regional GDP.

4. Methodology and Data Sources

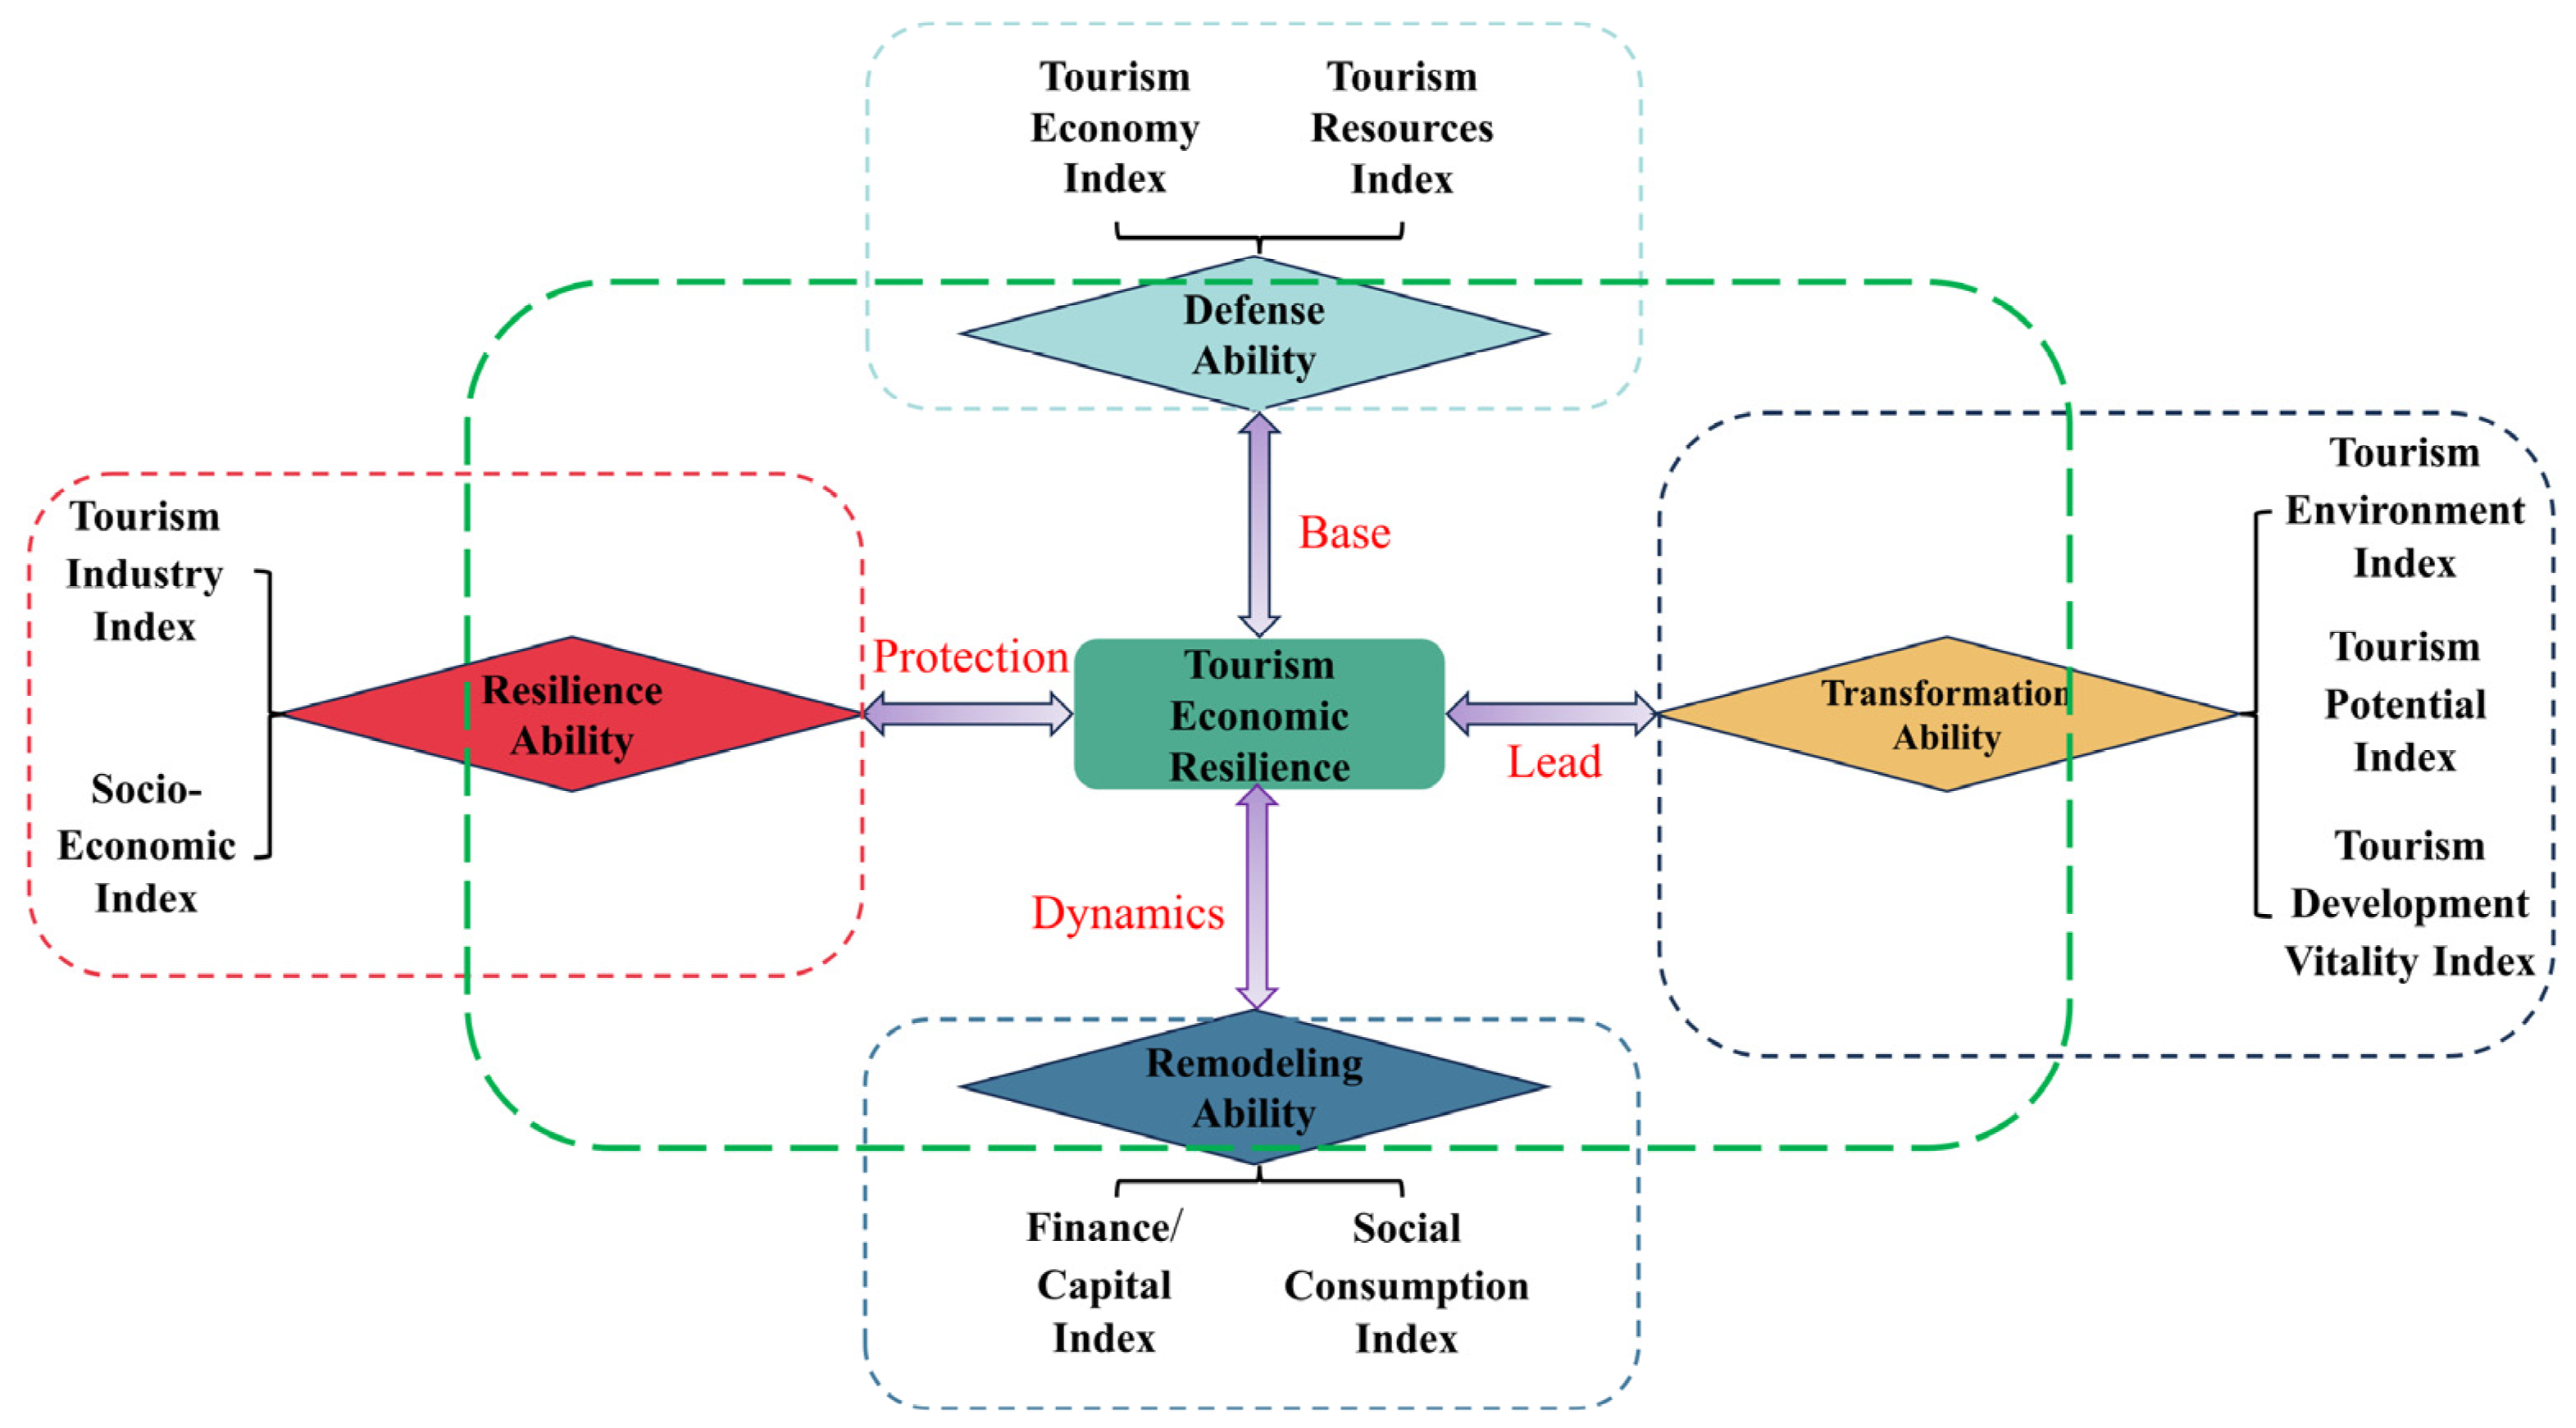
4.1. Construction of the Indicator System

Based on the core essence of tourism economic resilience and referring to the existing relevant research results, this paper follows the principles of systematicity, scientificity and data availability, and constructs a tourism economic resilience level evaluation index system consisting of 22 indicators in four dimensions, namely defense ability [18], recovery ability [18], remodeling ability [18], and transformation ability [19] (Table 1).
Defensive capacity refers to the degree of sensitivity and depth of reaction of the tourism economy in the face of internal and external risk perturbations. In economically weaker regions, the economic losses tend to be smaller [18]. This capacity mainly includes the tourism economic index [20] and tourism resources index [21]. Recovery capacity refers to the speed and degree of recovery of the tourism economy from the impact of risk fluctuations. This study considers both the industrial economy and social economy, dividing the indices into the tourism industry index and social economy index [22,23], which reflect the level of recovery of the tourism economy and the overall economy [24]. Reshaping capacity refers to the degree of repositioning and adaptation of the tourism economy to cope with shocks, as reflected in the financial/capital index and the social consumption index [25,26,27]. Transforming capacity represents the degree to which the tourism economy recovers its growth path or shifts to a new growth trend [28]; it mainly focuses on environmental improvement, tourism development potential, and tourism development dynamics [29,30,31], as shown in Figure 2.

4.2. The Entropy Weight TOPSIS Method
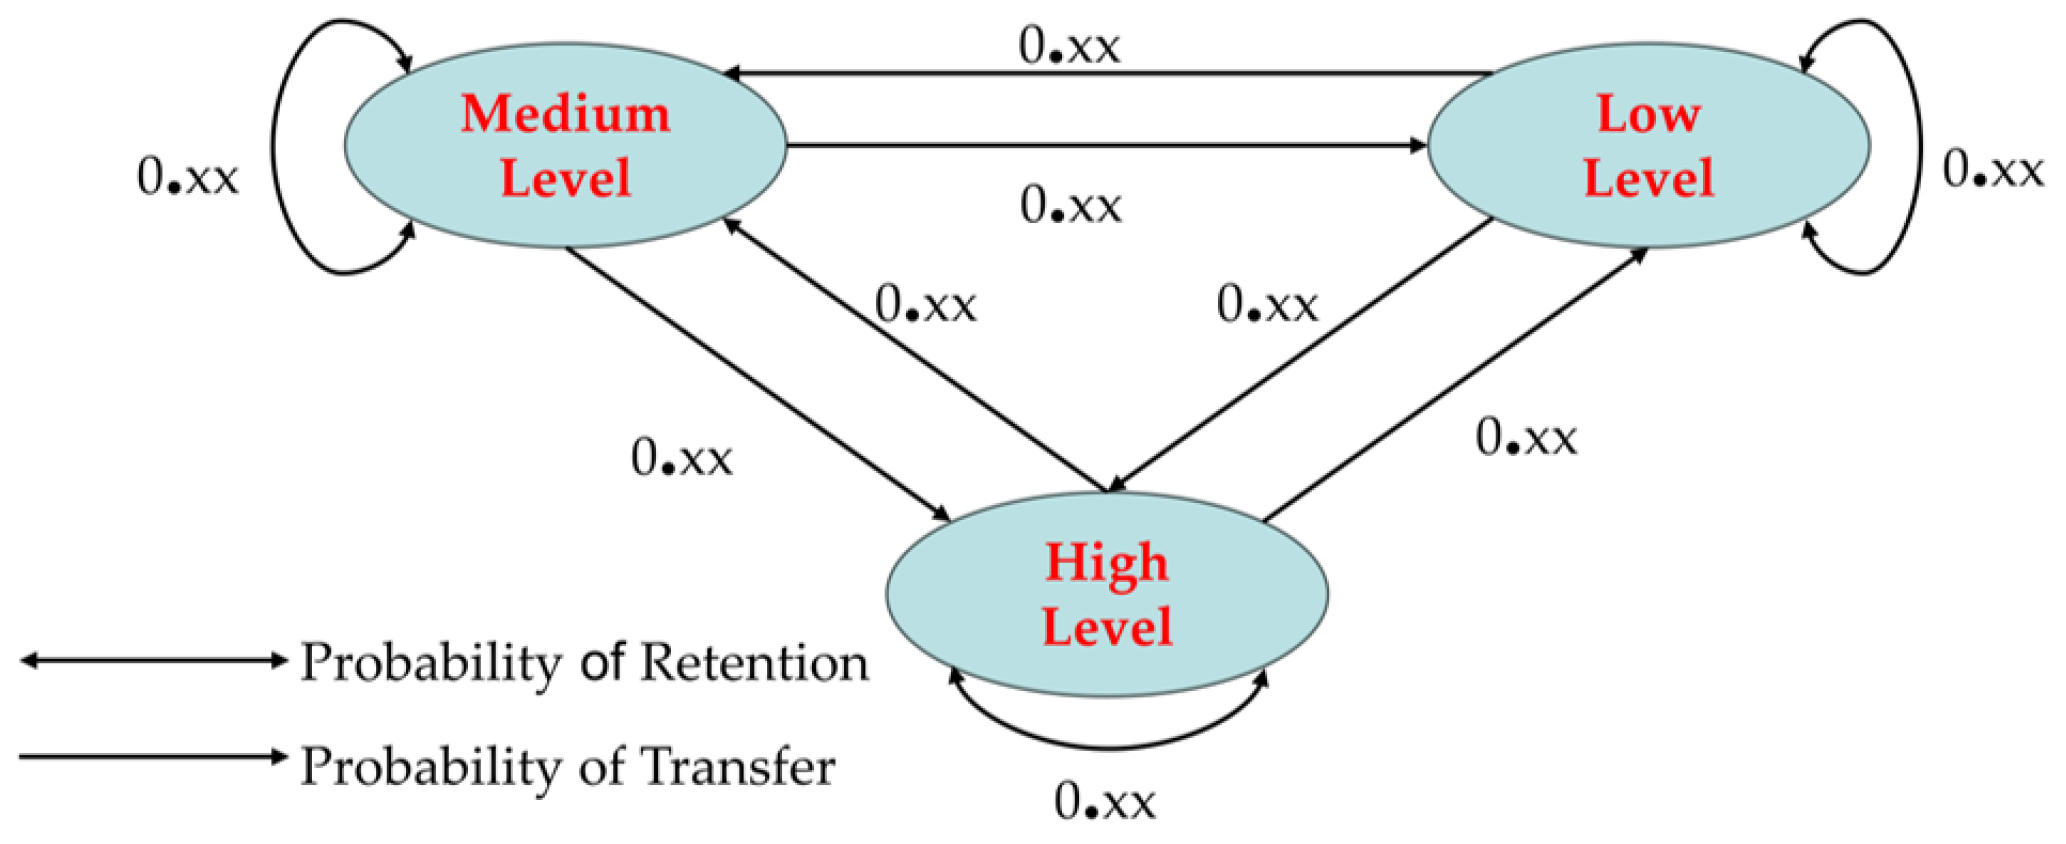
This paper applies the entropy weight TOPSIS method to measure tourism economic resilience in the study area. The entropy weight TOPSIS method was chosen because it effectively combines objective weights, which are used to determine the importance of each indicator, and robust ranking techniques, which are used to assess and rank the resilience of different regions. The entropy weighting method ensures that the weights reflect the diversity and importance of the data, while the TOPSIS method provides a comprehensive and nuanced assessment of tourism economic resilience by explicitly ranking the indicators based on their relative proximity to the ideal solution. The entropy weight TOPSIS method serves as a major advancement in tourism economic resilience assessment methods; the higher the relative proximity, the higher the tourism economic resilience. For specific steps, see [32].

4.3. Markov Chain

In this paper, the dynamic evolution of tourism economic resilience over time is modeled using Markov chains, a methodology that captures the probability of excesses between different resilience levels, which provides a clear framework for understanding the dynamics over time and predicting future trends compared to other methods. For example, if a region has a medium level of toughness in a given year, a Markov chain can help predict the likelihood that the region will move up, down, or remain at its original level in the following year. Figure 3 illustrates a simplified traditional Markov chain with three states: low toughness, medium toughness, and high toughness, with double arrows representing the probability of remaining at the original level and single arrows indicating the probability of transitioning from one state to another.

4.3.1. Traditional Markov Chains

Traditional Markov chains are mainly used to model the probability of the level of resilience moving from one state to another over time. In this study, it helps to analyze how economic resilience changes over time in different regions. The method discretizes continuous data into k types, the transfer between different types in different years constitutes a transfer probability matrix, and the type transfer probability is measured using the great likelihood estimation method [33] and validated using chi-square goodness-of-fit tests to ensure that observed transitions are consistent with expected probabilities.
P i j = n i j n i
where P i j denotes the probability that a city that is type i in year t shifts to type j in year t + 1 during the study period, n i j denotes the sum of the number of counties and cities that have shifted their tourism economic resilience from type i in year t to class j in year t + 1 during the study period, and n i denotes the sum of the number of cities that are in type i in all the years of the study period.

4.3.2. Spatial Markov Chain

The traditional Markov chain, which assumes that the future state depends only on the current state and not on the previous sequence of events, simplifies the analysis but may not be able to capture all the variations in real-world dynamics, and as a result, scholars have found that spatial spillovers due to geographic proximity play an important role in the evolution of a region’s development [34]. Considering the spatial characteristics of regional phenomena, based on the transfer probability matrix of the traditional Markov chain, the concept of “spatial lag” is introduced as a condition and divided into k types, and the k × k transfer probability matrix is decomposed into k k × k transfer conditional probability matrices.
  L a g = Y i W i j
where Y i represents the attribute value of a regional unit, and W i j represents the element of the jth column of the ith row of the spatial weight matrix W, i.e., the matrix of the proximity relationship between the region and the neighboring units.

4.4. Grey Relation Analysis

Grey relation analysis (GRA) is a multifactor statistical analysis method. Grey correlation analysis method makes up for the shortcomings caused by the use of mathematical statistical methods for system analysis [35]. It is equally applicable to the number of sample sizes and the presence or absence of patterns in the samples, and the calculation is small and very convenient, not to mention that there is no discrepancy between the quantitative results and the qualitative analysis results. The calculation steps are as follows:
(1)
Construction of the reference sequence and comparison sequence:
The reference sequence, i.e., the data sequence that can reflect the characteristics of the system’s behavior, similar to the dependent variable Y; and the comparison sequence, i.e., the sequence composed of factors that affect the system’s behavior, similar to the independent variable X, are denoted as:
Y = y 1 , y 2 , , y n T
X n m = x 11 x 12 x 1 m x 21 x 22 x 2 m x n 1 x n 2 x n m
(2)
Data preprocessing: de-measurement tempering:
y k ~ = y k y i , y i ¯ = 1 n k = 1 n   y k x k i ~ = x k i x i , x i   ¯ = 1 n k = 1 n   x k i i = 1,2 , , m
(3)
Calculation of the correlation coefficient of each indicator in the subseries with the parent series:
a = m i n i   m i n k   x 0 k x i k , b = m a x i   m a x k   x 0 k x i k
where a and b denote the two-level minimum and maximum differences, respectively.
Construct:
  ξ i k = y x 0 k , x i k = a + ρ b x 0 k x i k + ρ b
where ρ is the resolution factor, generally taking the value 0.5.
(4)
Calculation of correlation:
r i = 1 n k = 1 n   ξ i k = 1 n k = 1 n   y x 0 k , x i k
where r i ∈ [0, 1]; the closer to 1, the stronger the influence.

4.5. Data Sources

The data for the study outlined in this paper are based on the principles of accuracy and accessibility, and the data sources mainly include the Statistical Yearbook of Yili Kazakh Autonomous Prefecture of China (2010–2019), the annual statistical bulletins of counties and cities, and the Statistical Yearbook of Counties of China. In addition, the ecological and environmental protection data are excepted from the bulletin of environmental conditions of counties and cities. The nighttime lighting data were obtained from the National Science and Technology Basic Condition Platform-National Earth System Science Data Center; the NVDI data were obtained from the Resource and Environment Science and Data Center of the Chinese Academy of Sciences (https://www.resdc.cn/Default.aspx (accessed on 10 April 2024)). For some of the missing values, linear interpolation was uniformly used to fill them in.

5. Results and Analysis

5.1. Characteristics of Spatio-Temporal Differentiation of Tourism Economic Toughness Level in the Yili River Valley

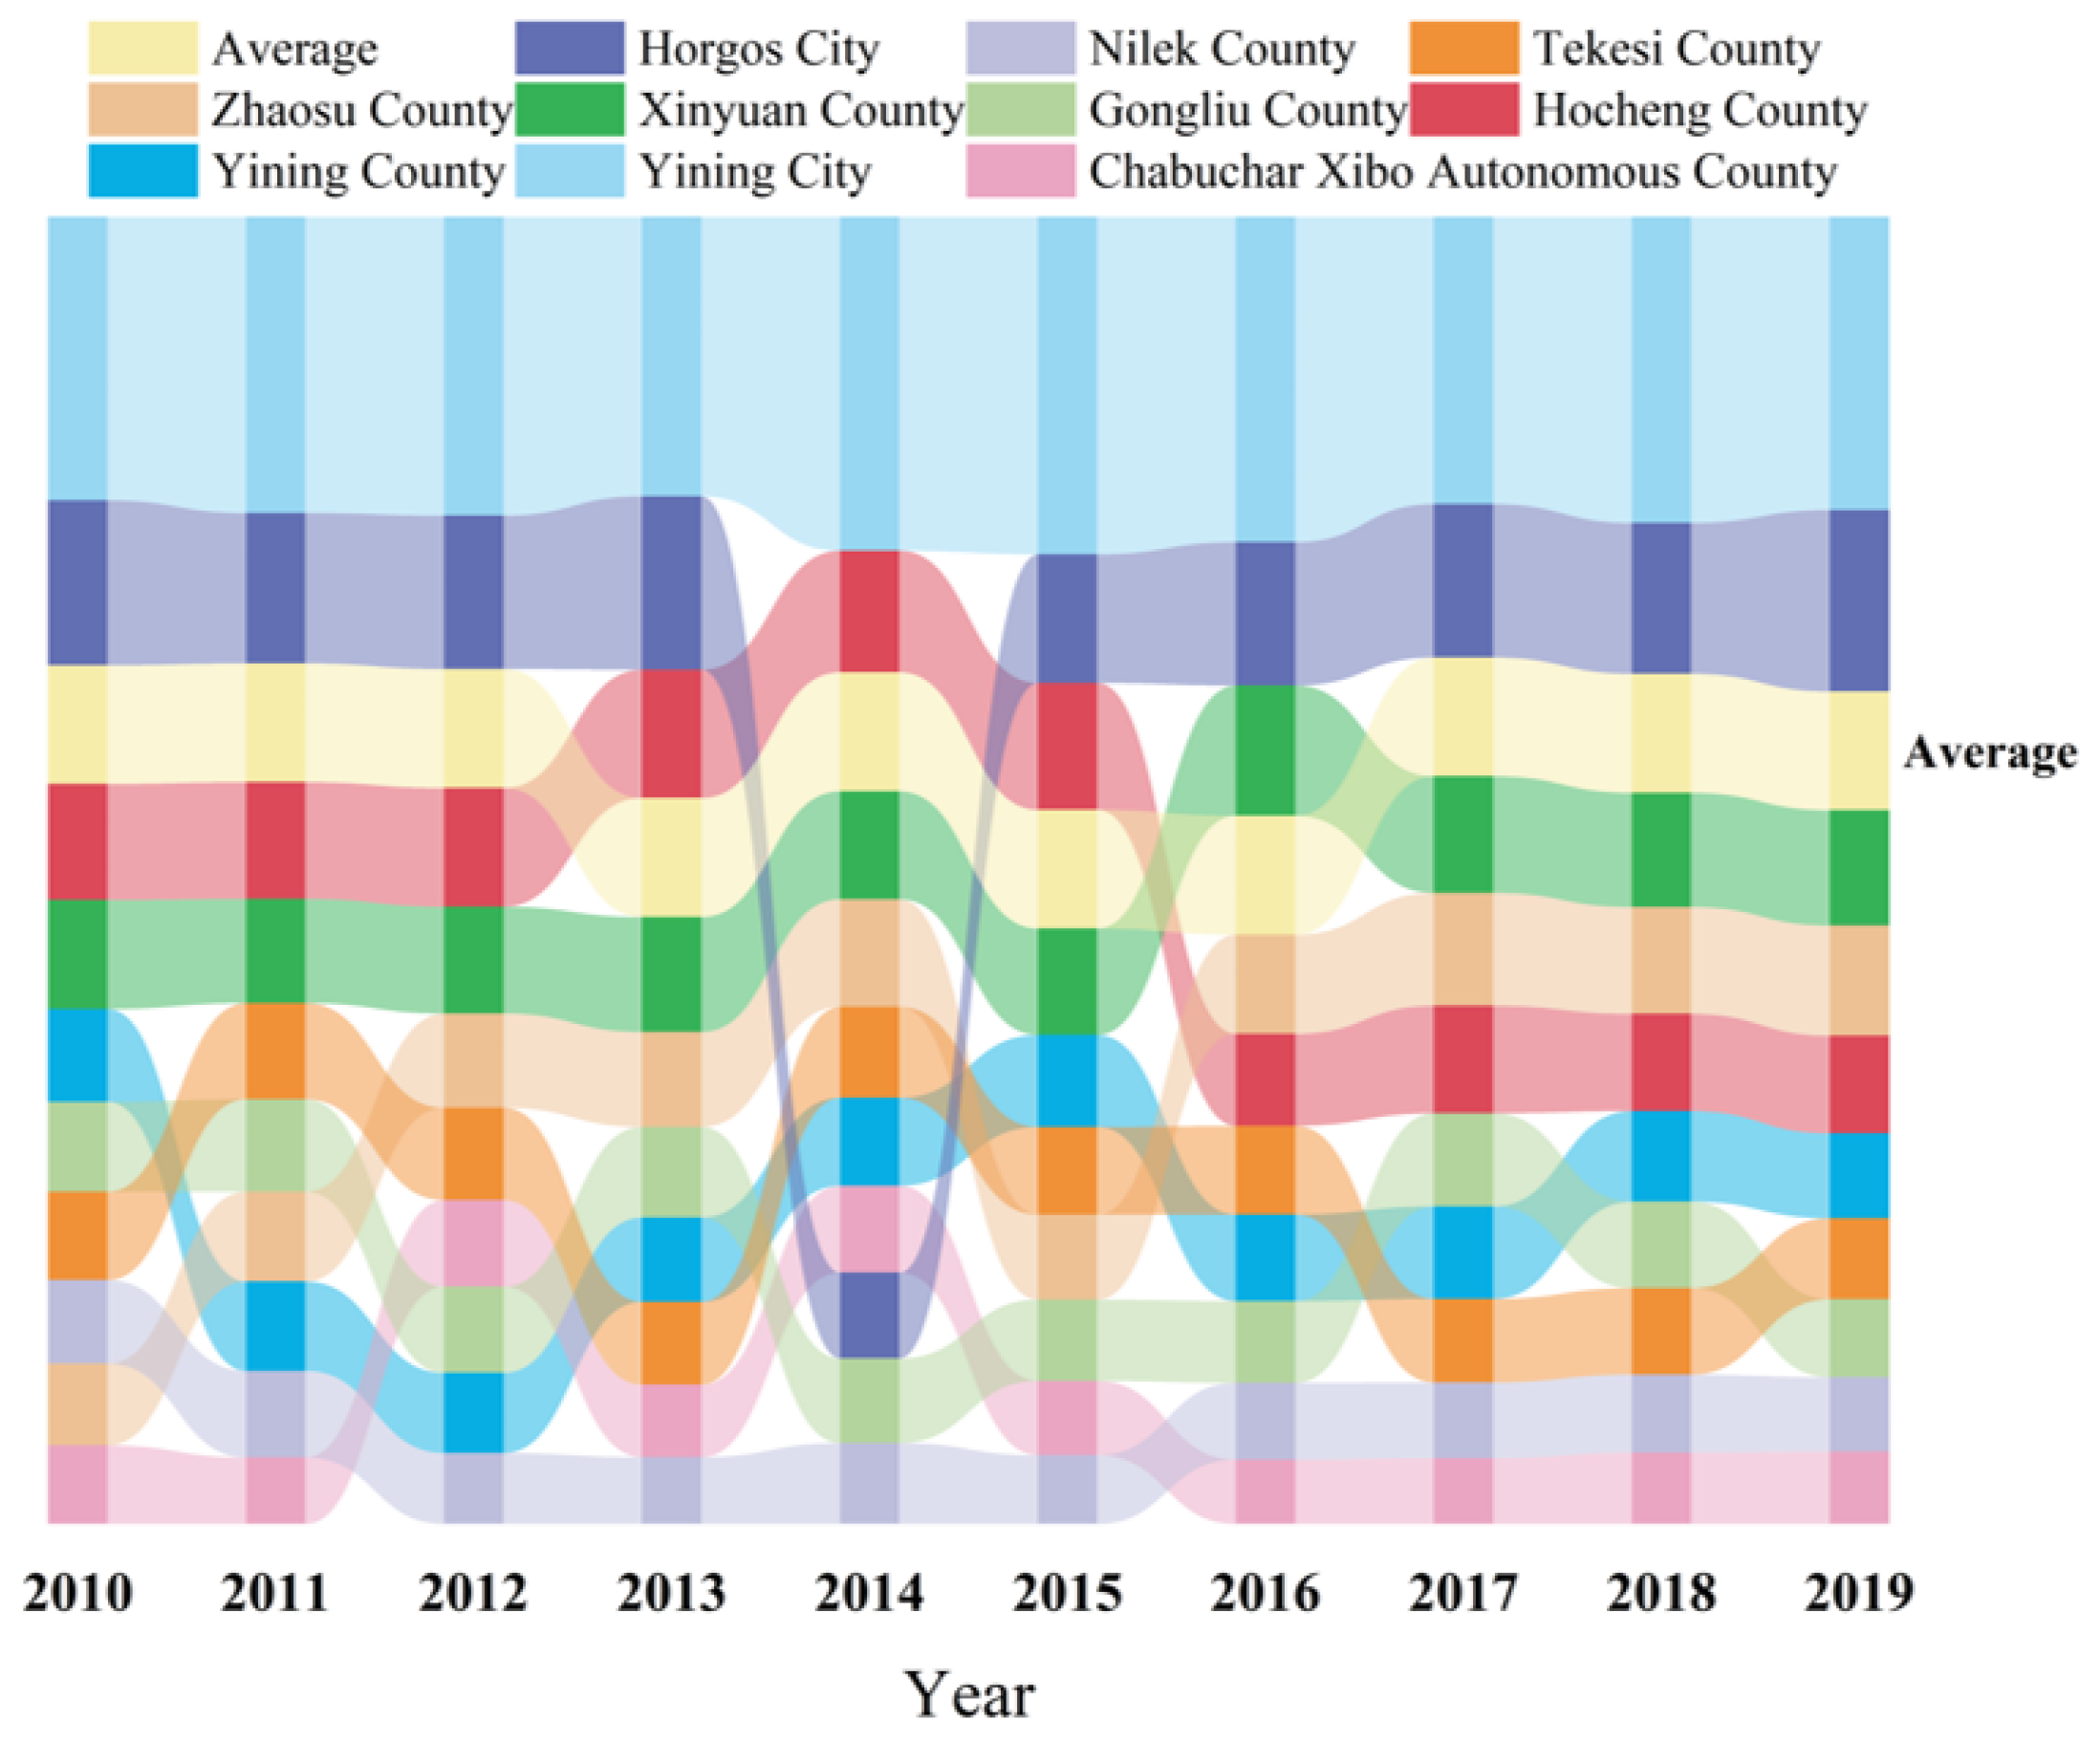
5.1.1. Time-Series Characteristics of Tourism Economic Resilience Level in the Yili River Valley

The tourism economic toughness of the Yili River Valley was measured using the entropy weight TOPSIS method, and the time-series change in the tourism economic toughness level was plotted by Origin2022 (Figure 4) and finally combined with the distribution of the data using the ArcGIS10.8 natural breakpoint method to classify it into low level ( S i < 0.218567), lower level (0.21857 < S i < 0.234047), medium level (0.234047 < S i < 0.273514), higher level (0.273514 < S i < 0.413837), and high level (0.413837 < S i < 0.838269).
From an overall point of view, the average index of tourism economic resilience in 2010–2019 was 0.28394, showing a “W”-shaped development trend, and there was a trough in 2013–2014 and 2015–2016, and the average index of tourism economic resilience decreased from 0.28 to 0.27; see Figure 4. The main reasons are as follows: on the one hand, the economic operation of the Yili River Valley is better, but the main tourism economic indicators have fallen, and the economic downward pressure has increased; on the other hand, new tourism consumption stimulus policies have not yet been introduced, new tourism consumption hotspots have not yet been formed, the growth of the tourism consumption market is weak, and the role of cultural and tourism consumption pulling is weakened. From the tourism economic toughness index of each county and city, firstly, Yining city, as the core city of Yili Kazakh Autonomous Prefecture, presents a breakaway lead, with a higher level of tourism economic toughness; secondly, Horgos city, as a port city, was set up as a county city in 2014, and the adjustment of its resource allocation, policy environment, investment decision, and regional competition and cooperation led to fluctuations in the tourism economic toughness in 2014, but because of its geographic advantages and rapid development of inbound and outbound tourism, tourism economic resilience quickly rebounded to a higher level. Growing trends in the resilience of the NWT’s tourism economy suggest that targeted investments in public infrastructure and marketing strategies are effective. Finally, the remaining counties’ tourism economic resilience levels show an “M” shaped development trend, in which Xinyuan County, Huocheng County, and Zhaosu County, due to their high endowment of tourism resources, are at a medium level, Yining County is at a lower level, and Tekes County, Gongliu County, Nilek County, and Cha Count, due to the lack of tourism core attraction, demonstrate relatively poor tourism economic development. Thus, they are at a low level of development. Policymakers should therefore focus on increasing tourism inputs to reduce the vulnerability of the western region to external shocks by improving transportation links and diversifying tourism products.

5.1.2. Spatial Characteristics of the Tourism Economic Resilience Level in the Yili River Valley

From the viewpoint of spatial distribution (Figure 5), the tourism economic resilience level of the Yili River Valley has basically formed dynamic evolution of the spatial pattern of “high on both sides and low in the middle”. Yining City and Horgos City, representing high-level and higher-level cities in the northwestern part of the region, exhibit spatial distribution characteristics of agglomeration, resulting in a more obvious regional agglomeration effect. Medium-level counties and cities are concentrated in the southwestern part of the region, mainly due to the higher endowment of tourism resources, contributing to the enhancement of tourism economic resilience. Lower-level counties and cities as well as low-level counties and cities in the central region show a trend of proliferation towards the southeast.
From a regional perspective, the tourism economic resilience level of Yining City is ahead of other cities, Horgos City and Huocheng County have reached the medium level or above, while Cha, Gongliu and Tekes Counties are at a low level of development; the development index also continues to decline, and the distribution range of the low-level cities shows the characteristic of first expanding and then narrowing. The above shows that the resilience level of the tourism economy in the Yili River Valley presents significant socio-economic and tourism resource preferences, and most of the counties and cities in the northwest of the study area have a good economic foundation and better accessibility, which can provide good capital, talent, market and other necessary conditions for the development of tourism and its related industries, while the central and southeastern counties and cities have a slower pace of economic development, insufficient tourism public service facilities, insufficient tourism core attracting factors, and a fragile tourism economy.

5.2. Characteristics of the Spatio-Temporal Evolution of Tourism Economic Resilience in the Yili River Valley

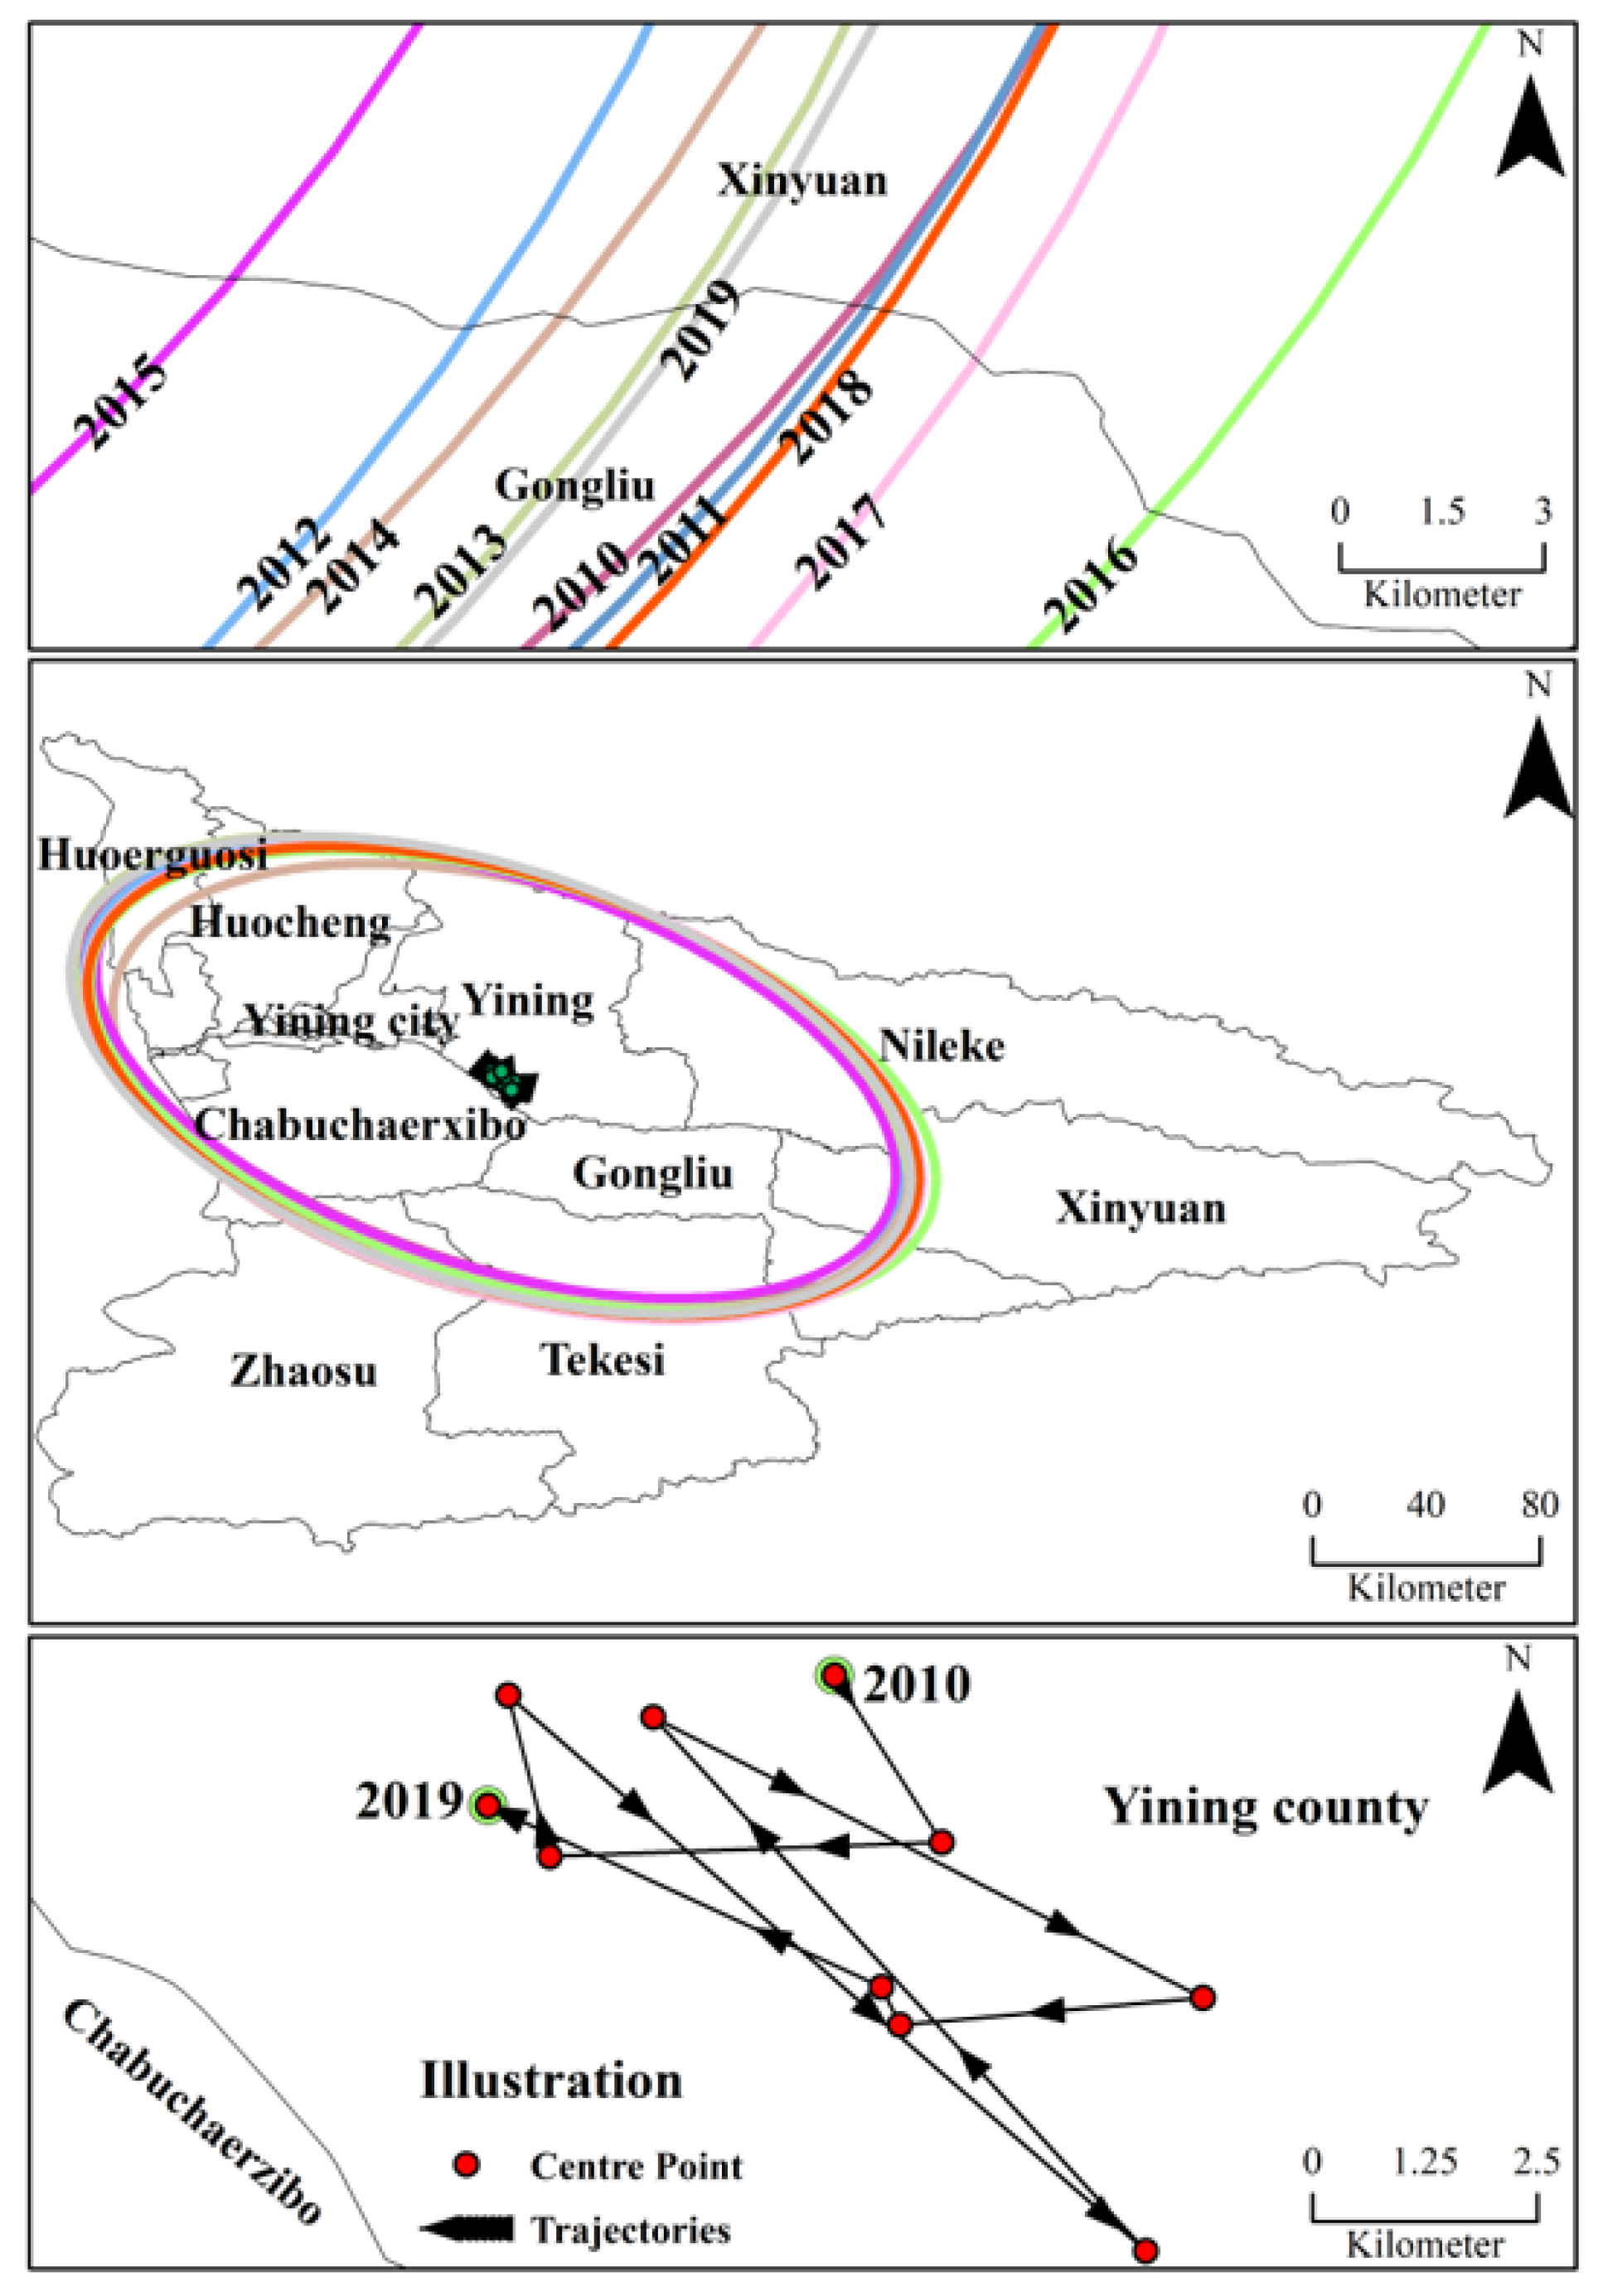
5.2.1. Center of Gravity Evolutionary Trajectory

Through the ArcGIS10.8 spatial statistical analysis tool, the standard deviation ellipse of the tourism economic resilience level and its center of gravity deviation trajectory of the Yili River Valley were plotted from 2010 to 2019 (Figure 6). From the perspective of the spatial distribution, the standard deviation ellipse in each year shows the direction of northwest–southeast, basically covering most of the counties and cities in the study area, and the contraction of the radius of the main axis and sub-axis is smaller; the change in the rotation angle is also smaller, which indicates that during the study period, the degree of agglomeration of the level of toughness of the tourism economy of the Yili River Valley has gradually increased, and the stable offset law is formed basically from the northwest to the southeast.
From the perspective of the center-of-gravity shift process, the center of gravity of tourism economic resilience is roughly located in the central west of the study area, and the center of gravity shift can be divided into four phases: from 2010 to 2014, the horizontal center of gravity shifted to the southeast; from 2014 to 2015, the horizontal center of gravity gradually shifted to the northwest; from 2015 to 2016, the horizontal center of gravity shifted to the southeast in a more substantial manner; and from 2016 to 2019, it gradually re-shifted to the northwest. This is due to the fact that in the early stage of development, the good tourism resources of the southeastern counties and cities in the study area pulled the development of the local tourism economy, and the defense ability and transformation ability were strengthened, but with the passage of time, the relative lagging of economic development could not provide a solid supply and guarantee for the development of its tourism economic resilience, while the northwestern cities have a higher level of economic and social development, their defense, recovery, remodeling, and transformation abilities are stronger, and the level of tourism economic resilience gradually increases.

5.2.2. Characterization of the Evolution of Spatial Dynamics

In order to further reveal the dynamic evolution of tourism economic resilience during the study period, this paper constructs traditional Markov chains as well as Markov chains, taking spatiality into account, analyzes their rank transfer probabilities, and reveals the stability and volatility of the tourism economic resilience in different regions, which in turn helps policymakers and stakeholders to formulate targeted strategies to enhance the resilience of the regional tourism economy. According to the five grades classified in the previous section, the Markov transfer probability matrix is calculated. Among them, the diagonal values indicate the probability of no rank transfer, and the non-diagonal values indicate the probability of transfer between different ranks.
(1)
Traditional Markov chain analysis
On the one hand, according to the typology of tourism economic resilience, there are five convergence clubs of low, lower, medium, higher and high levels of tourism economic resilience (Table 2). The probability values on the diagonal are greater than those on the off-diagonal, indicating that all five convergence clubs have strong stability, i.e., the probability of the region maintaining its original type of development level in any one period is at least 0.7923. Among them, the higher-level convergence club and the high-level convergence club have the greatest stability, with the probability of maintaining their original state being 0.888 and 0.992, respectively. The stability of low- and medium-level converging clubs is relatively balanced, while the stability of lower-level converging clubs is the worst, with a greater possibility of transformation to the medium-level type (0.189), and all significant at at least the 95% confidence level.
On the other hand, the probability of a shift occurring between the different types is small (non-diagonal probability values), with a maximum of 0.189; and the probability values that are not adjacent to the diagonal line are all less than 0.1, implying that the probability of a shift from a low level of county units of tourism economic resilience to a convergence club of more than a medium level of economic resilience is extremely low between the two consecutive years and the shift of a lower level of region to a higher and higher level of convergence club is difficult to achieve, and vice versa. Similarly, it is virtually impossible for medium-level county cells to shift to the “ends of the spectrum”. This result reflects the fact that the economic resilience of regional tourism is a continuous process and that it is difficult to achieve a leap or decline across levels in the short term.
(2)
Spatial Markov chain analysis
Further, on the basis of the Markov chain, the neighborhood environment condition is introduced to construct the spatial Markov chain probability matrix in order to quantitatively examine the influence of the neighborhood environment of the region on the probability of its shift to a particular convergence club (Table 3). In order to verify whether the spatial lag effect is statistically significant, a hypothesis test is required, which assumes that the shifts in tourism economic resilience are independent of each other independent of the type of neighboring state; the formula for the test is described in [34]. The unadjusted degrees of freedom are 80, and at the confidence level of α = 0.001, Q b = 250.65 > χ2 (80) = 124.84, thus rejecting the hypothesis that the type shifts in the level of economic resilience of the tourism economy in the Yili River Valley are spatially independent of each other.
From the table, it can be found that different neighborhood environments result in different probabilities of the type of shift in the region, i.e., the spatial location has an important influence on the convergence club of the region: the higher the neighborhood level, the more conducive to the shift of the county and city units to higher levels of convergence club, and all are significant at least at the 90% confidence level.
Among them, when the neighborhood level is at a low level, the probability of medium-level counties and cities keeping the original level is 0.57, and the probability of upward transfer is 0.43; when the neighborhood level is lower, the probability of tourism economic toughness of low-level, lower-level, and medium-level counties and cities to keep the original level is 0.837, 0.842, and 0.9, respectively, and there is a probability of upward 0.14, 0.15, and 0.1 transfer; when the neighborhood level is at a medium level, the probability of tourism economic toughness of low-level, lower-level, and medium-level counties and cities to maintain their original level is 0.917, 0.892, and 0.9, respectively, and there is a probability of less than 0.1 to transfer upward and downward, respectively; when the neighboring level is higher, the probability of the tourism economic toughness of higher-level counties and cities to stay at the original level is 0.75, and the probability of transferring upward to the high-level probability is as high as 0.25; when the neighborhood level of counties and cities is high, the probability of the tourism economic toughness of low-level, lower-level, medium-level, and higher-level counties and cities to shift to the high-level convergence club is 0.24, 0.2, 0.16, and 0.06, respectively, which indicates that the higher the level of neighborhood-level grade, the more conducive it is to improving the economic toughness of the low-level region, while at the same time, there will be a lower probability of the economic toughness of low-level regions improving due to the siphoning effect of economically developed regions, leading to a downward shift and decline in tourism economic resilience.

5.3. Analysis of the Drivers of the Spatial and Temporal Evolutionary Characteristics of Tourism Economic Resilience in the Yili River Valley

In this study, the average value of the tourism economic resilience index of each county and city from 2010 to 2019 was used as the dependent variable, and the first two indicators with the highest weight values in the four dimensions of defensive capacity, recovery capacity, remodeling capacity, and transformation capacity were used as the independent variables (Table 4); Matlab2022 software was used to analyze the tourism economic resilience driving factors of counties and cities of the Yili River Valley through the grey correlation degree.
By calculating the gray correlation between each indicator and the tourism economic resilience index, the correlation r value of each indicator is obtained. The results show (Table 5) that the magnitude of the correlation of each driver on the tourism economic resilience of the Yili River Valley is in the following order: number of employees in the tertiary industry (X7) > tourism reception (X1) > investment in social fixed assets (X5) > gross tourism income (X2) > total retail sales of consumer goods (X6) > night lights (X4) > ratio of tourists to permanent residents (X8) > number of travel agencies (X3).
First of all, the growth and improvement of the number of employees in the tertiary industry, especially the input of high-quality labor into the tourism industry, helps to improve the quality of tourism services and the development potential of the industry, making the tourism economy more resistant and resilient. The growth in the number of tourists and the total income from tourism shows the scale effect and economic efficiency of the tourism market, which has a direct effect on improving the resistance and resilience of the tourism economy.
Second, higher levels of socio-economic development are usually accompanied by stronger tourism consumption demand and quality tourism infrastructure, which strongly support the resilience of the tourism economy. Societal investment in fixed assets, especially in tourism infrastructure and related services, is crucial for improving the tourism environment, attracting tourists, and maintaining and revitalizing the tourism industry during periods of economic volatility. The tourism consumption component of total retail sales of consumer goods reflects the strong demand for tourism and promotes the prosperity of regional consumer markets, thus enhancing the intrinsic dynamics and stability of the tourism economy.
In addition, reasonable regulation of the ratio of tourists to permanent residents to ensure a balance between tourism carrying capacity and social stability is the key to safeguarding the long-term healthy and resilient development of the tourism economy. Finally, a moderate increase in the number of travel agencies and high-quality services will help integrate resources, innovate products and optimize the tourism experience, thus reinforcing the adaptability and resilience of the tourism market. Overall, the above factors are intertwined and interactive, together determining the strength of the resilience of the tourism economy in the Yili River Valley and providing diversified path choices for realizing the sustainable and sound development of the tourism industry.

6. Conclusions and Discussion

6.1. Conclusions

This paper effectively measures the level of tourism economic resilience of counties and cities in the Yili River Valley from 2010 to 2019 and analyzes its spatio-temporal evolution characteristics and influencing factors. The main conclusions are as follows:
(1)
From the point of view of temporal change and spatial distribution, during 2010–2019, the tourism economic toughness of the counties and cities in the Yili River Valley showed a “W”-shaped temporal change, with 2013–2014 and 2015–2016 being the trough period, which indicates the volatility of the tourism economic toughness in the region. Cities in the northwest, such as Yining City and Horgos City, show high levels of toughness, while the central-to-southeastern counties and cities show relatively low levels, and this spatial distribution pattern is characterized by being “high at both ends and low in the middle”.
(2)
The spatial and temporal evolution characteristics show that there is a stable agglomeration trend in the direction of “northwest–southeast” in the region. At the same time, the tourism economic resilience shows five convergence clubs with strong stability, and the neighboring environment has a significant influence on the transformation of the convergence club, and a high level of neighboring environment is conducive to the transformation of county and city units to a higher level of convergence club.
(3)
Regarding the driving factors, all indicators have a significant impact on the resilience of the tourism economy, with an influence of 0.77 or more. Among them, the number of employees in the tertiary industry, especially the high-quality labor force invested in the tourism industry, helps to improve the quality of tourism services and the development potential of the industry, and becomes the dominant factor for the tourism economy to be more resilient and elastic.

6.2. Discussion

(1)
The “W”-shaped time-series trend revealed in the paper, especially the decline in the resilience of the tourism economy between 2013–2014 and 2015–2016, may be related to multiple factors, such as global or regional economic fluctuations, unforeseen events and policy adjustments. This finding emphasizes the high sensitivity of the tourism economy to internal and external shocks, and the results of the study are consistent with the findings of the previous study by Smith et al. Therefore, policymakers need to build a dynamic monitoring system to identify risks in a timely manner, and at the same time strengthen resilience building, such as diversifying risks through diversified market strategies to enhance the flexibility and adaptability of the tourism industry. In the future, the Yili River Valley still needs to further improve marketization, enhance transportation accessibility, and strive to promote the transformation and upgrading of the industrial structure, so as to consolidate the infrastructure for tourism development. In addition, the macro policy should also strengthen the reasonable guidance to the tourism industry and try to avoid the negative impact of “black swan”, “gray rhino” and other events on the tourism economy.
(2)
The spatial distribution pattern of being “high on both sides and low in the middle” highlights the unevenness of regional development. The performance of cities in the northwest and counties and cities in the southwest illustrates the important contribution of infrastructure, industrial agglomeration and resource endowment to the resilience of the tourism economy. For the central to southeastern regions, the government should adopt differentiated support policies to increase investment in tourism infrastructure in these regions and improve the quality of tourism services, while focusing on sustainable tourism practices that protect natural landscapes and cultural heritage to enhance their core attractiveness. Through regional cooperation, the industrial layout should be optimized, and resource sharing and market linkages should be achieved to promote the overall enhancement and balanced development of the tourism economy.
(3)
Characterization of the spatio-temporal evolution shows that the economic resilience of tourism in the Yili River Valley is not only affected by time-series fluctuations but also shows obvious spatial aggregation and convergence phenomena. The stable pointing of the standard deviation ellipse and the existence of convergence clubs require policy makers to consider spatial proximity and inter-regional interaction in planning. High-level resilient regions should be encouraged to play a radiation-driven role and help low-level resilient regions upgrade through technology transfer and management experience sharing. Meanwhile, effective risk management and disaster preparedness are important parts of the tourism industry’s defense capability, and policy makers and stakeholders should develop and participate in the implementation of comprehensive risk assessment and contingency plans for unexpected crises faced by the Ili River Valley, so as to improve the overall preparedness and resilience to disasters.
(4)
It was found that, unlike Johnson, who emphasized the role of community participation, the results of the grey correlation analysis showed that the number of people employed in the tertiary sector, especially the highly qualified workforce, had a significant positive impact on the economic resilience of the tourism economy, highlighting the centrality of human resources in the tourism industry. This requires local governments to increase education and training efforts to enhance the professional skills and service level of tourism industry personnel while optimizing the talent introduction policy to attract more professionals to join the tourism industry, so as to enhance the quality of the tourism economy and innovation ability driven by talents. In addition, policymakers have prioritized infrastructure investments, particularly in transportation and communication networks, to improve connectivity and accessibility to the Yili Valley, thereby increasing resilience to external shocks.
Tourism economic resilience is related to the healthy and stable development of regional tourism and is an important indicator of high-quality tourism development. Whether different choices of indicators and methods will produce different research results can be further expanded on in the future. The results of this paper have enriched the study of tourism economic resilience in the valley region, and the entropy weight TOPSIS method and Markov chain as well as other cash methods for assessing the tourism economic resilience provide a strong methodological framework. That said, future research can still be further developed as follows: ① The Yili River Valley, serving as a bridgehead to the west, shows clear differences in the resilience of inbound tourism revenue and domestic tourism revenue indicators across its regions. Research could explore the differences in the measurement and spatial–temporal evolution mechanisms, and how we can strengthen comparative studies in the future. ② This paper analyzes the relationship between the impact of different factors on the toughness of the tourism economy by using the gray correlation scale, and future research could further explore the impact of climate change on the toughness of the tourism economy in the Yili River Valley.

Author Contributions

Conceptualization, P.Z. and H.S.; methodology, P.Z. and X.Z.; software, P.Z.; validation, P.Z.; formal analysis, P.Z.; resources, P.Z.; data curation, P.Z. and X.Z.; writing and editing, P.Z., X.Z. and C.S.; visualization, P.Z. and X.X.; supervision, H.S. and X.X.; project management, H.S.; funding acquisition, H.S. All authors have read and agreed to the published version of the manuscript.

Funding

The research was sponsored by the Social Science Foundation of Xinjiang Uygur Autonomous Region (No. 2023BYJ033).

Institutional Review Board Statement

Not applicable.

Informed Consent Statement

Not applicable.

Data Availability Statement

The data presented in the study are available in the article.

Acknowledgments

We thank the Statistics Bureau of Yili Kazakh Autonomous Prefecture, Xinjiang, Department of Culture and Tourism Resource, and Environmental Science and Data Center of the Chinese Academy of Sciences for providing us with the basic data.

Conflicts of Interest

The authors declare no conflicts of interest.

References

  1. Lin, C.-H.; Wang, W.-C.; Ou, S.-J. Impact of Comparative Climate Change Perceptions on Antecedents of Tourists’ Adaptation Intentions for a Coastal Destination in Taiwan. J. Sustain. Tour. 2022, 30, 69–88. [Google Scholar] [CrossRef]
  2. Scott, D.; Hall, C.M.; Gössling, S. Global Tourism Vulnerability to Climate Change. Ann. Tour. Res. 2019, 77, 49–61. [Google Scholar] [CrossRef]
  3. Liu, A.; Pratt, S.A. Tourism’s Vulnerability and Resilience to Terrorism. Tour. Manag. 2017, 60, 404–417. [Google Scholar] [CrossRef]
  4. Santana-Gallego, M.; Fourie, J. Tourism Falls Apart: How Insecurity Affects African Tourism. Tour. Econ. 2022, 28, 995–1008. [Google Scholar] [CrossRef]
  5. Wang, Z.; Zhang, X. Spatio-temporal Differences and Influencing Factors of Resilience of Tourism Svstem in the Yelow River Basin. Geogr. Geo-Inf. Sci. 2023, 39, 112–121. [Google Scholar]
  6. Sun, Y.; Song, Y. Sustainable tourism development from a resilience perspective. Tour. Trib. 2021, 36, 8–10. [Google Scholar] [CrossRef]
  7. Holling, C.S. Resilience and Stability of Ecological Systems. Annu. Rev. Ecol. Evol. Syst. 1973, 4, 1–23. [Google Scholar] [CrossRef]
  8. Martin, R. Regional Economic Resilience, Hysteresis and Recessionary Shocks. J. Econ. Geogr. 2012, 12, 1–32. [Google Scholar] [CrossRef]
  9. Sun, J.; Sun, X. Research Progress of Regional Economic Resilience and Exploration of Its Application in China. Econ. Geogr. 2017, 37, 1–9. [Google Scholar] [CrossRef]
  10. Martin, R.; Sunley, P. On the Notion of Regional Economic Resilience: Conceptualization and Explanation. J. Econ. Geogr. 2015, 15, 1–42. [Google Scholar] [CrossRef]
  11. Briguglio, L.; Cordina, G.; Farrugia, N.; Vella, S. Economic Vulnerability and Resilience: Concepts and Measurements. Oxf. Dev. Stud. 2009, 37, 229–247. [Google Scholar] [CrossRef]
  12. Sheng, Y.; Tan, Z.; Li, Q.; Xu, L. Can the digital economy promote the resilience of the tourism economy in the Yellow River Basin? Arid. Land Geogr. 2023, 46, 1704–1713. [Google Scholar]
  13. Wang, Y.; Gao, J. Shocks of 2019-nCoV, Economic Resilience and China’s High Quality Development. Bus. Manag. J. 2020, 42, 5–17. [Google Scholar] [CrossRef]
  14. Cai, X.; Xu, Y. Spatiotemporal Evolution and Influencing Factors of Tourism Economic Resilience under the Impact of COVID-19—A Case Study of Coastal Cities in China. Sustainability 2023, 15, 16668. [Google Scholar] [CrossRef]
  15. Wang, Q.; Zhao, L.; Yu, W.; Jia, J. Spatial-Temporal Evolution Characteristics and Influencing Factors of Resilience of Tourism Economic System in China. Geogr. Geo-Inf. Sci. 2020, 36, 113–118. [Google Scholar]
  16. Zhang, P.; Huang, Y.; Pan, S.; Chen, W.; Zhong, H.; Xu, N.; Zhong, M. Does Resilience Exist in China’s Tourism Economy? From the Perspectives of Resistance and Recoverability. Sustainability 2022, 14, 10641. [Google Scholar] [CrossRef]
  17. Sun, H.; Wang, Y. Integration research on tourism resources in Baicheng, Xinjiang-YiLi Valley as an exampale. J. Arid. Land Resour. Environ. 2009, 23, 195–200. [Google Scholar]
  18. Ding, C.; Gao, X.; Xie, Z. Analysing the Differential Impact of the COVID-19 Pandemic on the Resilience of the Tourism Economy: A Case Study of the Chengdu-Chongqing Urban Agglomeration in China. Int. J. Disaster Risk Reduct. 2024, 102, 104255. [Google Scholar] [CrossRef]
  19. Zhang, P.; Yu, H.; Xu, L.; Guo, W.; Shen, M. Synergistic Relationship or Not? Understanding the Resilience and Efficiency of the Tourism Economy: Evidence from Hainan Province, China. Environ. Dev. Sustain. 2024, 26, 3793–3817. [Google Scholar] [CrossRef]
  20. Wang, K.; Zhao, S.; Chen, X.; Lei, Z.; Zhou, X. Spatio-Temporal Evolution and Influencing Factors of the Resilience of Tourism Environmental Systems in the Yangtze River Economic Belt of China. Sustainability 2023, 15, 10527. [Google Scholar] [CrossRef]
  21. Xu, Q.; Zhu, G.; Qu, Z.; Ma, G. Earthquake and Tourism Destination Resilience from the Perspective of Regional Economic Resilience. Sustainability 2023, 15, 7766. [Google Scholar] [CrossRef]
  22. Hyun, K.; David, W.M. Considering Disaster Vulnerability and Resiliency: The Case of Hurricane Effects on Tourism-Based Economies. Ann. Reg. Sci. 2015, 54, 945–971. [Google Scholar]
  23. Cutter, S.L.; Ash, K.D.; Emrich, C.T. The Geographies of Community Disaster Resilience. Glob. Environ. Chang. 2014, 29, 65–77. [Google Scholar] [CrossRef]
  24. Berrouet, L.M.; Machado, J.; Villegas-Palacio, C. Vulnerability of Socio—Ecological Systems: A Conceptual Framework. Ecol. Indic. 2018, 84, 632–647. [Google Scholar] [CrossRef]
  25. Cheng, L.; Zhang, J. Is Tourism Development a Catalyst of Economic Recovery Following Natural Disaster? An Analysis of Economic Resilience and Spatial Variability. Curr. Issues Tour. 2020, 23, 2602–2623. [Google Scholar] [CrossRef]
  26. Rai, S.S.; Rai, S.; Singh, N.K. Organizational Resilience and Social-Economic Sustainability: COVID-19 Perspective. Environ. Dev. Sustain. 2021, 23, 12006–12023. [Google Scholar] [CrossRef] [PubMed]
  27. Cai, C.; Tang, J.; He, Q. Research on the Relationship Between Tourism Economic Resilience and Tourism Development Quality in China. J. Nat. Sci. Hunan Norm. Univ. 2024, 47, 42–53. [Google Scholar]
  28. Lounis, Z.; McAllister, T.P. Risk-Based Decision Making for Sustainable and Resilient Infrastructure Systems. J. Struct. Eng. 2016, 142, F4016005. [Google Scholar] [CrossRef]
  29. Mononen, L.; Auvinen, A.-P.; Ahokumpu, A.-L.; Ronka, M.; Aarras, N.; Tolvanen, H.; Kamppinen, M.; Viirret, E.; Kumpula, T.; Vihervaara, P. National Ecosystem Service Indicators: Measures of Social-Ecological Sustainability. Ecol. Indic. 2016, 61, 27–37. [Google Scholar] [CrossRef]
  30. Hong, W.; Jiang, R.; Yang, C.; Zhang, F.; Su, M.; Liao, Q. Establishing an Ecological Vulnerability Assessment Indicator System for Spatial Recognition and Management of Ecologically Vulnerable Areas in Highly Urbanized Regions: A Case Study of Shenzhen, China. Ecol. Indic. 2016, 69, 540–547. [Google Scholar] [CrossRef]
  31. He, X.; Ren, D.; Xu, H. The Impact of Regional Tourism Industry Agglomeration on Resilience of Tourism Economy and its Spatial Effect: A Case Study of the Yangtze River Economic Belt. J. Nat. Sci. Hunan Norm. Univ. 2024, 47, 54–64. [Google Scholar]
  32. Shi, X.; Li, L.; Tao, Z.; Lai, Z.; Li, T. Spatio-temporal evolution and influencing factors of urban ecotourism development level in the Yangtze River Delta. Acta Ecol. Sin. 2024, 44, 3970–3983. [Google Scholar] [CrossRef]
  33. Wang, S.; Gao, S.; Huang, Y.; Shi, C. Spatio-temporal evolution and trend prediction of urban carbon emission performance in China based on super-efficiency SBM model. Acta Geogr. Sin. 2020, 75, 1316–1330. [Google Scholar]
  34. Zeng, G.; Shang, Y.; Si, Y. The convergent evolution of China’s regional economic development models. Geogr. Res. 2015, 34, 2005–2020. [Google Scholar]
  35. Wu, Y.; Xie, Q.; Mu, C. Sensitivity Analysis of Factors Influencing the Blast Resistance of Reinforced Concrete Columns Based on Grey Relation Degree. Sustainability 2023, 15, 12285. [Google Scholar] [CrossRef]
Figure 1. Overview of the study area.
Sustainability 16 05141 g001
Figure 2. Research framework diagram.
Sustainability 16 05141 g002
Figure 3. Markov chain decision-making process.
Sustainability 16 05141 g003
Figure 4. Time series of changes in the level of economic resilience of tourism in the Yili River Valley.
Sustainability 16 05141 g004
Figure 5. Spatial characteristics of tourism economic resilience levels in the Yili River Valley, 2010–2019.
Sustainability 16 05141 g005
Figure 6. Standard deviation ellipse of tourism economic resilience level and its center of gravity shift trajectory in the Yili River Valley, 2010–2019.
Sustainability 16 05141 g006
Table 1. Evaluation index system of tourism economic resilience level.
Primary IndicatorsSecondary IndicatorsTertiary IndicatorsUnitWeights
Defense AbilityTourism Economy IndexTourism Receptionten thousand people0.048669
Gross Tourism Income10 K CNY0.057321
GDP per capitayuan0.04359
Tourism Resources IndexNumber of A-grade scenic spotspcs0.031395
Recovery AbilityTourism Industry IndexNumber of travel agenciespcs0.112212
Number of rooms in star-rated hotelspcs0.072538
Socio-Economic IndexNight Lights/0.119606
Value Added of Tertiary Industrybillion0.07995
Resident Populationten thousand people0.022688
Remodeling AbilityFinance/Capital IndexInvestment in Social Fixed Assets10 K CNY0.042493
General Public Budget Expenditure10 K CNY0.026415
Social Consumption IndexTertiary Industry Output Value as % of GDP%0.03114
Total Retail Sales of Consumer Goods10 K CNY0.057466
Transformation AbilityTourism Environment IndexNDVI%0.017156
Waste Gas EmissionMillion Nm30.009544
Wastewater Emissionten thousand t0.012967
Comprehensive utilization rate of solid waste%0.015342
Tourism Potential IndexNumber of students in secondary schoolspeople0.027383
Number of employees in the tertiary industryten thousand people0.050973
Advanced industrial structure%0.03508
Urbanization rate%0.020962
Tourism Development Vitality IndexRatio of tourists to permanent residents%0.06511
Note: NDVI stands for Normalized Difference Vegetation Index; the weights are calculated according to the entropy weighting method, and the average value of the weights from 2010 to 2019 is taken.
Table 2. Traditional Markov chain transfer probability matrix for tourism economic resilience in the Yili River Valley, 2010–2019.
t/t + 1Low LevelLower LevelMedium LevelHigher LevelHigh Leveln
Low level0.834184 ***0.159439 **0.003827 **0.002551 **0 ***784
Lower level0.01455 **0.792328 ***0.189153 **0.003968 **0 ***756
Medium level0 ***0.016173 ***0.809973 ***0.173854 ***0 ***742
Higher level0.001403 **0.001403 **0.019635 ***0.887798 **0.089762 **713
High level0 ***0 ***0 ***0.008451 **0.991549 **710
Note: ** and *** indicate significant at 95% and 99% confidence levels, respectively.
Table 3. Spatial Markov chain transfer probability matrix for tourism economic resilience in the Yili River Valley, 2010–2019.
Type of Fieldt/t + 1Low LevelLower LevelMedium LevelHigher LevelHigh Leveln
Low level1000000
2000000
30 ***0 *0.571429 ***0.428571 **0 ***28
40 **0 ***0.009901 **0.80198 ***0.188119 *101
50 *0 *0 **0.009501 **0.990499 ***421
Lower level10.837209 **0.139535 ***0 ***0.023256 **0 ***43
20 **0.842105 ***0.157895 **0 ***0 ***38
30 ***0 ***0.9 **0.1 ***0 **10
4000000
5000000
Medium level10.917404 ***0.079646 ***0.00295 *0 ***0 *339
20.021505 **0.892473 ***0.086022 **0 ***0 **93
30 ***0.1 **0.9 ***0 ***0 ***10
4000000
5000000
Higher level1000000
2000000
3000000
40 **0 ***0 *0.75 **0.25 ***24
50 **0 *0 ***0 **1 ***102
High level10.763682 *0.228856 **0.004975 ***0.002488 *0 ***402
20.0144 *0.7744 *0.2064 **0.0048 **0 **625
30 **0.015942 ***0.817391 *0.166667 **0 ***690
40.001727 **0.001727 ***0.022453 ***0.908463 ***0.06563 **579
50 **0 *0 ***0.010695 **0.989305 ***187
Note: *, **, and *** indicate significant at 90%, 95%, and 99% confidence levels, respectively.
Table 4. Indicators of factors influencing the resilience of the tourism economy.
Impact FactorsRepresentative IndicatorsProperties
Defense AbilityTourism reception (X1)Forward
Gross tourism income (X2)Forward
Resilience AbilityNumber of travel agencies (X3)Forward
Night lights (X4)Forward
Remodeling AbilityInvestment in social fixed assets (X5)Forward
Total retail sales of consumer goods (X6)Forward
Transformation AbilityNumber of employees in the tertiary industry (X7)Forward
Ratio of tourists to permanent residents (X8)Forward
Note: Night lights represent socio-economic indices.
Table 5. Grey relation analysis results.
Implicit VariableX1X2X3X4X5X6X7X8
r0.90290.86040.77160.81890.88800.85630.91110.8146
p0.00000.00000.00000.00000.00000.00000.00000.0000
Disclaimer/Publisher’s Note: The statements, opinions and data contained in all publications are solely those of the individual author(s) and contributor(s) and not of MDPI and/or the editor(s). MDPI and/or the editor(s) disclaim responsibility for any injury to people or property resulting from any ideas, methods, instructions or products referred to in the content.

