Abstract
Highway infrastructure projects financed by real estate investment trusts (REITs) have garnered significant attention due to their potential for generating stable returns. However, assessing the risks associated with such projects remains a critical challenge. This study addresses this gap by proposing a novel approach to risk assessments utilizing the Decision-Making Trial and Evaluation Laboratory (DEMATEL) integrated with Interpretive Structural Modeling (ISM). Unlike traditional risk assessment methods, which often treat risk factors as isolated entities, the DEMATEL—ISM approach provides a comprehensive framework that reveals the direct and indirect relationships between risk factors, thus offering a systemic understanding of the interactions. The results found that falling market prices, insufficient operating revenues, and operational inefficiencies were direct influences, and high financing costs and force majeure were the fundamental influences, while other factors acted as intermediate influences. In addition, the study identifies direct and indirect relationships between different risk factors, providing a hierarchical topology of risk factors to reflect the relationships between the risk factors. The findings not only contribute to enhancing the understanding of risk dynamics in highway infrastructure REITs projects, but also offer a structured framework for risk assessment and mitigation. This research represents a significant innovation in the field of infrastructure investment risk management, offering practical implications for project planning, decision-making, and risk management strategies.
1. Introduction
Highway infrastructure projects are vital components of a nation’s transportation network, serving as arteries for economic activity and societal development. As the demand for efficient and sustainable transportation grows, so does the need for innovative financing mechanisms to support the development and maintenance of these critical assets [1]. Real estate investment trusts (REITs) have emerged as a viable avenue for funding highway infrastructure projects, offering investors the opportunity to participate in the ownership and operation of these assets, while providing a source of long-term capital for infrastructure development [2].
However, the inherent risks associated with highway infrastructure REITs projects pose significant challenges to investors, developers, and policymakers alike. These risks encompass a wide range of factors, including but not limited to regulatory uncertainties, construction delays, traffic fluctuations, and environmental concerns [3]. Moreover, the complex interdependencies and feedback loops within the highway infrastructure ecosystem exacerbate the difficulty of accurately assessing and managing these risks.
In light of these challenges, there is a pressing need for comprehensive risk assessment frameworks tailored specifically to highway infrastructure REITs projects. While existing risk assessment methodologies offer valuable insights, they often fail to capture the intricate relationships and causal linkages among risk factors inherent in the highway infrastructure context [4]. Consequently, there remains a gap in the literature regarding effective risk assessment approaches that account for the dynamic and interconnected nature of highway infrastructure REITs projects.
To address this gap, this study proposes a novel risk assessment framework based on the Decision-Making Trial and Evaluation Laboratory (DEMATEL) and Interpretive Structural Modeling (ISM) methodologies. By integrating qualitative and quantitative techniques, the DEMATEL—ISM approach enables the identification of key risk factors, the elucidation of their interrelationships, and the prioritization of mitigation strategies [5]. Moreover, by leveraging the strengths of both methodologies, this framework offers a holistic and nuanced understanding of the complex risk landscape facing highway infrastructure REITs projects.
In summary, this research seeks to contribute to the existing body of knowledge by developing a robust and practical risk assessment framework tailored to the unique characteristics of highway infrastructure REITs projects. By enhancing our ability to identify, analyze, and mitigate risks, this framework aims to facilitate informed decision-making and ultimately promote the sustainable development of highway infrastructure systems worldwide.
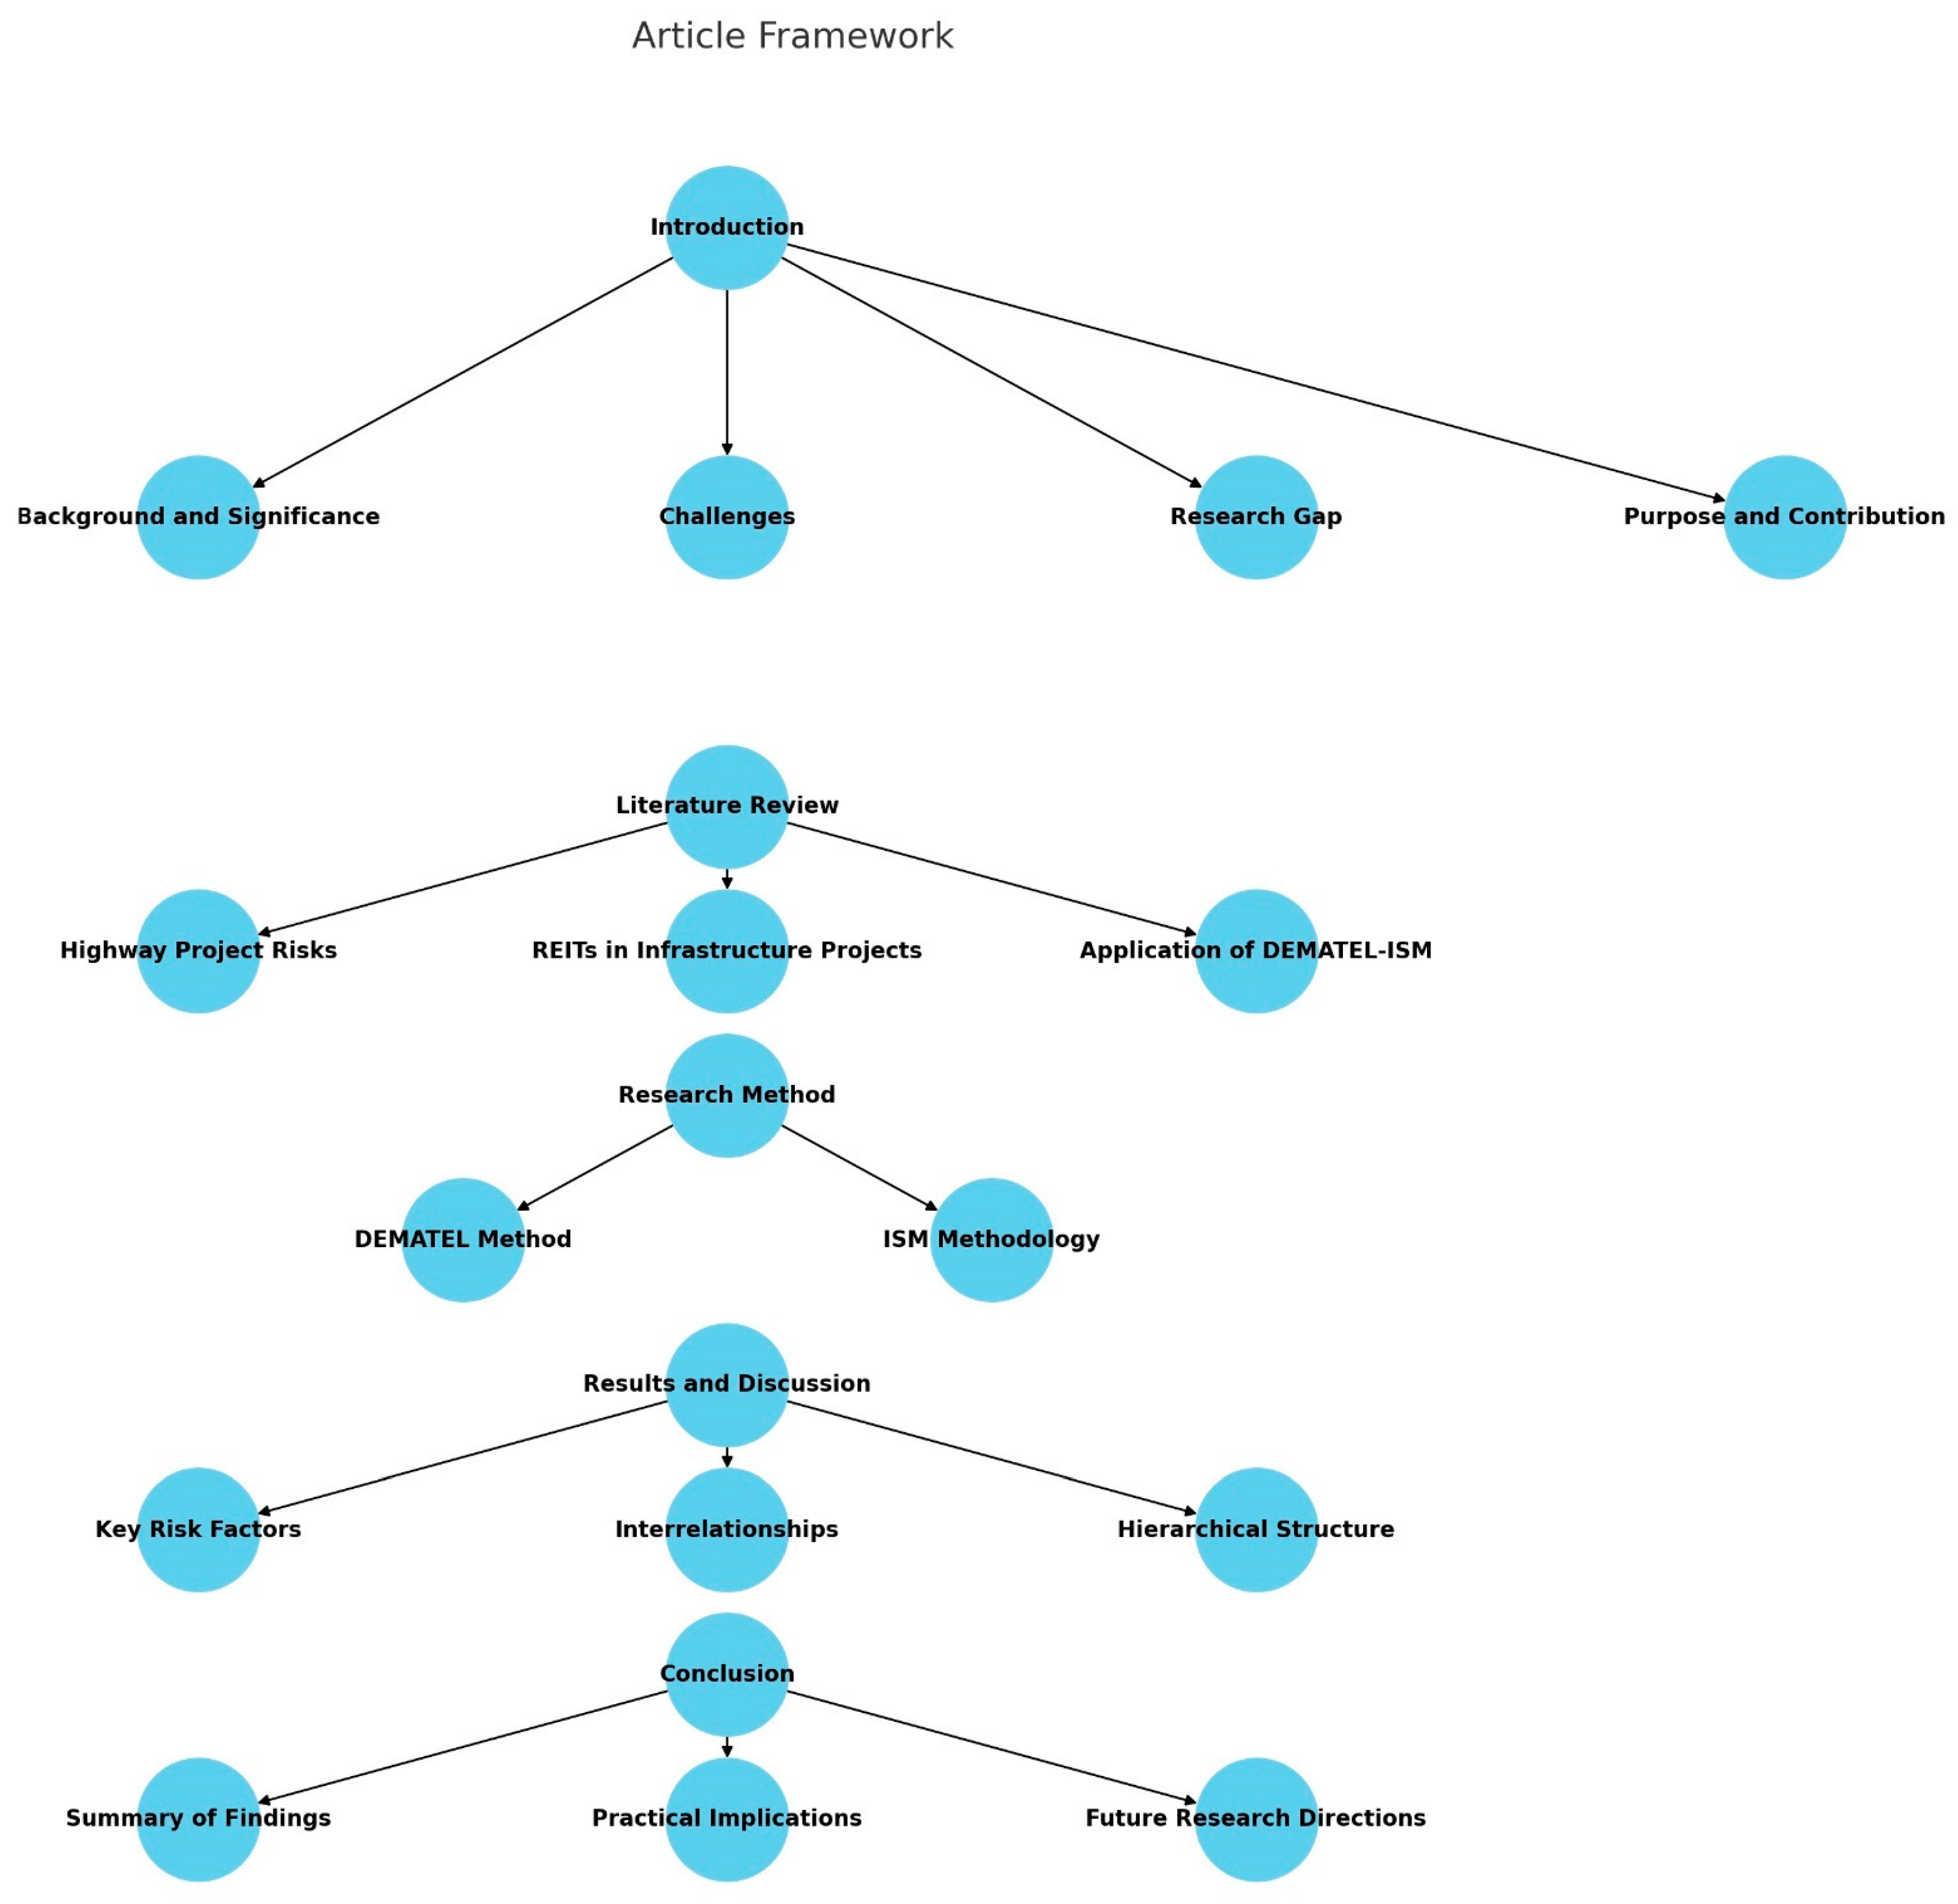
Figure 1 illustrates the research process framework for this article.

Figure 1.
Article framework.
2. Literature Review
Risk assessments in highway projects are a critical aspect that impacts project success and completion. Various studies have focused on different aspects of risk assessments and factors influencing risk in highway construction projects. Bhatt identified success and risk factors in public–private partnership (PPP) models for highway projects in India, emphasizing the uncertainties faced throughout the project phases [6]. Susanti discussed cost overruns in highway strategic projects in Indonesia, attributing the issues to high pressure from the government, impacting project costs [7]. Vu investigated schedule delay risk factors in highway projects in Vietnam, highlighting the impact of schedule delays on project investment efficiency, cost, and reputation. The study utilized a structural equation model to evaluate influential factors affecting highway construction schedules [8]. Kumar focused on financial risk assessment and modeling of PPP-based Indian highway infrastructure projects, applying a standard risk analysis model supported by Monte Carlo simulation. The study identified parameters, such as traffic flow and project cost, to model financial risks in real-world PPP-based highway projects [9].
Real estate investment trusts (REITs) are companies that own, operate, or finance income-producing real estate across a range of property sectors. They offer investors an opportunity to own real estate and receive dividend-based income and total returns [10]. The characteristics of REITs include their liquidity, as they are traded on major stock exchanges, and their requirement to distribute at least 90% of taxable income to shareholders, which makes them attractive for income-focused investors [11]. The performance of REITs has been the subject of extensive research. Studies have shown that REITs tend to offer competitive returns compared to other asset classes. According to a study by Ooi, Newell, and Sing, U.S. REITs have historically provided robust total returns, driven by both income and capital appreciation [12]. Additionally, studies by Pagliari, Scherer, and Monopoli have demonstrated that REITs can outperform traditional real estate investments due to their liquidity and professional management [13]. One of the key advantages of investing in REITs is their potential for diversification. REITs have low correlations with other major asset classes, such as stocks and bonds, which can enhance the risk–return profile of a mixed-asset portfolio [14]. Furthermore, REITs offer geographic and sector diversification, allowing investors to gain exposure to different types of properties and markets. Despite their benefits, REITs also come with inherent risks. Market risk, interest rate risk, and regulatory risk are among the primary concerns for REIT investors. The sensitivity of REIT prices to interest rate changes is well documented, as rising interest rates can lead to higher borrowing costs and lower property values [15]. Additionally, the operational risks associated with managing real estate assets, such as property vacancies, maintenance costs, and tenant defaults, can impact REIT performance. Environmental, social, and governance (ESG) considerations are becoming increasingly relevant, with investors scrutinizing REITs’ sustainability practices and their impact on long-term value creation [16].
In China, highway infrastructure projects, particularly those involving real estate investment trusts (REITs), are in their infancy; researchers have utilized the DEMATEL—ISM approach to assess the financing risks associated with these projects. This method involves data analysis to identify and evaluate the key risk factors affecting expressway REITs, providing a comprehensive index system for risk assessments. Song and Hao applied the fuzzy DEMATEL methodology to investigate the risk factors for financing highway infrastructure REITs [17]. The fuzzy DEMATEL method was utilized to derive the weights of key risk factors, and management recommendations were made. In addition to expressway REITs, the risk assessment of infrastructure projects in China, including those utilizing public–private partnerships (PPP), has been a focus of research. A hybrid fuzzy DEMATEL—ISM approach has been proposed for evaluating the risks associated with infrastructure REITs projects, highlighting the importance of considering institutional factors in risk assessments [18]. This approach emphasizes the need for a thorough evaluation of the risk factors to ensure the successful implementation of PPP projects in the infrastructure sector. Some scholars use quantitative methods, such as modeling, to investigate the risks associated with REITs. Based on the F-AHP fuzzy comprehensive evaluation method, combined with the operation status of highway REITs’ assets, Lu concluded that the top three financing risk factors are operation and management risk, credit risk, and legal risk, respectively, which help to provide risk avoidance suggestions for participants in China’s REITs market [19]. Jian-min used the DEMATEL method to study the financing risk factors of a waste incineration power generation PPP project. The results show that the risk factors are mainly categorized into risks involving the government’s breach of trust, inflation, interest rate risk, and the partner’s performance risk, etc. [20]. The study provides theoretical and practical references for future related research. Wang, starting from the characteristics of the REIT financing mode, combined with the practice of highway construction and operation, used the risk matrix method to quantitatively evaluate the risk of the highway REITs financing mode and put forward targeted risk response strategies, and the results of the study are practical and instructive to a certain extent [21]. Furthermore, the integration of the DEMATEL—ISM methodology in risk assessments has been applied to various construction projects beyond expressway and infrastructure REITs. For example, a study on the safety of coal mine construction projects utilized an integrated DEMATEL—ISM approach to evaluate the risk factors affecting project safety [22]. This demonstrates the versatility of the DEMATEL—ISM approach in assessing risks across different types of construction projects. The study by Liu X et al. focuses on the application of the DEMATEL—ISM methodology based on finance and does not directly mention the risk factors of highway infrastructure REITs financing; however, it also reveals the effectiveness and applicability of the methodology and provides inspiration and guidance for subsequent studies [23]. Giannotti found that the size of the REIT affects its risk from the perspective of REITs. Large REITs benefit from a large degree of risk diversification, which is affected by the portfolio structure of the REITs [24]. Chaudhry quantitatively analyzed the unsystematic risk affecting REITs by developing an asset pricing model. The results of the study show that the risk variables affecting REITs vary over time and behave differently [25]. Rong examined the link between REITs and the stock market from the perspective of external factors affecting the risk of REITs using a conditional copula model, and concluded that there is a clear positive correlation between REITs and the stock market [26]. Overall, the DEMATEL—ISM approach has proven to be a valuable tool in risk assessments for highway infrastructure REITs projects and other construction endeavors. By identifying and analyzing key risk factors, researchers and practitioners can make informed decisions to mitigate risks and enhance project success.
Despite the comprehensive studies conducted on risk assessments and REITs, there are notable research gaps that warrant further investigation. Firstly, while numerous studies have applied the DEMATEL—ISM approach to various projects, the specific application to highway infrastructure REITs in the Chinese context remains limited. There is a need for more empirical studies to validate the effectiveness of the DEMATEL—ISM approach in this specific sector. Secondly, existing research often focuses on individual risk factors without exploring the interplay between these risks in a holistic manner. Thirdly, the impact of emerging risks, such as those related to ESG considerations and technological advancements in construction, on highway infrastructure REITs has not been extensively explored. Addressing these gaps could provide deeper insights into risk mitigation strategies and contribute to the development of more resilient highway infrastructure REITs projects.
3. Research Method
3.1. DEMATEL Method
The Decision-Making Trial and Evaluation Laboratory (DEMATEL) is a quantitative and qualitative methodology used to analyze and understand the complex interrelationships among factors or elements within a system. Developed by Professor John P. Shaffer in the 1970s, DEMATEL aims to identify the causal relationships and determine the levels of influence among various factors [27]. The purpose of the method is to assess the influence relationships between elements and to calculate the degree of causality and centrality for each element. By establishing logical relationships and direct influence matrices, the DEMATEL method can quantify the degree of interaction between elements and identify dominant influences [28]. The results of these calculations are used as the basis for constructing a model that identifies the causal relationships between the elements and their location in the system. The DEMATEL method provides an effective tool for systems analysis and decision-making that can help decision-makers understand the complexity of a problem, assess the significance of influencing factors, and formulate an appropriate decision strategy [29].
Highway infrastructure REITs projects typically involve well-defined risk factors that can be precisely identified and evaluated. The DEMATEL method is adept at handling such deterministic data, providing clear and direct insights into the causal relationships among these factors. In addition, one of the key strengths of the DEMATEL method is its ability to elucidate both direct and indirect relationships among risk factors. This is particularly useful for highway infrastructure REITs, where understanding the ripple effects of one risk on another is critical for comprehensive risk management.
The steps in the analysis are as follows:
Step 1: Establish an initial direct relation matrix. Convene experts in the relevant fields to assess the strength of the relationship between the influencing factors. By using expert ratings, compare the impact of () on (), with no impact on itself (diagonal values are 0). This yields the initial direct relation matrix (). The relationship between the indicators is first quantified to obtain the initial direct relation matrix .
Step 2: The second step is to establish a normalized direct relation matrix. There are several methods for normalization and, here, we employ the row and maximum value method. Calculate the sum of each row in matrix (), take the maximum value among them, then divide all the elements of matrix () by this maximum value to obtain the normalized direct relation matrix (). Based on the following normalization formula, the normalized direct relation matrix is obtained as follows:
Step 3: Establish a total relation matrix (). The total relation matrix reflects the integrated effects among the elements within a system. The total relation matrix is calculated using the normalized direct relation matrix, based on the following equation ( is the unit matrix):
Step 4: Based on the total relation matrix, we can calculate the influencing degree (), influenced degree (), centrality degree (), and causality degree () for each element. In addition, we calculate the weights of all the risk factors and rank them.
The influencing degree refers to the sum of the rows in the matrix . The sum of the rows in the matrix represents the combined influence of each row element on all the other elements, denoted as :
The influenced degree refers to the sum of the columns in the matrix . The sum of the columns in the matrix represents the combined influence of each column on all the other elements, denoted as :
The centrality degree indicates the position of the factor in the evaluation system and the size of the role it plays. The centrality of a factor is the sum of its influence and the degree of being influenced, which is recorded as :
The causality degree is obtained by subtracting the influencing degree and the degree of being influenced by an element and is denoted as :
Normalize the centrality degree to obtain the weights of the indicators and, according to the weights, we rank the risk factors.
Step 5: Plotting cause and effect diagrams. Plot the cause and effect graph by using the centrality degree as the horizontal coordinate and the casualty degree as the vertical coordinate. The first and second quadrants are deep factors, while the factors in the third and fourth quadrants are surface factors.
3.2. ISM Methodology
Interpretive Structural Modeling (ISM) is a systematic methodology used to analyze complex relationships among various elements within a system. Developed by Professor John N. Warfield in the 1970s, ISM aims to uncover the hierarchical structure of interconnected elements and understand the interactions between them. It helps researchers and decision-makers to identify the interdependencies between different factors and organize these factors into an explanatory hierarchy. The ISM process begins with the identification of relevant elements or factors within the system of interest. These elements could represent variables, components, or entities that influence the system’s behavior or outcomes. Once identified, the relationships between these elements are examined through pairwise comparisons, typically using expert judgment or empirical data. Based on these comparisons, a directed graph, known as a reachability matrix, is constructed to depict the relationships between the elements. This matrix helps visualize the hierarchical structure and dependencies within the system. Through iterative analysis and refinement, the ISM method ultimately generates a structural model that reveals the levels of influence among the elements, ranging from direct influences to higher-order dependencies. ISM facilitates a deeper understanding of complex systems by highlighting the key drivers, dependencies, and feedback loops that shape their behavior. It provides insights into the structural properties of the system, aiding decision-making processes, strategic planning, and problem-solving efforts. Moreover, ISM can be integrated with other decision-making techniques, such as the Decision-Making Trial and Evaluation Laboratory (DEMATEL), to enhance its analytical capabilities and address specific research objectives. The goal of the ISM method is to reveal and understand the hierarchy and relationships between the factors in a system, as well as their impact on the overall performance of the system [30]. The steps in the analysis are as follows:
Step 1: Building a holistic impact matrix .
Step 2: Building the reachability matrix . In matrix , set numbers less than the threshold to 0 and others to 1, are used to obtain the reachability matrix . The values are determined by the mean and standard deviation.
In the reachability matrix, ‘1’ indicates the presence of a direct relationship and ‘0’ indicates its absence. If there is a path from factor i to factor j through other factors, then an indirect relationship is established.
Step 3: Compute reachability set, antecedent set, and intersection set.
The reachability set is , where each row represents a factor and each column represents the influence of one factor on another; the reachability set indicates which factors can directly influence others within the system. Specifically, in a row of the matrix, if there is a value of 1, it signifies that the factor corresponding to that column has a direct influence on the factor represented by the row. Therefore, the reachability set for each factor includes all the factors that it directly influences.
The antecedent set is , where each column represents a factor and each row represents the influence of one factor on another; the antecedent set indicates which factors directly influence the factor represented by a specific column. Specifically, for a column in the matrix, if there is a value of 1 in a row, it signifies that the factor corresponding to that row directly influences the factor represented by the column. Therefore, the antecedent set for each factor includes all the factors that directly influence it.
The intersection set is the intersection of .
Step 4: Factor stratification. When satisfied , it indicates that the factor in is the highest stratified factor. Stratify the stratified factors from and and the intersection sets. The factors with the same intersection sets form a level. These factors are then removed from the matrix, and the process is repeated to find the next level, until all the factors are assigned to a level.
By combining the DEMATEL and ISM methodologies, this approach leverages the strengths of both to more effectively capture the dynamic interdependencies among risk factors. The DEMATEL method excels at identifying and quantifying both direct and indirect relationships among factors, providing a nuanced understanding of how one risk can influence another within a system. This detailed causal analysis allows for the mapping of complex interdependencies, highlighting key risk factors that significantly impact others. Meanwhile, ISM organizes these interrelated factors into a clear hierarchical structure, revealing multi-level dependencies and providing a systematic view of the entire risk landscape. By integrating these approaches, the DEMATEL—ISM method not only uncovers intricate relationships and causal pathways, but also structures them into a coherent framework that is easier to analyze and manage. This comprehensive approach leads to more accurate risk assessments, better prioritization of mitigation efforts, and enhanced decision-making processes, making it particularly effective for managing the multifaceted risks associated with highway infrastructure REITs projects.
While the integration of DEMATEL and ISM methods offers a comprehensive framework for the risk assessment of highway infrastructure REITs projects, it also introduces potential methodological challenges that need to be critically assessed. One significant challenge is the reliance on expert judgments, which can introduce subjective biases. DEMATEL depends on expert opinions to determine the influence relationships among factors, and ISM uses these relationships to build a hierarchical structure. To mitigate this issue, it is essential to increase the number and diversity of participating experts and conduct consistency checks on their evaluations. Another challenge lies in the complexity of integrating these methods. The combined approach may increase the overall complexity of the analysis, making the results harder to interpret. To address this, sensitivity analysis can be performed to understand the impact of different assumptions and to ensure the robustness of the results.
4. Results
4.1. Risk Factor Identification
The identification of risk factors for highway infrastructure REITs projects was a meticulous process aimed at ensuring comprehensive coverage and relevance. The study utilized the Web of Science, CNKI, and Wanfang databases, focusing on the subject terms ‘highway infrastructure REITs’, ‘REITs financing’, and ‘REITs risk’. The search spanned from 2000 to 2024, yielding 231 articles. To refine this initial sample, a multi-stage screening process was implemented. First, non-academic literature was excluded to maintain the academic integrity of the study. Next, articles with a high level of repetition were identified and removed to avoid redundancy. Subsequently, the relevance of each article was assessed by evaluating the abstracts and keywords, ensuring that only those with significant research contributions and a clear focus on the subject matter were retained. Finally, any invalid records, such as incomplete articles or those lacking empirical data, were discarded. This thorough screening process resulted in a refined and high-quality sample of 103 articles, forming the basis for the subsequent risk factor identification and analysis using the DEMATEL—ISM approach.
We then used CiteSpace 6.2.R3 (64-bit) Advanced; Publisher: Drexel University, Philadelphia, PA, USA, 2023 to analyze the sample dataset for keyword co-occurrence. This analysis method parses keywords within the literature, calculates the frequency of co-occurrence, and visualizes the relationships between the keywords. It helps in identifying the most frequently occurring and relevant keywords within the field [31].
The co-occurrence of two keywords and in a set of documents can be represented by the co-occurrence matrix , where is the number of documents in which both keywords appear. The co-occurrence strength can be measured using the Jaccard index:
where and are the number of documents containing keywords and , respectively.
Additionally, keyword cluster analysis was conducted to group related risk factors. This method uses clustering algorithms to categorize keywords into clusters, where each cluster represents a distinct thematic area of risk factors. The clustering was performed using the K-means algorithm, which minimizes the within-cluster variance:
where is the number of clusters, is the set of points in cluster , is a point in cluster k, and is the centroid of cluster .
The keyword co-occurrence and keyword cluster analysis, using the CiteSpace software, revealed various risk factors categorized differently by scholars. To ensure comprehensiveness, we adopted the most frequently occurring risk indicators and classified them into seven main categories, resulting in 20 influencing factors as detailed in Table 1. The selection process emphasized factors with high relevance and frequency in the literature, ensuring that the identified risks were both significant and widely recognized.

Table 1.
Highway infrastructure REITs financing risk factor identification results.
Additionally, several alternative risk factors were considered during the selection process. For instance, factors such as “technology risk”, “environmental sustainability risk”, and “community opposition risk” were initially reviewed. However, these were ultimately excluded based on their relatively lower impact or overlap with other broader categories, such as “operational risk” and “regulatory risk”. For example, “technology risk” was deemed less critical for highway projects compared to sectors like telecommunications or IT infrastructure. Similarly, “environmental sustainability risk”, while important, was incorporated into the broader category of “environmental risk” to streamline the analysis. This approach ensured that the selected risk factors were the most impactful and relevant to the study’s objectives.
4.2. DEMATEL Modeling
4.2.1. Constructing an Initial Direct Relation Matrix
This paper uses the Delphi method to invite relevant experts and scholars to score the interactions among the risk factors listed in Table 1. Specifically, we compare the risk factors on the horizontal axis with those on the vertical axis. If a risk factor on the horizontal axis has no impact on a risk factor on the vertical axis, it is scored as 0. If a risk factor on the horizontal axis has a low impact on a risk factor on the vertical axis, it is scored as 1. If a risk factor on the horizontal axis has a medium impact on a risk factor on the vertical axis, it is scored as 2. If a risk factor on the horizontal axis has a high impact on a risk factor on the vertical axis, it is scored as 3. If a risk factor on the horizontal axis has a great impact on a risk factor on the vertical axis, it is scored as 4.
To ensure the robustness and credibility of our expert panel, we implemented a systematic selection process focusing on expertise, diversity, reputation, and ethical considerations. We targeted individuals with extensive experience in engineering and construction, particularly those with a proven track record in similar large-scale highway infrastructure projects. Our criteria for selecting experts included prioritizing candidates with advanced degrees, such as a Ph.D. or M.Sc., in relevant fields like civil engineering, transportation engineering, or infrastructure development. Additionally, we sought professionals with substantial work experience in large-scale highway infrastructure projects, including highways, tunnels, and transportation systems. Recognizing the multidisciplinary nature of such projects, we aimed to assemble a diverse panel representing various stakeholders and disciplines, including engineers specializing in structural design, transportation planning, and project management, as well as policymakers, economists, and environmental experts. Geographic diversity was also considered to ensure a broad range of perspectives and experiences. We sought experts who were widely respected and recognized within their respective fields, either through publications in reputable journals, participation in relevant conferences and committees, or leadership roles in professional associations. Their reputation served as a testament to their expertise and credibility, bolstering the quality of their contributions to our study. Experts were identified through a combination of targeted outreach and referrals from trusted sources within the engineering and construction community. To maintain objectivity and integrity, we carefully screened potential experts for any conflicts of interest that could compromise their impartiality. Individuals vested interests in specific outcomes were excluded from consideration to ensure unbiased evaluations and recommendations. Throughout the selection process, we adhered to ethical guidelines governing research involving human participants. Experts were provided with clear information about the study’s objectives, their roles, and the confidentiality of their contributions. Informed consent was obtained, and measures were put in place to protect the privacy and rights of all the participants. By adhering to these rigorous criteria and procedures, we assembled a qualified and diverse panel of experts capable of providing valuable insights and assessments for our study on the risk and economic evaluation of large-scale highway infrastructure projects. Their perspectives ensure the reliability and relevance of our findings, contributing to the advancement of knowledge in this critical area of infrastructure development. Specific information on experts is available on Table 2.
Table 2.
Expert information for the Delphi method.
Through scoring by the experts, we created an initial direct relation matrix . With the help of SPSS version 22.0 software, we analyzed the experts and scholars in regard to the reliability of their opinions, resulting in a Cronbach’s α of 0.925, which is greater than 0.80, so the survey results are more reliable. The initial direct relation matrix can be named , , which represents the degree of impact of risk factor on in cross-border bridge projects. When , , as shown in Table 3.
Table 3.
Initial direct relation matrix.
4.2.2. Normalized Processing
Normalizing the data in Table 3, according to Equation (1), yields the normalized direct relation matrix (Table 4):
Table 4.
Normalized direct relation matrix.
4.2.3. Building the Total Relation Matrix
In order to reflect the degree of mutual influence among the factors, the normalized direct relation matrix is calculated according to Equation (2) to find out the total relation matrix of the risk factors for highway infrastructure REITs financing (Table 5).
Table 5.
Total relation matrix.
4.2.4. Calculate Centrality Degree and Causality Degree
Based on the total relation matrix of the risk factors in regard to financing highway infrastructure, Equation (3) sums up the elements of each row in the matrix to obtain the influencing degree and, through Equation (4), the sum of the elements in each column in the matrix to obtain the influenced degree . From Equation (5) the centrality degree of an element is the influencing degree plus the influenced degree. From Equation (6), the causality degree of an element is the influencing degree minus the influenced degree, and the risk factor indicators in regard to financing highway infrastructure are shown in Table 6.
Table 6.
Results of DEMATEL analysis of risk factors in regard to financing highway infrastructure REITs.
4.2.5. Mapping Cause and Effect
Based on the calculation results of the influencing degree, influenced degree, causality degree, and centrality degree of highway infrastructure REITs financing risk factors, the causality diagram between the highway infrastructure REITs financing risk factors is drawn, as shown in Figure 2. By mapping out the causality and centrality of the risks, stakeholders can identify which risks have the most significant influence and, thus, which risks should be prioritized for mitigation. In addition, understanding the causality helps in developing strategic plans to address root causes rather than just symptoms. Furthermore, resources can be more effectively allocated to manage the most central and influential risks, thereby optimizing the risk management process.
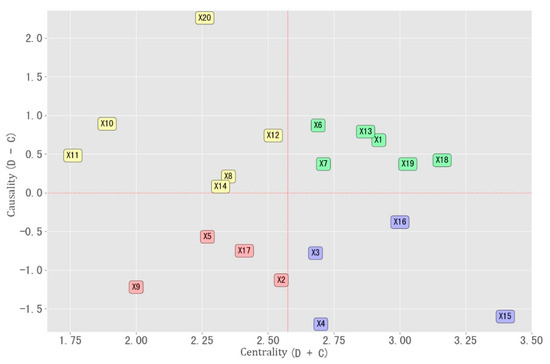
Figure 2.
Map of the results on the causes of risk in financing highway infrastructure REITs.
In Figure 2, the horizontal coordinate represents the centrality degree, which reflects the importance of each risk factor, and a larger value of centrality indicates that the risk factor plays a greater role in the system. The vertical coordinate represents the causality degree, which indicates whether a factor primarily acts as a cause (>0) or an outcome (<0). In the figure, force majeure risk (), approval delay risk (), and environmental law risk (), are the top influencing factors, significantly affecting the other risks. Conversely, operational inefficiency (), price risk (), and excessive government intervention (), are highly influenced factors, requiring close monitoring. The top central factors, operational inefficiency (), environmental legal risk (), and declining asset value (), highlight critical areas that substantially impact highway REITs. Factors with negative causality degrees, such as government over intervention (), government trust failure (), and price risk (), are primarily influenced by other factors, indicating areas where reactive risk management is essential. This analysis aids in prioritizing and implementing effective risk management strategies to enhance project viability and investor confidence.
4.3. ISM Modeling
4.3.1. Constructing a Holistic Impact Matrix
From Equation (7), the holistic impact matrix of highway infrastructure REITs financing risk factors is obtained , as shown in Table 7.
Table 7.
Holistic impact matrix.
4.3.2. Calculation Threshold
To simplify the structure of the system, a threshold is introduced ϵ [0, 1] to remove the matrix information of indicators with less influence in the matrix, and if the value of ϵ [0, 1] is too large, the structure of the system is simpler and it is more difficult to measure the relationship between the factors. If the value of is too small, the structure of the system is more complex and the relationship between the factors becomes complicated. To obtain the optimal system structure, we use the mean () of the statistical distribution of all the factors in the total relation matrix and the standard deviation () of the statistical distribution of all the factors in the total relation matrix to calculate the threshold value (), and the formula for calculating the threshold value is as follows:
Based on the combined impact matrix to find the threshold value , the result is 0.063, which means that all interactions with influence values below 0.063 are considered insignificant and are removed from the matrix. This helps in highlighting the more significant risk factors and their interactions, providing a clearer picture of the critical areas that need attention in the risk management process.
4.3.3. Constructing a Reachability Matrix
According to the threshold value, from Equation (8), the reachability matrix is calculated , as shown in Table 8. In the reachability matrix, is denoted as the influence relationship between two factors, if , then it is denoted as factor , which has an influence on ; if then it means that factor has no effect on .
Table 8.
Reachability matrix.
4.3.4. Delineation of the Factor Hierarchy
When a factor satisfies , it indicates that is at the highest level of the factors. Delete the rows and columns corresponding to factor in the reachability matrix , recalculate the reachability set, antecedent set, and intersection, and continue this process to find the next level, until all the factors are categorized, forming the final hierarchical factor division. The stratification of the influence factors is shown in Table 9.
Table 9.
Hierarchy of factors.
By analyzing the data, we can see that in the first layer {4, 9, 15}, in the second layer {2, 3, 16, 19}, in the third layer {5, 13, 17, 18}, in the fourth layer {7, 11, 14}, in the fifth layer {6}, in the sixth layer {1, 8}, in the seventh layer {12}, and in the eighth layer {10, 20}.
4.3.5. Modeling Multi-Layer Recursive Order Structures
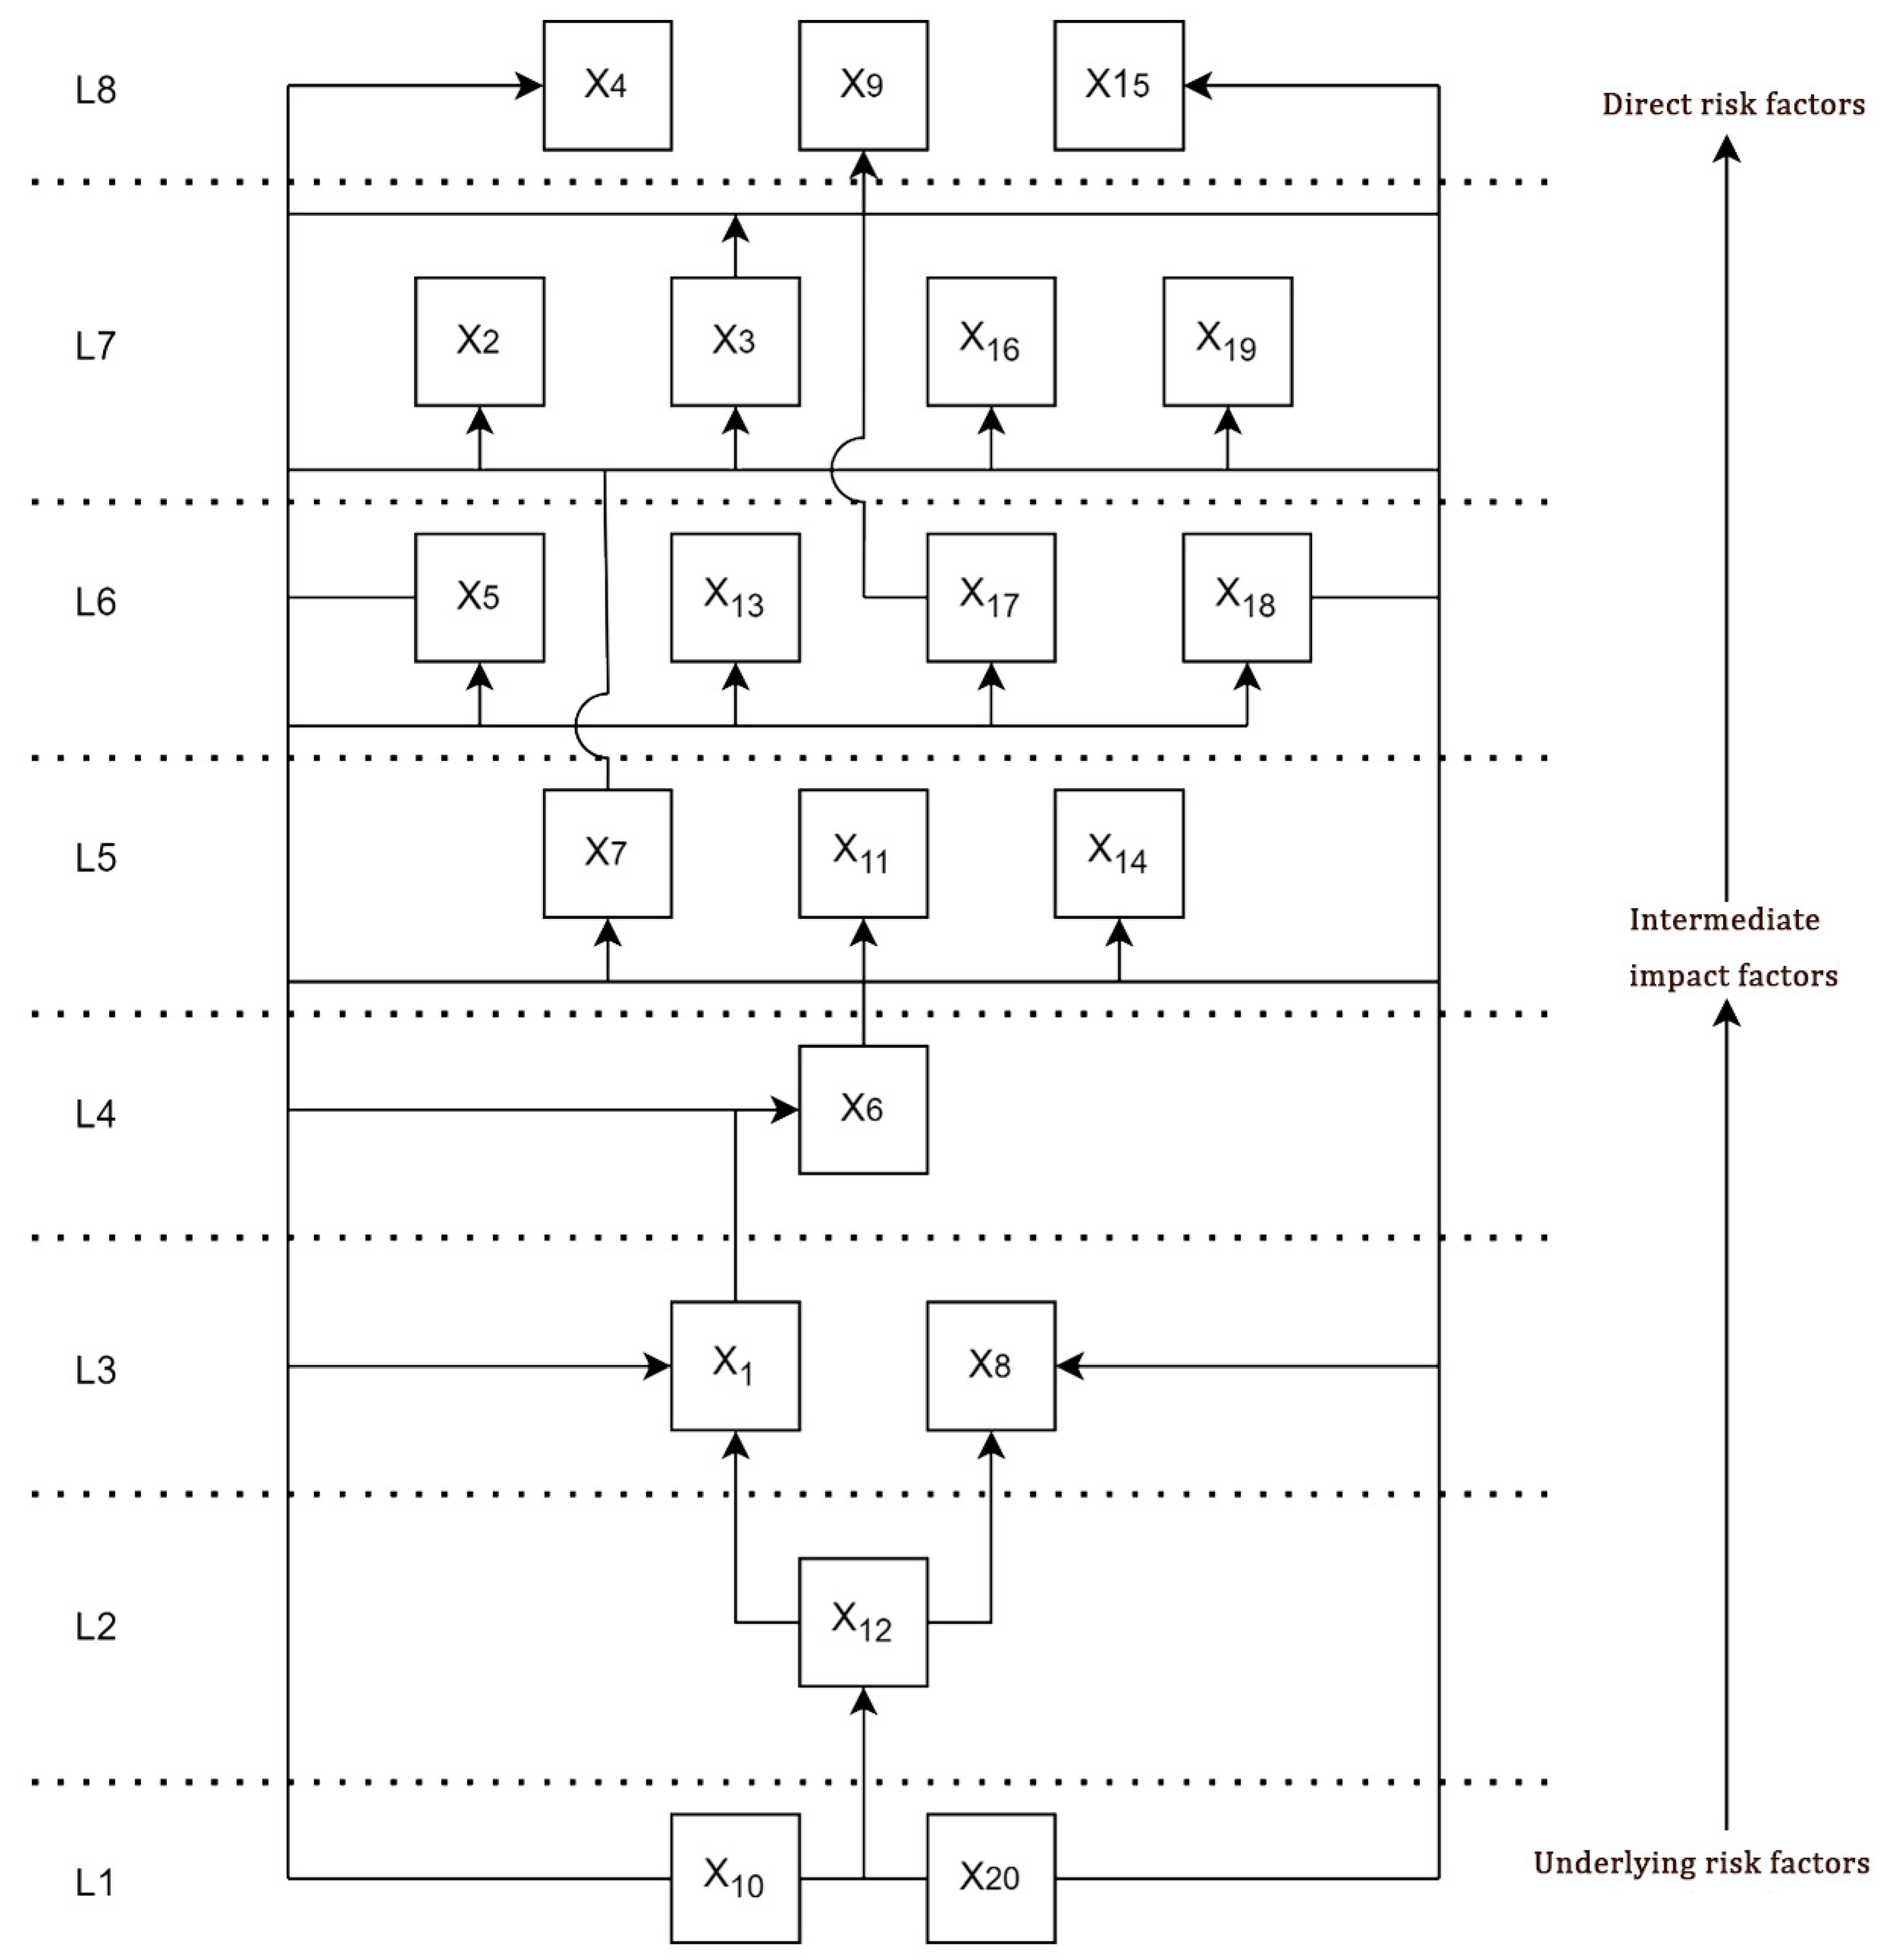
Based on the hierarchical relationships, the risk influences are arranged in hierarchical order to create a hierarchical topology map (Figure 3). It provides a structured approach to risk management by identifying the levels at which different risks operate. This helps in systematically addressing risks from the foundational level upwards. It also visually separates risks into different levels, making it easier for decision-makers to understand the complex interrelationships and dependencies among the risks. By showing which risks need to be addressed first, it aids in making informed decisions that can have a cascading positive effect on other risk factors.
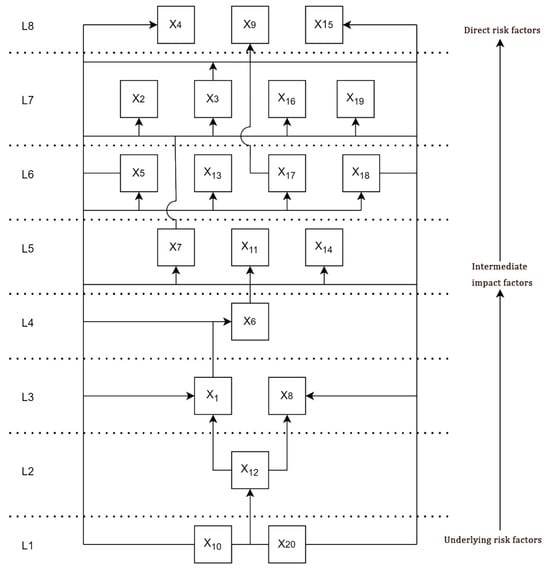
Figure 3.
Hierarchical topology of risk factors for highway infrastructure REITs financing.
In the topology diagram, the factors known as direct risk factors are the uppermost ones and include price risk (), insufficient operating income (), and operational inefficiency (), and the other factors work by acting on this layer. The factors at the bottom of the hierarchy are referred to as fundamental risk factors and include financing costs () and force majeure risk (), which are decisive for the outcome. The other layers are referred to as intermediate influences and play a transitional role.
The hierarchy shows that addressing risks at the lower levels can mitigate higher-level risks. For example, resolving issues related to regulatory approvals (a lower-level risk) can alleviate financial and operational risks (higher-level risks).
4.4. Sensitivity Analysis
Sensitivity analysis is a critical process in risk assessment to understand how variations in the input parameters impact the output of the model. This analysis helps to identify the most sensitive risk factors and assess the robustness of the DEMATEL—ISM model applied in this study.
We applied ±10% variations to the initial direct relation matrix and observed the effects of these changes on the influencing degree (), influenced degree (), centrality (), and causality (). The results of these changes are summarized in the table, where we analyzed the variations in the weight and ranking of the risk factors. The results of the sensitivity analysis are presented in Table 10.
Table 10.
Sensitivity analysis results.
The sensitivity analysis shows that variations in the initial direct relation matrix by ±10% lead to changes in the influencing degree, influenced degree, centrality, and causality of the risk factors. Despite these variations, the overall ranking of most risk factors remains relatively stable, indicating the robustness of the DEMATEL—ISM model. It is evident that policy risk () is the most sensitive factor. This sensitivity suggests that any fluctuations in policy-related inputs can significantly impact the risk assessment outcomes, necessitating careful monitoring and management. This information is crucial for prioritizing risk mitigation efforts, ensuring focused and effective risk management. Key factors such as (operational inefficiency) and (financial risk) consistently rank high under both positive and negative variations, highlighting their critical importance. On the other hand, factors like (policy risk) and (market risk) show moderate changes in ranking, suggesting they are somewhat sensitive to input variations. In conclusion, the sensitivity analysis confirms the reliability of the risk assessment model, while identifying the most sensitive risk factors.
5. Discussion
5.1. Analysis of Centrality and Causality Results
The degree of influence of various risk factors on the financing of highway REITs can be analyzed by the influencing degree and influenced degree, while the degree of causality and the degree of centrality are used to analyze the relationship between the observed influencing factors. The centrality degree is used to measure the importance of each influencing factor in the system. A higher value of centrality means that the factor has a greater influence on the system. Therefore, the value of the centrality degree is used to determine the importance of each factor in financing highway infrastructure REITs. When the causality degree of an influencing factor is greater than 0, it means the greater the influence of the factor on the other factors, i.e., it serves as a cause indicator in the system. When the causality degree is less than 0, it means that the magnitude of the factor has less influence on the other factors, and it is a result indicator in the system.
According to Figure 2, the top three factors in terms of influencing degree are force majeure risk (), approval delay risk (), and environmental law risk (), indicating that these three factors have a greater influence on the other factors. The top three factors in terms of influenced degree are operational inefficiency (), price risk (), and excessive government intervention (), indicating that these three factors are susceptible to the influence of the other factors. The top three factors in terms of centrality are operational inefficiency (), environmental legal risk (), and declining asset value (), indicating that these three risk factors have a significant impact on highway infrastructure REITs. The factors with a negative causality degree are government over intervention (), government trust failure , price risk (), interest rate risk (), insufficient operating income (), operational inefficiency (), decline in traffic flow (), and land-related legal risk (), which are the key factors affecting highway infrastructure REITs, and the cause degree is negative, indicating that these factors are outcome factors and are susceptible to the other factors.
The diagram also indicates that operational inefficiency (), environmental legal risk (), and declining asset value () are central factors. Efforts to improve operational efficiency and ensure compliance with environmental laws can significantly reduce the overall project risk. Factors with high causality degrees, like force majeure () and approval delays (), need proactive strategies, such as securing comprehensive insurance and streamlining approval processes, to minimize their impact.
5.2. Analysis of Multilayer Recursive Structural Models
5.2.1. Direct Risk Factors Affecting the Financing of Highway Infrastructure REITs
The direct risk factors affecting the financing of highway infrastructure REITs are at the top of the recursive structural model, namely price risk (), insufficient operating income (), and low operating efficiency (), according to which the decline in the market price of REITs directly leads to the difficulty of highway infrastructure REITs to raise sufficient funds to support the financing needs of the project, which affects the promotion and development of the project. And the lack of operating income will lead to lower investor interest in highway infrastructure REITs, thus reducing their investment participation in the project. Investors usually evaluate the attractiveness of a project based on its returns and risks. If operating revenues are insufficient, investors may turn to other investment opportunities with better return expectations and risk-to-reward ratios, which in turn may affect the amount and viability of financing for highway infrastructure REITs. Operational inefficiencies can lead to lower operating revenues or higher costs for highway infrastructure projects, which reduces the project’s cash flow. If the cash flow is not sufficient to support the financing needs of the project, it creates uncertainty and risk for investors and financial institutions, causing them to remain cautious about the amount of financing for the project.
5.2.2. Intermediate Risk Factors Affecting the Financing of Highway Infrastructure REITs
Level 2–7 factors are between the deep influence layer and the direct influence layer, which are intermediate influence factors. By analyzing these factors, the financing risk of highway REITs can be studied more comprehensively. The tax rate risk () is in the transition layer. In China, real estate investment trust (REITs) projects involve taxes in regard to all aspects of the project from establishment, operation, dividends, and exit. Since infrastructure REITs are required to pay value-added tax (VAT) and stamp duty based on the appreciation of the appraised value when transferring assets to the project company, they will face a higher tax burden in the transfer of ownership, which indirectly affects the financing of highway REITs. In addition, there may be changes in government tax rates for REITs, including modifications to tax incentives for REITs’ investment income. Changes in tax policies may affect investors’ expectations of investment returns from highway infrastructure REITs and increase the risk of investment. Increases in interest rates () could increase the cost of financing highway infrastructure REITs, reduce investment returns, increase liability risk, and could negatively impact the overall credit market. And government credit failure () is also an intermediate influence. Government credit is related to the ability of the parties related to that contract to fulfill their duties and obligations. To prevent such risks, it is necessary to continuously improve the standardization of norms and standards and gradually improve the corresponding supporting mechanisms, so as to promote the development of the investment and financing environment of highway REITs. Inflation () brought about by rising financing costs (), unstable cash flow, the depreciation of value, and the credit crunch all increase the risk of financing highway infrastructure REITs. Market demand risk () can limit the financing channels for highway infrastructure REITs, increase financing costs, reduce investment returns, and negatively impact the viability of the financed projects. Project quality risk () can exacerbate government credit risk (), leading investors to demand a higher risk premium. Inadequate financing () will result in project construction constraints, liquidity difficulties, increased debt stress, and exposure to policy and regulatory risks. The risk of approval delays () is reflected in increased financing costs, increased pressure on debt repayment, restricted business plans, and reduced market confidence. Increased operating costs () will lead to a decrease in operating income, which will affect the REIT’s cash flow. When operating costs increase, REITs may need to resort to external financing to fill the cash flow gap, which will increase financing costs. Increased financing costs will negatively impact the REIT’s profitability and return on investment, increasing the risk to investors. A decrease in traffic flow () will result in lower revenues, lower rental income, lower investor confidence, increased debt risk, and increased operational stress. Land-related legal risks () exist that can create legal uncertainty for projects funded by highway infrastructure REITs. For example, there may be disputes or controversies over the ownership, use or development rights of land, which may result in projects being stalled or not proceeding smoothly. This uncertainty can cause concern among investors and reduce their willingness to invest in and finance REITs. Compliance with environmental legal () requirements means that companies need to invest more resources in environmental risk management and environmental protection measures. For example, companies may need to conduct environmental impact assessments, implement environmental management programs, and purchase environmental insurance. These environmental risk management costs can increase the overall cost of the project, thus affecting the feasibility and economic efficiency of financing. As a result, environmental laws pose an additional economic risk to the financing of highway infrastructure REITs. A decline in asset values () may lead to a deterioration of the REITs’ financial condition, further increasing the risks and costs of financing. When asset values decline, REITs may need additional financing to fill cash flow gaps, but the cost of borrowing for REITs may rise due to lower asset values. This will increase the liability burden of REITs and make financing more difficult and costly.
5.2.3. Underlying Risk Factors Affecting the Financing of Highway Infrastructure REITs
Financing cost () is the deepest factor, not easily influenced by other factors, and plays a fundamental role and, ultimately, has a fundamental impact on the financing risk of highway infrastructure REITs through the first seven levels. High financing costs will limit the financing sources of highway infrastructure REITs. High financing costs mean that investors demand higher interest rates or returns, which will make it difficult for REITs to obtain sufficient financing capital. Restricted sources of financing will affect the operation and development of REITs, limiting their ability to expand and invest in projects and increasing the risk of financing. High financing costs mean higher interest payments and financing fees, which will increase the financial burden on REITs. High financing costs will take away from the REITs’ cash flow, affecting their profitability and ability to distribute cash. This will increase the financing pressure on REITs, which could lead to debt defaults and financial distress, raising the risk of financing. The cost of financing is one of the financial costs of REITs, and when the cost of financing is too high, the return on investment may not meet investors’ expectations. A low ROI will reduce investor interest in REITs, lower investors’ willingness to invest, and further limit the ability of REITs to raise capital. This will affect the operation and development of REITs and increase the risk of financing. Financing costs are also one of the important factors in determining the value of assets, and when financing costs are too high, investors’ valuations of REITs may be negatively affected. This will mean that REITs face difficulties in the fundraising and asset transfer process, increasing the risk of financing. Force majeure () may affect the value of assets, increase operational uncertainty, increase maintenance costs, and bring potential legal liabilities, so it is also the deepest cause.
5.3. Risk Governance
Effective risk governance necessitates both project-level and corporate-level strategies. At the project level, managing environmental and regulatory risks involves ensuring full compliance with environmental regulations through robust management systems, conducting environmental impact assessments (EIAs), and continuously monitoring ecological impacts to implement the necessary mitigation measures promptly. For legal risks associated with land , it is crucial to establish transparent land acquisition procedures, proactively manage stakeholders, and conduct thorough legal audits and due diligence to avoid disputes and legal interventions. Addressing operational risks, such as engineering quality , requires implementing stringent quality assurance programs, using advanced construction technologies, and ensuring regular inspections and audits to enhance infrastructure durability and reliability. Insufficient financing can be mitigated by developing meticulous financial plans, diversifying funding sources, partnering with reliable financial institutions, and maintaining continuous financial monitoring. To counter delayed approvals (), organizations should maintain ongoing communication and collaboration with regulatory bodies and streamline documentation and internal processes to expedite approvals and identify potential bottlenecks.
At the corporate level, addressing policy and governmental risks involves constant monitoring of policy changes, engaging in active lobbying and policy advocacy, and developing flexible strategies to adapt to new policy environments. Ensuring strong relationships with government agencies, while maintaining operational independence is critical to guard against excessive government intervention. Establishing rigorous corporate governance frameworks and compliance protocols and engaging third-party auditors can prevent government breaches of trust . For market risks, such as interest rate and tax rate fluctuations , utilizing interest rate hedging strategies, opting for tax-efficient investment structures, and staying informed about changing tax policies are essential. Conducting market research to forecast demand trends and diversifying asset portfolios can manage market demand risks . Regularly appraising asset values and implementing strategic asset management practices help maintain asset values, while comprehensive disaster recovery and business continuity plans, along with appropriate insurance coverage, can mitigate force majeure risks .
In conclusion, effective risk governance for highway infrastructure REITs requires a tiered approach that differentiates between project-level and corporate-level risks. Emphasizing compliance, quality assurance, and financial robustness at the project level, along with strategic flexibility, regulatory engagement, and strong governance structures at the corporate level, enhances resilience against diverse risk factors, ensuring sustainable operation and long-term success.
5.4. Transferability and Application of the DEMATEL—ISM Approach in Risk Assessment
We can explore the potential for transferring the DEMATEL—ISM approach used in the risk assessment of highway infrastructure REITs projects to other transport modes, economic sectors, and geographical locations. In rail transport, risks related to track maintenance, signal failures, and rolling stock management could be analyzed using the same methodology. In the energy sector, risks associated with supply chain disruptions, regulatory changes, and technological failures can be systematically assessed. By applying this method, stakeholders can better understand and mitigate risks in sectors such as manufacturing, healthcare, and finance. Applying the DEMATEL—ISM approach to different geographical locations involves considering local contextual factors. Risk factors may vary due to regional differences in climate, regulatory environments, and infrastructure quality. For instance, while assessing road infrastructure risks in tropical regions, factors like heavy rainfall and landslides might be more significant compared to arid regions. By adapting the approach to account for these variations, the methodology remains robust across diverse contexts. The interconnections among risk factors identified in one context may differ in another. For example, economic, ecological, and social factors can vary significantly between urban and rural settings. Understanding these linkages in different contexts ensures a comprehensive risk assessment.
6. Conclusions
In conclusion, this study employed a comprehensive methodology integrating the Delphi method, DEMATEL—ISM analysis, and computational tools to examine the risk factors associated with highway infrastructure real estate investment trust (REITs) financing. Through rigorous analysis, a detailed system of risk factors comprising eight levels and twenty factors was delineated, providing valuable insights into the dynamics of highway infrastructure REITs financing.
The findings underscore the critical importance of various risk factors in influencing the financing outcomes of highway infrastructure REITs projects. Factors such as market price fluctuations, operating income inadequacies, and operational inefficiencies were identified as direct influencers, directly impacting the financing efficacy of these projects. Additionally, fundamental factors like excessive financing costs and force majeure events were highlighted as overarching influencers, exerting profound effects on the feasibility and scale of financing endeavors by impinging on the profitability and sustainability of REITs.
Moreover, the study elucidated the intermediary role played by certain factors, which, through interactions with direct influencers, further compounded the financing risks associated with highway infrastructure REITs projects. This nuanced understanding of the interplay between various risk elements contributes significantly to the development of effective risk management strategies, tailored to the specific challenges faced by infrastructure REITs stakeholders and investors.
By leveraging advanced analytical techniques and empirical validation, this study not only enhances our understanding of the multifaceted nature of risk in infrastructure investments, but also provides practical insights for stakeholders and investors to navigate the complexities inherent in highway infrastructure REITs financing. Moving forward, incorporating these insights into decision-making processes and investment strategies can foster greater resilience and sustainability in infrastructure development initiatives, ultimately facilitating the realization of robust and prosperous highway infrastructure REITs projects.
We also acknowledge the limitations of our study. First, our data may not be comprehensive enough, the conclusions are drawn hastily without adequate support from empirical data. Second, the integration of advanced predictive modeling and data analytics was not within the scope of this study.
Future research on highway infrastructure REITs projects should focus on longitudinal studies to understand how risk factors evolve over time and impact financing outcomes. Additionally, exploring the effectiveness of various risk mitigation strategies and investment instruments can offer valuable insights for stakeholders. Integrating advanced predictive modeling and data analytics can facilitate proactive risk management and informed decision-making. Understanding the regulatory frameworks governing infrastructure REITs financing is also crucial for managing risk exposure and investor confidence. Addressing these gaps can lead to the development of robust risk management frameworks and investment strategies, promoting resilience and sustainability in infrastructure projects and advancing infrastructure development initiatives.
Author Contributions
Conceptualization, H.L. and Z.S.; methodology, H.L.; software, H.L.; validation, H.L.; formal analysis, H.L.; investigation, H.L.; resources, Z.S.; data curation, H.L.; writing—original draft preparation, H.L.; writing—review and editing, H.L. and Z.S.; visualization, H.L. and Z.S.; supervision, J.L.; project administration, Z.S.; funding acquisition, Z.S. All authors have read and agreed to the published version of the manuscript.
Funding
This research was supported by the Natural Science Foundation of Heilongjiang Province (Grant No. YQ2020G001) and Scientific Research Foundation for Heilongjiang Postdoctoral(Grant No. LBH-Q21054).
Institutional Review Board Statement
Not applicable.
Informed Consent Statement
Not applicable.
Data Availability Statement
The original contributions presented in the study are included in the article.
Acknowledgments
The authors express their sincere gratitude to the editor and the anonymous referees for their invaluable comments and suggestions, which have significantly enhanced the quality and clarity of this manuscript.
Conflicts of Interest
The authors declare no conflicts of interest.
References
- Mahmud, A.T.; Ogunlana, S.O.; Hong, W. Key driving factors of cost overrun in highway infrastructure projects in Nigeria: A context-based perspective. J. Eng. Des. Technol. 2021, 19, 1530–1555. [Google Scholar] [CrossRef]
- Zou, J.; Ni, W. The impact analysis of real estate investment trusts (REITs) on infrastructure projects management and operation. In Proceedings of the 2022 International Conference on Creative Industry and Knowledge Economy (CIKE 2022), Online, 25–27 March 2022; pp. 183–190. [Google Scholar]
- Fang, Z. Research on Risks and Management Mechanism of REITs in China. In Proceedings of the 5th International Conference on Economic Management and Green Development; Springer: Singapore, 2022; pp. 123–136. [Google Scholar]
- Deep, S.; Bhoola, V.; Verma, S.; Ranasinghe, U. Identifying the risk factors in real estate construction projects: An analytical study to propose a control structure for decision-making. J. Financ. Manag. Prop. Constr. 2022, 27, 220–238. [Google Scholar] [CrossRef]
- He, Y.; Kang, J.; Pei, Y.; Ran, B.; Song, Y. Research on influencing factors of fuel consumption on superhighway based on DEMATEL-ISM model. Energy Policy 2021, 158, 112545. [Google Scholar] [CrossRef]
- Bhatt, N.; Sarkar, D. Evaluation of success and risk factors for highway project performance through integrated analytical hierarchy process and fuzzy interpretive structural modelling. Int. J. Constr. Manag. 2020, 20, 653–665. [Google Scholar] [CrossRef]
- Susanti, R.; Nurdiana, A.; Kurnianto, Y. What causes cost overrun in highway strategic project in Indonesia? IOP Conf. Ser. Earth Environ. Sci. 2021, 700, 012050. [Google Scholar] [CrossRef]
- Vu, H.; Wang, J.; Liu, J.; Min, L.; Mai, S. Determiners of Schedule Delay Risk of the Highway Project in Vietnam: Based On the SEM model. In Proceedings of the 2016 International Forum on Management, Education and Information Technology Application, Guangzhou, China, 30–31 January 2016; pp. 98–103. [Google Scholar]
- Kumar, L.; Jindal, A.; Velaga, N.R. Financial risk assessment and modelling of PPP based Indian highway infrastructure projects. Transp. Policy 2018, 62, 2–11. [Google Scholar] [CrossRef]
- Naranjo, A.; Ling, D.C. Economic risk factors and commercial real estate returns. J. Real Estate Financ. Econ. 1997, 14, 283–307. [Google Scholar] [CrossRef]
- Block, R.L. Investing in REITs: Real Estate Investment Trusts; John Wiley & Sons: Hoboken, NJ, USA, 2011; Volume 141, pp. 78–81. [Google Scholar]
- Ooi, J.; Newell, G.; Sing, T.-F. The growth of REIT markets in Asia. J. Real Estate Lit. 2006, 14, 203–222. [Google Scholar] [CrossRef]
- Pagliari, J.L., Jr.; Scherer, K.A.; Monopoli, R.T. Public versus private real estate equities: A more refined, long-term comparison. Real Estate Econ. 2005, 33, 147–187. [Google Scholar] [CrossRef]
- Ling, D.C.; Naranjo, A. Returns and information transmission dynamics in public and private real estate markets. Real Estate Econ. 2015, 43, 163–208. [Google Scholar] [CrossRef]
- Gyourko, J.; Keim, D.B. What does the stock market tell us about real estate returns? Real Estate Econ. 1992, 20, 457–485. [Google Scholar] [CrossRef]
- Eichholtz, P.; Kok, N.; Yonder, E. Portfolio greenness and the financial performance of REITs. J. Int. Money Financ. 2012, 31, 1911–1929. [Google Scholar] [CrossRef]
- Song, Y.; Hao, S. Research on Financing Risk Factors of Expressway REITs in China with a Hybrid Approach. Systems 2022, 10, 38. [Google Scholar] [CrossRef]
- Alqershy, M.T.; Shi, Q. Barriers to Social Responsibility Implementation in Belt and Road Mega Infrastructure Projects: A Hybrid Fuzzy DEMATEL-ISM-MICMAC Approach. Buildings 2023, 13, 1561. [Google Scholar] [CrossRef]
- Lu, M.; Hao, Q.B. Research on construction engineering with data processing in the endowment real estate financing efficiency evaluation. Appl. Mech. Mater. 2015, 730, 339–342. [Google Scholar] [CrossRef]
- Song, J.-m.; Liu, Q.-l.; Chen, L.-m. Study on the Influencing Factors of Investment Return Rate of Waste Incineration Power Generation PPP Project. J. Eng. Manag./Gongcheng Guanli Xuebao 2022, 36, 84–86. [Google Scholar]
- Wang, Y.; Gong, E.; Zhang, Y.; Yao, Y.; Zhou, X. Risk assessment of infrastructure REITs projects based on cloud model: A case study of China. Eng. Constr. Archit. Manag. 2023, 1, 2891–2893. [Google Scholar] [CrossRef]
- Yuan, Q.; Zhang, X.; Zhu, H.; Zhang, B.; Chen, J. Research on influencing factors of coal mine safety production based on integrated fuzzy DEMATEL-ISM methods. Energy Sources Part A Recovery Util. Environ. Eff. 2023, 45, 2811–2830. [Google Scholar] [CrossRef]
- Liu, X.; Dou, Z.; Yang, W. Research on influencing factors of cross border E-commerce supply chain resilience based on integrated fuzzy DEMATEL-ISM. IEEE Access 2021, 9, 36140–36153. [Google Scholar] [CrossRef]
- Giannotti, C.; Mattarocci, G. Risk diversification in a real estate portfolio: Evidence from the Italian market. J. Eur. Real Estate Res. 2008, 1, 214–234. [Google Scholar] [CrossRef]
- Chaudhry, M.; Christie-David, R.; Webb, J. REITs: Hedging and diversification possibilities. J. Real Estate Portf. Manag. 2010, 16, 217–226. [Google Scholar] [CrossRef]
- Trück, S.; Rong, N. Modeling the Dependence Structure between Australian Equity and Real Estate Markets–A Copula Approach. Available at SSRN 1663152 2010, 47, 10–15. [Google Scholar] [CrossRef]
- Du, Y.-W.; Li, X.-X. Hierarchical DEMATEL method for complex systems. Expert Syst. Appl. 2021, 167, 113871. [Google Scholar] [CrossRef]
- Yazdi, M.; Khan, F.; Abbassi, R.; Rusli, R. Improved DEMATEL methodology for effective safety management decision-making. Saf. Sci. 2020, 127, 104705. [Google Scholar] [CrossRef]
- Garg, C.P. Modeling the e-waste mitigation strategies using Grey-theory and DEMATEL framework. J. Clean. Prod. 2021, 281, 124035. [Google Scholar] [CrossRef]
- Chen, J.-K. Improved DEMATEL-ISM integration approach for complex systems. PLoS ONE 2021, 16, e0254694. [Google Scholar] [CrossRef]
- Zhao, X. Evolution of construction risk management research: Historiography and keyword co-occurrence analysis. Eng. Constr. Archit. Manag. 2024, 31, 1408–1428. [Google Scholar] [CrossRef]
Disclaimer/Publisher’s Note: The statements, opinions and data contained in all publications are solely those of the individual author(s) and contributor(s) and not of MDPI and/or the editor(s). MDPI and/or the editor(s) disclaim responsibility for any injury to people or property resulting from any ideas, methods, instructions or products referred to in the content. |
© 2024 by the authors. Licensee MDPI, Basel, Switzerland. This article is an open access article distributed under the terms and conditions of the Creative Commons Attribution (CC BY) license (https://creativecommons.org/licenses/by/4.0/).