Article

Quantitative Evaluation of China’s Biogenetic Resources Conservation Policies Based on the Policy Modeling Consistency Index Model

1
Shanghai International College of Intellectual Property, Tongji University, Shanghai 200092, China
2
Department of Economic Management, Fujian Forestry Vocational and Technical College, Nanping 353000, China
*
Authors to whom correspondence should be addressed.
These authors contributed equally to this work.
Sustainability 2024, 16(12), 5158; https://doi.org/10.3390/su16125158
Submission received: 21 April 2024 / Revised: 6 June 2024 / Accepted: 11 June 2024 / Published: 17 June 2024

Abstract

:
Biogenetic resources are the foundation of biodiversity and are of great significance to the sustainability of human society. The effective promotion of biogenetic resource conservation depends on the scientific formulation and implementation of relevant policies, so the quantitative evaluation of biogenetic resource conservation policies can provide decision support for the next step of policy formulation. Based on text analysis, social network analysis, and the construction of the PMC index model, this study selected 132 policy samples issued by the Chinese government in the field of biogenetic resources, established an evaluation system for China’s biogenetic resources policies, which contains 10 first-level indicators and 55 s-level indicators, and drew the PMC curve diagram accordingly to quantitatively evaluate China’s biogenetic resources policies. The results show that China’s biogenetic resources policies are generally at a good level, which can meet the current practical needs of biogenetic resources conservation, but there are problems such as the lack of policy forecasts in the relevant policy texts, the lack of flexible planning in the short and medium term, the lack of co-operation among the policy issuers, and the insufficient guidance of innovation. Based on the results, this article puts forward suggestions for improving China’s biogenetic resource conservation policies.

1. Introduction

Biogenetic resources are important components of biodiversity and have significant value in maintaining ecological balance and fostering healthy human development [1]. Statistics show that the number of known biological species in the world has exceeded 8.7 million, and the genetic materials contained within them not only carry historical information on the evolution of species but also serve as a source of innovation in the fields of new drug research and development, agricultural breeding, etc., and have great value and application potential for the development of various fields of society [2]. However, biogenetic resources are facing increasingly serious threats, such as habitat loss, overexploitation, climate change, and invasion of alien species, under the impact of globalization and industrialization [3]. In particular, for countries with large stocks of genetic resources, the sustainable development of the industry can no longer be achieved by the path of development based on a resource-consuming approach, and new development options need to be sought [4]. Therefore, enhancing the protection and management of biological genetic resources is not only related to the maintenance of ecological balance but also the key to achieving sustainability in human society [5]. In this context, countries need to formulate reasonable genetic resource protection policies to meet current and future challenges and ensure that these valuable resources can continue to contribute to the development of human society.
China is one of the countries with the richest biodiversity in the world and possesses a huge pool of biogenetic resources. However, as the economy develops rapidly and the population continues to grow, China’s biogenetic resources are also facing enormous pressure to be conserved. Human activities such as land development, urban expansion, and industrial pollution have caused serious damage to the habitat of biogenetic resources, and the survival of many rare and endangered species is in a fragile condition [6]. In this context, the Chinese government attaches great importance to the protection of biological genetic resources and has formulated a series of regulations and policies aimed at strengthening the protection of biological resources and promoting their rational use and sustainable development. For example, in addition to the Seed Law, Animal Husbandry Law, Fisheries Law, Wildlife Protection Law, and Regulations on the Management of Human Genetic Resources issued by the central government, local governments have also enacted corresponding rules and regulations based on local biological resources, thus confirming the importance of the conservation of biogenetic resources at different policy levels [7]. However, have the formulation and implementation of such policies achieved the expected results? And what policy measures have been more effective? Which aspects are still insufficient? All these questions need to be answered by an objective and scientific quantitative evaluation of policies. To measure the effectiveness of the policy texts on biogenetic resources and the balance of the policy system in China and to improve the existing policies on the conservation of biological resources as well as the formulation of future policies, it is necessary to carry out a multidimensional quantitative evaluation of the existing policies on biogenetic resources.
This paper focuses on the following questions: First, what is the effectiveness of the formulation and implementation of conservation policies for biogenetic resources in China? Second, which aspects of such policies are more effective? Third, which aspects of such policies are still defective? With the methods of text analysis, social network analysis, and PMC index modeling, we selected samples of policies in the field of biogenetic resources in China, constructed the PMC index of each policy through the construction of a multi-input–output table, and drew PMC curve diagrams accordingly to evaluate the policies on biogenetic resources in a scientific and quantitative way. It is found that China’s policies on biogenetic resources are generally in a good grade and can meet the current practical needs of biogenetic resource conservation, but there are problems such as the lack of policy forecasts in the relevant policy texts, the lack of flexible planning in the short and medium term, the lack of co-operation among the policy issuers, and the insufficient guidance of scientific and technological innovation.
Compared with previous studies, the marginal innovations of this study lie in the following aspects: First, current research has not yet systematically explored the effects of conservation policies on biogenetic resources issued by the Chinese government, whereas this study evaluates the conservation policies on biogenetic resources in China by digging into the national, provincial, and district-level policies on conservation of biogenetic resources issued by the Chinese government, combining the textual characteristics of the policies and the high-frequency keywords to set up the indicators at all levels, and evaluating the macro effects of conservation policies on biogenetic resources in China in depth. This study fills the current research gap while also providing theoretical support for improvement in China’s biogenetic resource conservation policies and practical insights for the sustainability of biogenetic resources utilization. Second, different from previous research methods used in the field of policy evaluation, this study aims to quantitatively evaluate the policy texts of the biogenetic resources conservation policies issued by the Chinese government by means of textual analysis, social network analysis, and the construction of the PMC index model, thereby more accurately evaluating the effects of the formulation and implementation of the policies. This not only helps to expand the research content and methodology in this field, but it can also be oriented towards a comprehensive and objective policy evaluation to improve the sustainability of biogenetic resources.

2. Literature Review

An overview of the relevant studies in the field of biogenetic resource conservation reveals that most scholars have investigated the policy protection issues related to biogenetic resources mainly from the perspectives of ecology and management. Among them, scholars in the field of conservation of biological resources have conducted relevant studies from different perspectives by adopting different research methodologies, which cover the challenges faced by the conservation of biological resources [8,9,10], resource conservation preferences from the perspectives of different stakeholders [11,12,13,14], the utilization potential of biogenetic resources [15,16,17], the role of the government in the exploitation of the resources, and so on [18,19,20,21]. For example, Putterman used the choice experiment method to analyze the public’s conservation preferences for different biological resources based on the conservation of biological resources in the Wuyi Mountain region [22]. Anwar et al. used Aliwal Shoal as a case study to explore the existing challenges and potential solutions related to the management of Marine Protected Areas (MPAs) through 48 stakeholder interviews [23]. Xu et al. used the entropy weight method and hierarchical analysis method to establish an evaluation system for the sustainable use potential of marine medicinal biological resources. They quantitatively measured the use potential of marine medicinal biological resources in 11 provinces and cities along the coast of China, classified them into levels, and made a comparative evaluation of the development potential of the marine biomedicine industry in each province [24]. Marjanovic et al. used the P-S-R model to elaborate on the principle of pressure, state, and reaction interaction in the process of marine resource development and analyzed the macro and microenvironments for the realization of government inducement on the basis of the government-induced model for the development of marine biological resources [25].
Another branch of research related to resource conservation policies stems from the attention paid in the field of management studies to relevant policy evaluation methods. In the field of policy evaluation, some of the most commonly used policy evaluation methods include cost–benefit analyses, comparative methods, and attribution methods, which cover the ex-ante, ex post, and ex-post phases [26]. With the development of policy evaluation methods, quantitative policy evaluation research methods have become a hotspot of attention in the current policy research field [27]. For example, Ylönen et al. used text mining technology and the PMC index model to establish a cropland protection policy evaluation system and quantitatively evaluate the advantages and disadvantages of eight cropland protection policies in Finland since 2004 [28]. Davies et al. constructed a PMC index model with six scientific and technological achievement transformation policies introduced in 2019 as the research object and quantitatively evaluated China’s scientific and technological achievement transformation policies through text mining methods [29]. Kuhlmann et al. used text mining method to select the relevant policies in Germany for new energy vehicle subsidies, constructed the quantitative evaluation framework of the new energy vehicle subsidy policy with the PMC index model, and used the empirical analysis method to quantitatively evaluate the new energy vehicle subsidy policy [30]. In recent years, scholars in China have usually combined another policy analysis method in addition to the PMC index model to carry out quantitative evaluation of the policy, which, from a comprehensive point of view, mainly includes policy tools, semantic network analysis, knowledge mapping, and text analysis [31]. Taken together, this type of research mainly explores the traditional research methods in the field of policy evaluation [32,33,34], the integration of the PMC index model with other research methods [35,36,37].
From the above analyses, scholars have carried out meaningful discussions on the conservation of biogenetic resources and their necessity from the perspectives of ecology and management, and the results of the studies have provided great reference value for this research. However, in terms of research content and methodology, the existing studies still have the following drawbacks: Firstly, previous studies have analyzed the necessity of biogenetic resource conservation from the ecological and managerial levels and have lacked attention to the effects of biogenetic resource conservation policies. As a fundamental guideline for resource conservation, policies on the conservation of biogenetic resources play an important role in resource conservation in terms of strategic guidance and policy direction, and the effects of the policies issued by the Chinese government on the conservation of biogenetic resources in the process of formulation and implementation cannot be ignored. Therefore, the effectiveness of China’s policies on the conservation of biological genetic resources should also be an important topic that needs to be studied in the field of biological resource conservation. Secondly, although the existing studies have attempted to explore the best policy evaluation methods, the suitability of the relevant methods in the evaluation of biogenetic resource conservation policies is still debatable. For example, the hierarchical analysis method is prone to an imbalance of weights when too many indicators are selected; the entropy weighting method is complicated in calculation and harsh on data; and the case study method is challenged by the subjectivity of qualitative analysis. The limitations of the above research methods will further lead to the restricted application of the research conclusions, which cannot be adapted scientifically to the global planning of the relevant policies. Therefore, it is necessary to seek more precise and universal research methods for quantitative evaluation.

3. Research Design

3.1. Research Methodology

The policy modeling consistency index model (the abbreviation of the method is used uniformly as PMC) used in this paper was proposed by Ruiz Estrada in 2008. It is a research methodology that quantitatively evaluates policies on a given topic through a consistency evaluation index (PMC-Index) based on the content of the policy text, which has been applied in economic, social, cultural, ecological, scientific, and technological innovation fields [38]. Ruiz Estrada believes that the inclusion of non-economic and unknown variables contributes significantly to the construction of robust policies, and thus proposes the Omnia Mobilis hypothesis that everything in the world is interconnected, so no relevant variable can be ignored, and based on this, the PMC index model was constructed [39]. Based on the Omnia Mobilis hypothesis, we should strive to comprehensively include all relevant variables when selecting the relevant variables in the PMC research process. The PMC index model is based on this principle and constructs a complete evaluation system to accurately reflect the strength of the internal consistency of the policy by comprehensively considering all relevant variables [40]. This model effectively avoids the limitations of existing policy evaluation methods that focus excessively on specific variables while ignoring others, and thus can more accurately assess the overall effect of the policy. In addition, the PMC surface graph also reveals the strengths and weaknesses of each dimension of the policy in a visual way, making the results of policy evaluation easier to understand and accept. However, the PMC index model also has its limitations, such as the complexity of arithmetic and the high demand for data. For example, the specific calculations of the model may involve complex mathematical formulas and statistical techniques that require professional knowledge and skills to be applied accurately, which undoubtedly increases the difficulty and cost of implementing the model. At the same time, to comprehensively assess the policy effects, the PMC index model needs to cover many relevant variables, which requires a great deal of time and effort to be invested in data collection and processing. In this regard, the paper follows the requirements of the PMC index model to ensure the accuracy of the formulae and calculations based on the exhaustive collection of relevant data to encompass all the relevant variables. To improve the credibility of the results in this paper, we use the triangulation method to validate the results after completing the relevant measurements of the PMC index model. The triangulation method is a commonly used method in social science research that is characterized by using different research strategies to validate and complement each other’s results when studying the same empirical unit to improve the credibility and depth of the research. In the process of validation analysis, we will consider the views and feedback of different researchers. By collecting and analyzing information from these different perspectives, we can more comprehensively assess the practicality and applicability of the research findings and provide more dimensional support for policy recommendations. In addition, it should be noted that scholars usually combine other policy analysis methods in addition to the PMC index model when conducting quantitative policy evaluations. To evaluate the quantitative evaluation of biogenetic resources protection policies more objectively and scientifically, this paper comprehensively adopts the three methods of text analysis, social network analysis, and the construction of the PMC index model to carry out the research.

3.2. Sample Sources

For the reliability and typicality of the sample sources, we conducted carpet searches on the Chinese government website, the Ministry of Ecology and Environment, the Ministry of Agriculture and Rural Development, the Ministry of Science and Technology, the PKU Laws and Regulations Database, and the websites of government departments in various regions, obtaining a total of 375 policy texts at various levels. Through the first round of reading and analyzing the sample documents, it was found that the sample was more complex in terms of policy level, policy type, policy effectiveness, etc., and involved a wider range of policies. Under such circumstances, a second round of group discussion was conducted to screen the policy texts to ensure the scientific and typical nature of the selected samples. In the screening process, the sample documents were selected according to the following criteria: (1) In terms of policy level, the relevant policies issued by the central and local governments were screened accurately, and the main organizations involved included the Standing Committee of the National People’s Congress (NPC), the State Council and its agencies, and local governments at the national, provincial (including municipalities directly under the central government and autonomous regions), and municipal levels. (2) In terms of the policy type, the policy issuing body usually issues a number of documents in the process of issuing a policy to lay out the policy, such as the “notice” issued in advance, as well as after the policy is issued to supplement the biological resources “catalogue” and so on. This type of text usually has no substantive content or duplicates the content of the officially released policy. Therefore, after eliminating the policies that do not contain substantive content or are duplicated in the previous sample, such as “notices”, “announcements” and “catalogues”, the sample is formed with laws, regulations, departmental rules, and local regulations as the main components. (3) In terms of policy content, the screened policy samples should be relevant to the conservation of biological genetic resources. The title or content of the policy can cover “biological resources”, “genetic resources”, “biodiversity conservation” and “biosafety”. (4) In terms of policy validity, the selected policies must be marked as currently valid on the official websites of government departments and the PKU Laws and Regulations Database, and do not include policies with relevant content that are no longer legally valid. After analyzing and selecting the samples according to the above four criteria, 132 effective policy samples were finally formed to establish a database of biogenetic resources protection policies in China.

4. Policy Text Analysis

Policy keywords were extracted and analyzed by KHcoder (version 3) text analysis software for the above policy samples. After eliminating words with no substantive meaning such as “issue”, “strengthen”, “rely”, “truthful”, “report”, and “implement”, a total of 52 high-frequency keywords were formed in the policy texts (see Table 1).
In addition to high-frequency words in the traditional field of biogenetic resources such as “protection”, “management”, “utilization”, and “preservation”, new terms such as “technology”, “innovation”, “data”, and “ecology” also appear in the policy texts in this field. This indicates that the conservation of biogenetic resources has begun to gradually evolve into areas such as technological innovation and digital ecological conservation.
This paper was conducted with the help of Gephi software (Gephi version 0.9.2 was used in this study) by selecting the sum-of-squares method for keyword clustering of biogenetic resources policy texts by constructing a keyword hierarchical cluster co-occurrence matrix (see Figure 1). Among them, the horizontal axis of the coordinates represents the average distance between two keywords; the smaller the distance between two keywords, the more similar their connotations are, and the higher the probability of co-occurrence in the same policy text. From the clustering dendrogram, it can be found that the keyword matrix of the policy text divides the policy on biogenetic resources in order from top to bottom into five categories: future data innovation and development of biogenetic resources, prior production management and construction of biogenetic resources, subsequent safety supervision and guarantee, current ecological environment diversification, and the construction of protected areas in the interest of human beings (see orange zones on the figure for details). Combined with the content of the policy text, the overall distribution of this cluster is relatively balanced, reflecting the current theme of biogenetic resource protection.

5. PMC Index Model Construction

5.1. Variable Identification and Indicator Selection

In this paper, the biological genetic resource conservation policies enacted at the national, provincial, and municipal levels are taken as the target of the study, and at the same time, to ensure the scientific and reasonableness of the variable identification and indicator selection, the policy evaluation of Estrada is taken as the basis [41]. With reference to the studies of Yongan and other scholars [42,43,44,45], comprehensively set up the indicator system for policy evaluation in the existing literature, the nine first-level indicators of this study were finally established. And then, based on the characteristics of the biogenetic resources protection policy text and combined with the 52 high-frequency keywords of the policies collated in Table 1 above, the 44 secondary indicators of this study were finally established, thus forming the first-level variables and second-level variables of biogenetic resources protection policy evaluation. The variables set were quantified using binary coding to measure whether the policy samples conformed to the corresponding variables, assigning a value of 1 if they conformed to the conditions and 0 if they did not, for the purpose of balancing the variables (see Table 2).
Among them, policy nature X1 indicates whether the policy to be evaluated has a supervision, guidance, recommendation, forecasting, or planning effect on the conservation of biological genetic resources. Policy timeliness X2 is used to examine the timeliness characteristics of the policy to be evaluated on measures related to biogenetic resources and is classified as long-term, medium-term, and short-term according to the policy implementation period of 10 years, 5 years, and below. For example, the Seed Law was amended in 1984, 1998, 2009, and 2019, with an interval of more than 10 years each time, thus defining its policy timeliness as long-term. Policy level X3 is used to evaluate at what level the policy is to support the conservation of biogenetic resources. Policy subject X4 represents the level of the issuing subject of the policy to be evaluated. Policy area X5 represents whether the policy to be evaluated covers relevant areas in the conservation of biological genetic resources. Policy content X6 is used to screen the relevant contents stipulated in the policy to be evaluated to achieve the objectives of biogenetic resource conservation. Policy Function X7 examines what aspects of the policy to be evaluated have contributed to the conservation of biological genetic resources, including organizational leadership, publicity and popularization, financial support, technical testing, education, and training, as well as supervisory mechanisms. Policy evaluation X8 represents the evaluation of the implementation of the policy to be evaluated on the conservation of biological genetic resources, including whether the program is scientific, the objectives are clear, the basis is reasonable, or there is encouragement of innovation, which depends on the text of the policy and whether the relevant phrases or meanings are included in the general provisions in the first chapter. Policy receptor X9 represents the relevant geographic area within which the effects of the policy are to be evaluated.

5.2. Construction of Multiple Input–Output Tables

In the 1930s, the American economist Leontief created the input–output technique, which uses mathematical methods to study the quantitative relationship between inputs and outputs of various activities of an economic system. By constructing an input–output framework, the multidimensional relationship between the whole and the parts of the policy can be better grasped [46]. The multiple input–output table of the PMC index model is a data analysis framework formed by the multidimensional evaluation of policy variables, which contains first-level variables and second-level variables [47]. The primary variables are independent of each other, and the values of the secondary variables follow the [0, 1] distribution, are not limited in number, and can be set with the same weight. According to the Omnia Mobilis hypothesis, this paper combines the content of the biogenetic resource conservation policy and the results of text mining to complete the determination of policy evaluation indicators and variables and then carry out the construction of the multiple input–output table, which is shown in Table 3.

5.3. Calculation Method of PMC Index Model

According to Estrada’s research, the calculation method of the PMC index model in this paper is divided into the following four steps: (1) Based on the text mining results, the finalized 9 level 1 variables and 44 level 2 variables are brought into the multi-input–output table, i.e., Table 3. (2) The binary system [0, 1] is used to assign values to the secondary variables, and then Equations (1) and (2) are used to calculate the values of the secondary variables, and based on the results, it is judged whether the secondary variables are consistent with the policy modeling. (3) Calculate the values of all first-level variables according to Equation (3). In Equation (3), t is the first-level variable and j is the second-level variable. (4) According to Equation (4), each PMC index and grade of the biogenetic resource conservation policy are actually measured.
X   ~   N   0 , 1
X = X R : 0 ~ 1
X t n j = 1 X t j T X t j   t = 1,2,3...9
P M C = X 1 i = 1 5 X 1 i 5 + X 2 j = 1 3 X 2 j 3 + X 3 k = 1 3 X 3 k 3 + X 4 l = 1 4 X 4 l 4 +   X 5 m = 1 4 X 5 m 4 + X 6 n = 1 10 X 6 n 10 + X 7 o = 1 6 X 7 o 6 + X 8 p = 1 4 X 8 p 4 + X 9 q = 1 4 X 9 q 4

5.4. The Method of PMC Index Model Surface Drawing

The PMC index model surface can show the quantitative evaluation results of the biological genetic resources protection policy more intuitively and three-dimensionally. When drawing the PMC index model, the results of the first-level variables of the PMC index can be converted into a 3 × 3 PMC matrix with the same number of rows and columns. The calculation method for the PMC surface is based on Equation (5).
P M C   S u r f a c e =   X 1 X 4 X 7   X 2   X 5   X 8   X 3   X 6   X 9

6. Empirical Measurements

6.1. Selection of the Sample of Policies for Empirical Evaluation

The sample size of policy evaluation based on the PMC index model is generally stable between 8 and 12 items [48]. In this study, considering the factors of policy level, policy content, and policy recipients, 10 policies were selected from the database of biogenetic resources protection policies for quantitative evaluation of PMC indexes, as shown in Table 4. Among them, four policies at the national level, four policies at the provincial level, and two policies issued at the prefectural and municipal levels were selected. The reasons for choosing these 10 policies as the PMC policy evaluation samples are as follows: (1) The scope of the topic has universality and reasonability. These 10 policy samples basically cover all the subject areas of biogenetic resources, including human genetic resources, agricultural germplasm resources, livestock and poultry genetic resources, aquatic biological resources, marine biological resources, and related traditional knowledge under the umbrella of biosafety and biodiversity conservation. (2) The policy issuing organizations are diverse and representative. Regardless of whether the policy issuing body is from the central or local level, most of the policy evaluation samples are selected from different issuing bodies, such as the Standing Committee of the National People’s Congress (NPC), the State Council, the General Office of the State Council, and the former Ministry of Agriculture at the central level, and the Standing Committee of the National People’s Congress (NPC), the government, and the ecological environment departments at the local level, so that the policies have different levels of effectiveness. (3) The selection of policy functions and receptors is scientific and typical. Considering the richness of resources and the geographical distribution of ecology in China, the selection of local policies scientifically includes a more comprehensive biodiversity protection content and basically covers the eastern coastal areas, central areas, and resource-rich minority areas in the west to ensure the typicality of the sample selection.

6.2. Grade Evaluation

Based on the results of the PMC index evaluation of the biogenetic resources policies, this paper selects the typically good and acceptable policies among all the policy samples to carry out a detailed analysis, more clearly identify the key variables affecting the PMC index of the biogenetic resources policies, and put forward more targeted policy optimization suggestions.

6.3. PMC Index Calculation

According to the content of the selected 10 policy samples, the second-level variables in the multiple input–output table are assigned values, and the PMC index calculation is carried out based on Equations (1)–(4). Based on this, the PMC index policy scoring criteria (see Table 5) were combined to grade the policy samples, and four grades of excellent (8–9), good (6–7.99), acceptable (4–5.99), and failing (0–3.99) were delineated [49]. Eventually, the PMC index evaluation table of China’s biogenetic resource conservation policy was formed, and the results are shown in Table 6. After coming up with the result, all the researchers individually analyzed and judged whether the content of China’s biogenetic resource conservation policies involved the sub-variables according to their respective expertise. Following the first round of judgement, it was found that the assessment results of all the researchers were almost the same, except for individual variables. In this context, the paper conducted further analyses and discussions on the sub-variables that were controversial in the first round of judgement based on the policy content and evaluation criteria. A new round of measurements was re-conducted after a consensus was reached, and it was found that the results remained the same as the previous ones, indicating that this PMC measurement has reliability.

6.4. Presentation of PMC Surface Plot

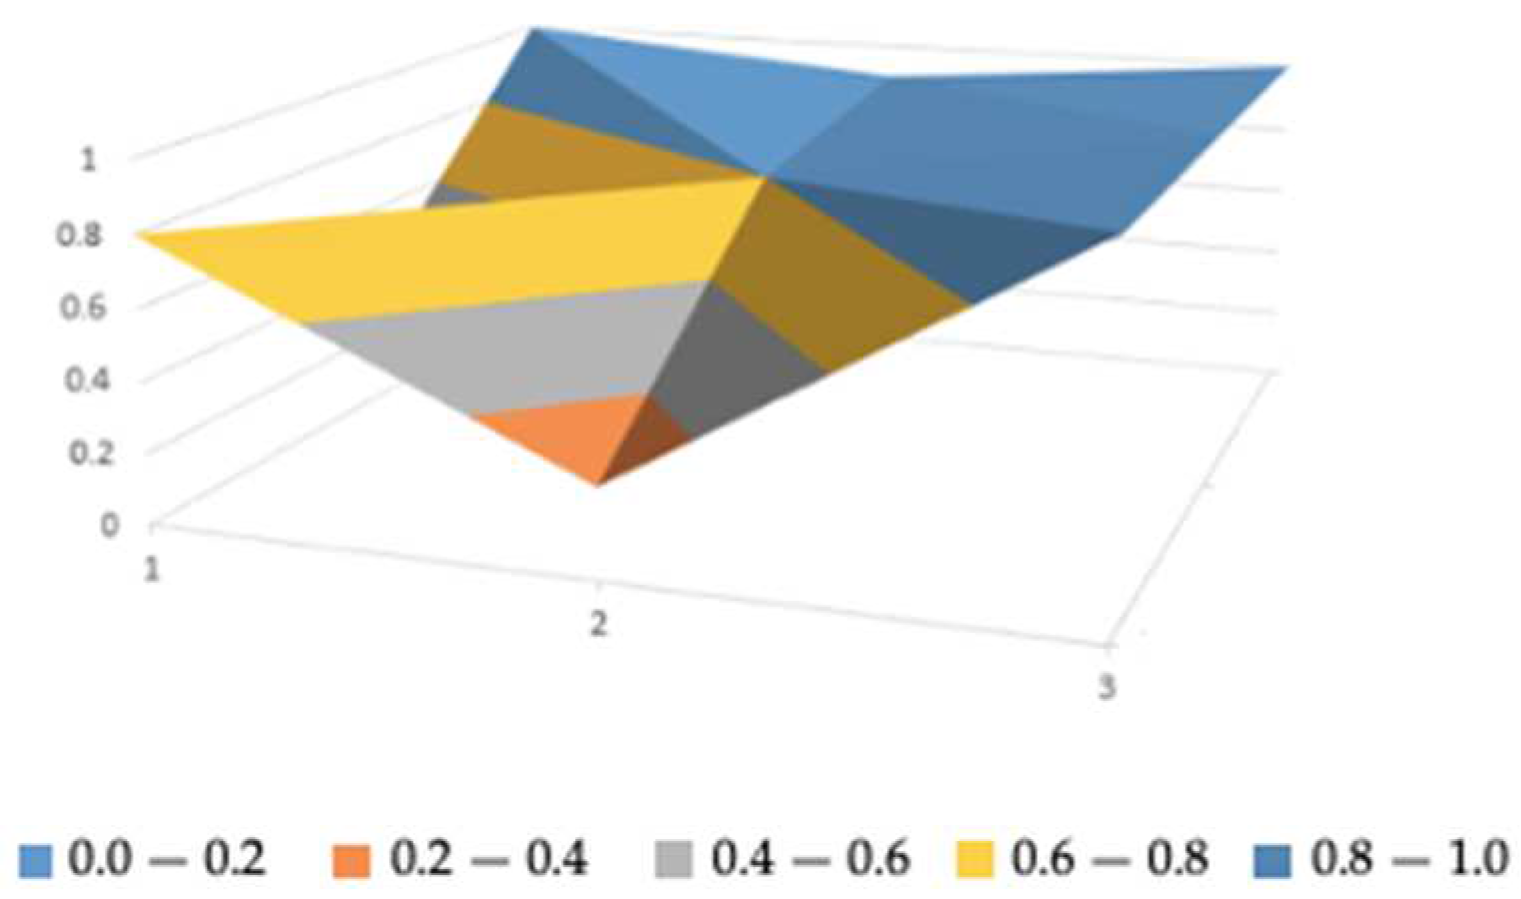
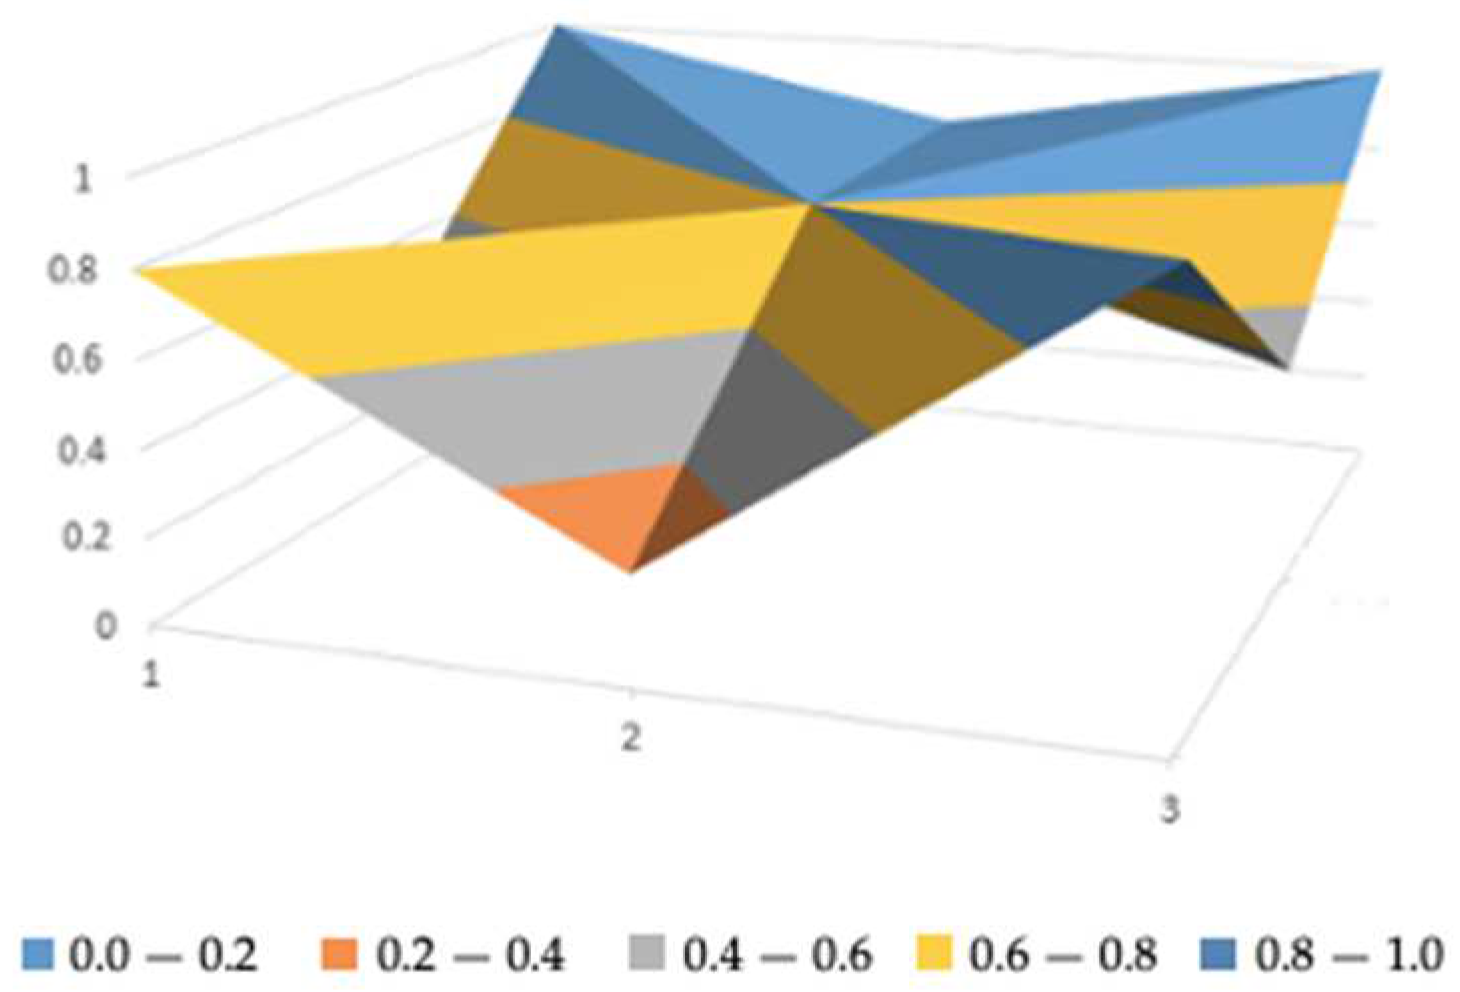
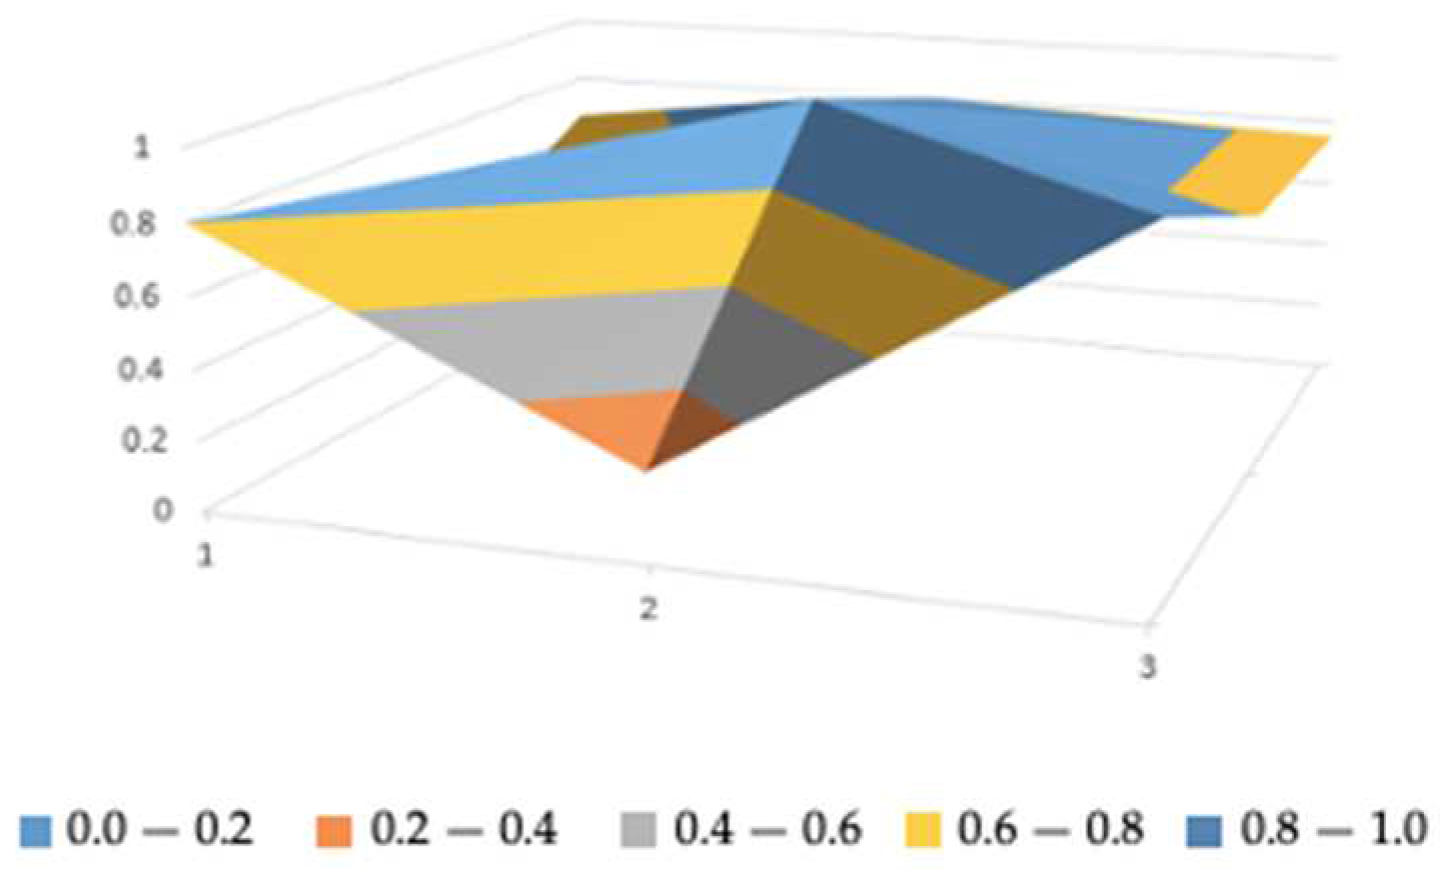
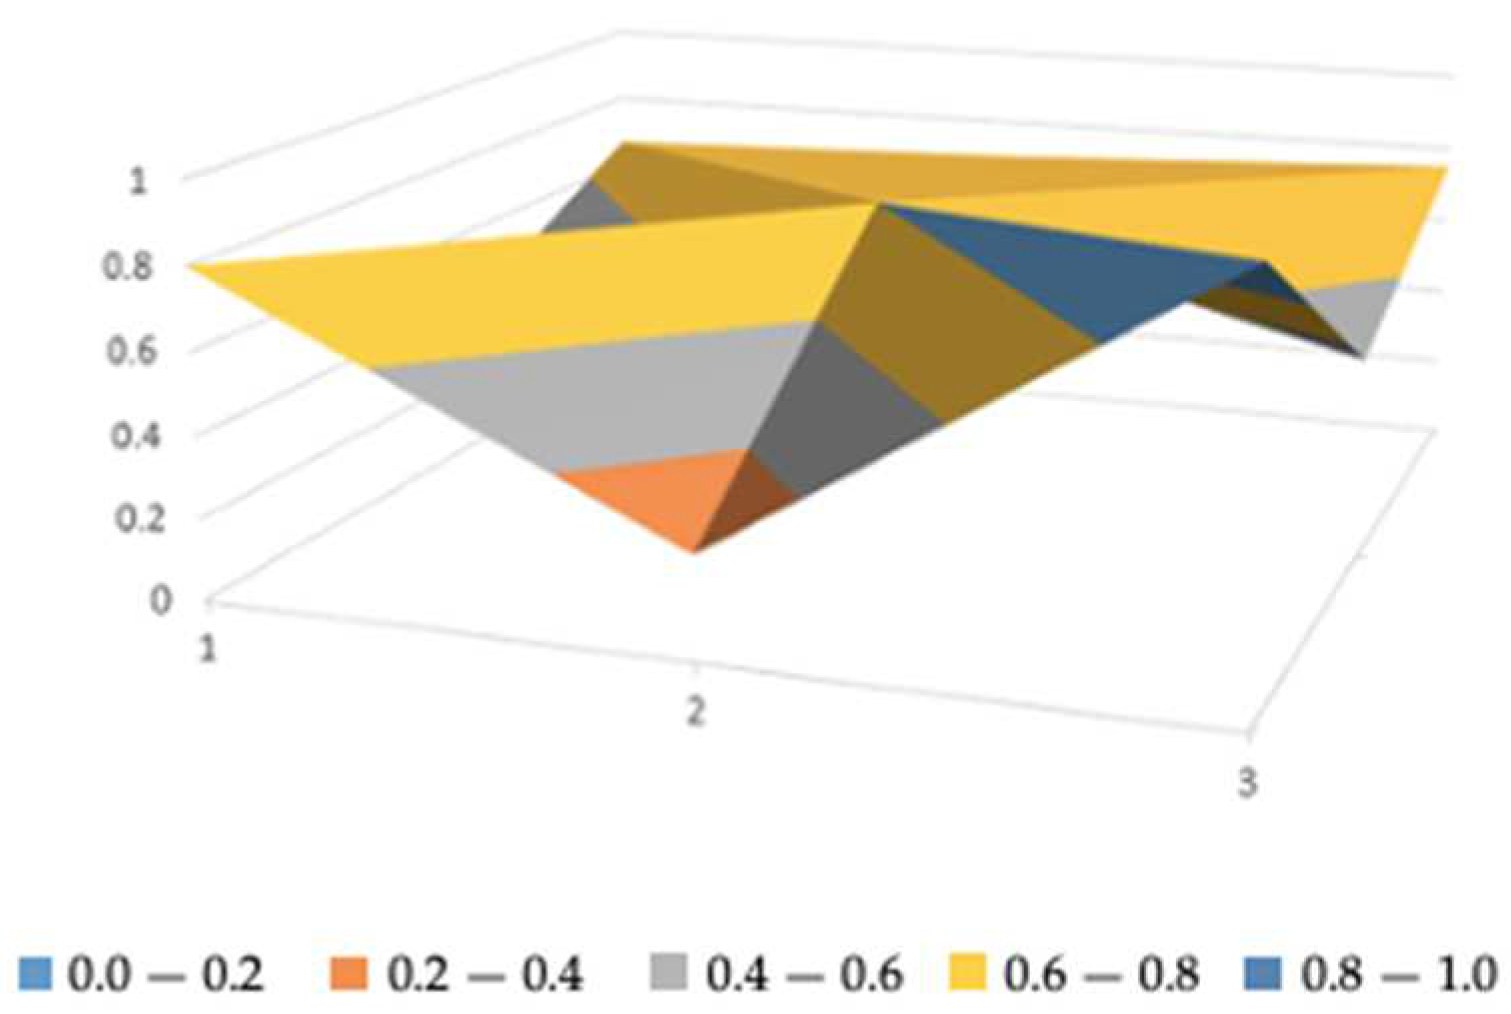
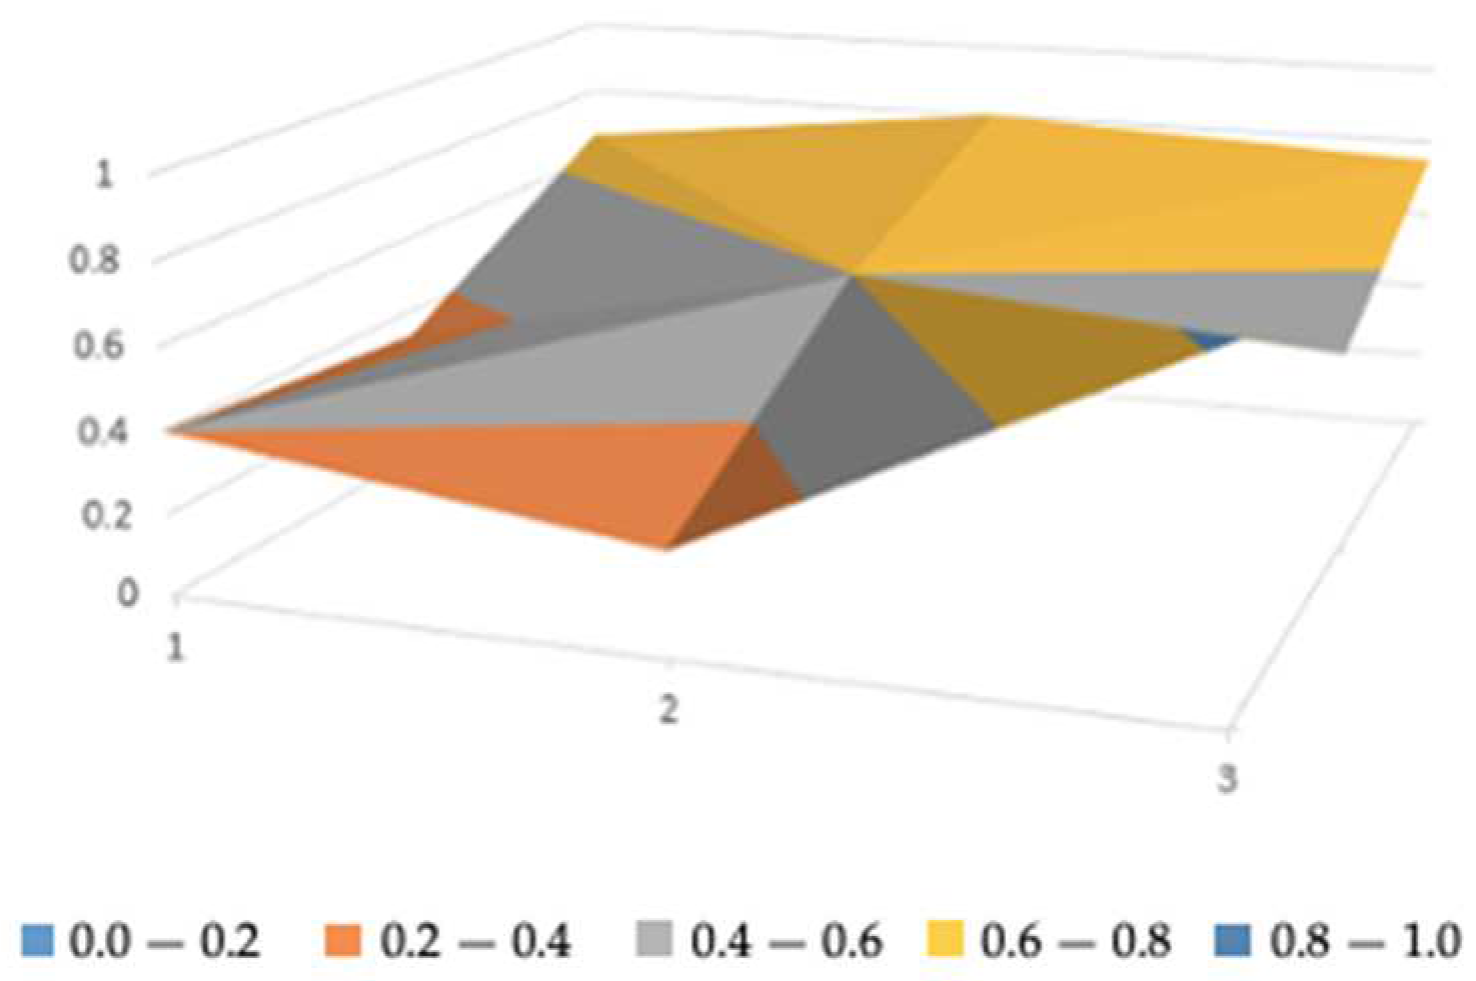
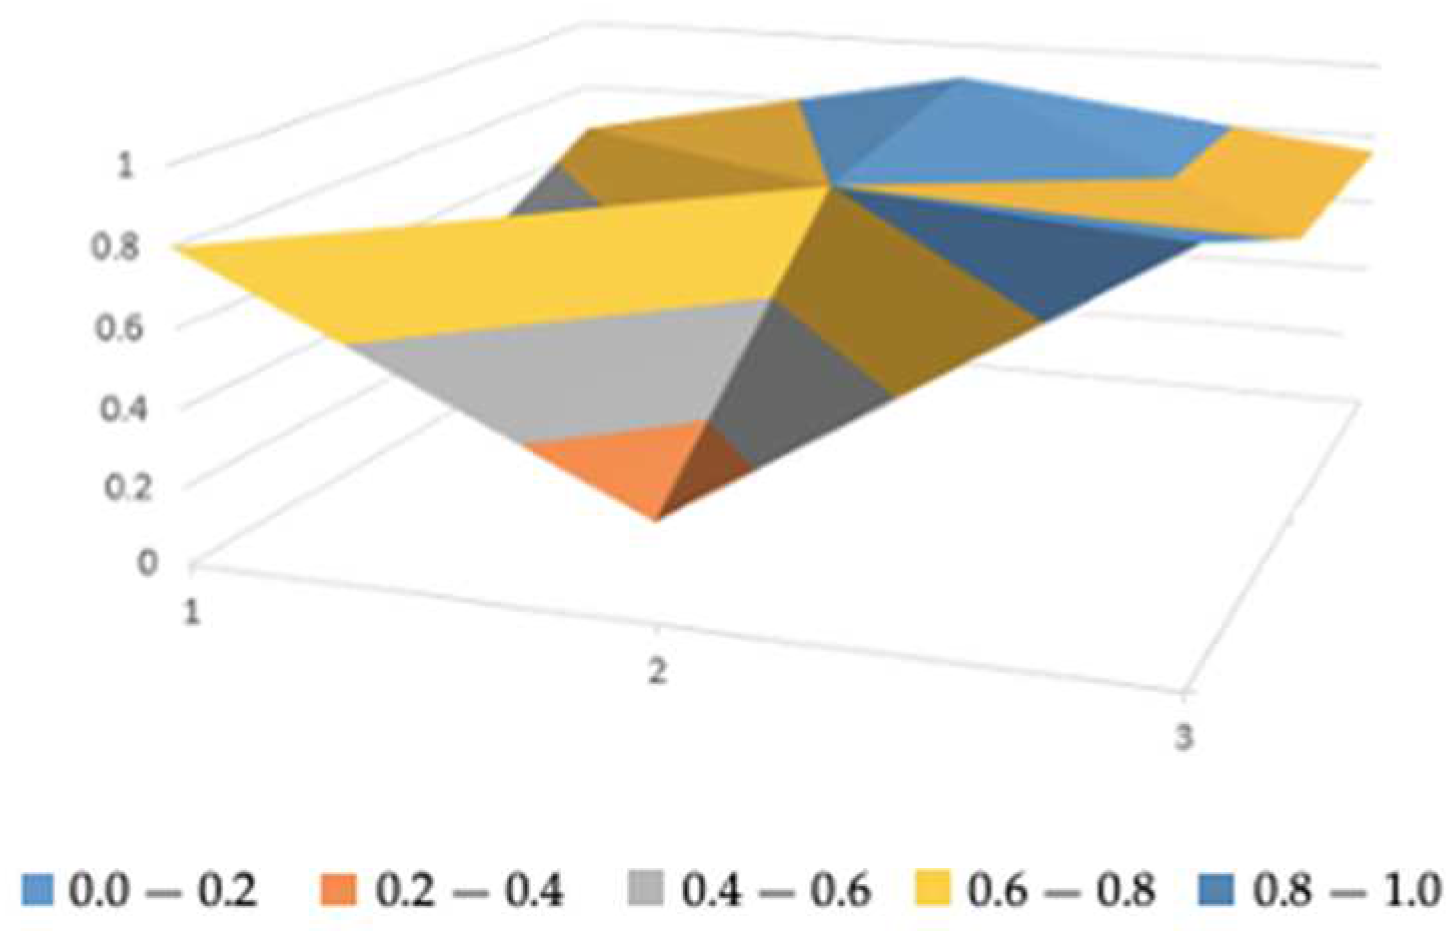
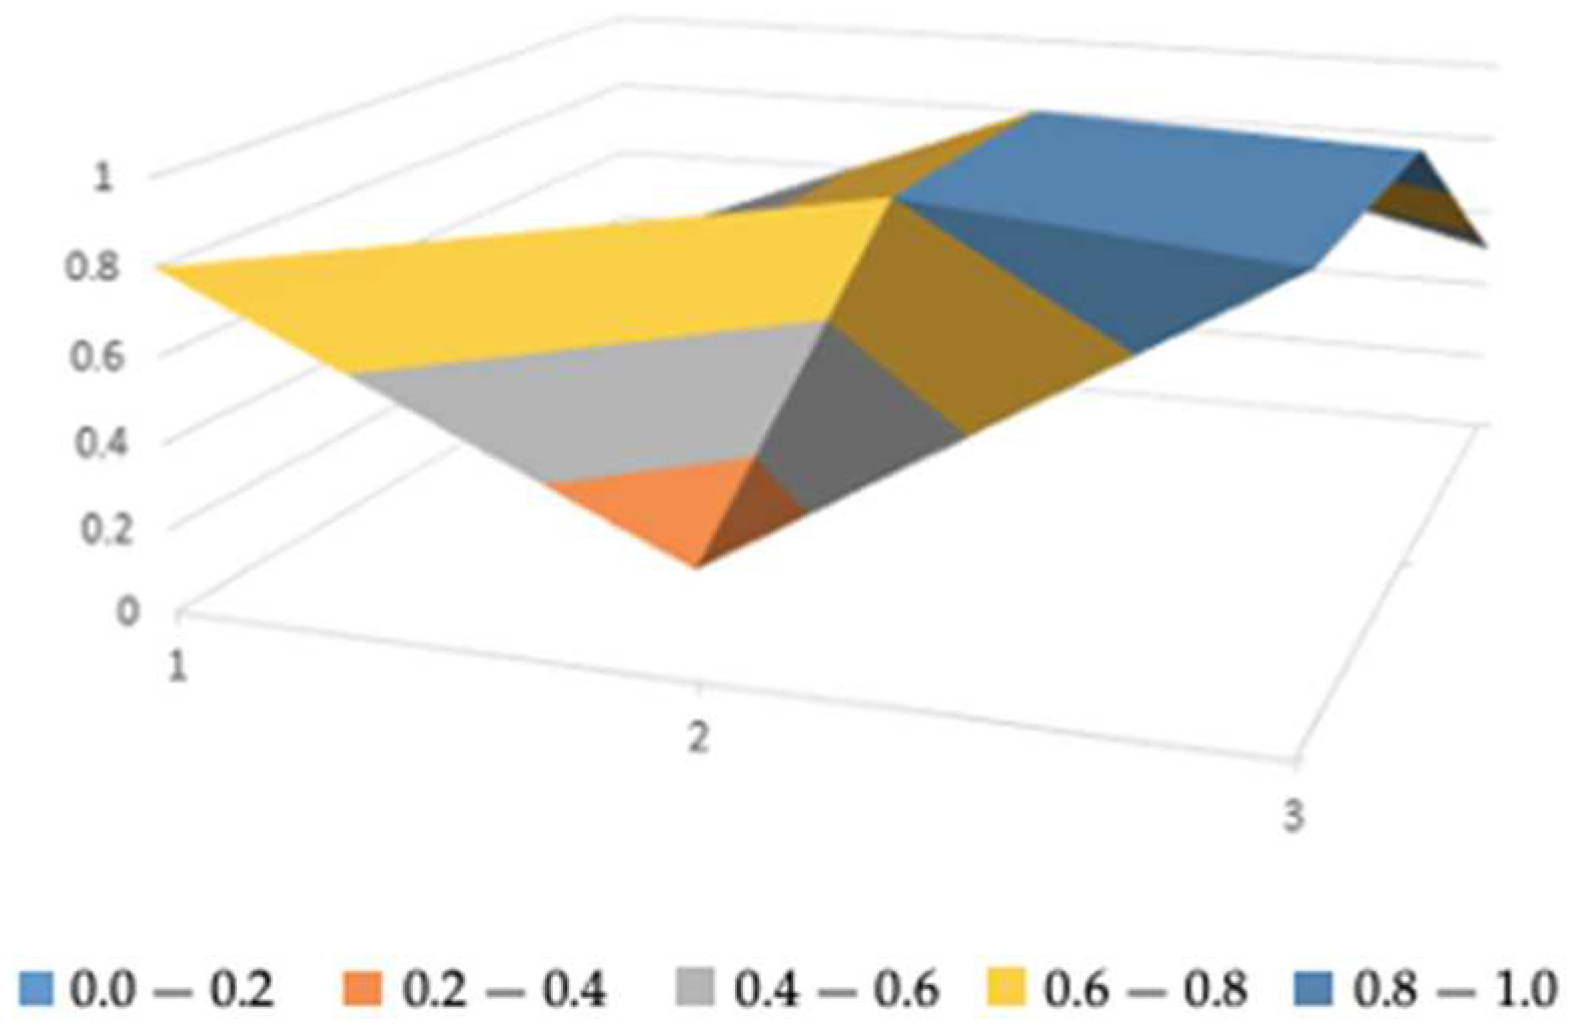
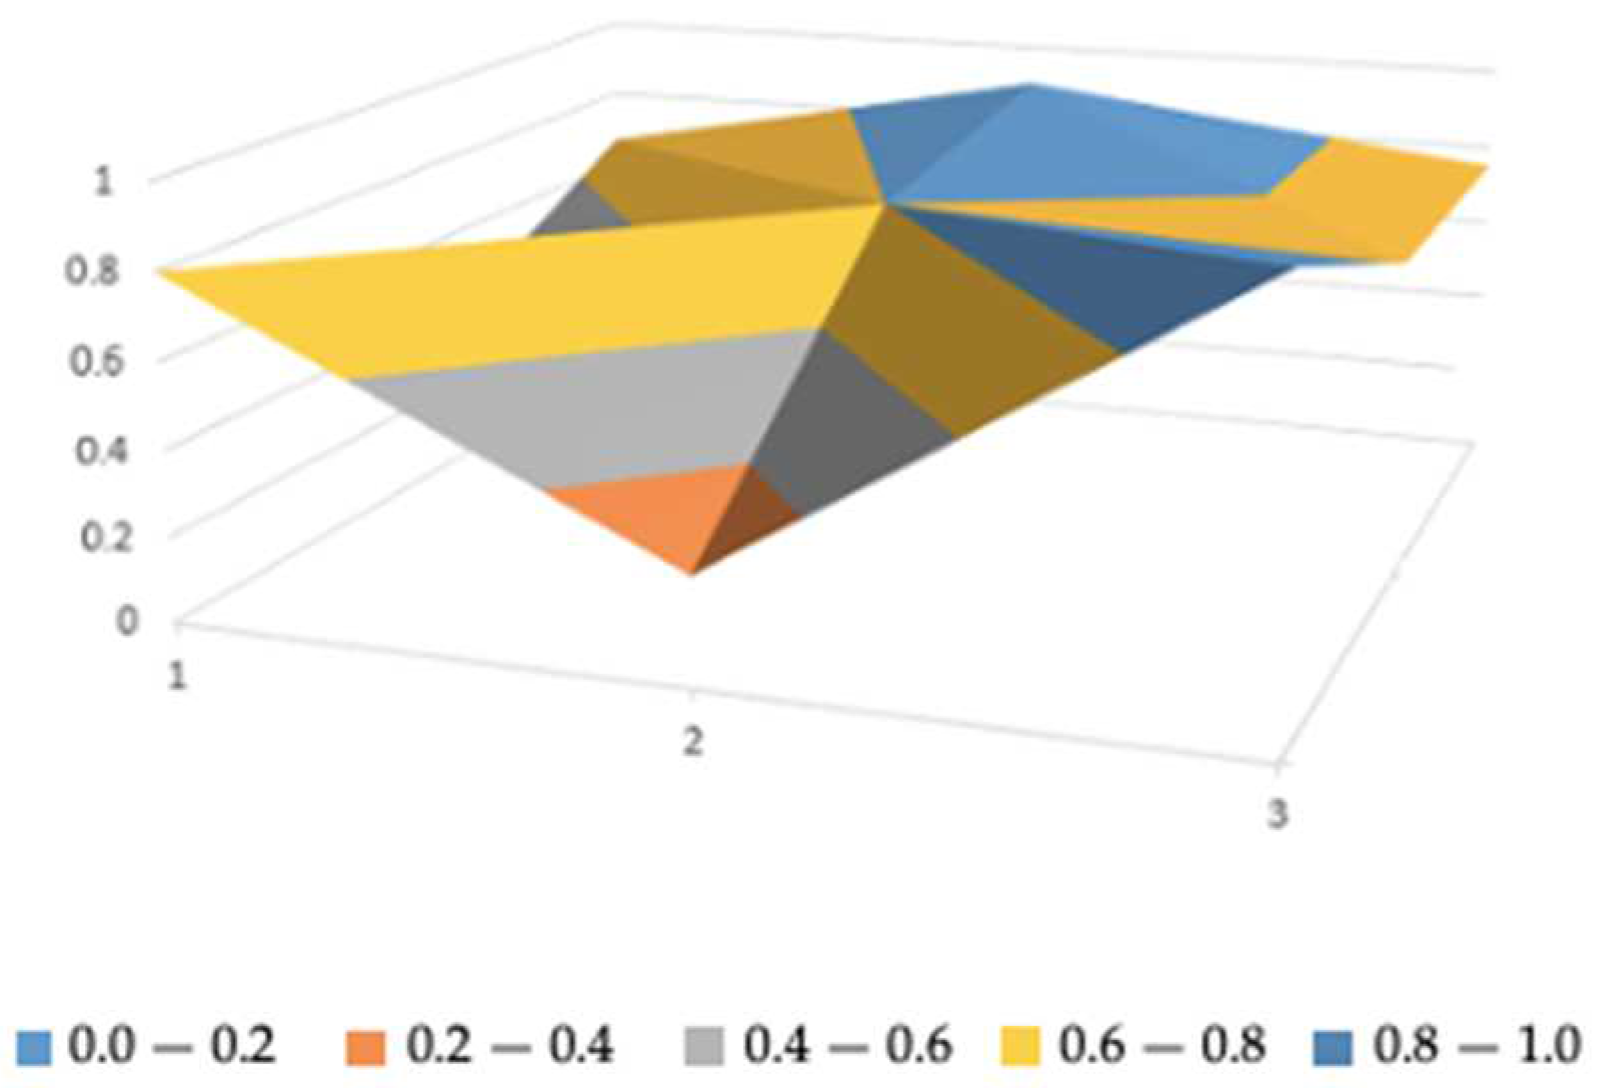
The surface map of the PMC can reflect the degree of smoothness and concavity of the policy. The overall defects of the policy and the degree of defects at each level of indicators can be visualized by the difference between the surface and the perfect plane. At the quantitative level, the degree of concavity represents the gap between the policy to be evaluated and the perfect policy, and the policy optimization path can be determined by two-level tracing of the degree of concavity. In this paper, by converting the calculation results of the first-level variables in the PMC index into a triple-order matrix and plotting them in EXCEL according to Equation (5), the PMC surface diagrams of the 10 policy samples are finally formed to visually display the quantitative data analysis of the policies on the conservation of biogenetic resources, according to which the deficiencies in the policy contents can be better identified and the potential value of the policy texts can also be explored (Figure 2, Figure 3, Figure 4, Figure 5, Figure 6, Figure 7, Figure 8, Figure 9, Figure 10 and Figure 11).

7. Results and Discussion

7.1. General Evaluation of the Empirical Results

Taking an overall view of the empirical evaluation results of China’s biogenetic resources protection policies, the 10 policy samples are classified into two grades of good and acceptable, according to their policy evaluation grades. Among them, seven sample policies, namely, P1, P2, P3, P5, P6, P8, and P10, were evaluated as good, and the PMC index scores of such policies ranged from 6 to 7.99, accounting for 60% of the total. Three sample policies, namely, P4, P7, and P9, were evaluated as acceptable, and the PMC index scores of such policies ranged from 4 to 5.99, accounting for 40% of the total. The average value of the PMC evaluation index of all policy samples is 6.349, which maintains a good rating, indicating that China’s policy system for the protection of biogenetic resources is scientific and feasible, and in general is in a good state of legislation, and that both the central and local governments are able to uphold the principle of seeking truth from facts in the process of policy formulation, and promulgate relevant policies in light of the actual situation of China’s biogenetic resources. Among them, the policy samples at the national level are rated in the front, indicating that the central government has played a leading role in the top-level design of policies [50] and has played an important role in leading and promoting the conservation of biodiversity, the rational use of resources, and the construction of ecology, which also reflects the importance that the Chinese government attaches to the conservation of biological genetic resources. However, it is worth noticing that none of the policies in all policy samples reached the excellent level of 8–9 points, which indicates that there is still room for further improvement in China’s biogenetic resource conservation policies.
The interpretation of the first-level indicators for the overall policy sample on a case-by-case basis allows for a multi-dimensional analysis of the implementation of the policy sample across the dimensions.
In terms of policy nature X1, the mean value of each sample is 0.800, which is higher overall. The Law on Biosafety is an important part of the national biosafety legal system and institutional safeguard system, and prior risk prevention is one of the basic principles of the act [51]. It was found through the analysis that the sample policies in terms of the predictive nature X1:4 except for P1 Law on Biosafety, the rest of the nine policies obviously lacked this indicator, which indicates that this part of the selected sample of biogenetic resources policies lacked policy prediction and was unable to make effective prediction and judgement on the future development trend in the field of biogenetic resources protection. In addition, value assessment is the basis for the formulation of genetic resource conservation policies, and considering the status and development trend of genetic resources, incorporating the current and future values of genetic resources into the formulation of conservation policies and the prioritization of resource conservation and consumption is an effective way to carry out the conservation and sustainable use of genetic resources [52]. In terms of the secondary indicator guidance X1:2, which incorporates the value of resources into the scope of the indicator, the average value of each policy sample reaches 1, indicating that the policy plays a good guiding role, and therefore continuing to pay attention to the value of resources in future policy planning is one of the means to strengthen the scientific conservation of resources.
In terms of policy timeliness X2, the mean value of each sample is 0.333. It can be seen from the analysis of the policy samples that both the central and local policies issued have incorporated biological resources into long-term strategic planning. As a strategic advantageous resource in China, biogenetic resources have been extremely abundant for a long time, but both opportunities and challenges exist in the field of resource development, and it is still necessary to guard against the widespread loss of biogenetic resources in global economic transactions. There is a lack of policies with medium-term and short-term timeliness in terms of the timeliness of policies on biogenetic resources, which side by side reflects that China’s policies on biogenetic resource protection are poorly transitional and lack policies to solve practical problems according to the actual timeliness.
In terms of policy level X3, the mean value of each sample is 0.733, and the analysis reveals that the coverage of biogenetic resources policies issued at each level is relatively balanced, thus indicating that the authority and responsibility of the departments that formulate China’s biogenetic resources policies are clear, and that the policy hierarchy is clearly delineated.
In terms of policy subject X4, the mean value of each sample is 0.250, and when analyzing the issuing institutions of each policy, it is found that the biogenetic resources policies are all issued by the corresponding institutions and departments at all levels of government, and the subjects of policy issuance are relatively homogeneous, especially as there are more homogeneous policy texts in the selected policy evaluation samples, and there is a lack of corresponding cooperative relationships among the issuing institutions, a feature that is evident in the policy issuing institutions’ social network cooperative relationship diagrams of the previous samples. This feature can be verified from the social network co-operation relationship diagram of the issuing institutions in the previous sample.
In terms of policy area X5, the mean value of each sample is 0.860, and most of the samples cover political, economic, cultural, social, and scientific and technological areas, and the evaluation system in the previous period has already included the factors of resource abundance, ecological and geographic distribution, and administrative capacity in each area. Through analysis, it is found that only a few samples do not cover the field of science and technology, which may be related to the long period of time since the release of the policy.
In terms of policy content X6, the mean value of all samples is 0.840, indicating that China’s biogenetic resources policy basically covers the key contents in the field of biological resource conservation. However, by analyzing the five secondary indicators selected under the first-level indicator policy content (X6), most of the policy samples lack the part of science, technology, and innovation in the policy content. In addition, adopting the opinions of frontline personnel through survey research in policy content is conducive to the development of more operational policies. Through analyzing the policy samples, it was found that in the secondary indicator survey research X6:6, there are more provisions related to frontline personnel in biological resources protection, but they have not yet covered all the samples, resulting in a slightly incomplete policy content of individual policies, which still needs to be further supplemented and improved.
In terms of policy function X7, the mean value of each sample is 0.983, indicating that the policy on biological genetic resources is scientific and reasonable in the establishment of policy objectives and the formulation of protection measures, and that the relevant initiatives to open the blockages in the protection of biological resources are appropriate and perfect.
In terms of policy evaluation X8, the mean value of all samples is 0.800, indicating that the objectives of the policy on biological genetic resources are clear, the basis is reasonable, and innovation can be encouraged in the practice of biological resource protection.
In terms of policy recipients X9, the mean value of all samples is 0.750, indicating that biogenetic resources policies at all levels have a wide radius and can be implemented in their respective jurisdictions, including provinces, autonomous regions and municipalities, prefectures, and cities, as well as other districts and counties.

7.2. Evaluation by Grade

Based on the results of the PMC index evaluation of the biogenetic resources policies, this paper selects the typically good and acceptable policies among all the policy samples to carry out detailed analysis, to more clearly identify the key variables affecting the PMC index of the biogenetic resources policies and put forward more targeted policy optimization suggestions.
(1) Grade of Good
Based on the results of the policy evaluation grades of all policy samples, the two policies with the highest rankings were selected to carry out specific analyses, namely P3 and P1.
P3 scored the highest in the evaluation of the grades of all the samples and had the best policy effect. Under the guidance of that opinion, Chinese government departments have taken several measures to strengthen the protection and use of agricultural germplasm resources. For example, a comprehensive census and collection of maize germplasm resources have been carried out to determine the proportion of rare, endangered, and endemic resources among maize varieties, and through the effective protection of these special varieties of resources, the genetic diversity of maize germplasm has been ensured, thus providing a solid foundation for the protection of agricultural biodiversity. In addition, the Chinese Government has implemented a genetic integrity monitoring program for wheat germplasm resources, and through regular monitoring, it has promptly detected and solved the problem of declining genetic purity of wheat germplasm resources. At the same time, modern biotechnological means have been used to rejuvenate some wheat germplasm with low genetic purity, restoring its genetic vitality and ensuring the long-term conservation and use of wheat germplasm. This policy was introduced by the General Office of the State Council specifically for agricultural germplasm resources, and it has specificity in terms of policy content. Among the nine first-level variables, except for the factors of policy timeliness (X2) and policy subject (X4), the characteristics of the other first-level variables were evaluated higher. Among them, the policy is rated as 1 in the dimensions of policy level (X3), policy field (X5), policy content (X6), policy function (X7), policy evaluation (X8), and policy receptor (X9), which fully demonstrates that the policy is scientific in content, complete in function, and clear in goal, and plays an important leading and demonstrative role in the system of policies of its kind. As for the lower-rated factors of policy timeliness (X2) and policy subject (X4), as emphasized in the previous overall analysis, the policy timeliness factor is due to the fact that the timeliness of each policy is long-term, while the policy subject factor is due to the fact that the policy is introduced for agricultural germplasm resources, which is specialized and thus unable to have the joint nature of the policy subject [53]. Thus, the policy as a whole is reasonable and scientific and provides a reference for the introduction and improvement of special policies related to biogenetic resources.
P1 scored second only to P3 in the full sample rating evaluation, and the policy is effective. This law was formulated and promulgated by the Standing Committee of the National People’s Congress (NPC) from the perspective of safeguarding national security, preventing and responding to biosafety risks, and protecting biological resources and the ecological environment. It plays an important leading role in the field of conservation of biological genetic resources, especially in biosafety issues [54]. Among the nine primary variables, as in P1, similarly low in X2 and X4 dimensions, the rest of the primary variables were characterized by high ratings, especially unique policy predictive nature compared to the rest of the nine policy samples. The ratings of 1 in the X3, X7, X8, and X9 dimensions, and 0.8 or 0.9 in the X1, X5 and X6 dimensions, fully demonstrate that the policy has in-depth and comprehensive functions, scientific and reasonable objectives, and plays a necessary leading role in promoting the healthy development of biotechnology, facilitating the building of a community of shared destiny for humankind, and realizing the harmonious coexistence of human beings and nature.
(2) Grade of Acceptable
Among the results of the policy evaluation rank of all policy samples, the lowest ranked policy P7 was selected to expand the specific analyses.
The Circular of the General Office of the People’s Government of Shaanxi Province on Strengthening the Conservation of Aquatic Biological Resources to Promote the Sustainable Development of Fisheries (P7) scored the lowest in the rank evaluation of the entire sample, with a policy effect evaluation rank of acceptable. The circular is a local normative document issued by the People’s Government of Shaanxi Province in 2006 on the conservation of aquatic biological resources for the sustainable development of fisheries. Under the guidance of this policy, the Shaanxi provincial government has established a special rescue rapid response system for the giant salamander, an endangered species, and organized and implemented special rescue operations. Through measures such as artificial breeding and habitat protection, more than 1000 individual giant salamanders have been successfully rescued and bred, effectively promoting the recovery of the giant salamander population and the protection of biodiversity [55].
Among the nine first-level variable scores of P7, the three indicator scores of X1, X6, and X7 all reached a score of 0.8. By analyzing the circular, it was found that the policy content highlighted five aspects of policy requirements, namely the protection and management of key fishery resources, the development of fishery resource enhancement, conservation and restoration activities, scientific aquaculture, increased law enforcement, and organizational leadership, which suggests that the policy function of the circular is relatively stable, the content is scientific and reasonable, and the nature of the circular is comprehensive [56]. However, in addition to these three indicators, the scores for dimensions X2, X4, and X8 are significantly lower. The analysis reveals that the circular lacks policy forecasts and short-term and medium-term planning for the conservation of aquatic biological resources, fails to consider the characteristics of aquatic biological resources to promote in-depth follow-up of relevant measures in the areas of resources, culture, economy, and science and technology, and lacks a section on encouraging innovations in the evaluation of the policy. Except for the first-level indicators mentioned above, the scores of the other indicators are in the middle level, so the overall rating of the policy is acceptable.

8. Conclusions

The rationality and scientific nature of biogenetic resource conservation policies are closely related to whether the conservation of biogenetic resources can be effectively and efficiently implemented. In this paper, 132 national, provincial, and municipal biogenetic resource conservation policies were selected as research samples and China’s biogenetic resource conservation policy database constructed. We use KHcoder, a text mining and analysis software, to extract keywords and analyze word frequency clustering. On this basis, with the help of the PMC index model method, we constructed first-level and second-level indicators of biogenetic resource conservation policies suitable for this research and selected 10 typical policy samples from the 132 research samples for PMC index evaluation to quantitatively evaluate the policy values and deficiencies of this policy system. The results of the PMC evaluation of the biogenetic resource conservation policies show that the mean value of the 10 policies is 6.349, which is a good policy grade in general, and 7 of the total samples have reached a good grade, while the rest are acceptable. It is evident that in the conservation of biogenetic resources, the policies issued by the government have played a positive and effective role in guidance.

Author Contributions

Methodology, L.Q., W.C. and C.L.; software, W.C.; validation, L.G.; formal analysis, W.C.; resources, L.G.; data curation, C.L.; writing—original draft, L.Q. and C.L.; writing—review & editing, L.Q. and X.S.; supervision, X.S. and L.G. project administration, X.S. All authors have read and agreed to the published version of the manuscript.

Funding

This research was funded by the National Social Science Foundation of China, grant number 16ZDA236.

Institutional Review Board Statement

Not applicable.

Informed Consent Statement

Not applicable.

Data Availability Statement

Publicly available datasets were analyzed in this study. These data can be found here: http://www.pkulaw.cn/?isFromV6=1 (accessed on 20 April 2024).

Conflicts of Interest

The authors declare no conflicts of interest.

References

  1. Boursot, P.; Desmarais, E. Genetic evaluation of biodiversity. Biofuture 1997, 17, 29–33. [Google Scholar] [CrossRef]
  2. Fransen, A.; Bulkeley, H. Transnational Governing at the Climate-Biodiversity Frontier: Employing a Governmentality Perspective. Glob. Environ. Politics 2024, 24, 76–99. [Google Scholar] [CrossRef]
  3. Salgotra, R.K.; Chauhan, B.S. Genetic diversity, conservation, and utilization of plant genetic resources. Genes 2023, 14, 18–25. [Google Scholar] [CrossRef] [PubMed]
  4. Wang, T.; Li, M.; Rasheed, M.F. The nexus between resource depletion, price fluctuations, and sustainable development in expenditure on resources. Resour. Policy 2024, 89, 117–125. [Google Scholar] [CrossRef]
  5. Francolini, E.M.; Mann-Lang, J.B.; McKinley, E.; Mann, B.Q.; Abrahams, M.I. Stakeholder perspectives on socio-economic challenges and recommendations for better management of the Aliwal Shoal Marine protected area in South Africa. Mar. Policy 2023, 148, 102–121. [Google Scholar] [CrossRef]
  6. Sherman, B.; Henry, R.J. The Nagoya Protocol and historical collections of plants. Nat. Plants 2020, 6, 430–432. [Google Scholar] [CrossRef] [PubMed]
  7. Nam, M. Analysis of genetic resources protection policy under the perspective of intellectual property rights. J. Cent. Univ. Natl. (Sci. Ed.) 2019, 28, 53–56. [Google Scholar]
  8. Dai, S.; Zhang, W.; Zong, J.; Wang, Y.; Wang, G. How effective is the green development policy of China’s Yangtze River economic belt? A quantitative evaluation based on the PMC-index model. Int. J. Environ. Res. Public Health 2021, 18, 7676. [Google Scholar] [CrossRef]
  9. Hoban, S.; da Silva, J.M.; Hughes, A.; Hunter, M.E.; Kalamujić Stroil, B.; Laikre, L.; Mastretta-Yanes, A.; Millette, K.; Paz-Vinas, I.; Bustos, L.R.; et al. Too simple, too complex, or just right? Advantages, challenges, and guidance for indicators of genetic diversity. Bioscience 2024, 11, 49–53. [Google Scholar] [CrossRef]
  10. Hoban, S.; Arntzen, J.W.; Bertorelle, G.; Bryja, J.; Fernandes, M.; Frith, K.; Gaggiotti, O.; Galbusera, P.; Godoy, J.A.; Hauffe, H.C.; et al. Conservation genetic resources for effective species survival (congress): Bridging the divide between conservation research and practice. J. Nat. Conserv. 2013, 21, 433–437. [Google Scholar] [CrossRef]
  11. Legese, K.; Bekele, A. Assessment of challenges and opportunities for wildlife conservation in Wenchi highlands, central Ethiopia. Trop. Conserv. Sci. 2023, 16, 533–541. [Google Scholar] [CrossRef]
  12. Walls, S.C. Coping with constraints: Achieving effective conservation with limited resources. Front. Ecol. Evol. 2018, 6, 26–35. [Google Scholar] [CrossRef]
  13. Grajal, A. Biodiversity and the nation state: Regulating access to genetic resources limits biodiversity research in developing countries. Conserv. Biol. 1999, 13, 6–10. [Google Scholar] [CrossRef]
  14. Trommetter, M. Biodiversity and international stakes: A question of access. Ecol. Econ. 2005, 53, 573–583. [Google Scholar] [CrossRef]
  15. Andrade, R.; van Riper, C.J.; Goodson, D.J.; Johnson, D.N.; Stewart, W.; López-Rodríguez, M.D.; Cebrián-Piqueras, M.A.; Horcea-Milcu, A.I.; Lo, V.; Raymond, C.M. Values shift in response to social learning through deliberation about protected areas. Glob. Environ. Chang.-Hum. Policy Dimens. 2023, 78, 96–101. [Google Scholar] [CrossRef]
  16. Locatelli, B.; Laurenceau, M.; Chumpisuca, Y.R.; Pramova, E.; Vallet, A.; Conde, Y.Q.; Zavala, R.C.; Djoudi, H.; Lavorel, S.; Colloff, M.J. In people’s minds and on the ground: Values and power in climate change adaptation. Environ. Sci. Policy 2022, 137, 75–86. [Google Scholar] [CrossRef]
  17. Gollin, D.; Evenson, R. Valuing animal genetic resources: Lessons from plant genetic resources. Ecol. Econ. 2003, 45, 353–363. [Google Scholar] [CrossRef]
  18. Winge, T. Linking access and benefit-sharing for crop genetic resources to climate change adaptation. Plant Genet. Resour.-Charact. Util. 2016, 14, 11–27. [Google Scholar] [CrossRef]
  19. Cowell, C.; Paton, A.; Borrell, J.S.; Williams, C.; Wilkin, P.; Antonelli, A.; Baker, W.J.; Buggs, R.; Fay, M.F.; Gargiulo, R.; et al. Uses and benefits of digital sequence information from plant genetic resources: Lessons learnt from botanical collections. Plants People Planet 2022, 4, 33–43. [Google Scholar] [CrossRef]
  20. Geary, J.; Bubela, T. Governance of a global genetic resource commons for non-commercial research: A case-study of the DNA barcode commons. Int. J. Commons 2019, 13, 205–243. [Google Scholar] [CrossRef]
  21. Lawson, C.; Rourke, M.; Humphries, F. Information as the latest site of conflict in the ongoing contests about access to and sharing the benefits from exploiting genetic resources. Queen Mary J. Intellect. Prop. 2020, 10, 7–33. [Google Scholar] [CrossRef]
  22. Putterman, D. Trade and the biodiversity convention. Nature 1994, 371, 553–554. [Google Scholar] [CrossRef] [PubMed]
  23. Anwar, M.; Khattak, M.S.; Popp, J.; Meyer, D.F.; Máté, D. The nexus of government incentives and sustainable development goals: Is the management of resources the solution to non-profit organisations? Technol. Econ. Dev. Econ. 2020, 26, 1284–1310. [Google Scholar] [CrossRef]
  24. Xu, S.; He, X.; Xu, L. Market or government: Who plays a decisive role in R&D resource allocation? China Financ. Rev. Int. 2019, 9, 110–136. [Google Scholar]
  25. Marjanović, N.; Jovanović, V.; Ratknić, T.; Paunković, D. The role of leadership in natural resource conservation and sustainable development—A case study of local self-government of eastern serbia. Ekon. Poljopr.-Econ. Agric. 2019, 66, 889–903. [Google Scholar] [CrossRef]
  26. Baker, T.; Nelson, R.E. Creating something from nothing: Resource construction through entrepreneurial bricolage. Adm. Sci. Q. 2005, 50, 329–366. [Google Scholar] [CrossRef]
  27. Cusack, C.; Cohen, B.; Mignone, J.; Chartier, M.J.; Lutfiyya, Z. Participatory action as a research method with public health nurses. J. Adv. Nurs. 2018, 74, 1544–1553. [Google Scholar] [CrossRef] [PubMed]
  28. Ylönen, M.; Salmivaara, A. Policy coherence across agenda 2030 and the sustainable development goals: Lessons from Finland. Dev. Policy Rev. 2021, 39, 829–847. [Google Scholar] [CrossRef]
  29. Davies, J.K.; Sherriff, N.S. Assessing public health policy approaches to level-up the gradient in health inequalities: The Gradient Evaluation Framework. Public Health 2014, 128, 246–253. [Google Scholar] [CrossRef] [PubMed]
  30. Kuhlmann, S. Evaluation of research and innovation policies: A discussion of trends with examples from Germany. Int. J. Technol. Manag. 2003, 26, 131–149. [Google Scholar] [CrossRef]
  31. Wang, G.; Yang, Y. Quantitative Evaluation of Digital Economy Policy in Heilongjiang Province of China Based on the PMC-AE Index Model. Sage Open 2024, 14, 13–19. [Google Scholar] [CrossRef]
  32. Brandt, L.; Biesebroeck, J.V.; Zhang, Y. Creative accounting or creative destruction? firm-level productivity growth in Chinese manufacturing. J. Dev. Econ. 2012, 97, 339–351. [Google Scholar] [CrossRef]
  33. Qin, Q.; Sun, Y. Assessing the Intention to Provide Human Genetic Resources: An Explanatory Model. Public Health Genom. 2020, 23, 133–148. [Google Scholar] [CrossRef] [PubMed]
  34. Attridge, J. Innovation models in the biopharmaceutical sector. Int. J. Innov. Manag. 2007, 11, 215–243. [Google Scholar] [CrossRef]
  35. Wang, N.; Wang, W.; Song, T.; Wang, H.; Cheng, Z. A quantitative evaluation of water resource management policies in China based on the PMC index model. Water Policy 2022, 24, 1859–1875. [Google Scholar] [CrossRef]
  36. Yang, Y.; Tang, J.; Li, Z.; Wen, J. How effective is the health promotion policy in Sichuan, China: Based on the PMC-Index model and field evaluation. BMC Public Health 2022, 22, 53–57. [Google Scholar] [CrossRef] [PubMed]
  37. Zhang, Y.; Wang, T.; Wang, C.; Cheng, C. Quantitative Evaluation of China’s CSR Policies Based on the PMC-Index Model. Sustainability 2023, 15, 7194. [Google Scholar] [CrossRef]
  38. Dai, S.; Zhang, W.; Lan, L. Quantitative Evaluation of China’s Ecological Protection Compensation Policy Based on PMC Index Model. Int. J. Environ. Res. Public Health 2022, 19, 10227. [Google Scholar] [CrossRef] [PubMed]
  39. Estrada, M. Policy modeling: Definition, classification and evaluation. J. Policy Model. 2011, 33, 523–536. [Google Scholar] [CrossRef]
  40. Huang, G.; Shen, X.; Zhang, X.; Gu, W. Quantitative evaluation of China’s central-level land consolidation policies in the past forty years based on the text analysis and PMC-index model. Land 2023, 12, 223–231. [Google Scholar] [CrossRef]
  41. Ruiz, E.; Yap, S.; Nagaraj, S. Beyond the ceteris paribus assumption: Modeling demand and supply assuming omnia mobilis. Soc. Sci. Electron. Publ. 2010, 17, 1522–1531. [Google Scholar]
  42. Zhang, Y.; Qie, H. Research on quantitative evaluation of popular entrepreneurship and innovation policies--taking the intelligence of 10 shuangchuang policies in 2017 as an example. J. Intell. 2018, 37, 158–164+186. [Google Scholar]
  43. Ding, X.; Fang, Y. Research on mining and quantitative evaluation of support policies for “chinese core”. Soft Sci. 2019, 33, 34–39. [Google Scholar]
  44. Wu, W.; Sheng, L.; Tang, F.; Zhang, A. Quantitative evaluation of manufacturing innovation policies based on feature analysis. Sci. Res. 2020, 38, 2246–2257. [Google Scholar]
  45. Liu, S.; Pang, Y.; Zhang, H.; Wang, B.; Ye, B. Comprehensive evaluation index system and assessment method for natural forest resources protection project in China. J. Ecol. 2021, 41, 5067–5079. [Google Scholar]
  46. Ma, J.; Du, G.; Xia, C. CO2 emission changes of China’s power generation system: Input-output subsystem analysis. Energy Policy 2019, 12, 1–12. [Google Scholar] [CrossRef]
  47. Cai, D.; Chai, Y.; Tian, Z. Quantitative evaluation of digital economy policy texts in Jilin Province based on PMC index model. Intell. Sci. 2021, 39, 139–145. [Google Scholar]
  48. Shi, L.; Huang, X.; Huang, J. Content analysis and quantitative evaluation of national fitness public service policy based on TM-PMC index model. China Sports Sci. Technol. 2023, 59, 13–22. [Google Scholar]
  49. Gu, Y.; He, D.; Huang, J.; Sun, H.; Wang, H. Research on the policy environment of China’s healthcare big data development based on PMC index model. China Health Policy Res. 2022, 15, 45–51. [Google Scholar]
  50. Rao, M.; Johnson, A.; Spence, K.; Sypasong, A.; Bynum, N.; Sterling, E.; Phimminith, T.; Praxaysombath, B. Building Capacity for Protected Area Management in Lao PDR. Environ. Manag. 2014, 53, 715–727. [Google Scholar] [CrossRef] [PubMed]
  51. Qin, T. The legislative positioning of the Biosafety Law and its unfolding. Soc. Sci. J. 2020, 248, 134–147+209. [Google Scholar]
  52. Liu, D.; Zhang, F.; Wu, X.; Li, J. The progress and application of genetic resources value assessment. Environ. Sustain. Dev. 2015, 40, 19–22. [Google Scholar]
  53. Poudel, D.; Johnsen, F.H. Valuation of crop genetic resources in Kaski, Nepal: Farmers’ willingness to pay for rice landraces conservation. J. Environ. Manag. 2009, 90, 483–491. [Google Scholar] [CrossRef] [PubMed]
  54. Zhang, B.; Cao, C. Policy: Four gaps in China’s new environmental law. Nature 2015, 517, 433–434. [Google Scholar] [CrossRef] [PubMed]
  55. Cao, C. China’s evolving biosafety/biosecurity legislations. J. Law Biosci. 2021, 8, 20. [Google Scholar] [CrossRef] [PubMed]
  56. Qin, M.; Yue, C.; Du, Y. Evolution of China’s marine ranching policy based on the perspective of policy tools. Mar. Policy 2020, 117, 103941. [Google Scholar] [CrossRef]
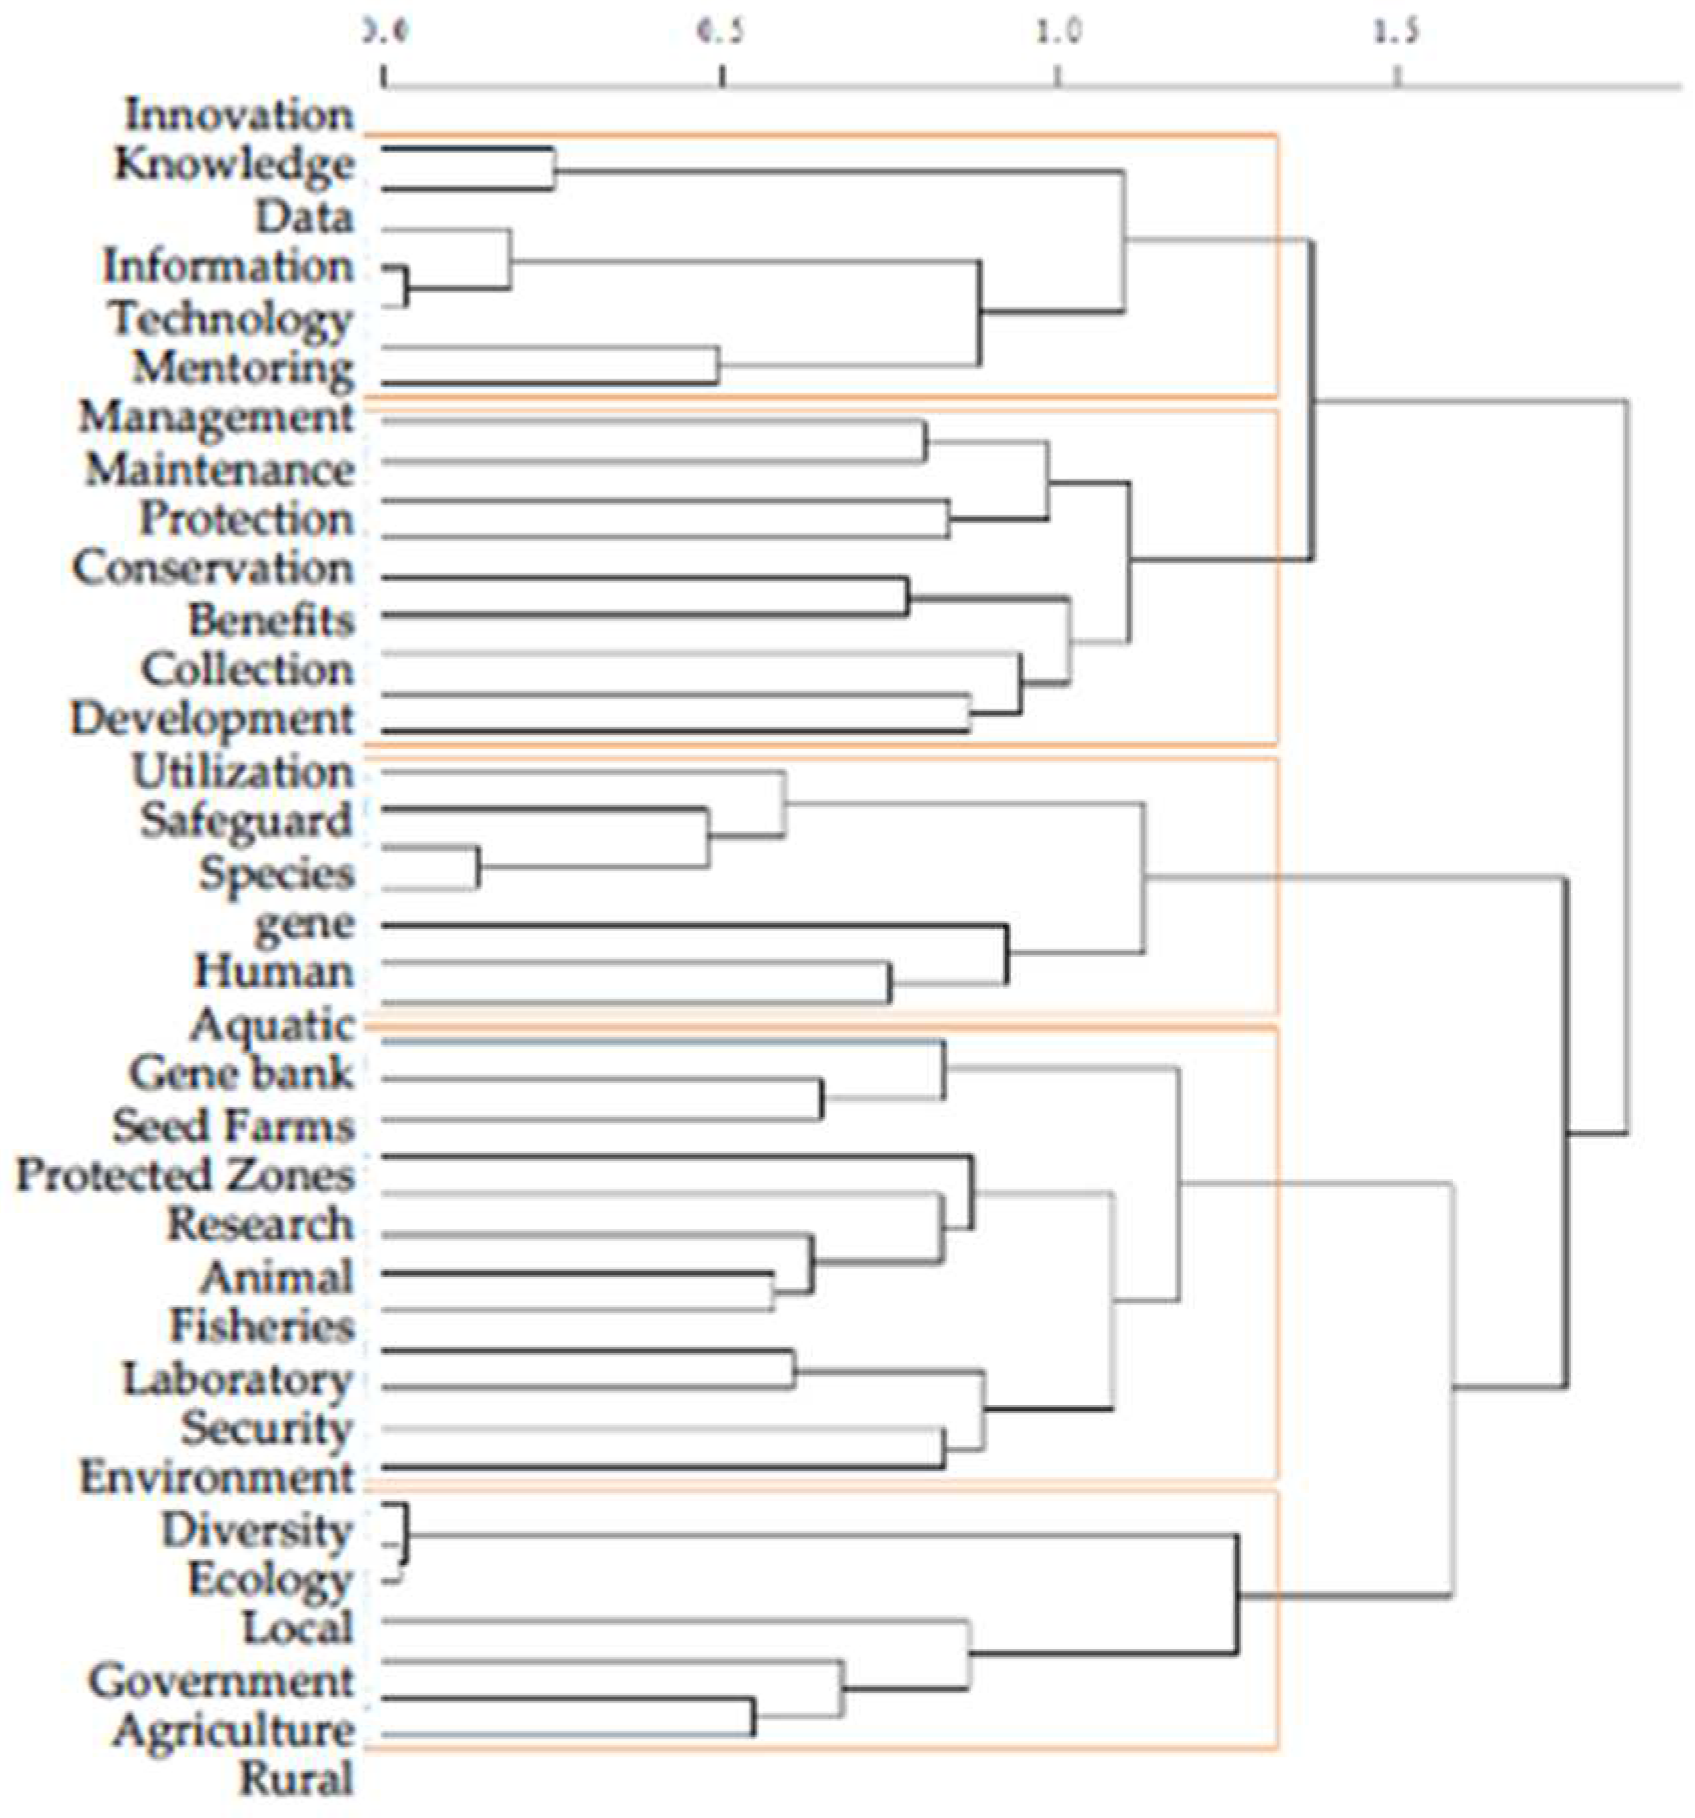
Figure 1. Tree diagram of keyword clustering for biological genetic resource policies.
Sustainability 16 05158 g001
Figure 2. PMC surface diagram for P1.
Sustainability 16 05158 g002
Figure 3. PMC surface diagram for P2.
Sustainability 16 05158 g003
Figure 4. PMC surface diagram for P3.
Sustainability 16 05158 g004
Figure 5. PMC surface diagram for P4.
Sustainability 16 05158 g005
Figure 6. PMC surface diagram for P5.
Sustainability 16 05158 g006
Figure 7. PMC surface diagram for P6.
Sustainability 16 05158 g007
Figure 8. PMC surface diagram for P7.
Sustainability 16 05158 g008
Figure 9. PMC surface diagram for P8.
Sustainability 16 05158 g009
Figure 10. PMC surface diagram for P9.
Sustainability 16 05158 g010
Figure 11. PMC surface diagram for P10.
Sustainability 16 05158 g011
Table 1. List of high-frequency words in the text of the biogenetic resource conservation policies.
WordFrequencyWordFrequencyWordFrequencyWordFrequency
Creatures4141Conservation820Survey401Aquatic255
Resources2833Utilization782Livestock399Genebank231
Genetics2337Species780Establishment390Seed Farms229
Government1930Environment753Maintenance378Protected Zones220
Agriculture1667Ecology692Benefits377Research193
Diversity1433Protection559Encouragement371Animal188
Rural1220Development503Human360Laboratory179
Fisheries1009Prevention499Technology347Knowledge177
Collection997Security441Production323Innovation169
Development985Local440Revision283Microbiology167
Safeguard967gene429Construction280Mentoring166
Data906Promote416Organization277Enabling162
Management821Oversight403Forestry263Information160
Table 2. Setting of variables for evaluation of biogenetic resource conservation policies.
First-Level VariableNo.Second-Level VariableNo.MetricsRationale for the Establishment
Policy NatureX1SupervisionX1:1Involved or not, 1 for yes, 0 for noReferring to the research setup of Y.A. Zhang et al. [42].
GuidanceX1:2Involved or not, 1 for yes, 0 for no
RecommendationX1:3Involved or not, 1 for yes, 0 for no
ForecastingX1:4Involved or not, 1 for yes, 0 for no
PlanningX1:5Involved or not, 1 for yes, 0 for no
Policy TimelinessX2Long-termX2:1Yes or no, 1 for yes, 0 for noReferring to the research setup of X.J. Ding et al. [43].
Mid-termX2:2Yes or no, 1 for yes, 0 for no
Short-termX2:3Yes or no, 1 for yes, 0 for no
Policy LevelX3NationalX3:1Yes or no, 1 for yes, 0 for noReferring to the research setup of W.H. Wu et al. [44].
ProvincialX3:2Yes or no, 1 for yes, 0 for no
MunicipalX3:3Yes or no, 1 for yes, 0 for no
Policy SubjectX4NPC Standing CommitteeX4:1Yes or no, 1 for yes, 0 for noReferring to the research setup of Y.A. Zhang et al. [42] and based on the policy sample’s issuing subject setting
General Office of the State CouncilX4:2Yes or no, 1 for yes, 0 for no
State Ministries and CommissionsX4:3Yes or no, 1 for yes, 0 for no
Provincial and Municipal OfficesX4:4Yes or no, 1 for yes, 0 for no
Policy AreaX5PoliticsX5:1Involved or not, 1 for yes, 0 for noReferring to Ruiz Estrada’s research setup
EconomicsX5:2Involved or not, 1 for yes, 0 for no
CulturalX5:3Involved or not, 1 for yes, 0 for no
SocialX5:4Involved or not, 1 for yes, 0 for no
Science and TechnologyX5:5Involved or not, 1 for yes, 0 for no
Policy ContentX6BiosecurityX6:1Involved or not, 1 for yes, 0 for noReferring to S. Liu et al. [45]’s study and setting up the content analysis based on the policy sample
Resource ConservationX6:2Involved or not, 1 for yes, 0 for no
Seedstock ConservationX6:3Involved or not, 1 for yes, 0 for no
BiodiversityX6:4Involved or not, 1 for yes, 0 for no
Science and Technology InnovationX6:5Involved or not, 1 for yes, 0 for no
ResearchX6:6Involved or not, 1 for yes, 0 for no
Genetic DataX6:7Involved or not, 1 for yes, 0 for no
Economic DevelopmentX6:8Involved or not, 1 for yes, 0 for no
ExploitationX6:9Involved or not, 1 for yes, 0 for no
ImmigrationX6:10Involved or not, 1 for yes, 0 for no
Policy FunctionX7Organizational LeadershipX7:1Involved or not, 1 for yes, 0 for noBased on the policy objectives of the sample and the analytical settings of the text keywords
Publicity and PopularizationX7:2Involved or not, 1 for yes, 0 for no
Financial SupportX7:3Involved or not, 1 for yes, 0 for no
Technical TestingX7:4Involved or not, 1 for yes, 0 for no
Education and TrainingX7:5Involved or not, 1 for yes, 0 for no
Supervision MechanismX7:6Involved or not, 1 for yes, 0 for no
Policy EvaluationX8Scientific ProgrammeX8:1Yes or no, 1 for yes, 0 for noReferring to the research setup of Y.A. Zhang et al. [42].
Clear GoalsX8:2Yes or no, 1 for yes, 0 for no
Soundly BasedX8:3Yes or no, 1 for yes, 0 for no
Encouragement of InnovationX8:4Yes or no, 1 for yes, 0 for no
Policy ReceptorsX9ProvincialX9:1Targeted or not, 1 for yes, 0 for noSet up for textual analysis of policy samples
Autonomous regions and municipalitiesX9:2Targeted or not, 1 for yes, 0 for no
MunicipalitiesX9:3Targeted or not, 1 for yes, 0 for no
OtherX9:4Targeted or not, 1 for yes, 0 for no
Table 3. Multiple input–output table of biogenetic resource conservation policies.
First-Level VariableSecond-Level Variable
X1X1:1 X1:2 X1:3 X1:4 X1:5
X2X2:1 X2:2 X2:3
X3X3:1 X3:2 X3:3
X4X4:1 X4:2 X4:3 X4:4
X5X5:1 X5:2 X5:3 X5:4 X5:5
X6X6:1 X6:2 X6:3 X6:4 X6:5 X6:6 X6:7 X6:8 X6:9 X6:10
X7X7:1 X7:2 X7:3 X7:4 X7:5 X7:6
X8X8:1 X8:2 X8:3 X8:4
X9X9:1 X9:2 X9:3 X9:4
Table 4. Sample system of empirical evaluation policies.
No.Name of the PolicyPublishersRelease Date
P1Law on BiosafetyStanding Committee of the National People’s Congress (NPC)17 October 2020
P2Regulations on the Management of Human Genetic ResourcesState Council (PRC)28 May 2019
P3Opinions of the General Office of the State Council on Strengthening the Protection and Utilization of Agricultural Germplasm ResourcesState Council Office of the People’s Republic of China30 December 2019
P4Measures for the Management of Livestock and Poultry Genetic Resources Breeding Reserve Sanctuaries and Gene Banks(former) Ministry of Agriculture5 June 2006
P5Regulations on Biodiversity Protection in Yunnan ProvinceYunnan Provincial People’s Congress (including Standing Committee)21 September 2018
P6Measures for the Management of Access and Benefit-Sharing of Biogenetic Resources and Associated Traditional Knowledge of the Guangxi Zhuang Autonomous Region (Trial Implementation)Department of Ecology and Environment of Guangxi Zhuang Autonomous Region24 September 2021
P7Notice of the General Office of the People’s Government of Shanxi Province on Strengthening the Conservation of Aquatic Bio-resources and Promoting the Sustainable Development of FisheriesPeople’s Government of Shanxi Province22 September 2006
P8Implementation Opinions of the People’s Government of Shanghai on Further Strengthening Biodiversity ConservationPeople’s Government of Shanghai Municipality18 November 2022
P9Regulations on the Protection of Biodiversity in Xiangxi Tujia and Miao Autonomous PrefectureStanding Committee of Xiangxi Tujia and Miao Autonomous Prefecture People’s Congress30 July 2020
P10Opinions on Strengthening the Management of Compensation for Losses of Marine Biological Resources Issued by the Office of the Lianyungang Municipal GovernmentPeople’s Government of Lianyungang City7 November 2017
Table 5. Criteria for policy scoring.
PMC Index8~96~7.994~5.990~3.99
Grade Excellent Good Acceptable Failing
Table 6. Evaluation of the PMC index of China’s biogenetic resource conservation policies.
First-Level VariableP1P2P3P4P5P6P7P8P9P10Mean Value
X10.8000.8000.8000.8000.8000.8000.8000.8000.8000.8000.800
X20.3330.3330.3330.3330.3330.3330.3330.3330.3330.3330.333
X31.0001.0001.0001.0000.6670.6670.6670.6670.3330.3330.733
X40.2500.2500.2500.2500.2500.2500.2500.2500.2500.2500.250
X50.8000.8001.0000.8001.0000.8000.6001.0000.8001.0000.860
X60.9000.8001.0000.7000.8000.9000.8000.9000.8000.9000.840
X71.0001.0001.0001.0001.0001.0000.8331.0001.0001.0000.983
X81.0000.5001.0000.5000.7500.7500.5001.0001.0001.0000.800
X91.0001.0001.0000.7500.7500.7500.7500.5000.5000.5000.750
PMC Index7.0836.4837.3835.8136.3506.2505.1336.4505.8166.1166.349
Policy Rank24195610387/
Policy GradeGoodGoodGoodAcceptableGoodGoodAcceptableGoodAcceptableGood/
Disclaimer/Publisher’s Note: The statements, opinions and data contained in all publications are solely those of the individual author(s) and contributor(s) and not of MDPI and/or the editor(s). MDPI and/or the editor(s) disclaim responsibility for any injury to people or property resulting from any ideas, methods, instructions or products referred to in the content.