Article

New Interpretation of Human–Land Relation: Differentiated Impacts of Global Demographic Transition on Carbon Emissions

1
College of Geography and Environment, Shandong Normal University, Jinan 250358, China
2
Dongying Institute, Shandong Normal University, Jinan 257092, China
*
Author to whom correspondence should be addressed.
Sustainability 2024, 16(12), 5168; https://doi.org/10.3390/su16125168
Submission received: 1 May 2024 / Revised: 7 June 2024 / Accepted: 16 June 2024 / Published: 18 June 2024
(This article belongs to the Section Environmental Sustainability and Applications)

Abstract

:
Demographic transition and environmental governance are the most prominent focal points of global concern in the 21st century. We quantitatively evaluate the distinct carbon emission impacts of the global demographic transition by regression models based on C–D production function. Our study highlights that while demographic transition boosts per capita economic growth, it adversely affects overall economic output and aggregate economic growth, highlighting significant reductions in carbon emissions as a result of these demographic changes. However, it has a negative contribution to overall economic output and economic growth. Meanwhile, demographic transition eventually reduces carbon emissions to some extent. The relationship between population urbanization and carbon emissions mainly conforms to an inverted U-shaped curve, while some of it does to a linear growth pattern. However, the relationship between population aging and carbon emissions mainly conforms to an inverted U-shaped pattern. The impacts of demographic transition on carbon emissions confirm the universality of the EKC law in the particular production function.

1. Introduction

Environmental governance and demographic transition are two of the major changes being faced globally in today’s world. The two are interconnected, with demographic transition being essential for the long-term balanced development of human societies, while energy conservation and emission reduction are not directly related to it. The threats to society and humanity posed by climate change are deepening [1]. Among them, carbon dioxide emissions account for 70% of greenhouse gas emissions (GHGs) [2], directly threatening global ecosystems. Otherwise, population urbanization and population aging, as two major demographic transitions in modern societies [3], pose unprecedented challenges to the world [4].
According to World Energy Statistical Yearbook (70th Edition), there has been a significant rise in global carbon emissions since the beginning of the 21st century. In 2019, the total global carbon emissions hit a new peak, at 34.36 billion tons. During 2000–2019, there was a significant increase, of 40.00%, in global CO2 emissions. To this end, various world organizations have concluded many conventions or declarations. The United Nations Framework Convention on Climate Change, adopted in 1992, is an international convention. In 1997, the Kyoto Protocol established a legal requirement for high-income countries to reduce their greenhouse gas emissions and urged industrialized countries to reduce their greenhouse gas emissions by 5.20% from the 1990 levels by the end of 2012. The Delhi Declaration, adopted in 2002, stressed that the suppression of climate change must be carried out within the framework of sustainable development. This shows that greenhouse gas emission reduction and sustainable development are still important tasks for the parties to implement this convention in the future. In 2009, the Copenhagen Accord, comprising mainly signed agreements, was adopted to reduce CO2 emissions according to the GDP of countries. It is essential for global greenhouse gas emissions to peak as soon as possible and for net greenhouse gas emissions to reach zero in the latter half of the 21st century in order to mitigate the ecological risks posed by climate change and alleviate the existential threat climate change presents to humanity. The latest data released by the National Climate Centre show that 2023 was the world’s hottest year since meteorological records began, breaking the record for the warmest year. The Intergovernmental Panel on Climate Change has projected a potential increase in global temperatures of 1.40–5.80℃ between the years 1990 and 2100. Affected by the global COVID-19 pandemic, global carbon emissions generally decreased in 2020 and dropped to 32.28 billion tons, a year-on-year decrease of 6.30%.
Due to global warming, there is a growing consensus on the necessity of reducing carbon emissions to achieve sustainable and environmentally friendly development worldwide. However, there remains a significant gap in research regarding the impact of demographic transition on carbon emissions, with few comprehensive studies addressing this issue. Therefore, our study seeks to quantitatively investigate the impacts of demographic transition on carbon emissions within the context of population aging and urbanization. Our approach represents a novel contribution by integrating two critical global concerns and conducting interdisciplinary research that spans demography, environmental economics, and other relevant disciplines. By examining the carbon emission impacts of demographic transition around the globe, we aim to provide valuable insights into global emission trends. Furthermore, our findings are intended to offer theoretical support for policymakers as they design and implement strategies related to demographic transition in pursuit of sustainable development at a global scale.

2. Literature Review

The impacts of demographic transition on carbon emissions have been acknowledged and appreciated, but there is a lack of comprehensive research findings. While there have been various accomplishments in examining specific aspects, such as the impact of population aging or urbanization on carbon emissions, literature reviews can be categorized into two main areas.

2.1. The Relationship between Carbon Emissions and Population Aging

The relationship between population aging and carbon emissions has been studied in various countries. Although there are inconsistencies in the findings, all show that population aging is an important factor in carbon emissions. Compared to technology, population aging has a negative impact on carbon emissions in the United States and to a much greater extent than technology in some cases [5]. The elderly consume more energy-intensive products in OECD countries, leading to an increase in carbon emissions [6]. When examining macroeconomic emissions by incorporating population aging and group composition into indicators, it is found that changes in the demographic age structure increase carbon emissions in OECD countries [7]. With the aging of the population happening at a fast pace, the rise in carbon emissions is attributed to changes in the industrial structure and urbanization. Additionally, the connection between income levels and carbon emissions differs among countries in various developmental stages [8]. High per capita consumption and an increase in older age groups are the main reasons for the higher share of the total carbon footprint of older age groups in most countries [9]. Population aging promotes CO2 emissions at the national level, with provincial differences [10]. The impact of population aging on household carbon emissions varies significantly between rural and urban areas [11]. The evolving consumption patterns, particularly the growing prevalence of small-size and elderly households, have been identified as significant contributors to the escalating energy consumption and carbon emissions in China [12].

2.2. The Relationship between Carbon Emissions and Population Urbanization

Urbanization currently creates extra global environmental pressure [13]. It is a universal truth that rapid urbanization increases carbon emissions [14]. Urbanization and carbon emissions, which have attracted widespread attention, have been two major characteristics [15] of modern global socio-economy. In the modern era, rapid urbanization has a considerable impact on CO2 emissions, whose one main source is urbanized areas [16]. Cities are the key areas for implementing carbon reduction policies [17]. Exploring the impacts of urbanization on CO2 emissions is of great significance [18] in striving toward a low-carbon society. Nevertheless, there have been limited investigations into the variations in carbon intensity and the driving factors at the city level [19]. The primary techniques for measurement involve the use of the ideal point cross-efficiency model [20], the stochastic frontier model [21], the hierarchical spatial autoregressive model [16], the logarithmic mean Divisia index decomposition method [22], the Panel Autoregressive Distributed Lag approach and the heterogeneous causality test [23], the tree-based regression model [19], the carbon intensity of human well-being [24], urban building carbon emissions [25,26,27], energy rebound impact [28], energy service companies [29], passenger transport of cities [19], etc. Although the improvement of methods creates extra uncertainties, some research has identified a direct link between urbanization and the release of carbon emissions [30], with urbanization’s regionally differentiated impacts on CO2 emissions [22]. Previous studies have revealed heterogeneity in the impacts of urbanization on carbon emissions, such as new-type urbanization [31]. Moreover, the speed of the barycenter of carbon emissions is faster than that of urbanization and industrialization [32]. The inverted U-shaped relationship between urbanization and carbon emissions has been identified [21,33,34]. However, the impacts of urbanization on CO2 emissions vary with different urbanization subsystems [18,35]. Among them, land urbanization and economic urbanization [30] display a Kuznets curve relationship with carbon emissions, which can be verified in the lower–middle-income group [36], such as India [37]. CO2 emissions are primarily affected by urbanization in lower–middle-income countries [23]. Additionally, the EKC hypothesis is also confirmed in upper-middle- and high-income groups [38].
In conclusion, there are emerging research findings and deepening theoretical studies related to the impact of demographic transition on carbon emissions. However, it is still necessary to further quantify these impacts. Therefore, we aim to investigate the relationship between population transformation and economic, technological, and environmental factors using the Cobb–Douglas (C–D) production function. Additionally, we will explore the international-scale environmental impacts of demographic transition through regression modeling. Finally, we will construct an environmental Kuznets curve (EKC) for demographic transition and carbon emissions based on economic development indicators. Our key innovation lies in integrating population and environmental issues to demonstrate their coordinated mechanism and promote interdisciplinary research in regional governance encompassing demography, environmental economics, and other disciplines. We hope that our study can establish a new research paradigm and effectively guide policies addressing the carbon emission impacts of demographic transition across various economies.

3. Methodology and Data Sources

3.1. Data

The primary data for carbon emissions and demographic transition were sourced from the World Development Indicators database (https://data.worldbank.org/, accessed on 19 October 2023). In our study, we identified carbon emissions as the dependent variable group, with demographic transition, economic growth, industrial upgrading, and technological input serving as independent variables. Additionally, economic development was included as a control variable in constructing the regression model (Table 1).

3.2. The Carbon Emission Impact Model Based on Demographic Transition

Based on previous research [3] and the Cobb–Douglas production function (Y = AγKαLβ + ε, α + β + γ = 1), we presented a mechanistic model to evaluate the carbon emission impacts of demographic transition and subsequently decomposed the production function into four specific categories, as delineated here.
ln E D 1 + ln C E 2 = α γ ln T I 2 + β γ ln D T 1 + β γ ln D T 2 + ε 0 ln E G 1 + ln E G 2 = α λ ln I U 2 + β γ ln D T 1 + β γ ln D T 2 + ε 1 ln E D 1 + 1 γ ln E E 1 = α γ ln T I 3 + β γ ln D T 1 + β γ ln D T 2 + ε 2 ln E D 1 = 1 γ ln T I 1 + α γ ln I U 1 + α γ ln E S 1 + β γ ln D T 1 + β γ ln D T 2 + ε 3
The particular production function (①) represents the impacts of demographic transition on economic output and CO2 emissions. The industrial upgrading function (②) illustrates the impact of demographic transition on economic growth and CO2 emission growth in the context of industrial upgrading and energy efficiency improvement. The Individual function (③) demonstrates how demographic transition affects per capita economy under the condition of increasing per capita R&D investment. The clean energy function (④) shows the influence of demographic transition on per capita economy and per capita CO2 emissions with adjustments to the energy structure and upgrades to the industrial structure.

3.3. Operation Mechanism

Due to shifts in the age distribution of the population, there are significant changes in the sizes of different age groups, leading to carbon emission impacts from demographic transition. Some of these impacts are directly related to household energy consumption and living habits. Additionally, population aging indirectly impacts carbon emissions through production and ecology. Furthermore, rapid urbanization has direct or indirect impacts on population aging in terms of lifestyle, production, and ecology. This results in complex trade-offs that make quantitative research more challenging. In conclusion, there is a causal relationship between demographic transition and carbon emissions, which we illustrate in Figure 1 by mapping the carbon emission impacts of demographic transition. Therefore, we conducted a quantitative analysis of the carbon emission impacts of demographic transition around the globe based on C–D production function.

4. Results

Before initiating the regression analysis, we conducted unit root tests and co-integration analysis to ensure stable data through Stata17.0. To minimize the impact of varying dimensions of different variables, we initially applied a logarithmic transformation to each variable. The results passed significance and heteroscedasticity tests using SPSS26.0. We then validated the influence of demographic transition on carbon emissions through theoretical analysis combined with relevant data and quantitatively determined the contribution rates of different core variables on the dependent variables using partition models to assess their correlation impacts. Finally, by calculating regression equations for each partition model, we obtained the linkage mechanism between demographic transition and other factors. Our partition models were constructed based on the annual CO2 emission growth rate, namely EG2 ≤ 0.0%; 0.0% < EG2 ≤ 5.0%; and EG2 > 5.0%. Ultimately, based on this classification (Table 2), we investigated the impact of demographic transition on carbon emissions using both overall models and partition models.

4.1. The Particular Production Function

Through the particular production function, the contribution rate of each variable was obtained (Figure 2). Next, regression models were used to derive the regression equations and coefficients for each variable (Table 3).
In terms of economic output, DT2 and DT1 are the primary drivers of ED1. Among them, ED1 increases by 2.14% for every 1% increase in DT2. ED1 increases by 0.58% for every 1% increase in DT1. ED1 increases by 0.16% for every 1% increase in TI2. Specifically, DT1 and DT2 encourage variously the ED1 of 66 countries, as shown in Table 3 and Figure 2, while clear classifications appear. There is significant heterogeneity in the contribution rate of DT2 to ED1. This means that DT1, DT2, and TI3 all have positive impacts on ED1. In these countries, the contribution rate is at its lowest when EG2 ≤ 0.0%, while it is the highest when EG2 > 5.0%. Similarly, the contribution rate of TI2 to ED1 gradually increases as EG2 increases. However, there is an inverted U-shaped curve, that is, compared to EG2 ≤ 0.0% (Figure 2b), and the contribution of DT1 decreases when 0.0% < EG2 ≤ 5.0% (Figure 2c) but increases when EG2 > 5.0% (Figure 2d).
In terms of pollution emissions, DT1 is the primary driver of CE1 (Table 3). CE1 decreases by 0.94% for every 1% increase in DT1. CE1 decreases by 0.82% for every 1% increase in DT1. However, CE1 increases by 0.63% for every 1% increase in TI2. Specifically, TI2 encourages variously the CE1 of 66 countries (Table 3 and Figure 2). Regardless of the annual CO2 emission growth rate, the contribution rate of TI2 to CE1 is absolute, resulting in minimal contributions from other variables. Among them, TI2 has an obviously positive impact on CE1. Conversely, DT1 and DT2 have little negative impact on CE1.

4.2. The Industrial Upgrading Function

Through the industrial upgrading function, the contribution rate of each variable was obtained (Figure 3). Next, regression models were used to derive the regression equations and coefficients for each variable (Table 4).
In terms of economic growth, IU2 contributes significantly to driving EG1. In the solution 1 (EG1 > 0) area, for every 1% increase in IU2, EG1 decreases by 0.69%. EG1 only decreases by 0.12% and 0.09% for every 1% decrease in DT1 and DT2, respectively. Specifically, the influence of IU2 on economic growth varies among the majority of the 163 countries, with diverse impacts on EG1. Notably, there is considerable heterogeneity in how IU2 affects EG1. The negative impacts of IU2 on EG1 increase as EG2 increases (Figure 3).
In terms of pollution growth, DT1 and DT2 are the dominant factors in EG2. In the solution 1 (EG1 > 0) area, EG2 decreases by 0.39% for every 1% increase in DT2. EG2 decreases by 0.33% for every 1% increase in DT1. EG2 decreases by 0.23% for every 1% increase in IU2. Specifically, DT1 and DT2 mitigate pollution emissions in most of the 163 countries, achieving various levels of decrease in EG2. The contribution rate of DT2 to EG2 is positive at EG2 ≤ 0.0%, the contribution rate transitions from positive to negative as EG2 rises, and the negative contribution rate is greater than 0.0% < EG2 ≤ 5.0% at EG2 > 5.0% in Figure 3. Meanwhile, the contribution rate of DT1 to EG2 is negative in both the overall model and the partition model, with 0.0% < EG2 ≤ 5.0% (Figure 3f).

4.3. The Individual Function

Through the individual function, the contribution rate of each variable was obtained (Figure 4). Next, regression models were used to derive the regression equations and coefficients for each variable (Table 5).
DT2 has a strong correlation with the increase in ED1. Specifically, a 1% increase in DT2 is associated with an 0.81% increase in ED1. Furthermore, a 1% rise in TI3 corresponds to a 0.48% increase in ED1. However, the impact of DT1 is not considered significant. Notably, the upsurge in TI3 serves as a stimulus for the economy across most of the examined 66 countries, leading to varying levels of achievement regarding ED1. However, there exists discernible heterogeneity concerning the contribution of TI3; this heterogeneity intensifies as ES1 increases. This relationship exhibits an inverted U-shaped curve, that is, compared to EG2 ≤ 0.0% (Figure 4b); the contribution of TI3 increases when 0.0% < EG2 ≤ 5.0% (Figure 4c), while it decreases when EG2 > 5.0% (Figure 4d). However, the contribution of DT2 increases with an increase in EG2. Conversely, the influence of DT2 amplifies with increasing EG2 and also contributes to economic growth across most countries at various levels.
In terms of per capita pollution emissions, DT2 is more strongly correlated with EE1. With each 1% rise in DT2, EE1 increases by 1.12%. In addition, TI3 has a lower positive contribution (0.17%). Specifically, the increase in TI3 affects pollution emissions in most of the 66 countries, achieving an increase in EE1. The contribution rate of DT2 varies significantly, with the highest rate observed in countries where EG2 exceeds 5.0% (Figure 4h), while it is the lowest in these countries when EG2 ≤ 0.0% (Figure 4f). Similarly, the contribution rate of DT2 also varies significantly. The countries exhibit the highest contribution rate when EG2 ≤ 0.0% (Figure 4f), while the contribution rate is the lowest in these countries when 0.0% < EG2 ≤ 5.0% (Figure 4g). This means that TI3 and DT2 have a positive impact on EE1.

4.4. The Clean Energy Function

Through the clean energy function, the contribution rate of each variable was obtained (Figure 5). Next, regression models were used to derive the regression equations and coefficients for each variable (Table 6).
In terms of per capita economy, DT2 and DT1 play a major role in influencing ED1. Specifically, for every 1% increase in DT2, there will be an increase of 2.10%, 0.64%, 0.33%, and 0.07%, respectively, in DT1, TI1, ES1, and ED1. However, the impact of IU1 is not considered significant. In particular, TI1 promotes economic growth in most of the 61 countries studied, leading to varying levels of ED1. There is noticeable diversity in how much TI1 contributes to this impact: it has the greatest impact on countries where EG2 ≤ 0.0%, while its influence is lowest in those with 0.0% < EG2 ≤ 5.0% (see Figure 5).

5. Discussion

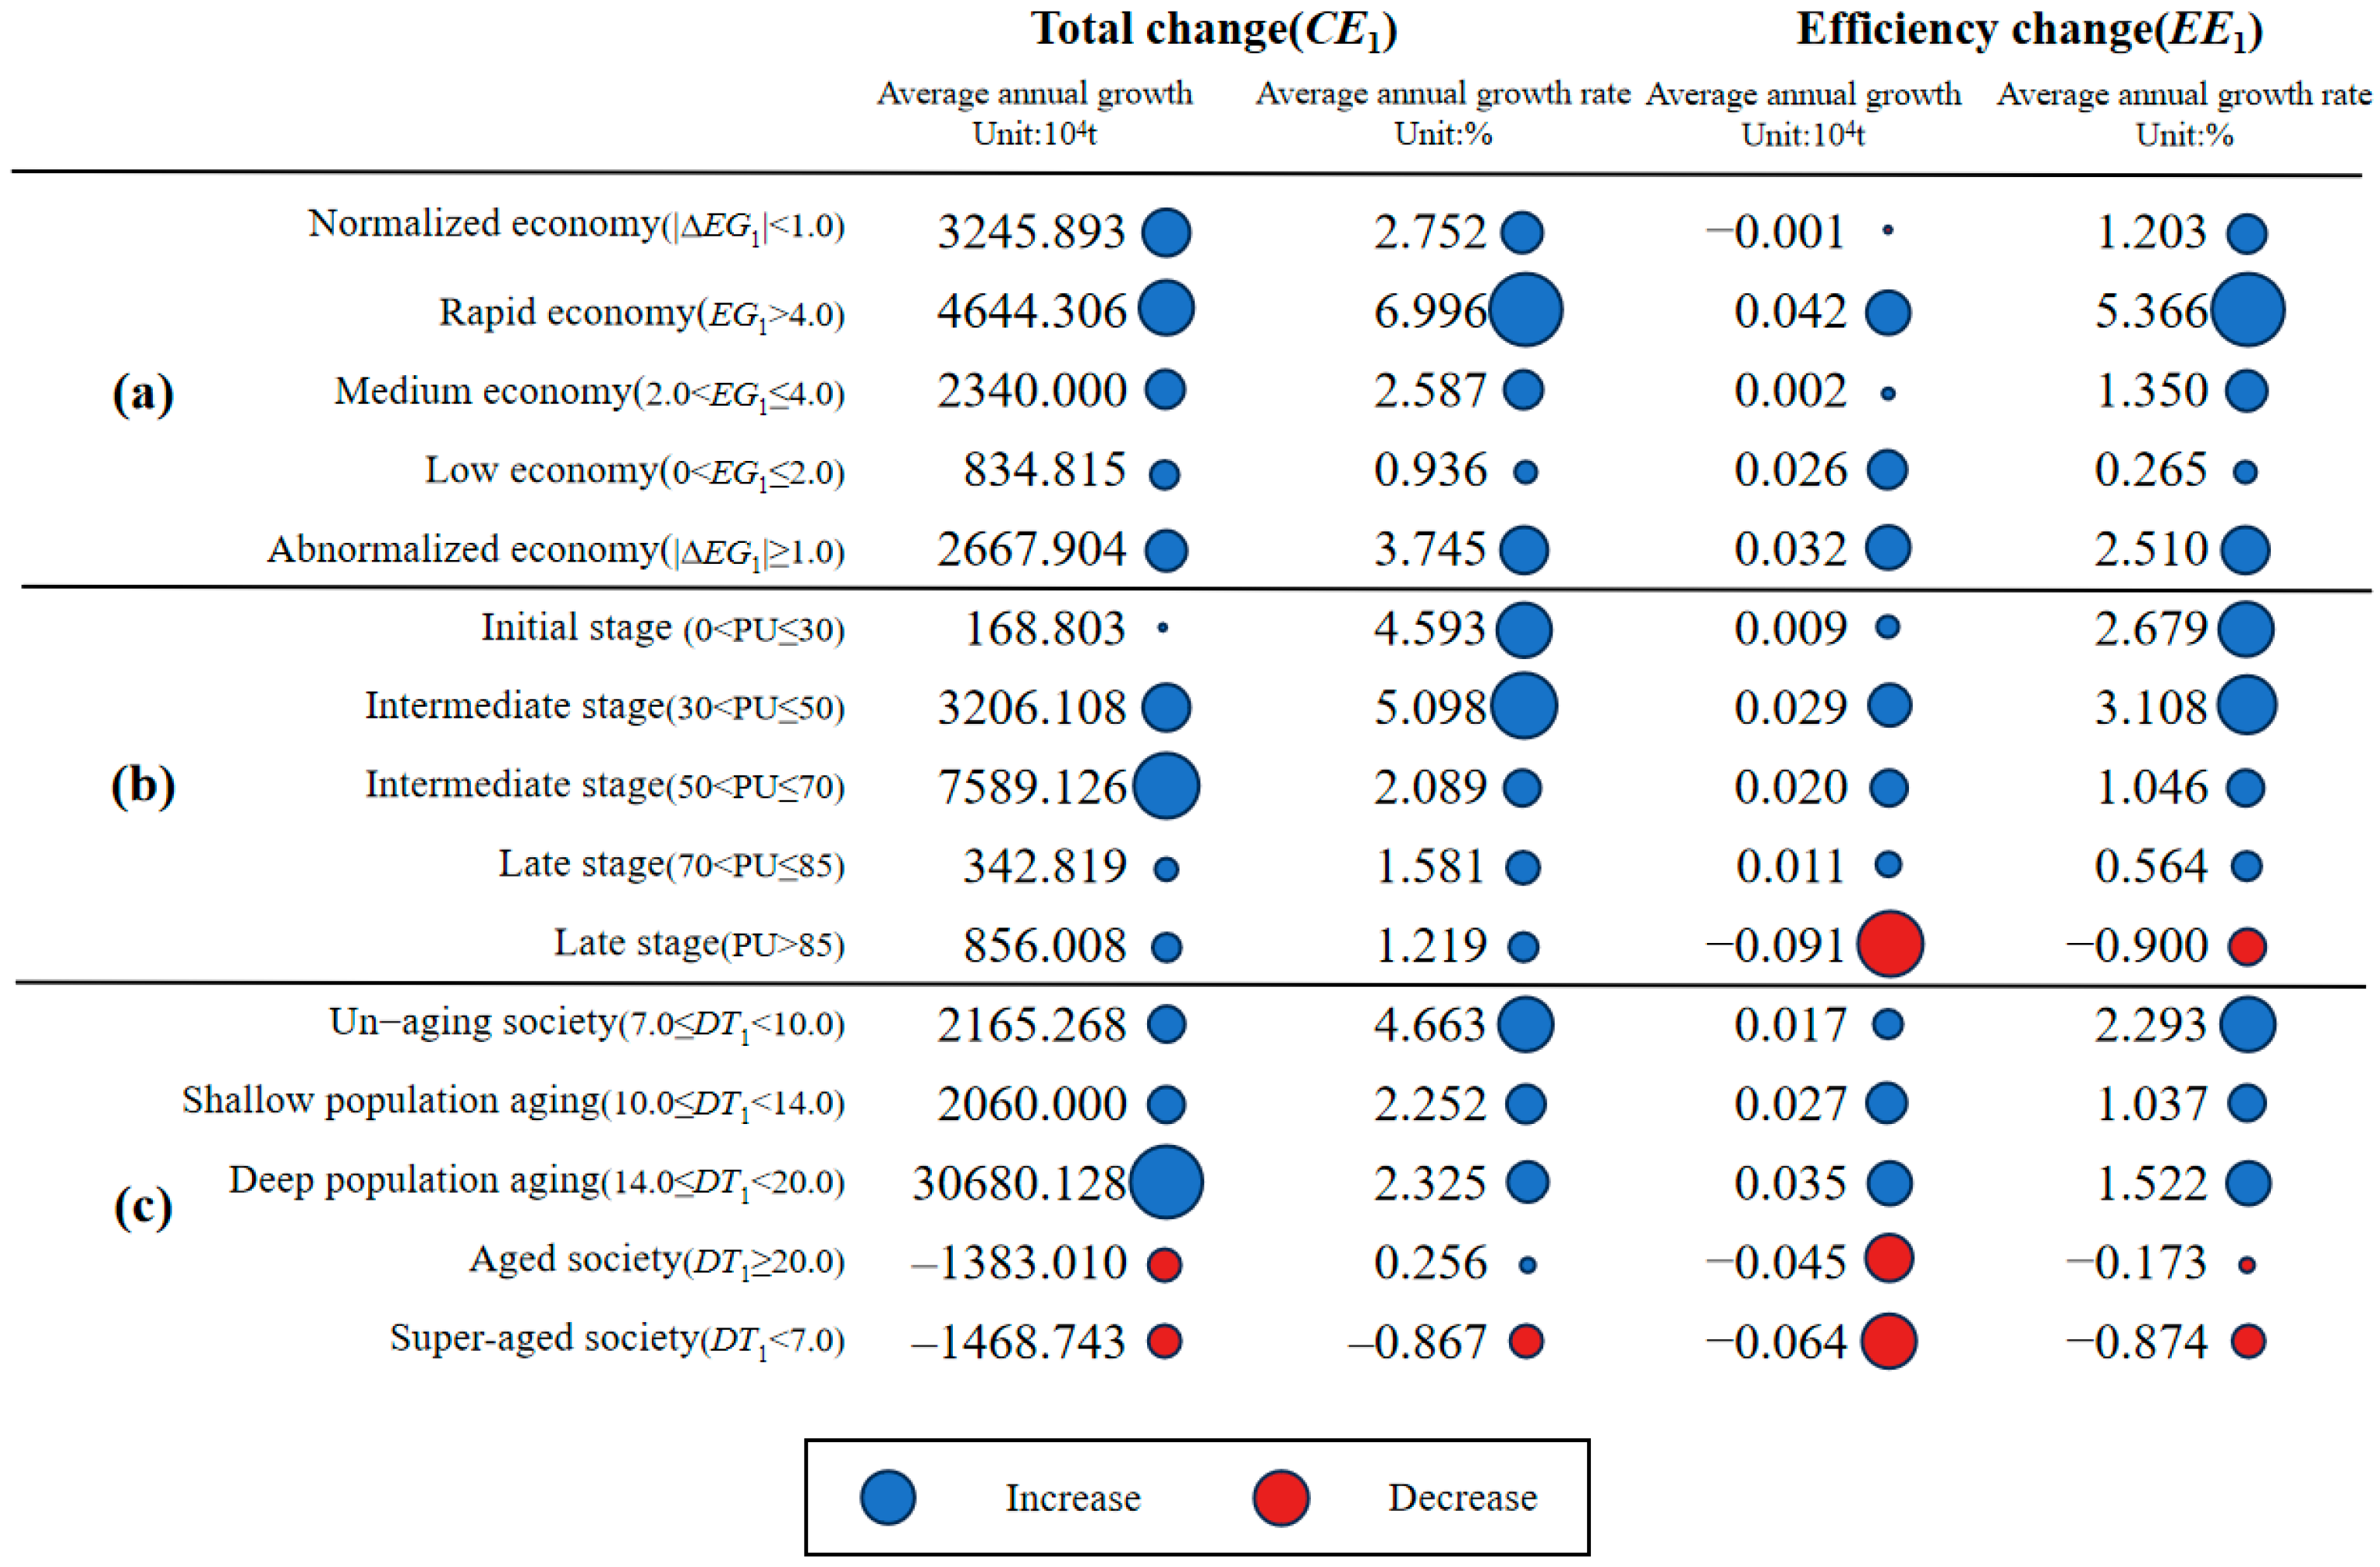
We categorized changes in total carbon emissions and changes in efficiency in 187 countries, with complete data according to the economic stage, the urbanization stage, and the population aging stage (Figure 6). In terms of economic stages, the normalized economy has a lower average annual growth rate of carbon emissions compared to the abnormalized economy. In addition, there is obvious spatial heterogeneity among the various types of economies. Among them, carbon emissions are growing at an average annual rate of less than 1% in low-economy countries, among which, some countries, represented by France and Germany, have already achieved a “carbon peak” and low-carbon transition. However, carbon emissions have increased significantly, with an average annual growth rate of nearly 7%, in countries with rapid economies, represented by low–middle-income countries in Asia and Africa.
From the perspective of urbanization stages, with population urbanization, the growth trend of CO2 emissions shows an upward and then a downward trend. Meanwhile, the average annual growth rate of CO2 emissions in countries in the late stages of urbanization is about 1.44%, which is only two-fifths of that in intermediate-urbanization-stage countries and one-third of that in the early-urbanization countries. CO2 emissions have already shown a negative growth trend in European countries in the late urbanization stage, such as Denmark, Finland, and Sweden. From the perspective of population aging stages, with the process of population aging, the growth of CO2 emissions is on a downward trend, but carbon emissions continue to grow at a high rate in the un-aging countries. CO2 emissions are on a negative growth trend in countries with an aged society and a super-aged society. Based on the earlier model analysis, it is evident that there are notable variations in the impacts of demographic transition on carbon emissions.

5.1. The Impacts of Demographic Transition on Carbon Emissions

Considering the impacts of additional factors, the findings from regression analysis (Table 3, Table 4, Table 5 and Table 6) and basic statistics on demographic transition and various economic stages (Figure 6 and Figure 7) are presented. The results show that DT1 and DT2 have a strong positive correlation with economic development and contribute positively to the growth of ED1, while DT1 and DT2 contribute negatively to CE1, EG1, and EG2. Meanwhile, demographic transition will ultimately reduce carbon emissions to some extent.
The environmental impact of population urbanization is mainly reflected in the changes in CO2 emissions (CE1) at different urbanization stages. Specifically, the annual growth rate of per capita CO2 emissions (EE1) exceeds 2.0% in countries in the initial stage and the intermediate urbanization stage and even exceeds 5.0% in countries with 30% < PU ≤ 50%, which is much higher than that in countries in the late urbanization stage. However, per capita CO2 emissions (EE1) show a negative growth rate in countries with an urbanization rate over 85% in the late urbanization stage.
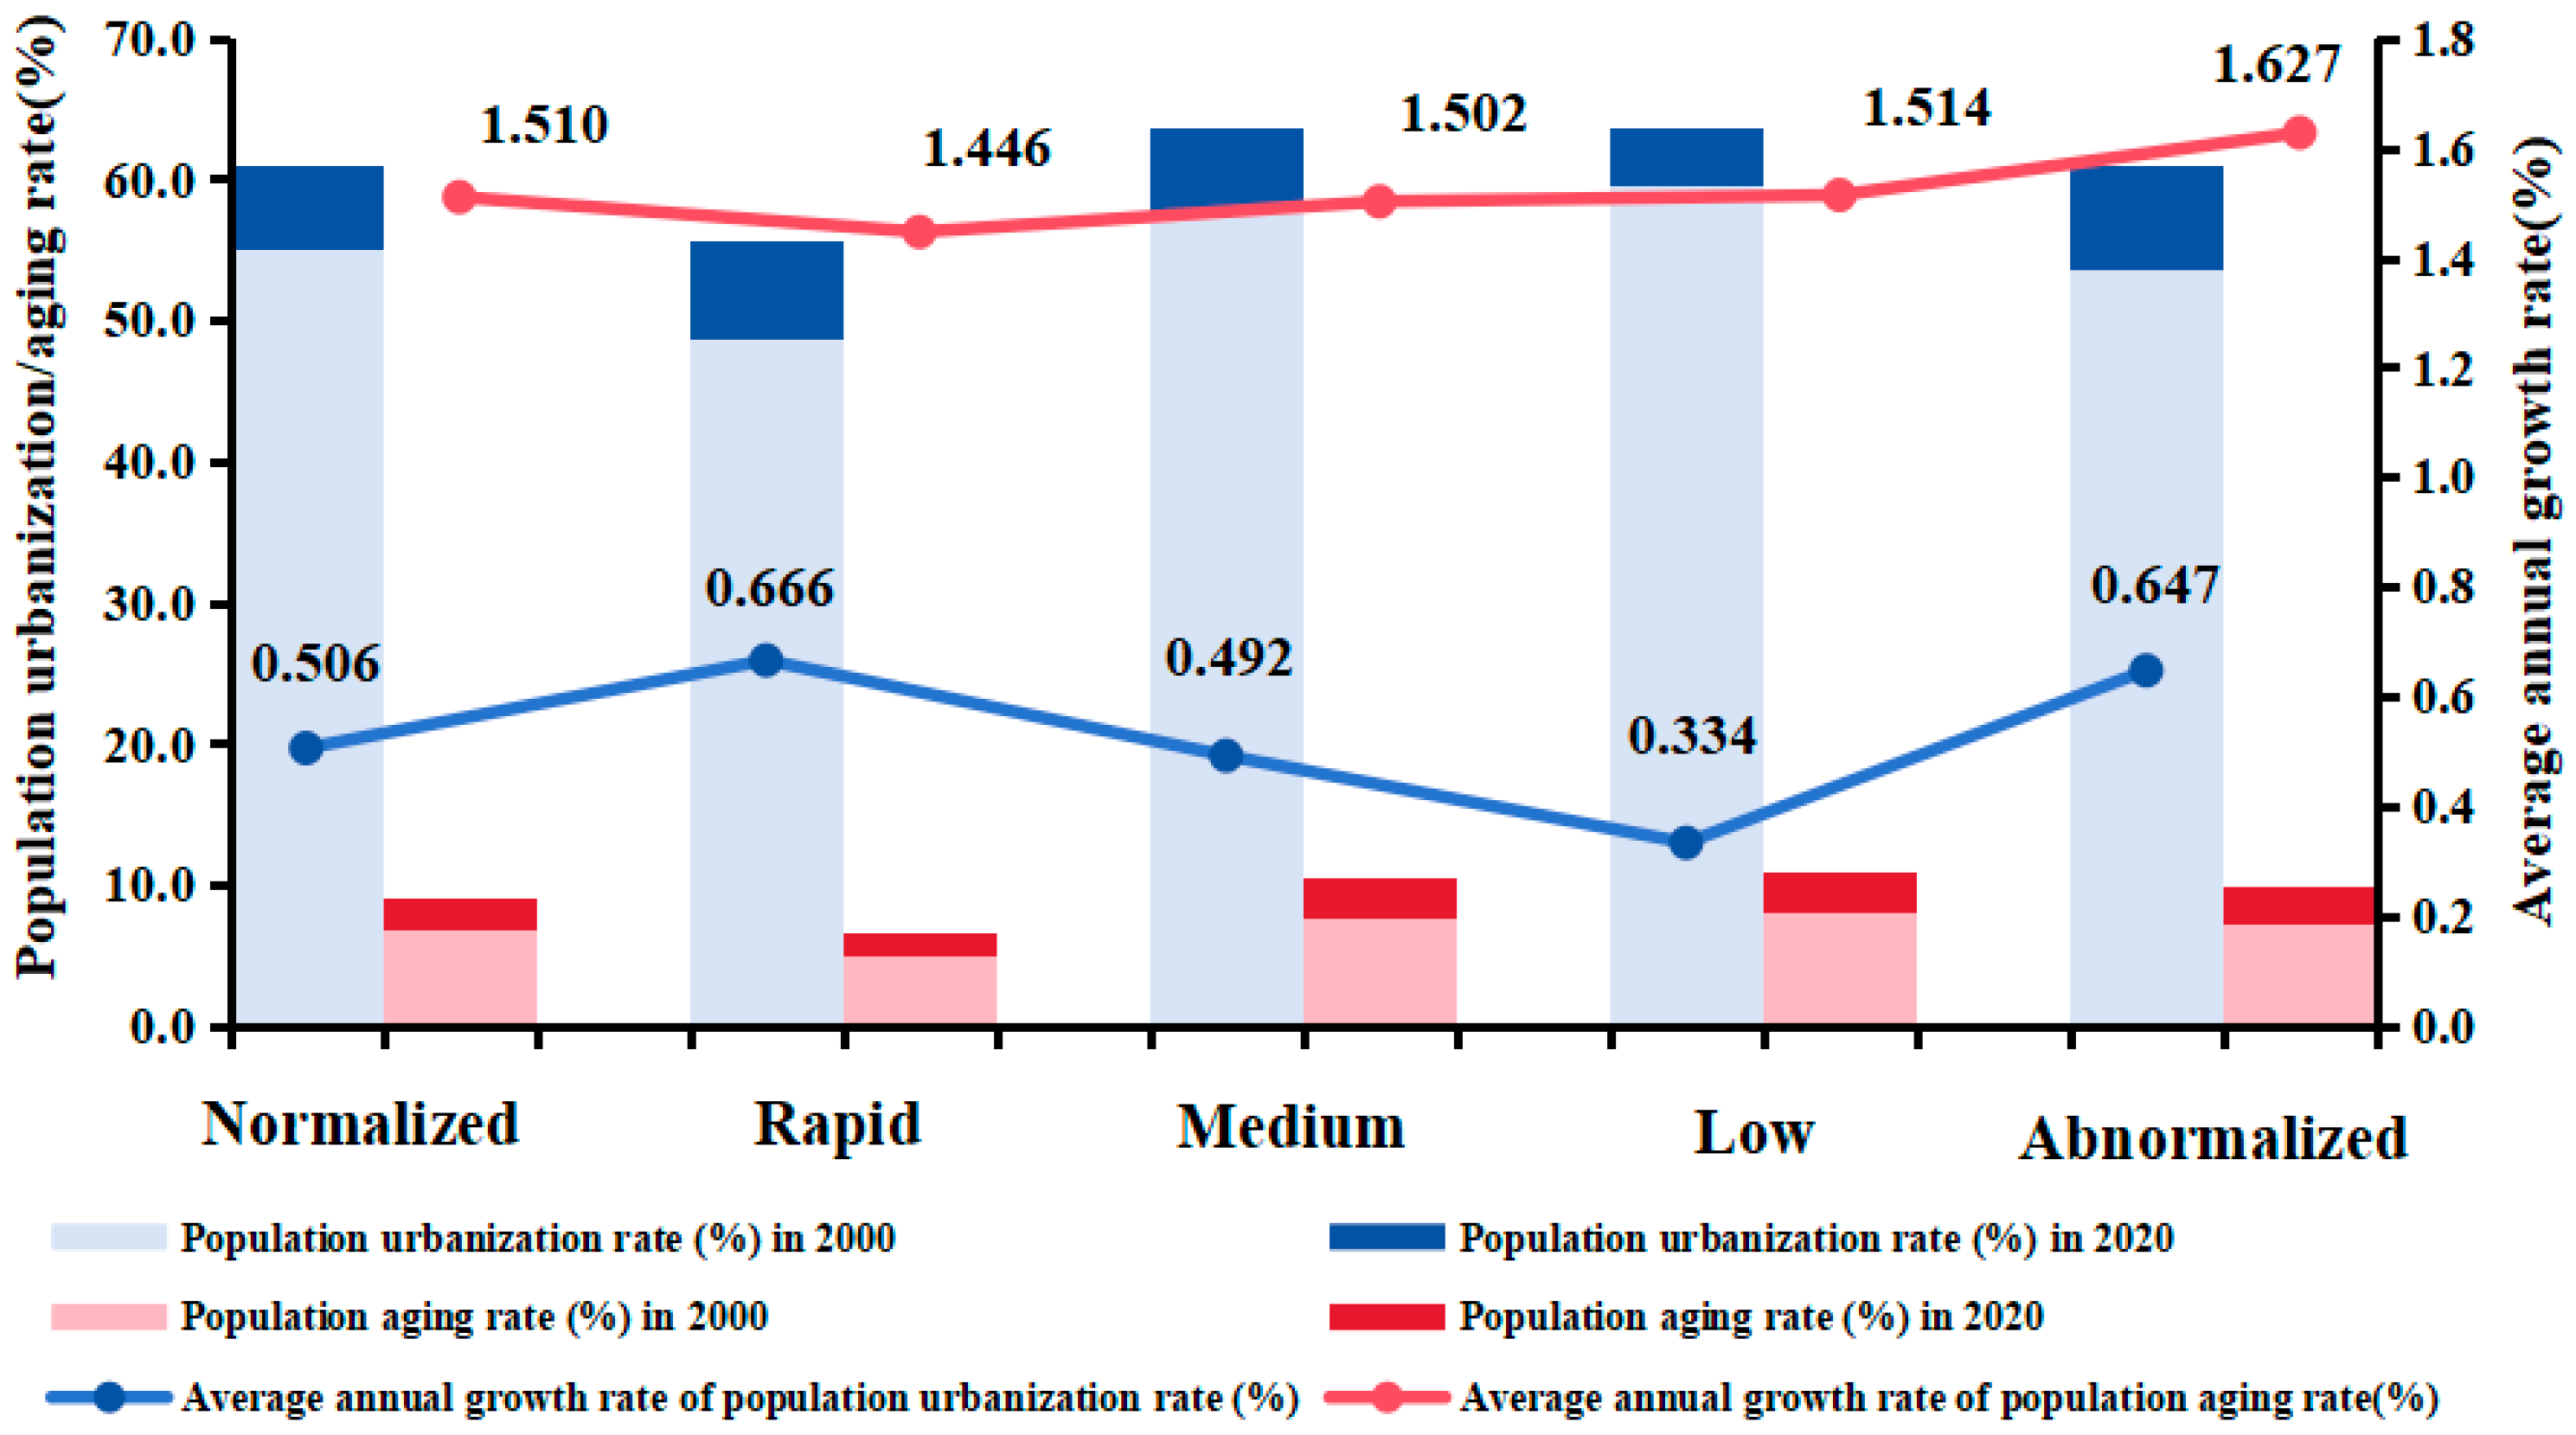
The impacts of population urbanization (DT2) on carbon emissions are also reflected in the differences in CO2 emissions (CE1) and per capita CO2 emissions (EE1) across different economies. In an abnormalized economy with a high growth of DT2 (Figure 7), the environmental impact of DT2 is higher than that in a normalized economy, and the increase in DT2 increases CE1. Among normalized economies, a highly developed rapid economy has the fastest growth of CE1, and a medium economy and a low economy have gradually decreasing average annual growth rates of CE1. It is clear that the higher demand for energy consumption leads to an increase in CE1 in the abnormalized economy and the rapid economy.
The impacts of population aging (DT1) on carbon emissions are also primarily manifested in CO2 emissions (CE1) in normalized economies, with CO2 emissions (CE1) in an aged society and a super-aged society showing a negative trend. This is closely related to the life pattern of the elderly, who are more inclined to a frugal lifestyle, which reduces CO2 emissions. The total CO2 emissions show a rising trend in a shallow-population-aging society and a deep-population-aging society. Most of these countries are lower–middle-income countries with a late start, and the current need for industrialization and transformation is still at a high level, resulting in rising CO2 emissions.
The environmental impact of population aging is also reflected in per capita CO2 emissions (EE1). The data show that the EE1 of an aged society and a super-aged society has entered a negative growth stage, with these countries mainly located in Europe and America. Conversely, the EE1 in countries with shallow- and deep-population-aging societies are still on an upward trend, such as those in Asia and Africa, unlike in countries with an aged society and a super-aged society. In nations with established economies over the long term, the impact of DT1 is primarily evident in the increase in CE1 during periods of rapid economic growth. This is because DT1 is low and the energy demand is high in the early stage of industrialization.

5.2. The EKC Test

Considering the influence of various factors on different economies, DT2 contributes to the growth of ED1 and ES1 to a certain extent, which inevitably increases EE1. There is an obvious and long-standing spatial heterogeneity in the carbon emission impacts of population urbanization, mainly conforming to an inverted U-shaped pattern (Figure 8). Among them, population urbanization and carbon emissions conform to an inverted U-shaped curve in a normalized economy, with the peak value occurring at around 82.56%. However, in an abnormalized economy, there is a certain linear relationship between population urbanization and CO2 emissions. Similarly, the relationship between population urbanization and carbon emissions shows a continuous trend in a low economy and a medium economy. However, in a rapid economy, the relationship between population urbanization and carbon emissions shows an inverted U-shaped curve, with an extreme value of 54.16%.
In most countries, CO2 emissions follow an inverted U-shaped curve with population aging (Figure 8). An extreme value of CO2 emissions in a normalized economy occurs at an approximate population aging rate of 13.00%. Among them, the relationship between population aging and CO2 emissions also shows an inverted U-shaped pattern in a rapid economy and a medium economy, with extremes of 10.07% and 12.32%, respectively. Before reaching the extremes, an increase in the rate of population aging raises CO2 emissions. After reaching the extremes, the population aging rate starts to have a dampening impact on the local economy. This is due to a decrease in the labor force and the potential strain on social welfare systems, which can lead to decreased productivity and an increased financial burden on the working-age population. However, in a low economy, there is a U-shaped curve between population aging and CO2 emissions. Simultaneously, as a result of the growing demand for medical and nursing services among the elderly population, combined with the rapid expansion of the global pension industry, there has been a rise in economic activities, contributing to an uptick in CO2 emissions.

6. Conclusions

6.1. Main Conclusions

Population aging and urbanization are two pivotal components of the current demographic transition, exerting a significant influence on both regional total CO2 emissions and per capita CO2 emissions. This study aimed to explore the carbon emission implications of demographic transition by examining the impact of population aging and urbanization. Drawing from empirical analysis around the globe, our key findings are as specified next.
Our research findings provide evidence that while demographic transition contributes positively to per capita economic growth, it, adversely, has a negative contribution to overall economic output and economic growth. Meanwhile, demographic transition will eventually reduce CO2 emissions to some extent. Based on different economies, the relationship between population urbanization and CO2 emissions mainly conforms to an inverted U-shaped curve, while some of it does to a linear growth pattern. There is obvious spatial heterogeneity in the carbon emission impacts across different urbanization regions, which is always present. Meanwhile, the relationship between population aging and CO2 emissions mainly conforms to an inverted U-shaped pattern. The environmental impact of population urbanization is significantly stronger than that of population aging. The impacts of the population urbanization rate on carbon emissions in rapid economies, with a much higher growth rate of population urbanization, are less than those in medium and low economies.

6.2. Policy Implications

Based on these conclusions, we propose the following policy implications:
(1)
The optimization of energy consumption structures should be pursued globally, with a focus on developing renewable resources, such as solar, nuclear, and tidal energy. Low-carbon industries should be actively developed and encouraged to achieve carbon-peak and carbon-neutral goals in terms of energy consumption.
(2)
Enhancements to public transportation networks are essential. With an increasing proportion of elderly individuals who tend to adopt frugal travel habits, there exists an opportunity to reduce carbon emissions within the transportation sector.
(3)
Technological innovation should be encouraged. With population urbanization, the agglomeration effect of technological innovation should not be ignored. Enterprises and research institutes can be encouraged to share technologies, such as clean energy and energy efficiency improvement, by setting up economic development zones, research and development funds, and tax incentives.
(4)
As there are obvious differences in the levels of global economic development, interregional cooperation should be strengthened to promote high-tech industries in all countries with a low economic level to achieve global energy conservation and emission reduction.

6.3. Research Prospects

Based on the traditional EKC theory, this paper adds demographic indicators to reinterpret the human–land relationship in the 21st century and explores the different impacts of global urbanization and population aging on carbon emissions. We hope that our findings can provide strong guidance for the carbon emission effects of demographic transition in various economies. However, there are some limitations of this paper. First, it is important to note that socio-economic variables are constrained in this paper, and control variables, such as levels of education, accessibility of health services, energy prices, and policy shifts, can be added in subsequent studies. A more comprehensive explanation of the important topic of strengthening the human–land relationship is required. Second, in the process of model construction, a classification study was conducted based on the economic level, the population urbanization rate, and the population aging rate, but the EKC results obtained after multi-sample classification reflect spatial heterogeneity and also weaken its universality. Third, when analyzing the correlation between demographic factors and carbon emissions, cross-sectional data were used, which resulted in regression outcomes lacking robustness compared to panel data analyses. Subsequent studies could use panel data for testing. How to solve these limitations will be the direction of our future research.

Author Contributions

Conceptualization, Z.P. and Z.W.; methodology, Z.P. and Z.W.; software, Z.P.; validation, Z.P.; data curation, Z.P., Z.W. and X.C.; writing—original draft preparation, Z.P. and Z.W.; writing—review and editing, Z.W.; funding acquisition, Z.W. All authors have read and agreed to the published version of the manuscript.

Funding

This research was supported by funding from the National Nature Science Foundation of China (grant number 42371194).

Institutional Review Board Statement

Not applicable.

Informed Consent Statement

Not applicable.

Data Availability Statement

The data presented in this study are available upon request from the corresponding authors.

Conflicts of Interest

The authors declare no conflicts of interest.

References

  1. Apergis, N.; Gupta, R.; Lau, C.K.; Mukherjee, Z. U.S. state-level carbon dioxide emissions: Does it affect health care expenditure? Renew. Sustain. Energy Rev. 2018, 91, 521–530. [Google Scholar] [CrossRef]
  2. Yang, X.; Li, N.; Mu, H.; Ahmad, M.; Meng, X. Population aging, renewable energy budgets and environmental sustainability: Does health expenditures matter? Gondwana Res. 2022, 160, 303–314. [Google Scholar] [CrossRef]
  3. Wang, Z.; Pan, Z.; Xu, Z.; Cui, X.; Zhang, X. How does demographic transition affect energy conservation? Evidences from the resource effects of global demographic transition. J. Clean. Prod. 2024, 2024, 140954. [Google Scholar] [CrossRef]
  4. Lewis, C.; Buffel, T. Aging in place and the places of aging: A longitudinal study. J. Aging Stud. 2020, 54, 100870. [Google Scholar] [CrossRef] [PubMed]
  5. Dalton, M.; O’Neill, B.; Prskawetz, A.; Jiang, L.; Pitkin, J. Population aging and future carbon emissions in the United States. Energ. Econ. 2008, 30, 642–675. [Google Scholar] [CrossRef]
  6. Hamza, N.; Gilroy, R. The challenge to UK energy policy: An ageing population perspective on energy saving measures and consumption. Energy Policy 2011, 39, 782–789. [Google Scholar] [CrossRef]
  7. Menz, T.; Welsch, H. Population aging and carbon emissions in OECD countries: Accounting for life-cycle and cohort effects. Energ. Econ. 2012, 34, 842–849. [Google Scholar] [CrossRef]
  8. Wang, W.; Liu, L.; Liao, H.; Wei, Y. Impacts of urbanization on carbon emissions: An empirical analysis from OECD countries. Energy Policy 2021, 151, 112171. [Google Scholar] [CrossRef]
  9. Zheng, H.; Long, Y.; Wood, R.; Moran, D.; Zhang, Z.; Meng, J.; Feng, K.; Hertwich, E.; Guan, D. Ageing society in developed countries challenges carbon mitigation. Nat. Clim. Change 2022, 12, 241–248. [Google Scholar] [CrossRef]
  10. Zhang, C.; Tan, Z. The relationships between population factors and China’s carbon emissions: Does population aging matter? Renew. Sustain. Energy Rev. 2016, 65, 1018–1025. [Google Scholar] [CrossRef]
  11. Fan, J.; Zhou, L.; Zhang, Y.; Shao, S.; Ma, M. How does population aging affect household carbon emissions? Evidence from Chinese urban and rural areas. Energ. Econ. 2021, 100, 105356. [Google Scholar] [CrossRef]
  12. Yu, B.; Wei, Y.M.; Kei, G.; Matsuoka, Y. Future scenarios for energy consumption and carbon emissions due to demographic transitions in Chinese households. Nat. Energy 2018, 3, 109–118. [Google Scholar] [CrossRef]
  13. Shi, G.; Lu, X.; Zhang, H.; Zheng, H.; Zhang, Z.; Chen, S.; Xing, J.; Wang, S. Air pollutant emissions induced by rural-to-urban migration during China’s urbanization (2005–2015). Environ. Sci. Ecotechnol. 2022, 10, 100166. [Google Scholar] [CrossRef] [PubMed]
  14. Wang, Z.; Cui, C.; Peng, S. How do urbanization and consumption patterns affect carbon emissions in China? A decomposition analysis. J. Clean. Prod. 2019, 211, 1201–1208. [Google Scholar] [CrossRef]
  15. Chen, J.; Wang, L.; Li, Y. Research on the impact of multi-dimensional urbanization on China’s carbon emissions under the background of COP21. J. Environ. Manage. 2020, 273, 111123. [Google Scholar] [CrossRef] [PubMed]
  16. Li, J.; Huang, X.; Chuai, X.; Yang, H. The impact of land urbanization on carbon dioxide emissions in the Yangtze River Delta, China: A multiscale perspective. Cities 2021, 116, 103275. [Google Scholar] [CrossRef]
  17. Lai, S.; Lu, J.; Luo, X.; Ge, J. Carbon emission evaluation model and carbon reduction strategies for newly urbanized areas. Sustain. Prod. Consump. 2022, 31, 13–25. [Google Scholar] [CrossRef]
  18. Zhou, C.; Wang, S.; Wang, J. Examining the influences of urbanization on carbon dioxide emissions in the Yangtze River Delta, China: Kuznets curve relationship. Sci. Total Environ. 2019, 675, 472–482. [Google Scholar] [CrossRef]
  19. Su, Y.; Wu, J.; Ciais, P.; Zheng, B.; Wang, Y.; Chen, X.; Li, X.; Li, Y.; Wang, Y.; Wang, C.; et al. Differential impacts of urbanization characteristics on city-level carbon emissions from passenger transport on road: Evidence from 360 cities in China. Build. Sci. 2022, 219, 109165. [Google Scholar] [CrossRef]
  20. Liu, B.; Tian, C.; Li, Y.; Song, H.; Ma, Z. Research on the effects of urbanization on carbon emissions efficiency of urban agglomerations in China. J. Clean. Prod. 2018, 197 Pt 1, 1374–1381. [Google Scholar] [CrossRef]
  21. Sun, W.; Huang, C. How does urbanization affect carbon emission efficiency? Evidence from China. J. Clean. Prod. 2020, 272, 122828. [Google Scholar] [CrossRef]
  22. Huang, Y.; Matsumoto, K. Drivers of the change in carbon dioxide emissions under the progress of urbanization in 30 provinces in China: A decomposition analysis. J. Clean. Prod. 2021, 322, 129000. [Google Scholar] [CrossRef]
  23. Sikder, M.; Wang, C.; Yao, X.; Huai, X.; Wu, L.; Yeboah, K.F.; Wood, J.; Zhao, Y.; Dou, X. The integrated impact of GDP growth, industrialization, energy use, and urbanization on CO2 emissions in developing countries: Evidence from the panel ARDL approach. Sci. Total Environ. 2022, 837, 155795. [Google Scholar] [CrossRef]
  24. Wang, S.; Xie, Z.; Wu, R.; Feng, K. How does urbanization affect the carbon intensity of human well-being? A global assessment. Appl. Energy 2022, 312, 118798. [Google Scholar] [CrossRef]
  25. Huo, T.; Li, X.; Cai, W.; Zuo, J.; Jia, F.; Wei, H. Exploring the impact of urbanization on urban building carbon emissions in China: Evidence from a provincial panel data model. Sustain. Cities Soc. 2020, 56, 102068. [Google Scholar] [CrossRef]
  26. Huo, T.; Cao, R.; Du, H.; Zhang, J.; Cai, W.; Liu, B. Nonlinear influence of urbanization on China’s urban residential building carbon emissions: New evidence from panel threshold model. Sci. Total Environ. 2021, 772, 145058. [Google Scholar] [CrossRef]
  27. Zhang, S.; Li, Z.; Ning, X.; Li, L. Gauging the impacts of urbanization on CO2 emissions from the construction industry: Evidence from China. J. Environ. Manage. 2021, 288, 112440. [Google Scholar] [CrossRef]
  28. Li, X. Study on the impact of energy rebound effect on carbon emission reduction at different stages of urbanization in China. Ecol. Indic. 2021, 120, 106983. [Google Scholar] [CrossRef]
  29. Zheng, S.; Wang, R.; Mak, M.W.T.; Hsu, S.; Tsang, C.W.D. How energy service companies moderate the impact of industrialization and urbanization on carbon emissions in China? Sci. Total Environ. 2021, 751, 141610. [Google Scholar] [CrossRef]
  30. Xu, Q.; Dong, Y.; Yang, R. Urbanization impact on carbon emissions in the Pearl River Delta region: Kuznets curve relationships. J. Clean. Prod. 2018, 180, 514–523. [Google Scholar] [CrossRef]
  31. Zhao, C.; Wang, B. How does new-type urbanization affect air pollution? Empirical evidence based on spatial spillover effect and spatial Durbin model. Environ. Int. 2022, 165, 107304. [Google Scholar] [CrossRef] [PubMed]
  32. Meng, G.; Guo, Z.; Li, J. The dynamic linkage among urbanisation, industrialisation and carbon emissions in China: Insights from spatiotemporal effect. Sci. Total Env. 2021, 760, 144042. [Google Scholar] [CrossRef] [PubMed]
  33. Lv, Q.; Liu, H.; Yang, D.; Liu, H. Effects of urbanization on freight transport carbon emissions in China: Common characteristics and regional disparity. J. Clean. Prod. 2019, 211, 481–489. [Google Scholar] [CrossRef]
  34. Xu, F.; Huang, Q.; Yue, H.; He, C.; Wang, C.; Zhang, H. Reexamining the relationship between urbanization and pollutant emissions in China based on the STIRPAT model. J. Environ. Manag. 2020, 273, 111134. [Google Scholar] [CrossRef] [PubMed]
  35. Lv, T.; Hu, H.; Zhang, X.; Wang, L.; Fu, S. Impact of multidimensional urbanization on carbon emissions in an ecological civilization experimental area of China. Phys. Chem. Earth. 2022, 126, 103120. [Google Scholar] [CrossRef]
  36. Wang, Q.; Wang, X.; Li, R. Does urbanization redefine the environmental Kuznets curve? An empirical analysis of 134 Countries. Sustain. Cities Soc. 2022, 76, 103382. [Google Scholar] [CrossRef]
  37. Li, B.; Haneklaus, N. The potential of India’s net-zero Carbon emissions: Analyzing the effect of clean energy, coal, urbanization, and trade openness. Energy Rep. 2022, 8, 724–733. [Google Scholar] [CrossRef]
  38. Muhammad, S.; Long, X.; Salman, M.; Dauda, L. Effect of urbanization and international trade on CO2 emissions across 65 belt and road initiative countries. Energy 2020, 196, 117102. [Google Scholar] [CrossRef]
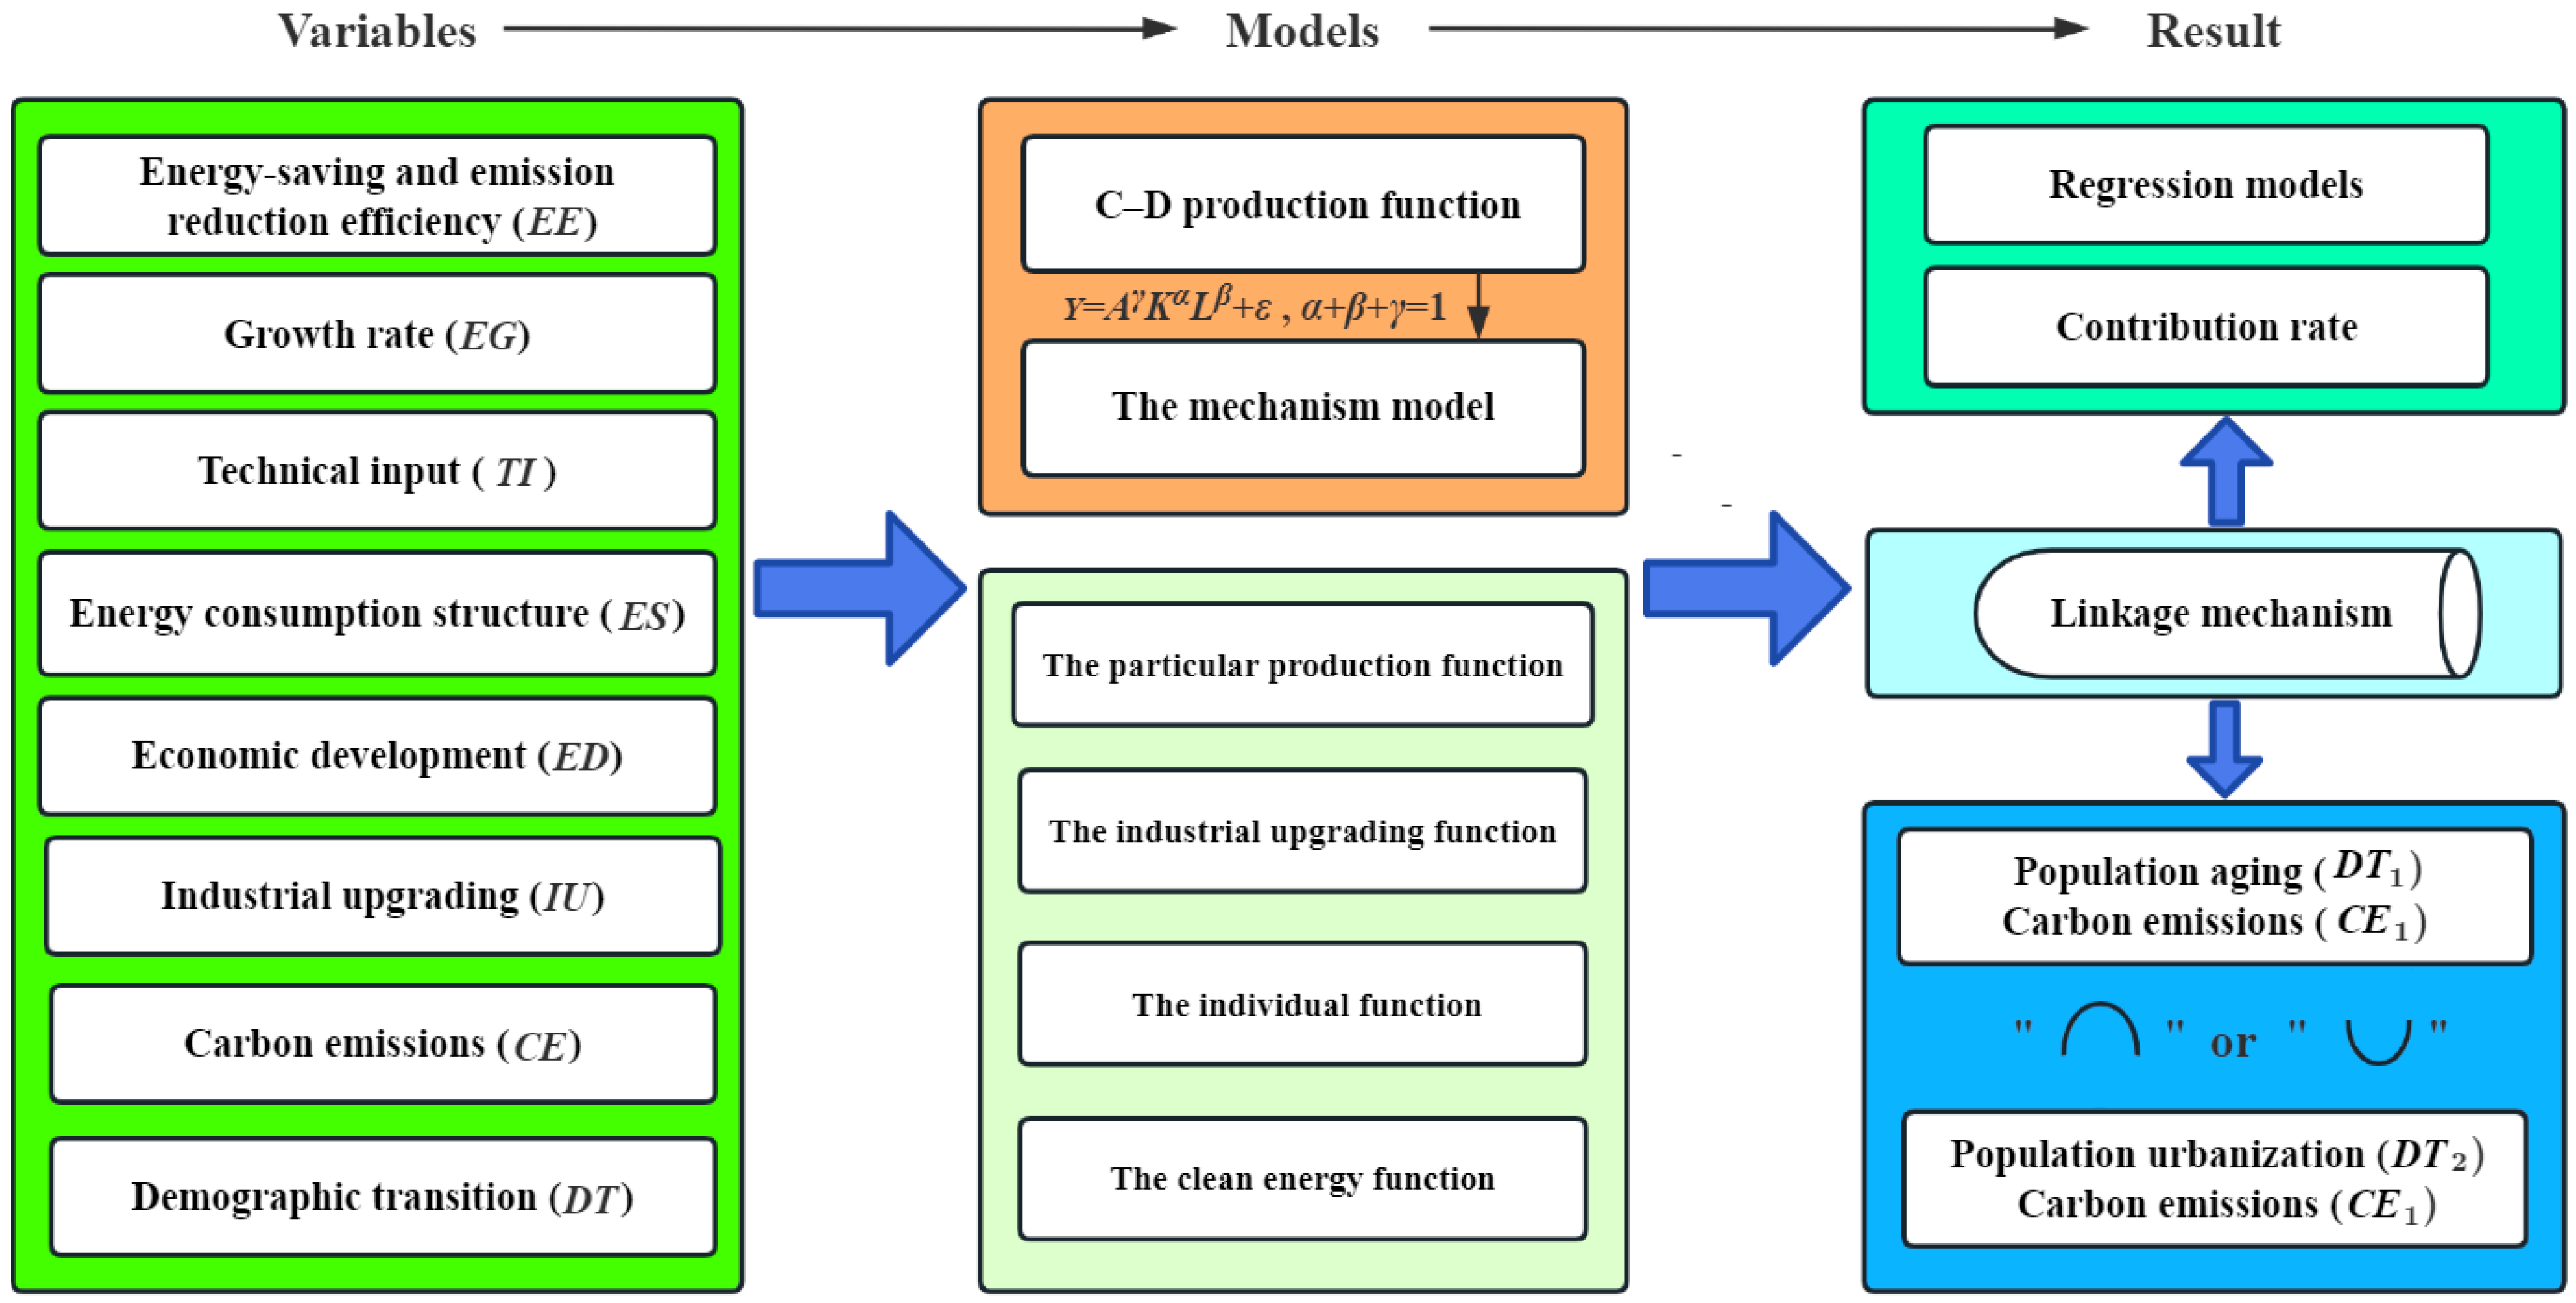
Figure 1. Mechanism diagram.
Sustainability 16 05168 g001
Figure 2. The contribution rates of various independent variables to ED1 and CE1 in the particular production function.
Sustainability 16 05168 g002
Figure 3. The contribution rates of various independent variables to EG1 and EG2 in the industrial upgrading function.
Sustainability 16 05168 g003
Figure 4. The contribution rates of various independent variables to ED1 and EE1 in the individual function.
Sustainability 16 05168 g004
Figure 5. The contribution rates of various independent variables to ED1 in the clean energy function.
Sustainability 16 05168 g005
Figure 6. The basic statistics of CO2 emissions related to economic stages (a), population urbanization stages (b), and population aging stages (c) during 2000–2020.
Sustainability 16 05168 g006
Figure 7. Demographic transition in different economies during 2000–2020.
Sustainability 16 05168 g007
Figure 8. The EKCs of the population urbanization rate (a), population aging rate (b), and CO2 emissions.
Sustainability 16 05168 g008
Table 1. Descriptive statistics of main data.
VariablesSpecific IndicatorsMeanStd. DeviationMax.Min.
Energy-saving and emission reduction efficiency (EE)Per capita CO2 emissions (t/person) (EE1)4.405.4447.700.02
Energy consumption structure (ES)Proportion of nuclear energy and other clean energy consumption in total energy consumption (%) (ES1)8.2610.6155.580.00
Carbon emissions (CE)CO2 emissions (104 t) (CE1)15,57371,6711,030,0003.00
Demographic transition (DT)Population aged 65 and above (% of total population) (DT1)7.815.4928.400.69
Urban population (% of total population) (%) (DT2)58.1824.04100.008.25
Growth rate (EG)Annual GDP growth rate (%/year) (EG1)3.335.63123.14−62.08
Annual CO2 emission growth rate (%/year) (EG2)3.4315.08350.00−74.75
Industrial upgrading (IU)Industry (including construction), value added (% of GDP) (IU1)26.3212.4794.703.15
Services, value added (% of GDP) (IU2)54.2112.8396.2010.86
Technical input (TI)R&D expenditure (% of GDP) (TI1)1.121.014.950.01
R&D investment (104 USD) (TI2)1,630,0005,570,00058,200,00075.68
Per capita R&D investment (104 USD/person) (TI3)0.040.050.210.00
Economic development (ED)Per capita GDP (USD/person) (ED1)15,216.4323,643.47189,487.10111.93
Table 2. Data included within every partition function.
FunctionPeriodSamples
EG2 ≤ 0.0%0.0% < EG2 ≤ 5.0%EG2 > 5.0%Subtotal
The particular production function2000–20185134602811254
The industrial upgrading function2000–2018111991510633097
The individual function2000–20185134602811254
The clean energy function2000–2014384332199915
Table 3. Regression statistics of the particular production function.
Dependent VariableClassificationRegression ModelR2Adjusted R2Fp-Value
ED1Overall E D 1 = D T 2 2.139 D T 1 0.575 T I 2 0.158 e 4.370 0.7260.7251102.5450.000
EG2 ≤ 0.0% E D 1 = D T 2 1.770 D T 1 0.651 T I 2 0.190 e 3.625 0.7150.713425.8290.000
0.0% < EG2 ≤ 5.0% E D 1 = D T 2 2.358 D T 1 0.590 T I 2 0.141 e 5.005 0.7110.709374.5780.000
EG2 > 5.0% E D 1 = D T 2 2.208 D T 1 0.393 T I 2 0.129 e 3.756 0.7020.699217.3630.000
CE1Overall C E 1 = e 3.860 T I 2 0.626 D T 1 0.939 D T 2 0.822 0.7010.701977.9550.000
EG2 ≤ 0.0% C E 1 = e 4.433 T I 2 0.624 D T 1 0.981 D T 2 0.941 0.6870.686373.2510.000
0.0% < EG2 ≤ 5.0% C E 1 = e 4.274 T I 2 0.670 D T 2 1.137 D T 1 0.933 0.7340.733420.3590.000
EG2 > 5.0% C E 1 = e 2.718 T I 2 0.585 D T 1 0.812 D T 2 0.390 0.6650.661183.3690.000
Table 4. Regression statistics of the industrial upgrading function.
Dependent VariableClassificationRegression ModelR2Adjusted R2Fp-Value
Solution 1: EG1 > 0
EG1Overall E G 1 = e 4.594 D T 1 0.121 D T 2 0.097 I U 2 0.694 0.0920.09192.4670.000
EG2 ≤ 0.0% E G 1 = e 3.878 D T 1 0.148 I U 2 0.628 0.0670.06531.4760.000
0.0% < EG2 ≤ 5.0% E G 1 = e 5.332 D T 2 0.172 I U 2 0.867 0.0820.08038.5280.000
EG2 > 5.0% E G 1 = e 4.104 I U 2 0.661 0.0580.05721.0840.000
EG2Overall E G 2 = e 4.426 D T 1 0.326 D T 2 0.384 I U 2 0.232 0.1160.115116.6330.000
EG2 ≤ 0.0% E G 2 = e 3.384 D T 2 0.574 0.0480.04639.4270.000
0.0% < EG2 ≤ 5.0% E G 2 = e 1.214 D T 1 0.304 0.0570.05652.5830.000
EG2 > 5.0% E G 2 = e 3.771 D T 1 0.087 D T 2 0.189 I U 2 0.148 0.0630.06022.4110.000
Solution 2: EG1 < 0
EG1Overall E G 1 = D T 2 0.361 e 6.058 D T 1 0.323 0.0240.0184.2470.015
EG2 ≤ 0.0% E G 1 = e 4.544 I U 2 0.961 0.0380.0349.2520.003
0.0% < EG2 ≤ 5.0% E G 1 = e 1.361 D T 1 0.732 0.0980.0795.2040.027
EG2Overall E G 2 = e 2.690 I U 2 0.441 D T 2 0.685 0.0880.08215.6530.000
EG2 ≤ 0.0% E G 2 = e 3.894 D T 2 0.530 0.0480.04411.0030.001
Table 5. Regression statistics of the individual function.
Dependent VariableClassificationRegression ModelR2Adjusted R2Fp-Value
ED1Overall E D 1 = e 3.993 D T 2 0.808 T I 3 0.480 0.8720.8722834.9410.000
EG2 ≤ 0.0% E D 1 = e 5.677 T I 3 0.535 D T 2 0.379 0.8870.8861329.7320.000
0.0% < EG2 ≤ 5.0% E D 1 = e 3.591 D T 2 0.897 T I 3 0.482 0.8700.8691014.5880.000
EG2 > 5.0% E D 1 = e 2.645 D T 2 1.194 T I 3 0.390 0.8220.820427.0060.000
EE1Overall E E 1 = D T 2 1.119 T I 3 0.172 e 3.881 0.5470.546502.7530.000
EG2 ≤ 0.0% E E 1 = D T 2 0.859 T I 3 0.163 e 2.867 0.4950.492166.2960.000
0.0% < EG2 ≤ 5.0% E E 1 = D T 2 0.947 T I 3 0.209 e 3.305 0.5640.562196.9730.000
EG2 > 5.0% E E 1 = D T 2 1.482 T I 3 0.166 e 5.252 0.5610.557118.1490.000
Table 6. Regression statistics of the clean energy function.
Dependent VariableClassificationRegression ModelR2Adjusted R2Fp-Value
ED1Overall E D 1 = D T 1 0.638 D T 2 2.088 T I 1 0.328 E S 1 0.067 e 0.956 0.7200.718484.0740.000
EG2 ≤ 0.0% E D 1 = e 1.514 D T 1 0.587 D T 2 1.756 T I 1 0.521 E S 1 0.044 I U 1 0.296 0.7280.724202.4280.000
0.0% < EG2 ≤ 5.0% E D 1 = D T 1 0.635 D T 2 2.166 T I 1 0.305 E S 1 0.085 e 1.638 0.6170.60765.2820.000
EG2 > 5.0% E D 1 = D T 2 2.091 T I 1 0.184 D T 1 0.570 e 1.469 0.6860.67884.3260.000
Disclaimer/Publisher’s Note: The statements, opinions and data contained in all publications are solely those of the individual author(s) and contributor(s) and not of MDPI and/or the editor(s). MDPI and/or the editor(s) disclaim responsibility for any injury to people or property resulting from any ideas, methods, instructions or products referred to in the content.