Article

The Impact of Digital Trade Barriers on Technological Innovation Efficiency and Sustainable Development

School of Economics, Huazhong University of Science and Technology, Wuhan 430074, China
*
Author to whom correspondence should be addressed.
Sustainability 2024, 16(12), 5169; https://doi.org/10.3390/su16125169
Submission received: 30 April 2024 / Revised: 14 June 2024 / Accepted: 14 June 2024 / Published: 18 June 2024
(This article belongs to the Special Issue Digital Transformation and Innovation for a Sustainable Future)

Abstract

:
The global digitization trend provides a favorable development environment for the efficient acquisition of knowledge and technology. However, restrictions imposed by countries on digital trade have hindered this trend. This study is based on 60 sample countries to study the impact of the digital trade barrier (DTB) on the technology innovation efficiency (TIE) of each country and the pathways from 2014 to 2020. Research finds that DTB significantly inhibits TIE. Among the five different policy fields that form DTB, Infrastructure and Connecting DTB and Other DTB have the greatest negative impact on TIE. A mechanism analysis found that DTB increases the difficulty of acquiring knowledge spillover and the high cost of research and development, leading to the mismatch and low efficiency of innovation resources, ultimately leading to a reduction in technological innovation efficiency in various countries. Participating in international technological innovation networks and improving technological innovation capabilities have a moderating effect on the aforementioned negative impacts that is beneficial for the sustainable development of national technological innovation. Heterogeneity tests indicate that countries with weaker innovation capabilities, low- and middle-income countries, and countries that have not joined the OECD have a more significant negative impact. This study serves as an important reference for the government to adjust digital trade policies and guide the effective use of external resources for sustainable and efficient technological innovation.

1. Introduction

Nowadays, countries that master high tech have the initiative and competitive advantage [1]. How to improve the efficiency of technological innovation is a problem that countries have been seeking breakthroughs in [2]. Compared with closed innovation that builds high external knowledge and technology barriers and refuses to exchange technology with foreign countries, promoting open innovation, that is, reducing barriers to foreign knowledge and technology exchange and absorbing innovation resources globally, has gradually become a key measure for countries to promote their own technological progress and improve innovation efficiency [3]. Open innovation requires actively acquiring advanced knowledge and technology from abroad and conducting innovation cooperation [4]. In the past, international trade and investment were the two traditional channels for knowledge spillover effects, providing convenience and possibility for countries to learn from advanced foreign technologies and experiences [5,6]. It promotes the redistribution of intangible assets and thus improves the technology innovation efficiency (TIE) [7]. In recent years, affected by political frictions and the COVID-19, global economic growth has slowed down, and anti-globalization has emerged. However, as an emerging and active area of global economic development, digital trade has provided new growth opportunities for countries. The United Nations Conference on Trade and Development (UNCTAD) [8] announced that digital trade reached USD 3.82 trillion in 2022, an increase of 3.9% compared to 2021. Compared with traditional trade, the characteristics of digital trade are highlighted in two aspects: the digitization of trade methods and the digitization of trade targets. Digital trade naturally has a high degree of internationalization [9], and its subject matter is also one of the elements of technological innovation. Therefore, countries need to pay attention to its impact on the efficiency of technological innovation [10]. However, the rise of non-tariff barriers, represented by the digital trade barrier (DTB), has attracted widespread attention [11,12]. Among them, digital trade restrictions, such as intellectual property infringement, information protection, and cross-border data-flow restrictions, have profoundly affected the efficiency of technological innovation on a global scale.
Although the existing research has achieved several results in discussing traditional trade and technological innovation, there is still no unified view on the efficiency of DTBs and technological innovation. Some scholars believe that trade barriers hinder domestic access to foreign knowledge spillovers, thereby hindering domestic technological innovation [13]; and some scholars believe that trade barriers are beneficial for protecting domestic research and development achievements and intellectual property rights, thereby increasing domestic technological innovation enthusiasm [14]. Compared with innovation input or output indicators, efficiency, as an important reflection of a country’s technological innovation capability, better reflects a country’s resource-utilization capacity [15]. The existing literature on DTBs mostly focuses on industry- and enterprise-level data, and the negative impact of DTBs on export volume [16], export quality [17], and value-chain length has been confirmed.
Based on the above background, the research question of this study was whether DTBs have a sustainable negative impact on technological innovation efficiency as speculated. If so, through what channels and mechanisms do DTBs affect technological innovation efficiency? Is there any method that can effectively alleviate the negative impact of DTBs on technological innovation efficiency? Is this effect sustainable? To answer these questions, this study attempted to combine an empirical analysis with a mechanism analysis to elucidate how a DTB affects TIE in order to further deepen innovation-driven research and continue the development of trade and technological innovation theories. The possible contributions of this study are as follows. (1) Reliable data sources: This study used accurate indicators from OECD, WIPO, and World Bank databases at the national level, filling the empirical analysis gap of DTB and TIE at the macro level. (2) Detailed description of DTB: Compared with previous studies, the analysis of the five sub-indicators of DTBs provided a clearer understanding of the sources of hindrance effects. (3) Mechanism analysis: This revealed the mediating and moderating variables that hinder the role, providing a basis for countries to deepen independent innovation and strengthen international cooperation. (4) Comparative analysis: A comparative analysis was conducted on the impact of obstacles on countries of different natures, making the research results more targeted.

2. Literature Review

International trade is not only about the global flow of factors or products but also reflects the diffusion of technology and knowledge between different countries [18]. The development of the contemporary global innovation cannot be separated from the free transmission of data [19]. In analyzing traditional trade and technological innovation, some of the literature points out that, in economic cooperation with developed countries, enterprises’ access to innovative resources through import learning effects and export learning effects ultimately promotes national economic development [20,21,22]. Refs. [23,24] believe that, in the era of globalization, research and development activities are no longer limited to the domestic. Innovative resources such as technology and knowledge are allocated globally by multinational corporations, and technology transfer has become an important way for a country to achieve technological innovation. However, international technology transfer and diffusion are influenced by government intervention measures and political and legal environments. Cory [25] conducted a statistical analysis on the types of data restricted by cross-border data flows and found that technical data are the subject of data restriction policies in various countries. Accordingly, countries may impose restrictions on data spillovers due to property rights issues.
The current common view regarding trade barriers is that there are two positive and negative impact paths on the country’s technological innovation. On the one hand, some scholars believe that DTBs have negative effects. Due to the externalities of knowledge and technology, a country participating in trade activities gains the possibility of knowledge or technology transfer, while trade barriers hinder trade exchanges between countries and reduce spillover effects from other countries, thus impeding the development of innovation [26,27]. In terms of digital trade, various digital protection measures implemented by countries to protect domestic enterprises, especially tariffs and technical trade barriers, not only fail to promote innovation but are actually detrimental to innovation [28,29,30]. Meltzer [31] believes that blocking copyright in digital trade can damage domestic trade profits. Balancing copyright rules is more conducive to improving domestic trade profits and strengthening enterprise research and development levels. On the other hand, some scholars believe that trade barriers protect the domestic market and reduce competition between the domestic and foreign innovation industries, which makes underdeveloped countries get rid of the dilemma of low-end lock-in in high-tech industries and promotes domestic independent innovation [32]. Li et al. [33] demonstrated that non-tariff barriers between trading partner countries form a forced mechanism and have a positive impact on enterprise innovation. Xie [34] believes that trade barriers form a demonstration effect and a reverse forcing effect on innovation in China, with a restraining effect from a short-term perspective and a growth effect from a long-term perspective. In summary, whether the impact of DTBs aimed at protectionism on the efficiency of national technological innovation is positive or negative remains to be discussed.
Currently, some of the literature links digital economy, innovation, and sustainable development. The digital economy orientation has been proven to promote digital ecological innovation towards sustainable development goals [35]. Business and society are undergoing digital development, and some scholars have de-fined Digital Business Model Innovation (DBMI), but empirical discussions have not yet been conducted [36]. In the era of tradable natural resources, digital innovation can achieve sustainable development [37]. Digitization is the main prerequisite for sustainable digital innovation, which enables small- and medium-sized enterprises to reduce resource waste and strengthen sustainable economic activities [38]. When expanding our perspective towards a sustainable future, Alsharah and Alsaeedi [39] proposed that digital transformation can be achieved through innovative tools to promote low-carbon and more sustainable economic transformation. In addition, in terms of the methodology for digital quantification, Annarelli et al. [40] predicted the competitive advantage and economic value obtained by adopting product service systems by estimating the value of service orientation. At present, there is no literature that focuses on the impact of DTB on the sustainability of technological innovation efficiency, which is addressed in this study.

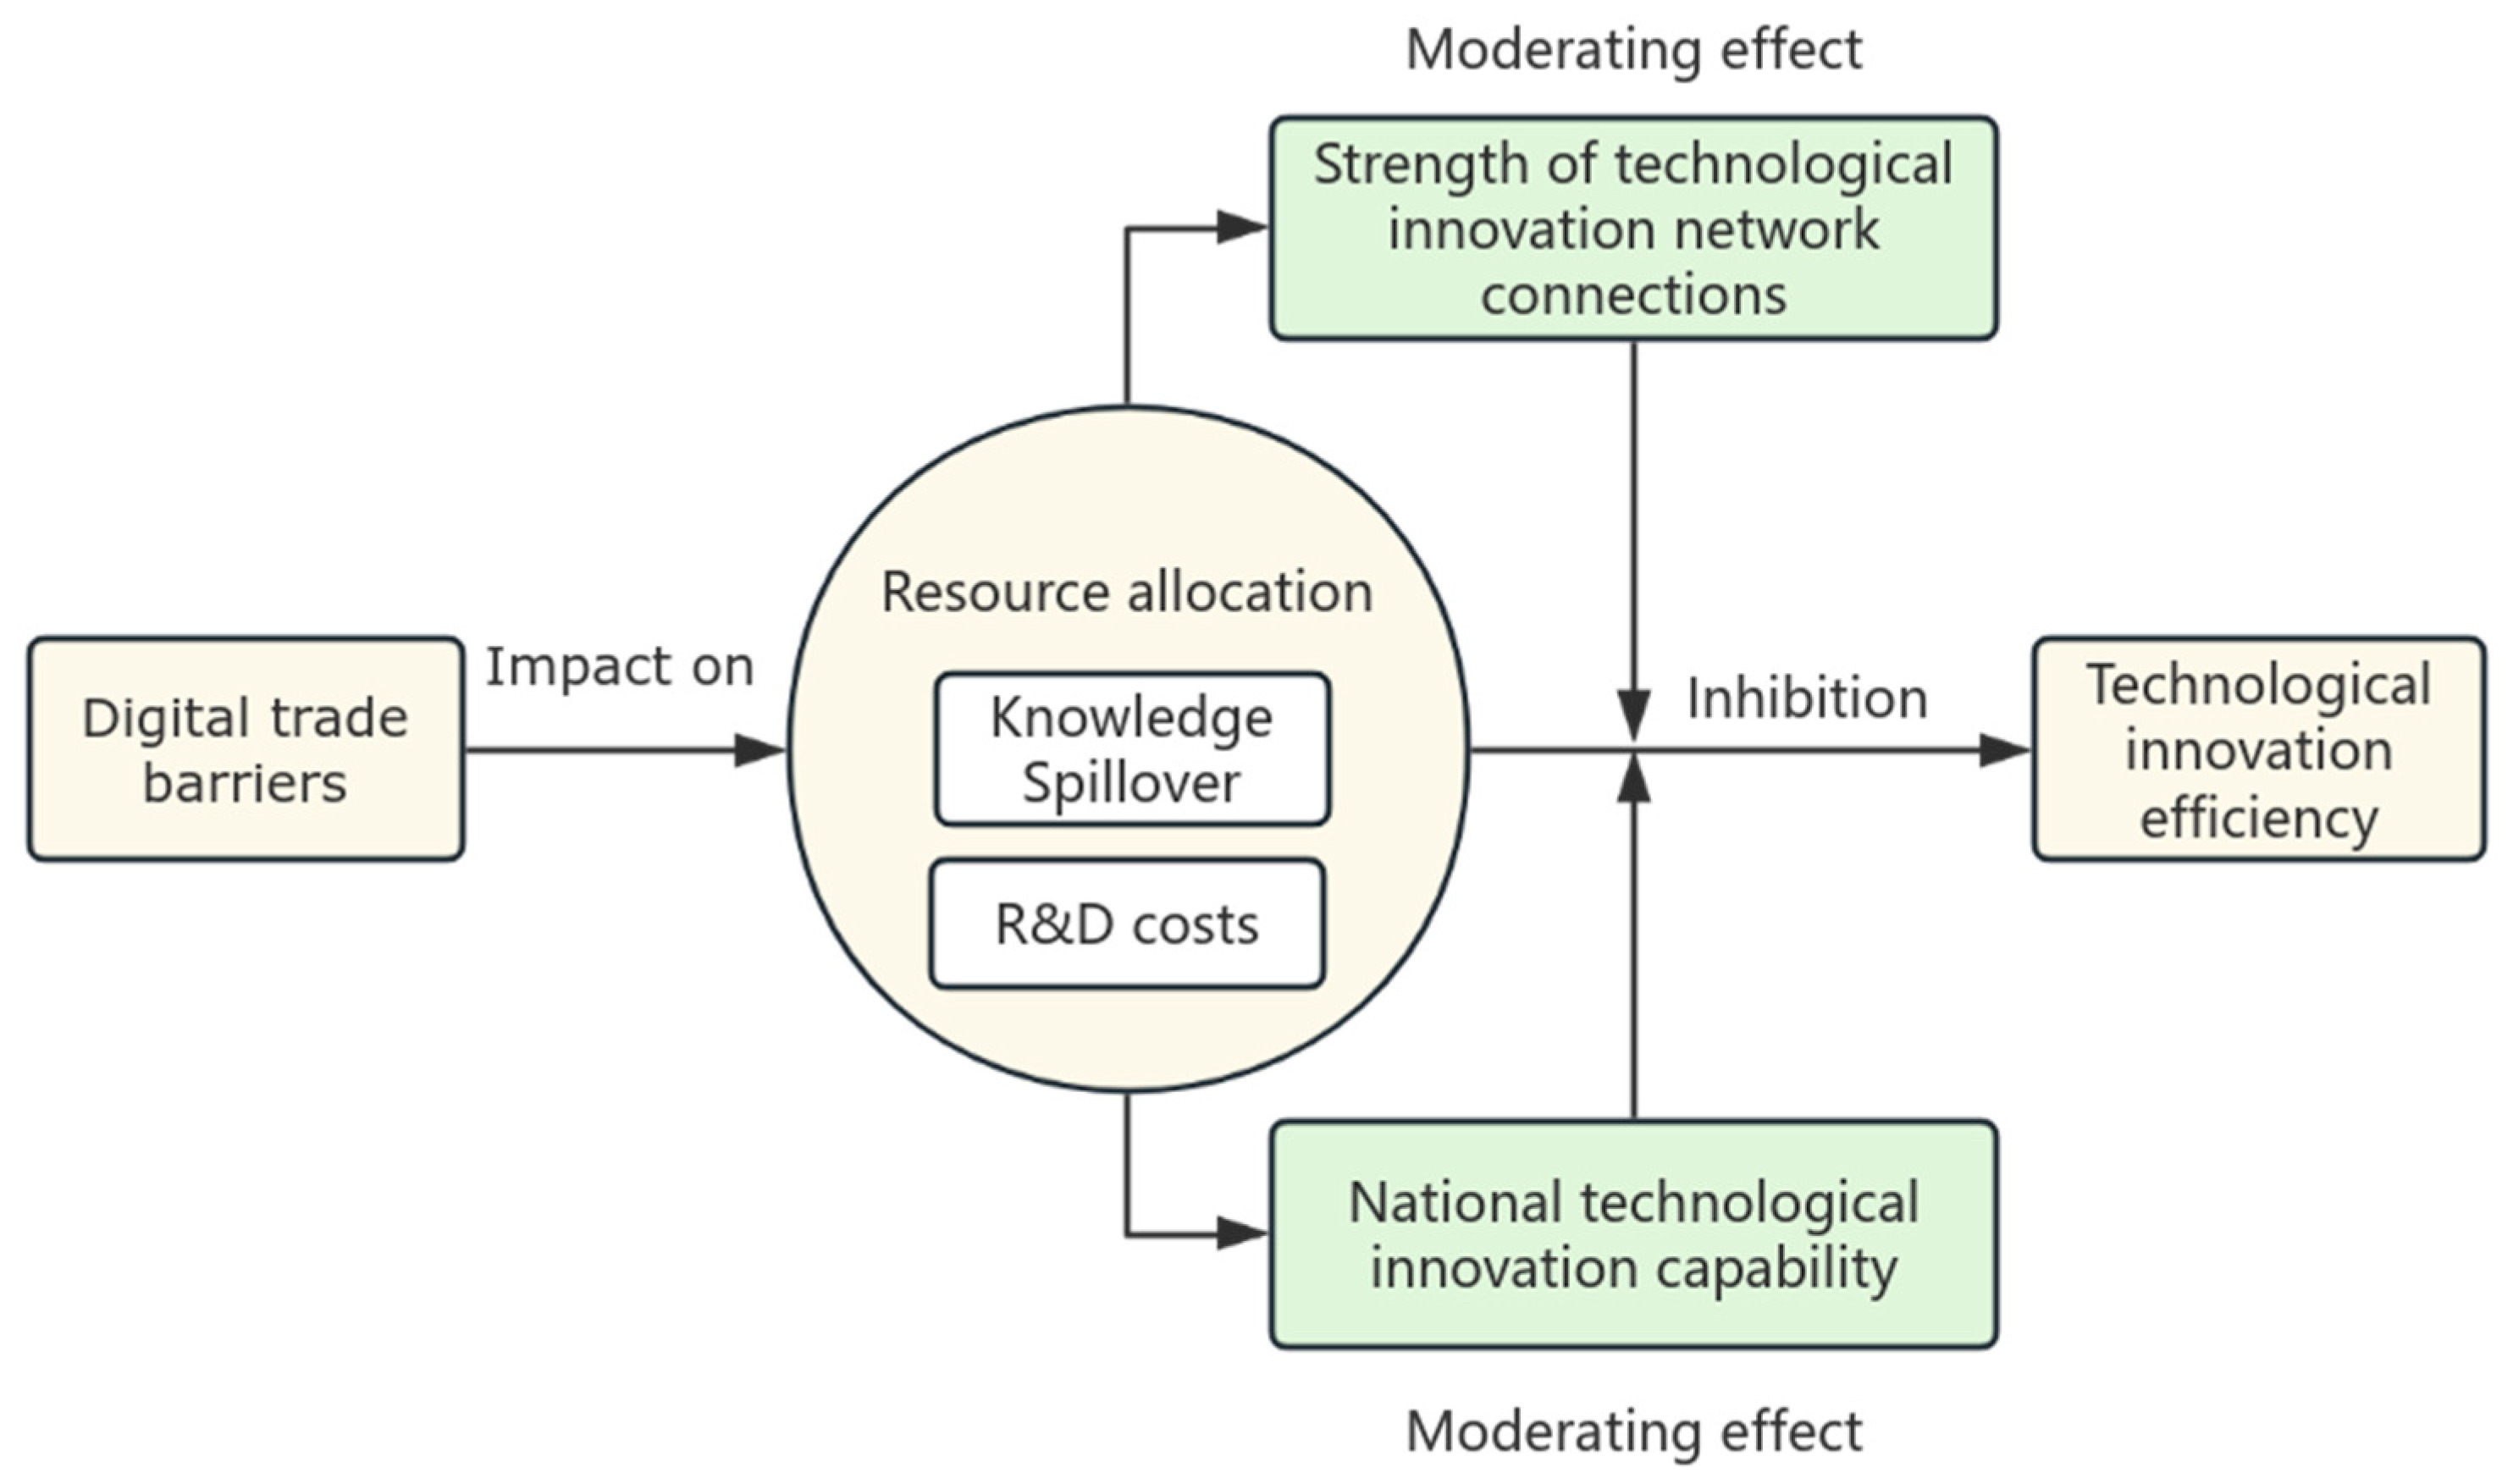
3. Theoretical and Mechanism Analysis

3.1. The Influence of DTB on TIE

TIE research is a part of efficiency research, and its essence is the optimal input–output solution, that is, the most effective allocation of resources. In digital trade, digital elements transcend the limitations of time and space, optimizing the allocation of domestic research and development resources. Countries can more conveniently and widely apply some digital information to the technological innovation process of industries [41]. On the contrary, digital trade restriction policies represented by DTBs have led to the mismatch and waste of global innovation resources [42]. Overall, DTBs suppress TIE by increasing the acquisition cost of digital R&D elements [43].
Firstly, limitations such as data and facility localization in DTB hinder data flow and information dissemination, increasing the cost of acquiring, searching, consulting, and transmitting digital information in technological innovation [44], and thus leading to information asymmetry in technological innovation between countries. Therefore, the non-tradability of technology forces each country to independently develop similar technologies, resulting in duplicate investments in research and development resources. Secondly, the lack of sharing in technological innovation leads to a reduction in spillover effects, reducing the opportunities for underdeveloped countries to gain additional benefits from trade, hindering the convenience and possibility of innovative ideas exchange between countries, and hindering the two-way interaction and upgrading of innovation. Thirdly, the discriminatory nature of intellectual property protection clauses on technological innovation in foreign countries has increased the legal and regulatory costs of obtaining digital trade spillover effects domestically. With the continuous increase in variable trade costs, such as information search and legal regulations, innovation enthusiasm has been reduced, and TIE has been suppressed. Fourthly, digital elements have inherent advantages in saving innovation trial and error costs, and DTBs hinder the realization of this advantage, making it difficult to achieve deep integration and development of foreign digital services and existing resources and thus shortening the innovation cycle.
In order to intuitively understand why the technological innovation cost hindered by DTBs is higher than the unaffected cost, this study referred to Akcigit et al. [45] and Shen et al. [46] for model validation. We need to introduce communication efficiency and learning efficiency into the innovation cost function. This study suggests that a DTB hinders national communication and learning efficiency, increases information search and matching costs, increases marginal costs of innovation activities, and suppresses technological innovation efficiency.
Let γ represent the annual level of innovation investment in innovative countries, depending on the quality of R&D personnel and, especially, the innovation efficiency of country innovators. Specifically, innovative countries can improve innovation efficiency in two ways: firstly, by increasing the frequency of exchanging ideas with the outside world; and, secondly, by enhancing the ability to learn external knowledge and experience.
γ = ( m D + m X ) θ
In Equation (1), γ represents the level of innovation investment of a country in a certain year; m D represents the communication efficiency of the innovative country that year; m X represents the efficiency of the innovative country in learning external resources that year; and θ captures the ability of the innovative country to generate inspiration that year, which be seen as the marginal input cost of innovation that year. The cost coefficient, c, on behalf of the difference in innovation input that year, is as follows:
θ = γ m D + m X = c γ ,   c = 1 m D + m X
In Equation (2), the spillover effect of annual digital trade can help countries to realize information search and exchange within and between countries without paying the cost, thereby improving communication efficiency, m D , and learning efficiency, m D , that year. From this, the following can be concluded:
m D h > m D l ,   m X h > m X l
In Equation (3), the letter h represents the conditions of freedom of digital trade, and the letter l represents the conditions of existence of DTB; and m D h , m D l , m X h , and m X l represent the conditions of digital trade freedom or restrictions, and the annual communication and learning efficiency of innovative countries. In the theoretical model of this study, there are the following:
M C h ( γ ) = θ h = c h γ = γ m D h + m X h , M C l ( γ ) = θ l = c l γ = γ m D l + m X l
In Equation (4), MC represents the annual marginal cost. Based on this, we obtain the following:
c h < c l
In Equation (5), c h represents the innovation cost of countries with free digital trade, and c l represents the innovation cost of countries with DTB. From the above equation, it can be concluded that, compared to digital trade freedom, countries with DTBs have higher information search and matching costs, resulting in higher costs of innovation investment and lower innovation efficiency.
Accordingly, this article proposes a hypothesis:
Hypothesis 1: 
A DTB has a negative impact on TIE.

3.2. Mechanism Analysis

The mechanistic framework is presented in Figure 1.

3.2.1. The Moderating Effect of Technological Innovation Network Connection

The technology innovation network is a new type of networked innovation organization model that helps innovators better utilize external resources, overcome the main contradiction of uncertainty and limited resources in technology innovation, improve the risk resistance of the entire network, and enable all members to benefit together. The closeness of technological innovation network connections is closely related to innovation efficiency [47]. Whether internationally or within countries, technology innovation networks with closer connections have a higher degree of knowledge and information sharing, more obvious internal spillover effects, lower R&D investment costs, and closer cooperation among individuals [48,49]. The technology innovation network has human resource and knowledge intensive characteristics [50], which can continuously improve the skill level and value creation ability of industry employees through education, training, and ‘learning by doing’, bringing excellent and sustainable talent support to countries within the network, thereby improving the competitiveness.
Joining an economic and trade cooperation organization is a manifestation of enhancing the connectivity of technological innovation networks, and this connectivity creates a relatively stable international trade environment with partner countries [9,51,52]. Overall, we infer that the technological innovation network connection offsets the negative impact of DTBs on technology innovation efficiency. This article presents a second hypothesis:
Hypothesis 2: 
The strength of technological innovation network connections has a moderating effect on the negative impact of DTBs on technological innovation.

3.2.2. The Moderating Effect of Innovation Capacity

National innovation capability refers to a country’s ability to continuously introduce innovative technologies over a long period of time, utilizing existing knowledge and materials to improve or create new technologies. In other words, the ability to innovate technology is gradually accumulated through a series of research and development practices. The innovation infrastructure, the innovation environment of industrial clusters, the quality of the connection between technology and industrial sectors, and the absorption capacity of international technology spillovers are all manifestations of a country’s technological innovation capability. Countries with strong technological innovation capabilities are likely to be high-income developed countries with relatively complete technological innovation systems. They have relatively low dependence on knowledge spillovers and foreign data and have lower research and development costs compared to countries with weak technological innovation capabilities. The stronger the ability, the deeper the foundation of technological innovation, the higher the TIE, the weaker the dependence on external conditions, and the stronger the ability to resist external risks, thus creating an ‘offsetting effect’ on external shocks. This article presents a third hypothesis:
Hypothesis 3: 
The national technological innovation capability has a moderating effect on the negative impact of DTBs on technological innovation.

4. Research Design and Variable Selection

4.1. Model Settings

This study analyzes the impact of DTBs on TIE using cross-border panel data from the OECD database and WIPO database from 2014 to 2020. This database contains 60 countries and economies. The constructed regression model is as follows:
I E R j t = β 0 + β 1 D S T R I j t + β 2 X j t + π j + θ t + ε j t
where the subscript j represents the country; t represents the year of observation; and the dependent variable is I E R j t , which represents the TIE of country j in year t. The explanatory variable is D S T R I j t , which represents the DTB of country j in year t. X j t represents the control variables, including Population Size (lnPOP), Strength of Technological Innovation Network Connection (INLK), High-Tech Export Dependence (HT), Service Trade Openness (lnST), Education Index (EDU), and Internet Development Level (lnINT) of each country. The model controls for both time-fixed effects, θ t , and individual-fixed effects, π j . ε j t is a random perturbation term.

4.2. Variable Definition

4.2.1. The Dependent Variable

Technological Innovation Efficiency (TIE): Innovation Efficiency Ratio (IER)
TIE is announced as a term of management science, which is defined as the input-output ratio of technological innovation resources, that is, the allocation efficiency of technological innovation resources. The data on TIE come from the WIPO-GII database, which is jointly established by three authoritative institutions, including the World Intellectual Property Organization, and ranks over 132 economies based on 80 indicators. It is the main reference and decision-making benchmark for policymakers. It includes sub-indicators such as innovation institutional, infrastructure, human capital, etc. The main indicator is The Global Innovation Index (GII), which provides data to measure a country’s technological innovation capability but is too general to measure TIE; it is used for mechanism analysis and heterogeneity testing in the following text. In contrast, the Innovation Efficiency Ratio (IER) in the database is a better choice to represent TIE. IER measures the ratio of sub-indicators of technological innovation output to sub-indicators of input in various countries. IER is measured by the following:
I E R j t = I n n o v a t i o n   O u t p u t   S u b i n d e x I n n o v a t i o n   I n p u t   S u b i n d e x

4.2.2. Explanatory Variables

Digital Trade Barriers (DTBs): Digital Trade Restriction Index (DSTRI)

The mainstream method for measuring and evaluating DTBs is the frequency analysis. There are three main types of comprehensive indicators. The first category is the Digital Services Trade Restriction Index (DSTRI) of the OECD database [53], which is the core data reflecting DTB worldwide. The value range of this index is between 0 and 1, where 0 represents a completely open foreign trade and investment environment, and 1 represents a completely closed environment. The larger the number, the more severe the barrier. DSTRI can also be subdivided into five subcategories. The database measures 85 countries and economies, including member states.
The second category is the Digital Trade Restriction Index (DTRI) of the European Centre for International Political Economy (ECIPE) [54]. The index can also be subdivided into four dimensions: ‘Fiscal Restrictions’, ‘Market Access Restrictions’, ‘Institutional Restrictions’, and ‘Data and Trade Restrictions’. However, DTRI data were released only for one issue in 2017; thus, they cannot be adopted by most empirical studies.
The third category is the ‘Digital Trade and US Trade Policy Report’ released by the Congressional Research Service (CRS) of the United States [55]. DTBs are divided into tariff barriers and non-tariff barriers. The latter specifically includes five parts: digital localization requirements, intellectual property infringement, policy consistency, review system, and network neutrality and network security. However, this report provides only a descriptive definition of DTB and does not form quantitative indicators.
This study uses the DSTRI as the representative of DTB. As shown on the OECD database, the DSTRI has five sub-restrictions, each of which includes several measures. When calculating a country’s overall digital trade barrier index, they are, respectively, assigned weights, including 55% for Infrastructure and Connectivity, 15% for Intellectual Property, 13% for Electronic Transactions, 12% for Other Trade Barriers, and 5% for Payment Systems. Finally, the above weight scores are weighted and summarized to characterize DTBs.
D S T R I j = p = 1 5 w p D S T R I p
where D S T R I j is the digital trade restriction index of country j, D S T R I p is the score corresponding to policy category p, and w p represents the weight of P policy. The calculation formula for D S T R I p is as follows:
D S T R I p = m = 1 n w p m D S T R I p m
where D S T R I p m represents the corresponding value of measure m in policy category p, and w p m represents the corresponding weight of measure m in policy p. The calculation formula for w p m is as follows:
w p m = w p k = 1 5 n k w k
where w p and w k are the corresponding weights of policy p and k, and n k represents the number of measures in the policy. The calculation formula for D S T R I p m is as follows:
D S T R I p m = s c o r e m × w p m
where s c o r e m represents the score of measure m.

4.2.3. Control Variables

The control variables (X) include the following:
Population Size (lnPOP): The natural logarithm of the population of each country.
The strength of technological innovation network connections (INLK): The index combines sub-indicators such as university/industry research cooperation, innovation cluster development status, foreign-funded GERD, and joint venture/strategic alliance transactions to score and rank the tightness of national technological innovation network connections in each country. Source from WIPO database. The higher the score, the closer the connection between the country’s technological innovation individual, and the more obvious the spillover effects and cost savings of technological innovation.
High-Tech Export Dependence (HT): The proportion of high-tech product exports to GDP represents the importance of a country’s reliance on high-tech product exports.
Service Trade Openness (lnST): The natural logarithm of a country’s service trade volume. The higher the openness of service trade, the more opportunities there are to obtain additional benefits through the process of trade.
Education Index (EDU): Source from WIPO database. Measuring the level of national human capital invested in technological innovation. In the previous literature, the proportion of education investment in GDP or higher education enrollment rate serves as an indicator for measuring human capital. This study used a more accurate index as the proxy variable for human capital, namely the Education Index in the WIPO database, more accurately reflecting the level of human capital in a country.
Internet Development Level (lnINT): The calculation method is the number of secure Internet base stations per million people. The flow of knowledge, ideas, and technology is highly dependent on Internet transmission channels, so it is expected that the level of Internet development will affect TIE.

4.3. Descriptive Statistics

This study matched the DSTRI data in the OECD database with the IER data in the WIPO database, selecting 60 (Austria, Belgium, Chile, The Czech Republic, Germany, Denmark, Spain, Estonia, Finland, France, Britain, Greece, Hungary, Ireland, Italy, Japan, Republic of Korea, Lithuania, Luxembourg, Latvia, Netherlands, Norway, Poland, Portugal, Russian federation, Slovak Republic, Sweden, Türkiye, United States, South Africa, Australia, Bolivia, Brazil, Cambodia, Cameroon, Canada, Colombia, Costa Rica, Guatemala, India, Israel, Kazakhstan, Kenya, Madagascar, Malaysia, Mali, Nepal, New Zealand, Pakistan, Paraguay, Peru, the Philippines, Rwanda, Saudi Arabia, Senegal, Singapore, Slovenia, Switzerland, Thailand, and Vietnam) overlapping countries and economies as samples over the period from 2014 to 2020. During the process, in order to supplement a small amount of missing data in the database, this study used the linear interpolation method. The descriptive statistics of the main variables are shown in Table 1.

5. Benchmark Regression Analysis

5.1. Benchmark Regression Results

This study used ordinary least squares regression to analyze the impact of DTBs on TIE using panel data from 2014 to 2020; the results are shown in Table 2. During the process, because the Hausman test [56] rejected the hypothesis of random effects, this study used a bidirectional fixed-effects regression model to control for individual-fixed effects and time-fixed effects. Gradually increasing the number of control variables in the six regression analyses, the coefficient of the core explanatory variable DSTRI is negative at the 1% level of statistical significance, as shown in Table 2 (1) to (6), indicating that DTB significantly inhibits TIE. Specifically, the regression coefficients of the explanatory variable DSTRI are −0.214, −0.196, −0.212, −0.210, −0.210, and −0.208, respectively. This indicates that, when a country’s DSTRI increases by one percentage point, its IER significantly decreases by 0.208 percentage points, verifying Hypothesis 1 of this study. The coefficients of the five control variables, namely lnPOP, INLK, HT, lnST, and EDU are all significant. Only the coefficient of lnINT is not statistically significant, indicating that the degree of internetization is not a main factor affecting the TIE. Specifically, Population Size, High-tech Export Dependence, and Education Level have a negative impact on TIE, while the Strength of National Technological Innovation Network Connections and Service Trade Openness have a positive impact on TIE. This indicates that the closer a country’s technological innovation network is connected and the more open its service trade is, the more favorable it is for improving the TIE.

5.2. Robustness Testing

After trying 1% tailing treatment and 1% truncated treatment, the regression coefficient of the explanatory variable is still significantly negative, verifying the robustness of the benchmark regression. The regression results are shown in Table A1 in Appendix A.

5.2.1. Replacing Core Explanatory Variables

In order to verify the robustness of the basic regression, we replace DSTRI with its five sub-indexes, respectively, and perform the regression again, namely Infrastructure and Connectivity, Electronic Transactions, Intelligent Property Rights, Payment System, and Other Barriers.
The regression results are shown in columns (1) to (5) of Table 3. Two sub-indicators coefficients of DTB are significantly negative, consistent with the benchmark regression, verifying the robustness of benchmark regression. Specifically, the regression coefficient of Infrastructure and Connectivity DTB and Other DTB is significantly negative, while the regression coefficient of Electronic Transactions DTB is significantly positive. The regression coefficient of Intellectual Property Rights DTB and Payment System DTB are not significant. This result indicates that Infrastructure and Connection and Other DTB suppress TIE. Other DTBs have the greatest hindering effect on TIE, namely increasing limitations such as data flow restrictions, data download restrictions, and mandatory technology transfer, significantly inhibiting TIE. The Electronic Transactions DTB contributes to the TIE. This may be because the barrier mainly focuses on fairness in transactions, stricter rules protect the interests of both buyers and sellers, and the improvement of reliability and fairness enhances the motivation of innovative individuals.
It is worth noting that the regression results of intellectual property DTBs do not match the expectations of some policymakers who hope to improve the efficiency of domestic technological innovation by blocking intellectual property rights. Zhao [57] and Gao [58] prove that, in countries with lower levels of intellectual property protection, companies typically rely more on internal innovation resources rather than external ones. Policymakers believe that blocking intellectual property rights and reducing knowledge and technology spillovers can increase the benefits and motivation of local technological innovation [59]. High investment and fast update speed are typical features of technological innovation activities. In order to achieve the protection of innovative achievements, countries may adopt high DTBs to reduce the probability of new technologies and models being imitated or pirated, thereby increasing the monopoly time of innovative products or services in the market. By reducing ‘free-riding’, countries can maintain their leading technological research and development advantages, maximize compensation for the accumulated costs of early innovation activities, and motivate enterprises to engage in more research and development activities. However, through the regression analysis conducted, we noted that the intellectual property digital trade barrier has not significantly improved the TIE, which overturned the views of these policies.

5.2.2. Replace the Dependent Variable

In the new regression, we used the ratio (IER) of technological innovation output to technological innovation input as a quantitative indicator of the dependent variable TIE. To conduct robustness testing, we respectively replace the numerator (Innovation Output Sub-Index) and the denominator (Innovation Input Sub-Index) of TIE for the regression analysis.
Firstly, we replace the Innovation Output Sub-Index with Knowledge and Technology Outputs and perform the regression. The Knowledge and Technology Outputs Index (it comprehensively measures patents, high-tech exports, intangible assets, and scientific publications and is a comprehensive indicator for representing a country’s technological innovation output) sources from the WIPO database, which includes three sub-indicators: knowledge creation, impact, and diffusion. Due to the greater output, the efficiency is higher with the same input. Therefore, the relationship between output and efficiency should be positive. Therefore, we assume that the relationship between this indicator and DSTRI should be negative. The regression results are shown in Table 4 (1). Column (2) of Table 4 shows the regression results of each indicator removing extreme outliers after tail reduction treatment at the 5% level. Through two regression results, it can be seen that there is a significant negative relationship between Knowledge and Technology Outputs and DSTRI, that is, the more severe the DTB, the less technological innovation output, and the lower the TIE.
Secondly, we replace the Innovation Input Sub-Index with the Research and Development Index (it comprehensively measures R&D personnel, R&D funds, number of R&D companies, etc., and can basically reflect a country’s technological innovation input situation), which is sourced from the WIPO database. Based on Yu and Wang’s [60] research, knowledge capital investment, and human capital investment can promote efficiency change, thereby promoting the intensive utilization of production factors and improving TIE and total factor productivity. Due to the lower input, the efficiency is higher with the same output. The relationship between input and efficiency should be negative. Therefore, we assume that its relationship with DSTRI is positive. The regression results are shown in Table 4 (3). Column (4) of Table 4 shows the regression results of each indicator after a 5% level tail reduction treatment. Due to severe missing R&D data for Cambodia, Cameroon, and Rwanda, Column (5) of Table 4 shows the regression results after excluding these three countries. It can be seen that there is a significant positive relationship between the Research and Development Index and DSTRI. The more severe the DTB, the more input in technological innovation, and the lower the TIE.
The above regression results show that, after replacing the dependent variable, the regression results are still consistent with the benchmark regression, indicating that the benchmark regression results are relatively robust.

5.2.3. Dealing with Endogeneity Issues

There may be a bidirectional causal relationship between a country’s innovation efficiency and DTBs, meaning that countries with higher TIE will also have relatively weaker DTBs. This may be because countries with high TIE may have high utilization rates of digital resources in the digital age and are more likely to sign trade agreements related to digital trade with other countries, resulting in relatively less restrictive policies on digital trade. In order to reduce the bias of benchmark regression estimation, this article uses the Instrumental Variable (IV) to overcome endogeneity issues. Therefore, this article regresses the core explanatory variables in the model with a lag of one period (L.DSTRI) and uses the Two-Stage Least Squares (TSLS) method for processing. The core explanatory variable is highly correlated with its lagged variable, and the lagging variable has already occurred, independent of the disturbance term. The TSLS regression results of the IV are shown in Table 5. The first column shows the correlation between L.DSTRI and DSTRI, while the second column shows the relationship between the explanatory variable (L.DSTRI) and the dependent variable (IER). According to Stock and Yogo (2005) [61], The Kleibergen–Paap rk LM statistic and Kleibergen–Paap rk Wald F statistic are good indicators for testing whether instrumental variables are unrecognizable or weakly recognizable. As reflected in the results shown in the table below, both the identification deficiency test and weak identification test for instrumental variables were rejected, indicating that the instrumental variables selected in this article are reasonable and effective. After using instrumental variables, the coefficient of the explanatory variable was significantly negative. The regression results of the original explanatory variable and the IV are similar, indicating that the endogeneity problem of the model is not obvious.

6. Heterogeneity Analysis

This section analyzes the impact of DTB on TIE under the condition of distinguishing country differences.
Firstly, we grouped the sample countries based on their technological innovation capabilities to compare and analyze whether the TIE of countries with strong technological innovation capabilities is less affected by DTB. According to the score of the main index GII in the WIPO database, countries with a GII above 50 are classified as countries with strong technological innovation capabilities, while countries with a GII below 50 are classified as countries with weak technological innovation capabilities. The regression results are shown in Table 6 (1) (2). Similar to our general understanding, countries with weak technological innovation capabilities exhibit strong negative significance in the DSTRI regression coefficient, while countries with strong technological innovation capabilities do not exhibit statistically significant regression coefficients. Therefore, we can conclude that the inhibitory effect of DTBs on TIE is more pronounced in countries with weak technological innovation capabilities. This may be due to countries with weak technological innovation capabilities not having a comprehensive technological innovation system and having a strong dependence on external data resources. DTBs cut off their access to external data and knowledge resources, as well as the accompanying spillover effects. Relying solely on an immature internal system increases the cost of technological innovation and reduces its efficiency. By comparison, countries with strong technological innovation capabilities have a stronger ability to resist external risks.
Secondly, we discuss whether a country’s accession to an economic organization can offset the negative impact of DSTRI on its TIE. The OECD, for instance, provides a platform for member states to jointly pay attention to and negotiate economic development policies, providing opportunities for close cooperation in areas such as maintaining economic growth; maintaining trade, investment and financial stability, and technological innovation; promoting common prosperity among member states; and resisting external risks. This study divides the sample into two groups for regression based on whether or not to join the OECD organization. The regression results are shown in Table 6 (3) and (4), and the negative impact of DSTRI on technological innovation is significant regardless of whether it is added to the OECD or not. However, countries that have not joined the OECD have a greater and more significant negative impact. As analyzed before, joining an organization increases the possibility of a tight connection of technological innovation network between members, partially offsetting the negative impact of DTB on TIE.
Thirdly, we discuss the different results of national development level and income gap. Usually, income is the basis for dividing developed and developing countries. According to the World Bank’s national income classification standards, we first conducted a regression analysis on developed and developing countries, with a per capita gross national income of USD 12,536 in 2019 as the dividing line. Afterward, for further research, we continued to divide the sample into four groups based on per capita gross national income: low-income, lower-middle-income, upper-middle-income, and high-income countries. This study regressed the six economic groups mentioned above, and the results are shown in Table 7. Although the regression results in developed countries are more significant, the absolute value of the regression results in developing countries is greater. A further analysis revealed that, among developing countries, the regression coefficient of countries with lower- and middle-income levels is very significant and has the highest absolute value, indicating that their TIE is most affected by DTBs. The behavior of low-income countries setting DTBs to protect the development of their technological innovation and break free from the ‘low-end lock-in’ situation has resulted in a decrease in their technological innovation efficiency rather than an increase, indirectly verifying the fact that DTBs to intellectual property have no impact on technological innovation, as mentioned earlier [55,62].

7. Mechanism Verification

First, this study introduces the interaction term between DTB and the strength of national technological innovation networks (DSTRI*INLK) to demonstrate the moderating effect. The benchmark regression confirms that the closer a country’s national technological innovation network is connected, the higher the TIE, and they are positively correlated. As shown in Table 8 (1), the coefficient of interaction term (DSTRI*INLK) is significantly positive, indicating that the larger the DTB, the looser the connection between national technological innovation networks, and the more severe the inhibition of TIE. In other words, the closer the connection between national technological innovation networks, the less significant the negative effect of the DTB on TIE, which can offset the negative impact of some DTBs. Accordingly, the moderating effect of the strength of technological innovation network connections is the mechanism that adjusts the inhibitory effect of DTBs on TIE. Thus, Hypothesis 2 is verified.
Next, this study introduces the control variable technological innovation capacity (GII) and the interaction term between DTB and the technological innovation capacity (DSTRI*GII) to demonstrate the moderating effect. As shown in Table 8 (2), the coefficient of GII and DSTRI*GII is significantly positive, indicating that GII and DSTRI*GII are positively correlated with TIE. The improvement of technological innovation capability will promote TIE and compensate for the negative impact of the DTB. Thus, Hypothesis 3 is verified.

8. Discussion

The process of digital trade is filled with technological privacy data. Based on the explanation given earlier, in the context of different levels of intellectual property regulation in different countries, governments tend to adopt data localization policies to protect the innovative achievements of domestic enterprises from foreign competition. However, this study confirmed that DTBs have a sustained suppressive effect on technological innovation efficiency. From a sustainable development perspective, it is not wise for the government to close off digital trade exchanges with foreign countries. At present, the development of digital economy is the trend, and the benefits brought by digital trade to countries are long-term and sustainable, but the negative impact brought by DTB is also long-term and sustainable. That is because sustainable external knowledge learning and technology introduction are sources for a country to improve its domestic technological innovation efficiency. Establishing high DTB, blocking domestic and international digital trade opportunities, and relying solely on independent research for closed innovation cannot sustainably narrow the technological efficiency gap between developed countries and developing countries with weaker innovation capabilities and lower incomes. Excessive protectionism may yield benefits in the short term, but it is not conducive to long-term, sustainable benefits. By contrast, reducing the DTB and obtaining foreign elements of digital innovation and knowledge spillovers through digital trade can sustainably absorb and integrate external knowledge, accelerate internal innovation activities, and help strengthen continuous internal and external information exchange, sustainably spreading new ideas through external channels. Reducing digital trade restrictions is more conducive to the sustainable development of innovation, especially in low- and middle-income developing countries with weaker technological innovation capabilities. It is recommended to build a close technological innovation network and regional innovation chain while enhancing the national technological innovation capacity in order to resist the sustained negative impact of the DTB.

9. Conclusions

The inhibitory effect of TIE on the DTB is not only an important content of research on DTB but also content that needs to be understood in building a scientific response mechanism to DTB. This study confirmed the negative impact of digital trade-mechanism trade barriers on TIE based on data from 2014 to 2020. The results are as follows: Infrastructure and Connecting DTB and Other DTB have the greatest negative impact. The theoretical analysis explained that DTB has a suppressive effect on TIE through two channels: increasing the difficulty of acquiring external knowledge and technology spillovers and increasing technological innovation costs. The mechanism analysis found that the closer the connection strength of national technological innovation networks, the stronger the country’s technological innovation ability, and the more effective it is in alleviating the inhibitory effect of DTB on TIE. Heterogeneity testing shows that the negative effect is more pronounced for low innovation-ability countries, low-income countries, and countries that have not joined the OECD.
The long-term impact of digital trade barriers on technological innovation efficiency is a complex issue that still requires further research on sustainable development themes. The limitation of this study is that it used data only from authoritative institutions for a macro analysis at the national level. In fact, exploring the efficiency of enterprise technological innovation at the micro level also has great academic value, that is, the micro response caused by macro policy changes. Subsequent research will focus on the digital transformation and sustainable innovation of enterprises or industries, or conduct in-depth research on digital economy companies. In addition, further research can choose other data sources and empirical methods and analyze short-term and long-term effects separately to verify whether the effect is sustainable.

Author Contributions

Writing—original draft, M.Y.; Writing—review & editing, H.L. All authors have read and agreed to the published version of the manuscript.

Funding

This research was funded by the National Social Science Fund of China grant number 19BJL107.

Institutional Review Board Statement

Not applicable.

Informed Consent Statement

Not applicable.

Data Availability Statement

Data are contained within the article.

Conflicts of Interest

The authors declare no conflict of interest.

Appendix A

The table below shows the robustness test regression result of data processing mentioned in the main text.
Table A1. Robustness testing—data processing.
Variables(1)
IER
(2)
IER
DSTRI−0.321 ***−0.313 ***
(−2.62)(−2.97)
lnPop−1.091 ***−1.096 ***
(−6.17)(−6.80)
INLK0.002 ***0.003 ***
(4.55)(5.18)
HT−0.002−0.001
(−1.47)(−1.45)
lnST0.066 **0.075 ***
(2.32)(2.95)
EDU−0.001 **−0.001 **
(−2.08)(−2.16)
lnINT−0.002−0.003
(−0.21)(−0.40)
Constant17.495 ***17.387 ***
(5.53)(6.01)
Observations382420
Country FEYesYes
Year FEYesYes
R-squared0.5970.628
*** p < 0.01, ** p < 0.05.

References

  1. Tong, T.; Iqbal, K.; Rahman, A.A. Core Technological Competence and Competitive Advantage: A Study on Chinese High-Tech SMEs. Front. Psychol. 2022, 13, 959448. [Google Scholar] [CrossRef] [PubMed]
  2. Mengxuan, T.; Khan, K.; Cifuentes-Faura, J.; Sukumaran, S. Technological innovation and energy efficiency in central Eastern European countries. Util. Policy 2024, 88, 101761. [Google Scholar] [CrossRef]
  3. Fang, H.; Huo, Q.X. The Innovation Effect of Open Digital Service Trade on Enterprises. Econ. Dyn. 2023, 01, 54–72. [Google Scholar]
  4. Amila, P.; Hatidza, J. The adoption of inbound open innovation practices in developing countries: Empirical evidence from the manufacturing sector. Eur. J. Innov. Manag. 2022, 25, 774–790. [Google Scholar] [CrossRef]
  5. Ho, C.; Wang, W.; Yu, J. International knowledge spillover through trade: A time-varying spatial panel data approach. Econ. Lett. 2018, 162, 30–33. [Google Scholar] [CrossRef]
  6. Grossman, G.M.; Helpman, E. Trade, innovation, and growth. Am. Econ. Rev. 1990, 80, 86–91. [Google Scholar]
  7. Zhou, R.J. The Impact of Intellectual Property Protection and Import Trade Technology Spillovers on Innovation. Stat. Decis. Mak. 2019, 35, 90–94. [Google Scholar] [CrossRef]
  8. UNCTAD. Digital Economy Report 2021; UNCTAD: Geneva, Switzerland, 2021. [Google Scholar]
  9. Azmeh, S.; Foster, C.; Echavarri, J. The International Trade Regime and the Quest for Free Digital Trade. Int. Stud. Rev. 2020, 22, 671–692. [Google Scholar] [CrossRef]
  10. Haihua, L.; Peng, W.; Zejun, L. Is There Any Difference in the Impact of Digital Transformation on the Quantity and Efficiency of Enterprise Technological Innovation? Taking China’s Agricultural Listed Companies as an Example. Sustainability 2021, 13, 12972. [Google Scholar] [CrossRef]
  11. Hufbauer, G.C.; Lu, Z.L. The European Union’s Proposed Digital Services Tax: A De Facto Tariff. Peterson Institute for International Economics. 2018, No PB18-15. Available online: https://www.piie.com/publications/policy-briefs/european-unions-proposed-digital-services-tax-de-facto-tariff (accessed on 21 January 2016).
  12. Meng, X.; Sun, L.; Wang, H. The impact of digital service trade barriers and regulatory policy heterogeneity on digital delivery service trade. Asia Pac. Econ. 2020, 6, 42–52+147. [Google Scholar] [CrossRef]
  13. Mishrif, A.; Khan, A. Do Free Trade Agreements Facilitate FDI Spillover Effects on Domestic Firms? Empirical Evidence from Oman. Economies 2024, 12, 141. [Google Scholar] [CrossRef]
  14. Liebman Benjamin, H.; Reynolds Kara, M. Competitive pressure, innovation and trade protection: Evidence from US patent data. World Econ. 2019, 42, 1695–1712. [Google Scholar] [CrossRef]
  15. Gu, W.; Saaty, T.L.; Wei, L.R. Evaluating and Optimizing Technological Innovation Efficiency of Industrial Enterprises Based on Both Data and Judgments. Int. J. Inf. Technol. Decis. Mak. 2018, 17, 9–43. [Google Scholar] [CrossRef]
  16. Ge, S.Q.; Wang, X.L. The impact of digital trade rules on the export of digital delivery services: A test based on UNCTAD service trade data. Int. Econ. Trade Explor. 2023, 39, 19–34. [Google Scholar]
  17. Zhang, G.F.; Jiang, L.D.; Liu, S.S. Does digital trade barriers inhibit the upgrading of export product quality. Financ. Trade Econ. 2022, 43, 144–160. [Google Scholar] [CrossRef]
  18. Bergstrand, J.H.; Egger, P. A knowledge-and-physical-capital model of international trade flows, foreign direct investment, and multinational enterprises. J. Int. Econ. 2007, 73, 278–308. [Google Scholar] [CrossRef]
  19. Meltzer, J.P. Maximizing the Opportunities of the Internet for International Trade, ICTSD and World Economic Forum. 2016. Available online: https://ssrn.com/abstract=2841913 (accessed on 21 January 2016).
  20. Amiti, M.; Konings, J. Trade liberalization, intermediate inputs, and productivity: Evidence from Indonesia. Am. Econ. Rev. 2007, 97, 1611–1638. [Google Scholar] [CrossRef]
  21. Li, J.C.; Qin, X.T. Tang J, Yang L, Foreign trade and innovation sustainability: Evidence from China. J. Asian Econ. 2022, 81, 101497. [Google Scholar] [CrossRef]
  22. Wyszkowska-Kuna, J. Internal and External Sources of Knowledge in Manufacturing and Service Enterprises. A Comparative Analysis of European Union Countries. Comparative Economic Research. Cent. East. Eur. 2020, 23, 21–39. [Google Scholar]
  23. Qiao, C.X. New Changes in International Technology Transfer and Its Implications for China. Theor. J. 2015, 48–54. [Google Scholar]
  24. Pan, J. International Knowledge Flow, Knowledge-based Service Trade, and Economic Growth: Mechanisms, Models, and Countermeasures. Sci. Manag. Res. 2011, 29, 92–94. [Google Scholar]
  25. Cory, N. Cross-border Data Flows: Where Are the Barriers, and What Do They Cost? Inf. Technol. Innov. Found. 2017, 1–42. [Google Scholar]
  26. Gu, Z.H.; Shen, Y. Intellectual Property Protection, Technological Innovation, and Technology Transfer—From the Perspective of Developing Countries. Ind. Econ. Res. 2015, 64–73. [Google Scholar]
  27. Yu, C.L.; Wang, R.F. Intellectual Property Protection and Technological Innovation in Developing Countries: Is It Just a Linear Relationship. Contemp. Econ. Sci. 2009, 31, 92–100+127. [Google Scholar]
  28. Sun, B. Countermeasures for Technological Trade Barriers from the Perspective of Technological Innovation. Res. Sci. Manag. 2018, 36, 19–22. [Google Scholar] [CrossRef]
  29. Nie, H.L. The Impact of Trade Protection on Technological Progress under Open Economic Conditions. Ph.D. Thesis, Jiangxi University of Finance and Economics, Nanchang, China, 2009. [Google Scholar]
  30. Cheng, Z.M.; Sun, B.Q.; Yu, T. Empirical Study on the Impact of Trade Barriers on Enterprise Innovation. Stat. Decis. Mak. 2023, 39, 179–183. [Google Scholar] [CrossRef]
  31. Meltzer, J.P. Supporting the Internet as a Platform for International Trade: Opportunities for Small and Medium-Sized Enterprises and Developing Countries. SSRN Electron. J. 2014, 2. [Google Scholar] [CrossRef]
  32. Yang, Y.B. Can Enhancing Intellectual Property Protection Always Promote Innovation An analysis of the north-south framework incorporating the ‘learning by doing’ effect. World Econ. Res. 2018, 115–131+134. [Google Scholar]
  33. Li, P.; Tian, S.; Liu, T.H. The impact of trade barriers on China’s technological innovation—also on the role of the government. Int. Trade Issues 2014, 105–114. [Google Scholar]
  34. Xie, H.Y. Analysis of the Impact of Trade Barriers on China’s Technological Innovation. Foreign Econ. Trade Pract. 2015, 41–44. [Google Scholar]
  35. Mishra, R.; Singh, K.R.; Rana, P.N. Digital orientation, digital eco-innovation and circular economy in the context of sustainable development goals. Bus. Strategy Environ. 2023, 33, 2752–2770. [Google Scholar] [CrossRef]
  36. Trischler, M.F.G.; Li-Ying, J. Digital business model innovation: Toward construct clarity and future research directions. Rev. Manag. Sci. 2023, 17, 3–32. [Google Scholar] [CrossRef]
  37. Su, C.W.; Yue, P.; Hou, X.; Dördüncü, H. Sustainable development through digital innovation: A new era for natural resource extraction and trade. Resour. Policy 2023, 85, 103920. [Google Scholar] [CrossRef]
  38. Yousaf, Z.; Radulescu, M.; Sinisi, C.I.; Serbanescu, L.; Păunescu, L.M. Towards Sustainable Digital Innovation of SMEs from the Developing Countries in the Context of the Digital Economy and Frugal Environment. Sustainability 2021, 13, 5715. [Google Scholar] [CrossRef]
  39. Alsharah, H.; Alsaeedi, A. Digitalization Leading the Way for a Sustainable Future. Tech. Vocat. Educ. Train. 2024, 39, 259–270. [Google Scholar] [CrossRef] [PubMed]
  40. Annarelli, A.; Battistella, C.; Borgianni, Y.; Nonino, F. Estimating the value of servitization: A non-monetary method based on forecasted competitive advantage. J. Clean. Prod. 2018, 200, 74–85. [Google Scholar] [CrossRef]
  41. Wen, H.W.; Chen, W.J.; Zhou, F.X. Does digital service trade boost technological innovation? International evidence. Socio-Econ. Plan. Sci. 2023, 88, 101647. [Google Scholar] [CrossRef]
  42. Burri, M. Designing Future-Oriented Multilateral Rules for Digital Trade; Edward Elgar Publishing: Cheltenham, UK, 2015. [Google Scholar] [CrossRef]
  43. Kong, D.; Lin, C.; Wei, L.; Zhang, J. Information Accessibility and Corporate Innovation, Working article. SSRN 2018. [Google Scholar]
  44. Meltzer, J.P. Governing Digital Trade. World Trade Rev. 2019, 18, 1–26. [Google Scholar] [CrossRef]
  45. Akcigit, U.; Caicedo, S.; Miguelez, E.; Stantcheva, S.; Sterzi, V. Dancing with the Stars: Innovation Through Interactions, Working article. NBER 2018, 24466. [Google Scholar]
  46. Shen, G.B.; Yuan, Z.Y. The Impact of Enterprise Internetization on Chinese Enterprise Innovation and Export. Econ. Res. 2020, 55, 33–48. [Google Scholar]
  47. Binz, C.; Truffer, B. Global Innovation Systems—A conceptual framework for innovation dynamics in transnational contexts. Res. Policy 2017, 46, 1284–1298. [Google Scholar] [CrossRef]
  48. De-Prato, G.; Nepelski, D. Global technological collaboration network: Network analysis of international co-inventions. J. Technol. Transf. 2014, 39, 358–375. [Google Scholar] [CrossRef]
  49. Bruno, R.L.; Crescenzi, R.; Estrin, S. Multinationals, innovation, and institutional context: IPR protection and distance effects. J Int Bus Stud 2022, 53, 1945–1970. [Google Scholar] [CrossRef]
  50. Dai, X.; Wu, J.; Yan, L. A Spatial Evolutionary Study of Technological Innovation Talents’ Sticky Wages and Technological Innovation Efficiency Based on the Perspective of Sustainable Development. Sustainability 2018, 10, 4201. [Google Scholar] [CrossRef]
  51. IDB, ICTSD. Digital Trade-Related Provisions in Regional Trade Agreements: Existing Models and Lessons for the Multilateral Trade System; IDB, ICTSD: Geneva, Switzerland, 2017. [Google Scholar]
  52. Peng, Y.; Yang, B.Z. The Third Country Trade Effect of Digital Trade Rules in Regional Trade Agreements: Transfer or Spillover. Int. Trade Issues 2023, 36–54. [Google Scholar]
  53. Organisation for Economic Co-operation and Development Database. Digital Services Trade Restrictiveness Index; Organisation for Economic Co-Operation and Development Database: Paris, France, 2020. [Google Scholar]
  54. European Centre for International Political Economy. Digital Trade Restrictiveness Index; European Centre for International Political Economy: Brussels, Belgium, 2017. [Google Scholar]
  55. Congressional Research Service. Digital Trade and U.S. Trade Policy; Congressional Research Service: Washington, DC, USA, 2017. [Google Scholar]
  56. Hahn, J.; Liao, Z.; Liu, N.; Sheng, S. Some finite-sample results on the Hausman test. Econ. Lett. 2024, 238, 111721. [Google Scholar] [CrossRef]
  57. Zhao, M. Conducting R&D in countries with weak intellectual property rights protection. Manag. Sci. 2006, 52, 1185–1199. [Google Scholar]
  58. Gao, Q. The Impact of Intellectual Property Barriers on Export Innovation Based on PSM-DID Method. Xinjiang Soc. Sci. 2019, 41–48. [Google Scholar]
  59. Khouilla, H.; Bastidon, C. Does increased intellectual property rights protection foster innovation in developing countries? A literature review of innovation and catch-up. J. Int. Dev. 2023, 36, 1170–1188. [Google Scholar] [CrossRef]
  60. Yu, D.H.; Wang, B.H. The Research on the Endogenous of the Technology Innovation Productivity and the Stochastic Change Effect: The Differential Affection of the Knowledge Capital and Human Resource Investment. South China J. Econ. 2020, 39, 76–94. [Google Scholar]
  61. Stock, J.H.; Yogo, M. Testing for weak instruments in linear IV regression. In Identification and Inference for Econometric Models: Essays in Honor of Thomas Rothenberg; Chapter 5; Cambridge University Press: Cambridge, UK, 2005; pp. 80–108. [Google Scholar]
  62. Richard, M. GMM Analyses of the Effects of Digital Services Trade on Economic Growth of Low, Middle and High Income Countries. Asian J. Econ. Bus. Account. 2022, 22, 1–22. [Google Scholar] [CrossRef]
Figure 1. Mechanistic framework.
Sustainability 16 05169 g001
Table 1. Descriptive statistics of main variables.
Variable Category Variable NameAbbreviationObservationMeanMedianStd. DeviationMinMaxData Source
Dependent variableTechnological innovation efficiencyIER4200.6840.6950.1360.2601.018WIPO
Explanatory variableDigital trade barriersDSTRI4200.1690.1440.10000.647OECD
Control variablePopulation SizelnPOP42016.8416.711.41713.2321.06World Bank
Strength of technological innovation network connectionsINLK42035.8935.5013.313.20082.50WIPO
High-Tech Export DependenceHT42015.3812.3612.670.25767.05World Bank
Service Trade OpennesslnST42024.5924.821.67120.7628.03World Bank
Education IndexEDU42048.7851.6012.9410.7086.30WIPO
Internet Development LevellnINT4207.2657.9182.8830.10912.53World Bank
Table 2. Benchmark regression results.
Variables(1)
IER
(2)
IER
(3)
IER
(4)
IER
(5)
IER
(6)
IER
DSTRI−0.214 ***−0.196 ***−0.212 ***−0.210 ***−0.210 ***−0.208 ***
(−2.74)(−2.61)(−2.81)(−2.81)(−2.82)(−2.78)
lnPOP−1.214 ***−1.126 ***−1.112 ***−1.032 ***−1.034 ***−1.046 ***
(−8.10)(−7.74)(−7.66)(−7.08)(−7.13)(−6.52)
INLK 0.003 ***0.003 ***0.002 ***0.003 ***0.003 ***
(5.27)(5.25)(4.94)(5.18)(5.17)
HT −0.002 *−0.002 **−0.002 *−0.002 *
(−1.86)(−1.97)(−1.77)(−1.73)
lnST 0.077 ***0.070 ***0.070 ***
(3.04)(2.78)(2.77)
EDU −0.001 **−0.001**
(−2.22)(−2.22)
lnINT −0.001
(−0.17)
Constant21.194 ***19.626 ***19.413 ***16.193 ***16.444 ***16.644 ***
(8.41)(8.02)(7.95)(6.14)(6.27)(5.77)
Observations420420420420420420
Country FEYESYESYESYESYESYES
Year FEYESYESYESYESYESYES
R-squared0.5760.6070.6110.6210.6260.626
Note: t-statistics in parentheses; *** p < 0.01, ** p < 0.05, and * p < 0.1.
Table 3. Robustness test—replacing core explanatory variables.
Variables(1)
IER
(2)
IER
(3)
IER
(4)
IER
(5)
IER
Infrastructure and Connectivity−0.240 ***
(−2.72)
Electronic Transactions 1.189 ***
(2.88)
Intellectual Property Rights 0.431
(0.23)
Payment System −0.896
(−1.51)
Other Barriers −1.390 ***
(−3.47)
lnPop−1.016 ***−0.936 ***−1.045 ***−1.021 ***−0.902 ***
(−6.32)(−5.69)(−6.43)(−6.29)(−5.48)
INLK0.003 ***0.003 ***0.003 ***0.003 ***0.003 ***
(5.16)(5.17)(5.26)(5.13)(5.19)
HT−0.002 *−0.001−0.001−0.001−0.001
(−1.86)(−1.32)(−1.39)(−1.15)(−1.04)
lnST0.067 ***0.065 **0.071 ***0.069 ***0.075 ***
(2.64)(2.55)(2.74)(2.70)(2.96)
EDU−0.001 **−0.002 ***−0.001 **−0.001 **−0.001 **
(−2.24)(−2.60)(−2.20)(−2.21)(−2.25)
lnINT−0.001−0.003−0.004−0.0040.001
(−0.13)(−0.34)(−0.48)(−0.59)(0.11)
Constant16.220 ***14.881 ***16.608 ***16.246 ***14.087 ***
(5.62)(5.06)(5.68)(5.58)(4.77)
Observations420420420420420
Country FEYESYESYESYESYES
Year FEYESYESYESYESYES
R-squared0.6260.6270.6180.6210.631
*** p < 0.01, ** p < 0.05, and * p < 0.1.
Table 4. Robustness test—replacing the dependent variable.
Variables(1)(2)(3)(4)(5)
K&T OutputsK&T OutputsR&D IndexR&D IndexR&D Index
DSTRI−9.145 **−14.247 ***8.442 *14.782 **15.412 **
(−2.14)(−2.70)(1.76)(2.24)(2.26)
Control variableYESYESYESYESYES
Observations420420420420399
Country FEYESYESYESYESYES
Year FEYESYESYESYESYES
R-squared0.3260.3680.0690.0790.086
*** p < 0.01, ** p < 0.05, and * p < 0.1.
Table 5. IV regression results.
Variables(1)(2)
DSTRIIER
DSTRI −0.414 ***
(−6.91)
L.DSTRI1.010 ***
(56.67)
Kleibergen–Paap rk LM 324.895 ***
[0.00]
Kleibergen–Paap rk Wald F 3211.459 ***
{16.38}
Control variableYESYES
Observations360360
Country FEYESYES
Year FEYESYES
R-squared0.9300.535
Note: () represents the z-statistic; *** represents the significance levels of estimated coefficients of 1%. The p-value of the statistic in []; {} represents the critical value of the Stock Yogo test at the 10% level.
Table 6. Heterogeneity analysis based on innovation capacity and organization differences.
Variables(1)(2)(3)(4)
WeakStrongOECD MemberNot OECD Member
DSTRI−0.238 **−0.137−0.221 *−0.379 **
(−2.10)(−0.59)(−1.79)(−2.15)
Control variableYESYESYESYES
Observations266154252168
Country FEYESYESYESYES
Year FEYESYESYESYES
R-squared0.7140.3100.4780.704
** p < 0.05, and * p < 0.1.
Table 7. Heterogeneity analysis based on national income differences.
Variables(1)(2)(3)(4)(5)(6)
DevelopedDevelopingHighUpper-MiddleLower-MiddleLow
DSTRI−0.273 **−0.347 *−0.273 **−0.263−0.963 ***0.225
(−2.19)(−1.92)(−2.19)(−1.45)(−3.12)(0.17)
Control variableYESYESYESYESYESYES
Observations245175245847021
Country FEYESYESYESYESYESYES
Year FEYESYESYESYESYESYES
R-squared0.4770.7070.4770.8710.7720.900
*** p < 0.01, ** p < 0.05, and * p < 0.1.
Table 8. Mechanism analysis.
Variables(1)
IER
(2)
IER
DSTRI−0.774 ***−0.719 ***
(−5.09)(−3.85)
DSTRI*INLK0.015 ***
(3.90)
DSTRI*GII 0.016 ***
(3.10)
GII0.015 ***0.014 ***
(15.54)(14.85)
Control variableYESYES
Observations420420
Country FEYESYES
Year FEYESYES
R-squared0.5950.815
*** p < 0.01.
Disclaimer/Publisher’s Note: The statements, opinions and data contained in all publications are solely those of the individual author(s) and contributor(s) and not of MDPI and/or the editor(s). MDPI and/or the editor(s) disclaim responsibility for any injury to people or property resulting from any ideas, methods, instructions or products referred to in the content.

