Abstract
Portugal is the country in Europe where the death rate in winter and summer has the highest correlation with outdoor temperatures. The Portuguese National Institute of Public Health Ricardo Jorge has developed a national warning system for heat waves called ICARO, which has been in place since 1999 (and is the oldest in Europe). However, it presents some limitations, namely, the low spatial resolution (five regions in Portugal’s mainland), the low temporal forecasting period (one day), and the fact that it was only accessible to health authorities until very recently. This work describes the development of a new public dashboard that uses a new early warning index for extreme weather events, the CLIMAEXTREMO index, which extends the current warning system by improving the current forecasting models for risk by integrating new sources of public data and increasing the spatial and time resolution of the warnings to the municipality or the parish level. The new index is a combination of a new model to estimate the relative mortality increase (updating the model used in ICARO) together with a model of the indoor temperature of building archetypes for all municipalities and a vulnerability index that considers socio-demographic economic indicators. This work discusses the results of the new risk indicator for the heat waves that occurred in Portugal at the end of June and mid-August 2023, and it shows that the index was able to indicate a high risk for the municipalities that had an increase in the number of deaths during that period.
1. Introduction
Portugal is the country in Europe where the death rate in winter has the highest correlation with outdoor temperatures, although it has one of the mildest winter climates [1,2]. The same happens in summer during extreme heat periods [3]. This is explained by the fact that most buildings in Portugal do not comply with the minimum requirements regarding thermal comfort conditions [4]; the occupants’ low average incomes along with high energy prices [5]; and the aging of the population [6], since elderly people have fewer physiological mechanisms to handle large and sudden variations of temperature.
Over the last decades, the Portuguese National Institute of Public Health Ricardo Jorge (INSARJ) has developed a national warning system for extreme heat periods (“ICARO”) and extreme cold periods (“FRIESA”) that might have a potential impact on mortality [3]. Based on the weather forecast, these systems calculate a risk measure at the regional level, which is then used by different public agents to implement actions previously defined in contingency plans to minimize the risks to the population (e.g., reinforcement of hospital staff during the extreme cold or heat periods).
This work aimed to develop a public geographic dashboard with real-time information and a high spatial resolution on the building occupants’ health risk during extreme weather events—heat and cold. The objective of the dashboard was to extend the current surveillance capabilities in two dimensions:
- Improving the current forecasting models for risk by integrating new sources of public data;
- Increasing the spatial and time resolution of the warnings, if possible, to the municipality or the parish level and for longer forecasting periods (7 days).
The model and the data are available in a public dashboard at http://climaextremo.tecnico.ulisboa.pt (accessed on 29 April 2024) that can be accessed by different public authorities or the general public. The information is updated every day for the next week. The webpage enables any institution or person to get direct warnings regarding a specific location (for example, managers of nursing homes; citizens who wish to have specific warnings regarding their parents’ or relatives’ residences; and policymakers, namely, indirect public administration, such as municipalities). The underlying research hypothesis is that the new proposed risk model can predict the locations where extreme weather events will have more impact on the population’s well-being with a higher accuracy.
This work contributes to predicting and communicating the impact of climate change on public health by proposing an innovative multidisciplinary approach to improve social well-being in cities and territories. In this way, this work contributes to three sustainable development goals for 2030: good health and well-being (goal 3) by ensuring healthy lives and promoting well-being for all at all ages; sustainable cities and communities (goal 11) by making cities and human settlements inclusive, safe, and resilient; and action on climate change (goal 13) by taking urgent action to combat climate change and its impacts [7].
The rest of this article presents the relevant literature review on the topic, describes the methodology to calculate the new risk index, and analyzes the risk warning results for the heat waves that occurred in Portugal at the end of June and mid-August of 2023.
2. Review of the Literature
2.1. Climate Change and Heat Waves
Extreme weather events, like heat waves, have become more frequent and intense across most land regions since the 1950s, according to the Sixth Assessment Report from the Intergovernmental Panel on Climate Change (IPCC) [8]. All regions in the globe are affected. In terms of the impact on society, heat waves are happening more regularly, starting earlier and ending later. Temperatures over 40 °C and even 50 °C are becoming increasingly frequent in many parts of the world, posing a major threat to human health and well-being. The risks of climate change to cities, settlements, and key infrastructure will rise rapidly in the mid- and long-term with further global warming, especially in places already exposed to high temperatures, along coastlines, or with high vulnerabilities.
Limiting global warming to 1.5 °C instead of 2 °C could result in around 420 million fewer people being frequently exposed to extreme heat waves [9]. Two extreme heat waves in 2003 (western Europe) and 2010 (Russian Federation) accounted for 80 percent of weather-related deaths in Europe from 1970 to 2019. The lessons learned from the 2003 heat wave were instrumental in ushering in heat–health early warnings and action plans [3]. In Portugal, the effects of extreme heat on health, specifically on mortality, in situations where there is a sudden and intense temperature increase have been identified [10]. The same is true for other extreme events like extreme cold days, especially when the incidence of influenza is high [6].
The World Health Organization (WHO) defines a “heat wave” as a period characterized by abnormally high temperatures during consecutive days for the time of year. Relative humidity, wind speed, and the habituation of the population to the climate of a given region affect people’s ability to withstand this climate situation.
The effects of heat waves on the environment (such as increased concentrations of airborne contaminants such as ozone, deterioration of water quality or reduced availability of water, and the spread of pathogens) may contribute to the development of diseases such as allergic rhinitis, diseases related to the consumption of and contact between water and food, and diseases transmitted by vectors. There is an association between excess mortality and the existence of periods of three or more consecutive days of unusually high temperatures. This association is observed on the first day, or with a delay of up to three days after the rising temperatures. Changes in the frequency and intensity of extreme climatic events can pose a serious risk to human health and are associated with a higher number of deaths, as well as heart and respiratory problems aggravated by air pollution. In regions with greater difficulties in the supply of drinking water, there is also an increase in the diseases transmitted by water and food.
The effects of heat waves depend on exposure (frequency, severity, and duration), size, and the vulnerability of the exposed population. The occurrence of extreme temperatures in early summer is often associated with higher mortality when compared to that observed in exposure during the rest of the summer. In cities, the events can be exacerbated by the “heat island effect”, which describes the existence of temperatures higher than those observed in peripheral areas, since materials like asphalt and concrete reflect less sunlight and absorb more heat than natural surfaces. This effect intensifies the phenomenon of “thermal stress” and affects the health of people and the comfort of the inhabitants of the cities; it also has consequences for the air quality and the consumption of water and energy.
The impact of ambient temperature on health is becoming an increasing matter of concern with climate change and the aging of the population. Significant excess mortality is associated with extreme cold and heat periods and there is a significant short-term effect of ambient temperature on morbidity [11]. Most of the available studies on the association between ambient temperature and health relate to outdoor climate conditions. People spend most of their time indoors, particularly more vulnerable groups like infants or the elderly. However, studies that have assessed the association between indoor thermal comfort and health are scarce, their study methods differ, and the quality and consistency of the evidence is variable. In this work, we consider that the indoor temperature is an important factor to take into consideration [12].
2.2. Heat Wave Definitions
There is no universally acceptable definition of heat waves [13]. They are understood to be periods of unusually hot and dry or hot and humid weather that have a subtle onset and cessation, a duration of at least two to three days, and a discernible impact on human activities [14]. During such periods of hot weather, not only do daytime temperatures reach high values but nocturnal temperatures and humidity levels may also rise well beyond their long-term mean. Heat waves are relative to a location’s climate; the same meteorological conditions can constitute a heat wave in one place but not another. Similarly, not all heat wave events are the same as their spatial extent, and the intensity may vary considerably across a region.
In this way, different countries adopt different definitions. However, they share the commonality of considering that a heat wave happens when, for more than a few days, the temperatures (usually but not exclusively the maximum) are above a certain threshold that is defined using the historical temperature series.
For example, in the US, the National Oceanic and Atmospheric Administration (NOAA) considers a heat wave as a period of abnormally and uncomfortably hot and unusually humid weather that typically lasts for two or more days. The Environmental Protection Agency (EPA) further specifies that a heat wave is a period of two or more consecutive days when the daily minimum apparent temperature (the actual temperature adjusted for humidity) in a particular city exceeds the 85th percentile of the historical July and August temperatures (1981–2010) for that city [15].
In Australia, a heat wave is a climatic event when, during three or more days in a row, both daytime and night-time temperatures are unusually high compared to the local long-term climate and the recent past. However, there is no single temperature threshold for a heat wave in Australia. For each part of the country, the forecast of the maximum and minimum temperatures for each three days in the coming week is compared to the average temperatures expected for that location at that time of year and to the observed temperatures over the last 30 days [16].
In Madrid, Spain, a heat wave occurs when the daily maximum temperature surpasses the threshold of 34 °C in the Observatory in Madrid [17]. For the UK, Ref. [18] uses the same definition as [13], which considers a heat wave to be a period with three or more consecutive hot days, where a hot day is a day that lays in the 95th percentile of the historical data for a moderate heat wave or in the 98th percentile for an extreme heat wave.
In Portugal, the national weather forecast agency IPMA adopted the World Weather Organization and considers that a heat wave occurs when, in a period of six consecutive days, the maximum air temperature is 5 °C higher than the average value of the maximum daily temperatures in the reference period (1981–2000) [19].
The main challenge with heat wave definitions using historical data is that, due to climate change, it is easy to observe two or more days with temperatures higher than the statistical average. That may explain the significant increase in heat wave events over the last decade, but these events do not necessarily pose any considerable health challenges. Therefore, a warning system for extreme heat or cold periods should consider more than the outdoor temperature.
2.3. Heat–Health Warning Systems
Heat–health warning systems (HHWSs) are used worldwide as the main system to alert decision-makers and the public of dangerous heat situations [20]. The different systems around the world can be categorized into two main groups: one based on weather forecasts and another based on weather–health relations.
The ones based on weather forecasts usually use a color code or numerical scale to indicate the level of associated risk or severity of the heat wave. In most countries, this level is exclusively based on the utilization of the single metric of temperature or a modified form of temperature (average, percentile) [14]. Some also include a minimum duration of the heat event and/or are based on a combination of several meteorological variables or indices like relative humidity.
Regarding the methods that assess the weather–health relations, the first component is to choose the variables that describe that relation and define the threshold(s) of the weather variable(s) linked to the impact (e.g., in the epidemiological studies that study the associations between temperature and mortality). The thresholds trigger a system of graded alerts, often related to specific actions for specific target groups, which are then used to advise governmental agencies about the severity of health impacts [21]. The communication of the warnings to the general population is usually performed through media using press releases.
2.4. The Existing HHWS for Portugal
In Portugal, the weather forecast-based system provided by the national authority for weather forecasts (IPMA) uses a three-level warning system (yellow, orange, and red) based on the WMO definition, where for each district (18 in the mainland) there is a temperature threshold for each level (yellow, orange, and red) above which it is considered that a heat wave is occurring if the threshold is surpassed during two or more days [22].
The heat–health-based system is the ICARO national warning system. This system was developed by the INSARJ in 1999 for heat waves [23]. Every working day between May and September, a bulletin reporting a risk level for each of the five mainland health regions is shared with a list of the healthcare institutions—the Directorate-General of Health (DGS), the Regional Health Administrations (ARSs), the Civil Protection Authority (ANPC), and local agencies (municipalities, police, and fire officers)—that implement measures to mitigate the possible effects predicted by ICARO system. ICARO is a numerical measure of the potential risk that high ambient temperatures have for the health of the population, which can lead to death. It compares the deaths predicted by the statistical model underlying ICARO with the expected deaths without the effect of the extreme temperatures. The values are greater than or equal to zero and correspond to a relative excess of risk at the regional level. A similar index has been used since 2015 for extreme cold periods (“FRIESA”): FRIo Extremo na SAúde [6].
2.5. Guidelines to Improve the HHWS
According to the World Health Organization and World Meteorological Organization, the development of an HHWS should follow a set of guidelines [9].
A warning is the process by which people are made aware in advance of actual or potential harm. How warnings are communicated is one of the critical determinants of the success of an HHWS, and, therefore, the use of emerging communication technologies is increasing. This enables precise and targeted communication with specific groups like the elderly. Warning messages need to be composed in clear, unambiguous language. Finally, knowing the factors that influence human responses to warnings can assist with the development and implementation of communication and education strategies.
2.6. Designing a Risk Indicator for Heat Waves
Natural disasters can be defined as a combination of the natural hazards—forest fires, floods, hurricanes, earthquakes, and heat waves—and vulnerabilities that endanger vulnerable communities that are incapable of withstanding the adversities arising from them [24]. Previous knowledge of the natural hazards and potential impacts is essential to authorities to design strategies to minimize the impact in communities, which is known as disaster management.
In disaster management, the use of a risk indicator is often designed to describe the ability of a population to absorb and ultimately recover from the effects of the hazard, that is, the exposure to an event that might present a grave threat to its people and economy given the level of vulnerability of the population and the available resources to mitigate the hazard. The main objective of designing a risk indicator is to allow the development of actions that can hinder the impact of certain events and therefore increase the resilience of systems by implementing a mix of dynamic and static responses [25].
Risk indicators are usually defined as a function of hazard, exposure, and vulnerability [26,27], as proposed in the following equation:
where R is the risk; H is the Hazard and θH are the variables that define the hazard; E is the Exposure and θE are the variables that define the exposure; and V is the Vulnerability and θV are the variables that define the vulnerability. This approach has already been used to address the risk assessment for a heat wave in [28], following the IPCC Fifth Assessment Report.
Hazard is a natural phenomenon or human activity that may cause loss of life, injury or other health impacts, property damage, social and economic disruption, or environmental degradation. For the risk calculation, hazard generally describes the likelihood of the event. In the case of extreme heat periods, it can be evaluated using weather forecast methods, for example, when a certain temperature is above a certain historical threshold.
Exposure in risk analysis is usually a measure of the losses related to a specific asset. In the case of natural phenomena, it may refer to the losses of the people or infrastructure affected by hazardous events. In cases of extreme heat periods, it can be evaluated by the increase in mortality.
Vulnerability is defined generically as the propensity or predisposition to be adversely affected. Such predisposition constitutes an internal characteristic of the affected element. In the field of disaster risk, this usually includes the characteristics of a person or group and their situation that influence their capacity to anticipate, cope with, resist, and recover from the adverse effects of physical events [29]. For the risk calculation, vulnerability describes the likelihood of the consequences (e.g., the age of the population).
Risk results from a combination of the three items, and each of the three items may also result from the combination of multiple variables. The way these variables are combined affects the index itself [30]. The combination may be an additive normalization approach based on the summation of the values of multiple indicators that are assumed to contribute to the item or the risk. It may or may not be weighted to express some relative importance among the variables. When the number of variables is very high, a variable reduction approach using methods like Principal Component Analysis may be used. This approach reduces partly collinear indicators to a smaller number of unitless uncorrelated variables.
The additive approach is favorable when it is assumed that each factor adds a different element to the overall composite index; as a result, it will be used for the global risk indicator. For the vulnerability calculation, as it depends on many variables that can be correlated, a variable reduction approach will be used.
3. Materials and Methods
The main objective of this work was to improve the national HHWS working since 1999. According to the framework previously described, the existing index (ICARO) can be seen as a risk indicator that uses the hazard and exposure dimensions but does not include the vulnerability. In this way, the CLIMAEXTREMO index improves the existing system in five ways.
First, it was important to improve the exposure dimension, namely, the models that correlate the incidence of extreme weather events with the type of events in the healthcare system (e.g., people seeking health treatment and deaths). Secondly, as it is known that indoor conditions play such an important role in exposure, it was important to explicitly include the impact of outdoor temperatures in indoor environments. Thirdly, it was necessary to explicitly include the vulnerability dimension by updating the previous work of [30], which presents a vulnerability map for Portugal based on socio-economic information from the census of 2011 and the impact of the heat wave in 2013. Here, we updated the socio-economic data, used more detailed datasets for several of the variables, and ran the model for the heat wave of 2018. Fourthly, it was important to provide this information with a more detailed spatial resolution than the current five health regions. The objective was to increase, at least, to the municipality level in the mainland (278) and, if possible, to the parish level (3091). This implied the collection of data and the development of models at the municipal or parish level for hazard, exposure, and vulnerability dimensions. Finally, the index was calculated for the next seven days, taking advantage of the improved weather forecast models.
In the following sections, we describe in detail the methods used for the risk index calculation.
3.1. Hazard: Thermal Comfort and Indoor Temperatures
In recent years, Portugal has been particularly affected by extreme weather events, such as the droughts of 2004/2005 and 2011/2012 and the fact that the spring of 2009 was the driest since 1931. The prolonged drought periods associated with a considerable increase in the number of fires resulted in higher periods of high temperatures, which might have also contributed to the increased risk of desertification. The heat wave of 2003 was associated with an excess mortality of 1953 deaths, particularly severe in people aged 75 or over [31]. In 2010, there were four climatological heat waves between 17 May and 11 August, and it was estimated that the excess mortality for these periods of intense heat reached 2167 deaths [32]. It is expected that the average annual temperature rises for Portugal, with a marked increase in maximum temperatures and, consequently, an increase in the number of days with very high temperatures—above 35 °C—and an increase in the number of tropical nights, with minimum temperatures above 20 °C. Thus, the number of heat waves will also be more frequent and intense.
Thermal discomfort is not just a lack of satisfaction with the ambient temperature but reflects a situation where there is a potential threat to health—that is, when the indoor temperature falls below 18 °C or rises above 24 °C for a certain time. This range is based on the World Health Organization’s guidance on thermal comfort for the home environment, which is aimed at protecting health, particularly the health of those most susceptible to low or high temperatures [33]. The guidance is directed specifically at the housing environment and so differs from the Predicted Mean Vote and Predicted Percentage Dissatisfied, which are geared toward the working (office) environment and are inappropriate for households [34]. The WHO guidance, followed by most European countries, also recommends that for certain groups, such as the very young and the elderly (65 years and over), the lower limit should be 20 °C.
In a study on the relationship between the temperature and urban mortality in 12 cities with temperate, tropical, and subtropical climates, the temperature was associated with daily mortality and with an increased mortality risk at both extremes [35]. There are some forced or unavoidable responses or circumstances, where the occupier has few or no alternatives, and others that may be unintentional, where the occupier lacks the knowledge to adopt precautionary behavior to avoid either overheating or exposure to the cold characteristics of the dwelling or has a limited adaptive capacity.
The impact of heat waves in buildings can be estimated at different spatial scales, spanning from a mesoscale (below 1000 km) [36] to a microscale level (below 1 km) [37]. While is only possible to fully capture the complex composite impacts of the urban forms using microscale models, mesoscale models can reproduce the average behavior of variables like the mean radiant temperature, even in highly urbanized areas, although the spatial differences during daytime are not fully reproduced [36].
In this work, we proposed to use the indoor temperature as the hazard measure instead of the outdoor temperature. For that, we modeled the indoor temperature for all types of residential housing in Portugal at the municipality or parish level. As it is impossible to simulate each building of a large urban area, taking into account, in particular, the variability in building materials and insulation, as well as ventilation patterns or air conditioning systems, there is a need to use a simplified approach in the simulation of building energy, usually called building archetypes [38]. An archetype represents a share of buildings and is defined by the most statistically representative construction parameters, the average geometrical characteristics, and the systems for a certain location.
These archetype models were generated in Energy PlusTM, 23.1.0, a software tool that is mainly used for the simulation of thermal comfort and energy consumption. The program simulates air movements and the interactions between zones using the Transfer Function Method (TFM) for the calculation of thermal loads. This function has been adopted by ASHRAE and is regarded as one of the most accurate methods for the calculation of heating and cooling loads [39]. The TFM calculates the heating and cooling loads by initially computing the heat gains from walls, windows, floors, and roofs, and then by multiplying the heating loads by the heat transfer coefficients. It was demonstrated that this approach can accurately reproduce the indoor temperature for the whole year in residential settings in Portugal [40].
To generate the models, we used the data that specify the constructive solutions, materials, and systems available from the Energy Performance Certificates (EPC) database of residential buildings in Portugal, which has been issued since 2008 and covers more than 2 million households from different construction periods and types of buildings (from singular houses to multifamily apartment buildings) [41]. As there are hundreds to thousands of EPCs for each municipality, it was necessary to define which archetypes describe the existing buildings in that area. In the case of residential areas, the archetypes can describe single or multifamily buildings and buildings of specific construction periods (before 1919, 1919–1945, 1945–1960, 1961–1970, 1971–1980, 1981–1990, 1991–1995, 1996–2000, 2001–2005, and after 2006), in a total of twenty. These models were then simulated using the real weather data from the municipality for the past two weeks [42] and the forecasting data for the next week [43].
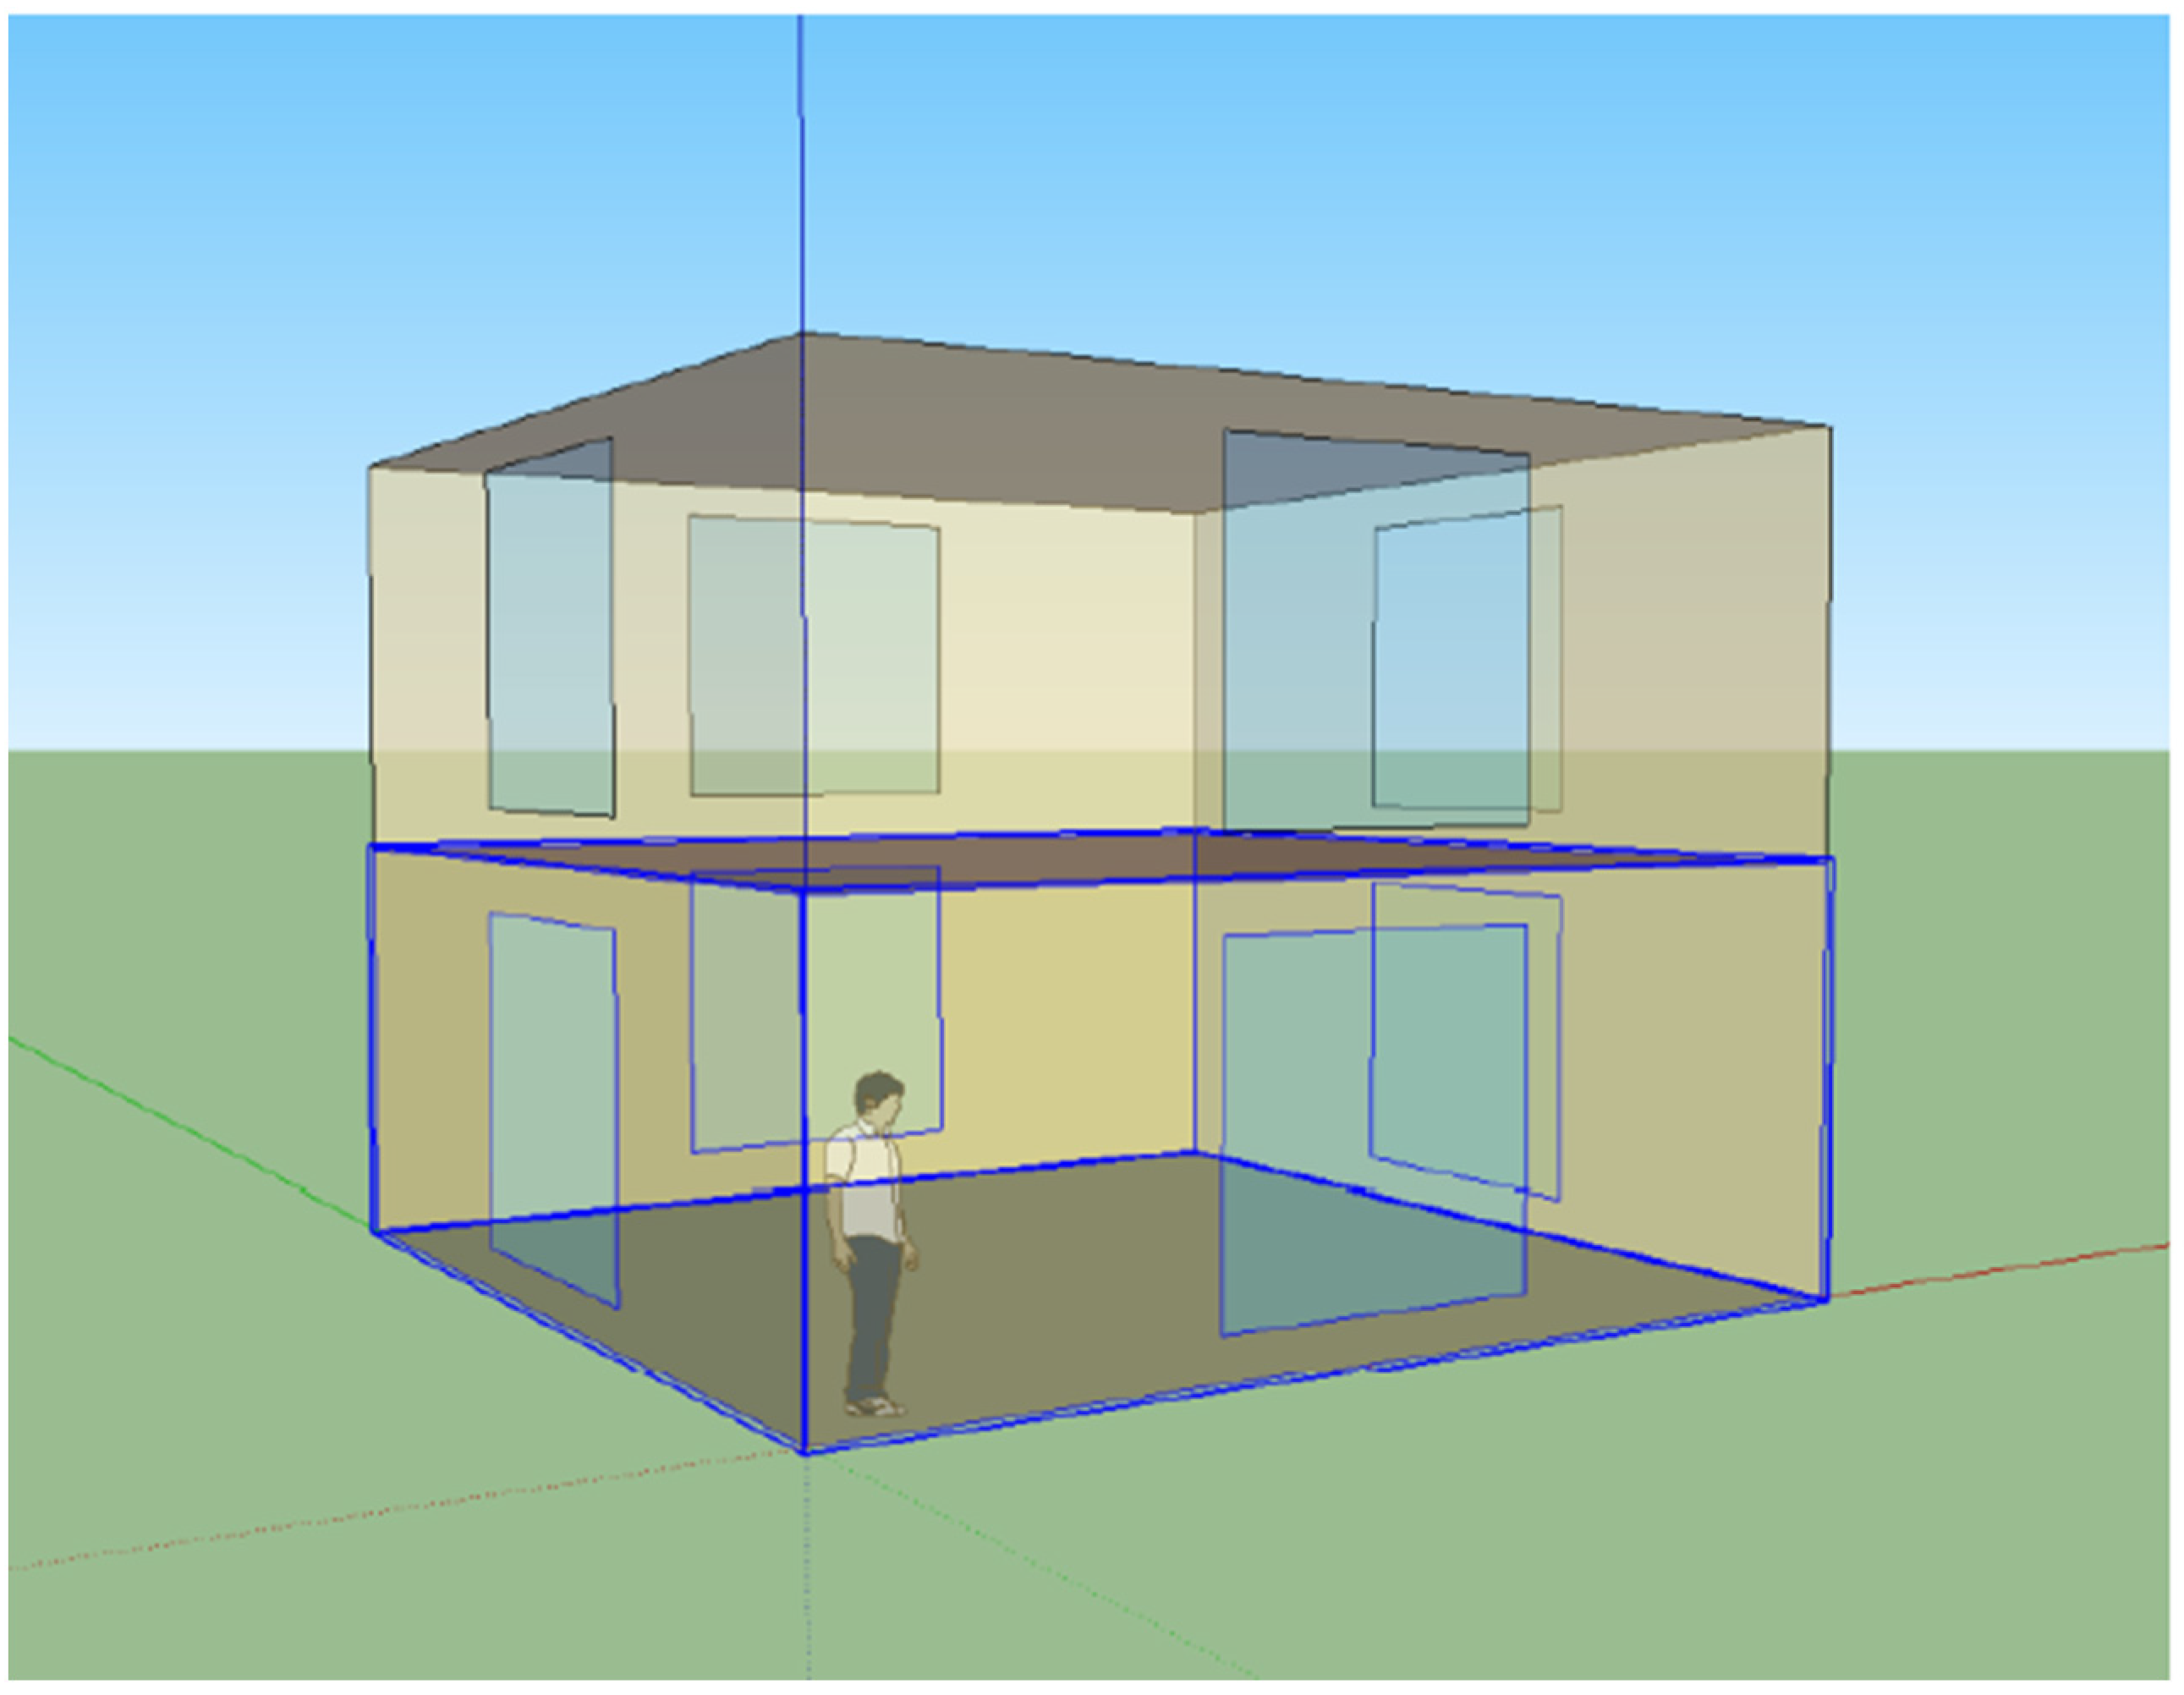
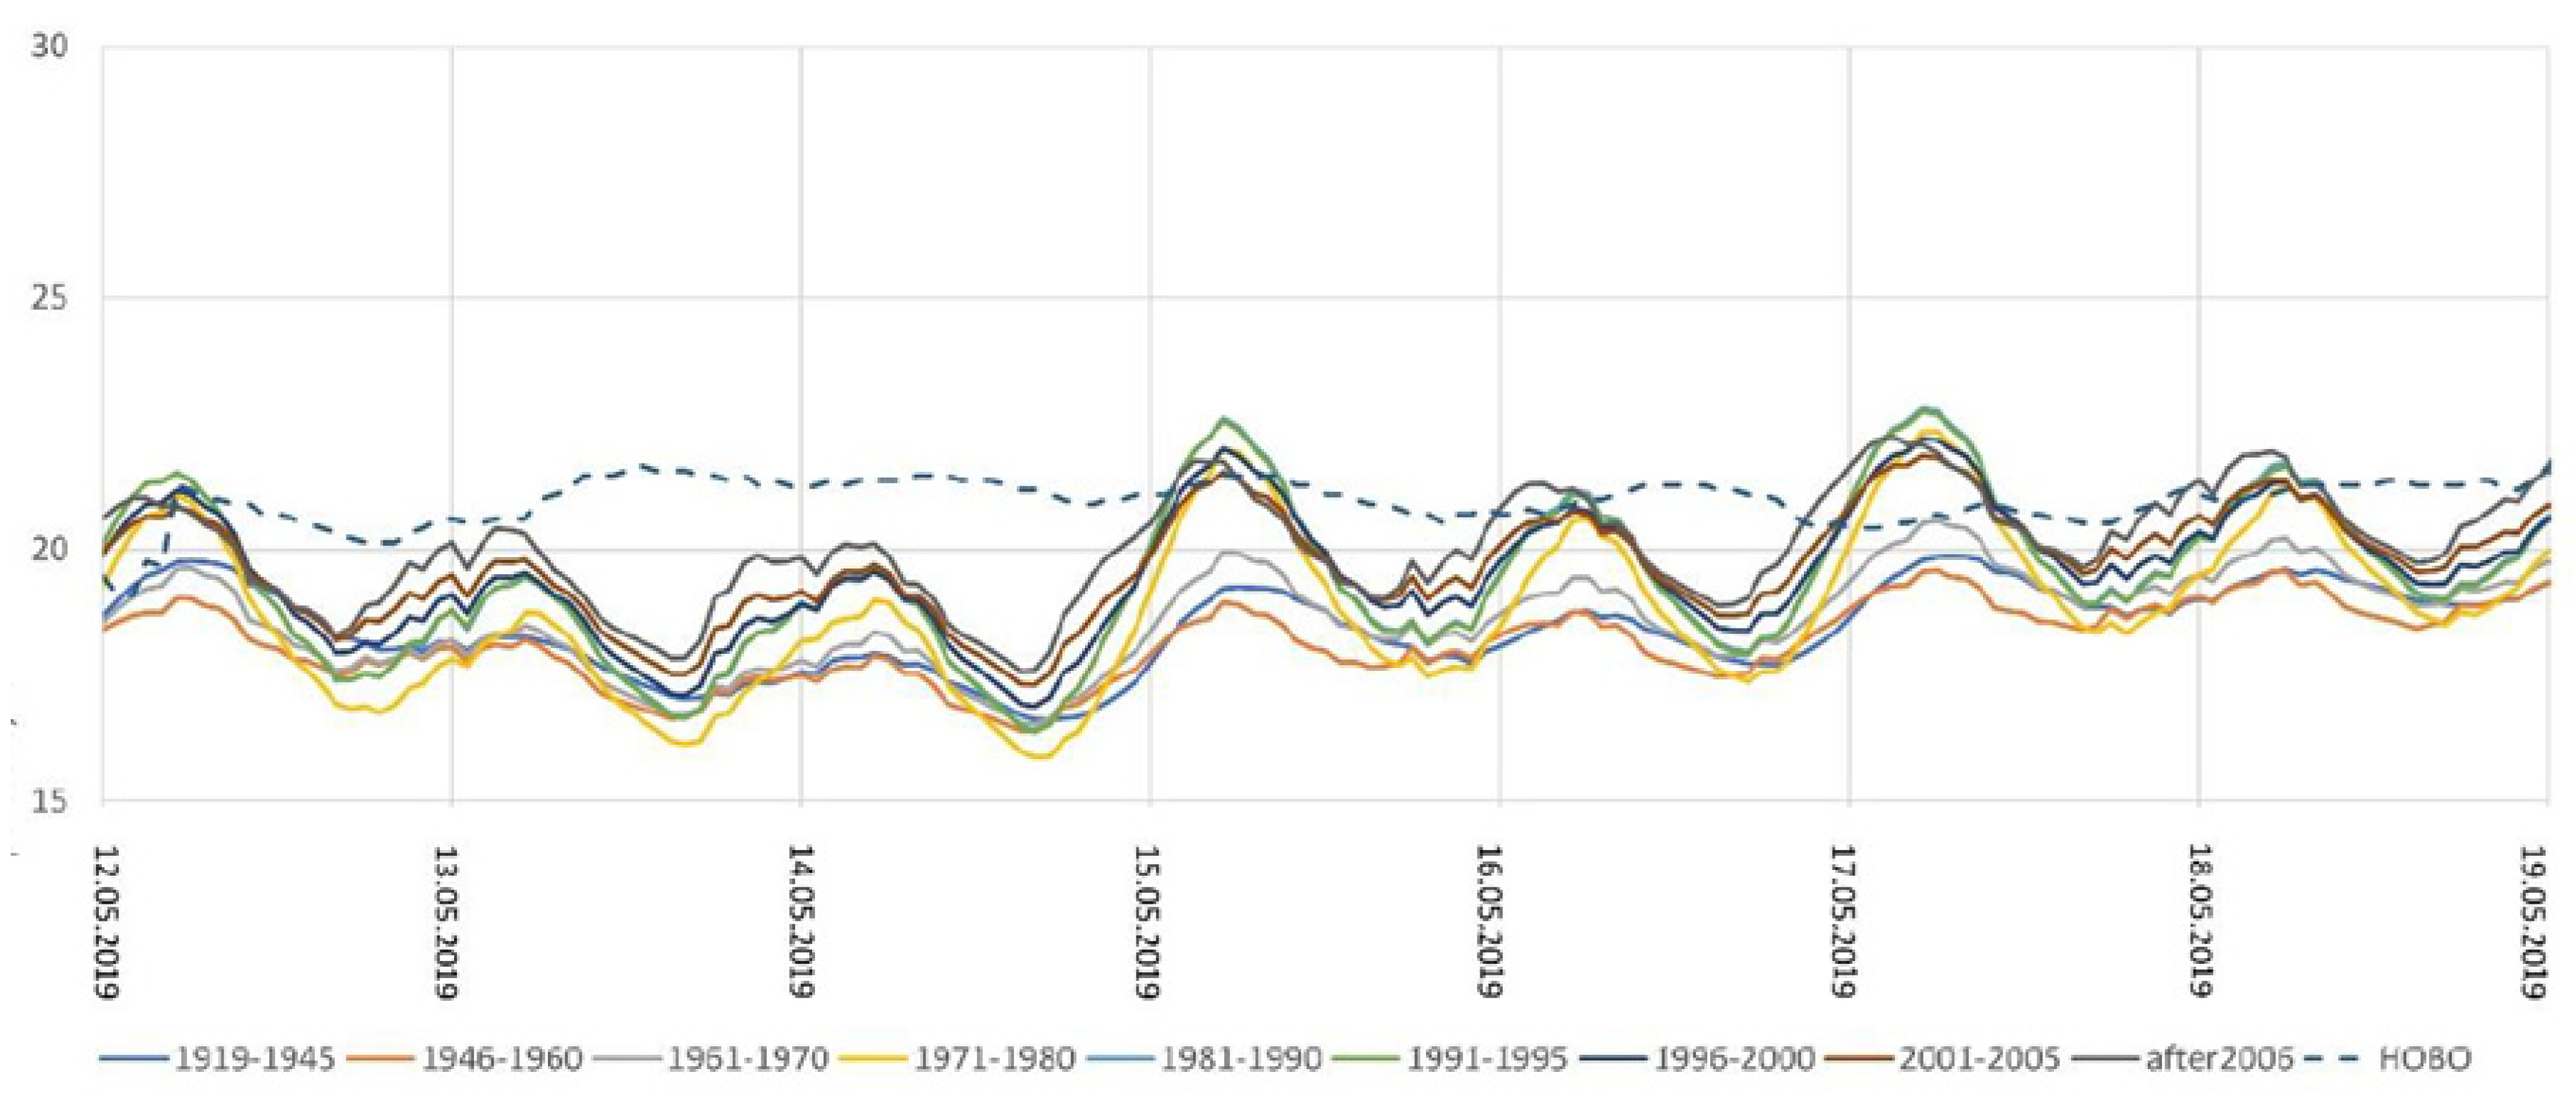
The results were validated for one archetype (1946–1960) in one municipality (Montalegre) with the real measurements for a month between May and June 2020. The archetype and the results are presented in Figure 1 and Figure 2. It shows a comparison between the Energy Plus model shown in continuous color lines for the different archetypes and the real indoor data, which is represented by a blue dashed line. The light-brown line represents the results for the Energy Plus model for the 1946–1960 archetype during a week with mild weather. Although for this week there was an average 2 °C difference, the performance complies with the ASHRAE guidelines for model validation, both in terms of MBE (4.02%) and cvRMSE (12.12.9%), which demonstrates the sensitivity of the model to the EPC data. Notice that the model was not calibrated specifically for the building’s constructive solutions, systems, or the occupants’ behavior.
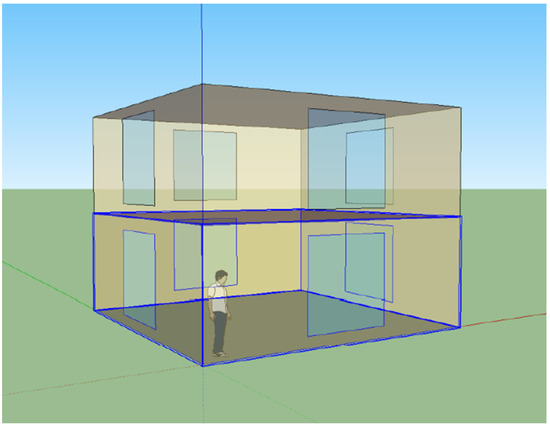
Figure 1.
Archetype model in Sketchup.
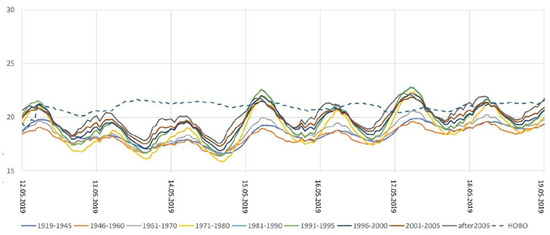
Figure 2.
Data validation for Montalegre municipality. The dashed line represents the real indoor measurements using a HOBO thermo-hygrometer and the different colors represent the results for the different local archetypes.
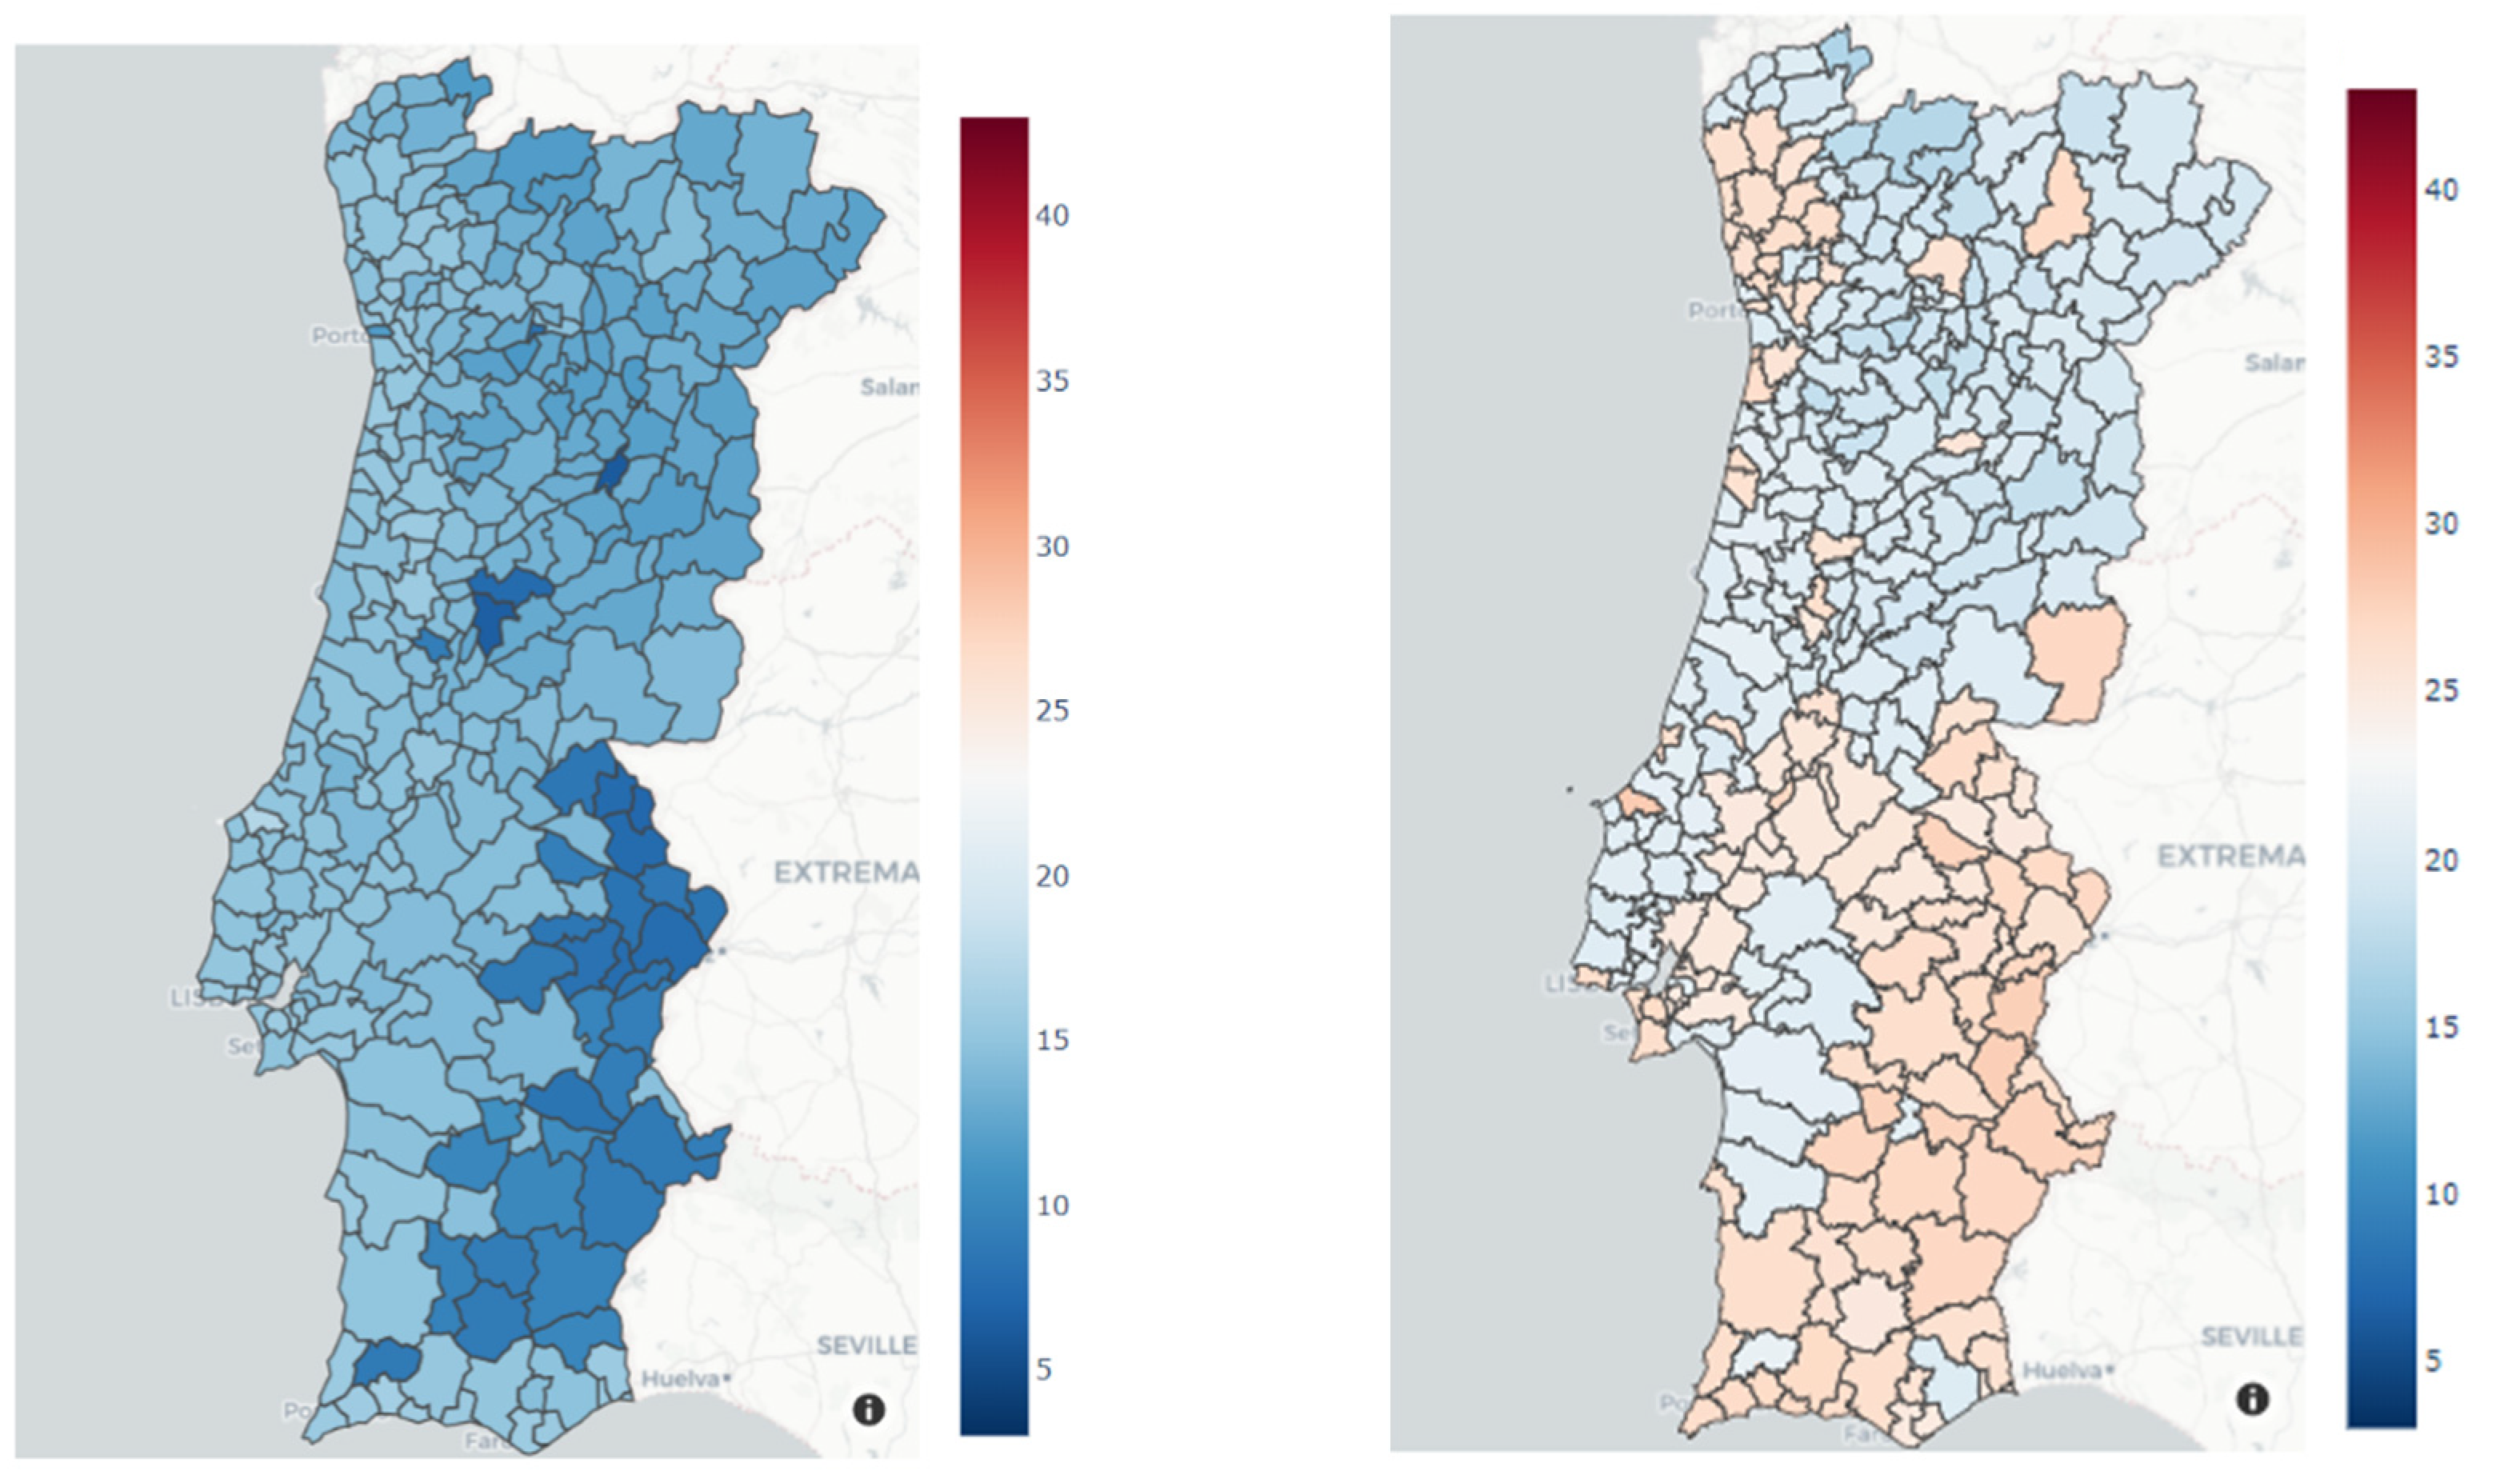
In this way, the twenty archetypes for all 278 municipalities were run daily using the weather forecast for the next week and considering the information from the previous weeks (to account for the thermal inertia in the models). In Figure 3, the lowest or highest temperature achieved in all archetypes during two extreme weather episodes (a cold wave on 2 March 2023 and a heat wave on 3 June 2022) is represented for each municipality. We can observe that, for winter, in some municipalities, the indoor temperatures are clearly below 18 °C (dark blue); for summer, in some municipalities, the model predicts indoor temperatures around 30 °C (orange), which are clearly above the thermal comfort threshold of 24 °C.
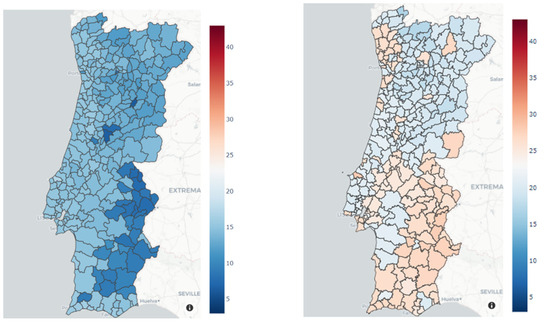
Figure 3.
The indoor temperature prediction for the worst archetype in each municipality during the cold wave on 2 March 2023 (left) and the indoor temperature prediction for the worst archetype for each municipality during the heat wave on 3 June 2022 (right).
3.2. Exposure: Increased Relative Risk (RR) of Mortality
The impact of heat waves on mortality or morbidity is normally derived from time series regression models that treat the occurrence of heat waves as a binary variable and do not control for temperature [44]. This caveat is partially overcome when the evidence for the attributable risk of temperature is accounted for [45]. Nevertheless, this approach is often restricted to extreme events and does not account for the continuity of temperature. One way to overcome this limitation is to rely on statistical modeling approaches that account for the complex temperature–mortality dependency, calculating the total mortality burden attributable to non-optimum ambient temperatures. The relation between excessive cold/heat varied in locations, showing the existence of an “optimal” temperature for minimized mortality and significant increases towards both extreme cold and heat conditions [45].
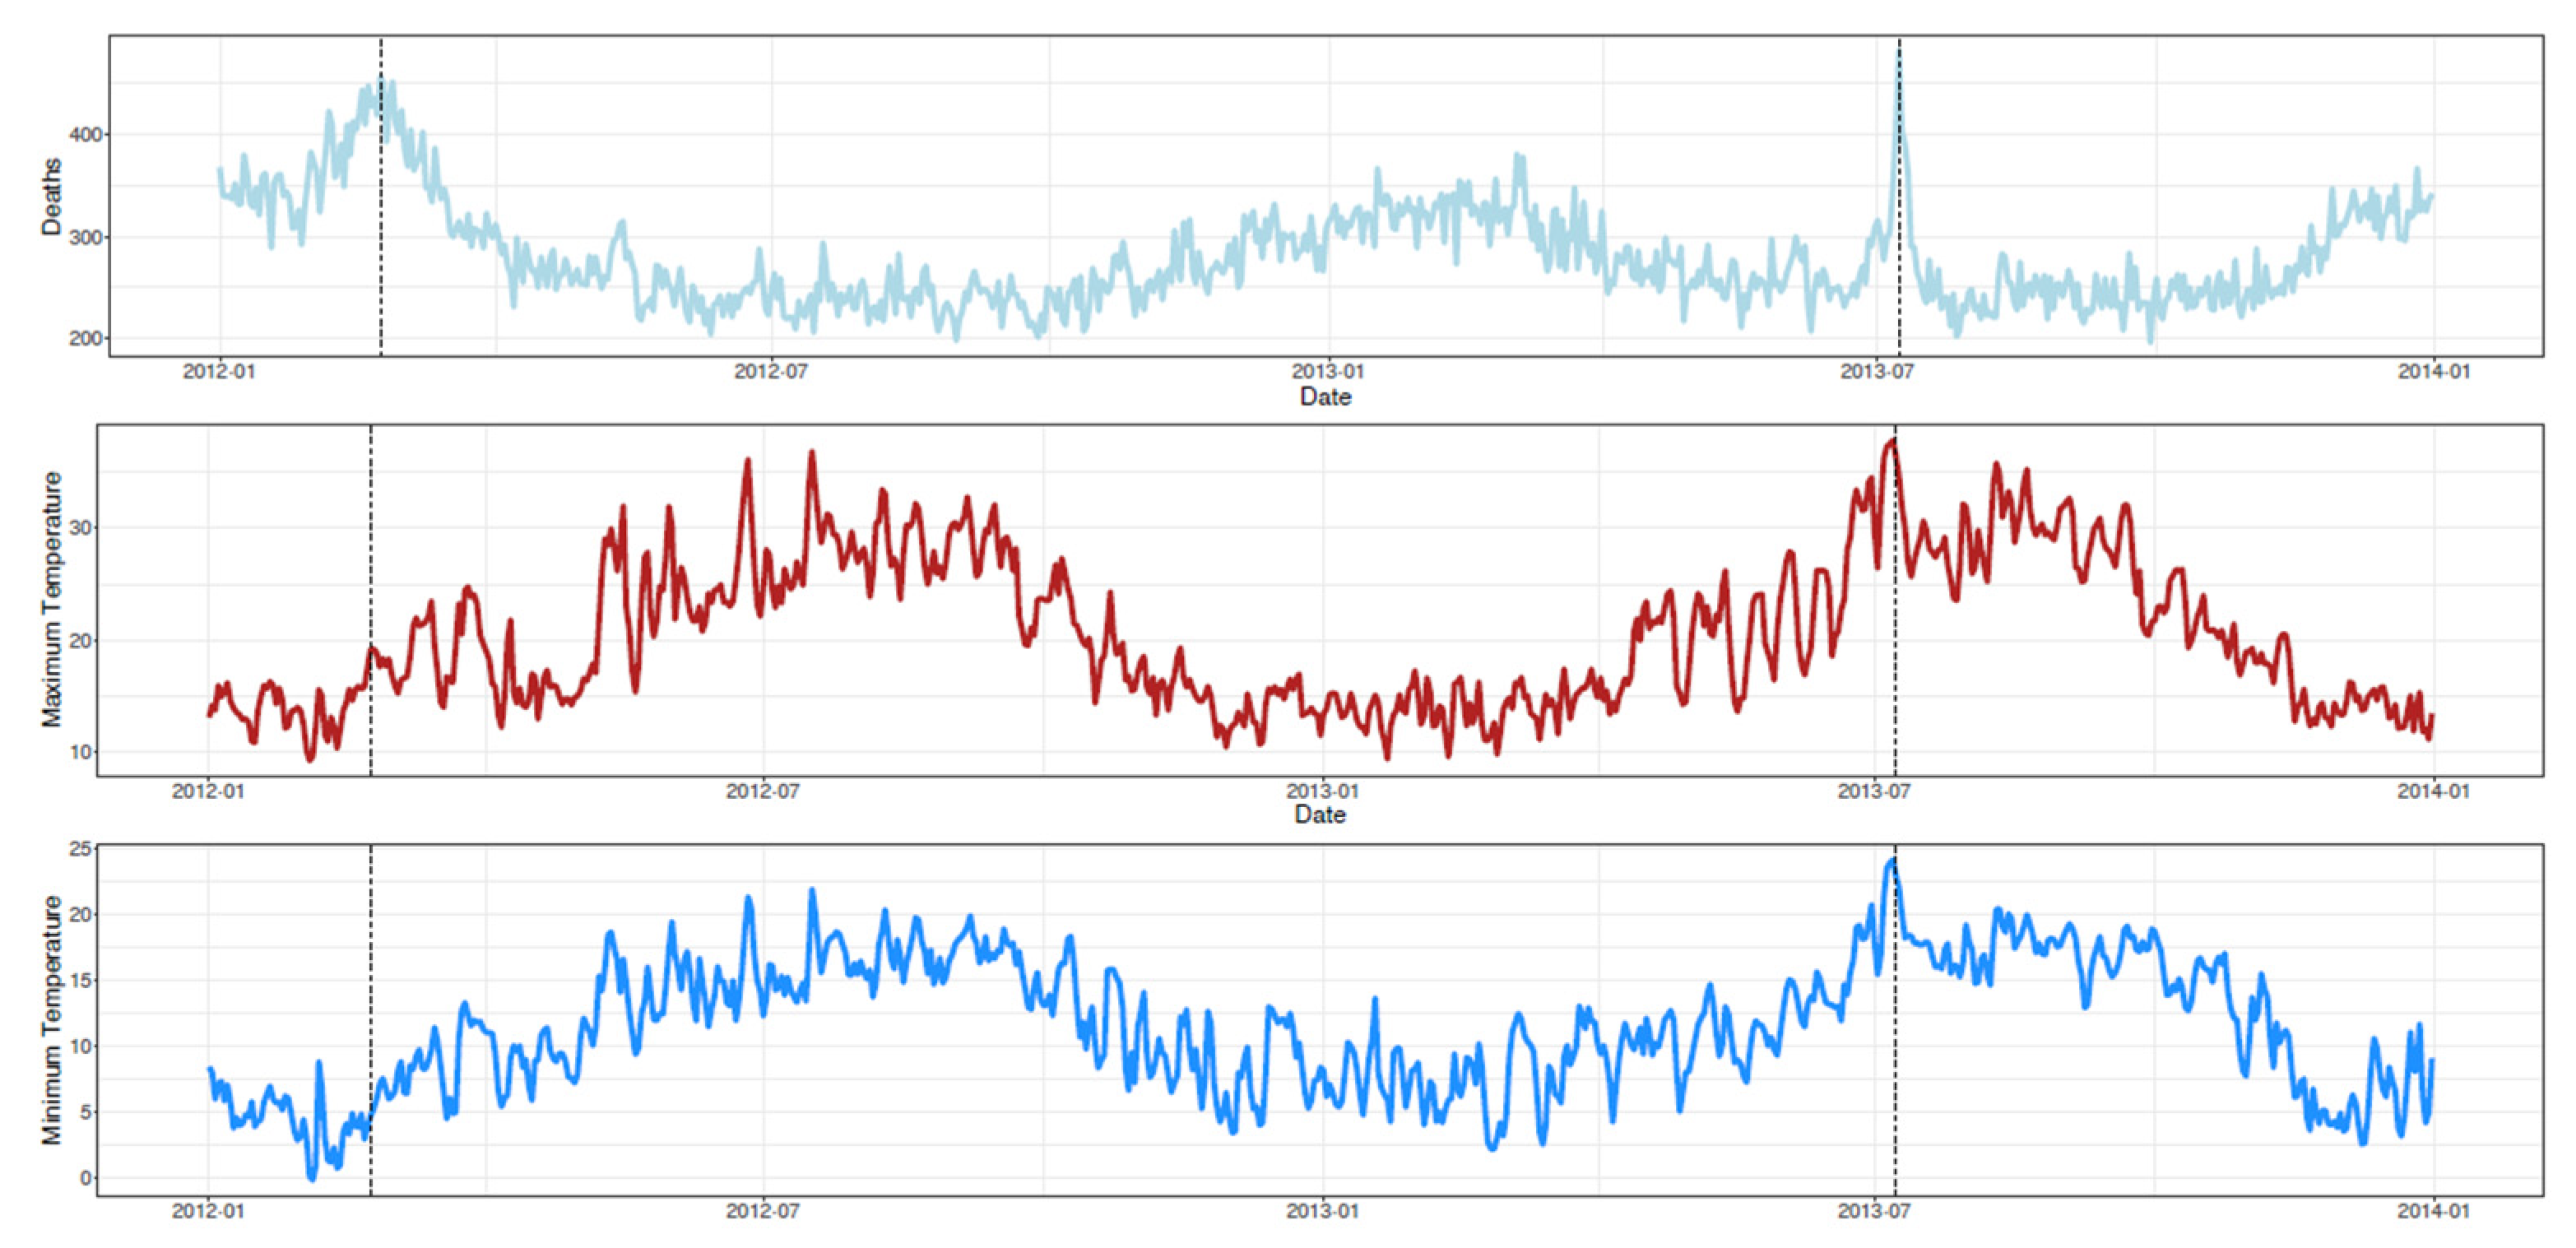
For this work, a generic model for the whole year (which includes heat and cold periods) was developed. The data include daily information about all-causes mortality [46], temperature [42], demographics [47], and influenza incidence. Focus was given to the 1995–2020 time period and to mainland Portugal. Statistics Portugal provided the demographic and daily mortality data disaggregated to the municipality level [47]. The meteorological data for each municipality was provided by MARETEC\LARSyS [43]. Additionally, the influenza incidence rate was provided by the INSARJ as a weekly indicator for the whole country. After performing a linear interpolation to get the daily values, we assumed the same value for all the municipalities Figure 4 displays the daily time series for the deaths and maximum and minimum temperatures at a national level for 2012 and 2013. During this period, 23 February 2012 and 8 July 2013 (identified with the dashed vertical lines) were the deadliest days. In the graph, it is clear that there is, in general, an inverse correlation between the number of deaths and the temperature (maximum and minimum), as the number of deaths is higher in winter. However, in summer, when the maximum temperature is above 30 °C, the number of deaths starts to increase.
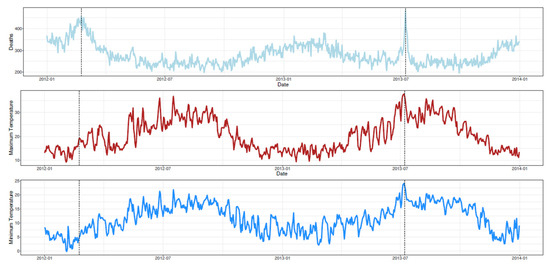
Figure 4.
Death counts and the maximum and minimum temperature time series for 2012 and 2013 (in mainland Portugal). The dashed lines correspond to the peak of deaths in 2012 (in the winter) and 2013 (in the summer).
Regarding the statistical modeling approach, Poisson regression models combined with distributed lag models were applied to assess the exposure–response relationship and the lag patterns of the association between the temperature (minimum and maximum) and the all-cause mortality from 1995 to 2019 in each area level of Portugal’s Mainland Districts [45,48]. The models were adjusted for the confounding effect of influenza, overdispersion, and population size. Due to the small numbers in some municipalities, the data were aggregated at the district level (18). For details, please refer to [49].
To aggregate the temperature data to the district level, we estimated a temperature index using the weighted average of the temperatures recorded in each municipality of a district, with the weights being the resident population number of each municipality according to national statistics.
Modeling at the district level still allows the risk forecast to be given at the municipality level, since we have decided to use municipality-specific exposures for the municipality-specific forecasts. To do this, we assumed that the characteristics of the effects of temperature on mortality estimated for the district would apply and generalized to each of the district’s municipalities.
Thus, the temperature thresholds were defined, below or above which there would be an expected temperature effect on mortality. The temperature thresholds corresponded to the quantiles in the distribution of the minimum and maximum temperatures for each district.
In this way, in the first phase, the temperature thresholds for each district were chosen based on which values improved the model fit. In the second phase, the models were used to estimate the daily relative risk (RR) values for each district and to obtain their distribution. The RR was calculated by the number of expected deaths given that day’s temperatures divided by the number of expected deaths for that day if none of the thresholds were exceeded. This provided us with the district-specific RR distribution, on which we based our daily risk indicator: if the index was 1 or below, the risk was 0; otherwise, it was 1, 2, or 3 if the RR was between 1 and 1.1, 1.1 and 1.2, and above 1.2 respectively.
Finally, and taking advantage of weather forecasts at the municipality level, it was possible to extrapolate the district-level model to the municipality scale. With maps A and B in Figure 5, we aim to present what types of warnings would have been issued to the whole country at the municipality level on both days. We can clearly see that the municipalities belonging to the same district have different warning levels, which reinforces the need to have higher spatial resolution in risk warnings.
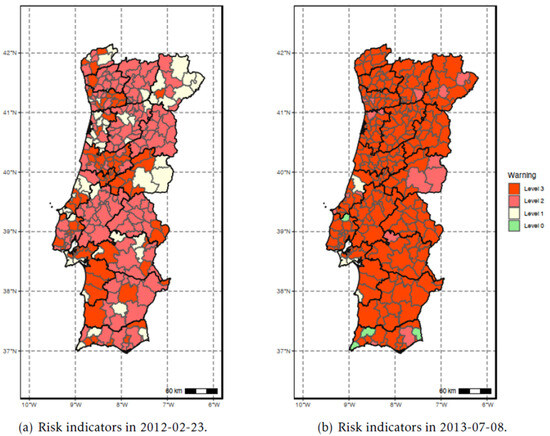
Figure 5.
Municipality-specific risk level, for: (a) 23 February 2012 (winter); (b) 8 July 2013 (summer). District and municipality borders are displayed in black and gray, respectively.
3.3. Vulnerability: Social, Economic, and Environmental Characteristics
There is not much information about the impact of heat on morbidity in Portugal, namely, its effect on hospital admissions, nor about the vulnerability of the Portuguese population to heat, taking into account the area where people live [50]. Some studies have an approach at the national or regional level, but it is known that there are variations. These spatial dissymmetries may be due to climatic contrasts on the one hand, and, on the other hand, the inequality of the vulnerability of populations. Nevertheless, a vulnerability index to identify and compare the geographical areas and local populations most vulnerable to the effect of extreme heat periods in mainland Portugal has been proposed [31]. In that study, nine variables known to be associated with vulnerability to the extreme heat effect of 2013 were analyzed. A principal components analysis was applied obtaining three variables that accounted for more than 70% of the total variance. The factor scores were then summed to obtain a vulnerability index. The results of this index can be seen in Figure 5 (left), where it is clear that spatial variability to the heat effect is found at the national level, generally being higher at the interior center and south of Portugal.
In this study, we followed the same approach using the results for the heat wave of 2018 and adding some additional socio-economic information at the municipality or parish level if available in [47]. The data cover nine variables in five dimensions: demographic data (to identify the percentage of elderly people, especially if living alone), economic factors (to determine income, as it has been demonstrated that a low-income population is more vulnerable to heat waves), health factors, building conditions (to determine the existence of cooling systems), and vegetation (to determine the existence of green vegetation, which helps to regulate temperature and relative humidity).
Regarding the demographic factors, as in the original study, we used demographic data from the 2021 and 2011 censuses, in order to interpolate the data for 2018. In detail, we considered the percentage of classic households with one individual in relation to the total classic households by parish; the percentage of classic households with an individual aged 65 or over, relative to the total number of classic families by parish; and the percentage of classic households with an unemployed, retired or disabled person, in relation to the total number of classic families by parish. All of these data are available in [47].
Regarding the economic factors, we consider as in the original study the unemployment rate in percentage, by parish of residence, but we include additional variables like the percentage of the population that has access to the energy social tariff and the average tax over individuals (IRS). All of these data are available in [47].
For the health factors, we consider the percentage of episodes (outpatient and inpatient) recorded in percentage of the resident population aged 65 and over, in relation to the total resident population, by municipality. These data are available in [46].
Regarding the building conditions, similar to the original study, we used the percentage of the resident population without air conditioning by parish, in relation to the total resident population; the percentage of buildings that need repairs by parish; as well as information from the Energy Performance Certificates regarding the access to air conditioning system. These data are available in [41,47].
Finally, regarding the vegetation, instead of the original percentage of the parish area not covered by vegetation or water bodies in the Corine Land Cover 2006, we used the Corine Land Cover 2018 data (the most recent available) [51].
The methodology was replicated from [31]. A factor analysis was performed and a compounded score for each observation was derived by calculating the sum of the factor scores, which reflects the number of standard deviations each observation’s score is from the mean. The number of factors was chosen based on the eigenvalues, with those having values above 1 being selected. The compound score in this analysis was calculated by summing the standardized factor scores from the variables that were most strongly associated with each factor, creating a composite index that encapsulated the cumulative influence of all the factors. This analysis showed that there are four compound variables that are related to health episodes during heat and cold waves. The compound variables are categorized in four levels (from 0 to 3) resulting in a final scale between 0 and 24. The compound variables include the following variables: the percentage of the population with an income lower than 5 k€ per year, the employment rate, the percentage of the population above 65, the percentage of houses built before 1980, the percentage of vegetation, the percentage of buildings that require renovation, and the percentage of hours where the outdoor temperature is below 15 °C or above 32 °C.
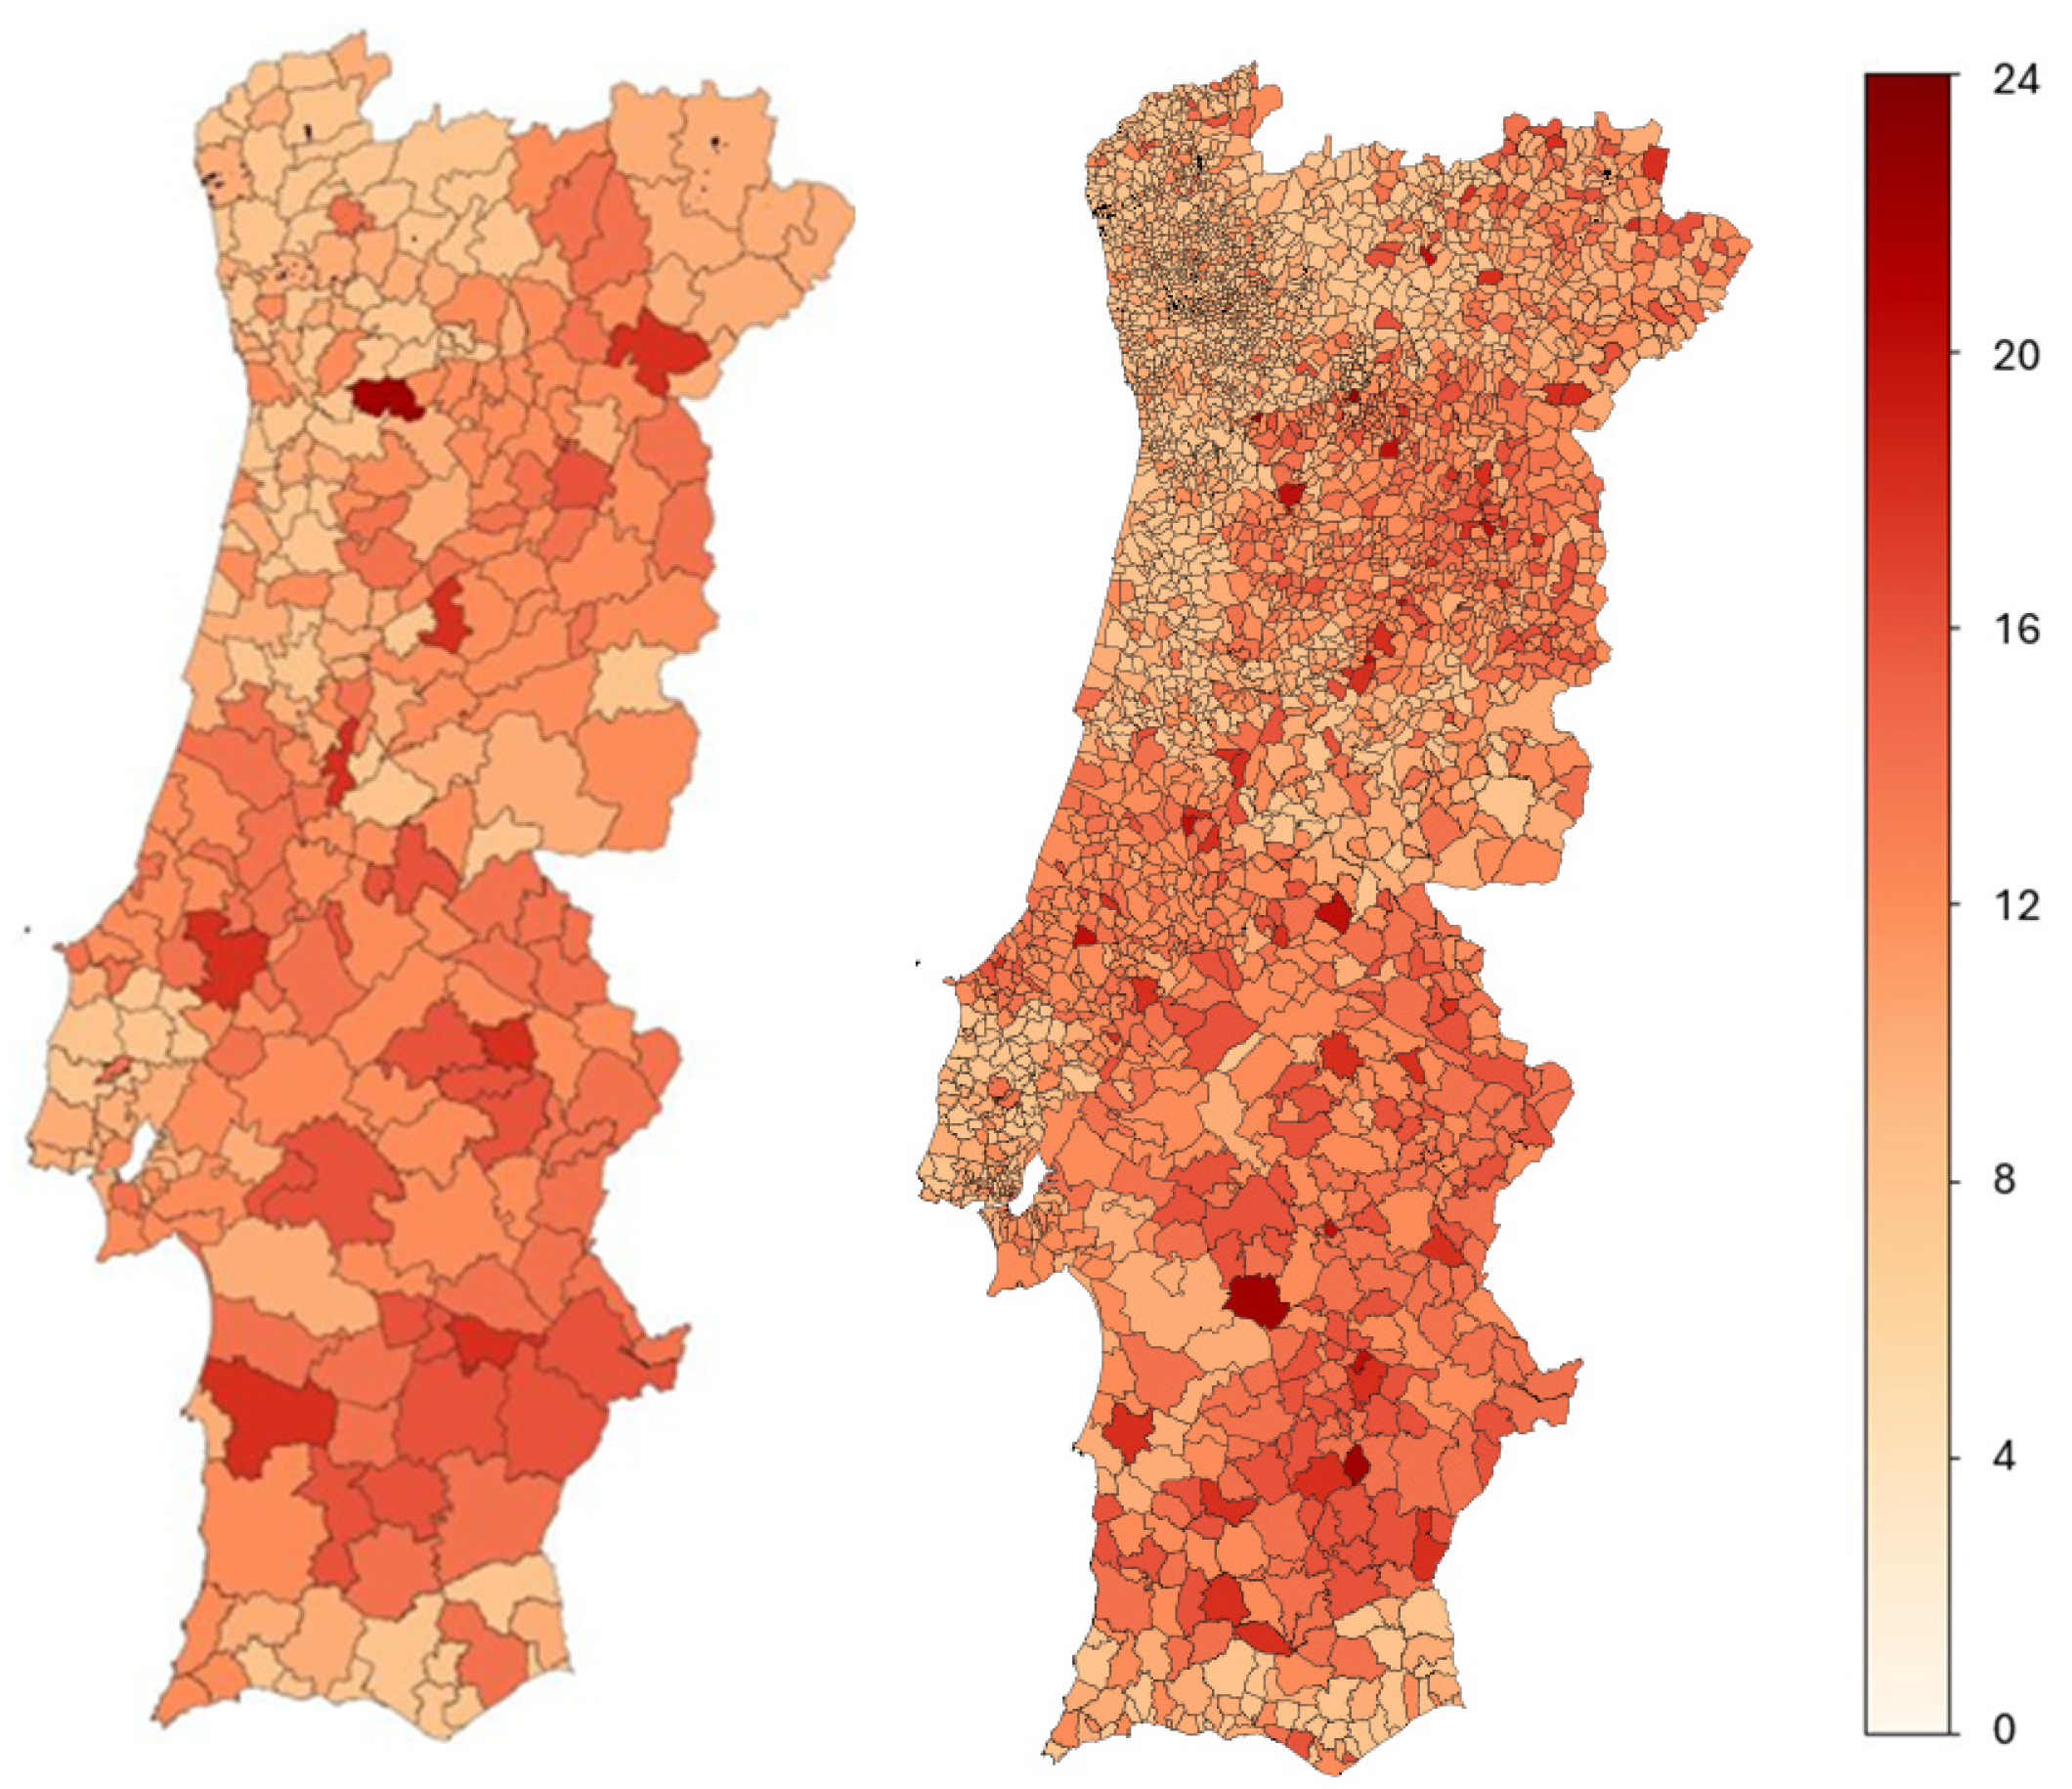
Figure 6 presents the updated version of the vulnerability map taking into consideration the 2021 census data calibrated for the 2018 heat wave at the municipality level (left) and the results at the parish level (right). We can observe that the main results are similar to those of [31], with the interior center and south being the most vulnerable areas, together with some parishes in the northeast. From the 2016 map [31] to the current one (Figure 6), the main difference is in the south, where the vulnerability decreased.
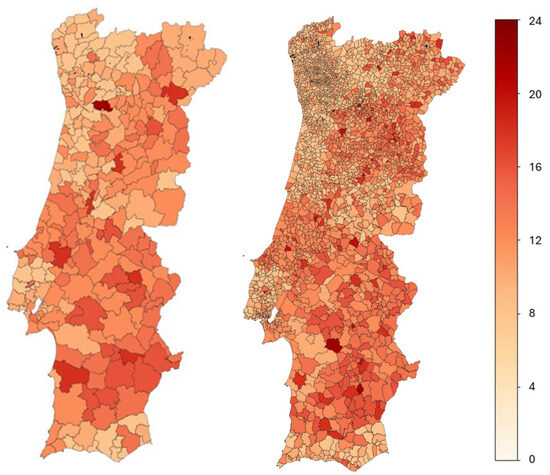
Figure 6.
Vulnerability index updated versions based on the 2018 heat wave at the municipality level (left) and the parish level (right).
3.4. Designing the CLIMAEXTREMO Index
The design of the CLIMAEXTREMO index results from a combination of these three dimensions: the indoor temperature (hazard), the mortality relative risk (exposure), and the vulnerability. The first two are dynamic, as they depend on the outdoor temperature, while the third is static (though it can be updated every year by updating the information).
Firstly, the risk components were normalized to a classification between 0 and 3, where 0 represents no risk, 1 represents a low risk, 2 represents a moderate risk and 3 represents a high risk. The threshold levels for each component are represented in Table 1. For the indoor temperature, we used the temperature levels that, according to the WMO, define the thermal comfort (see Section 3.1); for the mortality increase, we used the levels defined by the INSARJ (see Section 3.2); and for the vulnerability, we used a simple division between the interval of the scale (24) and the number of levels (4).

Table 1.
Risk components categorization.
Secondly, the risk components were added, assuming that each one had its own individual contribution. The following equation describes the risk index:
The logic was that the risk remains null if two of the factors were null (0), even if the other factor was high (3). For example, if the indoor temperature is very high but the relative risk in that location is null and the vulnerability is null, the overall risk is null. However, if two factors are high (6) and the other is not null (1 or more) or two parameters are moderate (4) and one is high (3), then the risk is high.
3.5. Potential Application of the Methods to Other Regions and Limitations
The developed methodology can be easily applied to other countries, in particular countries in the European Union where all the information used to implement the model should be publicly available, namely, the weather forecast, energy performance certificate information for the indoor temperature modeling, public health data for the increased mortality model, and socio-economic data for the vulnerability model.
The model is, therefore, scalable, and the computational effort mostly depends on the number of archetype simulations that are performed in the EnergyPlus model. For the twenty archetypes in the 278 municipalities (over 5560 EnergyPlus runs), the server takes 4 h to generate the risk for the next 7 days. During World Youth Day, a Catholic religious event that gathered more than 1 million people in the area of Lisbon that took place in the first week of August 2023, the model was extended to estimate the risk at the parish level in the municipalities around Lisbon, from Setúbal in the south to Fátima in the north.
There are some limitations to the methodology. The first is that the models of the buildings are based on archetypes (which are representations of buildings that are modeled with average characteristics) and do not represent particular buildings; for example, it may not take into account the existence of a particular HVAC system in a building, because most of the buildings for that construction period may not have those type of systems. The second limitation has is related to the increased mortality risk, which has to be calculated at the district level and not the municipality level. For many municipalities, the number of deaths is so small that the models do not have sufficient statistical representation at this spatial resolution. The third main limitation concerns the updating rate of the socio-economic indicators; most of the used data are annually updated by Statistics Portugal, but for some variables like income, the publication has a significant lag and may not properly reflect rapid socio-economic changes like those that occur during an economic crisis.
4. Results
In this section, we present the results of the methodology for the live dashboard that was developed in this project and is available at climaextremo.tecnico.ulisboa.pt. Although, in this paper, we have focused mostly on heat waves, the developed methodology is also applicable to extreme cold events.
The dashboard represents the global index risk for the current day and the next six days. It also represents the maximum outdoor temperature (in summer) or the minimum temperature (in winter). Then, it further represents the maximum indoor temperature (or the minimum temperature) for the worst archetype in the municipality or parish. Finally, it represents the vulnerability on a scale from 4 to 24. The relative risk of increased ambient temperatures on mortality is not represented, because the stakeholders considered that it might be misinterpreted by the general public.
4.1. Heat Wave in June 2023
Between 23 June and 28 June 2023 (weeks 25 and 26), there was a heat wave in Portugal that lasted six days in the interior north and center and south regions, according to the national weather agency, IPMA. Furthermore, in the first week of July (week 27) the temperatures remained high. For the analysis, we used the first week of July, when the warning for a heat wave was no longer active but the temperatures remained high after the heat wave. According to the Portuguese mortality surveillance dashboard [46], during the heat wave and two additional days, from 23 June to 1 July, there were 37 more deaths than the 3rd quartile between 2007 and 2023 for the same period.
The dashboard for 4 July (middle of week 27) is represented in Figure 7. It shows the different municipalities classified with an index risk between 0 and 3 on the map on the left. On the right, there are the municipalities in the south-east like Alandroal, Arronches, Barrancos, and Beja, as well as Castanheira de Pêra and Castelo Rodrigo in the interior center, that were categorized as high risk. In the same table, the maximum indoor temperature in the worst archetypes is above 30 °C and the vulnerability index is high, because in these municipalities there was a significant percentage of elderly people (above 65) with very low incomes (below 5 k€ per year), who were living in old houses that needed refurbishing. The mortality relative risk is above 1.2 for all these municipalities, which means that the model predicted an increase of at least 20% in deaths compared to the average.
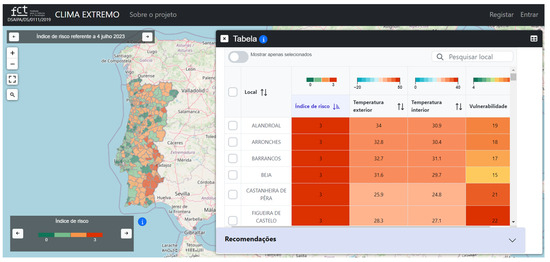
Figure 7.
Public dashboard view during the heat wave on 30 June 2023 in Portugal (in Portuguese). In the Table (Tabela) on the right, we can observe the location (Local), risk index (Índice de risco), outdoor temperature (Temperatura exterior), indoor temperature (Temperatura interior), and vulnerability (Vulnerabilidade).
In Table 2, we present the weekly number of deaths in the two weeks prior to the heat wave (weeks 23 and 24) and after the heat wave (weeks 27 and 28). We also present the average for 2023. The heat wave lasted for six days from the middle of week 25 to week 26. As can be seen, the number of deaths in the weeks of the heat wave increased significantly. During week 27, after the heat wave was over, at least according to the IPMA/WOA definition, it can be seen in Figure 6 that the warning remained high for the six municipalities. In Table 2, the results show that the real number of deaths remained high in four out of the six municipalities, which indicates that the risk remained high, even though the heat wave was apparently finished.
Table 2.
Number of deaths per week in municipalities ranked as high risk during the heat wave in June 2023.
4.2. Heat Wave in August 2023
In August 2023, there were two heat waves in Portugal. The first one occurred between weeks 31 and 32 (from 5 to 11 August) but only affected the interior center of Portugal. The second one took place between weeks 33 and 34 (from 18 to 25 August) and affected the interior center and south. According to the Portuguese mortality surveillance dashboard [46], during the heat wave and two additional days, the mortality in Portugal from 5 August to 13 August and 18 August to 27 August was, respectively, above 37 and 182 deaths above the 3rd quartile between 2007 and 2023 for the same period.
Figure 8 represents the table on the dashboard for 23 August in the middle of the second extreme heat episode. Table 3 presents the weekly number of deaths in the two weeks prior to the heat wave (weeks 29 and 30) and after the heat wave (weeks 35 and 36). We also present the average for 2023.
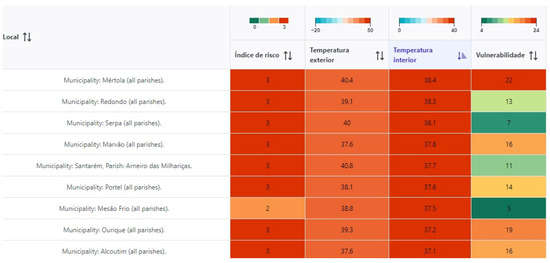
Figure 8.
Detail of the public dashboard view during the heat wave on 23 August 2023 in Portugal (in Portuguese). We can observe the location (Local), risk index (Índice de risco), outdoor temperature (Temperatura exterior), indoor temperature (Temperatura interior), and vulnerability (Vulnerabilidade).
Table 3.
Number of deaths per week in municipalities ranked as high risk during the heat wave in August 2023.
Once again, for most of the municipalities in the table, the average number of deaths during the heat wave was higher than the weekly average for the year. For the municipalities of Serpa, Marvão, and Portel, the effects were more visible in the first two weeks, while for the parish of Arneiro de Milharaças and the municipalities of Santarém and Alcoutim the effects were more visible in the last two weeks. For Ourique, the average increased throughout the whole four week period. For Mesão Frio, which was given a risk of 2 because the vulnerability was low (2), we can observe that the average also increased.
4.3. Discussion
The underlying hypothesis was that the new proposed risk model could predict with a higher accuracy the locations where extreme weather events would have more of an impact on the population’s well-being. Not much research work quantitatively discusses the impact of early warning systems for extreme weather events that the authors know of, except for [52], who survey the literature, and [53], who estimate that 4000 early deaths were avoided in France in 2006 as a result of the early warning system.
As shown by the examples discussed in the previous subsections, the new risk indicator could identify locations where the mortality did, in fact, increase during extreme heat episodes. Further, it signals the risk even outside the periods recorded as heat waves according to the WMO definitions. As the dashboard was only publicly released at the end of June 2023, the dissemination process was not yet fully completed at the time, even among local health and civil protection authorities, so the chances that the dashboard had any positive impact are very small. In this way, despite all the limitations of the methodology that were discussed in Section 3.5 and the high uncertainty that results from its application, the results suggest that the index could be used by different stakeholders to design local strategies at least at the municipality level to reduce the impact of extreme weather episodes.
5. Conclusions
The new proposed CLIMAEXTREMO risk index developed for the new public heat–health warning system climaextremo.tecnico.ulisboa.pt extends the current warning system ICARO in Portugal in several dimensions: it provides a higher spatial resolution (at the municipality level with the possibility to be extended to the parish level); it updates the mortality relative risk model currently used in ICARO by predicting excess mortality during heat and cold periods; it includes the indoor temperature estimation, which has more of a direct effect than the outdoor temperature; and it also takes into account socio-demographic economic factors that describe the vulnerability of the population to these extreme weather events.
This paper describes the results of the new warning system for a heat wave at the end of June 2023 and mid-August 2023 in Portugal and analyzes the high risk indicated for 15 municipalities the week after the heat wave, where the temperatures remained high. The analysis of the number of deaths in those municipalities shows that nine out of the fifteen presented a higher number than the weeks before the heat wave, which may indicate that the effects on the vulnerable population remained after the heat wave. These are just preliminary results, and a more detailed analysis is required to validate the new risk model.
The advantage of the proposed methodology is that it can be automatically applied to winter and extreme cold periods, as the indoor temperature models are the same. The excessive deaths model was developed for all temperatures, and the vulnerability index was also calculated for the whole year. Further, the same methodology could be applied to other countries.
Finally, the same type of approach could be used to generate early warning risk indicators for other important areas where the impact of climate change is also significant, like water resources, with water being not only an important raw material with strategic meaning and an irreplaceable component of the environment and all living ecosystems but also the raw material that is present in all technological processes and the limiting factor of sustainable development in regions and all society [54]. The development of these types of tools, which take advantage of new information and communication technologies, contributes to the commitment of countries and cities to foster smart solutions for a better quality of life for citizens [55].
Author Contributions
Conceptualization, C.S.S. and S.P.S.; methodology, D.V.F., R.G., L.P., A.B. and B.N.; software, F.P.C. and S.S. (Sabrina Scuri); validation, C.S.S.; data curation, D.V.F.; writing—original draft preparation, C.S.S.; writing—review and editing, all authors; project administration, C.S.S. and S.P.S.; and funding acquisition, C.S.S. All authors have read and agreed to the published version of the manuscript.
Funding
This research was supported by the National Foundation for Science and Technology of Portugal (FCT) under the RELIABLE—REaL tIme dAshboard on BuiLdings occupants’ risk during extreme weather Events—research project, grant numbers DSAIPA/DS/0111/2019 and LA/P/0083/2020 (LA LARSyS–IN+).
Institutional Review Board Statement
Not applicable.
Informed Consent Statement
Not applicable.
Data Availability Statement
The data are unavailable due to privacy.
Conflicts of Interest
The authors declare no conflicts of interest. The funders had no role in the design of this study; in the collection, analyses, or interpretation of the data; in the writing of this manuscript; or in the decision to publish the results.
References
- Ballester, J.; Rodó, X.; Robine, J.-M.; Herrmann, F.R. European seasonal mortality and influenza incidence due to winter temperature variability. Nat. Clim. Chang. 2016, 6, 927–930. [Google Scholar] [CrossRef]
- Fowler, T.; Southgate, R.J.; Waite, T.; Harrell, R.; Kovats, S.; Bone, A.; Doyle, Y.; Murray, V. Excess winter deaths in Europe: A multi-country descriptive analysis. Eur. J. Public Health 2014, 25, 339–345. [Google Scholar] [CrossRef] [PubMed]
- Kirch, W.; Menne, B.; Bertollini, R. Extreme Weather Events and Public Health Responses. 2005. Available online: https://api.semanticscholar.org/CorpusID:127880815 (accessed on 29 April 2024).
- Matos, A.M.; Delgado, J.M.P.Q.; Guimarães, A.S. Linking Energy Poverty with Thermal Building Regulations and Energy Efficiency Policies in Portugal. Energies 2022, 15, 329. [Google Scholar] [CrossRef]
- Nogueira, P.; Paixão, E. Models for mortality associated with heat waves: Update of the Portuguese heat health warning system. Int. J. Climatol. 2008, 28, 545–562. [Google Scholar] [CrossRef]
- Antunes, L.; Silva, S.P.; Marques, J.; Nunes, B.; Antunes, S. The effect of extreme cold temperatures on the risk of death in the two major Portuguese cities. Int. J. Biometeorol. 2017, 61, 127–135. [Google Scholar] [CrossRef]
- United Nations. The UN Sustainable Development Goals; United Nations: New York, NY, USA, 2015; Available online: https://sdgs.un.org/goals (accessed on 3 June 2024).
- IPCC. Summary for Policymakers: Synthesis Report. Climate Change 2023 Synthesis Report. Contribution of Working Groups I, II III to Sixth Assessment Report of the Intergovernmental Panel on Climate Change. 2023, pp. 1–34. Available online: https://reliefweb.int/attachments/dd4beacc-1f69-4231-aa6e-85c0f767f6bf/IPCC_AR6_SYR_SPM.pdf (accessed on 29 April 2024).
- WMO World Meteorological Organization. Early Warnings for All; Executive Action Plan. WMO Bulletin. 2023. Available online: https://wmo.int/media/news/early-warnings-all-action-plan-unveiled-cop27 (accessed on 29 April 2024).
- Torres, A.R.; Silva, S.; Nunes, B.; Rodrigues, A.P. Excesso de mortalidade em Portugal associado ao período de calor extremo em agosto de 2018: Um instrumento ao serviço da intervenção em saúde pública. Bol. Epidemiológico Obs. 2020, 9, 9–13. Available online: http://hdl.handle.net/10400.18/7079 (accessed on 29 April 2024).
- Ye, X.; Wolff, R.; Yu, W.; Vaneckova, P.; Pan, X.; Tong, S. Ambient temperature and morbidity: A review of epidemiological evidence. Environ. Health Perspect. 2011, 120, 19–28. [Google Scholar] [CrossRef]
- Lindemann, U.; Stotz, A.; Beyer, N.; Oksa, J.; Skelton, D.A.; Becker, C.; Rapp, K.; Klenk, J. Effect of Indoor Temperature on Physical Performance in Older Adults during Days with Normal Temperature and Heat Waves. Int. J. Environ. Res. Public Health 2017, 14, 186. [Google Scholar] [CrossRef] [PubMed]
- Perkins, S.E.; Alexander, L.V.; Nairn, J.R. Increasing frequency, intensity and duration of observed global heat waves and warm spells. Geophys. Res. Lett. 2012, 39, 1–5. [Google Scholar] [CrossRef]
- World Meteorological Organization; World Health Organisation. Heat Waves and Health: Guidance on Warning-System Development; No. 1142; WHO: Geneva, Switzerland, 2015. [Google Scholar]
- U.S. Environmental Protection Agency. Heat Waves; EPA Technical Report; US Environmental Protection Agency (EPA): Washington, DC, USA, 2021; Volume 77, pp. 24–25.
- Varghese, B.M.; Barnett, A.G.; Hansen, A.L.; Bi, P.; Nairn, J.; Rowett, S.; Nitschke, M.; Hanson-Easey, S.; Heyworth, J.S.; Sim, M.R.; et al. Characterising the impact of heat waves on work-related injuries and illnesses in three Australian cities using a standard heat wave definition-Excess Heat Factor (EHF). J. Expo. Sci. Environ. Epidemiol. 2019, 29, 821–830. [Google Scholar] [CrossRef]
- Díaz, J.; Carmona, R.; Mirón, I.J.; Ortiz, C.; León, I.; Linares, C. Geographical variation in relative risks associated with heat: Update of Spain’s Heat Wave Prevention Plan. Environ. Int. 2015, 85, 273–283. [Google Scholar] [CrossRef]
- Sanderson, M.G.; Economou, T.; Salmon, K.H.; Jones, S.E.O. Historical Trends and Variability in Heat Waves in the United Kingdom. Atmosphere 2017, 8, 191. [Google Scholar] [CrossRef]
- IPMA (Instituto Português do Mar e a Atmosfera). Glossários-Glossário Climatológico/Meteorológico; IPMA: Lisbon, Portugal, 2024. [Google Scholar]
- Casanueva, A.; Burgstall, A.; Kotlarski, S.; Messeri, A.; Morabito, M.; Flouris, A.D.; Nybo, L.; Spirig, C.; Schwierz, C. Overview of Existing Heat-Health Warning Systems in Europe. Int. J. Environ. Res. Public Health 2019, 16, 2657. [Google Scholar] [CrossRef]
- Lass, W.; Haas, A.; Hinkel, J.; Jaeger, C. Avoiding the avoidable: Towards a European heat waves risk governance. Int. J. Disaster Risk Sci. 2011, 2, 1–14. [Google Scholar] [CrossRef]
- IPMA (Instituto Português do Mar e a Atmosfera). Critérios de Emissão dos Avisos Meteorológicos; IPMA: Lisbon, Portugal, 2024. [Google Scholar]
- Leite, A.; Santos, A.J.; Silva, S.; Nunes, B.; Mexia, R.; Rodrigues, A.P. Assessing the use and understanding of the Portuguese heat–health warning system (ÍCARO). J. Public Health 2020, 42, 395–402. [Google Scholar] [CrossRef]
- Yu, M.; Yang, C.; Li, Y. Big Data in Natural Disaster Management: A Review. Geosciences 2018, 8, 165. [Google Scholar] [CrossRef]
- Alexander, D.E. Resilience and disaster risk reduction: An etymological journey. Nat. Hazards Earth Syst. Sci. 2013, 13, 2707–2716. [Google Scholar] [CrossRef]
- Cardona, O.D. Indicators of Disaster Risk and Risk Management-Program for Latin America and the Caribbean Summary Report, 2nd ed.; IDB: Washington, DC, USA, 2008. [Google Scholar]
- Molarius, R.; Könönen, V.; Leviäkangas, P.; Zulkarnain Rönty, J.; Hietajärvi, A.M.; Oiva, K. The extreme weather risk indicators (EWRI) for the European transport system. Nat. Hazards 2014, 72, 189–210. [Google Scholar] [CrossRef]
- Yamagata, Y.; Murakami, D.; Yoshida, T. Spatiotemporal Heat wave Risk Evaluation: Considering Hazard, Exposure, and Vulnerability. In Proceedings of the IGARSS 2019—2019 IEEE International Geoscience and Remote Sensing Symposium, Yokohama, Japan, 28 July–2 August 2019; pp. 5524–5527. [Google Scholar] [CrossRef]
- Wisner, B.; Blaikie, P.; Cannon, T.; Davis, I. At Risk: Natural Hazards, People’s Vulnerability and Disasters; Routledge: London, UK, 2004. [Google Scholar]
- Reckien, D. What is in an index? Construction method, data metric, and weighting scheme determine the outcome of composite social vulnerability indices in New York City. Reg. Environ. Chang. 2018, 18, 1439–1451. [Google Scholar] [CrossRef] [PubMed]
- Silva, S.; Roquette, R.; Nunes, B. Mapeamento de índice de vulnerabilidade a ondas de calor. In Conferência Internacional de Riscos Urbanos; Teves, C.P., Luis, Z.J., Cristina, C., Mamaral, F.M., Ricardo, G., Luis, M., Pais, I., João, R.M., Ines, R., Sousa, M.L., Eds.; CERU—European Centre on Urban Risks: Lisbon, Portugal, 2016; pp. 681–687. Available online: https://repositorio.insa.pt/bitstream/10400.18/3870/1/ICUR2016_Poster_final.pdf (accessed on 29 April 2024).
- Nogueira, P.J.; Falcão, J.M.; Contreiras, M.T.; Paixão, E.; Brandão, J.; Batista, I. Mortality in Portugal associated with the heat wave of August 2003: Early estimation of effect, using a rapid method. Eurosurveillance 2005, 10, 5–6. [Google Scholar] [CrossRef] [PubMed]
- Åström, D.O.; Bertil, F.; Joacim, R. Heat wave impact on morbidity and mortality in the elderly population: A review of recent studies. Maturitas 2011, 69, 99–105. [Google Scholar] [CrossRef]
- Ormandy, D.; Ezratty, V. Health and thermal comfort: From WHO guidance to housing strategies. Energy Policy 2012, 49, 116–121. [Google Scholar] [CrossRef]
- McMichael, A.J.; Friel, S.; Nyong, A.; Corvalan, C. Global environmental change and health: Impacts, inequalities, and the health sector. BMJ 2008, 336, 191–194. [Google Scholar] [CrossRef]
- Jin, L.; Schubert, S.; Fenner, D.; Salim, M.H.; Schneider, C. Estimation of mean radiant temperature in cities using an urban parameterization and building energy model within a mesoscale atmospheric model. Meteorol. Z. 2022, 31, 31–52. [Google Scholar] [CrossRef]
- Anders, J.; Schubert, S.; Sauter, T.; Tunn, S.; Schneider, C.; Salim, M. Modelling the impact of an urban development project on microclimate and outdoor thermal comfort in a mid-latitude city. Energy Build. 2023, 296, 113324. [Google Scholar] [CrossRef]
- Monteiro, C.S.; Costa, C.; Pina, A.; Santos, M.Y.; Ferrão, P. An urban building database (UBD) supporting a smart city information system. Energy Build. 2018, 158, 244–260. [Google Scholar] [CrossRef]
- Al-Rabghi, O.M.A.; Al-Johani, K.M. Utilizing transfer function method for hourly cooling load calculations. Energy Convers. Manag. 1997, 38, 319–332. [Google Scholar] [CrossRef]
- Gomes, R.; Ferreira, A.; Azevedo, L.; Neto, R.C.; Aelenei, L.; Silva, C. Retrofit measures evaluation considering thermal comfort using building energy simulation: Two Lisbon households. Adv. Build. Energy Res. 2021, 15, 291–314. [Google Scholar] [CrossRef]
- ADENE, Agência para a Energia. Sistema de Certificação Energética. 2008. Available online: https://www.sce.pt/ (accessed on 29 April 2024).
- IPMA, Instituto Português do Mar e Atmosfera. Séries Longas. 2024. Available online: https://www.ipma.pt/pt/oclima/series.longas/ (accessed on 29 April 2024).
- MARETEC, Marine, Environment and Technology Center. Meteo Tecnico Weather Forecast. Available online: https://meteo.tecnico.ulisboa.pt/ (accessed on 29 April 2024).
- Cheng, J.; Xu, Z.; Bambrick, H.; Prescott, V.; Wang, N.; Zhang, Y.; Su, H.; Tong, S.; Hu, W. Cardiorespiratory effects of heat waves: A systematic review and meta-analysis of global epidemiological evidence. Environ. Res. 2019, 177, 108610. [Google Scholar] [CrossRef]
- Gasparrini, A.; Guo, Y.; Hashizume, M. Mortalité attribuable au froid et à la chaleur: Analyse multi-pays. Environ. Risques Sante 2015, 14, 464–465. [Google Scholar] [CrossRef] [PubMed]
- e-Mortality Surveillance. Mortalidade em Tempo Real. DGS, SNS. 2023. Available online: https://evm.min-saude.pt/ (accessed on 29 April 2024).
- Statistics Portugal. Statistics Portugal Web Portal. Available online: https://www.ine.pt/xportal/xmain?xpgid=ine_main&xpid=INE (accessed on 29 April 2024).
- Bhaskaran, K.; Gasparrini, A.; Hajat, S.; Smeeth, L.; Armstrong, B. Time series regression studies in environmental epidemiology. Int. J. Epidemiol. 2013, 42, 1187–1195. [Google Scholar] [CrossRef]
- Brito, A.; Nunes, B.; Silva, C.S.; Roquette, R.; Silva, S. First Steps for New Extreme Temperatures Health Early Warning System in Portugal. In Proceedings of the ISEE 2022: 34th Annual Conference of the International Society of Environmental Epidemiology, Athens, Greece, 2022; Available online: https://ehp.niehs.nih.gov/doi/abs/10.1289/isee.2022.P-0620 (accessed on 29 April 2024).
- Alho, A.M.; Oliveira, A.P.; Viegas, S.; Nogueira, P. Effect of heat waves on daily hospital admissions in Portugal, 2000–2018: An observational study. Lancet Planet. Health 2024, 8, e318–e326. [Google Scholar] [CrossRef]
- Copernicus Land Monitoring Service. CORINE Land Cover 2018. 2018. Available online: https://land.copernicus.eu/en/products/corine-land-cover/clc2018 (accessed on 29 April 2024).
- Rogers, D.P.; Shapiro, M.A.; Brunet, G.; Cohen, J.-C.; Connor, S.J.; Diallo, A.A.; Elliott, W.; Haidong, K.; Hales, S.; Hemming, D.; et al. Health and climate–opportunities. Procedia Environ. Sci. 2010, 1, 37–54. [Google Scholar] [CrossRef]
- Fouillet, A.; GRey Jougla, E.; Hémon, D. Estimation de la Surmortalité, Observée et Attendue au cours, de la Vague de Chaleur du mois de Juillet 2006. Rapport remis à l’Institut de Veille Sanitaire. 2006. Available online: https://hal-lara.archives-ouvertes.fr/hal-01571668v1/file/INSERM_rapport_canicule2006.pdf (accessed on 29 April 2024).
- Perácek, T.; Majercáková, D.; Mittelman, A. The Constitutional Protection of Water as Irreplaceable Component of Environment and All Living Ecosystems. In The Conditions of the Slovak Republic, Proceedings of the 16th International Multidisciplinary Scientific Geoconference (SGEM 2016), 2016, Ecology, Economics, Education and Legislation Conference Proceedings, SGEM 2016, Bulgaria Albena, Bulgaria, 30 June–6 July 2016; SGEM Geoconferences: Sofia, Boulgaria, 2016; Volume I, pp. 995–1000. [Google Scholar]
- Kaššaj, M.; Peráček, T. Sustainable Connectivity—Integration of Mobile Roaming, WiFi4EU and Smart City Concept in the European Union. Sustainability 2024, 16, 788. [Google Scholar] [CrossRef]


Disclaimer/Publisher’s Note: The statements, opinions and data contained in all publications are solely those of the individual author(s) and contributor(s) and not of MDPI and/or the editor(s). MDPI and/or the editor(s) disclaim responsibility for any injury to people or property resulting from any ideas, methods, instructions or products referred to in the content. |
© 2024 by the authors. Licensee MDPI, Basel, Switzerland. This article is an open access article distributed under the terms and conditions of the Creative Commons Attribution (CC BY) license (https://creativecommons.org/licenses/by/4.0/).