Article

Comparison of the Impact of Different Economic Patterns on Population Inflows: Evidence from China’s Guangdong, Jiangsu, and Zhejiang Provinces

Research Institute for Population Science, School of Public Administration, Hohai University, Nanjing 211100, China
*
Authors to whom correspondence should be addressed.
Sustainability 2024, 16(12), 5176; https://doi.org/10.3390/su16125176
Submission received: 25 March 2024 / Revised: 19 May 2024 / Accepted: 15 June 2024 / Published: 18 June 2024

Abstract

:
Between 2000 and 2022, China’s top three highest GDP provinces, Guangdong, Zhejiang, and Jiangsu, each having distinct economic structures, displayed different paths of development in their net population inflows. This prompts us to ponder how the economic patterns of the most economically developed regions impact population inflows. To answer the question, we first examine each economic pattern and use the entropy weight method to construct a comprehensive index to capture the features of each economic pattern in different regions. Then, we employ a two-way fixed effects model with panel data from the three provinces to conduct the empirical analysis. Moving forward, we expand the sample size to 10 provinces, including China’s eastern metropolitan areas, to extend the analysis beyond the previously selected regions and corroborate the consistency and robustness of our model. The results show that the Wenzhou pattern, featured primarily by the private sector, has the most impact on population inflows, followed by the Pearl River pattern, driven by an export-oriented economy. In contrast, the Sunan pattern, characterized by the collective economy, has an insignificant impact. We further dissect and determine the essential factors influencing population inflows within the three economic patterns and estimate the sustainability of the economic pattern via net population inflows. Our findings can provide insights for policy-makers to understand and utilize economic patterns in order to impact population inflows effectively. Specifically, we propose that the observable net population inflows can serve as an indicator to evaluate the sustainability of local economic patterns, thus providing another perspective on assessing the region’s economic development.

1. Introduction

Human resources, as one of the most critical economic factors, can influence regional economic development through the spatial reallocation of population in the form of migration [1]. At the same time, population inflow can reflect a region’s capacity to attract migrant workers and transform them into permanent residents [2], contributing to the regional growth of the population [3]. (Usually, the flows are documented as directional data, i.e., migrations from certain origin regions to certain target regions. For the “target regions”, flows are inflows, and for the “original regions”, flows are outflows. In this paper, the migration between regions we discuss is mainly inter-provincial flows.) Determining how different factors can impact a region’s attractiveness for population flows is one of the key research topics in demography [4]. It is primarily the difference in regional economic development that impacts population migration. For economically developed regions, in the context of China’s mid-to-late stage urbanization and the decline in the natural population growth, local governments try to enhance their attractiveness for the inter-provincial flows to drive up urban population growth and optimize the population structure [5]. China started to have a negative population growth in 2022 [6], and population aging in various regions has worsened. With the nation’s declining fertility rates, attracting migrant populations to increase the stock of human capital becomes essential for maintaining sustainable regional development [7].
China’s geographic variations and policy differences between provinces result in distinctive paths of economic development, each having different economic patterns. A recent research focus in China [8,9,10,11,12,13] is to identify factors that drive the evolution of regional economic patterns. Typical regional development patterns for the rich provinces comprise three major types: the Sunan (Southern Jiangsu) pattern, characterized by the development of the collective economy; the Wenzhou (coastal Zhejiang) pattern, featured primarily by the private sector; and the Pearl River (coastal Guangdong) pattern, driven mainly by the development of an export-oriented economy [14,15,16,17,18].
Previous studies [19] mainly focus on the impact of population inflows on sustainable economic growth or the dynamical mechanism of economic development. These studies all focus on how to promote the existing economy rather than questioning the economic mode. Aiming solely to increase population inflows without considering the intrinsic features of the local economy is not an effective or sustainable solution. As the most dynamic factor of production, the population is a vital foundation for socioeconomic development [20]. Few studies have investigated the impact of economic growth on population inflows, especially the impact of different economic patterns. Our study fills the gap: through empirical analysis, it quantifies how different economic patterns impact population inflows. As net population inflows are readily observable, they can serve as a handy indicator for local policymakers to determine the more suitable and sustainable economic pattern so that they can assess and adjust the existing economic pattern for future development.
Due to local socioeconomic development, the regional economic pattern varies by location and time [21]. As typical case studies, we analyze the Pearl River, Wenzhou, and Sunan regions from Guangdong, Jiangsu, and Zhejiang provinces. These regions are the birthplaces of China’s distinctive major regional economic patterns, and each captures and represents the pattern’s characteristic features.
As leading provinces of China’s economic development, they are especially attractive to out-of-province migrants. They have long been recognized as a province with no shortage of hands, while data on net population inflows shows another story: Jiangsu’s interprovincial net population inflows have been lower than those of Zhejiang and Guangdong since 2003. After 2017, the yearly net population inflow decreased, and there was no rebound until 2020. The growth rate of Guangdong’s net population inflows has significantly slowed since 2012 and began to shrink in 2018, with a faster rate of decline than that of Jiangsu (See Section 3.1). However, since Jiangsu’s economy was booming during that time, population inflows should have been in tune with economic development [22], but statistics contradict this presumption. Additionally, as one of the most populous provinces in China, Guangdong’s net population inflows have always been high among all provinces. Why has its momentum significantly faltered after the COVID-19 epidemic?
We address those questions in this study and also explore whether economic growth drivers differ in developed regions and if a region can infer the sustainability of its current economic pattern by observing population inflows. To quantify how different economic patterns impact population inflows, we construct indices and use a two-way fixed effects model to analyze their relationship empirically. Section 2 shows the impact of economic factors on population inflows, thus providing the basis for constructing the indicator system. Section 3 describes the data and methodology. Section 4 presents empirical analysis results in selected regions and then expands the case to larger areas. Section 5 presents conclusions and discussions.

2. Literature Review and Research Area

2.1. Economic Factors Affecting Population Inflows

Studies have explored population migration patterns in different regions (such as China, the United States, and Africa) and attempted to identify the fundamental drivers behind population migration [23,24,25,26,27,28,29,30]. One of the primary research topics in demography is how different factors determine a region’s attractiveness to the migrant population [4].
In retrospect, before China’s economic reforms in the late 1970s, a strict household registration system restricted population flow and economic development [31]. The economic reforms unleashed China’s economic potential and tore down the barriers to free population migration [25,32]. It is estimated that between 80 and 100 million people leave the countryside each year looking for financial opportunities [33]. As transportation and communication costs decrease and the household registration system relaxes, population flows become more affordable and accessible. Beyond intra-provincial flows, people from economically underdeveloped agricultural sectors are migrating to places for more employment and income opportunities, thus forming inter-provincial flows. Economic factors are the primary determinants of where people migrate [32,33,34,35].
Over the past four decades, China has experienced the largest scale of population migration in its history [36]. According to the 7th National Population Census [37], inter-provincial migration accounts for a considerable proportion of the total population flows. Among them, more than 50% of migrations are due to employment [37], and when accounting for accompanying family members, the proportion of migrations due to employment is even higher. The economic attractors for the migrant population are mainly the capacity for employment and the ability to settle down. Industrial restructuring will inevitably affect employment, as it absorbs high-quality labor by promoting technological progress and innovating the industrial capital [38]. The industrial structure is the foundation of economic structure, which reminds us to focus on economic structure when studying the impact of economic development on net population inflows. One study [39] shows that industrial structure adjustment is essential to the migration process. Their research on population migration in the United States shows that the main factor determining population flows in the United States is the adjustment of economic structure. It suggests that due to the restructuring of the U.S. economy, old manufacturing regions (the “Rust Belt” or “Steel Belt”) in the northeastern and midwestern U.S. began to decline. In contrast, regions with emerging industries, mainly in the western and southeastern U.S., started to prosper [39]. The changes in the economic patterns of these regions have had a significant impact on population flows. Different economic structures determine economic patterns, so rather than discussing how the latter affect population inflows, it is essential to decide how the main drivers behind economic patterns affect population inflows. Therefore, we need to analyze the evolution of economic patterns and identify the dominant drivers.

2.2. Evolution of the Three Economic Patterns and Their Relationship to Population Inflows

Economic pattern refers to the structure and characteristics manifested during economic development [40]. Sachs et al. [41] described five different economic patterns and found that differences in physical geography distribution and natural resource reserves lead to countries having different patterns of economic development. Silverberg et al. [42] suggested that economic patterns are a suitable analytical framework for understanding economic growth. Their case studies showed that economic systems exhibit inherent temporal and structural regularities and are influenced by economic transformation. In conclusion, economic patterns exhibit the historical development of a country or region and embody its development strategy [43].
The Sunan (Jiangsu), Wenzhou (Zhengjiang), and Pearl River (Guangzhou) regions represent three distinct regional economic patterns in China. Each has a different development path due to variations in natural endowments, economic foundations, industrial structures, and transportation locations.
During the initial stages of China’s reform and opening up, the robust development of the collective economy in Jiangsu created employment opportunities and absorbed surplus rural labor. However, it only incorporated primarily the local industrialization process that attracted the local rural labor force [44]. Later, the collective economic pattern faced increasingly intense competition from the private sector and the export-oriented economy. To maintain market competitiveness, the collective economy must improve its technological level and product quality, which demands capital accumulation. Due to technological progress and increased capital intensity, labor absorption decreases accordingly in this transformation process. This process embodies the role of market competition in driving the economic pattern transformation and upgrades [45]. As industries rely more heavily on capital investments (machinery, equipment, etc.) than on labor, the economy tends to weaken the employment-generating capacity of the industrial sector relative to earlier stages of development. Those are the challenges Jiangsu faces while trying to maintain its labor-intensive industrial pattern.
Consequently, the employment prospects in the secondary (manufacturing) sector, which previously relied heavily on labor-intensive village enterprises to achieve “full employment”, are facing a crisis. Because the industrial structure of Jiangsu is labor-intensive and heavily based on the chemical industry, it is more difficult to attract young workers from outside the province. Studies show that in the 21st century, Jiangsu’s overall employment elasticity coefficient is consistently lower than that of Zhejiang and Guangdong. The main reason for this is that the pace of the labor force transition from the secondary (manufacturing) sector to the tertiary (service) sector has been the slowest in Jiangsu compared to the other two provinces. The slower pace of the labor force transition from manufacturing to services implies a continued reliance on the secondary sector for employment. However, as discussed earlier, the manufacturing sector’s ability to absorb labor diminished due to increasing capital intensity and technological progress. This highlights the importance of structural transformation and the expansion of labor-intensive service industries for sustaining employment growth [46].
The Wenzhou pattern has become a prominent model for developing the private sector. The private sector is an essential component of a market-based economy and has emerged as the main force and a crucial engine driving China’s rapid economic growth. The private sector’s role in the overall economic landscape is becoming increasingly significant. It is foreseeable that in the future, the private sector will serve as an essential driving force for economic development [47]. Research comparing the efficiency of state-owned, private, and foreign-funded enterprises in Vietnam reveals that private enterprises are more efficient and have the most robust job creation capabilities [48,49]. The comparative analysis of state-owned and private enterprises in terms of promoting employment and increasing output, as well as other aspects revealed that the monopoly of state-owned units is a significant reason for market inefficiency. The competitive advantages of private enterprises give them a solid ability to promote employment. Since China’s reform and opening up, Zhejiang has gradually become one of China’s fastest-growing and most influential provinces in private sector development. Situated in the Yangtze River Delta, Zhejiang is also the most developed province in terms of its private sector. Industries such as the Internet and the physical economy have attracted a large inflow, providing crucial economic and social development support [50].
The Pearl River pattern [51] mainly focuses on developing an export-oriented economy, which heavily attracted population inflows. For example, Li et al. [52] analyzed city-level data since 2000 and found that foreign direct investment (FDI) has promoted domestic migration in China through labor-intensive export industries, attracting large population inflows to Guangdong. Meanwhile, the impact of an export-oriented economy on domestic migration within China has been changing over time. FDI initially attracted migrants within the province [53]. Later, as FDI grew, it facilitated large-scale, long-distance migration throughout China [28,54], greatly enhancing Guangdong’s ability to attract population inflows. However, the Pearl River Delta development has been primarily driven by the processing and service industries, leading to lower-end technological capabilities within the province and hindering endogenous development. Consequently, it curtails the region’s ability to upgrade the global supply chain and remain competitive in international trade. As FDI shifts from labor-intensive industries to the high-tech and service sectors, its impact on migration will decrease [55,56]. It has been found that from 2000 to 2015, the role of the export-oriented economy in promoting long-distance population migration weakened [52,57].
Moreover, the export-oriented economy has developed a strong dependency on FDI. During the COVID-19 pandemic, the global supply chain was disrupted, leading to a sharp decline in foreign orders, severely impacting Guangdong’s economic activities, whose import and export trade-to-GDP ratio was as high as 71.68% in 2018 [58]. Many foreign trade companies were deregistered or had their licenses revoked, which was a severe blow to Guangdong’s foreign trade. In the long run, domestic private enterprises will eventually replace exports as the primary driver of population inflows. As China’s industries develop, the demand for human resources in export-oriented economic patterns has shifted from labor-intensive towards high-tech and service sectors, which only results in a much smaller population migration of highly skilled workers.
Table A1 in the Appendix A gives an overview of the main characteristics of the three regional patterns. Considering various aspects, such as location features, infrastructure conditions, and funding sources, all three regional economic patterns have aligned with regional economic development trends and facilitated rapid regional economic growth. Though initially distinguished by region, economic patterns can also learn from and incorporate patterns from other areas. The defining factor of economic development patterns lies in the economic growth mode, i.e., how production factors are combined for economic growth [59]. Therefore, the economic structure defines economic patterns and critically influences net population inflow.

3. Measures and Analytical Strategy

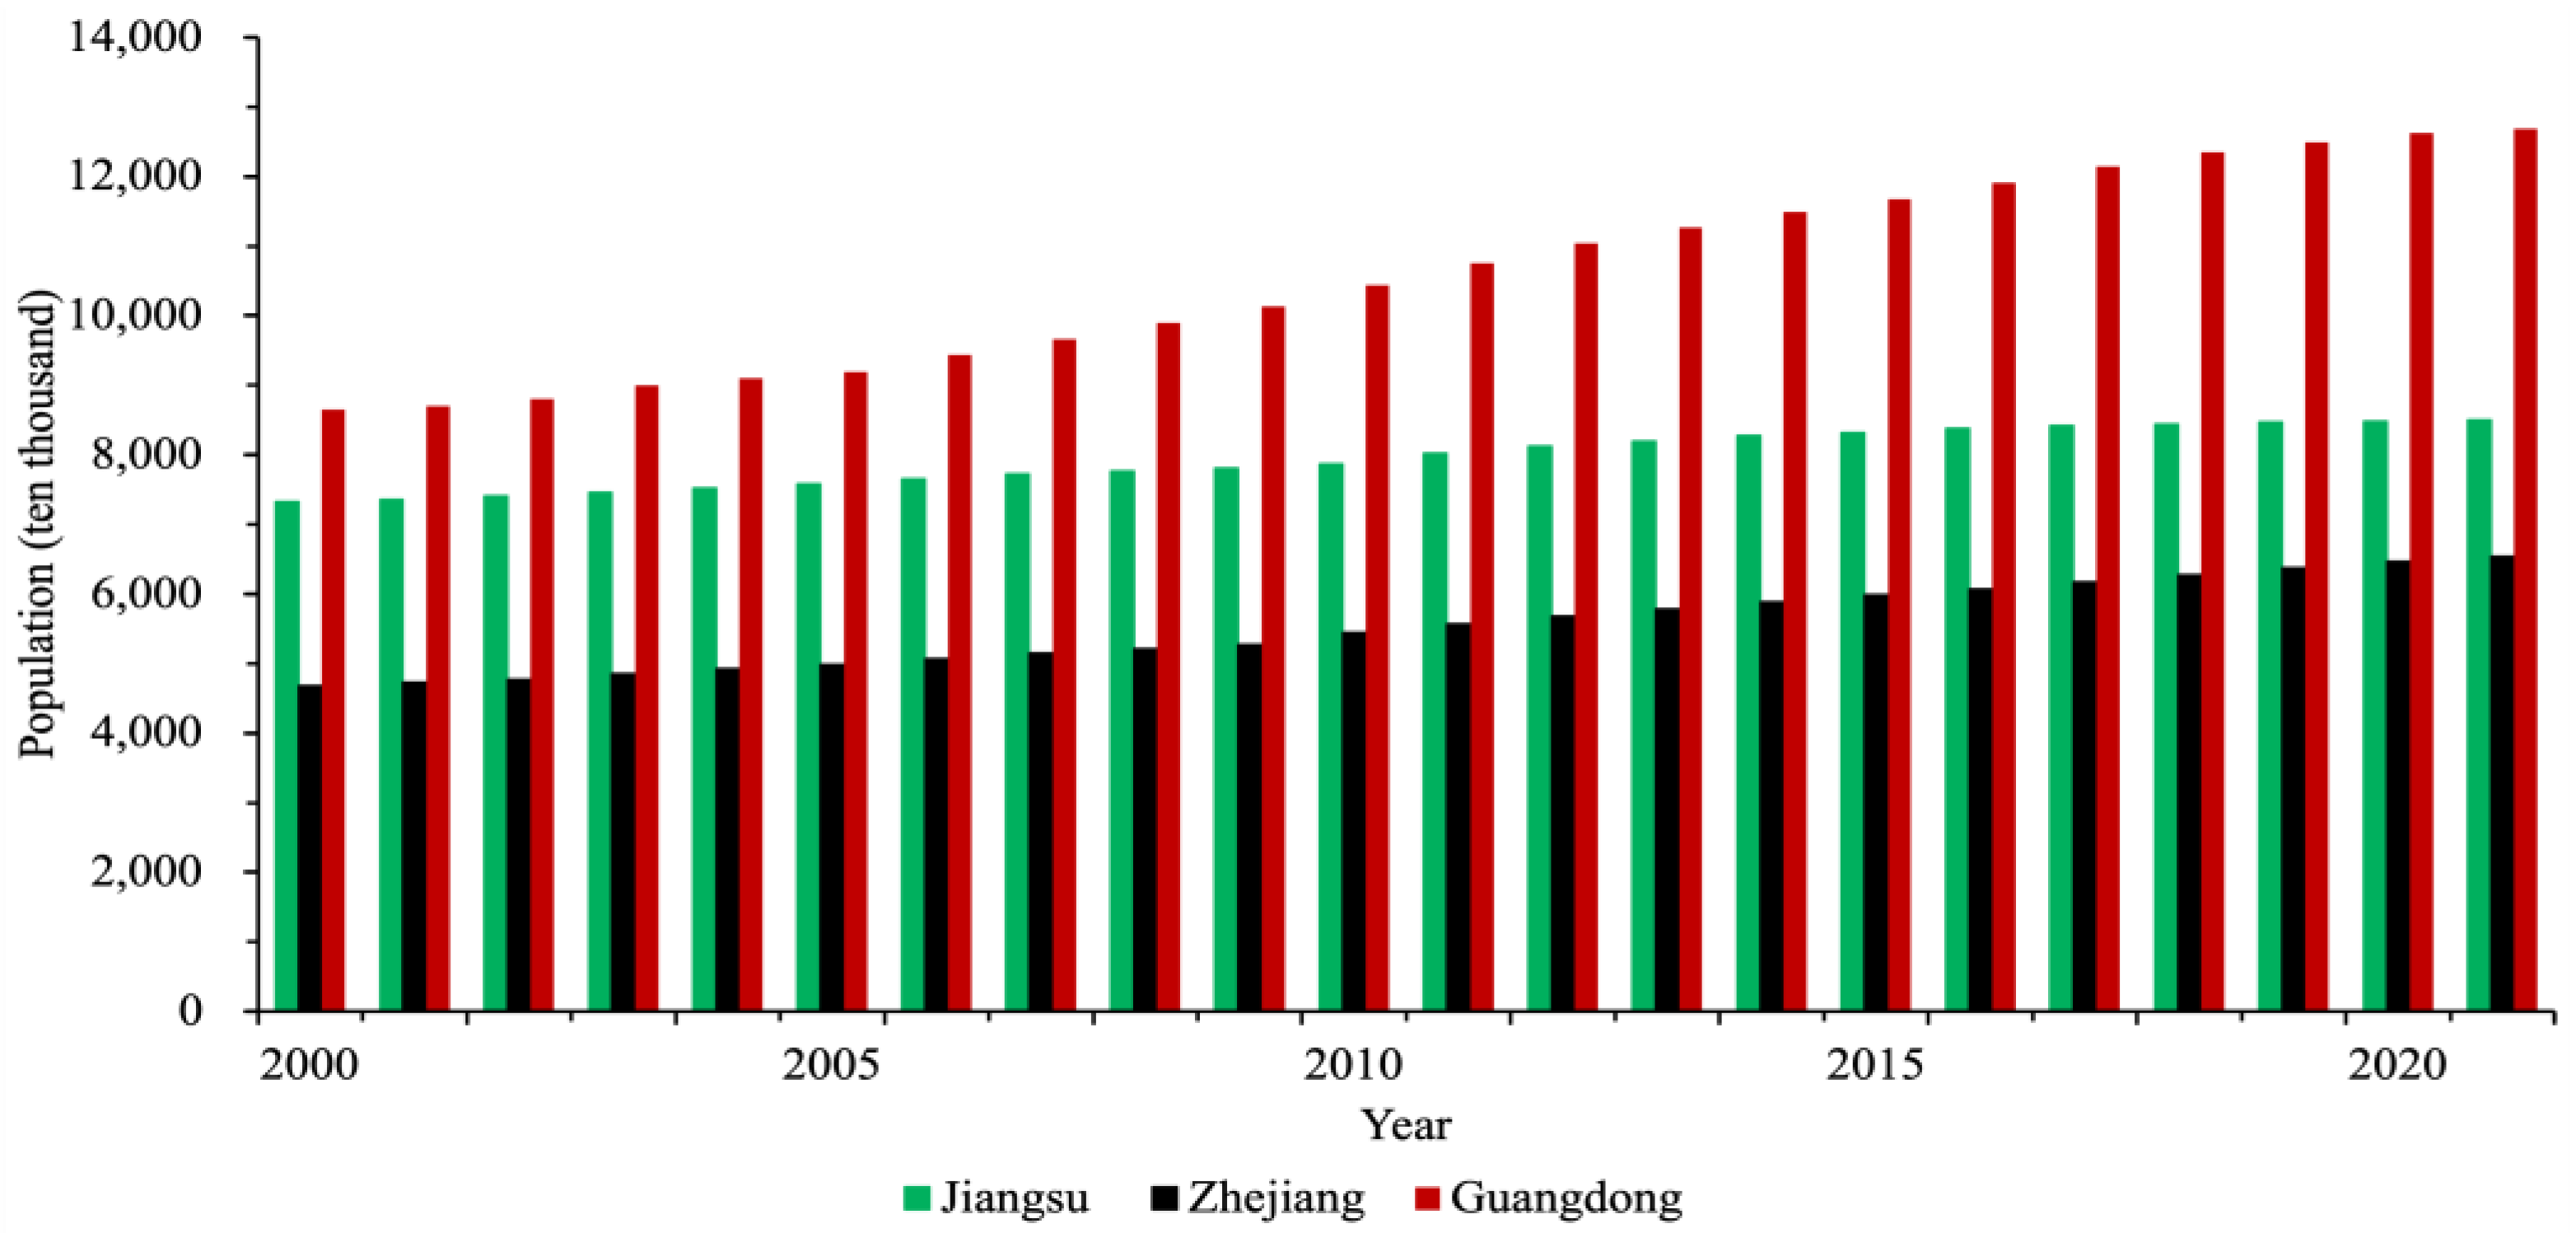
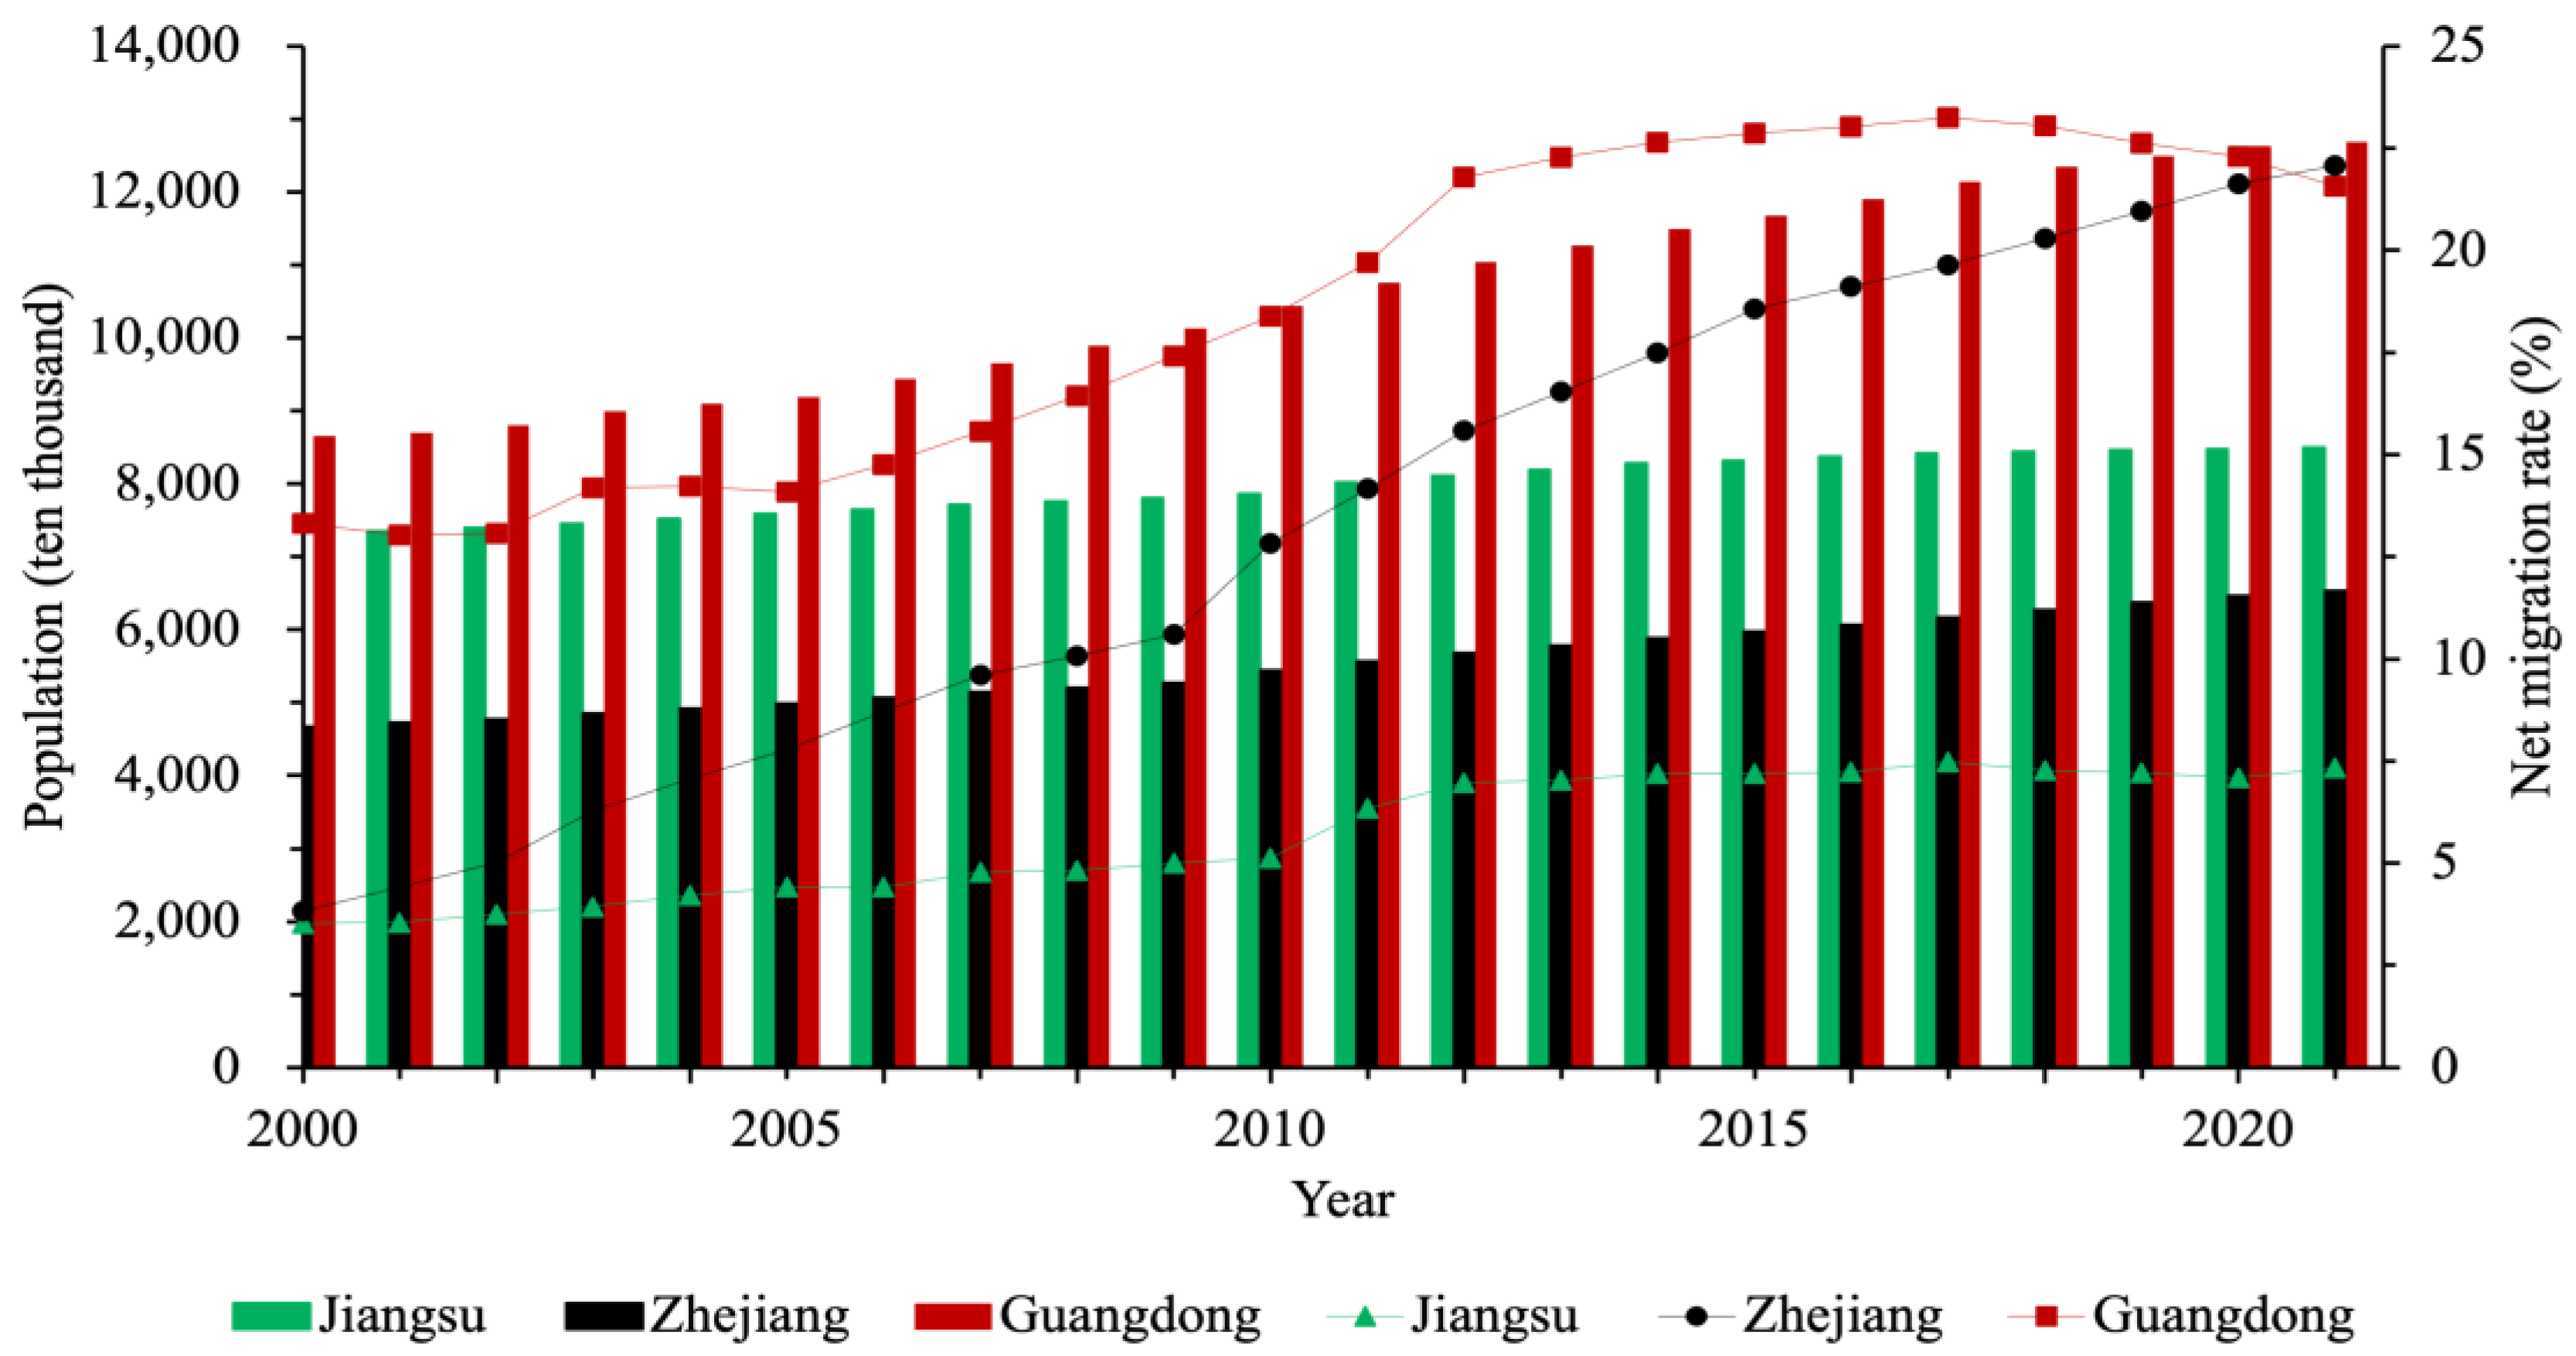
3.1. Overview of Net Population Inflows in the Study Area

Guangdong, Jiangsu, and Zhejiang, as economically developed and FDI-friendly provinces on China’s east coast, have similar economic sizes, with the total GDP ranking, respectively, the first (12.91 trillion RMB), second (12.29 trillion RMB) and fourth (7.77 trillion RMB) among all provinces. Economic and social development and the geographic location are pivotal factors attracting population inflows. Taking the year 2020 as an example, as depicted in Figure 1, the higher net population inflow regions are mainly concentrated on China’s eastern coast, with a high correlation of economic development levels. However, among the top ten provinces in China with net population inflows, Jiangsu’s net population inflows and net migration rate are far behind those of Guangdong and Zhejiang Provinces. In 2020, Jiangsu’s net population inflows reached 6.025 million, approximately 21% and 43% of Guangdong and Zhejiang’s figures, respectively. Moreover, the net migration rate is only about one-third of that of these two provinces [58,60,61].
We further analyzed the population status of the three provinces based on time trends. As shown in Figure 2, the growth rate of permanent residents in Guangdong is highest, followed by Zhejiang and Jiangsu. From 2000 to 2022, the average annual population growth rates of Jiangsu, Zhejiang, and Guangdong were 0.69%, 1.56%, and 1.75%. From 2010 to 2022, the average growth rates of permanent residents in the three provinces were 0.66%, 1.58%, and 1.62%. We can see that the growth rates of permanent residents in Jiangsu and Guangdong are slowing down, while Zhejiang still has accelerated growth. In each province, the scale of net population inflows can significantly change the permanent population, given the low growth rates in a natural population.
As shown in Figure 3, the non-registered population (the non-registered population in a region refers to the difference between the permanent population and the registered population) in Guangdong had been increasing since 2000 but began to decline after reaching 284.588 million in 2018. Specifically, the average annual growth rate was 1.0447 million from 2000 to 2012 and 0.7346 million from 2012 to 2018, registering a decrease of 0.3628 million annually after 2018. Among the three provinces, Jiangsu’s non-registered population is the smallest and has been slowly growing since 2014. It peaked at 6.2931 million after 2017 and then began to decline. Zhejiang’s non-registered population has accelerated since it surpassed Jiangsu in 2003. Especially after 2017, after the non-registered population in Guangdong and Jiangsu began to shrink, Zhejiang is still growing fast. From 2020 to 2021, Zhejiang’s non-registered population accounted for the highest proportion of permanent residents (net migration rate), surpassing Guangdong, and the gap is still widening. As of 2022, the net migration rates of the three provinces, Jiangsu, Zhejiang, and Guangdong, are 7.55%, 22.30%, and 21.60%, respectively. Meanwhile, Zhejiang’s net migration rate has continued to climb steadily. Economically, the gross domestic product (GDP) of Jiangsu, Zhejiang, and Guangdong grew at an average annual rate of 12.88%, 12.21%, and 11.93% from 2000–2022; and 9.49%, 9.08%, and 8.99% from 2010–2022, respectively.
This prompts us to ponder why there are different temporal trends in attractiveness among the three provinces for the migrating population and whether the drivers of economic growth for those developed regions are different.

3.2. Variable Selection and Index System Construction

Based on the analysis of the three economic patterns presented in Section 2, we select corresponding indicators to build a model simulating the pattern and evaluate each indicator’s impact on population inflows. We choose three indicators to capture the characteristics of an economic pattern: structural characteristics, employed population, and development potential. We use the entropy weight method to construct a comprehensive indicator representing the economic pattern as an explanatory variable. For structural characteristics, we present the degree of dependence on foreign trade and foreign investment to illustrate the export-oriented economy of the Pearl River Delta pattern, the proportion of manufacturing value added to the GDP to represent the highly industrialized Sunan pattern, and the proportion of private sector value added to the GDP to depict the primary private sector in the Wenzhou pattern. Regarding the employed population and development potential, we choose the proportion of employed people, the proportion of enterprises, and the proportion of enterprise fixed-asset investment to registered capital.
The explained variable is the net migration rate ( n m i t ). Following the definition of migration population by Duan et al. [62], the net migration rate shows the scale and direction of population migration, calculated by dividing the net population inflows by the resident population. The net migration rate can be positive or negative. A positive net migration rate means a province with net population inflows, while a negative value means net outflows.
We select five control variables from demographic, economic, and social aspects to form the regression equation. For population, we take urban population density ( p o p i t ) [63] to reflect the degree of geographic saturation of the population. When the urban population density of a region is too large, the over-concentration of the population has a congestion effect, which increases the burden of urban governance. The resulting traffic congestion, environmental pollution, and other problems in the city reduce the population’s willingness to migrate. The labor force level ( l a b i t ) reflects the percentage of the working-age population, which indicates the region’s attractiveness to the young population, as the age structure of the region’s population significantly impacts population migration [64]. On the economic side, the marketization index ( m i t ) is chosen to indicate the degree of market-oriented reforms in regional economic development [65]. As China’s marketization process advances, a series of factors, such as the household registration system that previously hindered population migration, have gradually weakened through reforms. With the advance of market-oriented reforms, the scale of worker migration has significantly increased. The local government’s affordable housing expenditure ( h o u i t ) is chosen to represent the government’s support for housing. Government housing support policies can stimulate population inflows by making housing more accessible and affordable, thus promoting regional economic and social development. Mulder et al. [66] have shown that providing adequate and affordable housing attracts specific categories of immigrants. Finally, we choose urban road space per capita ( i n f i t ) to indicate the regional infrastructure level, where high levels promote population migration [67].
First, the original data should be standardized due to having different units when chosen as indicators. Since all indicators are positively oriented, Formula (1) processes the data as follows:
S i j = x i j m i n X i m a x X i m i n X i ,
where S i j is the value standardized for each index data; xij denotes the j-th indicator value of the i-th individual.
Following data standardization, this study employs the entropy method to determine the weight of each indicator, ultimately forming an evaluation index system representing the economic patterns. The entropy weight method is an objective weighting method, where the smaller the variation of an indicator, the less information it reflects, and thus, the lower the corresponding weight. The specific calculation steps are as follows:
Step 1: calculate the indicator proportions: P i j = S i j i = 1 n S i j .
Step 2: calculate the entropy value of the j-th indicator: e j = k i = 1 n P i j × ln P i j , where k is the adjustment coefficient k = 1 ln n ; e j 0 .
Step 3: based on the indicator’s utility value D j ( D j = 1 e j ) , calculate the j-th indicator’s weight W j = D j i = 1 n D j .
The final formed indicator system and the weights of each index are shown in Table 1.

3.3. Data Sources and Analytical Strategy

We first select Guangdong, Jiangsu, and Zhejiang as case studies. Our data cover the beginning of the 21st century until 2022, totaling 69 samples. We compute the marketization index according to Fan and Wang [68], while other data are sourced from statistical yearbooks and bulletins of each province. To further evaluate the impact of the three economic patterns on the population inflows in developed coastal areas, ten coastal provinces (municipalities) are selected for the same period, totaling 230 samples. After removing the samples with missing control variables, 130 samples are used for empirical analysis.
Based on related studies, such as Puu et al. [69], Gu et al. [70], and Keuntae et al. [71], we then apply a fixed effects model. The individual fixed effect model, time-point fixed effect model, and time-point individual fixed effect model are three types of fixed effects models. In this paper, to study the impact of the economic pattern on net population inflows and, at the same time, effectively control the individual effect and the time effect, we adopt a two-way fixed effects model to construct the equation:
n m i t = β 0 + β 1 P R i t + β 2 S N i t + β 3 W Z i t + β 4 p o p i t + β 5 l a b i t + β 6 m i t + β 7 h o u i t + β 8 i n f i t + γ i + δ t + ε i t
where i denotes the province, t denotes the year. n m i t is the explanatory variable net migration rate, which represents the net migration rate of the i province in the year t. P R i t , S N i t , and W Z i t are core explanatory variables, which refer to the Pearl River, Sunan, and the Wenzhou patterns in the year t of i province. p o p i t , l a b i t , m i t , h o u i t , and i n f i t are the control variables, which represent urban population density, labor force level, marketization degree, government housing support, and infrastructure level. β c is the intercept term. β ( i = 1 , 2 , , 8 ) are the coefficient parameters corresponding to the explanatory variables, γ i denotes the individual effect that does not change over time, and δ t denotes the time effect that does not change across individual effects. ε i t denotes the random perturbation term.
Our data sample includes unbalanced panel data and some missing data observations. Since the paper later focuses on analyzing the results of the empirical analysis for a slightly larger sample (10 provinces), only the descriptive statistics for 10 provinces are reported in Table 2.

4. Empirical Results and Analysis

4.1. Basic Regression Results

As shown in Table 3, Model 1 and Model 2 represent the results of the linear regressions both without and with control variables. The regression results indicate that both the Pearl River and the Wenzhou patterns, as core explanatory variables, significantly influence the net migration rate of Jiangsu, Zhejiang, and Guangdong. However, the impact of the Sunan pattern on the net migration rate changes from significant to insignificant after the inclusion of the control variables. Specifically, the coefficients for the Pearl River and Wenzhou patterns are positive and significant at 10% and 1% confidence levels, respectively, indicating their strong population attraction, which is the pulling force of population flows. This is consistent with the conclusion of Qi et al. [46]. The coefficient of the Wenzhou pattern in the regression results of this article is greater than the coefficient of the Pearl River pattern, which also shows that in recent years, the Wenzhou pattern has been more attractive to the inter-provincial flows than the Pearl River pattern. The coefficient for the Sunan pattern is negative and significant at the 1% confidence level without the control variables but becomes insignificant after their inclusion. This implies that the Sunan pattern pushes population flow in Jiangsu, Zhejiang, and Guangdong without considering the control variables. We primarily focus on the results after including the control variables to ensure a rigorous analysis and avoid spurious regression. Model 2 demonstrates that the Sunan pattern, as a core explanatory variable, is insignificant and has a negative coefficient. Although it does not constitute an inhibiting effect, it still negatively impacts the population inflows. In contrast, for every unit increase in the Wenzhou and Pearl River patterns, the net migration rate increases by 0.2833 and 0.0533, respectively.
Given the relatively small sample size of this empirical analysis, this study expands the sample region to include ten coastal provinces to boost the robustness of our analysis. The three metropolitan belts along the eastern coast of China around the Bohai Sea (Beijing, Tianjin, Hebei, Liaoning, Shandong), the Yangtze River Delta (Shanghai, Jiangsu, and Zhejiang), and South China (Guangdong, Fujian) are China’s economically developed provinces and core areas for participating in international competition [72]. They are also the primary areas of net population inflows (see Figure 1). Models 3 and 4 represent the results of linear regressions both without and with the control variables, after expanding the sample size. The regression results indicate that both the Pearl River and the Wenzhou patterns, as core explanatory variables, have significant positive effects on the net migration rate of Jiangsu, Zhejiang, and Guangdong regions, at 5% and 1% confidence levels, respectively. However, the Sunan pattern loses significance after including the control variables, continuing to impact net population inflows negatively. The results are broadly consistent with those obtained when the sample was limited to Jiangsu, Zhejiang, and Guangdong. Only then did the significance of the Pearl River pattern strengthen. Moreover, the gap between the Pearl River and Wenzhou patterns’ importance for the population inflows narrows. For every unit increase in the Wenzhou and Pearl River patterns, the net migration rate of the population increases by 0.1578 and 0.1142, respectively.
From this analysis, it can be inferred that in the economically developed coastal areas, the Wenzhou pattern exhibits greater vitality and more robust significance to population inflows than the other two. In contrast, the Sunan pattern no longer plays a significant role. From the perspective of the Sunan pattern, the manufacturing and industry-related data selected when constructing the Sunan pattern show that in areas leading to the industrial growth pattern, industrial transformation and upgrading could be faster. Constrained by the existing local industrial structure, labor absorption primarily accelerates the development of low-end industries, while other sectors are suppressed and develop slowly. Consequently, the overall employment opportunities fail to increase, diminishing the region’s attractiveness for the population. From the perspective of the Pearl River pattern, it is primarily an exogenously driven growth pattern that guides the population flow through China’s connections with global markets. Regions developing an export-oriented economy are mainly concentrated in eastern coastal areas, requiring a large labor force to produce goods for the worldwide market. However, the local labor force cannot meet this demand, so migrants are attracted to the eastern coastal areas to fill the labor market vacancies. However, studies have shown that the impact of the Pearl River pattern on population inflows varies with time and space due to economic globalization. On the one hand, as foreign direct investment shifts from labor-intensive industries to high-tech and service sectors, the Pearl River pattern, dominated by an export-oriented economy, will become less attractive to migrant workers. On the other hand, this economic pattern, overly dependent on external forces (foreign companies), may suffer severe blows during global economic crises [73], being affected by the business environment [74].
From the perspective of the Wenzhou pattern, it has the most significant impact on the net population inflows among the three core explanatory variables. It is primarily driven by the private sector, which has distinct advantages in promoting employment and withstanding risks from international market trade. It is a vibrant force in China’s enterprise development and can attract and concentrate migrant populations. In investigating the effects of private enterprises on employment absorption capacity, several scholars deploy regression models for their analysis. Based on a game theoretical model, Haskel, J et al. [75] found that privatization promotes a more efficient government and a more liberalized market that facilitates employment and attracts inward migration of external populations. Wang et al. [76] confirm that in the context of the 2008 financial crisis, China was able to address employment challenges through its private enterprises.

4.2. Endogeneity and Robustness Tests

The relationship between population inflows and economic development is not unidirectional; instead, a mechanism of mutual interaction exists. Previous studies have suggested an interactive mechanism between economic development and population inflows. High-quality and sustainable economic growth accelerates the accumulation of human capital, as well as the population flows between regions, thereby expanding the market scale of human capital [77]. Additionally, population inflows lead to the continuous expansion of the human capital scale, steady improvement in its quality, and optimization of its structure, injecting a constant source of momentum into sustainable economic growth. Thus, the mutual promotion between population inflows and economic growth forms a positive cycle.
Based on the above analysis, the two-way fixed effects model also has potential endogeneity problems. Therefore, we employ the instrumental variable method to conduct a 2SLS regression on the model, incorporating control variables. Following the approach of Hao et al. [78], the first-order lag variables of the three economic patterns are selected as instrumental variables. The regression results are presented in Model 5 and Model 6 in Table 4. The results of the 2SLS regression show that both the Pearl River pattern and the Wenzhou pattern have significant effects on population inflows, confirmed by 5% and 1% significance tests, respectively. Compared to Models 3 and 4, the regression coefficients of each variable remain consistent in sign and significance level, with slight numerical fluctuations. This indicates that the baseline linear regression model does not suffer from severe endogeneity issues, and the research conclusions remain valid. This study conducts robustness tests using GMM (Generalized Method of Moments) estimation to ensure the reliability of the empirical regression results. A regression using GMM estimation is performed on equations both without and with the control variables, as shown in Models 7 and 8 in Table 3. The regression results align entirely with those of the 2SLS regression, indicating that the baseline linear regression model does not have severe heteroskedasticity, and the regression results are robust.

5. Discussion and Conclusions

The findings of this study contribute to both theory and practice. Taking the differences in net population inflows among the three economically strong provinces of Jiangsu, Zhejiang, and Guangdong as the starting point, we trace back to these provinces as the birthplaces of China’s three major economic patterns. By reviewing the impact of economic development on population inflows in previous studies, it was reasonably speculated that the three economic patterns will affect the population inflows differently. To investigate the impact, we sort out the evolutionary process of the three economic patterns and analyze their economic structures to determine the dominant factors of each. Then, we use the entropy weighting method to construct the dominant factors into a comprehensive indicator. Moreover, we expand the research scope to three critical coastal economic zones and empirically analyze the impact of the different economic patterns in economically developed areas on population inflows. The empirical results show the following:
(1) As the earliest established typical economic pattern, the Sunan pattern has been followed by many regions due to its remarkable results. However, it has seriously lacked motivation to attract population inflows and has even had a negative impact. The reasons are worthy of further discussion. The Sunan pattern is a typical industrial manufacturing-dominated economic pattern. Considering the sample groups, the scope of this study is the economically strong provinces in the eastern coastal areas, many of which have passed the stage of economic growth driven by industrialization, as confirmed in other studies. For instance, Frey et al. [79] studied the industrial districts of the Great Lakes in the United States. They found that this region initially developed its industries by leveraging the abundant natural resources and the well-developed railroad infrastructure. This allowed cities in the area to transition from small towns to prosperous urban centers through gradual industrialization. However, when this industrial economy declined, these cities could revive their prosperity by undergoing an economic restructuring, shifting from an industrial-based economy to a service-oriented one. The existing literature, such as Liu [80], in the empirical analysis of the impact of industrial agglomeration on population migration, found significant positive effects of service and manufacturing agglomeration on population concentration. However, the study sample covered all of China. The heterogeneity of the impact of manufacturing on population flows among different population groups may warrant further research.
(2) The Wenzhou pattern, represented by the private sector, is the most dynamic of the three economic patterns and has the most significant potential for sustainable development. A robust private sector often means a vibrant job market and, thus, job creation, which can attract a multi-skilled labor force. According to Molly [81], it is a significant driver of flows, as individuals move to areas with brighter employment prospects. Secondly, regions with a thriving private sector usually become centers of technological advancement and innovation, with more high-income opportunities. Shi et al. [82] found that high-tech industries create clusters of economic activity that raise the average wages and living standards in the areas where they are concentrated and are highly attractive to migration. Finally, the private sector can make a region less vulnerable to economic downturns. Ekpo et al. [83] consider that the level of development of the private sector is one of the most critical factors influencing economic diversification, which improves the resilience of the urban economy, thereby increasing economic stability and job creation. These findings corroborate the results of this study, suggesting that regions with vibrant private sectors are likely to have significant population inflows due to better employment prospects and higher rates of job creation. Therefore, regions should vigorously develop their private sectors, take more pragmatic initiatives to continuously optimize the environment for private sector development, effectively address the difficulties of private enterprise development, and boost the confidence of private enterprises in their development.
(3) The Pearl River pattern also significantly affects population inflows, but its influence is weaker than the Wenzhou pattern. Thanks to the Pearl River pattern, Guangdong, the top economic province, has the highest net population inflows, which have decreased in recent years. The net migration rate has gradually declined, reminding us to pay attention to the sustainability of the Pearl River pattern. During the rapid development of the Pearl River’s export-oriented economy, local enterprises or organizations exchange regional resources with multinational corporations to participate in the global production network [84]. However, this economic pattern is vulnerable to risks due to its dependence on international markets. Analyzing the Pearl River pattern, we found different development patterns in its eastern and western parts. Since the 1980s, the East Pearl River Delta area has primarily relied on external forces, represented by foreign investment companies and domestic buyers [85]. However, in the western Pearl River Delta cities, while using the same strategies as cities in the east to promote foreign investment, the region and the government actively encourage establishing local-owned township enterprises. These enterprises accumulate the production and marketing skills learned from multinational corporations, then develop their manufacturing industry, and eventually privatize these township enterprises into joint-stock companies in later stages to stimulate the competitiveness of local enterprises. In contrast, industrial clusters in the eastern region, dominated by foreign-funded enterprises, are susceptible to control by foreign investors, as local enterprises act as suppliers or low-level subcontractors of foreign-funded enterprises. Western Pearl River Delta cities’ strategies enable them to gradually upgrade from low-end brand manufacturers to leading domestic enterprises and expand into the global market. These enterprises, which are not solely reliant on foreign companies and traders, are less prone to economic crises and declines in international trade. This may serve as a direction for developing and upgrading the Pearl River Delta pattern.
In summary, through net population inflows, we have examined the sustainability of the economic development that influences regions’ attractiveness for the population. Sustainable development is a long-term, dynamic evolutionary process that requires continuous monitoring and adjustment throughout the regional development process. For example, Zhang et al. [72] studied the main forces driving economic development in China’s three major metropolitan areas and empirically analyzed their significant differences and changes over different periods. We can consider the three major economic patterns as “three primary colours” that can mix and match to form new colors, similar to how economic patterns can mix and match to create new patterns. As regions undergo economic and social development, they no longer possess a single economic pattern. It is crucial to clarify the dominant factors of each economic pattern to investigate the mechanisms driving economic growth and better analyze the key factors that influence the net population inflows from an economic perspective. Wang et al. [86] also demonstrated the close relationship between population migration in China’s eastern regions, particularly in the Yangtze River Delta, Pearl River Delta, and Beijing-Tianjin-Hebei metropolitan areas, and their economic growth pole.
For regions that focus on the Sunan pattern, characterized by an industrialization-led growth pattern, the emphasis should be on accelerating their progression toward the higher end of the global value chain [87]. On the one hand, these regions should strive to create advanced production factors, develop a private sector, and attract elite talents. On the other hand, they must transition from being factor-driven to being innovation-driven and continue to evolve from traditional manufacturing to digitalization and intelligent manufacturing. This shift towards innovation-driven and technologically advanced industries is crucial for laying a solid economic foundation to become a modern nation. Promoting the deep integration between manufacturing and services, gradually optimizing and upgrading the industrial structure, increasing the degree of openness to the outside world, and more closely integrating into the global industrial chain lay the foundation for sustainable development. Regions focusing on the Pearl River Delta pattern, dominated by an export-oriented economy, should develop an internal economic cycle so that local enterprises drive industrial clusters. This can be achieved by imitating existing products, selling them under their brands in the domestic market, and gaining high profits. Thus, local firms can earn high profits and enhance their production capabilities and risk resilience. Simultaneously, they can conduct subcontracting businesses in the global market to understand market trends and new technologies. Meanwhile, this approach further strengthens opening-up and promotes high-level openness to the outside world.
The findings of this study contribute to both theory and practice. We can infer the sustainability of their economic patterns through the data on net population inflows in the three provinces. China has previously set the transformation of economic growth modes and the adjustment of industrial structures as goals for macro-control. This study further reminds us that regions can dynamically adjust and optimize their economic structures following local development characteristics. Thus, regional policymakers are not merely passive observers of population change but also active agents who can stimulate population inflows by reshaping the economic patterns to ensure that the mechanisms of economic growth remain strong and dynamic. Beyond considering existing policies that may attract population inflows, such as housing benefits, public services, urban infrastructure levels, and degrees of market openness [88], they now have a new directive—adjusting the economic patterns as one of the strategies to coordinate population inflows. The goal of attracting population inflows is not temporary employment; regional policymakers should create an irresistible socioeconomic environment that transforms the migrants into permanent residents. It signifies that regional policies should transition from static to dynamic, responsive governance, enabling decision-makers to leverage the insights from this study to achieve effective societal upliftment.
Additionally, while this study’s empirical focus is on China’s eastern coastal areas, the fundamental research question concerning the relationship between regional economic patterns and internal migration bears global relevance. The private sector has great potential for attracting population inflows, especially for other emerging economies undergoing rapid urbanization and infrastructural development. The ‘economic patterns’ discussed in this paper have strong regional characteristics, but no region is dominated by a single economic pattern. Despite the regional contexts worldwide, the research methods and conclusions presented can serve as a reference point for similar studies in different backgrounds. In constructing economic patterns, the main drivers of economic growth are extracted: structural characteristics, population employment, and development potential. Focusing on internal factors is pertinent for most countries or regions at a similar stage of development. Identifying the dominant aspects of each economic pattern enables a better exploration of the dynamics of economic growth and a better analysis of the critical economic factors influencing population inflows. Our research has sparked new questions regarding how economic patterns impact population inflows, signaling the urgent need for a policy tailored to the specifics of these regions. It offers a benchmark for international policymakers and scholars to evaluate the effectiveness of similar economic pattern adjustments within their respective contexts. Hence, this study holds theoretical and practical value for global audiences.
Nevertheless, this research also has its limitations. Numerous studies have shown that regional policies can significantly impact migration. For example, Chen et al. [89] confirmed that the policy interventions during the COVID-19 pandemic, such as lockdowns, border closures, and travel restrictions, inevitably reshaped population inflows by directly modifying the physical possibilities for transportation. Additionally, research by Yang et al. [13] indicates that institutional aspects, such as incentive and constraint mechanisms, the degree of market competition, the completeness of contracts, and institutional changes, are essential factors influencing economic growth. It is evident that regional policies also play a crucial role in the formation of economic patterns. However, given the limitations of data availability and spatial constraints, this study did not consider the influence of regional policy factors impacting the economy or inflows due to the complexity and diversity of regional policies, which are challenging to quantify and uniformly apply within a cross-sectoral analysis framework. Future research could choose better and more systematic indicators, with a more comprehensive data resource to examine economic patterns and perform a more accurate empirical analysis.

Author Contributions

R.F. and D.H. drafted and conducted the manuscript; R.F. contributed to the method, data analysis, and results and finalized the manuscript; R.F. and J.H. contributed to the introduction and discussion and finalized the manuscript; R.F. and J.H. contributed to revising the manuscript. All authors have read and agreed to the published version of the manuscript.

Funding

This research was funded by the Key Project of the National Social Science Foundation of China, grant number “17ARK003” and the Open Project of Jiangsu Health Development Research Center in 2021, grant number “JSHD2022028”.

Institutional Review Board Statement

Not applicable.

Informed Consent Statement

Informed consent was obtained from all individual participants included in the study.

Data Availability Statement

The data are available from the corresponding author upon reasonable request.

Acknowledgments

We sincerely thank the participants who agreed to participate in this study.

Conflicts of Interest

There are no conflicts of interest.

Appendix A

Table A1. Summary of characteristics of the three major economic patterns.
The Sunan PatternThe Wenzhoun PatternThe Pearl River Pattern
Location
feature
The central part of the Yangtze River Delta.
Included cities such as Suzhou, Nanjing, Wuxi, and Changzhou, adjacent to Shanghai.
Surrounded by mountains on three sides
and faces the sea on one side.
Convenient transportation and proximity to Hong Kong and Macau.
Path of
development
Urbanization is based on industrialization.
Focusing on vigorously developing large cities.
Dedicated to pursuing the path of industrial urbanization, with primary and medium-sized cities as the main drivers and small towns as the linkages.
Following the theory of small-town development.By fully capitalizing on the proximity to Hong Kong and Macao, as well as overseas connections, vigorous efforts have been made to develop the export-oriented economy of the Pearl River Delta region and to introduce advanced technologies.
History
culture
Relying on abundant agricultural resources.
Under government leadership, it vigorously developed township enterprises and promoted a collective economy, laying a good foundation for the transition from agriculture to industry.
Specific period of “up to the mountains and down to the countryside,” under the livelihood requirements of rural labor and sent-down mechanic, Sunan emerged and formed the basic framework of early socialized industry, thus rapidly forming a large-scale collective economy and laying the foundation for primitive capital accumulation that would lead to industrialization through township enterprises later on. In recent years, Jiangsu has been striving for transformation through comprehensive reform and work innovation centered on the property rights system, developing city clusters characterized by openness and industrial parks supported by high-tech industries to enhance economic development.
Lacks the industrial and collective economic foundation of Southern Jiangsu. Wenzhou farmers, therefore, cannot adopt the Sunan pattern for transitioning to non-agricultural sectors.
With the continuous improvement of property rights, the “Wenzhou pattern” organizational form evolved from family businesses to joint-stock cooperatives. Modern corporate systems such as enterprise groups, limited-liability companies, and joint-stock-limited companies are becoming dominant, becoming the key pattern of private sector development.
Directly benefits from the country’s opening-up policy and has the advantage of receiving national preferential policies.
Local governments provide land or standard factory premises, the mainland supplies inexpensive labor, while Hong Kong and Taiwan furnish capital, equipment, technology, and management in the ‘Three Supplies and One Compensation’ model, focusing on the development of labor-intensive industries.
From the 1990s, Guangdong Province had already absorbed a large number of labor-intensive technologies, it prioritized introducing high and new technologies and is committed to the construction of high-tech industrial belts.
Conditions
of
infrastructure
A large population and limited land.Many people, little land, and a lot of surplus labor.
Limited national investment and poor transportation and energy infrastructure.
Convenient transportation and proximity to Hong Kong
and Macau, the Pearl River Delta benefits from its geographical advantage and numerous overseas Chinese and compatriots from Hong Kong and Macau, which can provide the funds and entrepreneurial experience.
predicamentWith the demand for industrial upgrading, rising labor costs, and the pressure to reduce energy consumption and emissions, capital instead of labor is becoming a realistic choice for enterprises. This choice significantly weakens the advantage of low-cost labor, placing the original reliance on village-level enterprises to achieve “full employment” in the secondary sector of the labor force in crisis.
Because the industrial structure of Sunan is labor-intensive and heavily based on the chemical industry, it is more difficult to attract young inter-provincial labor.
The extensive development model, long in use, has become unsustainable; systemic and structural issues, once obscured by rapidly growing economic aggregates, are increasingly coming to light.
Moreover, issues such as ‘one-size-fits-all’ approaches in administrative enforcement, repetitive inspections, and excessive interventions are prevalent in some areas. This has led to a lack of stable expectations for the production and operation of private enterprises and a dampening of confidence among private entrepreneurs.
Enterprises developed under the Pearl River pattern often assume the role of ‘factories’, responsible for processing raw materials and samples, yielding minimal profit.
Most are engaged in the processing and service industries, resulting in insufficient technological sophistication and endogenous development within the province.
Hence, the capability to ascend to the higher echelons of the global value chain and to hold a competitive edge in international markets needs enhancement.
Vulnerable to external factors, such as the logistics disruptions and global supply chain blockages caused by the three-year COVID-19 pandemic, and the unfavorable international business environment.

References

  1. King, R. Return Migration and Regional Economic Development: An Overview 1. In Return Migration and Regional Economic Problems; Routledge: London, UK, 2015; pp. 1–37. [Google Scholar]
  2. Silineviča, I. The attractiveness of cities in the frame of regional development. Hum. Resour. Main Factor Reg. Dev. 2010, 3, 74. [Google Scholar]
  3. Deschermeier, P. Population Development of the Rhine-Neckar Metropolitan Area: A Stochastic Population Forecast on the Basis of Functional Data Analysis. Comp. Popul. Stud. 2012, 36, 769–806. [Google Scholar]
  4. Argent, N.; Tonts, M.; Stockdale, A. Rural Migration, Agrarian Change, and Institutional Dynamics: Perspectives from the Majority World. Popul. Space Place 2014, 20, 299–302. [Google Scholar] [CrossRef]
  5. Lu, C.; Yu, Z.; Cui, X.; Li, S.; Lu, D. A Conceptual Framework of the Evolution Mechanism and Optimization Method of Regional Population Distribution for Sustainable Development. In Proceedings of the International Conference on Construction and Real Estate Management 2016, Edmonton, AB, Canada, 29 September–1 October 2016; American Society of Civil Engineers: Reston, VA, USA, 2016; pp. 649–658. [Google Scholar]
  6. Xin, Y. The Original New, Face up to the Opening of the Negative Growth Stage of Population; China Party and Government Cadres Forum: Beijing, China, 2023; pp. 81–82. (In Chinese) [Google Scholar]
  7. Ullman, E.L. Regional development and the geography of concentration. Pap. Reg. Sci. 1958, 4, 179–198. [Google Scholar] [CrossRef]
  8. Fan, C.C. Of Belts and Ladders: State Policy and Uneven Regional Development in Post-Mao China. Ann. Assoc. Am. Geogr. 1995, 85, 421–449. [Google Scholar] [CrossRef]
  9. Fan, C.C. Uneven development and beyond: Regional development theory in post-Mao China. Int. J. Urban Reg. Res. 1997, 21, 620–639. [Google Scholar] [CrossRef]
  10. Ma, L.J.; Wei, Y. Determinants of state investment in China, 1953–1990. Tijdschr. Voor Econ. Soc. Geogr. 1997, 88, 211–225. [Google Scholar] [CrossRef]
  11. Wei, Y. Regional Inequality of Industrial Output in China, 1952 to 1990. Geogr. Ann. Ser. B Hum. Geogr. 1998, 80, 1–15. [Google Scholar] [CrossRef]
  12. Wei, Y.D. Regional inequality in China. Prog. Hum. Geogr. 1999, 23, 49–59. [Google Scholar] [CrossRef]
  13. Yang, D.L. Beyond Beijing: Liberalization and the Regions in China; Routledge: London, UK, 2012. [Google Scholar]
  14. Fan, C.C. Developments from above, below and outside: Spatial impacts of China’s economic reforms in Jiangsu and Guangdong provinces. Chin. Environ. Dev. 1995, 6, 85–116. [Google Scholar]
  15. Lin, C.; Lin, G.C. Red Capitalism in South China: Growth and Development of the Pearl River Delta; UBC Press: Vancouver, BC, Canada, 1997; Volume 2. [Google Scholar]
  16. Oi, J.C. Rural China Takes Off: Institutional Foundations of Economic Reform; University of California Press: Oakland, CA, USA, 1999. [Google Scholar]
  17. Dennis Wei, Y. Beyond the Sunan model: Trajectory and underlying factors of development in Kunshan, China. Environ. Plan. A 2002, 34, 1725–1747. [Google Scholar] [CrossRef]
  18. Lu, L.; Wei, Y.D. Domesticating globalisation, new economic spaces and regional polarisation in Guangdong province, China. Tijdschr. Econ. Soc. Geogr. 2007, 98, 225–244. [Google Scholar] [CrossRef]
  19. Bove, V.; Elia, L. Migration, Diversity, and Economic Growth. World Dev. 2017, 89, 227–239. [Google Scholar] [CrossRef]
  20. Peterson, E.W.F. The Role of Population in Economic Growth. SAGE Open 2017, 7, 2158244017736094. [Google Scholar] [CrossRef]
  21. Paraskevopoulos, C.C. Patterns of regional economic growth. Reg. Urban Econ. 1974, 4, 77–105. [Google Scholar] [CrossRef]
  22. Biagi, B.; Faggian, A.; McCann, P. Long and short distance migration in Italy: The role of economic, social and environmental characteristics. Spat. Econ. Anal. 2011, 6, 111–131. [Google Scholar] [CrossRef]
  23. Geist, C.; McManus, P.A. Different Reasons, Different Results: Implications of Migration by Gender and Family Status. Demography 2011, 49, 197–217. [Google Scholar] [CrossRef]
  24. He, J. The regional concentration of China’s interprovincial migration flows, 1982–1990. Popul. Environ. 2002, 24, 149–182. [Google Scholar] [CrossRef]
  25. Liang, Z.; Li, Z.; Ma, Z. Changing patterns of the floating population in China, 2000–2010. Popul. Dev. Rev. 2014, 40, 695–716. [Google Scholar] [CrossRef]
  26. Liu, Y.; Shen, J. Jobs or amenities? Location choices of interprovincial skilled migrants in China, 2000–2005. Popul. Space Place 2014, 20, 592–605. [Google Scholar] [CrossRef]
  27. Piguet, E.; Kaenzig, R.; Guélat, J. The uneven geography of research on “environmental migration”. Popul. Environ. 2018, 39, 357–383. [Google Scholar] [CrossRef]
  28. Shen, J. Changing Patterns and Determinants of Interprovincial Migration in China 1985–2000. Popul. Space Place 2012, 18, 384–402. [Google Scholar] [CrossRef]
  29. Xu, X.; Zhao, Y.; Zhang, X.; Xia, S. Identifying the impacts of social, economic, and environmental factors on population aging in the Yangtze River Delta using the geographical detector technique. Sustainability 2018, 10, 1528. [Google Scholar] [CrossRef]
  30. Yan, T.; Wang, Y.Q. Environmental migration and sustainable development in the upper reaches of the Yangtze River. Popul. Environ. 2004, 25, 613–636. [Google Scholar] [CrossRef]
  31. Chan, K.W. The Chinese hukou system at 50. Eurasian Geogr. Econ. 2009, 50, 197–221. [Google Scholar] [CrossRef]
  32. Shen, J. Increasing internal migration in China from 1985 to 2005: Institutional versus economic drivers. Habitat Int. 2013, 39, 1–7. [Google Scholar] [CrossRef]
  33. Chan, K.W.; Zhang, L. The hukou system and rural-urban migration in China: Processes and changes. China Q. 1999, 160, 818–855. [Google Scholar] [CrossRef]
  34. Liang, Z.; Ma, Z. China’s floating population: New evidence from the 2000 census. Popul. Dev. Rev. 2004, 30, 467–488. [Google Scholar] [CrossRef]
  35. Zhang, L. Economic migration and urban citizenship in China: The role of points systems. Popul. Dev. Rev. 2012, 38, 503–533. [Google Scholar] [CrossRef]
  36. Liang, Z. China’s Great Migration and the Prospects of a More Integrated Society. Annu. Rev. Sociol. 2016, 42, 451–471. [Google Scholar] [CrossRef]
  37. Office of the Seventh National Census Leading Group of The State Council. China Census Yearbook-2020; China Statistics Press: Beijing, China, 2022; p. 4. ISBN 978-7-5037-9771-2. [Google Scholar]
  38. Basile, R.; Donati, C.; Pittiglio, R. Industry structure and employment growth: Evidence from semiparametric geoadditive models. Reg. Dev. 2013, 38, 121–160. [Google Scholar]
  39. Greenwood, M.J. Migration and Economic Growth in the United States: National, Regional, and Metropolitan Perspectives; Academic Press: Cambridge, MA, USA, 2014. [Google Scholar]
  40. Hay, R. Patterns of urbanization and socio-economic development in the Third World: An overview. In Third World Urbanization; Routledge: London, UK, 2013; pp. 71–101. [Google Scholar]
  41. Sachs, J.D. Globalization and patterns of economic development. Rev. World Econ. 2000, 136, 579–600. [Google Scholar] [CrossRef]
  42. Silverberg, G. Patterns of evolution and patterns of explanation in economic theory. In Newton to Aristotle: Toward a Theory of Models for Living Systems; Springer: Berlin/Heidelberg, Germany, 1989; pp. 201–226. [Google Scholar]
  43. Arthur, W.B.; Hanusch, H.; Pyka, A. Elgar Companion to Neo-Schumpeterian Economics. In Chapter 67: Complexity and the Economy; Edward Elgar Publishing: London, UK, 2007. [Google Scholar]
  44. Zhang, Z.Z.; Yang, T.H. Some problems in the formation and development of the ‘Sunan Model’. Res. Agric. Mod. 1995, 16, 189–191. [Google Scholar]
  45. Wei, Y.D.; Lu, Y.; Chen, W. Globalizing regional development in Sunan, China: Does Suzhou Industrial Park fit a neo-Marshallian district model? In Globalizing Regional Development in East Asia; Routledge: London, UK, 2013; pp. 134–152. [Google Scholar]
  46. Qi, J.; Zhou, L.; Yang, Q.; Qiu, M. Reasons and Countermeasures of Jiangsu’s Population Attraction Dilemma: Based on a comparative study of Jiangsu, Zhejiang and Guangdong. Res. Dev. 2021, 38, 64–76. (In Chinese) [Google Scholar]
  47. Truong, D.T. Public Enterprises and Economic Performance: An Examination of Vietnamese State Owned Enterprises; The University of Texas at Dallas: Dallas, TX, USA, 2013. [Google Scholar]
  48. Rostowski, J. The decay of socialism and the growth of private enterprise in Poland. Sov. Stud. 1989, 41, 194–214. [Google Scholar] [CrossRef]
  49. Pryke, R. The comparative performance of public and private enterprise. In Fiscal Studies; Wiley: Hoboken, NJ, USA, 1982; pp. 68–81. [Google Scholar]
  50. Wang, Z. The Private Sector and China’s Market Development; Elsevier: Amsterdam, The Netherlands, 2008. [Google Scholar]
  51. Leung, C.K. Foreign manufacturing investment and regional industrial growth in Guangdong Province, China. Environ. Plan. A 1996, 28, 513–536. [Google Scholar] [CrossRef]
  52. Li, X.; Pan, Z. Globalization-driven internal migration in China: The impact of foreign direct investment and exports since 2000. Popul. Space Place 2023, 29, e2612. [Google Scholar] [CrossRef]
  53. Fan, C.C. Economic opportunities and internal migration: A case study of Guangdong Province, China. Prof. Geogr. 1996, 48, 28–45. [Google Scholar] [CrossRef]
  54. Liang, Z.; White, M.J. Market transition, government policies, and interprovincial migration in China: 1983–1988. Econ. Dev. Cult. Chang. 1997, 45, 321–339. [Google Scholar] [CrossRef]
  55. Chen, X. The new spatial division of labor and commodity chains in the Greater South China Economic Region. In Contributions in Economics and Economic History; Praeger: Westport, CT, USA, 1994; p. 165. [Google Scholar]
  56. Chen, X. Both glue and lubricant: Transnational ethnic social capital as a source of Asia-Pacific subregionalism. Policy Sci. 2000, 33, 269–287. [Google Scholar] [CrossRef]
  57. Tian, S.; Wang, X.; Li, X. The Promotion effect of industry encouragement policy on the entry of Foreign direct investment in China: Based on the Catalogue for the Guidance of Foreign Investment Industries and the analysis of micro enterprise data. Fudan J. Soc. Sci. Ed. 2020, 62, 174–184. (In Chinese) [Google Scholar]
  58. GPBS. Guangdong Statistical Yearbook 2023; China Statistics Press: Beijing, China, 2023. [Google Scholar]
  59. Basu, K.; Maertens, A. The pattern and causes of economic growth in India. Oxf. Rev. Econ. Policy 2007, 23, 143–167. [Google Scholar] [CrossRef]
  60. GPBS. JiangSu Statistical Yearbook 2023; China Statistics Press: Beijing, China, 2023. [Google Scholar]
  61. GPBS. ZheJiang Statistical Yearbook 2023; China Statistics Press: Beijing, China, 2023. [Google Scholar]
  62. Duan, C.; Sheng, D. Cross-provincial migration of population in three northeastern provinces since 1953: Based on the census survival ratio method. Popul. J. 2022, 44, 14–28. (In Chinese) [Google Scholar]
  63. Buch, T.; Hamann, S.; Niebuhr, A.; Rossen, A. What Makes Cities Attractive? The Determinants of Urban Labour Migration in Germany. Urban Stud. 2014, 51, 1960–1978. [Google Scholar] [CrossRef]
  64. Morgan, J.N.; Robb, E.H. The impact of age upon interregional migration. Ann. Reg. Sci. 1981, 15, 31–45. [Google Scholar] [CrossRef] [PubMed]
  65. Montanari, A.; Staniscia, B. Human Mobility: An Issue of Multidisciplinary Research. In Global Change and Human Mobility; Domínguez-Mujica, J., Ed.; Springer: Singapore, 2016; pp. 1–23. [Google Scholar]
  66. Mulder, C.H. Population and housing. A two-sided relationship. Demogr. Res. 2006, 15, 401–412. [Google Scholar] [CrossRef]
  67. Müller, A.L.; Tuitjer, L. Editorial: Infrastructures and migration. Geogr. Helv. 2023, 78, 559–565. [Google Scholar] [CrossRef]
  68. Wang, X.; Fan, G.; Yu, J. China’s Marketization Index Report by Province (2016); Social Sciences Academic Press: Cambridge, MA, USA, 2017. (In Chinese) [Google Scholar]
  69. Puu, T. Spatial Pattern Formation. In Nonlinear Economic Dynamics; Springer: Berlin/Heidelberg, Germany, 1991; pp. 8–24. [Google Scholar]
  70. Gu, H.; Jie, Y.; Li, Z.; Shen, T. What Drives Migrants to Settle in Chinese Cities: A Panel Data Analysis. Appl. Spat. Anal. Policy 2021, 14, 297–314. [Google Scholar] [CrossRef]
  71. Keuntae, K. Determinants of Interregional Migration Flows in Korea by Age Groups, 1995–2014. Dev. Soc. 2015, 44, 365–388. [Google Scholar]
  72. Zhang, L. Empirical research on economic development of Eastern three metropolitan areas in China. In Proceedings of the 2012 International Symposium on Management of Technology (ISMOT), Hangzhou, China, 8–9 November 2012; IEEE: New York, NY, USA, 2012; pp. 303–307. [Google Scholar]
  73. Du, Z.; Jin, L.; Ye, Y.; Zhang, H. Characteristics and influences of urban shrinkage in the exo-urbanization area of the Pearl River Delta, China. Cities 2020, 103, 102767. [Google Scholar] [CrossRef]
  74. Oizumi, K. The emergence of the Pearl River Delta economic zone-challenges on the path to megaregion status and sustainable growth. Pac. Bus. Ind. 2011, 11, 2–20. [Google Scholar]
  75. Haskel, J.; Szymanski, S. Privatization, Liberalization, Wages and Employment: Theory and Evidence for the UK. Economica 1993, 60, 161–181. [Google Scholar] [CrossRef]
  76. Wang, X.; Wang, S. The development of private enterprises is an important way to solve the employment problem. Acad. Exch. 2010, 1, 73–76. (In Chinese) [Google Scholar]
  77. Patrick, C.; Stephens, H.M. Incentivizing the Missing Middle: The Role of Economic Development Policy. Econ. Dev. Q. 2020, 34, 154–170. [Google Scholar] [CrossRef]
  78. Hao, H.; Ren, D.; Liu, M. Does service industry agglomeration promote population diffusion in central cities? Macroecon. Res. 2021, 4, 94–112. (In Chinese) [Google Scholar]
  79. Frey, W.H.; Speare, A. The Revival of Metropolitan Population Growth in the United States: An Assessment of Findings from the 1990 Census. Popul. Dev. Rev. 1992, 18, 129–146. [Google Scholar] [CrossRef]
  80. Liu, J. The influence of industrial agglomeration and industrial coordination on population migration. J. Popul. 2023, 45, 63–77. (In Chinese) [Google Scholar]
  81. Molloy, R.; Smith, C.L.; Wozniak, A. Job Changing and the Decline in Long-Distance Migration in the United States. Demography 2017, 54, 631–653. [Google Scholar] [CrossRef] [PubMed]
  82. Shi, J.-l.; Lai, W.-H. Incentive factors of talent agglomeration: A case of high-tech innovation in China. Int. J. Innov. Sci. 2018, 11, 561–582. [Google Scholar] [CrossRef]
  83. Ekpo, A.H.; Afangideh, U.J.; Udoh, E.A. Private Sector Development and Economic Diversification: Evidence from West African States. In Private Sector Development in West Africa; Seck, D., Ed.; Springer International Publishing: Cham, Switzerland, 2014; pp. 97–110. [Google Scholar]
  84. Yeung, H.W.-C. Regional Development and the Competitive Dynamics of Global Production Networks: An East Asian Perspective. Reg. Stud. 2009, 43, 325–351. [Google Scholar] [CrossRef]
  85. Liu, Y.; Liang, Y.; Ma, S.; Huang, K. Divergent Developmental Trajectories and Strategic Coupling in the Pearl River Delta: Where Is a Sustainable Way of Regional Economic Growth? Sustainability 2017, 9, 1782. [Google Scholar] [CrossRef]
  86. Wang, G.; Zhang, Y. Population migration and economic growth polarization in three metropolitan areas in eastern China. J. East China Norm. Univ. Philos. Soc. Sci. Ed. 2006, 5, 1–9. (In Chinese) [Google Scholar]
  87. Huang, Y.; Chen, C.; Su, D.; Wu, S. Comparison of leading-industrialisation and crossing-industrialisation economic growth patterns in the context of sustainable development: Lessons from China and India. Sustain. Dev. 2020, 28, 1077–1085. [Google Scholar] [CrossRef]
  88. Wu, J.; Yu, Z.; Wei, Y.D.; Yang, L. Changing distribution of migrant population and its influencing factors in urban China: Economic transition, public policy, and amenities. Habitat Int. 2019, 94, 102063. [Google Scholar] [CrossRef]
  89. Chen, Y.; Chen, M.; Huang, B.; Wu, C.; Shi, W. Modeling the Spatiotemporal Association Between COVID-19 Transmission and Population Mobility Using Geographically and Temporally Weighted Regression. GeoHealth 2021, 5, e2021GH000402. [Google Scholar] [CrossRef]
Figure 1. Map of China’s economic distribution. Note: Jiangsu, Zhejiang, and Guangdong are in red. Other coastal provinces are in blue. Source: Jiangsu, Zhejiang and Guangdong Statistical Yearbook 2023 [58,60,61].
Sustainability 16 05176 g001
Figure 2. Comparison of non-registered population in three provinces. Source: Jiangsu, Zhejiang and Guangdong Statistical Yearbook 2023 [58,60,61].
Sustainability 16 05176 g002
Figure 3. Size of non-registered population and its share in the total population in the three provinces. Source: Jiangsu, Zhejiang and Guangdong Statistical Yearbook 2023 [58,60,61].
Sustainability 16 05176 g003
Table 1. Index system and weight distribution.
Indicators SystemVariable NameIndicator UnitIndicator Weight (%)
Pearl River patternForeign investment dependence%25.28
Export-oriented trade dependence%24.44
Number of foreign-invested enterprises
as a percentage of the total population
%24.24
Total investment by foreign-invested enterprisesbillions26.04
Sunan patternManufacturing value added as a share of the GDP%23.38
Share of manufacturing employment
in total employment
%26.65
Number of industrial enterprises above selected size as a percentage of the total population%24.91
Investment in fixed assets of industrial
enterprises above selected size
billions25.06
Wenzhou patternValue added by the private sector
as a share of the GDP
%22.79
Registered capital of
individual private enterprises
billions28.27
Share of private and self-employment
in total employment
%23.39
Number of private individual households
as a percentage of the total population
%25.55
Note: The indicator weight samples are calculated using data from ten provinces in three major metropolitan areas.
Table 2. Descriptive statistical results of variables.
VariantMeanStd. Dev.MinMax
Pearl River pattern0.2210.1190.0160.529
Sunan pattern0.4360.2270.0961.059
Wenzhou pattern0.2190.1120.0720.792
Government housing support0.1830.1410.010.762
Labor force level75.1883.21565.39983.841
Marketization index8.8451.6564.48412.39
Urban population density226.31485.50085.2501.6
Infrastructure level143.7158.51040.4258.2
Table 3. Estimated results of influence by different economic patterns on net migration rate.
(1)(2)(3)(4)
VariantNet
Migration Rate
Net Migration RateNet Migration RateNet Migration Rate
Pearl River pattern0.0569 *0.0523 *0.1287 **0.1142 **
(3.8294)(3.1924)(2.4068)(3.0284)
Sunan pattern−0.1628 ***−0.2604−0.2236 ***−0.0290
(−27.3490)(−2.6141)(−6.4911)(−1.0198)
Wenzhou pattern0.3047 ***0.2833 ***0.1936 ***0.1578 ***
Government housing support 0.0181 *** 0.0175 *
(22.1577) (2.1951)
Labor force level 0.0022 ** 0.0000
(4.4502) (0.0256)
Marketization index 0.0033 0.0063
(1.1374) (1.3976)
Urban population density −0.6688 −0.0001 *
(−1.2893) (−1.9475)
Level of infrastructure 0.0004 0.0002 **
(2.3542) (2.6417)
Constant0.0853 ***−0.18000.1552 ***0.0292
(20.1120)(−1.1787)(7.7736)(0.2864)
Observations6633220120
Numbers of Years22112211
Numbers of Provinces 331010
ProvinceYesYesYesYes
YearYesYesYesYes
Note: ***, ** and * represent significance levels of 10%, 5%, and 1%, respectively.
Table 4. Endogeneity and robustness tests.
(5)(6)(7)(8)
VariantNet
Migration Rate
Net Migration RateNet Migration RateNet Migration Rate
Pearl River pattern0.0448 **0.0667 *0.1353 ***0.1565 **
(2.1642)(1.3678)(2.9776)(3.1301)
Sunan pattern−0.1891 ***−0.1851−0.2115 ***−0.0535
(−17.9414)(−0.5223)(−6.8817)(−1.4861)
Wenzhou pattern0.2881 ***0.3145 ***0.2268 ***0.1800 ***
(60.2532)(4.0228)(5.3031)(4.2000)
Government housing support 0.0228 * 0.0067
(1.6823) (0.6507)
Labor force level 0.0027 ** 0.0001
(2.4568) (0.0646)
Marketization index 0.0047 0.0057 *
(0.8586) (1.8535)
Urban population density 2.4092 −0.0088 ***
(0.0100) (−2.6926)
Level of infrastructure 0.0053 * 0.0022 ***
(1.7358) (3.5606)
Constant0.1415 ***−0.20670.2629 ***0.2595 ***
(92.3718)(−0.3331)(12.7805)(2.5998)
Observations6633220120
Number of Years22112211
Number of Provinces 331010
ProvinceYesYesYesYes
YearYesYesYesYes
Note: ***, ** and * represent significance levels of 10%, 5%, and 1%, respectively.
Disclaimer/Publisher’s Note: The statements, opinions and data contained in all publications are solely those of the individual author(s) and contributor(s) and not of MDPI and/or the editor(s). MDPI and/or the editor(s) disclaim responsibility for any injury to people or property resulting from any ideas, methods, instructions or products referred to in the content.

