
Finite–Discrete Element Method Simulation Study on Development of Water-Conducting Fractures in Fault-Bearing Roof under Repeated Mining of Extra-Thick Coal Seams

Abstract
:1. Introduction
2. Constitutive Relation of Continuous Deformation—Discrete Motion of Rock
2.1. Elastic–Plastic Deformation of Intact Rock
2.2. Mixed Fracture of Non-Interpenetrated Cracks
2.3. Mechanical Response of Penetrating Cracks
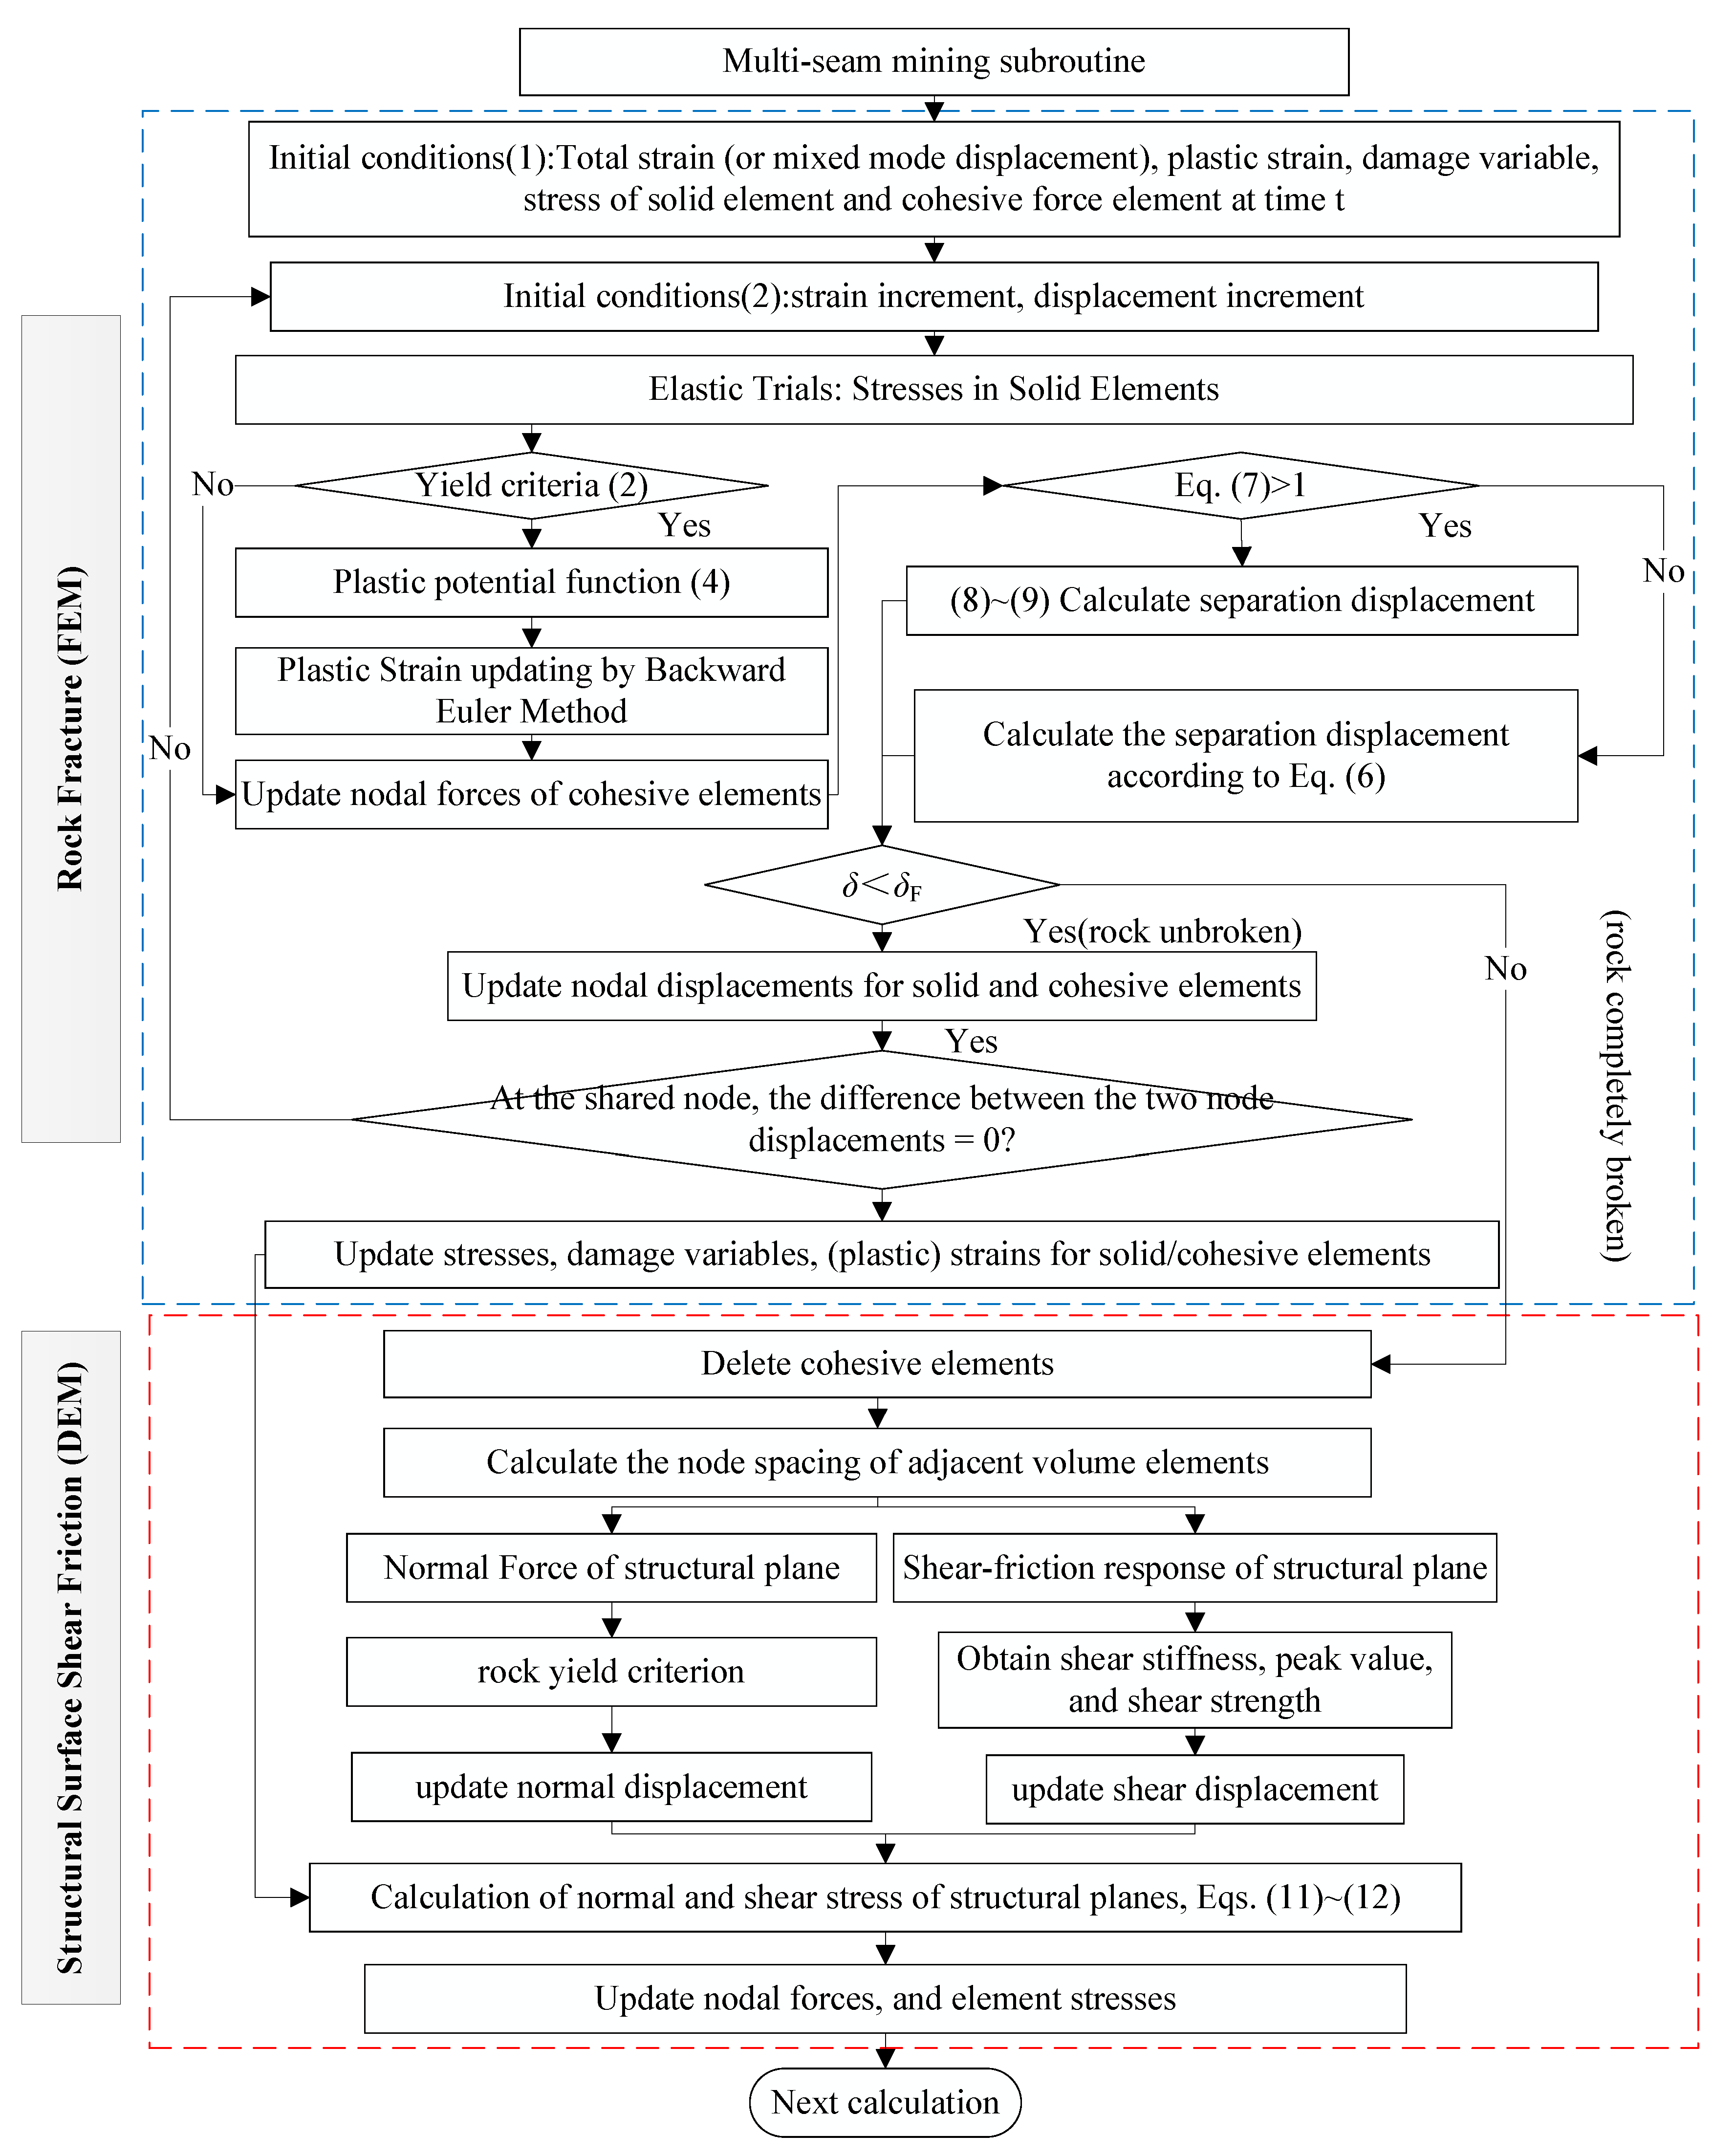
- (1)
- Separation occurs when any node spacing (l) between adjacent solid elements (simulating intact-rock blocks) is more than 0. At this time, Newton’s second law is used to calculate the rock movement under the influence of gravity [37].
- (2)
- If l = 0 and there is compressive stress between adjacent rock blocks, penetrating cracks undergo a compression extrusion process.
- (3)
- If l = 0 and there is shear stress along the penetrating crack, shear friction occurs.
3. Material Parameters and Verification of Constitutive Equations
3.1. Material Parameters
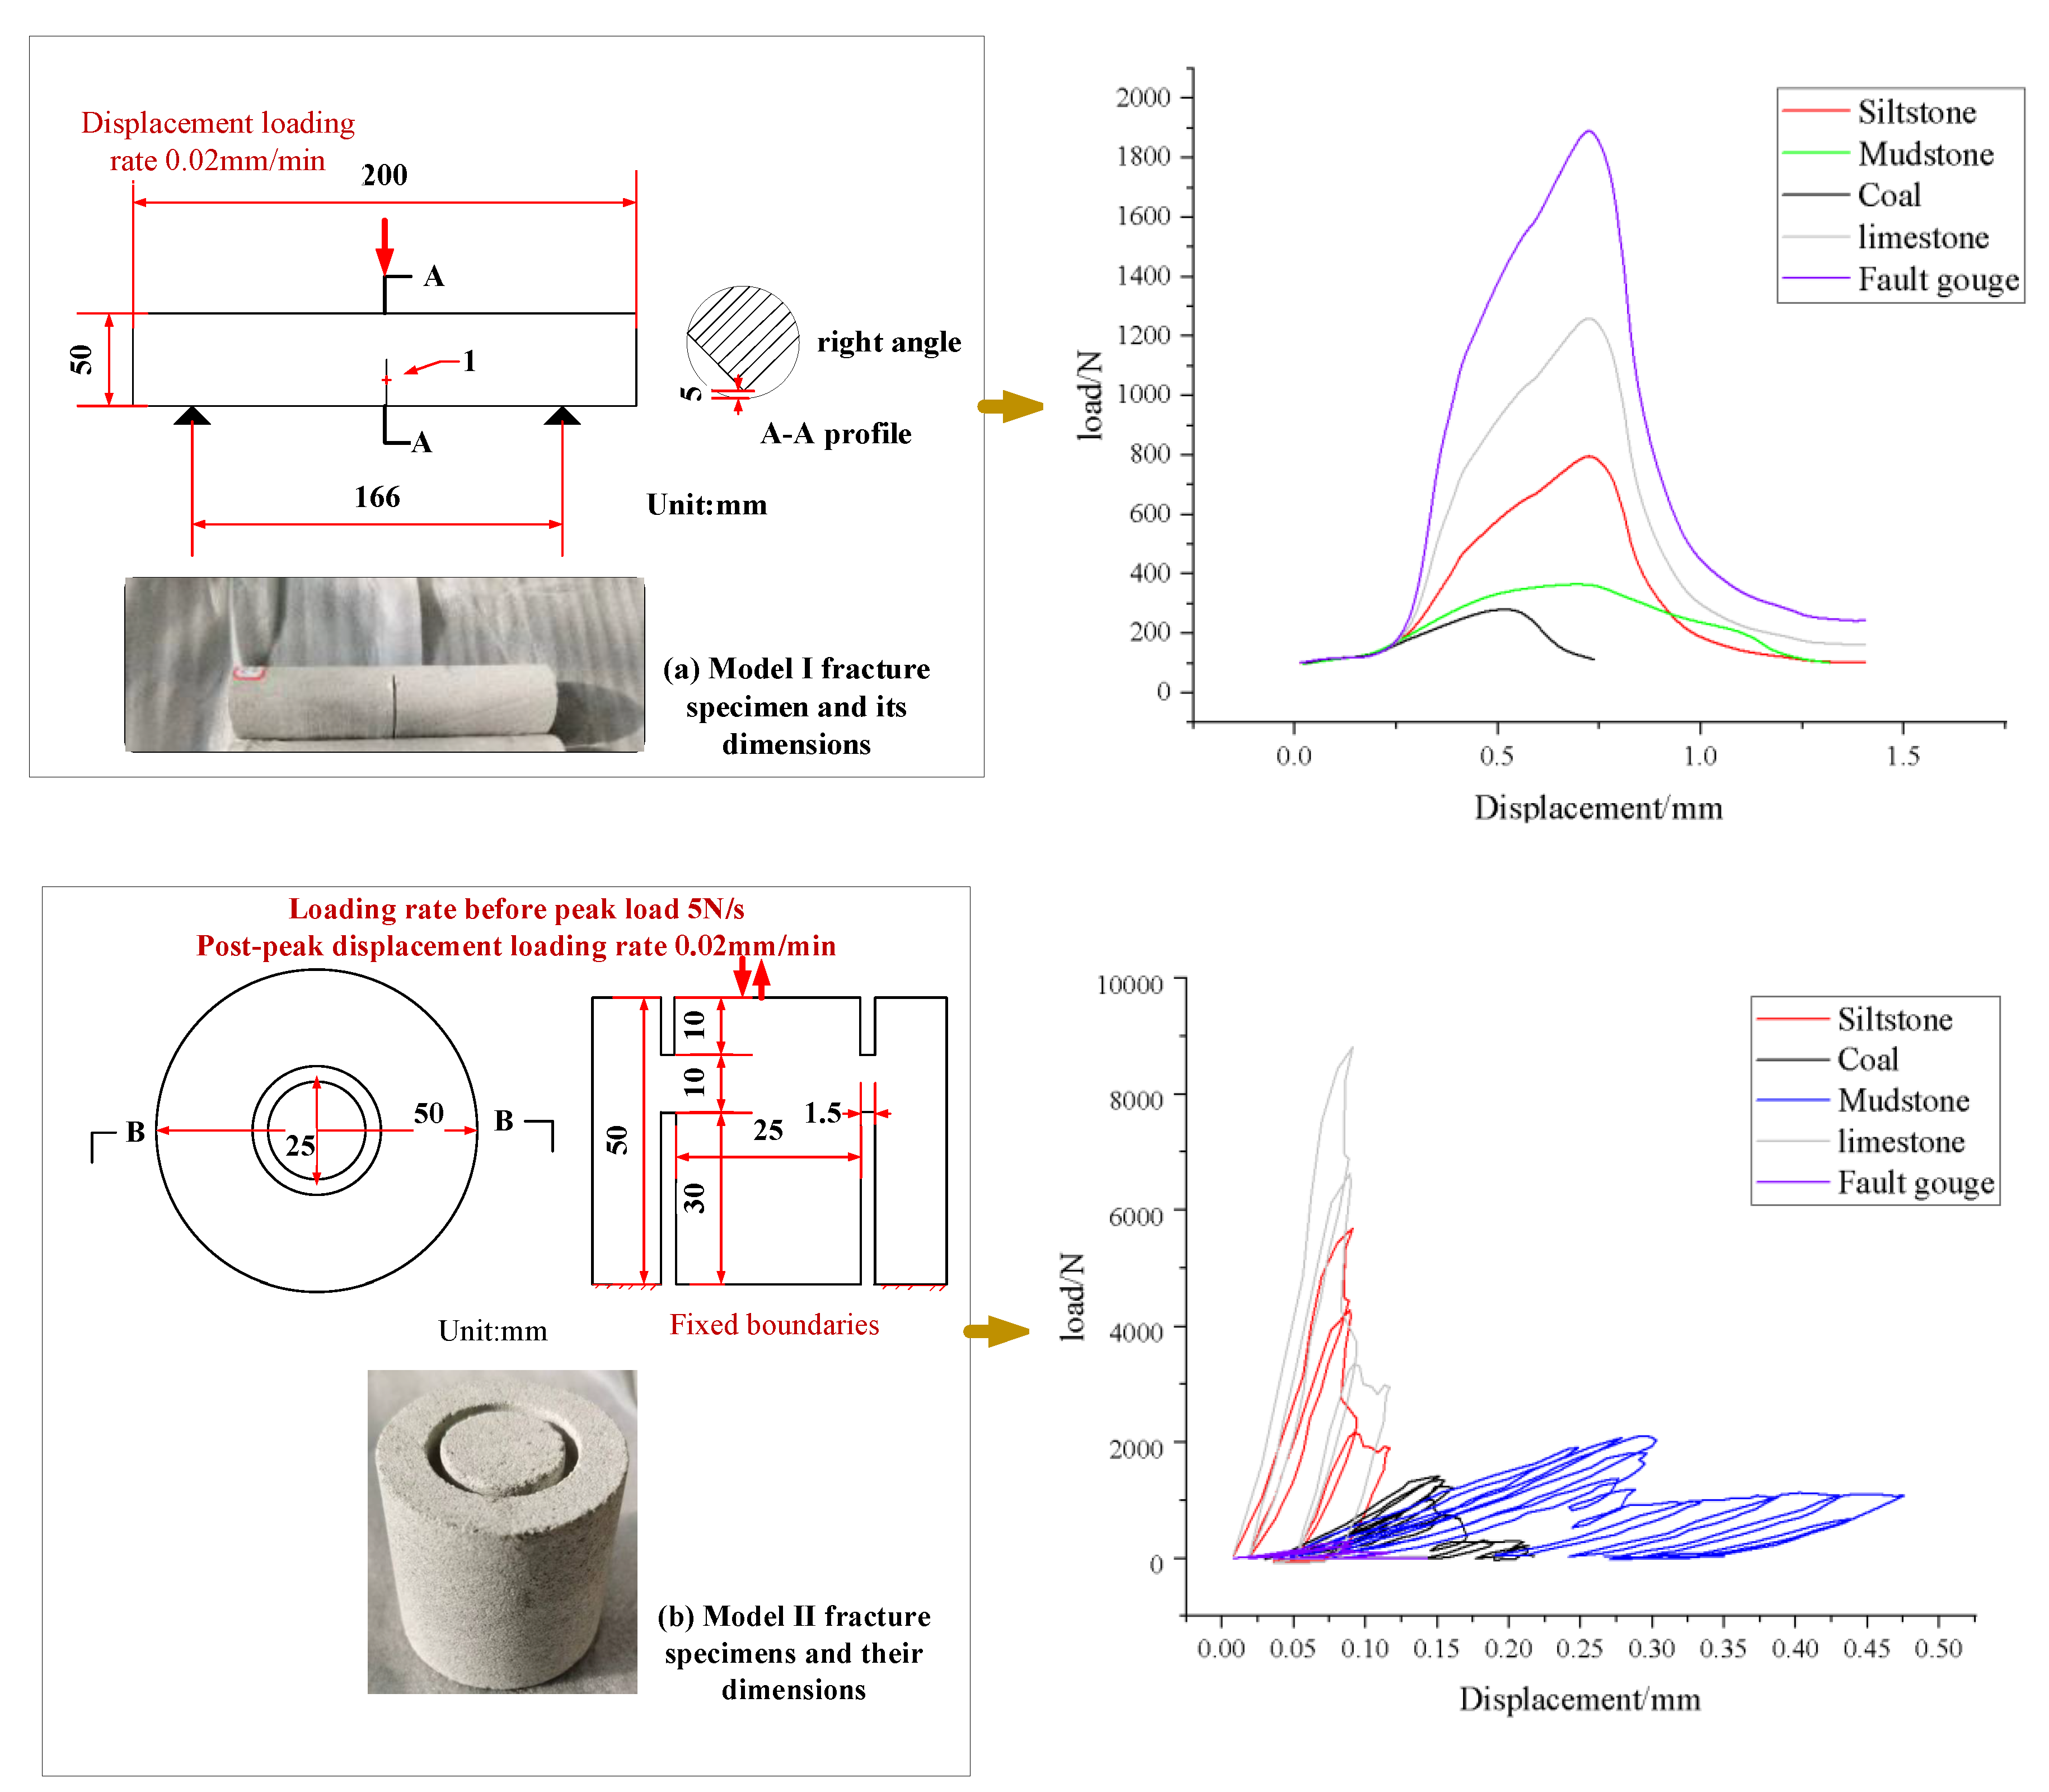
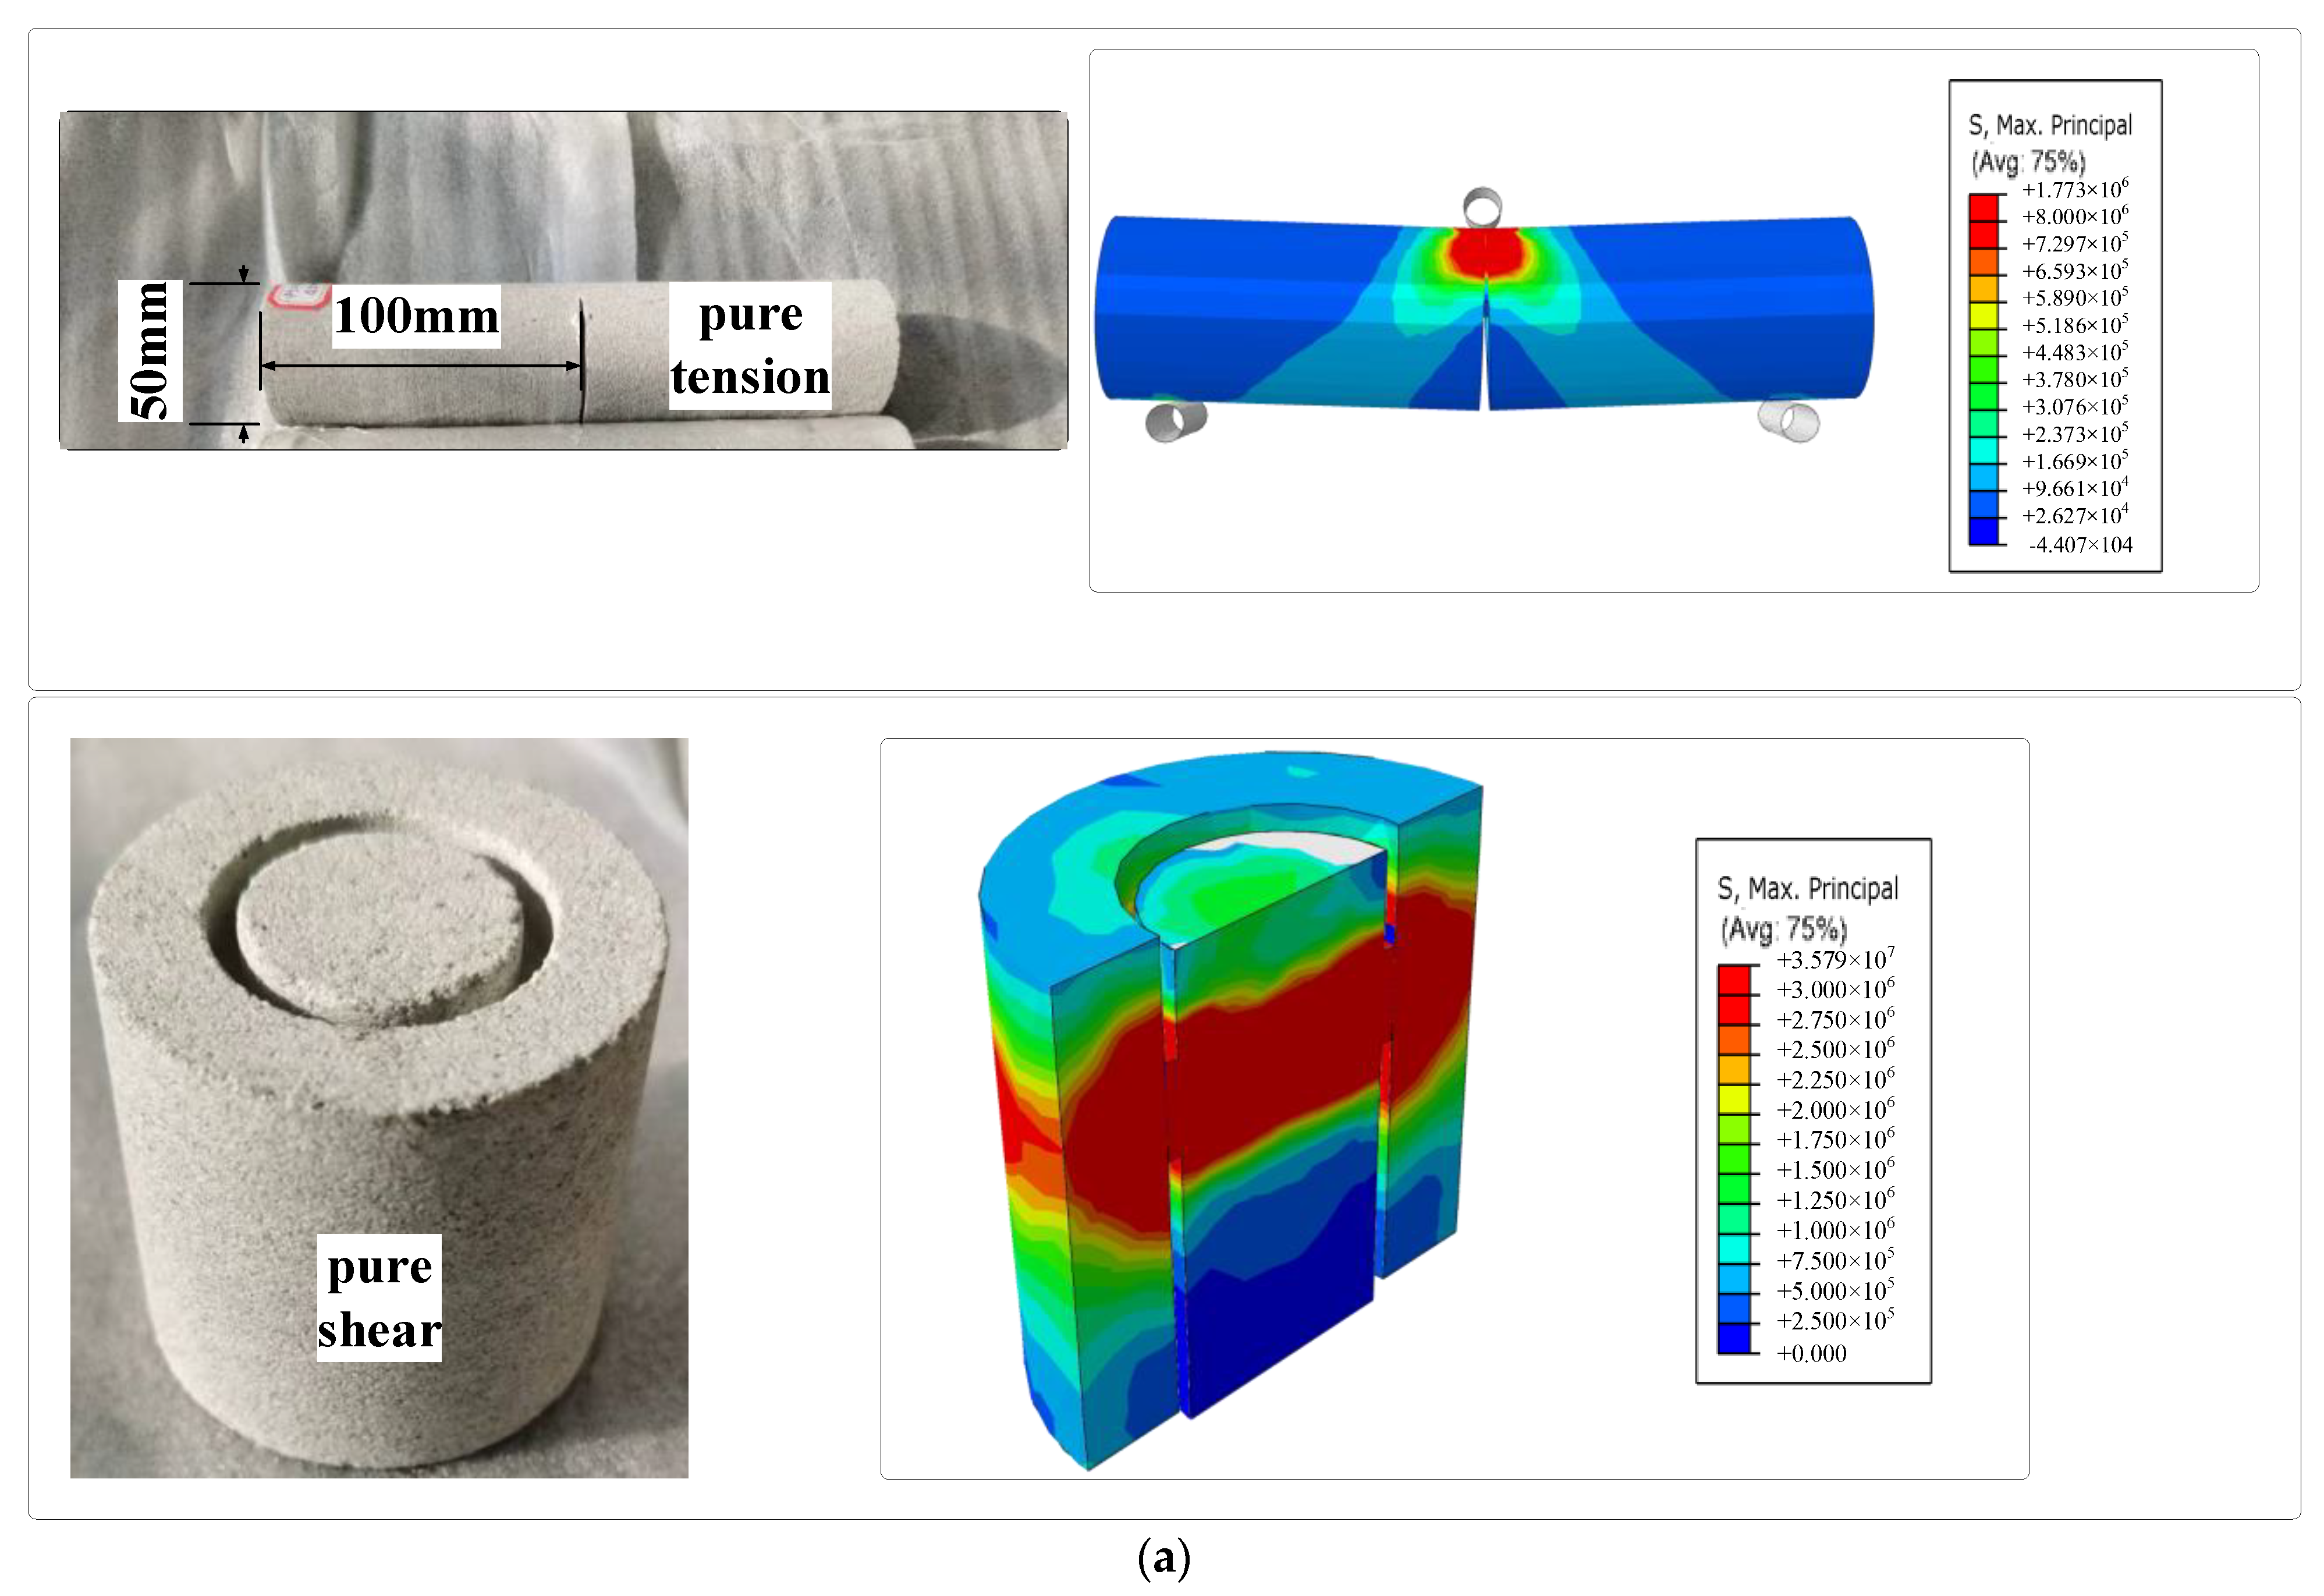
3.2. Constitutive Equation Verification
- (1)
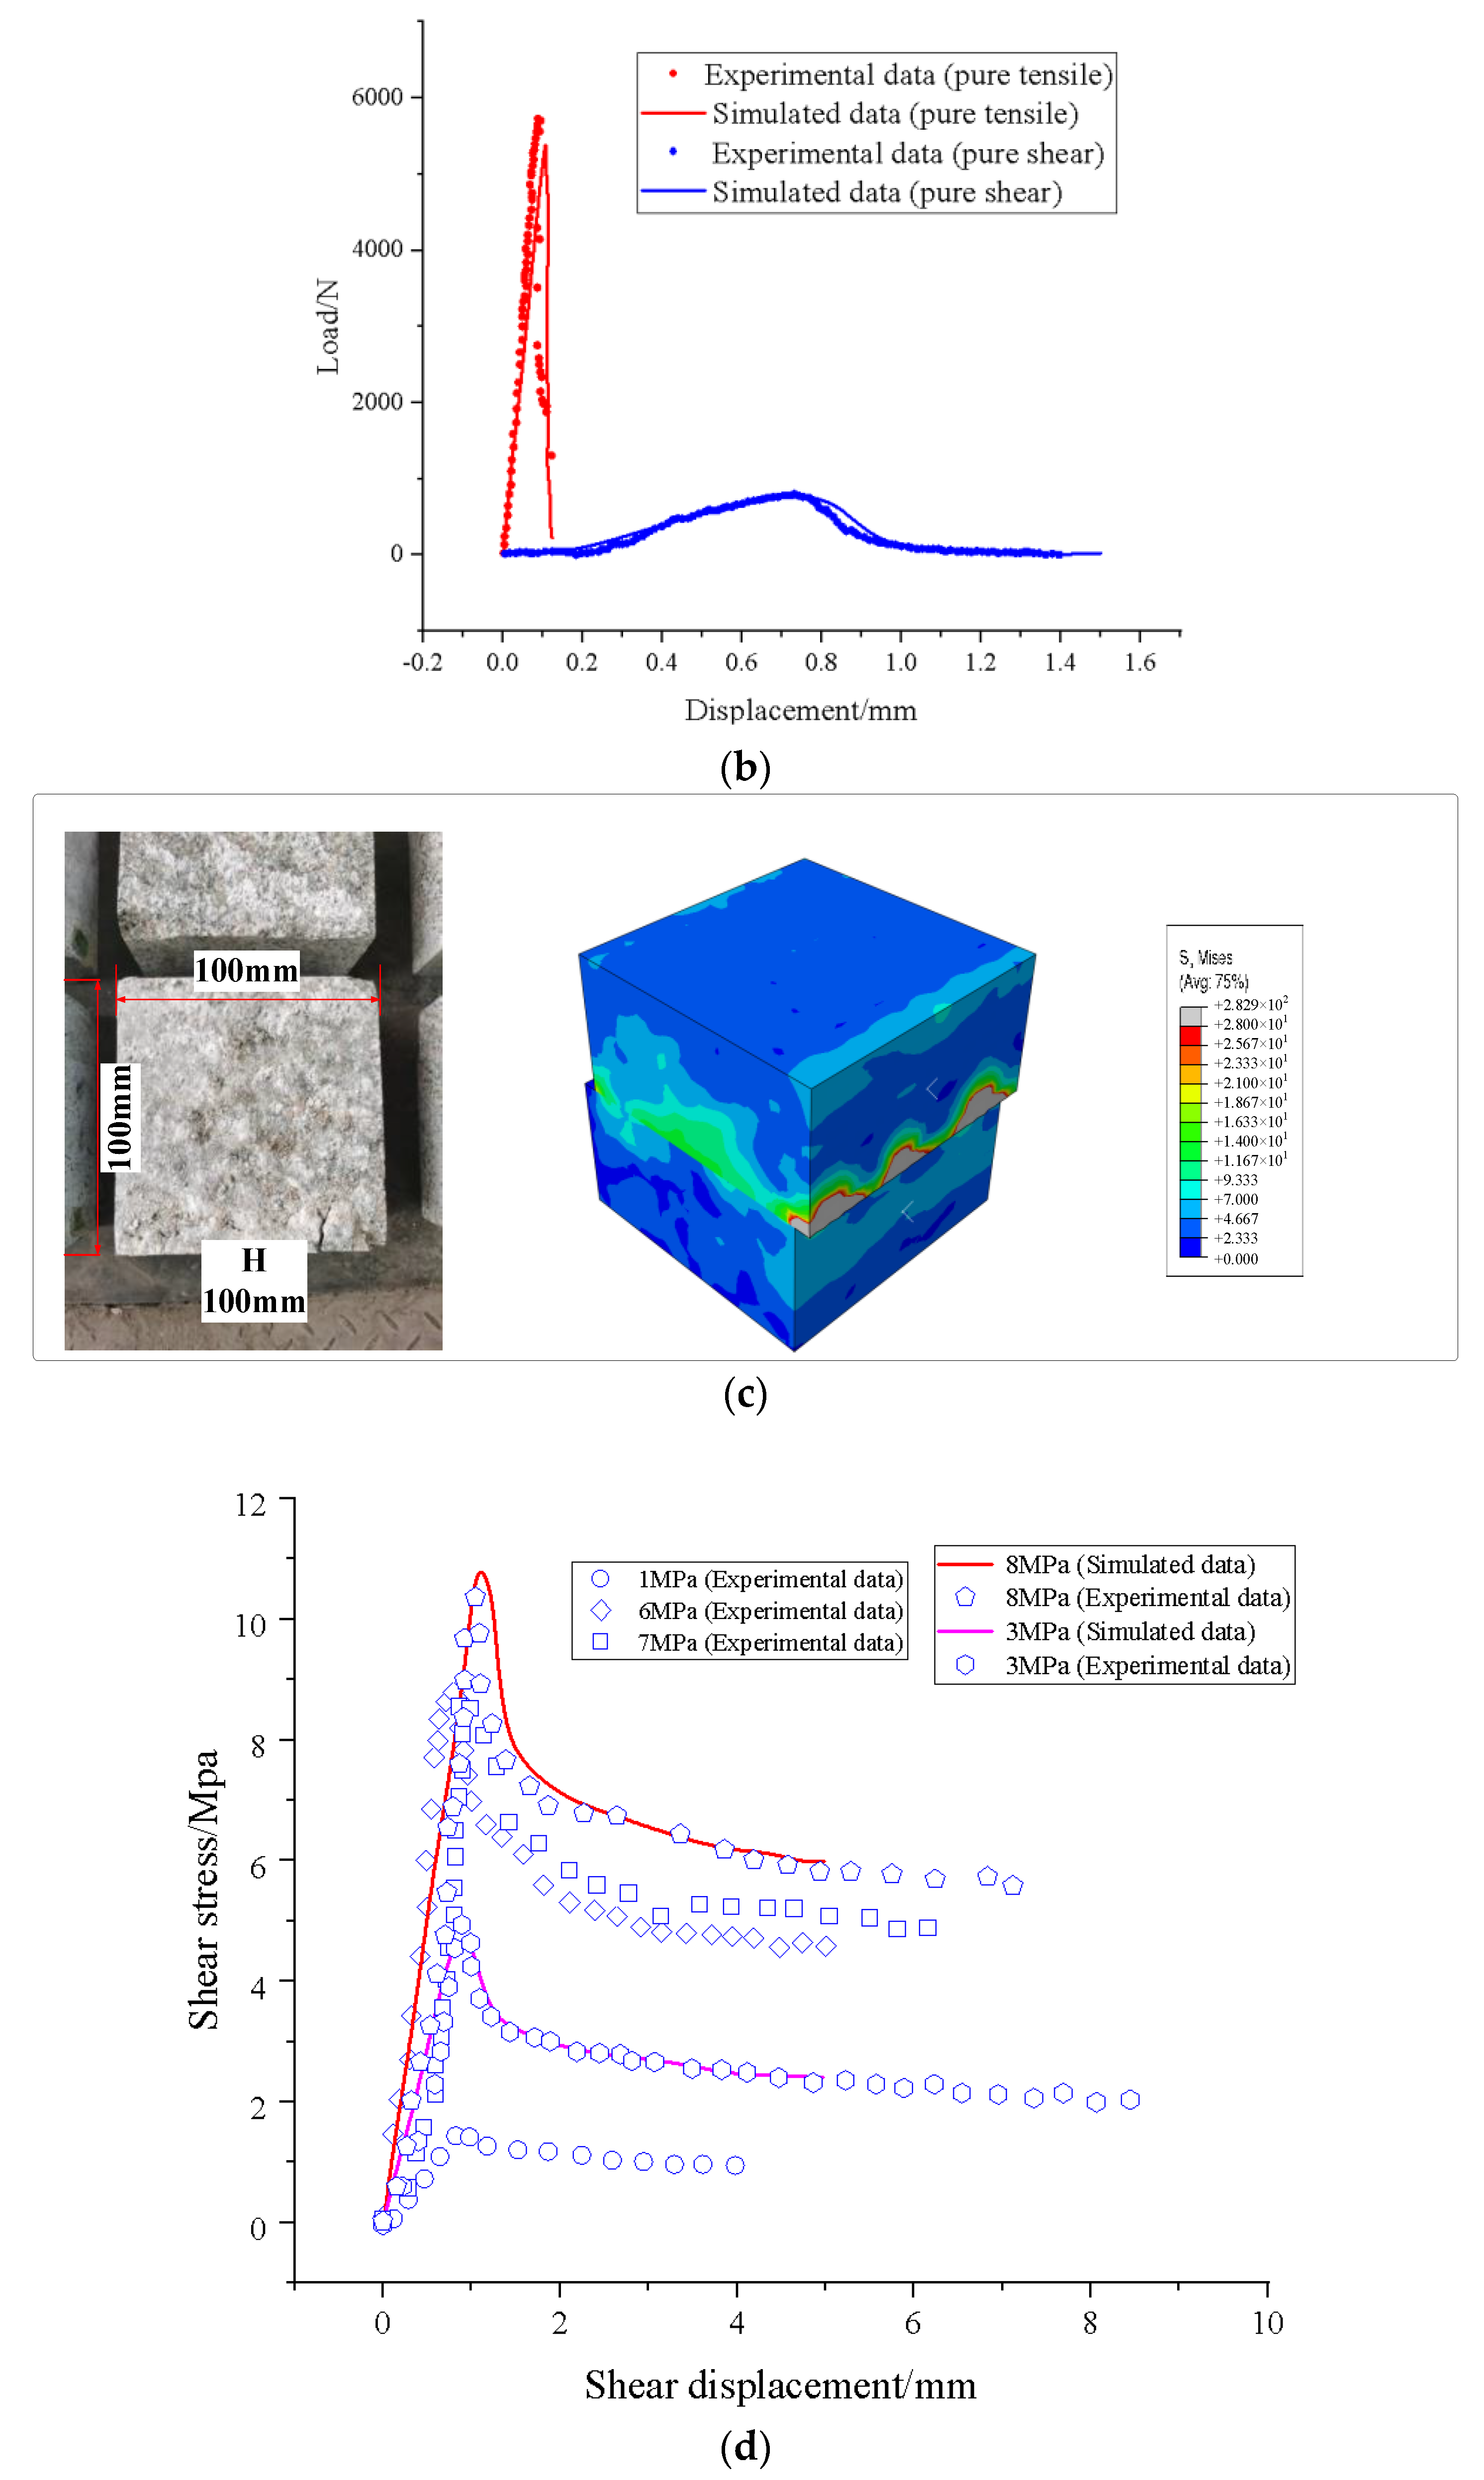
- The load–displacement curves of tension and shear obtained from the numerical simulations were highly consistent with the experimental results. Taking siltstone as an example, the peak loads obtained from experiments (simulations) were 785 (770 N) and 5720 (5688 N), with simulation errors of 3% and 0.5%. The peak displacements were 0.74 (0.77) mm and 0.09 (0.10) mm, respectively, with simulation errors of 4% and 11%. According to the above comparison, the applicability of the fracture constitutive equations was verified.
- (2)
- The mechanical parameters obtained from the experiments with σn =1, 6, and 7 MPa were substituted into the constitutive equations of penetrating cracks; the shear stress–displacement curves under σn = 3 and 8 MPa conditions were obtained. When σn was increased from 3 MPa to 8 MPa, the peak shear stresses of the structural plane obtained from the experiment (simulation) were 4.82 (4.77) MPa and 10.68 (10.94) MPa, and the peak displacements were 0.89 (0.93) mm and 1.01 (1.10) mm, respectively. The above data show that the simulation results are close to the experimental results, indicating the rationality of the constitutive model.
- (3)
- It should be noted that there is a nonlinear segment at the beginning of the curve obtained from the numerical simulation shown in Figure 2b. This is due to the fact that a 5 min linear loading phase was set up in the pre-displacement loading stage of the numerical model, and the loading rate was gradually increased from 0 to 0.002 mm/min to avoid the formation of shock loads.
4. Numerical Simulation Methods
4.1. FDEM Numerical Process
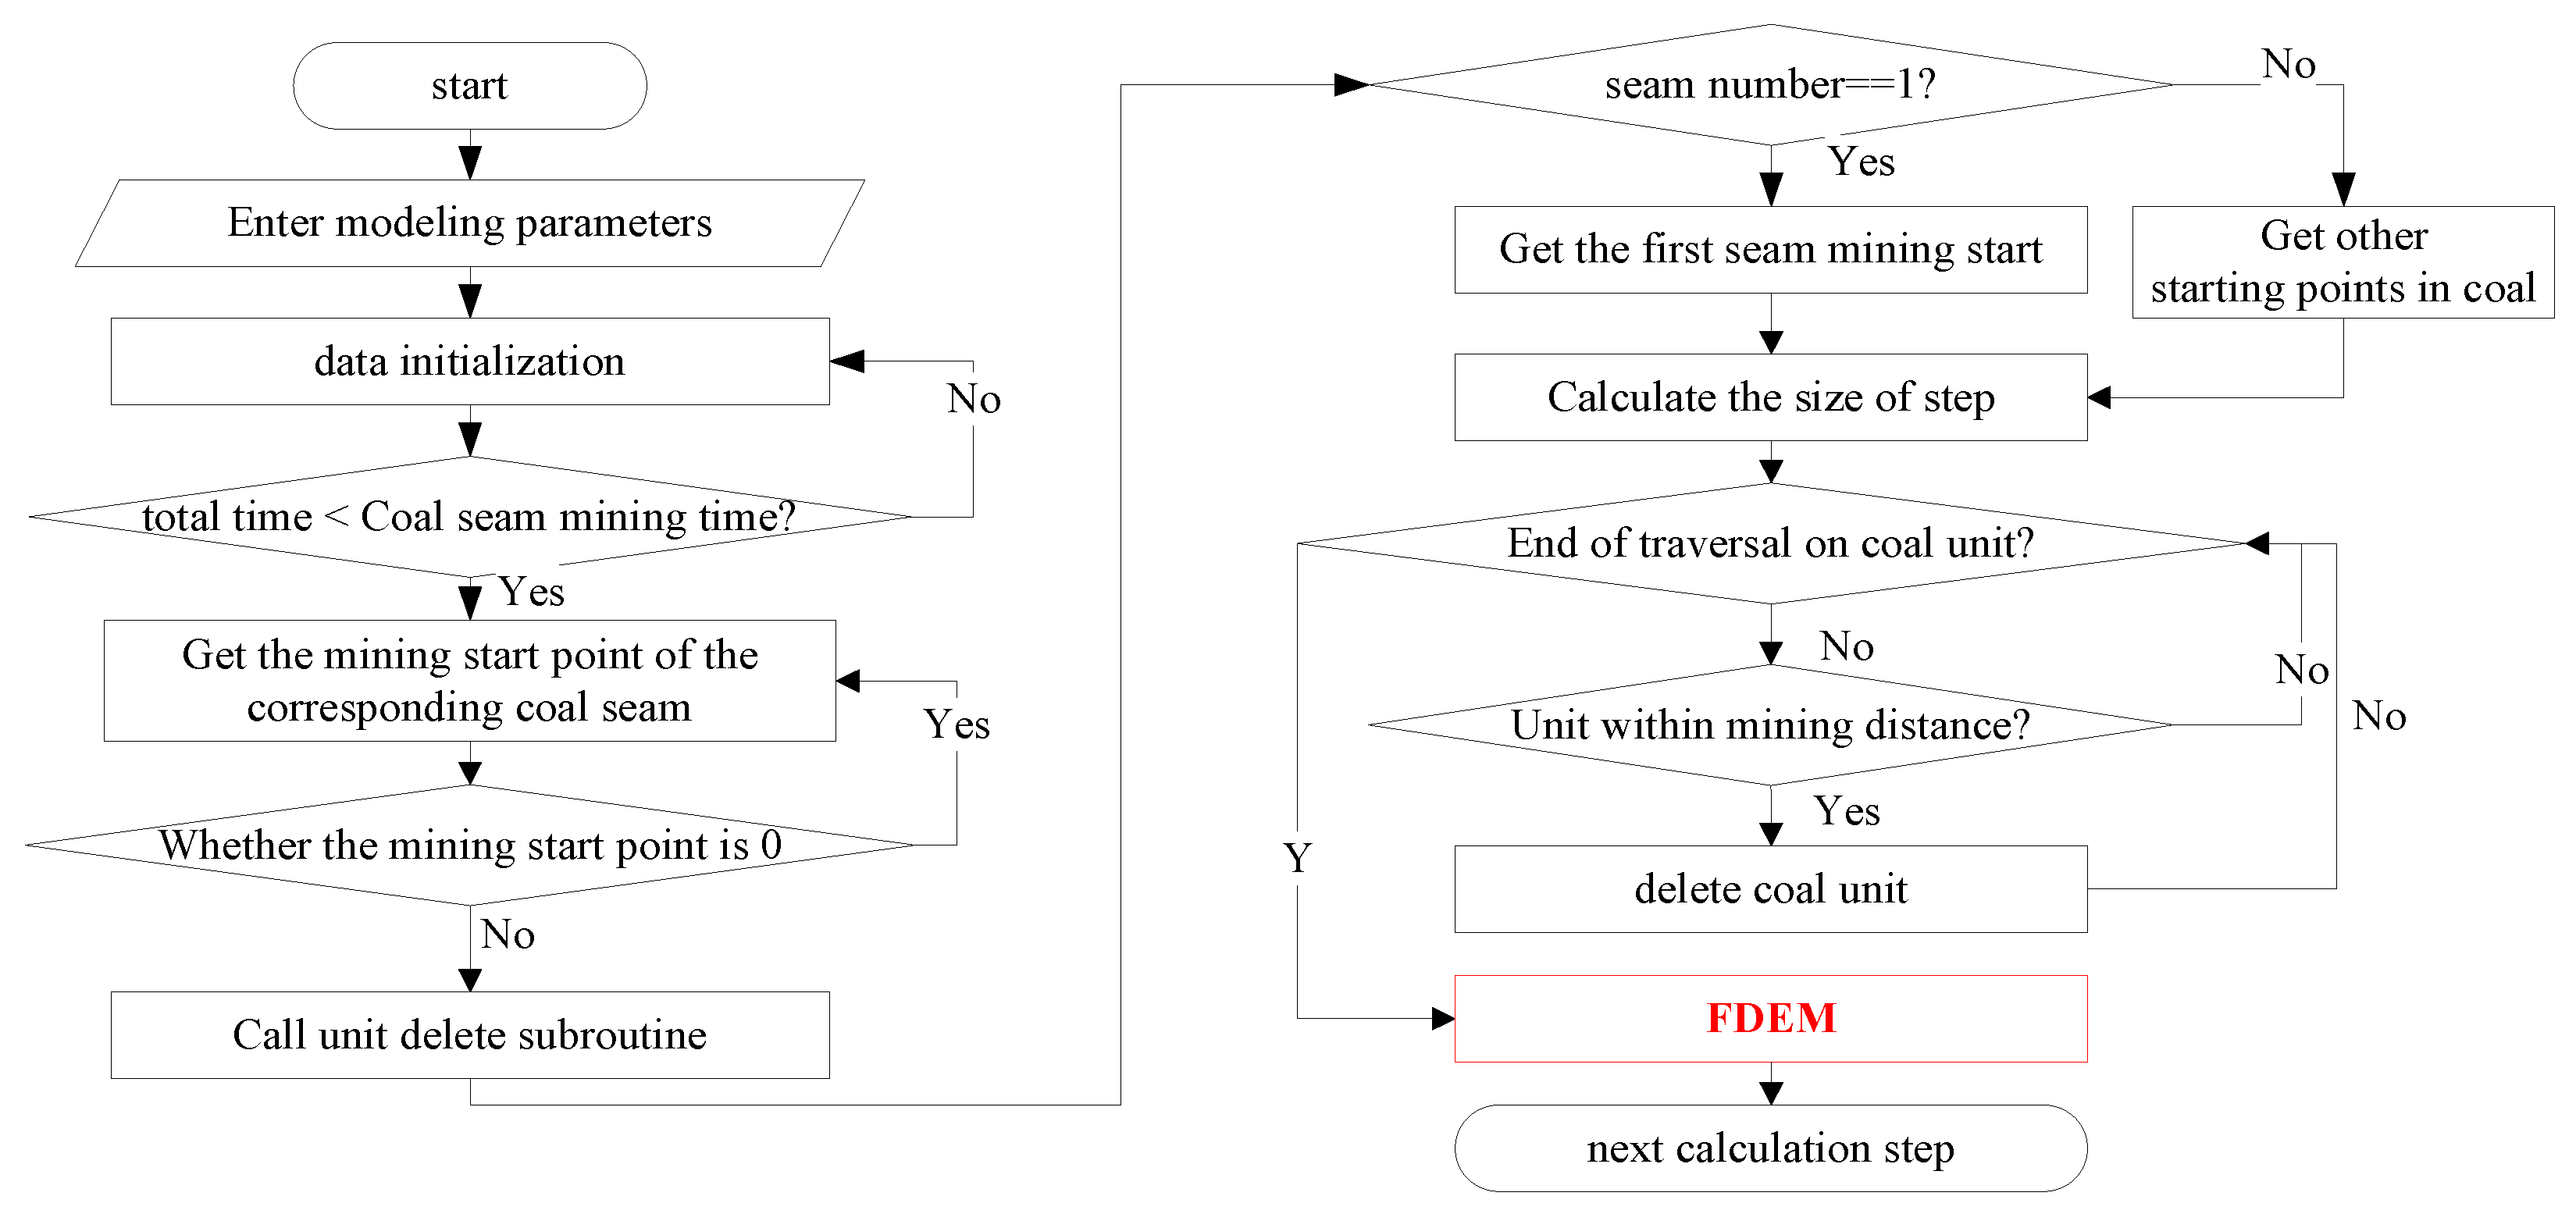
4.2. Numerical Subroutine for Continuous Coal Mining
- (a)
- The establishment of numerical calculation models according to engineering geological conditions.
- (b)
- The selection of the VUSDFLD subroutine as the interface. The unit data of the coal seam to be mined are extracted. If the advancing speed of the working face is speed m, according to the return parameters and the speed of the subroutine in the advancing distance formula, the advancing distance can be obtained, and the time–displacement relationship iswhere is the advancing distance, is the starting point of mining, is the total time of the return parameters, is the speed, is the number of the coal seam, and is the mining time corresponding to each coal seam.
5. Simulation of Development of Overlying Rock Rupture Zone across Double Fault
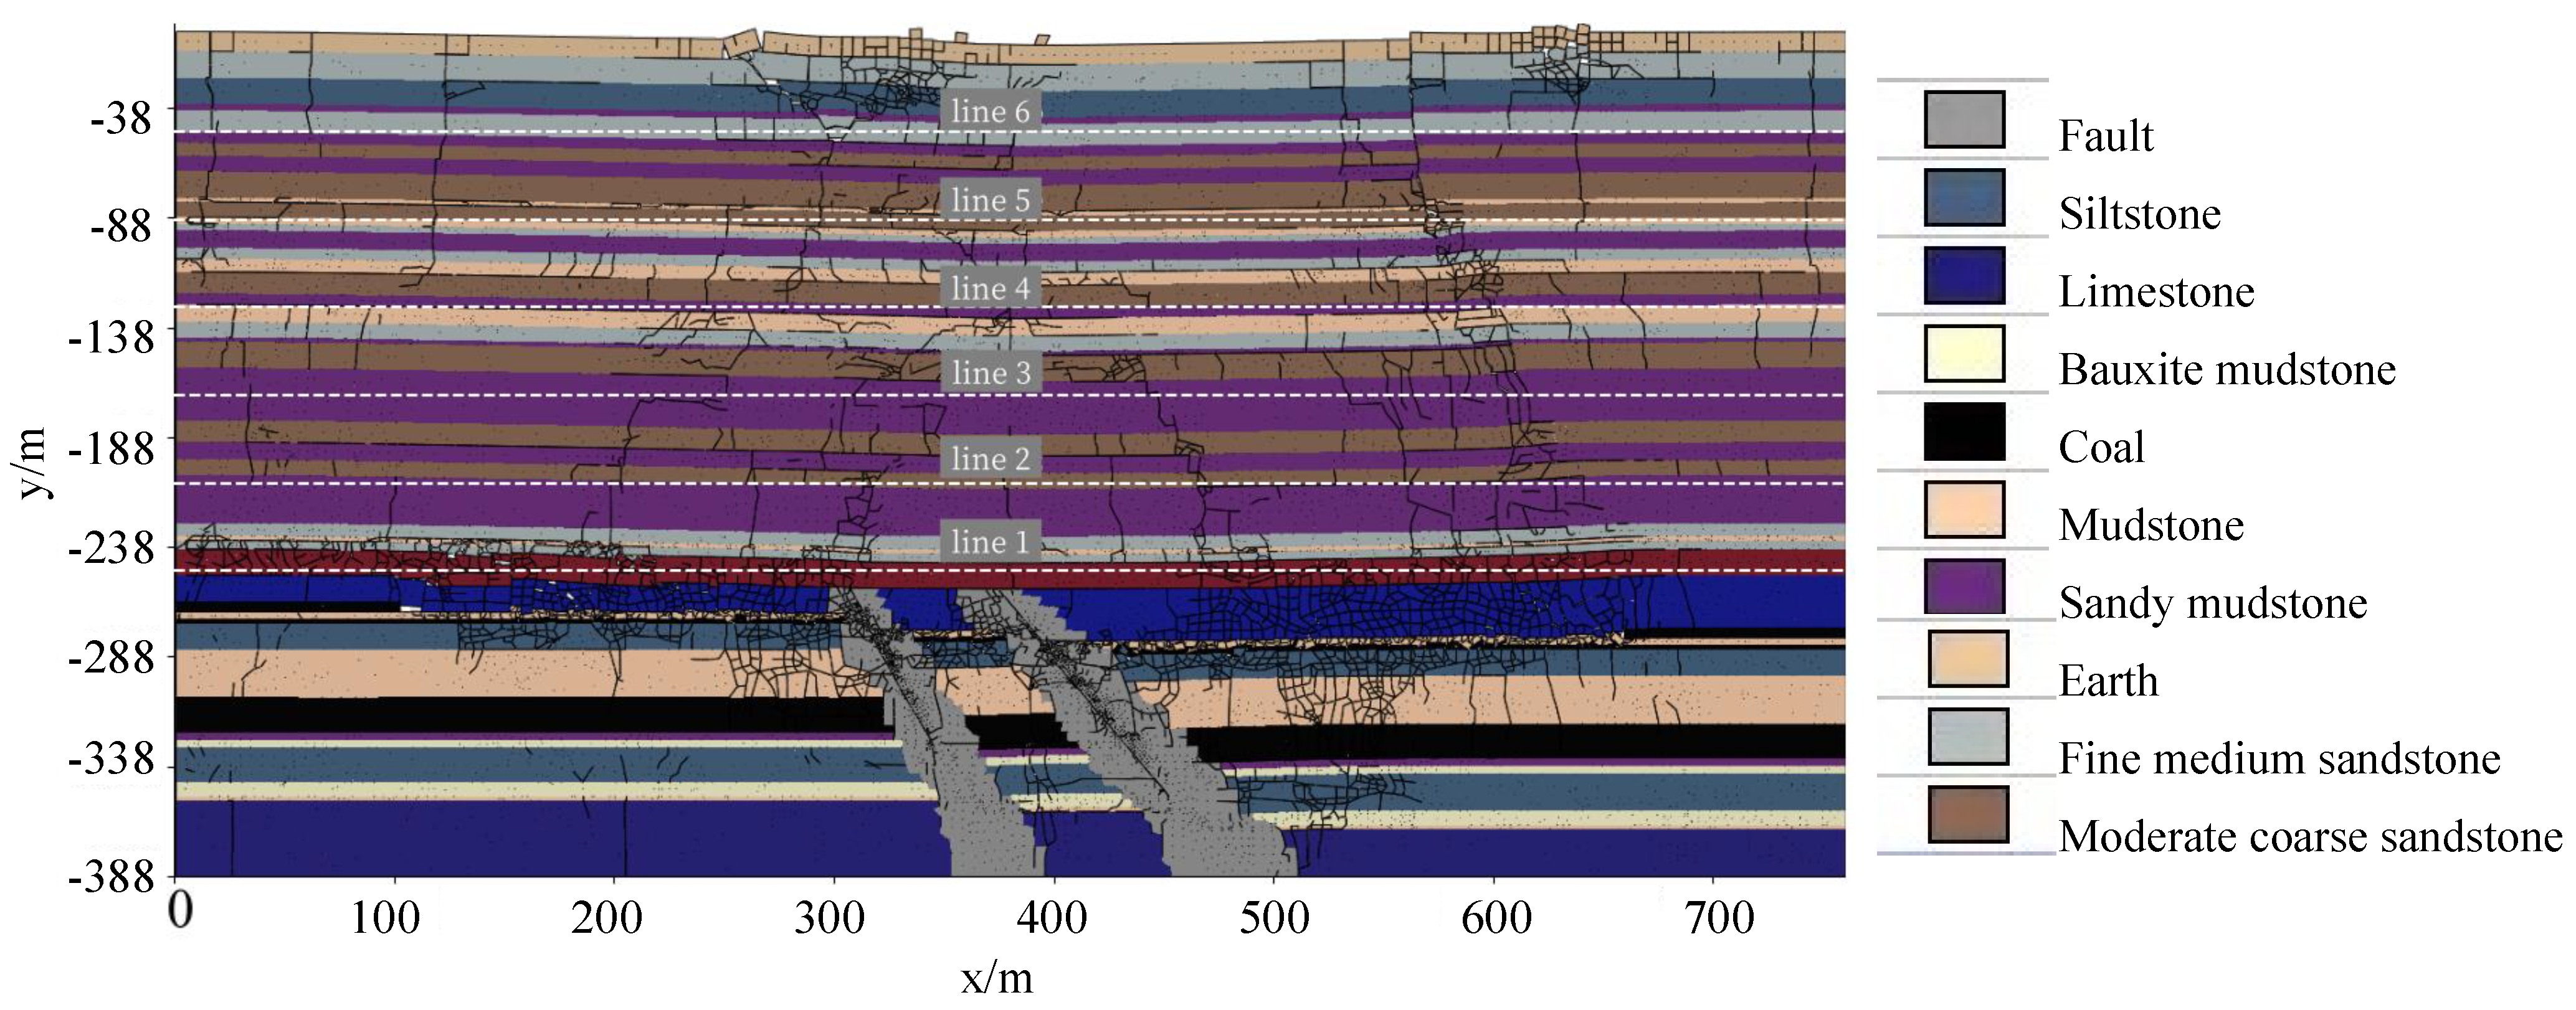
5.1. Study Area
5.2. Numerical Model
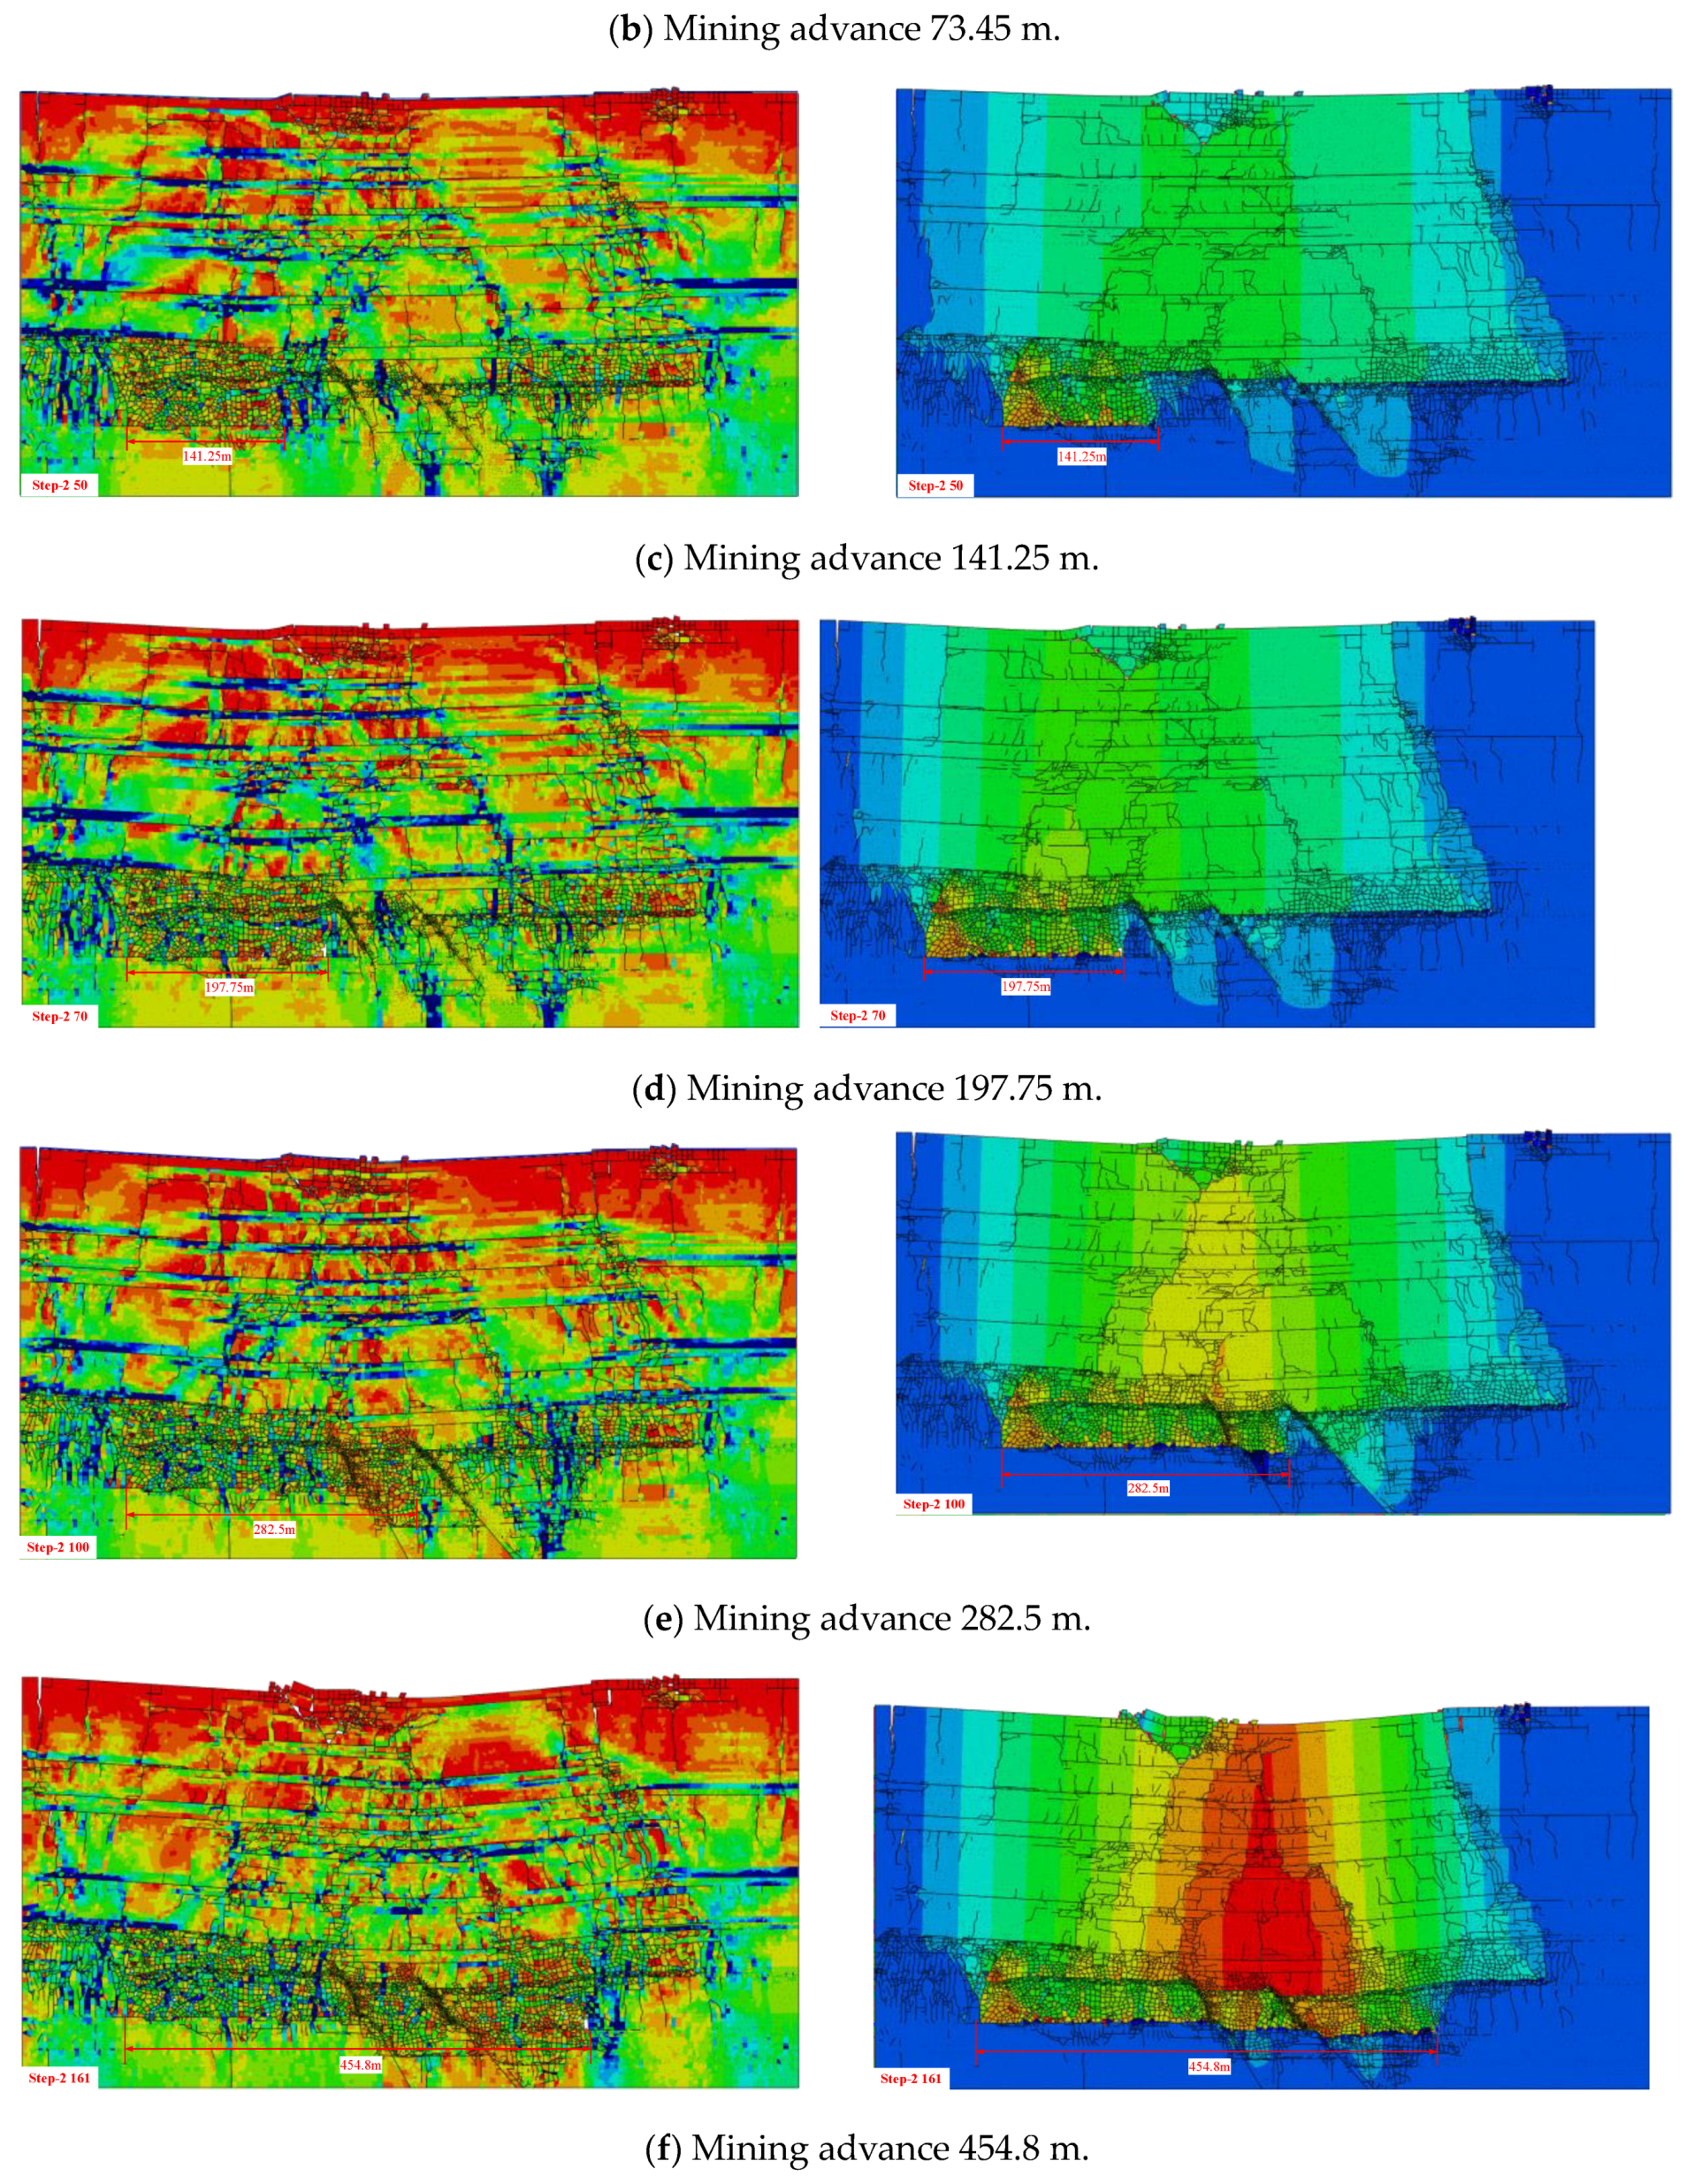
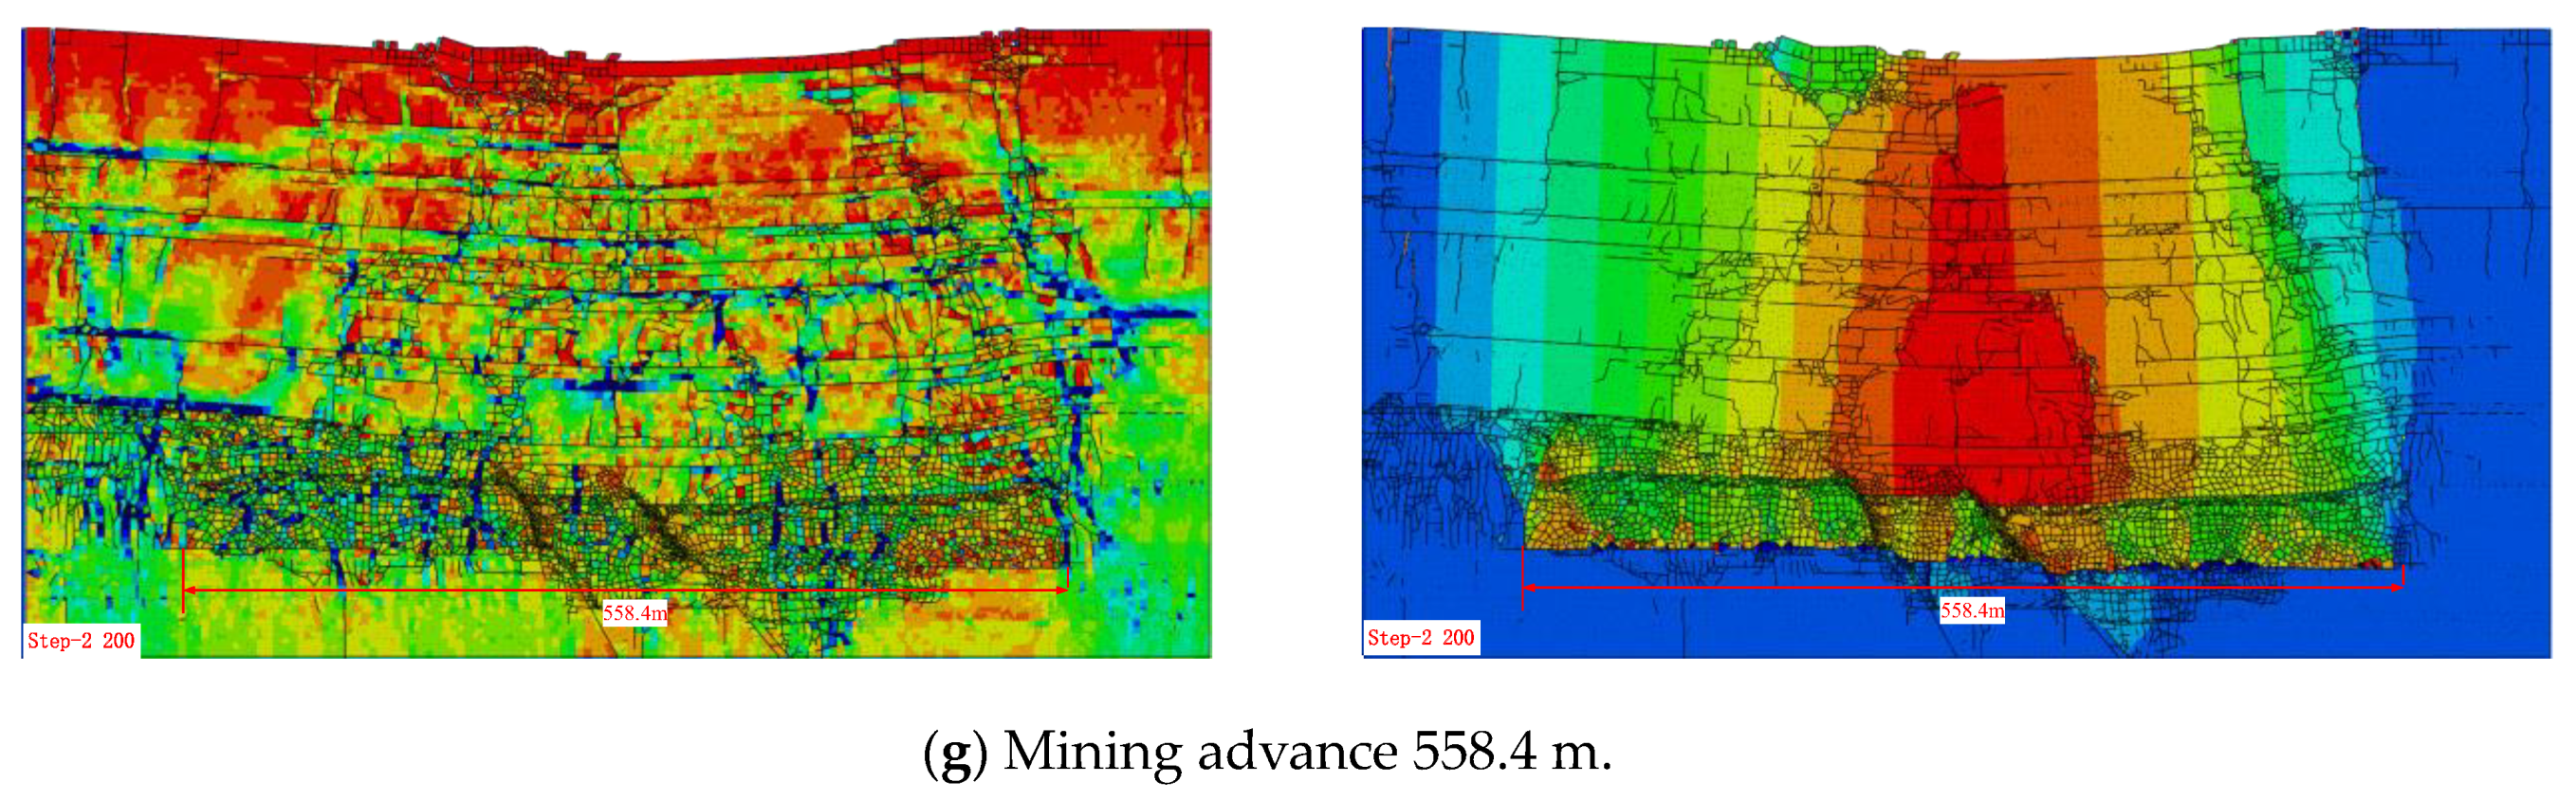
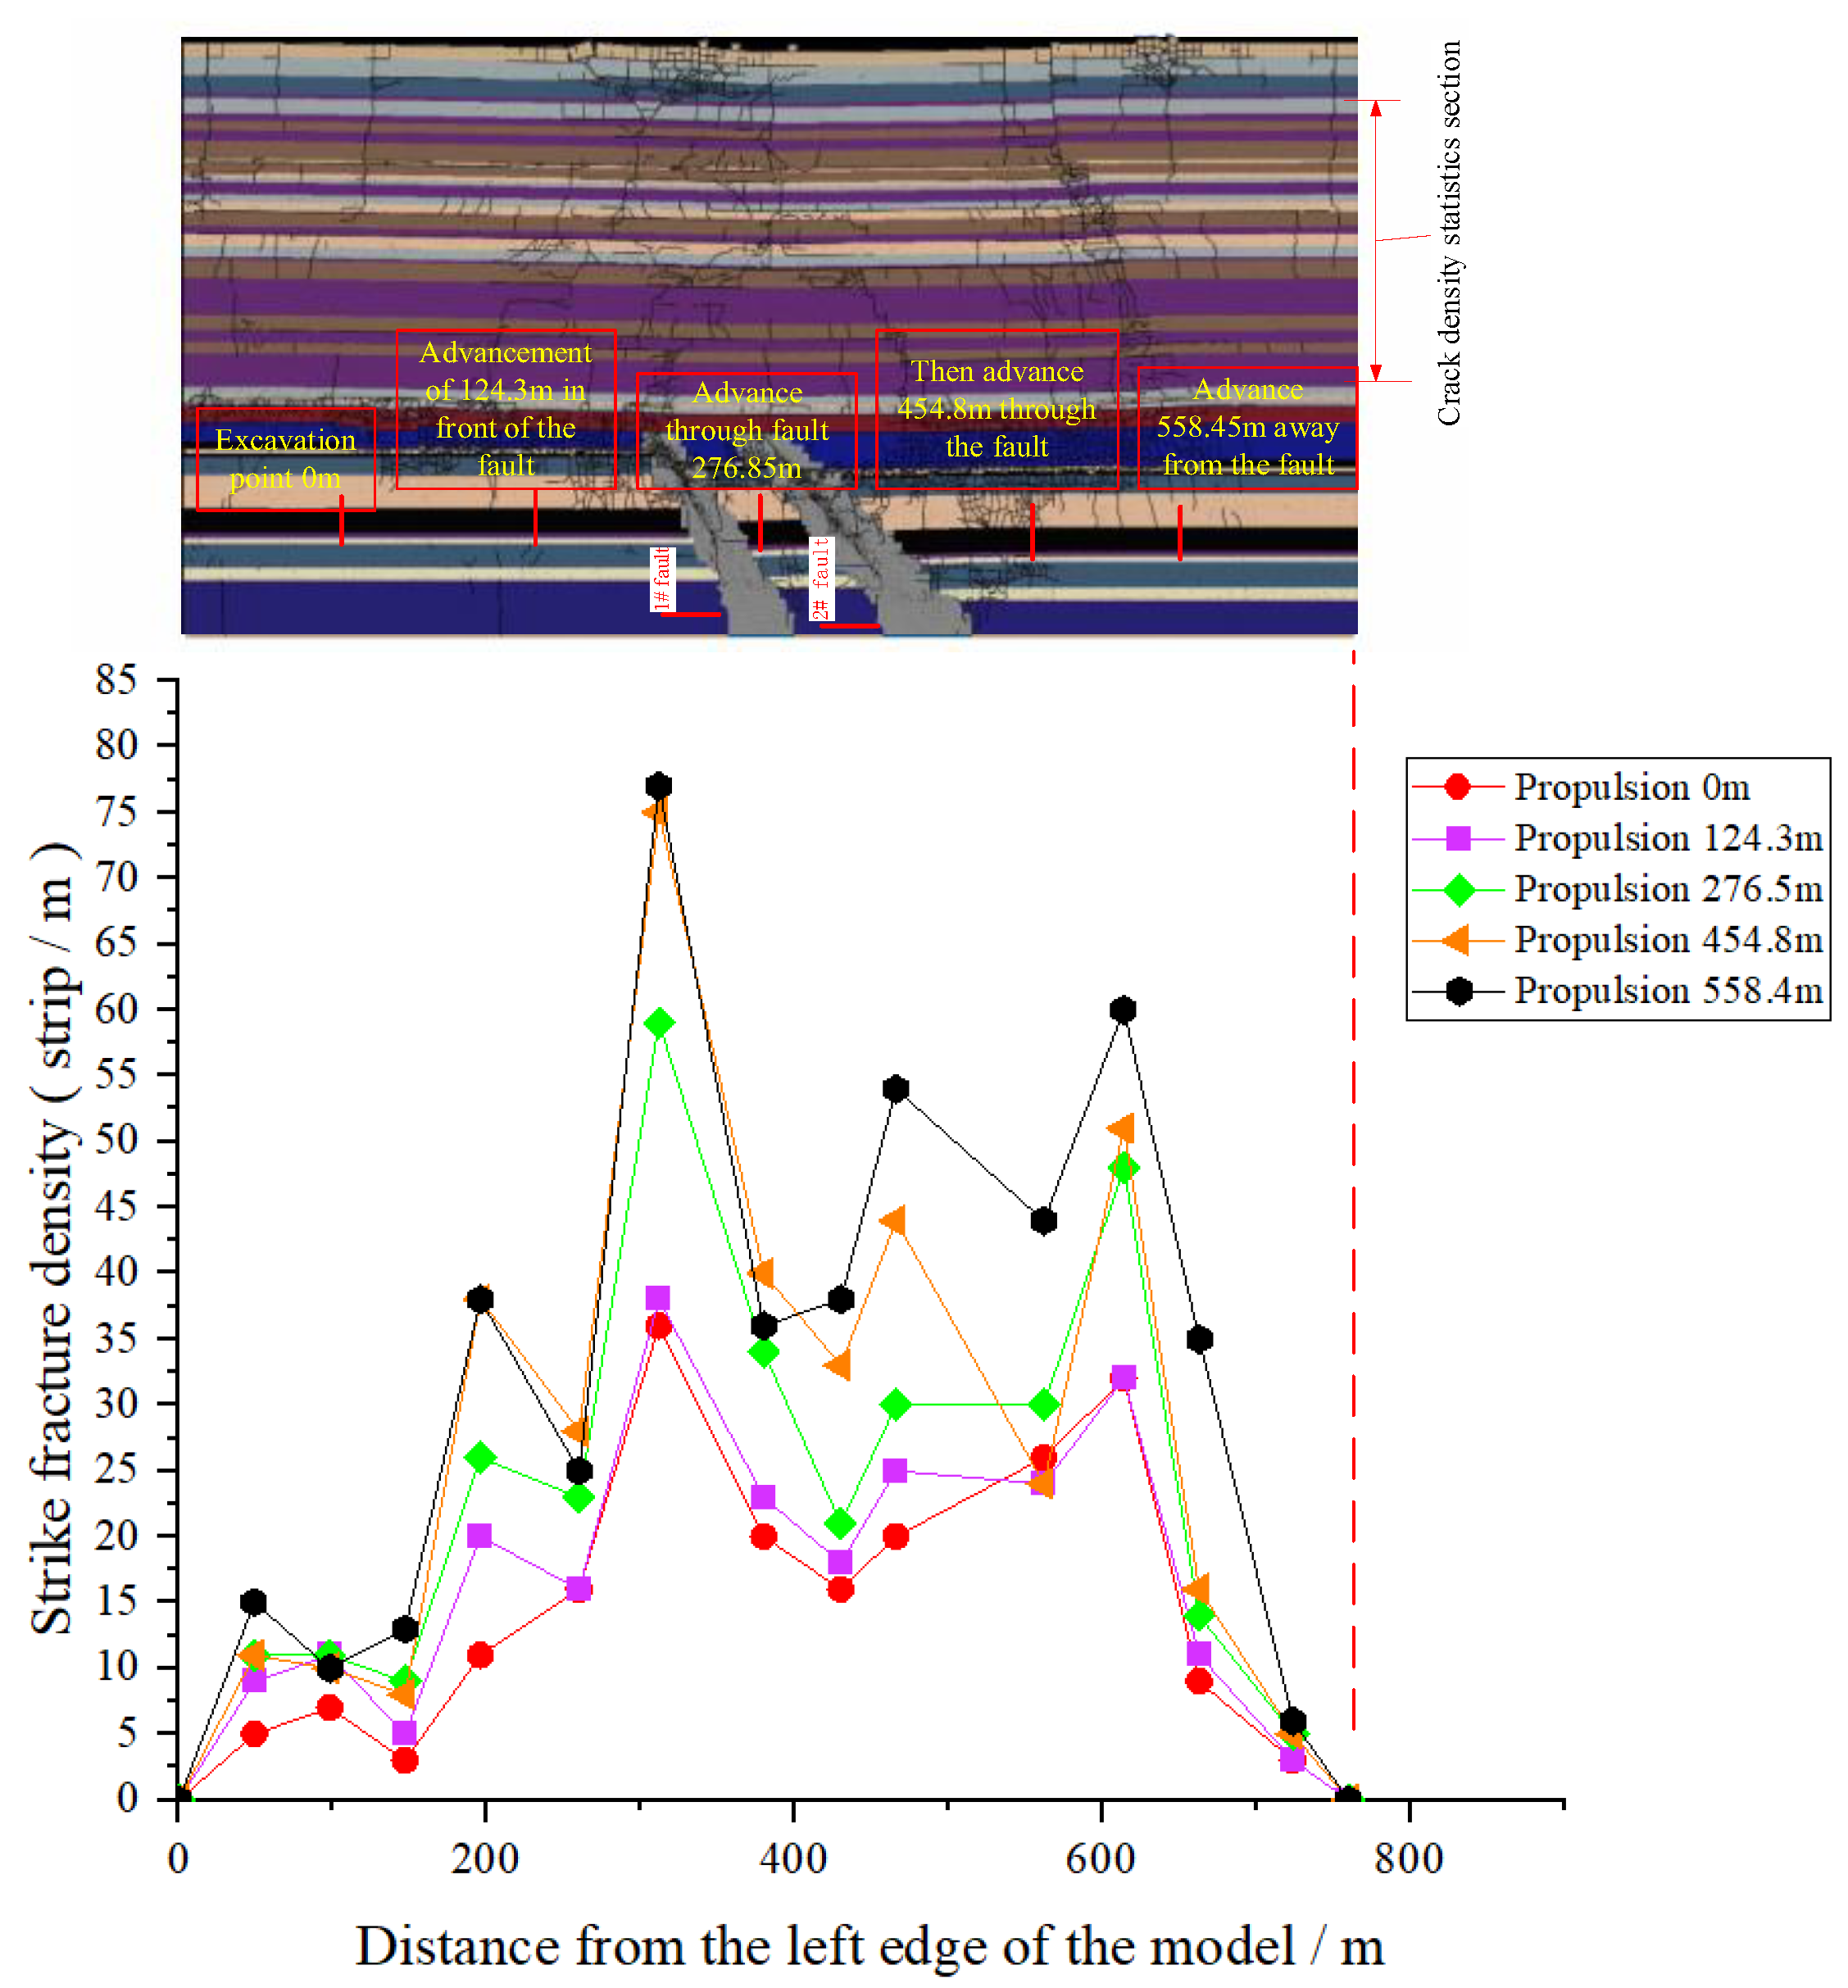
5.3. Simulation Results
5.4. In Situ Experiment
6. Discussion
7. Conclusions
- (1)
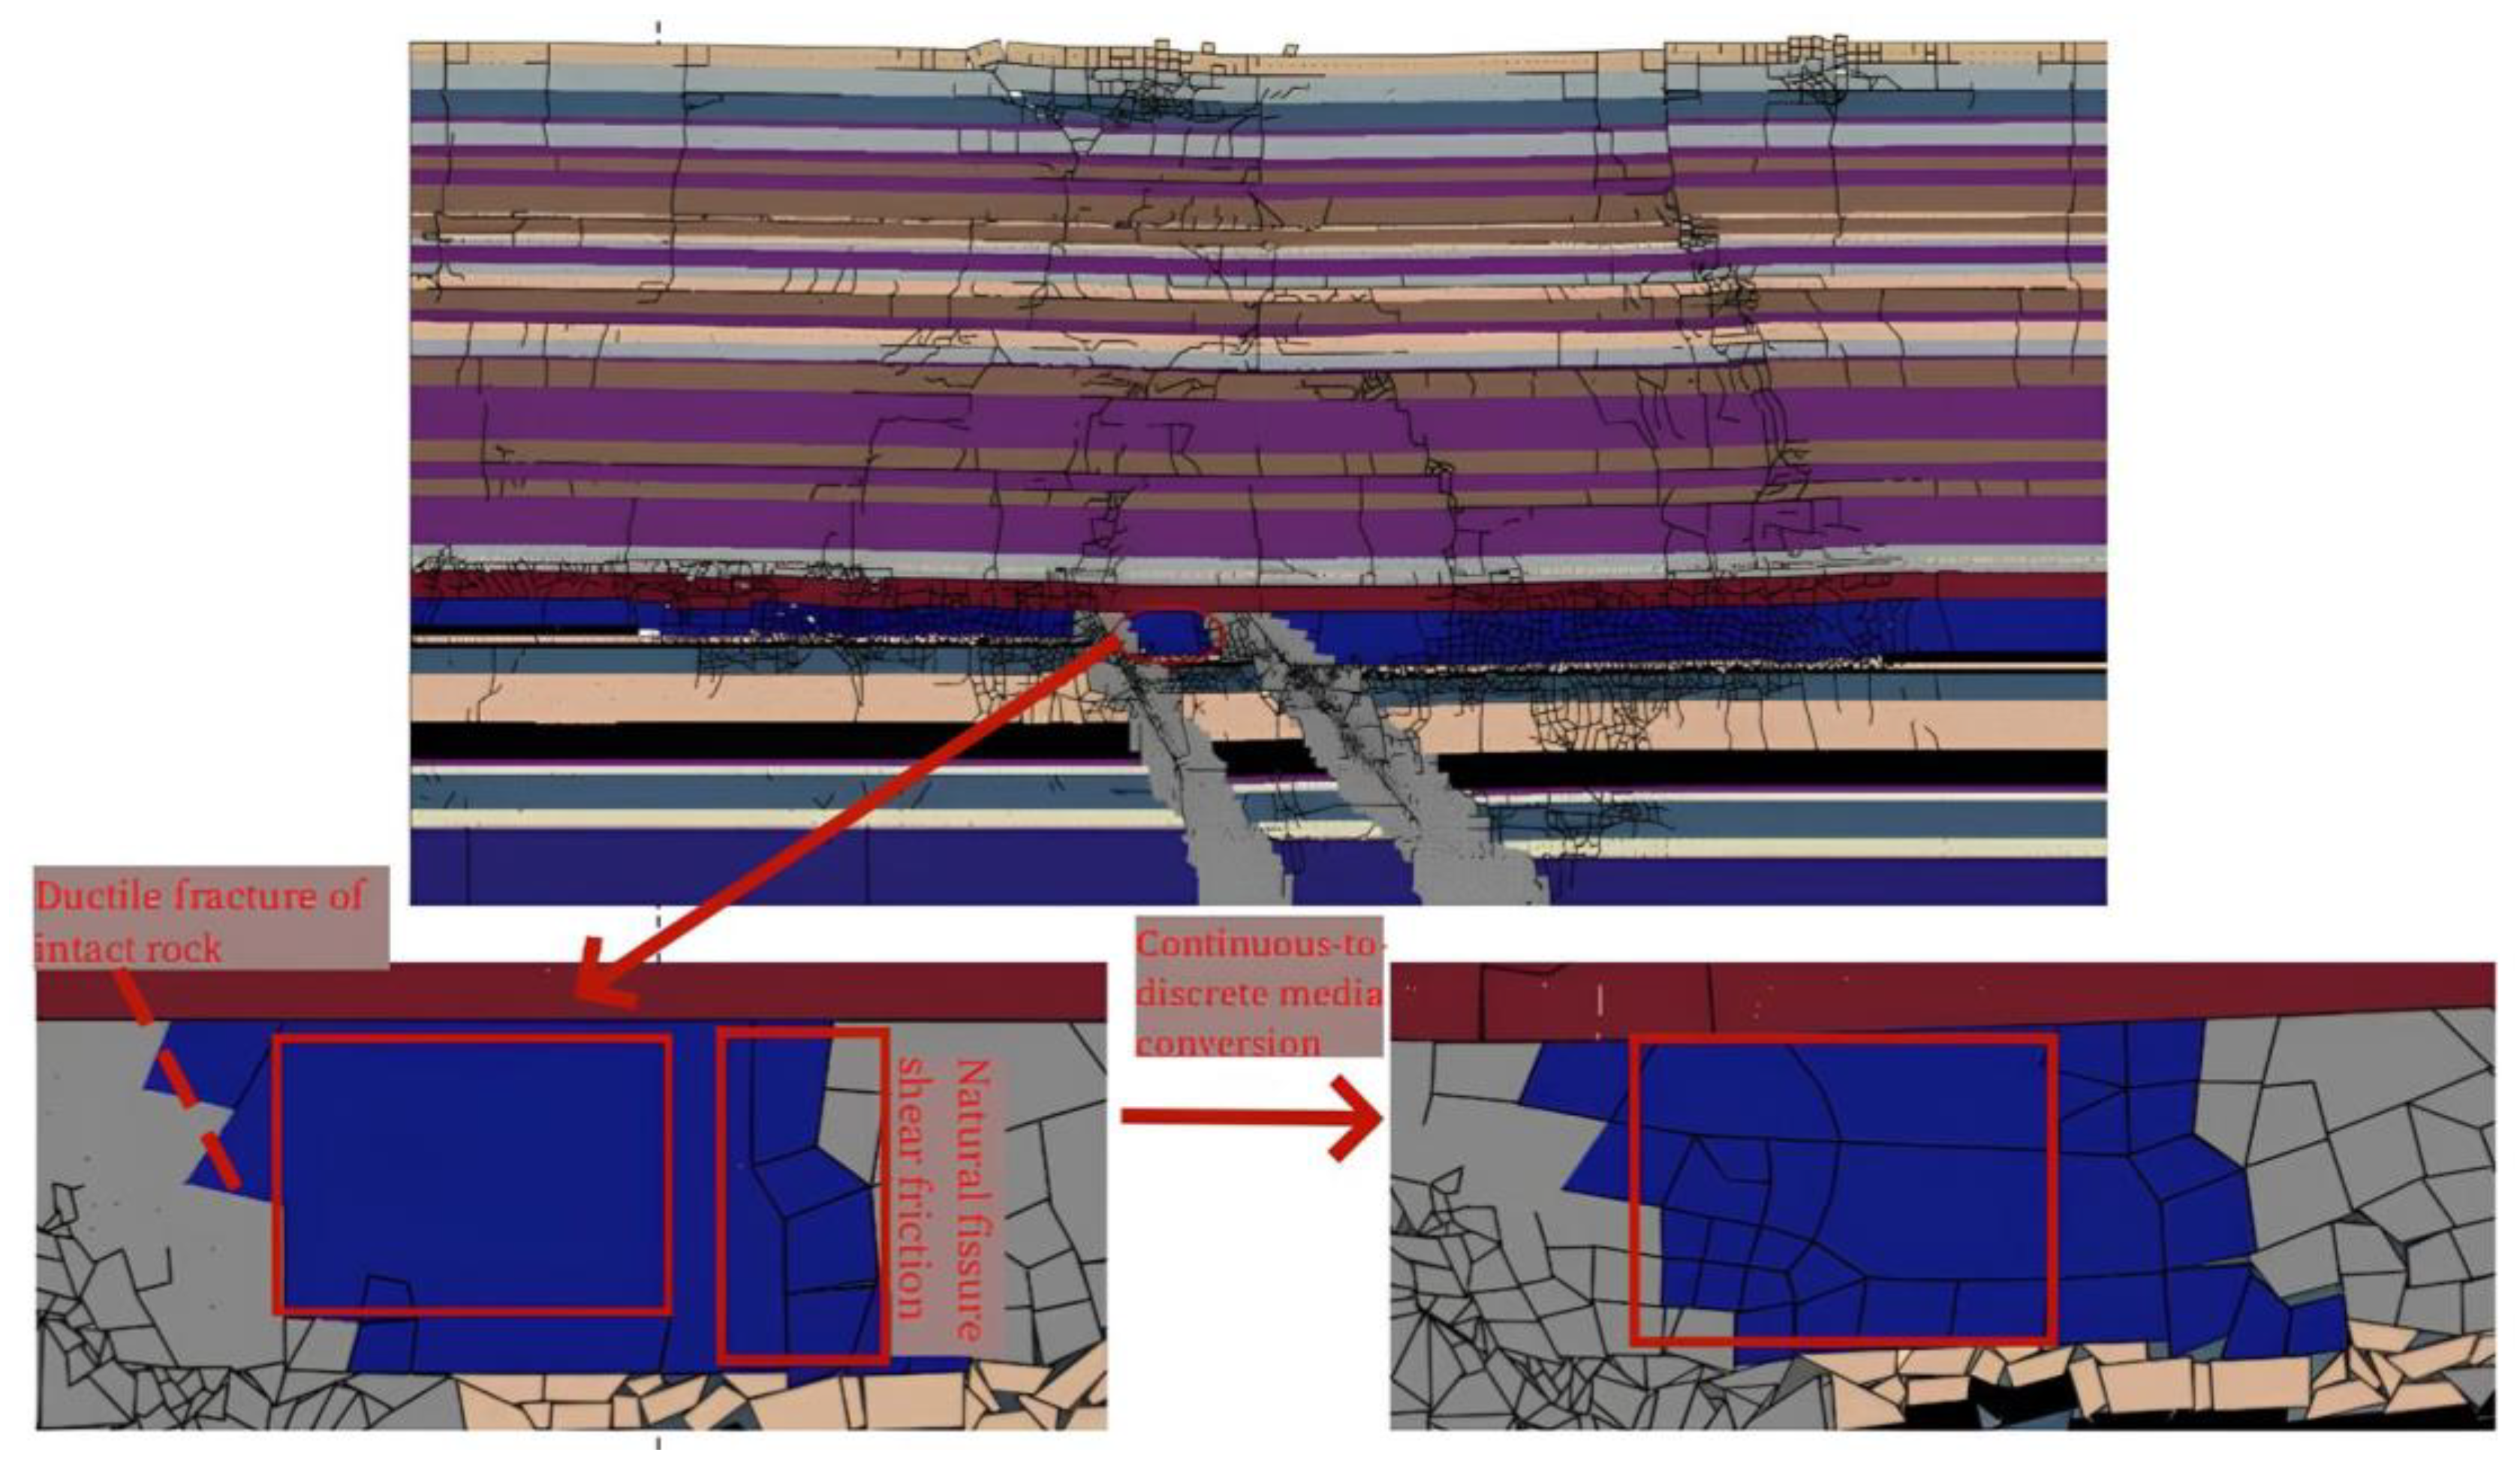
- With the established continuous rock deformation–discrete motion constitutive relation and the corresponding FDEM, the VUSDFLD multi-coal seam continuous mining algorithm subroutine was compiled to achieve the continuous mining of multiple coal seams and accurately reproduce the formation process of water-conducting fracture zones under the conditions of extra-thick coal seams crossing faults.
- (2)
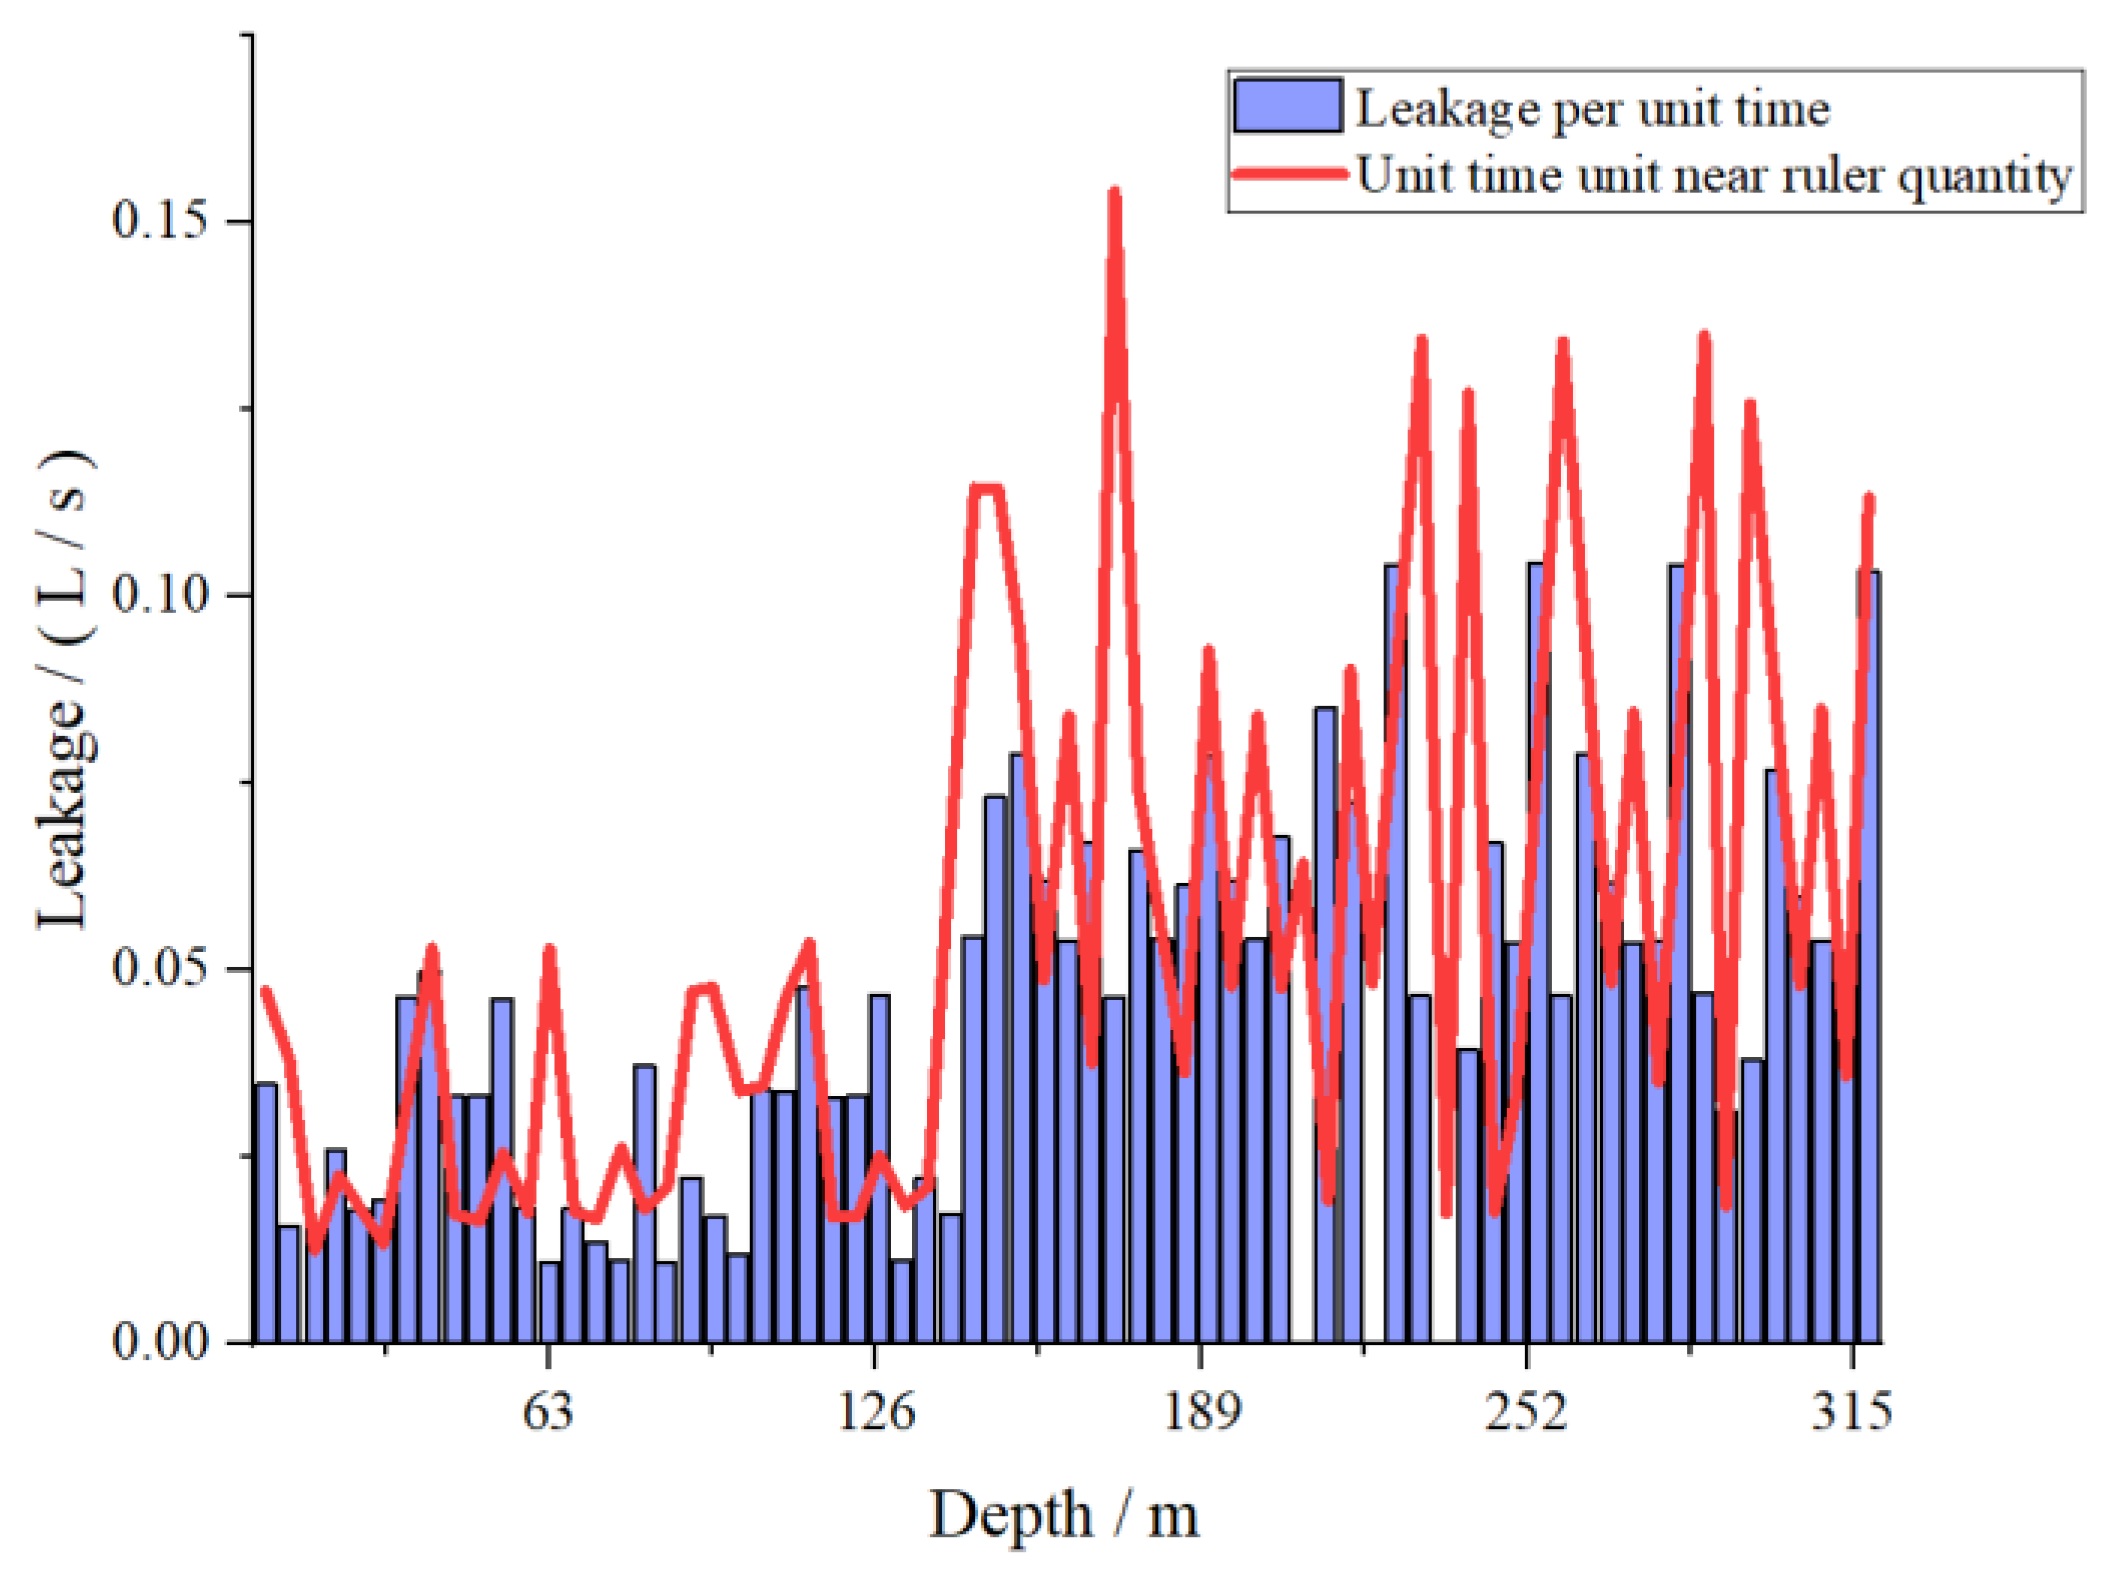
- Under simulation conditions, the height of the water-conducting cracks in the overlying rock layer caused by the continuous mining of extra-thick multiple coal seams was in the range of 216~226 m, and the fracture–mining ratio was 14.1, presenting a deviation from the in situ experimental results of borehole flushing fluid loss of 5%~10%.
- (3)
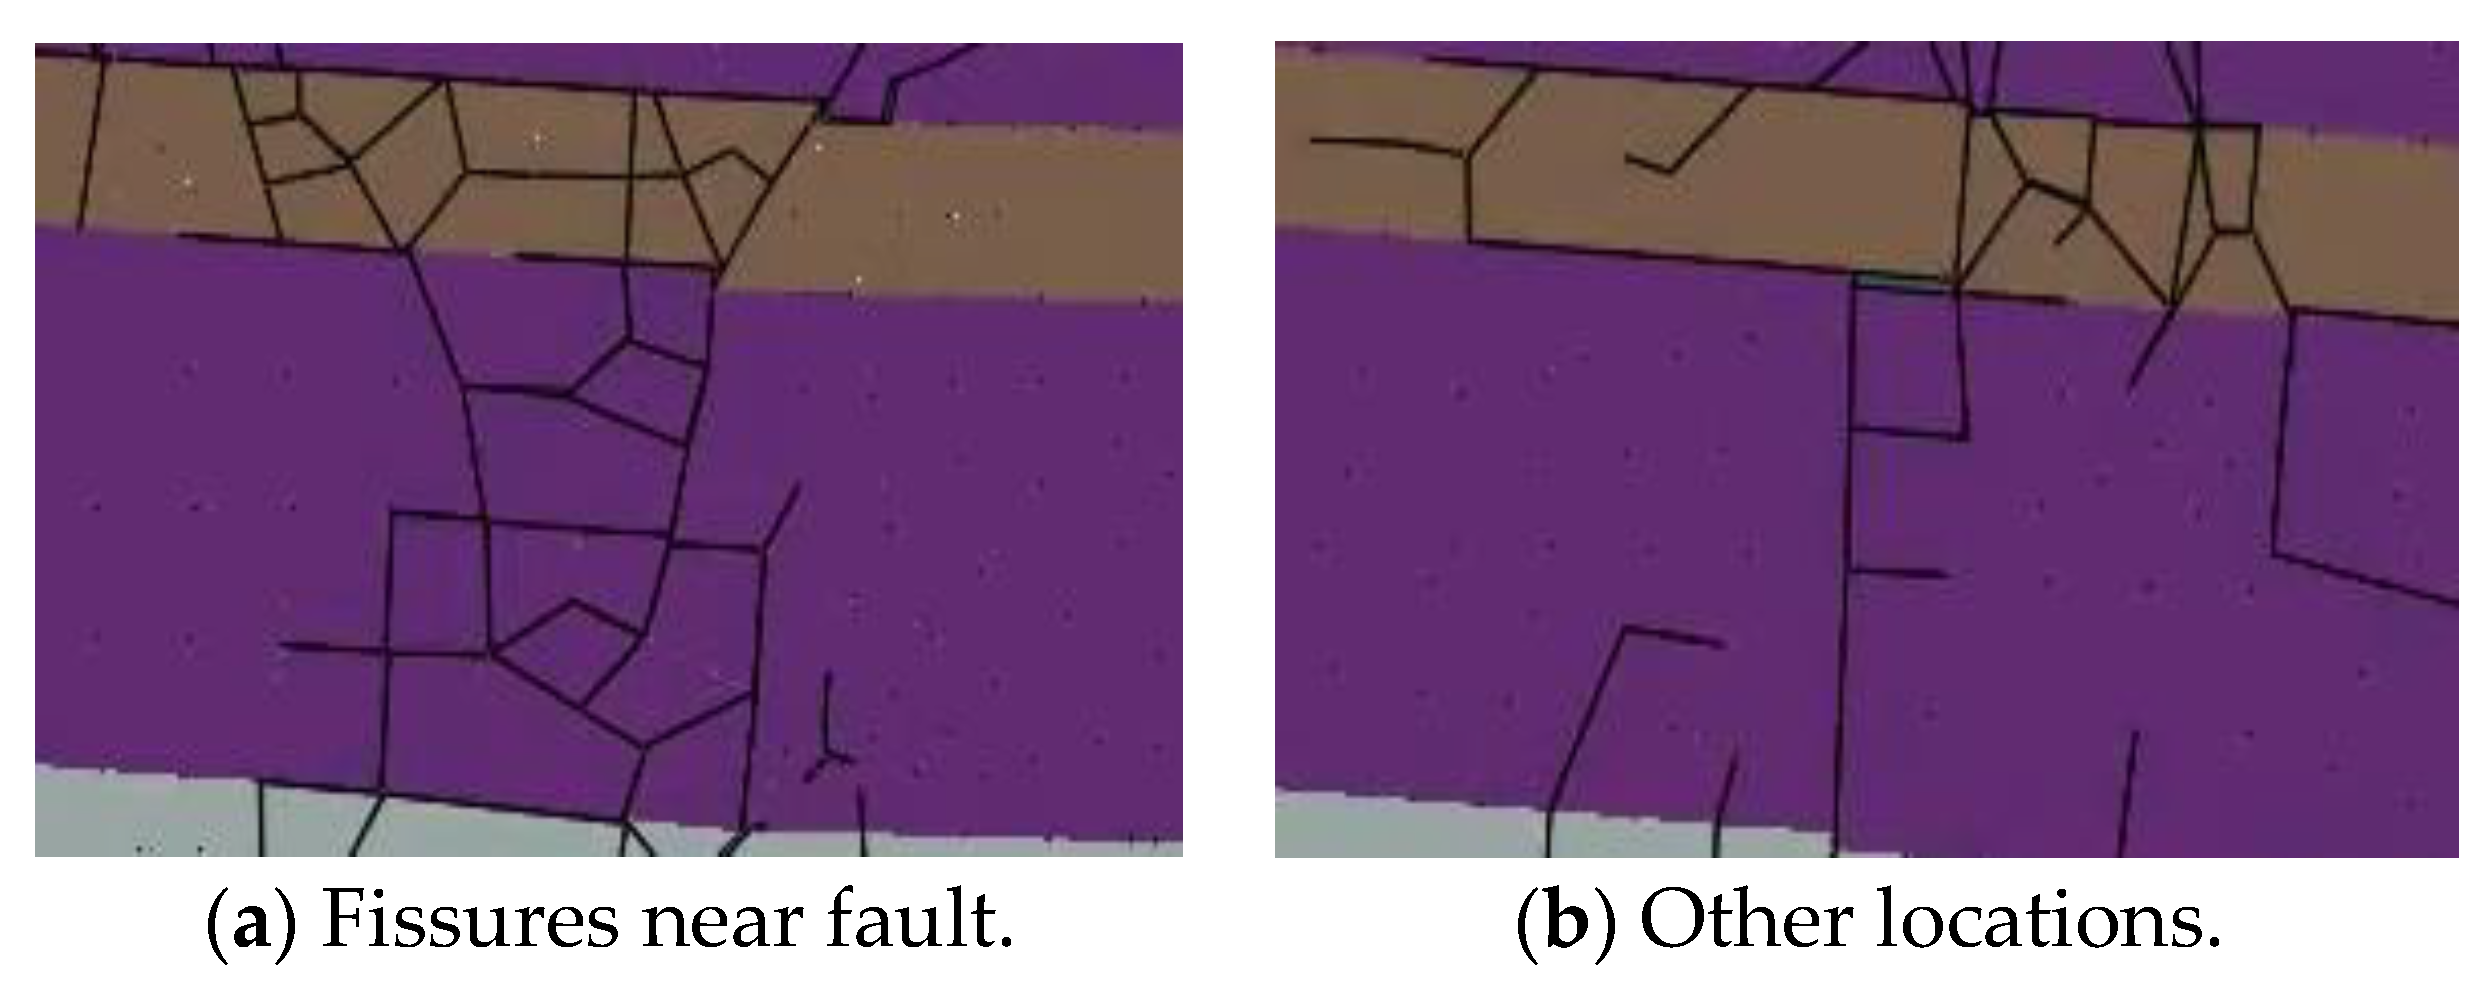
- Compared with non-structural locations, overlying rock strata in fault zones are subject to greater loads under the stress induced by extra-thick coal seam mining, resulting in a significant increase in the density and width of overlying rock cracks in the upper roof, exacerbating the risk of roof water inrush.
Author Contributions
Funding
Institutional Review Board Statement
Informed Consent Statement
Data Availability Statement
Acknowledgments
Conflicts of Interest
References
- Arkoç, O.; Ucar, S.; Ozcan, C. Assessment of impact of coal mining on ground and surface waters in Tozaklı coal field, Kırklareli, northeast of Thrace, Turkey. Environ. Earth Sci. 2016, 75, 514. [Google Scholar] [CrossRef]
- Zeng, Y.; Meng, S.; Wu, Q.; Mei, A.; Bu, W. Ecological water security impact of large coal base development and its protection. J. Hydrol. 2023, 619, 129319. [Google Scholar] [CrossRef]
- Lyv, Y.; Qiao, W.; Chen, W.; Cheng, X.; Liu, M.; Liu, Y. Quantifying the Impact of Coal Mining on Underground Water in Arid and Semi-Arid Area: A Case Study of the New Shanghai No. 1 Coal Mine, Ordos Basin, China. Water 2023, 15, 1765. [Google Scholar] [CrossRef]
- Kumi, S.; Addo-Fordjour, P.; Fei-Baffoe, B.; Adjapong, A.O.; Asamoah, F.B. Dynamic Influence of Mining-Induced Land Use Land Cover Changes on Avifauna Community over a mining landscape, Ghana. Trees For. People 2024, 15, 100515. [Google Scholar] [CrossRef]
- Liu, X.; Zhou, W.; Bai, Z. Vegetation coverage change and stability in large open-pit coal mine dumps in China during 1990–2015. Ecol. Eng. 2016, 95, 447–451. [Google Scholar] [CrossRef]
- ST, N.; Ahmed, M. Inhabitant Perception on the Effects of Artisan Mining on Rangelands in Gedarif State (Eastern Sudan). 2024. Available online: https://papers.ssrn.com/sol3/papers.cfm?abstract_id=4746231 (accessed on 2 June 2024).
- Liu, Y.; Liu, Q.-m.; Li, W.-p.; Li, T.; He, J.-h. Height of water-conducting fractured zone in coal mining in the soil–rock composite structure overburdens. Environ. Earth Sci. 2019, 78, 242. [Google Scholar] [CrossRef]
- Zhang, P.-D.; Wu, Y.-J.; Cao, Z.-Z.; Li, Z.-H.; Du, F.; Wang, W.-Q.; Zhai, M.-L. Study on overburden failure characteristics and displacement rule under the influence of deep faults. Front. Earth Sci. 2024, 12, 1388612. [Google Scholar] [CrossRef]
- Moriya, H.; Naoi, M.; Nakatani, M.; van Aswegen, G.; Murakami, O.; Kgarume, T.; Ward, A.K.; Durrheim, R.J.; Philipp, J.; Yabe, Y. Delineation of large localized damage structures forming ahead of an active mining front by using advanced acoustic emission mapping techniques. Int. J. Rock Mech. Min. Sci. 2015, 79, 157–165. [Google Scholar] [CrossRef]
- Chi, M.; Zhang, D.; Honglin, L.; Hongzhi, W.; Yazhou, Z.; Shuai, Z.; Wei, Y.; Shuaishuai, L.; Qiang, Z. Simulation analysis of water resource damage feature and development degree of mining-induced fracture at ecologically fragile mining area. Environ. Earth Sci. 2019, 78, 88. [Google Scholar] [CrossRef]
- Zhao, B.; He, S.; Bai, K.; Lu, X.; Wang, W. Elastic wave prospecting of water-conducting fractured zones in coal mining. Sci. Rep. 2024, 14, 7036. [Google Scholar] [CrossRef]
- Yang, K. Study on the Evolving Characteristics and the Dynamic Affecting of Surrounding Rock Macro Stress Shell and Mining Induced Fracture. Master’s Thesis, AnHui University of Science and Technology, Huainan, China, 2007. [Google Scholar]
- Islam, M.R.; Hayashi, D.; Kamruzzaman, A. Finite element modeling of stress distributions and problems for multi-slice longwall mining in Bangladesh, with special reference to the Barapukuria coal mine. Int. J. Coal Geol. 2009, 78, 91–109. [Google Scholar] [CrossRef]
- Adhikary, D.; Guo, H. Modelling of longwall mining-induced strata permeability change. Rock Mech. Rock Eng. 2015, 48, 345–359. [Google Scholar] [CrossRef]
- Wang, W.; Sui, W.; Faybishenko, B.; Stringfellow, W. Permeability variations within mining-induced fractured rock mass and its influence on groundwater inrush. Environ. Earth Sci. 2016, 75, 326. [Google Scholar] [CrossRef]
- Shabanimashcool, M.; Li, C.C. Numerical modelling of longwall mining and stability analysis of the gates in a coal mine. Int. J. Rock Mech. Min. Sci. 2012, 51, 24–34. [Google Scholar] [CrossRef]
- Suchowerska, A.; Merifield, R.S.; Carter, J.P. Vertical stress changes in multi-seam mining under supercritical longwall panels. Int. J. Rock Mech. Min. Sci. 2013, 61, 306–320. [Google Scholar] [CrossRef]
- Vu, T.T. Solutions to prevent face spall and roof falling in fully mechanized longwall at underground mines, Vietnam. Min. Miner. Depos. 2022, 16, 127–134. [Google Scholar] [CrossRef]
- Rak, Z.; Stasica, J.; Burtan, Z.; Chlebowski, D. Technical aspects of mining rate improvement in steeply inclined coal seams: A case study. Resources 2020, 9, 138. [Google Scholar] [CrossRef]
- Zhang, Y.; Li, F. Monitoring analysis of fissure development evolution and height of overburden failure of high tension fully-mechanized caving mining. Chin. J. Rock Mech. Eng. 2011, 30, 2995–3001. [Google Scholar]
- Liu, H.; Tang, C.; Rui, Y. Numerical simulation of strata failure process with multi-coal strata mined. Chin. J. Rock Mech. Eng. 2001, 20, 190–196. [Google Scholar]
- Liu, Y.; Wang, S.; Wang, X. Development characteristics of water flowing fractured zone of overburden deep buried extra thick coal seam and fully mechanized caving mining. J. China Coal Soc. 2014, 39, 1970–1976. [Google Scholar]
- Ning, W.J.; Tao, L.W.; Cheng, S.W. Numerical Simulation and Test Analysis of Development Height of Fractured Zone in Overlying Strata. Coal Technol. 2017, 36, 149–151. [Google Scholar]
- Thin, I.; Pine, R.; Trueman, R. In Numerical modelling as an aid to the determination of the stress distribution in the goaf due to longwall coal mining. Int. J. Rock Mech. Min. Sci. Geomech. Abstr. 1993, 30, 1403–1409. [Google Scholar] [CrossRef]
- Liu, Y.-X. Numerical Simulation of Mining Overburden Failure Law. Saf. Coal Mines 2013, 44, 198–200. [Google Scholar]
- Cheng, P. Study on Overburden Mining Effect and Roof Water Disaster Prediction in Multi-seam Mining. Master’s Thesis, China University of Mining and Technology, Beijing, China, 2019. [Google Scholar]
- Azrag, E.A.; Ugorets, V.I.; Atkinson, L.C. Use of a finite element code to model complex mine water problems. In Mine Water and Environmental Impacts, Proceedings of the International Mine Water Association Symposia, Johannesburg, South Africa, 7–13 September 1998; International Mine Water Association (IMWA): Lakewood, CO, USA, 1998; pp. 31–41. [Google Scholar]
- Hernández, J.-H.; Padilla, F.; Juncosa, R.; Vellando, P.R.; Fernández, Á. A numerical solution to integrated water flows: Application to the flooding of an open pit mine at the Barcés river catchment–La Coruña, Spain. J. Hydrol. 2012, 472, 328–339. [Google Scholar] [CrossRef]
- Xia, B.; Gong, T.; Yu, B.; Zhou, L. Numerical simulation method for stope underground pressure in whole process of longwall mining. J. China Coal Soc. 2017, 42, 2236–2245. [Google Scholar]
- Li, H.; Bai, H.; Ma, L.; Kang, Z.; Li, Z.; Miao, X.; Wu, P.; Wei, J. Research on the evolution law of water flowing fractures in the Jurassic and Carboniferous coal seams based on FDEM simulation. J. China Coal Soc. 2022, 47, 4443–4454. [Google Scholar]
- Munjiza, A.; Andrews, K.; White, J. Combined single and smeared crack model in combined finite-discrete element analysis. Int. J. Numer. Methods Eng. 1999, 44, 41–57. [Google Scholar] [CrossRef]
- Munjiza, A.; Owen, D.; Bicanic, N. A combined finite-discrete element method in transient dynamics of fracturing solids. Eng. Comput. 1995, 12, 145–174. [Google Scholar] [CrossRef]
- Fan, J.; Yuan, Q.; Chen, J.; Ren, Y.; Zhang, D.; Yao, H.; Hu, B.; Qu, Y. Investigation of surrounding rock stability during proximal coal seams mining process and feasibility of ground control technology. Process Saf. Environ. Prot. 2024, 186, 1447–1459. [Google Scholar] [CrossRef]
- Lei, C. The measured analysis of the development law of the water-conducting fracture zone in the roof of the working face. Shanxi Coking Coal Sci. Technol. 2021, 45, 14–16+20. [Google Scholar]
- Fan, H.; Luo, F.; Gao, S.; Li, M.; Lv, Z.; Sun, G. Evolution law of mining-induced overburden stratum stress and fracture fields in inclined coal seam. World J. Eng. 2024, 21, 475–486. [Google Scholar] [CrossRef]
- Gao, X. Study on the Stability of Coal-Rock Interface in Indirect Fracturing Coalbed Methane Mining Engineering. 2021. Available online: https://kns.cnki.net/kcms2/article/abstract?v=l4t8J_Kk_A98TB0Gk0McfdTTY4DQmwDkBtLrQ7mAX0KR63odGzWDppj81toQTyBsK6ZcNS6aMGFuf04D0EyvZ25lnjyllpjmH94oBuEmWuNvvUMMRwUhhUWHD8nz7OG1oSkiL0K-e27_cUwCzY9SSg==&uniplatform=NZKPT&language=CHS (accessed on 2 June 2024).
- Li, X. Investigation on Evolution Characteristics of Rock Type Ⅰ and Type Ⅰ–Ⅱ Fracture Based on DSCM 2020.
- Sargin, M. Stress-Strain Relationships for Concrete and the Analysis of Structural Concrete Sections. Master’s Thesis, Study, Solid Mechanics Division, University of Waterloo, Waterloo, ON, Canada, 1971. [Google Scholar]
- Li, H.; Tang, S.; Ma, L. Continuous-discrete coupling simulation of progressive failure of mining-induced overburden rock. J. Rock Mech. Eng. 2022, 41, 2299–2310. [Google Scholar]
- Vyazmensky, A.; Stead, D.; Elmo, D.; Moss, A. Numerical analysis of block caving-induced instability in large open pit slopes: A finite element/discrete element approach. Rock Mech. Rock Eng. 2010, 43, 21–39. [Google Scholar] [CrossRef]
- Panza, E.; Agosta, F.; Zambrano, M.; Tondi, E.; Prosser, G.; Giorgioni, M.; Janiseck, J.M. Structural architecture and Discrete Fracture Network modelling of layered fractured carbonates (Altamura Fm., Italy). Ital. J. Geosci. 2015, 134, 409–422. [Google Scholar] [CrossRef]
- Malashkevych, D.; Petlovanyi, M.; Sai, K.; Zubko, S. Research into the coal quality with a new selective mining technology of the waste rock accumulation in the mined-out area. Min. Miner. Depos 2022, 16, 103–114. [Google Scholar] [CrossRef]


| ρ/(kg·m−3) | ts0, tt0/MPa | tn0/MPa | Enn/GPa | Ess, Ett/GPa | /m | E/GPa | μ | |
|---|---|---|---|---|---|---|---|---|
| Fault gouge | 1500 | 10 | 1.5 | 0.2 | 2.53 | 0.17 | 6.52 | 0.35 |
| Siltstone | 2500 | 7.2 | 3.6 | 4 | 16.23 | 0.06 | 17.23 | 0.22 |
| Limestone | 2500 | 20 | 5.7 | 6.2 | 37.28 | 0.04 | 41.56 | 0.25 |
| Coal | 1500 | 10 | 3.5 | 3 | 3.98 | 0.06 | 10.21 | 0.25 |
| Mudstone | 1500 | 3.5 | 2 | 3 | 3.56 | 0.12 | 11.85 | 0.25 |
| Sandy mudstone | 2500 | 10 | 3.5 | 15 | 6.71 | 0.07 | 15.33 | 0.25 |
| Bauxite mudstone | 2500 | 10 | 3.5 | 15 | 4.53 | 0.09 | 13.86 | 0.25 |
| Ds/GPa | σs/MPa | σr/MPa | Sr/mm | Sp/mm | φ/(°) | c/MPa | ψ/(°) | |
| Fault gouge | 0.26 (1) | 0.69 (1) | 0.38 (1) | 7.64 (1) | 1.89 (1) | |||
| 0.96 (6) | 2.25 (6) | 1.44 (6) | 9.11 (6) | 2.54 (6) | 27 | 3.73 | 22 | |
| 1.03 (7) | 2.72 (7) | 1.91 (7) | 9.03 (7) | 2.66 (7) | ||||
| Siltstone | 2.04 (1) | 1.47 (1) | 0.82 (1) | 2.63 (1) | 0.72 (1) | 40 | 12.35 | 34 |
| 10.40 (6) | 8.40 (6) | 4.55 (6) | 6.18 (6) | 0.79 (6) | ||||
| 11.06 (7) | 9.49 (7) | 5.13 (7) | 6.30 (7) | 0.84 (7) | ||||
| Limestone | 1.96 (1) | 1.21 (1) | 0.62 (1) | 1.94 (1) | 0.63 (1) | |||
| 9.21 (6) | 7.26 (6) | 4.12 (6) | 5.81 (6) | 0.65 (6) | 45 | 22.70 | 34 | |
| 10.11 (7) | 8.21 (7) | 4.67 (7) | 5.93 (7) | 0.69 (7) | ||||
| Coal | 0.68 (1) | 0.72 (1) | 0.34 (1) | 5.61 (1) | 1.06 (1) | |||
| 3.67 (6) | 4.11 (6) | 2.22 (6) | 8.54 (6) | 1.14 (6) | 30 | 4.77 | 25 | |
| 4.27 (7) | 4.79 (7) | 2.59 (7) | 9.13 (7) | 1.16 (7) | ||||
| Mudstone | 0.37 (1) | 0.89 (1) | 0.47 (1) | 8.50 (1) | 2.43 (1) | |||
| 1.03 (6) | 3.08 (6) | 1.86 (6) | 9.58 (6) | 2.96 (6) | 32 | 7.36 | 26 | |
| 1.12 (7) | 3.44 (7) | 2.09 (7) | 9.54 (7) | 3.05 (7) | ||||
| Sandy mudstone | 0.57 (1) | 1.35 (1) | 0.86 (1) | 9.88 (1) | 3.23 (1) | |||
| 1.45 (6) | 3.66 (6) | 2.36 (6) | 10.55 (6) | 4.12 (6) | 38 | 9.88 | 32 | |
| 1.56 (7) | 4.13 (7) | 2.68 (7) | 10.92 (7) | 4.23 (7) | ||||
| Bauxite mudstone | 0.45 (1) | 1.11 (1) | 0.65 (1) | 9.12 (1) | 2.88 (1) | |||
| 1.33 (6) | 3.52 (6) | 2.11 (6) | 10.22 (6) | 3.16 (6) | 38 | 9.13 | 30 | |
| 1.42 (7) | 3.92(7) | 2.44 (7) | 10.45 (7) | 3.23 (7) |
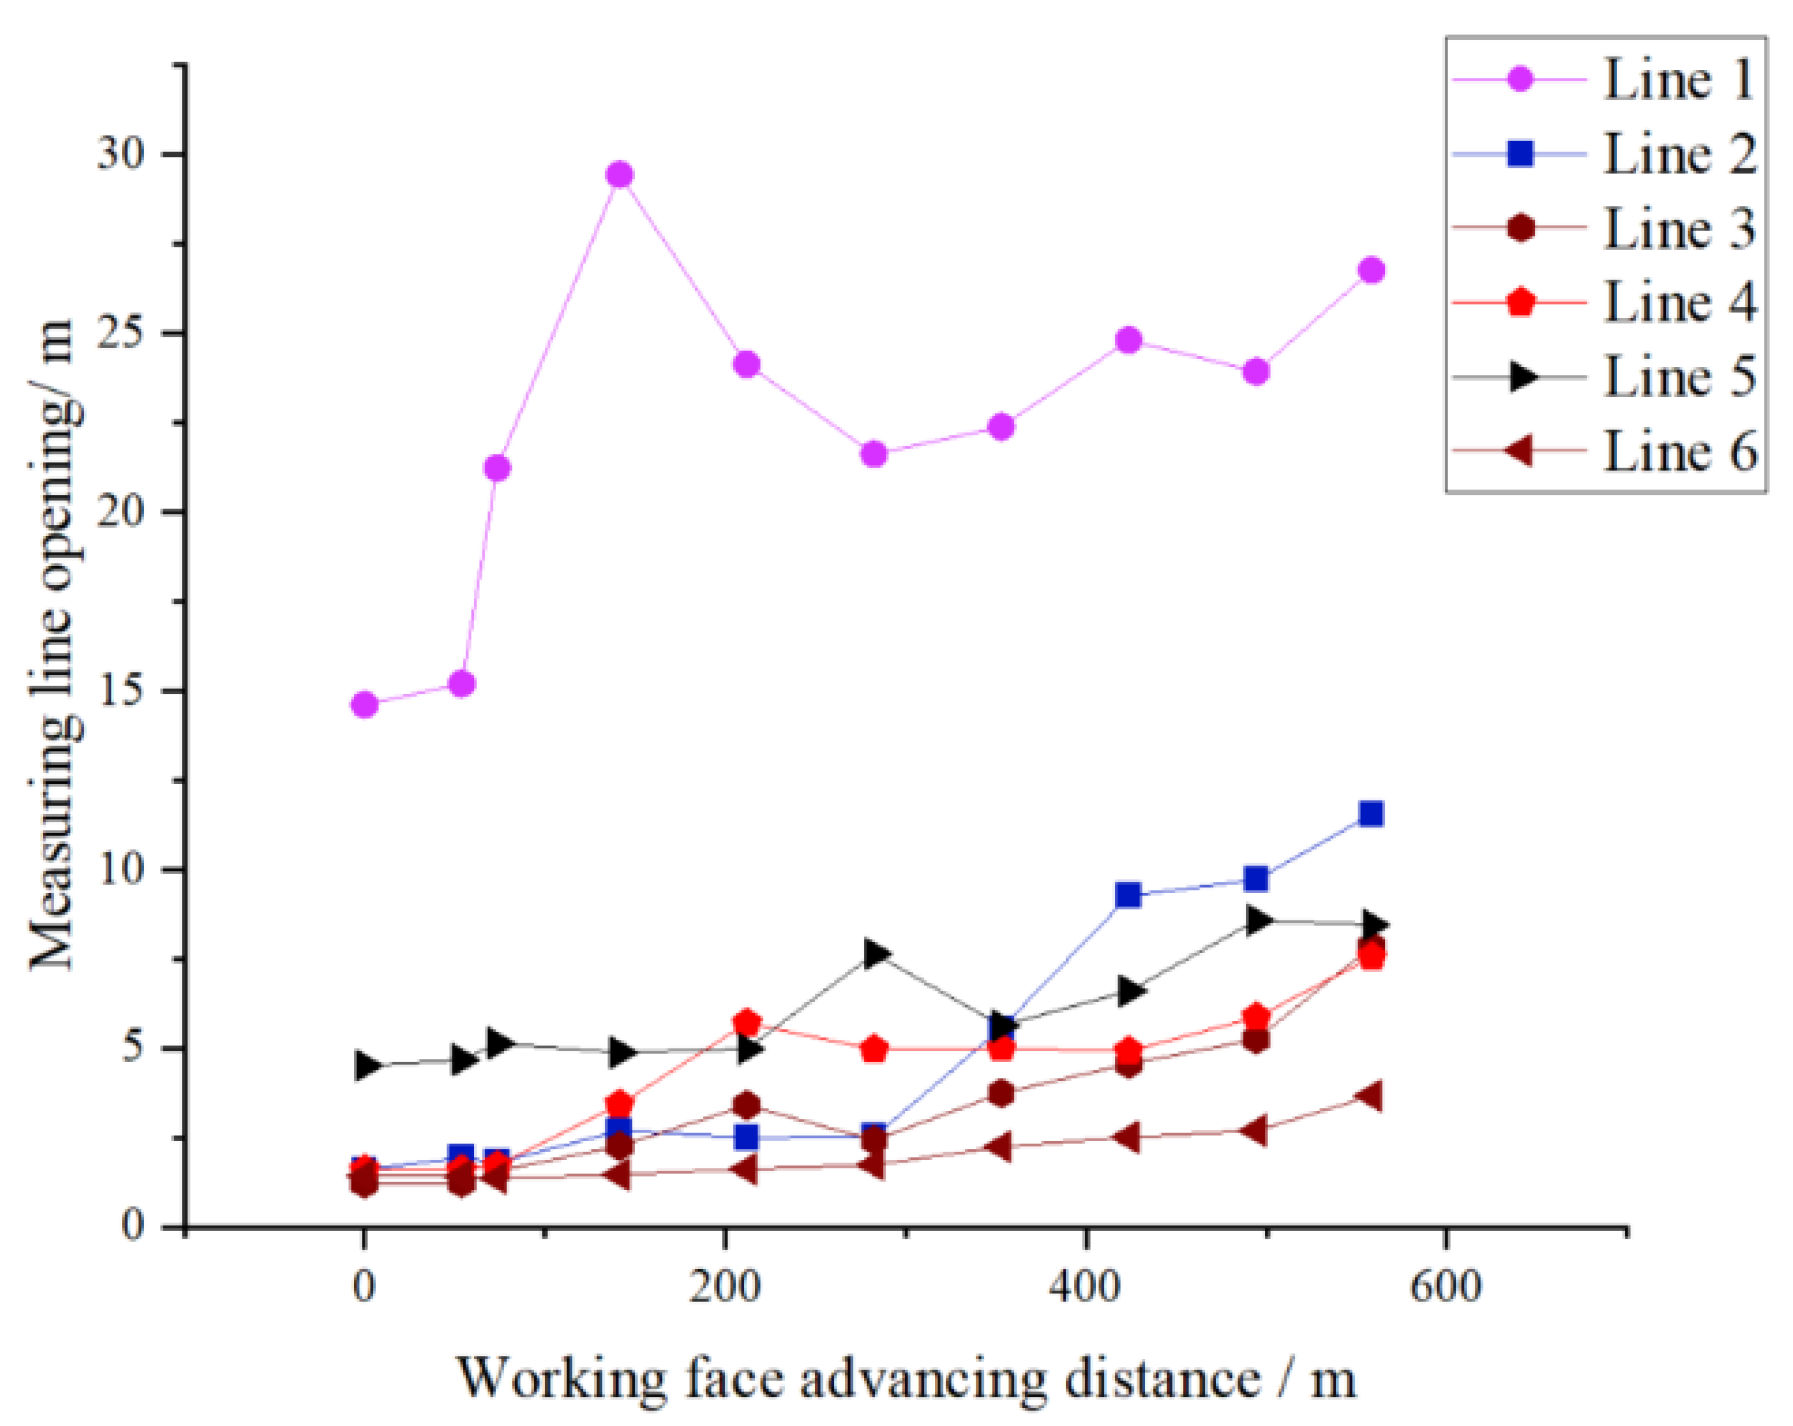
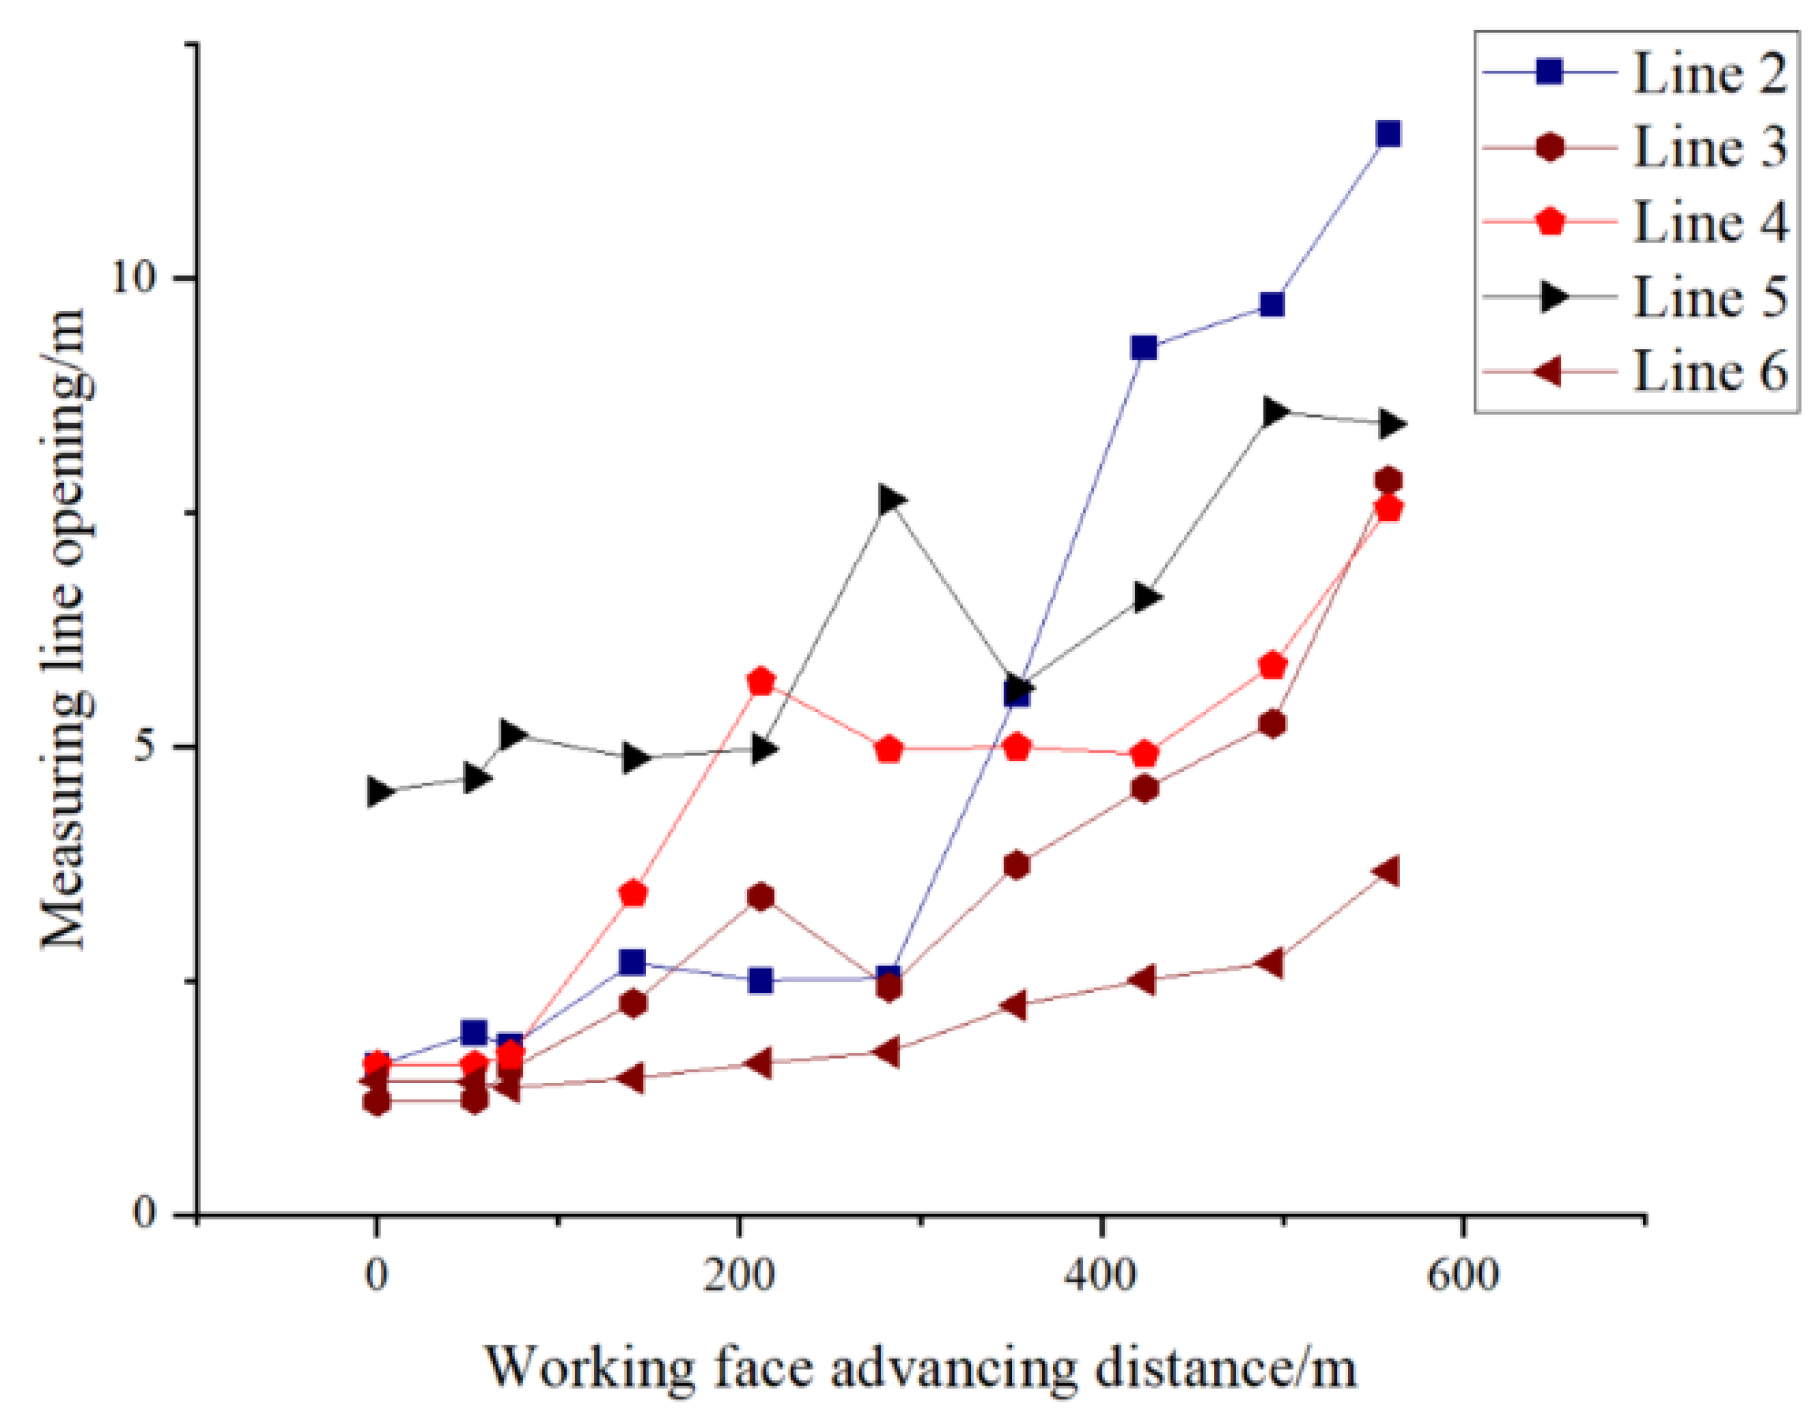
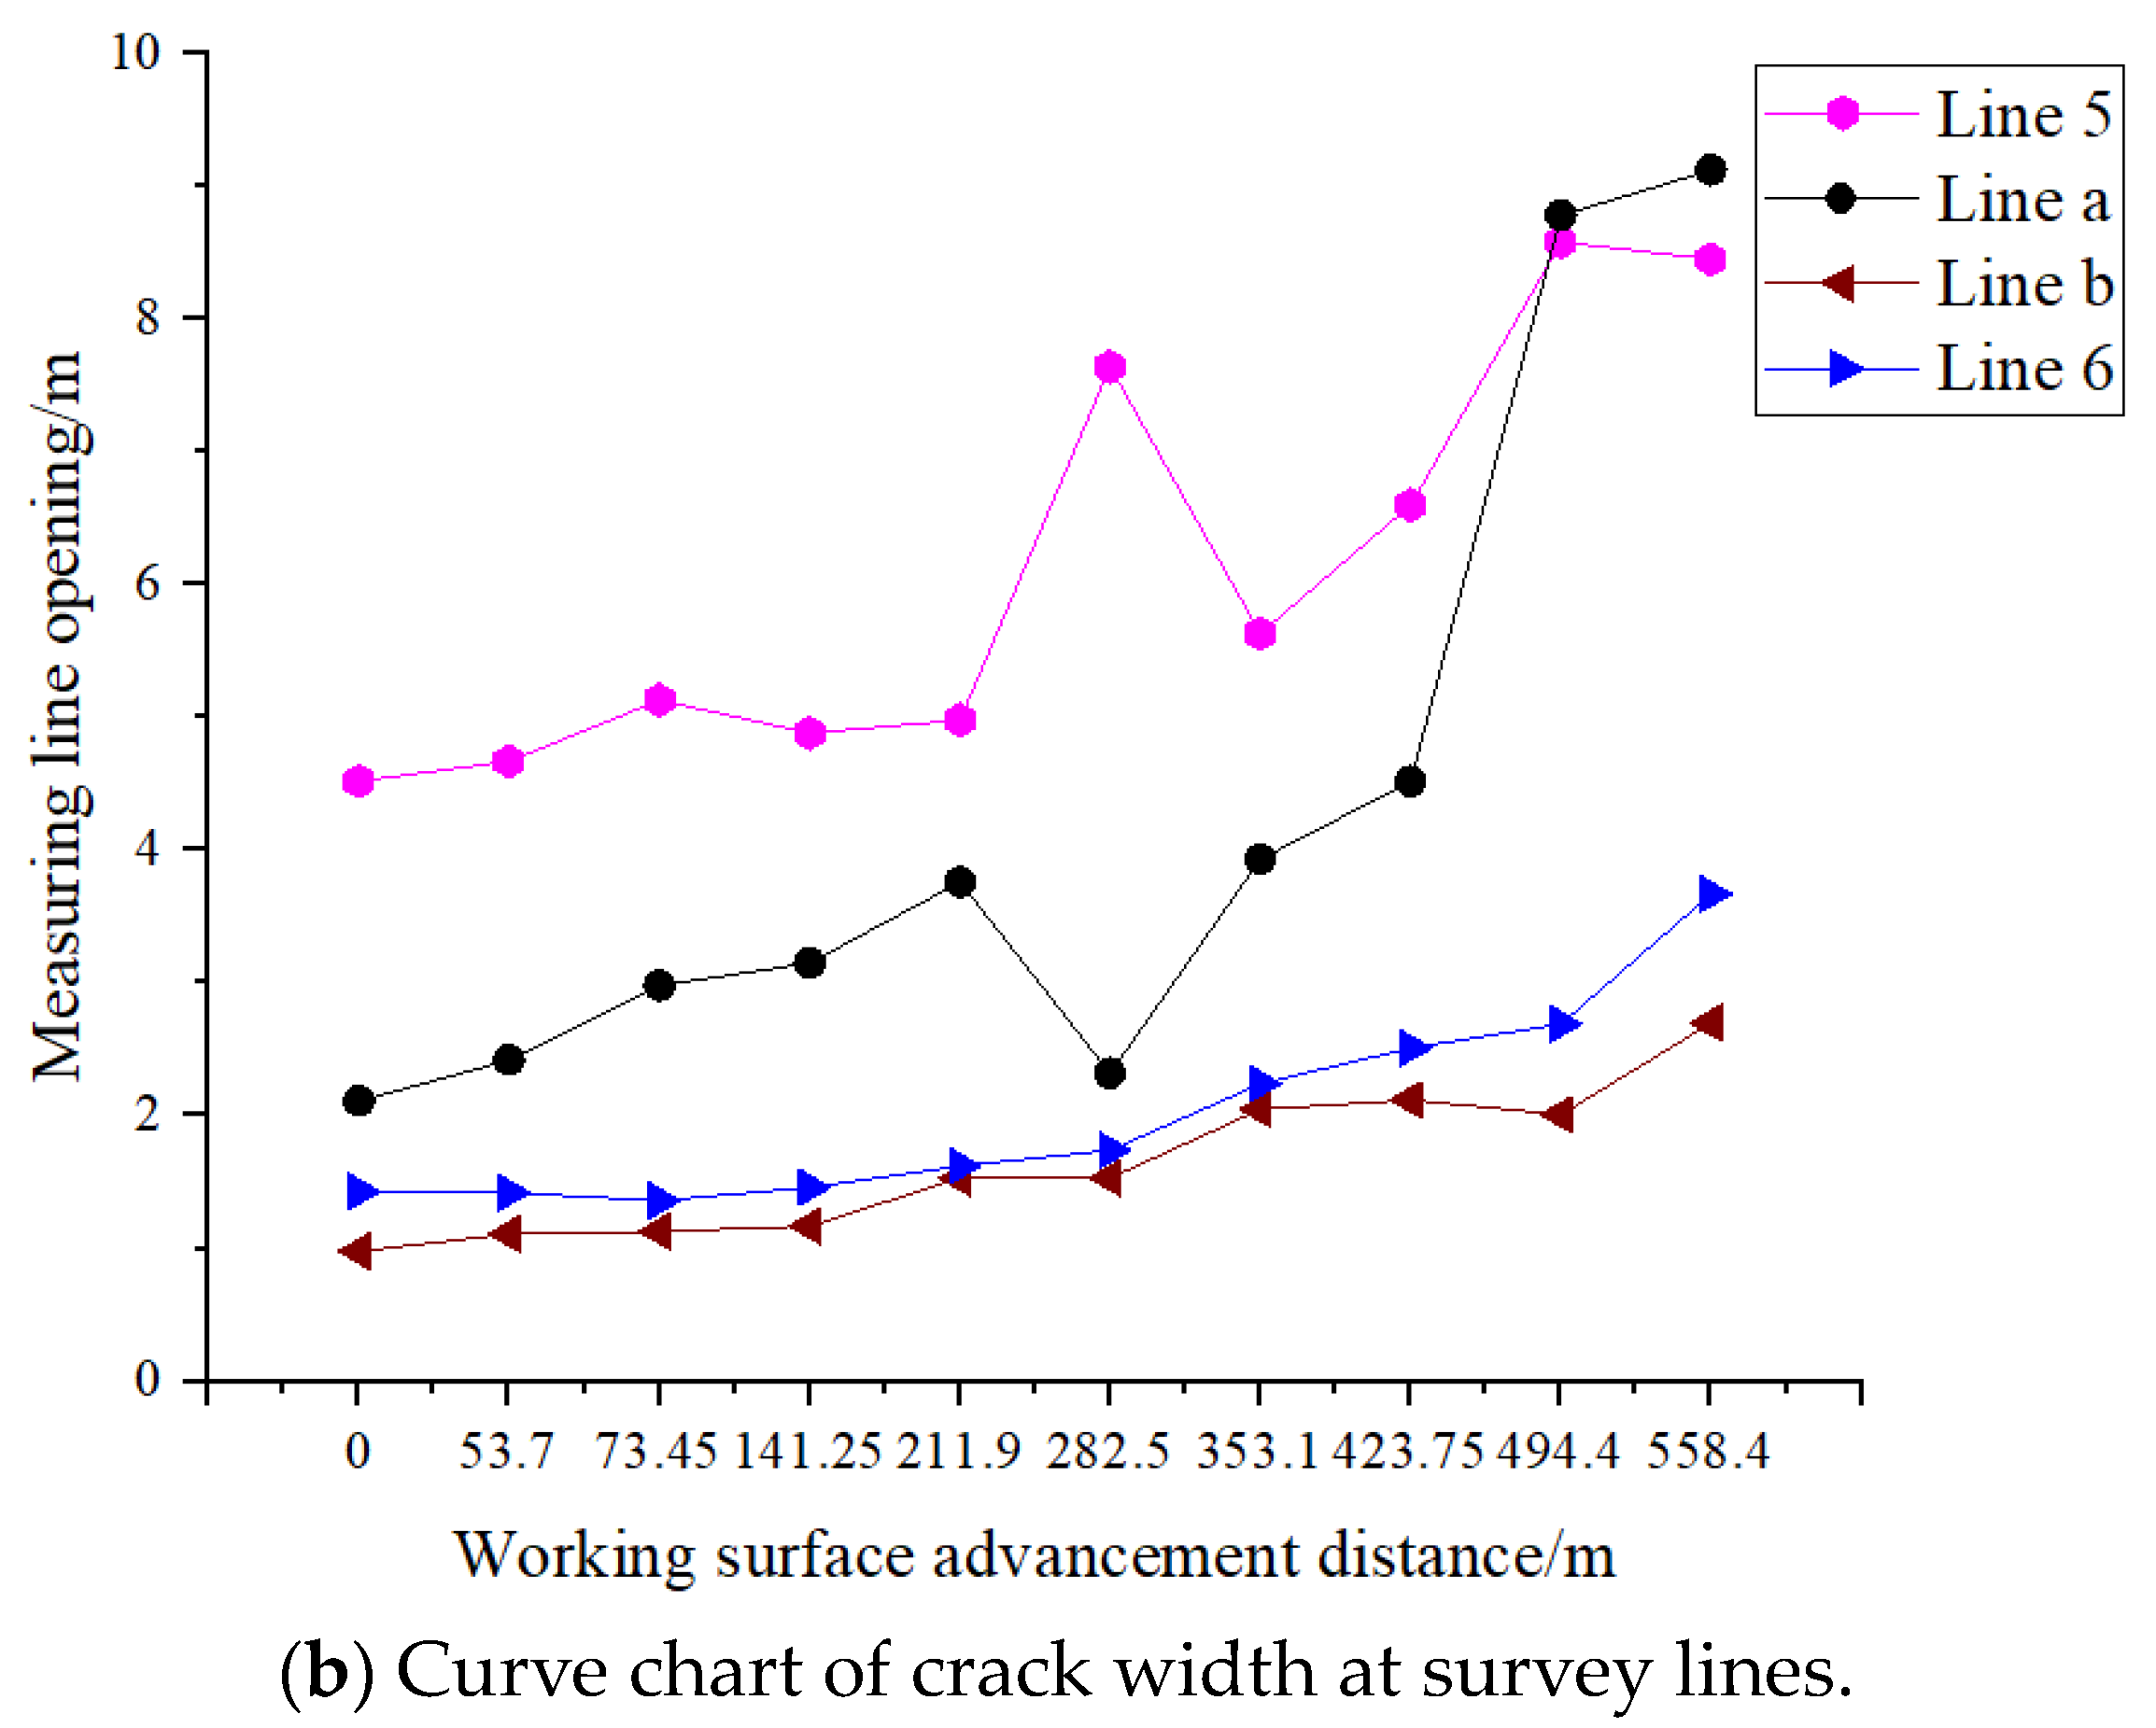
| Mining Distance (m) | Cracks Opening at Measuring Line 1 (m) | Cracks Opening at Measuring Line 2 (m) | Cracks Opening at Measuring Line 3 (m) | Cracks Opening at Measuring Line 4 (m) | Cracks Opening at Measuring Line 5 (m) | Cracks Opening at Measuring Line 6 (m) |
|---|---|---|---|---|---|---|
| 0 | 14.61 | 1.6 | 1.21 | 1.6 | 4.52 | 1.43 |
| 53.7 | 15.2 | 1.94 | 1.23 | 1.6 | 4.67 | 1.42 |
| 73.45 | 21.24 | 1.8 | 1.56 | 1.71 | 5.13 | 1.36 |
| 211.9 | 24.14 | 2.5 | 3.4 | 5.7 | 4.98 | 1.62 |
| 282.5 | 21.62 | 2.53 | 2.43 | 4.97 | 7.64 | 1.7 |
| 353.1 | 22.39 | 5.56 | 3.74 | 5 | 5.63 | 2.2 |
| 423.75 | 24.81 | 9.26 | 4.56 | 4.92 | 6.6 | 2.5 |
| 494.4 | 23.94 | 9.72 | 5.25 | 5.87 | 8.58 | 2.6 |
| 558.4 | 26.77 | 11.55 | 7.85 | 7.55 | 8.45 | 3.67 |
Disclaimer/Publisher’s Note: The statements, opinions and data contained in all publications are solely those of the individual author(s) and contributor(s) and not of MDPI and/or the editor(s). MDPI and/or the editor(s) disclaim responsibility for any injury to people or property resulting from any ideas, methods, instructions or products referred to in the content. |
© 2024 by the authors. Licensee MDPI, Basel, Switzerland. This article is an open access article distributed under the terms and conditions of the Creative Commons Attribution (CC BY) license (https://creativecommons.org/licenses/by/4.0/).
Share and Cite
Mai, L.; Li, H. Finite–Discrete Element Method Simulation Study on Development of Water-Conducting Fractures in Fault-Bearing Roof under Repeated Mining of Extra-Thick Coal Seams. Sustainability 2024, 16, 5177. https://doi.org/10.3390/su16125177
Mai L, Li H. Finite–Discrete Element Method Simulation Study on Development of Water-Conducting Fractures in Fault-Bearing Roof under Repeated Mining of Extra-Thick Coal Seams. Sustainability. 2024; 16(12):5177. https://doi.org/10.3390/su16125177
Chicago/Turabian StyleMai, Longquan, and Hao Li. 2024. "Finite–Discrete Element Method Simulation Study on Development of Water-Conducting Fractures in Fault-Bearing Roof under Repeated Mining of Extra-Thick Coal Seams" Sustainability 16, no. 12: 5177. https://doi.org/10.3390/su16125177