Article

Exploring Employee Retention among Generation Z Engineers in the Philippines Using Machine Learning Techniques

by
Paula Zeah N. Bautista
1,2 and
Maela Madel L. Cahigas
1,*
1
School of Industrial Engineering and Engineering Management, Mapua University, 658 Muralla St., Intramuros, Manila 1002, Philippines
2
School of Graduate Studies, Mapua University, 658 Muralla St., Intramuros, Manila 1002, Philippines
*
Author to whom correspondence should be addressed.
Sustainability 2024, 16(12), 5207; https://doi.org/10.3390/su16125207
Submission received: 18 May 2024 / Revised: 9 June 2024 / Accepted: 11 June 2024 / Published: 19 June 2024
(This article belongs to the Section Sustainable Management)

Abstract

:
Generation Z represents a significant portion of the current workforce and is poised to become dominant in the engineering field. As the new generation arises, employee retention becomes a crucial topic in the Philippines. Hence, this study explored the factors influencing employee retention among Generation Z engineers in the Philippines using machine learning feature selection (filter method’s permutation, wrapper method’s backward elimination, and embedded method’s Least Absolute Shrinkage and Selection Operator) and classifiers (support vector and random forest). A total of 412 participants were gathered through a purposive sampling technique. The results showed that six out of seven investigated features were found to be significant factors impacting Generation Z engineers’ intention to remain in a company. These six features were supervisor support, company attachment, job satisfaction, contribution, emotional support, and shared value, organized in descending order of feature importance. These were further explained by fifteen significant subfeatures representing each feature. Only one feature, servant leadership, was deemed insignificant. These findings were extracted from the optimal combination of machine learning algorithms. Particularly, feature selection’s backward elimination brought 85.66% accuracy, and the random forest classifier further enhanced the accuracy value to 90.10%. In addition, the model’s precision, recall, and F1-score values were 89.50%, 90.10%, and 88.90%, respectively. This research also provided practical insights for the company executives, organizational leaders, and human resources department seeking to enhance employee retention strategies. These implications were based on the significant features influencing Generation Z engineers’ retention, ultimately contributing to the long-term success and competitiveness of organizations.

1. Introduction

Generation Z comprises individuals born from 1996 to 2010, whose current ages span from 13 to 27 years old as of 2023 [1]. This emerging generation was poised to inherit a robust economy characterized by historically low levels of unemployment. Gen Z workers have a pre-existing reputation, and there are prevalent stereotypes associated with them. They are often described as entitled and excessively demanding, perceived as emotional individuals, and perceived as having limited job loyalty [2]. Hence, this reputation causes the stereotype surrounding their generation.
One of the biggest challenges faced by a human resources (HR) department is the employee retention of Generation Z engineers in the workplace [2]. Relying solely on conventional human resource management (HRM) strategies and practices is insufficient for retaining a highly skilled workforce [3]. Employee retention is the practice through which a company takes steps to prevent its employees from resigning from their positions. It is crucial as companies compete for skilled engineers in a competitive and continuously innovating industry. Engineers are in demand in different company areas because they create a fool-proof system [4]. Thus, corporations continuously find ways to keep engineers in the workforce. As many employees of various ages enter the workforce, the old generations (millennials, Generation X, and boomers) are anticipated to be replaced by the younger generation. It has been reported that Generation Z makes up 40% of the population in the Philippines [1]. It will soon reach the highest percentage of the workforce, replacing retired individuals. Hence, the importance of knowing the reasons for employee retention of Gen Z engineers is very crucial to maintaining the smooth operation of a company.
Every organization aims to retain its valuable human resources for as long as possible. This objective enhances productivity, ensures smooth business operations, and lowers the expenses associated with recruiting and training new employees. Consequently, retention stands as a primary focus for the majority of companies [5]. Hence, the researchers aimed to find the factors affecting the retention of Generation Z engineers in a company. In this study, employee retention is considered the class or dependent variable to be used in feature selection analysis.
Feature selection is an advanced machine learning tool that determines important features affecting the class [6]. It comprises three main techniques, which are filter, wrapper, and embedded. Since there are many types of these techniques, the researchers investigated the filter method’s permutation importance, the wrapper method’s backward elimination, and the embedded method’s LASSO. They are chosen due to their ability to reduce data noise and maximize small datasets [7]. These feature selection techniques are merged with other machine learning algorithms to investigate human perceptions [6], specifically, the factors affecting the retention rate of Generation Z engineers. The combination of feature selection algorithms mitigates the chances of underfitting and overfitting. Despite its promising capacity, there are limited studies focusing on the importance of applying comprehensive feature selection prior to machine learning classifiers. For instance, Biswas et al. [8] focused on classifier comparisons in predicting employees’ intention to quit. Meanwhile, Shafie et al. [9] incorporated feature selection in assessing factors affecting employee turnover but failed to itemize a specific feature selection technique, which resulted in a restricted feature selection process.
Machine learning-based classifiers come in several forms. The researchers focused on the support vector classifier (SVC) and random forest classifier (RFC) because they associate optimal results from feature selection techniques with one class [10]. SVC was often used to aid stakeholders during decision-making processes [10]. It was also utilized to identify behavioral patterns and root causes [11]. In a workforce-related study, the hiring process can benefit from SVC [12]. Through past studies’ parameters, the researchers noted that SVC can also be utilized to assess employee behavior, such as the likeliness of Generation Z engineers staying long in a company. On one hand, RFC is commonly used for human behavior prediction, aiding in technology improvements [13]. In one study, RFC revealed a high accuracy value by feeding the model with data relevant to employees’ intention to quit [8]. Thus, the researchers considered RFC as one of the adequate classifiers with the ability to predict Generation Z engineers’ retention. While these studies contributed to the workforce and machine learning applications, none of them applied feature selection merged with SVC and RFC in identifying the retention determinants of Generation Z engineers.
The primary objective of this research study is to examine the determinants of employee retention among Generation Z engineers through machine learning’s feature selection techniques, support vector classifier, and random forest classifier. The study considered work-related, organizational, and social variables that referred to Generation Z’s perceptions of their direct tasks and their relationship to corporate culture. Specifically, the authors assessed employee retention (ER) through multiple features, such as shared value (SV), company attachment (CA), emotional support (ES), contribution (C), supervisor support (SS), servant leadership (SL), and job satisfaction (JS). This research aims to contribute to identifying the unique values, preferences, and expectations of Generation Z engineers in the workplace, with a focus on factors that affect their decision to stay or leave their current employment. Moreover, the researchers intend to investigate the impact of career development opportunities, work–life balance, meaningful work, organizational culture, and recognition on the job satisfaction and retention of Generation Z engineers. Finally, this research intends to influence leadership and management practices, mentoring, and professional growth opportunities for Generation Z engineers.

2. Literature Review

The researchers evaluated seven features: shared value, company attachment, emotional support, contribution, supervisor support, servant leadership, and job satisfaction. They are all relevant to employee retention because the Generation Z workforce has given importance to well-being [5]. Figure 1 presents the summarized connections of seven features to ER. These factors influence loyalty and commitment to remain in a company.
Shared value (SV) determines the agreement of important and unimportant beliefs among individuals [14]. This includes similarities among Generation Z engineers, including their problems, emotions, and observations. A past study found a positive connection between work values and employee retention [2]. This is aligned with another study showing that work principles among team members affect employee well-being and eventually lead to employee retention [5]. Since disagreements are inevitable, SV can also be attained when individuals compromise despite differences. Generation Z employees are known for their self-confidence; thus, they voice opinions when needed [2]. However, their assertiveness also plays a role in understanding SV, especially in the engineering perspective where technicalities are involved.
Company attachment (CA) is also known as a psychological attachment; nonetheless, its main principle is feeling a sense of self-belongingness [8]. Employees must feel a personal attachment to the company to work for the company for longer periods. If they feel a genuine bond, personal affection increases directly and company affection increases indirectly [14]. It takes time for employees to process their sentiments; hence, they realize CA upon careful evaluation.
Emotional support (ES) pertains to management’s ways of alleviating employees’ stress by giving advice and providing coping mechanisms [15]. Some jobs are physically demanding while others are mentally demanding. Generation Z is prone to feeling overwhelmed regardless of the stress induced by any kind of industry [2]. Hence, ES is a crucial factor as Generation Z employees may resign from a company if they reach a high level of stress without an adequate support system. Employees remain in a company if their emotional well-being is taken care of [5].
Contribution (C) refers to an employee’s remarkable highlights involving organizational objectives [5]. Some highlights include the acquisition of new customers, discovery of efficient systems, launch of new products or services, and a lot more depending on the business nature. Meanwhile, organization objectives include reducing expenses, increasing profits, and receiving positive engagement. Employees who feel confident in their communication and technical skills believe they are a part of the company’s success [16]. Hence, they are motivated to stay longer and perform better. In this study, Generation Z engineers’ contributions are assessed by their unique accomplishments and the importance of their jobs.
Supervisor support (SS) is the professional support given by team leaders, managers, and directors to their respective employees. Ethical leadership is a common form of showcasing supervisor support because it aligns with fairness [9]. Hence, employees are encouraged to work longer in a company if supervisors provide them with the resources needed to perform a job excellently. Without resources, such as training from leaders, employees tend to quit a job [8]. Since Cahigas et al. [16] noted that leaders exude professionalism during working hours, they only provide resources based on company needs. Employees should also ensure that the requested resources are aligned with the organization’s objectives. This helps in resolving possible issues insinuated from the lack of supervisor support.
Servant leadership (SL) implies a leader’s personal support for their employees. Servant leaders ensure a good work environment, develop the self-efficacy of employees, and encourage proactiveness among team members [15]. The SL feature aims to understand the criticality of leaders’ selflessness by helping Generation Z engineers. One relevant study stated that Generation Z tends to prioritize teamwork and feedback from supervisors [2]. These circumstances help Generation Z employees understand the work dynamics, which affects their employment tenure. In another study, company leaders assess the personality traits of employees to customize performance feedback [16]. Generation Z retention tends to be longer if performance improvement is noticed.
Job satisfaction (JS) pertains to employees’ contentment with their responsibilities and career progression [8]. They feel appreciated when they receive professional recognition. This also reduces routine, which boosts Generation Z’s motivation. Moreover, Generation Z upholds job satisfaction, resulting in exceptional work [2]. Another study supported that an increase in JS level positively influenced employee retention [9]. In the present study, JS is measured by recognizing Generation Z engineers’ happiness in alignment with their work opportunities.
Based on the existing studies, these seven evaluated features contribute to ER. However, the magnitude of influence, direct significance, and indirect relationship vary from one study to another. There is a lack of studies quantifying the ranking of importance among all factors influencing ER. While others noted a significant relationship of one feature with ER [9,15], they overlooked the importance of understanding the perceptions of Generation Z engineers. Most studies noted the indirect relationships of features with ER [5,14,16], which posited insufficient findings. Thus, the present study aims to bring closure by providing a concrete relationship among features with the help of machine learning techniques. Machine learning was mostly used as an individual tool [7,8,12], but this study noted that it is more effective and powerful to combine different algorithms. The testing of different feature selection techniques and merging them with SVC and RFC were considered novel. As of this writing, this technique has not yet been explored in the context of Generation Z engineers’ retention. Furthermore, researchers would optimize parameters to ensure the uniqueness of machine learning methods.

3. Methodology

3.1. Data Collection and Questionnaire

This study employed a survey research design. Google Forms was utilized in disseminating the online questionnaire. The researchers shared the questionnaire through online media channels and their social networks. A purposive sampling technique was used to ensure that all participants were Generation Z engineers of legal age currently working in the Philippines. This supported the alignment of participants with the purpose of the study. Their demographics were recorded before the questionnaire was answered. In addition, all participants were informed of the study’s objective and signed a consent form voluntarily.
A pilot questionnaire was first distributed to 50 volunteers who met the needed demographics. This was to ensure that the final questionnaire was reliable and valid. Following the guidelines of Marshall [17], participants were asked open-ended questions after completing the pilot questionnaire, which were as follows: “Do you find the questionnaire lengthy?” “Are the instructions unclear?” “Do you find the questionnaire lengthy?” “What questions do you believe should have been included in the questionnaire but were not?” After the questionnaire was modified based on pilot questionnaire inputs, the validity was tested through the Pearson correlation coefficient. The study generated a 0.62 coefficient value, which was above the threshold. Specifically, a past study declared a minimum value of 0.35 was necessary to ensure the validity of questionnaire items [18].
The final questionnaire was created by adopting questions from credible sources as shown in Table 1. A total of 39 questions were answered by respondents from September 2023 to January 2024. This questionnaire employed a 5-point Likert scale where a rating of 1 indicated strong disagreement and a rating of 5 denoted strong agreement. A Likert scale functions as a measurement tool designed to assess respondents’ viewpoints, attitudes, or degrees of agreement in response to survey statements. It is the most applicable type of questionnaire in predicting human behavior through the inclusion of machine learning algorithms [6]. Demographic responses were also collected from the participants, including their age, gender, educational attainment, employment status, employment tenure, and average monthly income.

3.2. Participants

The questionnaire was filled out by Generation Z employees (male and female) from various disciplines of engineering. Generation Z engineers or those born between 1996 and 2010 were the only ones allowed to participate in the survey. In addition, all types of engineering degrees were allowed to participate in covering the point of view of all educational levels (bachelor, master, and doctoral) when it comes to employee retention. Table 2 demonstrates a wide range of demographic characteristics from 412 volunteer respondents, and these variations could potentially influence their comprehension of the research topic being studied.
As of 2023, 65% of the workforce comprised Generation Z in the Philippines [20]. It was difficult to identify the percentage of engineers in the country because not all engineering professionals are regulated through licensure examinations. Hence, the sample size was calculated following 62.6 million of the Filipino population and 95% accuracy through Yamane’s formula [21]. Accounting for the 65% population of Generation Z, a minimum sample size of 400 was needed. This study gathered 412 valid responses that met the criteria, specifically, Generation Z employed as an engineer in the workforce.
The majority of respondents were male (72%), and the remaining were female (28%). The data about gender demographics shed light on the gender composition within the engineering workforce being studied. This gender imbalance was documented in another study, showing the underrepresentation of women in engineering roles [22]. In addition, the distribution of respondents according to their age offered insights into the generational composition of the engineering workforce under consideration. As reflected in the percentages, the respondent age range fell within the 22 to 26 bracket. Notably, 27% of the respondents were 23 years old, 24% were 24 years old, 22% were 26 years old, 16% were 25 years old, and 11% were 22 years old. The presence of a relatively high percentage of 23-year-olds suggests that the organization may have recently hired a substantial number of entry-level engineers. This could be attributed to the preferences and career aspirations of Gen Z engineers, who seemed to be the focus of the study. Remarkably, 97% of the respondents hold a bachelor’s degree. These data suggested that the organization primarily employs engineers with undergraduate education. Moreover, the majority of the surveyed engineers were in either a probationary or regular employment status, making up 53% and 42% of the sample, respectively. Hence, the organization recently hired a significant number of engineers on probation, possibly to accommodate fresh graduates or young talent. Furthermore, the data reveal that a significant majority, constituting 80% of the respondents, have less than a year of work experience, indicating a relatively young workforce or a recent influx of talent. Lastly, more than half (56%) of respondents’ average monthly income is at most PHP 25,000, followed by 39% of the respondents earning PHP 26,000 to PHP 35,000, and only a few, 5%, under the PHP 36,000 to PHP 50,000 range. This concentration of engineers in the lower to mid-income ranges is an important consideration when seeking to understand and cater to the needs of Gen Z engineers.

3.3. Feature Selection

The three feature selection methods utilized in the study were filter, wrapper, and embedded, following a specific technique under each method. The participants’ responses to the 5-point Likert scale underwent all feature selection methods through Jupyter Notebook. A total of 7 primary features with 31 subfeatures were processed alongside 1 class (ER) containing 8 subfeatures.
The filter method’s permutation importance applies a learning algorithm where pre-processed data undergo goodness of feature criteria [7]. It rearranges features randomly until a score is assigned to the best subfeature combination. This technique was chosen because it was found the best among all filter methods due to its unpredictability criteria [6]. In the present study, all subfeature combinations were investigated with their relevance to ER. The parameters chosen were 70% training size, 30% testing size, and 5 K permutation replicates. The past study displayed adequate accuracy with positive effects on the class while utilizing these parameters [6]. This approach meant that 70% of the data were trained before the final accuracy calculation. The number of replications helped the algorithm in minimizing error and finding other sets of subfeature combinations to be fed into the algorithm. The following equation was adopted from Cahigas et al. [6] to calculate the filter method’s permutation importance score for every replication:
P e r m u t a t i o n   I m p o r t a n c e j = s 1 K k = 1 K s k , j
where s refers to the customized accuracy criteria of unused subfeatures, s k , j pertains to the customized accuracy criteria of randomly selected subfeature combinations, k is the number of permutation replications, and j is the number of selected subfeatures. Afterward, the accuracy was found based on the best score among all combinations.
The wrapper method’s backward elimination explores the optimal subset by feeding all features into the model and eliminating the least important feature one at a time [7]. Among all wrapper methods, many studies supported that its extensive process leads to a high accuracy value [23]. Backward elimination applies the Ordinary Least Squares model to identify the best feature combination depending on the class. This process is repeated continuously until the combination’s p-values are less than or equal to 0.05 [23]. The p-value of the best feature combination was selected by adopting the equation from the study of Maldonado and Weber [24]:
W ( p ) 2 ( a ) = i , s = 1 m a i a s y i y s K ( x i ( p ) , x s ( p ) )
where w 2 ( a ) is the variation of removed features, ( p ) is the removed features, i is the set of feature combinations in the training set, s is the set of feature combinations in the testing set, m is the number of iterations, a is the support vector, K is the algorithm’s decision function, and x is the identified feature combination.
The embedded method’s LASSO utilizes penalization scores and eliminates unimportant features through regularization parameters [6]. This technique generates −1 to 1 coefficient values, whereas non-zero values denote feature importance while zero values imply the unimportance of selected features [6]. Therefore, non-zero values were retained and zero values were eliminated to collate the best feature combination. The following equation from the study of Cahigas et al. [6] showcases the penalized equation:
min { i = 1 n ( y i j = 0 p ( w j ) ( x i j ) ) 2 +   λ   j = 0 p w j 2 }
where ( y i j = 0 p ( w j ) ( x i j ) ) 2 pertains to the residual sum of squares, similar to the concept of ordinary linear regression. Meanwhile, λ   j = 0 p w j 2 represents the penalty formula, with an expected value ranging from 0 to 1, that enhances the LASSO’s accuracy value.

3.4. Machine Learning Classifiers

The support vector classifier (SVC), also known as support vector machine (SVM), is best used for generalized concepts because it can handle any kind of feature data [8]. Since the most optimal feature had the highest accuracy rate, its corresponding data were fed into the SVC algorithm. According to a past study, data were best divided at 70% training size and 30% testing size [6], and these values were utilized in the research. Moreover, the present study used a linear kernel because it allows the model to find the best hyperplane by trying different linear classification algorithms [24]. Another SVC parameter includes the regularization parameter (C) = 5 because this aids in producing a small margin in the hyperplane’s systematized data [11]. These parameters were trained and tested iteratively until the highest accuracy for each iteration was generated. SVC applies a weighted classification model through a confusion matrix where accuracy is projected individually. Aside from accuracy, precision, recall, and F1-score are also generated. The overview of SVC’s pseudocode is presented in Table 3.
The random forest classifier (RFC) reproduces multiple decision trees, aiming to predict the class or intended objective [8]. In this study, RFC selects the most optimal feature combination based on employee retention indicators. The procedure started with the initialization of data from the best feature selection technique. The initial parameter includes training and testing sizes of 70% and 30%, respectively [6]. Afterward, the number of estimators (n_estimators) was set to 50, and a split criterion of the Gini Index was used [10]. This meant that the model consisted of 50 probabilities identifying whether Generation Z engineers would be retained in the company or not. A random state of 0 was also added in the RFC model, similar to the study of Ong et al. [13]. This value helps split the data steadily. Succeeding processes include continuous iteration of tree splits, training and testing of parameters, and extracting the predicted data. Since 50 decision trees were generated, the final RF model was chosen based on the highest accuracy rate among all the decision trees. Then, a confusion matrix was built consisting of the final model’s accuracy, precision, recall, and F1-score. The RFC pseudocode is displayed in Table 4.

4. Results

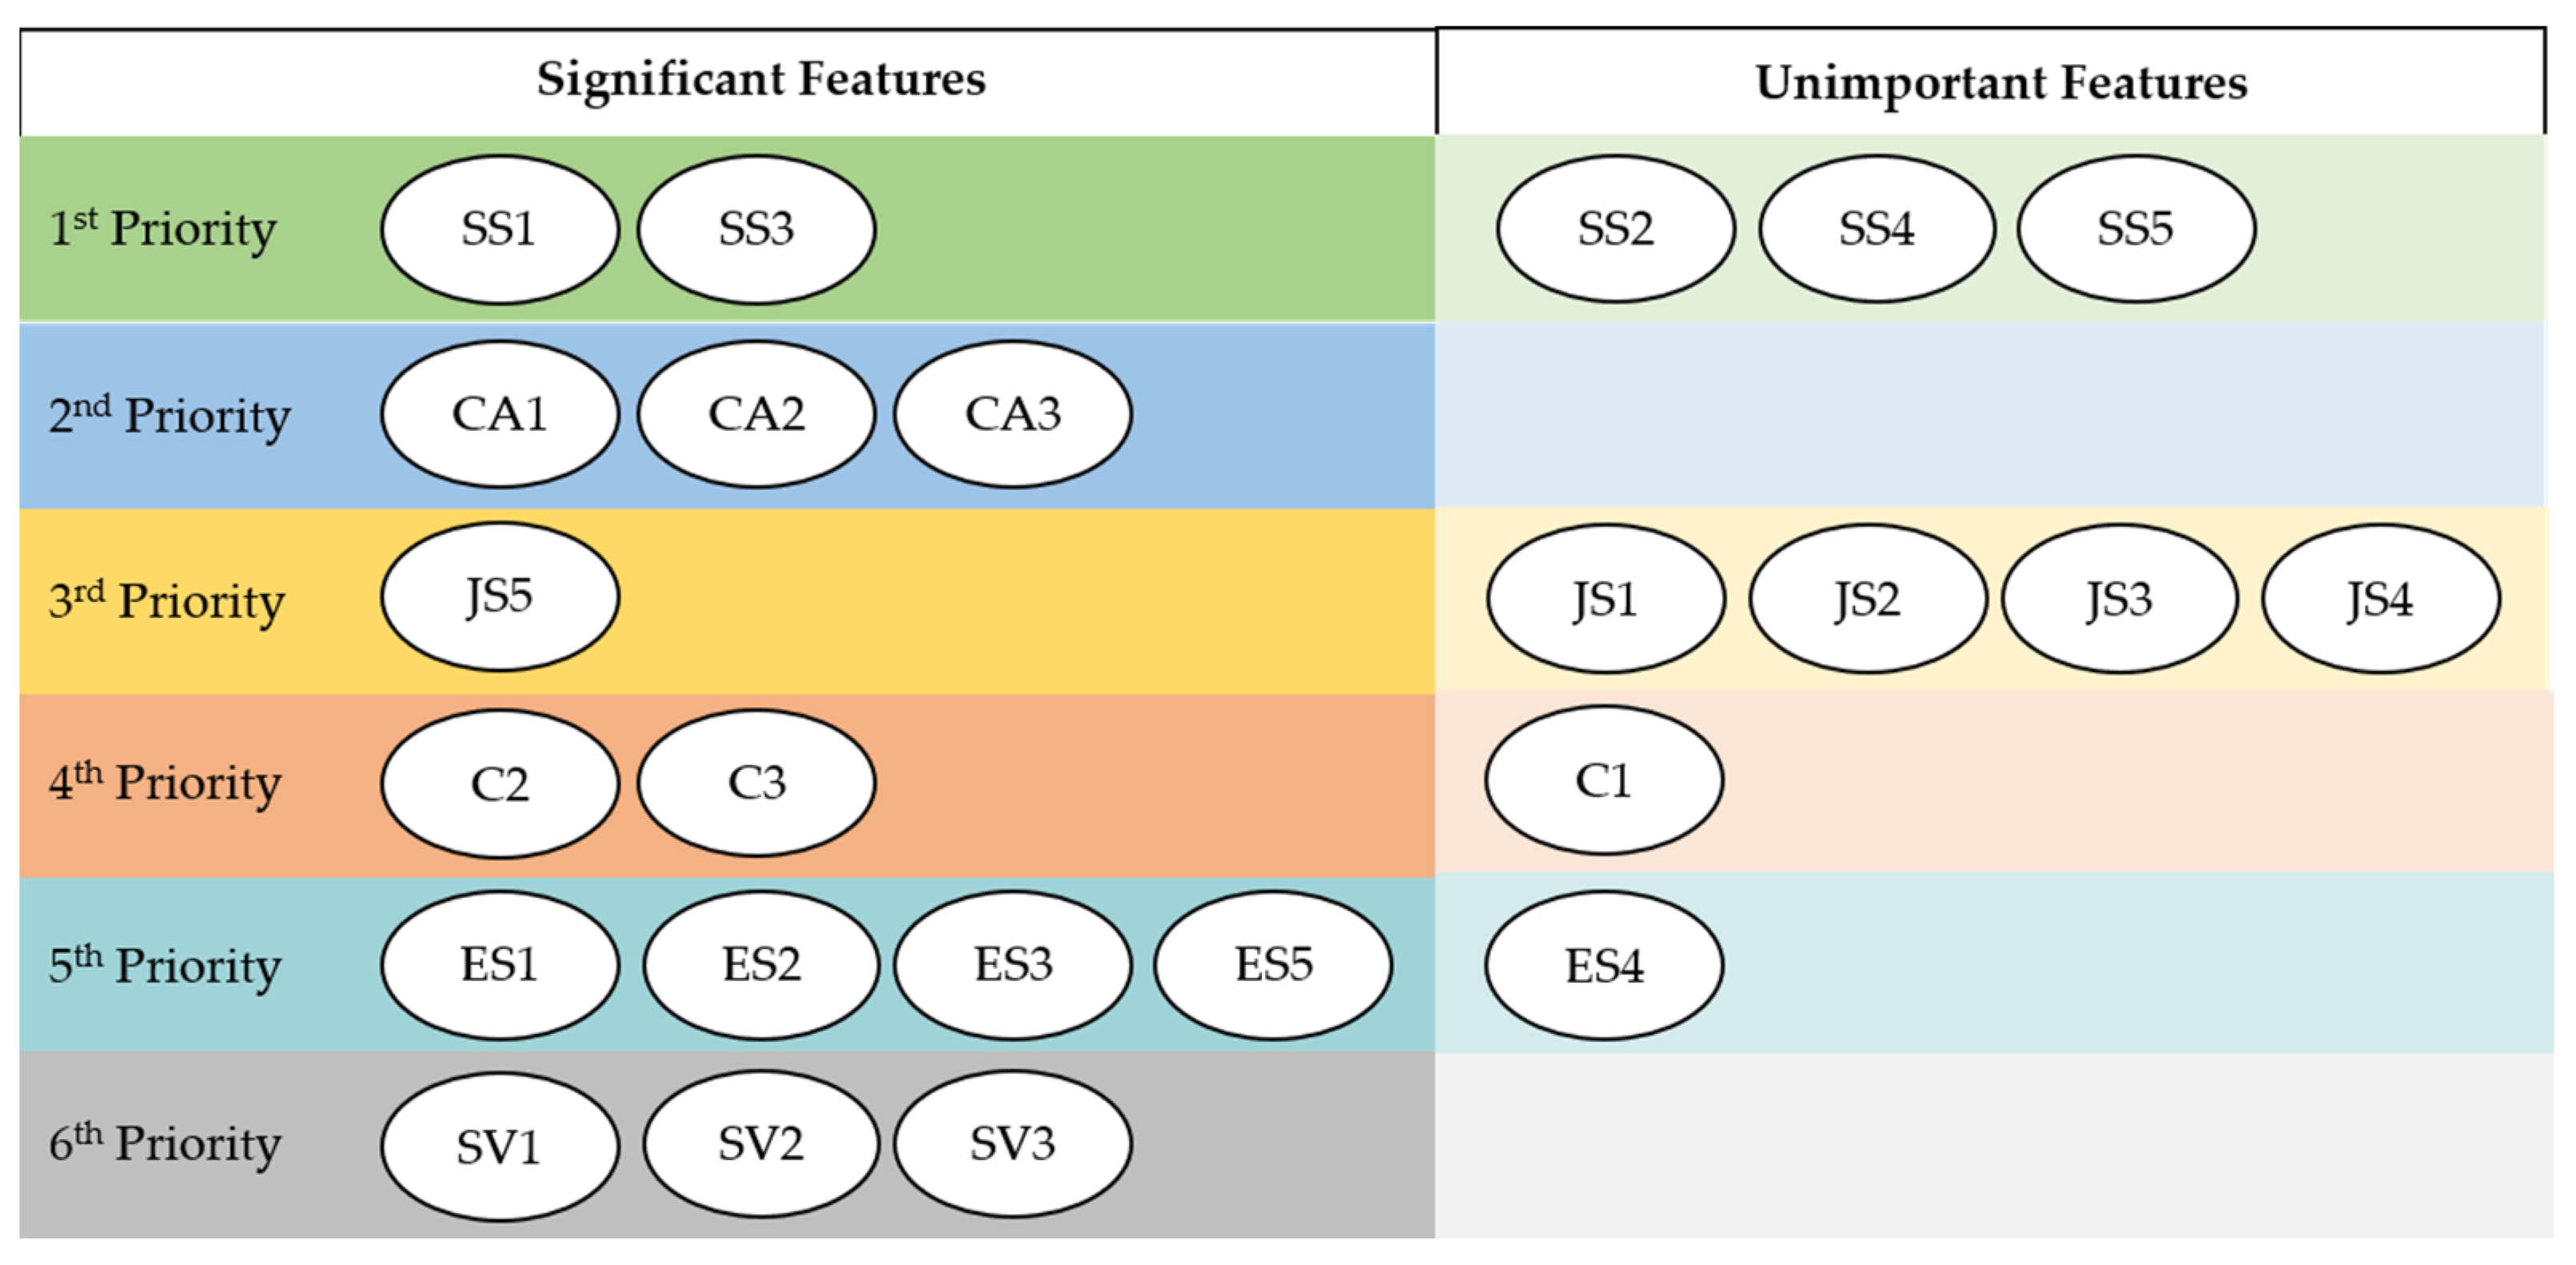
4.1. Feature Selection Findings

As shown in Table 5, the most optimal feature selection was the wrapper method through backward elimination with 85.66% accuracy with a total of 15 important subfeatures. It was chosen because it garnered the highest optimal number with the highest accuracy [23]. According to a past study, the wrapper’s backward elimination displays a higher accuracy value through continuous computations of group dependencies, resulting in minimized error [7]. The correct class should be selected to ensure accurate results, which was supported in the study. Although LASSO’s optimal number was similar to backward elimination, it received a lower accuracy value. Meanwhile, permutation importance was the worst-performing feature selection technique among the three techniques. Despite having a rank among all feature selection techniques, their accuracy values were above average considering that the normal threshold was set at 70% [23]. Therefore, the evaluated feature selection techniques were all reliable, but the wrapper’s backward elimination was deemed as the best solution.
These findings posited that six evaluated features (SV, CA, ES, C, SS, and JS) were suitable predictors of Generation Z engineers’ retention in a company. SL was found unimportant since it was not included in the optimal subset. After the evaluation of important employee retention determinants, individual features were determined, as displayed in Table 5. It specifies three important features under SV and CA, four important features for ES, two important features for C and SS, and one important feature for JS.
Table 6 exhibits the comparison between regression without feature selection and regression after the most optimal feature selection technique. It could be depicted that only three features (SV, CA, and SL) were significant at ≤0.05 p-value in regular regression. Meanwhile, all six features (SV, CA, ES, C, SS, and JS) were significant predictors of JS. They should be prioritized by employers to ensure that Generation Z engineers are satisfied with their job scope. SL was not included in the regression analysis because it was unimportant based on the wrapper method, thus depicting “N/A” values in Table 6. These findings showcased the significance of eliminating unimportant features and retaining important features through the feature selection technique. A high accuracy value was also the result of meeting the p-value threshold.
This optimal feature subset garnered a 0.82 R-squared value, which implied a strong positive relationship among the features. An R-squared value of between 0.70 and 1.00 was deemed acceptable and further indicated a high degree of connection [23]. This substantial R-squared value demonstrated the effectiveness of the model in explaining Generation Z engineers’ employee retention factors. The findings also aligned with a past study where the model development was supported by R-square’s strong relationship between features and the class [25].

4.2. Classifier Findings

The results for the wrapper method’s optimal subset underwent classifier algorithms. Table 7 displays that RFC had a higher average value for accuracy, precision, recall, and F1-score compared to SVC. Hence, RFC was a better classifier than SVC in identifying good metrics of determinant fit contributing to employee retention among Generation Z engineers. The gap among average metrics was wide given that SVC only resulted in 82.40% accuracy while RFC had a 90.10% accuracy. This implied that RFC supported optimal feature fit to the algorithm. Meanwhile, RFC’s precision was 89.50%, which meant features were predicted accurately fit to employee retention. The RFC’s recall was 90.10%, which posited that the features were classified correctly in consideration of possible errors. Lastly, RFC’s F1-score was 88.90%, implying a balance between precision and recall. These interpretations were supported by a past study though only one class was investigated in the present study [11].

5. Discussion

5.1. Interpretation of Machine Learning Findings

The researchers recommend using the wrapper method’s backward elimination in finding the most important features representing Generation Z’s intention to remain in a company. It generated the highest accuracy (85.66%) and was higher (+3%) compared to permutation importance and LASSO. A total of 15 important subfeatures were extracted from the optimal subset. They covered six (SV, CA, ES, C, SS, and JS) out of seven features. The wrapper method’s backward elimination was the only technique that met the standards of feature selection. Specifically, it aims to find the optimal method through the highest accuracy value with the highest inclusivity of features [23]. Another study supported the advantages of backward elimination, specifically the inclusion of validation errors while reducing overfitting and underfitting [24]. In this study, the accuracy was identified as not too low or too high. Moreover, the accuracy result incurred a 3% approximate margin compared to other feature selection techniques, which eliminates the possibility of bias. Another importance of this method was the presence of a p-value, which guaranteed the importance of feature combination in a subset.
Meanwhile, the researchers suggest refraining from using the filter method’s permutation importance in analyzing human behavior, like employee retention. The results showed that it garnered the lowest accuracy value (82.50%), similar to the findings of Cahigas et al. [6]. This occurred due to restricted optimality criteria and minimal replication numbers. Unlike other feature selection techniques that offered more parameter options, permutation importance failed to identify the best feature combination as it eliminated 25 subfeatures. The remaining six subfeatures originated under four features (SV, ES, SS, JS) out of seven features. Meanwhile, the embedded method’s LASSO only produced a little higher accuracy (82.77%) than the permutation importance, which meant that it did not perform well along with permutation importance. In the results presented by Cahigas et al. [6] where LASSO received the highest accuracy, it only resulted in an accuracy of 76.60%. This value was lower than the current study’s accuracy score. Thus, it implied that LASSO was a better performer for tourist-related human behavior but not a good feature selection technique for investigating Generation Z’s retention in a company.
Between the two classifiers, RFC outperformed SVC in all aspects of machine learning metrics. The summarized performance metrics for all runs are displayed in Figure 2. It was seen that RFC dominated SVC for almost all runs except for having an almost similar result or metric drop in the 4th, 5th, 7th, and 10th runs. Additionally, the average accuracy of RFC (90.10%) was significantly higher than that of SVC (82.40%), and the same was found for other metrics like precision, recall, and F1-score. This occurred due to RFC’s process of testing different possibilities through multiple trees. The testing phase yielded a better outcome in ensuring that optimal features affecting employee retention were accurate. While SVC’s hyperplane, linear kernel, and regularization parameters produced a promising result in a past study [11], result differences occurred due to the evaluated data. Singh and Sidhu [11] focused on image data type in eliminating driver distraction, while the present study utilized quantitative and actual survey responses from Generation Z engineers. While both studies assessed human behavior, findings exhibited that SVC was not the best machine learning classifier for workforce-related data. In a scholarly work by Biswas et al. [8], RFC was found the best algorithm for gauging employee intelligence and predicting employees’ intention to quit. Almost similar to the objective of the present study where Generation Z engineers’ intention to remain in a company was tested, RFC was discovered as the optimal machine learning classifier.

5.2. Important Factors Influencing Employee Retention

Supervisor support, with two optimal subfeatures (SS1 and SS3), was the most important feature influencing employee retention. It was significant at a 0.001 p-value with the least standard error. The findings showed that Generation Z engineers are likely to remain in a company if their supervisors recognize their accomplishments and give full credit for their ideas. Generation Z engineers tend to seek advice from a higher position because they are willing to learn from their mistakes. Moreover, they are willing to help management with organizational tasks. The engineering field is a combination of technical and administrative, and not all members of Generation Z excel in both areas. Thus, Generation Z engineers address skill deficiency through supervisor support. Management should prioritize the professional support given by supervisors to their subordinates. A study recognized the importance of providing employees’ needs to nurture their careers [26]. Another study concluded that supervisor support increases the chances of employees remaining in a company [5]. These implications can be attributed to Generation Z engineers’ desire to gain early practical experience. Generation Z engineers are eager to learn from their supervisors; thus, they also yearn for validation. This stems from the supervisor’s image of guidance and reliability. Since Generation Z engineers are considered young, they look up to supervisors with proven credibility in the field. They intend to replicate their supervisor’s skills by adapting techniques. Eventually, they modify techniques to make their own versions that would further enhance the effectiveness and efficiency of their engineering tasks.
Company attachment was the second most important factor that Generation Z engineers should experience to ensure a high employee retention rate. Similar to the first important feature, it garnered a 0.001 p-value with the second least standard error. Interestingly, all CA subfeatures (CA1, CA2, and CA3) were found to be an optimal combination. This signified that all the investigated CA subfeatures strongly supported the relationship with employee retention. Generation Z engineers want to feel they have a family connection at work, are emotionally attached to the company, and have a sense of belongingness. This implied that Generation Z engineers treat work as their second home. Since Generation Z undergoes a whirlwind of emotions at home [2], their work arrangement is treated as a coping mechanism to relieve negative emotions. They value having workmates with whom they can present themselves without pretensions. They also value feeling at ease whenever they perform activities with workmates. Once Generation Z engineers start to look forward to seeing their workmates every workday, their attachment to the company will increase and eventually turn into long-term retention. A previous publication elaborated on Generation Z’s attitude toward working in a specific industry, and it identified that connections developed similar to those with family, friends, and companions are found to be the most vital work groups [2]. Furthermore, employees’ emotional reaction directly affects retention [5]. Aligning with the present study, CA includes the emotional attachment of Generation Z engineers to the company. Thus, Generation Z engineers with positive emotions brought by workmates would stay in a company, while those harboring negative feelings would increase the company’s turnover rate.
Third, Generation Z engineers require job satisfaction to remain in a company. Out of all five subfeatures of JS, only one JS subfeature (JS5) was found the most significant. Specifically, Generation Z engineers should feel happy with their jobs. This includes their feelings toward job responsibilities and the work environment. Job responsibilities from a contract should fit Generation Z’s actual work activities. Generation Z engineers experienced happiness signing a contract after seeing the list of tasks. Since it is inevitable to perform ad hoc tasks for an engineering job, management should ensure that ad hoc tasks are aligned with their employees’ interests. These job responsibilities make up the day-to-day activity of Generation Z engineers, and thus they hold a high value, impacting employee retention. If daily tasks appear tedious, the company will experience turnover. Otherwise, daily tasks that activate Generation Z’s happiness will result in retention. In addition, Generation Z engineers’ happiness is dependent on the work environment. The work environment refers to the overall structure of the organization that impacts employees’ well-being. One study shows that employee well-being affects the length of stay in a company [5]. Likewise, the present study perceived that young employees value their work environment as it improves their well-being. Eventually, Generation Z engineers feel more satisfied with their jobs and serve their employers for a long time due to the positive effects on their well-being. According to Goh and Lee [2], Generation Z employees greatly value being happy at work. Thus, their positive emotions should be prioritized by management. An organization must exert efforts to attract young engineering graduates by offering personal development and professional training programs that are both sufficient for job satisfaction.
Fourth, Generation Z engineers value contribution as it would make them stay in a company for a long time. Two contribution subfeatures (C2 and C3) were discovered as the most important and significant for employee retention. Generation Z engineers would remain loyal to a company if they believed their job was important for the company and could support the organization’s success. Previous research indicated that employee awards and promotions signify their top contribution to the company [16]. In another study, employees who failed to receive promotions and could not discern their importance in the organization left in less than five years [9]. The similarity between the present and previous findings was found because these studies investigated the decision-making process in the HR field. Furthermore, this career-driven behavior is aligned with engineers’ work attitudes of constantly identifying root causes and innovating systems. Since their primary responsibilities revolve around improving processes, they feel more validated every time their career advances. These system enhancements and product/service innovations demonstrate that Generation Z engineers are a valuable contribution to a company. Without their contributions, companies would have a hard time implementing a more efficient method. Generation Z engineers feel a sense of accomplishment at work because their contributions may help minimize expenses and maximize profits. Once they are aware of their worth, they will think of future improvements that they may contribute as they maintain employment in the company.
Moreover, Generation Z engineers prioritize emotional support in maintaining their loyalty to a company. Four (ES1, ES2, ES3, ES5) out of five subfeatures were the most substantial influencing employee retention. It was denoted that ES had the highest number of significant subfeatures compared to other features. This implied that ES subfeatures were good indicators concerning ER. These findings are associated with other significant features (CA and JS) wherein emotional support was an additional indicator impacting Generation Z’s intention to retain in a company. Generation Z engineers feel valued if management provides them with coping mechanisms, values their physical energy for work, inspires them to get up every workday, and recognizes their dedication and hard work. Their emotions are involved immensely in work-related scenarios. A good or bad emotional state affects their decision to stay or leave the company, respectively. Generation Z engineers achieve a good emotional state by maintaining healthy relationships with workmates. Otherwise, they feel stressed with uncooperative teammates and underappreciation from higher-ups. Moreover, Generation Z engineers’ physical health contributes to emotional support because it is a factor in work–life balance. Tasks are expected to be completed during the designated work hours because overtime violates the personal time of Generation Z. In return, Generation Z engineers are more likely to remain in a company once physical health is maintained because it is a subfeature of emotional support. Similar to the discussion of Goh and Lee [2], Generation Z is motivated to work hard as long as emotional support is provided by their employers. Employees’ positive emotions were a significant predictor of an ideal work environment because they reciprocate an optimistic work attitude [26]. This positive outcome is associated with employee retention aligned with the research objective.
Furthermore, shared value was another important feature affecting employee retention. Although SV yielded the least importance, its subfeatures were still significant. Surprisingly, all SV subfeatures (SV1, SV2, and SV3) were significantly related to employee retention. This implied that all indicators answered by Generation Z engineers were a significant predictor of SV that eventually impacted their retention behavior. Generation Z engineers believe it is necessary to share problems at work, have the same feelings toward job responsibilities, and have the same opinion about most things. Sharing of sentiments with colleagues and bosses is confirmed to significantly influence employee retention [5]. These findings also coincided with a past study where older generations gave less importance to work value similarities compared to Generation Z’s attitudes [2]. Another study supported that self-interest values should be reflected across the whole team [15]. Since Generation Z engineers tend to be more assertive, especially with their values, a company fostering SV encourages employee retention. Generation Z engineers uphold transparency and authenticity. They also believe that negative insights should be shared among the teammates to resolve unideal understandings. Even though a conversation may lead to arguments, Generation Z engineers believe that it is better to have a constructive argument than not having any conversation at all. They try to incorporate their ideas with people who have different opinions and find a middle ground. It was seen that Generation Z engineers work longer with like-minded people because they resonate well with them. Every time they transform people into having similar perceptions, they are more motivated to advocate their viewpoints by staying longer in a company.
All these aforementioned important subfeatures are emphasized on the left side of Figure 3. These features were ranked based on the order of priority. All of the values on the left side of the figure were significant at a p-value of less than 0.05. Since the study generated six significant features out of all the seven evaluated features, only six features are displayed. Meanwhile, the right side of Figure 3 displays unimportant subfeatures in each corresponding feature.
On one hand, servant leadership was found unimportant based on machine learning algorithms. Thus, SL had a negligible effect on the effectiveness of retaining Gen Z engineers and preventing productivity losses. Although SL consisted of seven subfeatures, none of them were found significantly associated with ER. In particular, Generation Z engineers did not feel a strong significance in ethical leadership. Servant leaders practice ethical leadership by maintaining fairness when collaborating with their subordinates. Although this is an ideal approach in a traditional setting, Generation Z engineers felt that it was not a direct determinant influencing their intention to remain in a company. Since Generation Z engineers believe in their capabilities as supported in the previous discussion, they believe more in their capability to impress a superior. In addition, they dislike full liberty. Generation Z engineers value guided support from their supervisors. According to the discussion about significant features, Generation Z engineers would exhibit loyalty to the company if they build close-knit professional and social relationships. However, it should be noted that excessive care is frowned upon by Generation Z engineers. There should be a boundary between professional and personal lives to maintain employees’ positive perceptions. SL encompassed leaders’ excessive attention to their subordinates, which did not have a significant impact on employee retention. These findings were aligned with Generation Z’s priority to maintain work–life balance and professional relationships. Moreover, it was previously mentioned that Generation Z engineers tend to have a strong personality. Thus, they did not prefer to be served all the time and disliked being spoon-fed.
Therefore, Generation Z engineers seemingly stay in a company due to professional support and not through SL’s personal support. Similarly, Ruiz-Palomino et al. [15] stated that SL only supports the psychological health of employees, including a decrease in their depression. Also, Yang et al. [26] concluded that SL supported the employees’ quality of family life. These results implied that SL would be a better feature indicator of Generation Z engineers’ emotional health and social support and not their intention to stay in a company. Generation Z engineers prefer to enhance their skills by exploring on their own while having a decent amount of guidance from their supervisors. Overall, working with servant leaders who would often spoon-feed employees and give excessive attention to employees would not incur a direct connection with company loyalty.

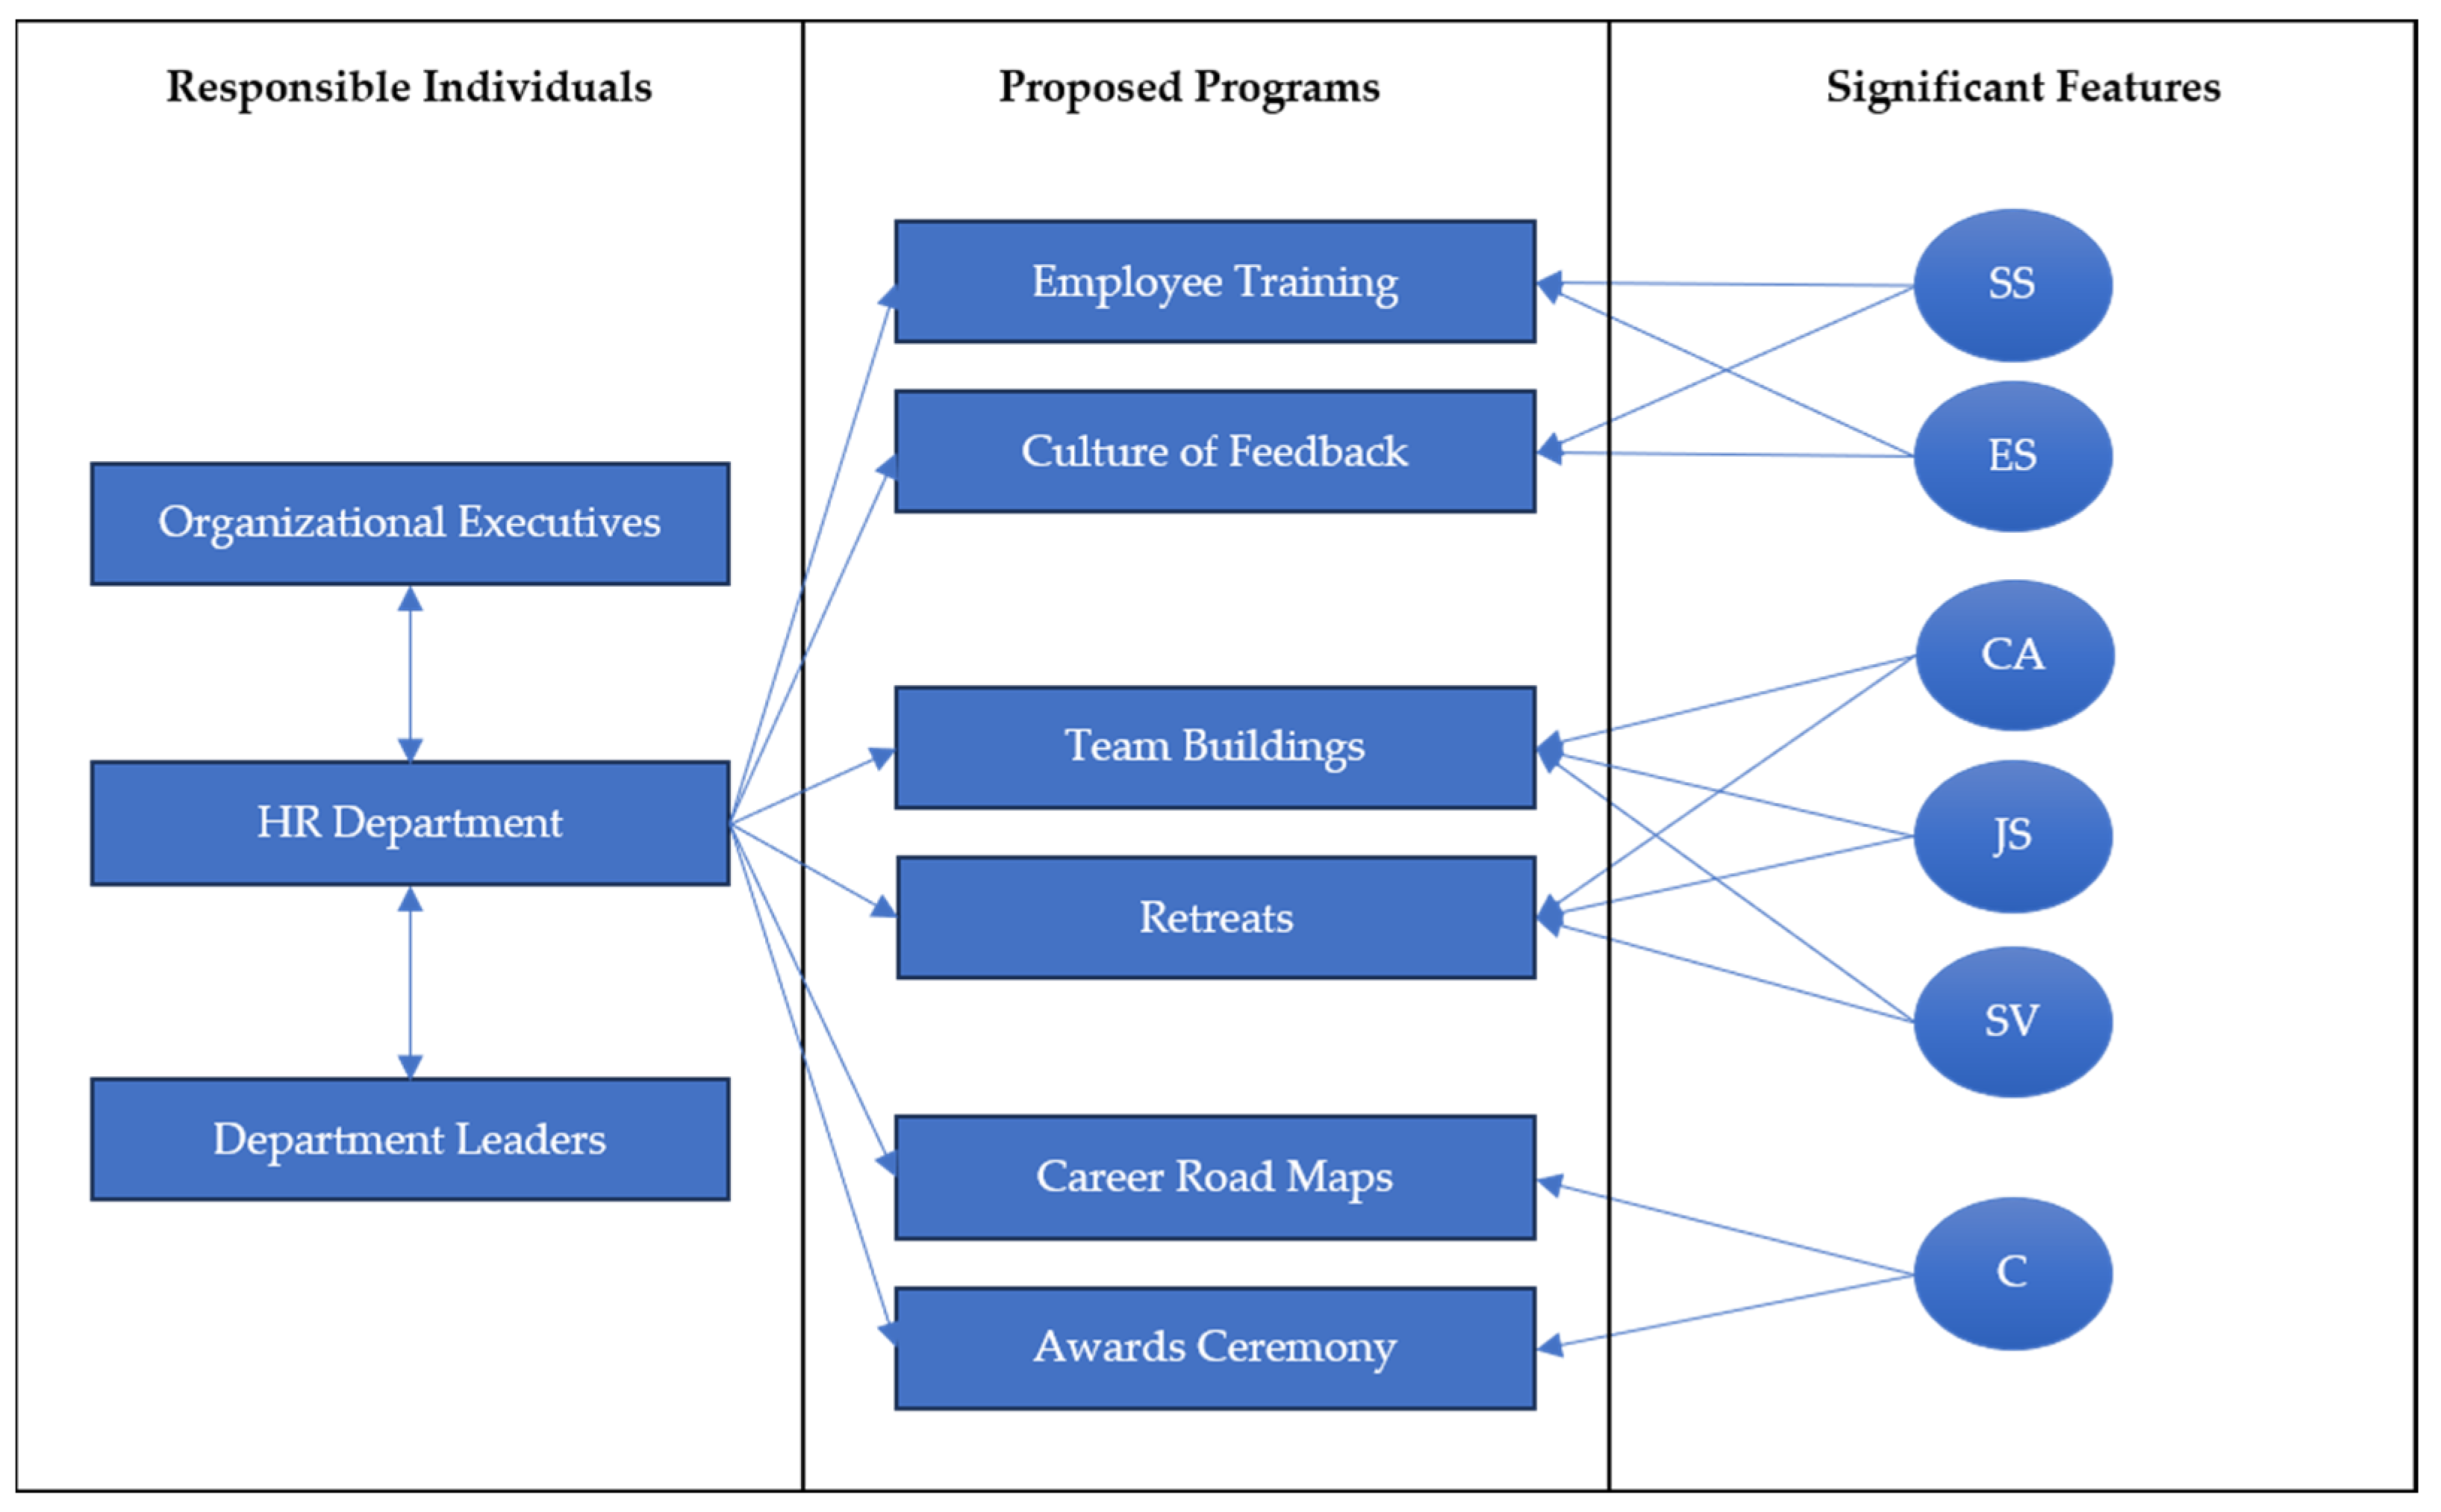
5.3. Practical Contributions

Through the presented findings, the researchers propose practical implications to help companies retain Generation Z engineers. SS and ES would be addressed by encouraging corporation stakeholders to prioritize leadership training. The HR department should organize the training program by selecting skilled leaders within the company and consultants outside the company premises. This managerial implication intends to merge ideas among in-house and third-party experts. It ensures that existing perceptions are enhanced and new observations are adopted, both aiding in retaining Generation Z engineers in a company. The researchers recommend a consecutive two-day full leadership training every quarter. Between the interval of the recently concluded and the subsequent training, Generation Z engineers must be given the option to share feedback anonymously about their supervisors. Feedback should include highlights, lowlights, and areas of improvement. This feedback should be used by the HR department to collaborate with trainers to further enhance the HR leadership training programs. It should also be communicated by the management to the corresponding supervisors to ensure that they are aware of their employees’ feedback.
The results inferred by CA, JS, and SV stimulate researchers to recommend organizing social events like team buildings and retreats. The HR department must spearhead these events on an annual basis. Team buildings hone Generation Z’s cooperation by participation in competitive games. It was recommended to incorporate more team-based games than individual games. The games must test employees’ critical thinking, creativity skills, resourcefulness, and physical capabilities. This one full day of team building would help Generation Z engineers harmonize with their teammates and bosses. In addition, retreat activities should be facilitated by life coaches and psychologists specializing in work–life balance and personal development. One goal of retreats is to know the inner desires and feelings of individuals, resulting in personal connection among all employees. Generation Z engineers would feel emotionally connected through retreats because everyone shares their honest opinions. They become vulnerable to others by discussing work and personal perceptions constructively, resulting in a stronger bond. Positive emotions, honesty, and camaraderie are fostered through socialization with teammates.
Finally, C could be addressed by catering to Generation Z’s diverse career stages. The whole organization, including the management, stakeholders, and HR department, should lay out detailed career progression for each role. The possible promotions from entry level to the executive level alongside the expected performance for each role must be presented to the respective employees. Since not everyone would be qualified for promotion, another strategy is to recognize the remarkable accomplishments of employees through an awards ceremony. This event acknowledges not just the promoted individuals but also the significant process improvements proposed by Generation Z engineers. These tailored retention strategies pay particular attention to the engagement and integration of Generation Z employees into company systems. They aid in creating a trustworthy and active working environment while preventing productivity losses and turnover costs.
All these aforementioned strategies, induced by significant features, are illustrated in Figure 4. The proposed programs should be spearheaded by the identified individuals and departments. Since organizational executives and department leaders hold a high position in a company, their expertise and resources would help the HR department carry out the proposed programs smoothly. They are considered the key to improving Generation Z engineers’ retention.

5.4. Theoretical Implications

The framework used in this study was not derived from existing theories as the researchers focused on developing a model with high accuracy using machine learning methods. Nevertheless, a comparison between the present framework and existing theories is further elaborated in this subsection. For instance, as an existing theory, the theory of organizational equilibrium emphasizes that an organization focuses on the broad sense more than the narrow sense [27]. This theory concentrated on the organization’s point of view, which contradicted the present study’s employee-related perception and objective. Although the theory of organizational equilibrium could not be considered for factor selection, its concept was aligned with the proposed programs under contribution. These programs were deemed organization initiatives that connect with employees in a broad sense. Almost similar to the point of view when using the theory of organizational equilibrium, resource dependence theory considers management perspectives before implementing employee-centered programs [28]. This previous study put more importance on internal management and available resources as they can further enhance employees’ skills [28]. On the contrary, the current study offered a wider perspective by considering more importance of employees’ views rather than management. Since employee retention caters to employees’ opinions, the researchers structured its framework by investigating the perceptions of employees.
Meanwhile, a past study utilized social exchange theory to assess job satisfaction, employee engagement, and the turnover rate of employees [29]. They discovered that employees intend to repay the good deeds of employers if they receive positive treatment [29]. Another study used equity theory where employees’ inputs and outputs in private and public employment were compared [30]. Researchers from the past study noted that employment challenges could be mitigated by applying the proposed initiatives out of the theory’s factors [30]. However, both social exchange theory and equity theory failed to recognize the commitment of employees without reciprocity and expected output. In the present study, findings highlighted intrinsic factors like SV, CA, C, and JS. These factors were found to be more sustainable compared to the reciprocity and expectation principles. On one hand, job embeddedness theory has similar factors to the current study, particularly referring to emotion- and social-related areas and not financial factors [31]. In the present study, financial factors were indirectly stated, and the proposed practical programs covered the financial needs of employees. The current study accentuated that financial factors could be evaluated as part of factor’s measure items and not as a sole factor contributing to employee retention. This posited that employees had other motivational factors apart from financial resources.
Based on the comparison of the current study and existing theories, this study’s employee retention factors provided a more comprehensive framework as they included both intrinsic and extrinsic features. Specifically, the combination of significant features (SS, ES, CA, JS, SV, C) had not yet been evaluated by the aforementioned existing theories. These features were overlooked by other researchers, but the current research gathered a high accuracy rate (90.10%). The findings signified that these factors influenced the long-term commitment of Generation Z to the company. Moreover, some studies would only focus on intrinsic features [29,30], while others would only concentrate on extrinsic organizational aspects [27,28]. Although one study examined both intrinsic and extrinsic, some factors became redundant, which undermined the significant findings [31]. Overall, the presented theory with its significant factors coupled with machine learning’s accuracy value proposed a good benchmark in identifying determinants affecting Generation Z engineers’ retention in the Philippines. Also, this could be used to further evaluate other industries’ retention factors and professions from other countries.

5.5. Limitations

This study acknowledges limitations that can be further improved by future scholars. First, the study did not categorize engineers based on the industry. For instance, they can be categorized as Generation Z civil engineers, industrial engineers, electrical engineers, and more. Since engineering is a broad field, future studies may generate varying accuracy rates for every engineering type. Nonetheless, the current study provided a comprehensive report of Generation Z engineers’ perceptions, which could be used as a standard. Second, future scholars could minimize the sampling error rate from 5% to 1% to cater to a broader range of participants that may potentially bring a more clustered finding. But then, the usage of 95% accuracy incurring a 5% error rate was supported by a previous study [21], and the purposive sampling technique successfully targeted the intended research participants. Another suggestion to increase the number of participants and reduce sampling error is to distribute the questionnaire to Generation Z engineers outside the Philippines. This may further enhance the result as Generation Z engineers from other countries might have different work perceptions. For instance, important factors for Philippine-based Generation Z engineers might be unimportant for other countries, and vice versa. Nevertheless, the present findings pioneered the assessment of primary factors affecting employee retention. Third, another machine learning algorithm, like clustering techniques, can be applied once the industries of Generation Z engineers are classified. The present study successfully achieved the methods stated in the objective, but the inclusion of clustering algorithms would yield a wider objective coverage. Lastly, the current feature subsets were considered low, but the number of participants from the actual survey and machine learning accuracy were high, which supported the current findings. Other researchers may increase the accuracy rate and discover other features affecting employee retention by adding more features and subfeatures. By addressing these limitations, future scholars could close the gap in the context of diversity and generalizability. These top two concerns would be addressed by determining more significant employee retention factors alongside developing a more robust machine learning model.

6. Conclusions

It is crucial to identify the factors contributing to employee retention because the retention rate signifies the overall satisfaction of employees. Some factors may or may not be significant depending on the generation and industry. This study focused on determining the important factors influencing Generation Z engineers’ intention to remain in a company. The researchers investigated seven features or factors (SV, CA, ES, C, SS, SL, and JS) affecting ER. They utilized machine learning algorithms, such as three feature selection techniques (investigated filter method’s permutation importance, wrapper method’s backward elimination, and embedded method’s LASSO) and two classifiers (SVC and RFC).
The pilot questionnaire was distributed to 50 Generation Z engineers and was later modified through reliability and validity tests. Afterward, a total of 412 Generation Z engineers voluntarily responded to the final questionnaire, consisting of 6 demographic questions and 39 5-point Likert scale questions. Among the three feature selection techniques, the wrapper method’s backward elimination performed the best with an accuracy value of 85.66%. Its value was further supported by regression, whereby all optimal features were found significant at a p-value less than or equal to 0.05 compared to other methods that incurred a p-value greater than 0.05. Additionally, the model produced an R-squared value of 0.82, inferring a strong positive relationship between optimal features and employee retention. To further check the accuracy of optimal features, RFC and SVC were applied. Between the two classifiers, RFC generated a better result. Specifically, RFC yielded 90.10% accuracy, 89.50% precision, 90.10% recall, and 88.90% F1-score. Thus, RFC was the best classifier to be combined with a feature selection method when analyzing important features influencing the retention of Generation Z engineers.
Following the presented results, SS, CA, JS, C, ES, and SV were important features influencing Generation Z engineer retention. These features were arranged based on their most significance, SS being the most important feature and SV the least. Despite the arrangement, all of them accurately defined ER for 90.10%. However, SL was discovered as an insignificant feature. Therefore, Generation Z engineers value factors such as trustworthy leaders, career development opportunities, meaningful work experiences, and collaborative environments. These findings align with broader generational trends but also reveal nuanced preferences and expectations unique to this generation, such as a preference for feedback and recognition. The full research findings provided practical insights for HR professionals, managers, and organizational leaders seeking to enhance employee retention strategies tailored to the specific needs of Generation Z engineers. The previous section elaborated on managerial implications focusing on leadership training programs, social events, and career progression. These recommendations aim to contribute to the long-term success and competitiveness of Generation Z engineers in organizations.
The present study also contributed to the application of machine learning in the existing literature database. There were limited studies utilizing feature selection and classifier techniques to identify factors influencing ER. Moreover, none of them utilized the aforementioned methods while considering Generation Z engineers’ perceptions. The research findings disclosed the most optimal feature selection method and classifier depending on the area of study. Thus, this study could be used by future scholars to further evaluate other workforce behaviors and discover other suitable machine learning algorithms.

Author Contributions

Conceptualization, P.Z.N.B.; methodology, P.Z.N.B. and M.M.L.C.; software, M.M.L.C.; validation, M.M.L.C.; formal analysis, P.Z.N.B. and M.M.L.C.; investigation, P.Z.N.B. and M.M.L.C.; resources, P.Z.N.B. and M.M.L.C.; data curation, P.Z.N.B. and M.M.L.C.; writing—original draft preparation, P.Z.N.B. and M.M.L.C.; writing—review and editing, P.Z.N.B. and M.M.L.C.; visualization, P.Z.N.B. and M.M.L.C.; supervision, M.M.L.C.; project administration, M.M.L.C.; funding acquisition, M.M.L.C. All authors have read and agreed to the published version of the manuscript.

Funding

This research was funded by Mapua University’s Directed Research for Innovation and Value Enhancement (DRIVE).

Institutional Review Board Statement

This study was approved by the Mapua University Research Ethics Committees (FM-RC-23-01-41).

Informed Consent Statement

Informed consent was obtained from all subjects involved in this study (FM-RC-23-02-41).

Data Availability Statement

The data presented in this study are available on request from the corresponding author.

Acknowledgments

The researchers would like to thank all the participants for their dedication in completing the questionnaire. They are also grateful for the support of their family members and friends.

Conflicts of Interest

The authors declare no conflicts of interest.

References

  1. Belmonte, Z.J.; Prasetyo, Y.T.; Benito, O.P.; Liao, J.-H.; Susanto, K.C.; Young, M.N.; Persada, S.F.; Nadlifatin, R. The Acceptance of Nuclear Energy as an Alternative Source of Energy among Generation Z in the Philippines: An Extended Theory of Planned Behavior Approach. Nucl. Eng. Technol. 2023, 55, 3054–3070. [Google Scholar] [CrossRef]
  2. Goh, E.; Lee, C. A Workforce to Be Reckoned with: The Emerging Pivotal Generation Z Hospitality Workforce. Int. J. Hosp. Manag. 2018, 73, 20–28. [Google Scholar] [CrossRef]
  3. Khalid, K.; Nawab, S. Employee Participation and Employee Retention in View of Compensation. SAGE Open 2018, 8, 215824401881006. [Google Scholar] [CrossRef]
  4. Lin, Y.; Cahigas, M.M. An Analysis of the Perspective Road Design Scheme around Zhangzhou Olympic Sports Center. Procedia Comput. Sci. 2024, 234, 1076–1086. [Google Scholar] [CrossRef]
  5. Chen, X.; Al Mamun, A.; Hoque, M.E.; Hirwani Wan Hussain, W.M.; Yang, Q. Work Design, Employee Well-Being, and Retention Intention: A Case Study of China’s Young Workforce. Heliyon 2023, 9, e15742. [Google Scholar] [CrossRef]
  6. Cahigas, M.M.; Ong, A.K.; Prasetyo, Y.T. Super Typhoon Rai’s Impacts on Siargao Tourism: Deciphering Tourists’ Revisit Intentions through Machine-Learning Algorithms. Sustainability 2023, 15, 8463. [Google Scholar] [CrossRef]
  7. Foithong, S.; Pinngern, O.; Attachoo, B. Feature Subset Selection Wrapper Based on Mutual Information and Rough Sets. Expert Syst. Appl. 2012, 39, 574–584. [Google Scholar] [CrossRef]
  8. Biswas, A.K.; Seethalakshmi, R.; Mariappan, P.; Bhattacharjee, D. An Ensemble Learning Model for Predicting the Intention to Quit among Employees Using Classification Algorithms. Decis. Anal. J. 2023, 9, 100335. [Google Scholar] [CrossRef]
  9. Shafie, M.R.; Khosravi, H.; Farhadpour, S.; Das, S.; Ahmed, I. A Cluster-Based Human Resources Analytics for Predicting Employee Turnover Using Optimized Artificial Neural Networks and Data Augmentation. Decis. Anal. J. 2024, 11, 100461. [Google Scholar] [CrossRef]
  10. Sreejith, S.; Khanna Nehemiah, H.; Kannan, A. A Clinical Decision Support System for Polycystic Ovarian Syndrome Using Red Deer Algorithm and Random Forest Classifier. Healthc. Anal. 2022, 2, 100102. [Google Scholar] [CrossRef]
  11. Singh, H.; Sidhu, J. Smart Detection System for Driver Distraction: Enhanced Support Vector Machine Classifier Using Analytical Hierarchy Process Technique. Procedia Comput. Sci. 2023, 218, 1650–1659. [Google Scholar] [CrossRef]
  12. Masruroh, F.; Surarso, B.; Warsito, B. A Decision Support System Based on Support Vector Machine for Employee Recruitment. AIP Conf. Proc. 2022, 2578, 060008. [Google Scholar] [CrossRef]
  13. Ong, A.K.; Prasetyo, Y.T.; Yuduang, N.; Nadlifatin, R.; Persada, S.F.; Robas, K.P.; Chuenyindee, T.; Buaphiban, T. Utilization of Random Forest Classifier and Artificial Neural Network for Predicting Factors Influencing the Perceived Usability of COVID-19 Contact Tracing “Morchana” in Thailand. Int. J. Environ. Res. Public Health 2022, 19, 7979. [Google Scholar] [CrossRef]
  14. Sin, L.Y.M.; Tse, A.C.B.; Yau, O.H.M.; Chow, R.P.M.; Lee, J.S.Y.; Lau, L.B.Y. Relationship Marketing Orientation: Scale Development and Cross-Cultural Validation. J. Bus. Res. 2005, 58, 185–194. [Google Scholar] [CrossRef]
  15. Ruiz-Palomino, P.; Yáñez-Araque, B.; Jiménez-Estévez, P.; Gutiérrez-Broncano, S. Can Servant Leadership Prevent Hotel Employee Depression during the COVID-19 Pandemic? A Mediating and Multigroup Analysis. Technol. Forecast. Soc. Change 2022, 174, 121192. [Google Scholar] [CrossRef]
  16. Cahigas, M.M.; Robielos, R.A.; Gumasing, M.J. Application of Multiple Criteria Decision-Making Methods in the Human Resource Recruitment Process. In Proceedings of the 11th Annual International Conference on Industrial Engineering and Operations Management; IEOM Society International: Singapore, 2021. [Google Scholar] [CrossRef]
  17. Marshall, G. The Purpose, Design and Administration of a Questionnaire for Data Collection. Radiography 2005, 11, 131–136. [Google Scholar] [CrossRef]
  18. Oktavia, R.; Irwandi; Rajibussalim; Mentari, M.; Mulia, I.S. Assessing the Validity and Reliability of Questionnaires on the Implementation of Indonesian Curriculum K-13 in STEM Education. J. Phys. Conf. Ser. 2018, 1088, 012014. [Google Scholar] [CrossRef]
  19. Longo, M.; Mura, M. The Effect of Intellectual Capital on Employees’ Satisfaction and Retention. Inf. Manag. 2011, 48, 278–287. [Google Scholar] [CrossRef]
  20. Dagooc, E.M. Job Portal Warns Employers to Brace for Gen Zs. Available online: https://www.philstar.com/the-freeman/cebu-business/2023/09/14/2296168/job-portal-warns-employers-brace-gen-zs (accessed on 6 January 2024).
  21. German, J.D.; Redi, A.A.; Prasetyo, Y.T.; Persada, S.F.; Ong, A.K.; Young, M.N.; Nadlifatin, R. Choosing a Package Carrier during COVID-19 Pandemic: An Integration of pro-Environmental Planned Behavior (PEPB) Theory and Service Quality (SERVQUAL). J. Clean. Prod. 2022, 346, 131123. [Google Scholar] [CrossRef]
  22. Rosero, D.; Vargas, D. Gender Communication Interplay Approach in the Development of Gender Friendly Farm Machinery in Selected Agricultural Agencies in the Philippines. SSRN Electron. J. 2021. [Google Scholar] [CrossRef]
  23. Cahigas, M.M.; Zulvia, F.E.; Ong, A.K.; Prasetyo, Y.T. A Comprehensive Analysis of Clustering Public Utility Bus Passenger’s Behavior during the COVID-19 Pandemic: Utilization of Machine Learning with Metaheuristic Algorithm. Sustainability 2023, 15, 7410. [Google Scholar] [CrossRef]
  24. Maldonado, S.; Weber, R. A Wrapper Method for Feature Selection Using Support Vector Machines. Inf. Sci. 2009, 179, 2208–2217. [Google Scholar] [CrossRef]
  25. Smith, K.N.; Gayles, J.G. “Girl Power”: Gendered Academic and Workplace Experiences of College Women in Engineering. Soc. Sci. 2018, 7, 11. [Google Scholar] [CrossRef]
  26. Yang, Z.; Zhang, H.; Kwan, H.K.; Chen, S. Crossover Effects of Servant Leadership and Job Social Support on Employee Spouses: The Mediating Role of Employee Organization-Based Self-Esteem. J. Bus. Ethics 2015, 147, 595–604. [Google Scholar] [CrossRef]
  27. Takatsu, S. Organizational Equilibrium under Uncertainty. Kybernetes 1984, 13, 87–92. [Google Scholar] [CrossRef]
  28. Singh, P.J.; Power, D.; Chuong, S.C. A Resource Dependence Theory Perspective of ISO 9000 in Managing Organizational Environment. J. Oper. Manag. 2010, 29, 49–64. [Google Scholar] [CrossRef]
  29. Huang, Y.-H.; Lee, J.; McFadden, A.C.; Murphy, L.A.; Robertson, M.M.; Cheung, J.H.; Zohar, D. Beyond Safety Outcomes: An Investigation of the Impact of Safety Climate on Job Satisfaction, Employee Engagement and Turnover Using Social Exchange Theory as the Theoretical Framework. Appl. Ergon. 2016, 55, 248–257. [Google Scholar] [CrossRef]
  30. Ryan, J.C. Old Knowledge for New Impacts: Equity Theory and Workforce Nationalization. J. Bus. Res. 2016, 69, 1587–1592. [Google Scholar] [CrossRef]
  31. Zhang, M.; Fried, D.D.; Griffeth, R.W. A Review of Job Embeddedness: Conceptual, Measurement Issues, and Directions for Future Research. Hum. Resour. Manag. Rev. 2012, 22, 220–231. [Google Scholar] [CrossRef]
Figure 1. Framework of the features.
Sustainability 16 05207 g001
Figure 2. Comparison of machine learning classifiers.
Sustainability 16 05207 g002
Figure 3. Levels of priority.
Sustainability 16 05207 g003
Figure 4. Suggested employee retention strategies.
Sustainability 16 05207 g004
Table 1. Five-point Likert scale questionnaire.
FeatureCodeQuestionReference(s)
Shared ValueSV1We all share problems at work.[14]
SV2We share the same feelings towards job responsibilities.
SV3We share the same opinion about most things.
Company AttachmentCA1I feel like a part of a family in my company.[8,14]
CA2I feel emotionally attached to my company.
CA3I feel a strong sense of belonging in my company.
Emotional SupportES1The management provides me with coping mechanisms whenever I feel emotionally drained from work.[5,15]
ES2The management values the physical energy I use throughout the workday.
ES3The management makes me feel energized when I get up in the morning and have to face another day on the job.
ES4The management helps me whenever I feel burned out from my work.
ES5The management supports my dedication, especially when I feel I am working too hard on my job.
ContributionC1I think that I make a unique contribution to the organization.[19]
C2I think that my job is important for this organization.
C3I think that I am a valuable instrument to aid this organization’s success.
Supervisor SupportSS1My supervisor often praises employees for a job well done.[8,16]
SS2My supervisor tends to appreciate the employees’ hard work.
SS3My supervisor gives employees full credit for their ideas.
SS4My supervisor stands up for their employees.
SS5My supervisor provides resources that help me perform at my best.
Servant LeadershipSL1My leader prioritizes ethical principles at work.[2,15]
SL2My leader puts my best interest ahead of his/her own.
SL3My leader gives me the freedom to handle difficult situations in the way that I feel is best.
SL4My leader emphasizes the importance of giving feedback.
SL5My leader lends a helping hand and a listening ear whenever I have a personal problem.
SL6My leader makes my career development a priority.
SL7My leader can tell if something work-related is going wrong.
Job SatisfactionJS1I am satisfied with my job responsibilities.[19]
JS2I am satisfied with my promotion opportunities.
JS3I am content with the recognition I get for doing good work
JS4I am happy with my level of input in my work.
JS5I feel happy to have this job.
Employee RetentionER1I love working for this company.[5,8]
ER2If I received an attractive job offer from another company, I would not accept it.
ER3If I could start over again, I would still choose to work for my current company.
ER4If it were up to me, I would definitely continue working for this company for the next five years.
ER5If I wanted to pursue another job or function, I would first explore the possibilities within this company.
ER6I see myself having a future within this company.
ER7My work within this company brings me stability.
ER8I plan to remain with this company as long as it maintains the current environment.
Table 2. Respondents’ demographic profile (N = 412).
CharacteristicItemNumber of
Respondents
Percentage of
Respondents
GenderMale29672%
Female11628%
Age224511%
2311327%
249824%
256516%
269122%
Highest Educational AttainmentBachelor’s Degree39897%
Master’s Degree143%
Employment StatusProbationary21753%
Regular17342%
Contractual/Fixed Term225%
Years in the IndustryLess than a year32880%
1–2 years6315%
2–3 years133%
More than 3 years82%
Average Monthly
Income
≤PHP 25,00022956%
PHP 26,000–PHP 35,00016239%
PHP 36,000–PHP 50,000215%
Table 3. SVC pseudocode.
StepDescription
1Initialize the data from the best feature selection method.
2Set up the training and testing size.
3Apply SVC parameters, such as Kernel and C.
4Train and test the data using SVC parameters.
5Generate a confusion matrix.
6Identify accuracy, precision, recall, and F1-score.
Table 4. RFC Pseudocode.
StepDescription
1Initialize the data from the best feature selection method.
2Set up the training and testing size.
3Apply RFC parameters, such as n_estimators, split attribute, and random state.
4Split the trees iteratively until all parameters are met.
5Train and test the data using RFC parameters.
6Extract the predicted data based on multiple trees.
7Develop the final RF model
8Generate a confusion matrix.
9Identify accuracy, precision, recall, and F1-score.
Table 5. Optimal feature subsets.
Feature Selection
(Class: Employee
Retention)
Optimal NumberOptimal FeaturesAccuracy
Filter Method: Permutation Importance6SV3, ES1, SS5, JS1, JS2, JS3, JS582.50%
Wrapper Method: Backward Elimination15SV1, SV2, SV3, CA1, CA2, CA3, ES1, ES2, ES3, ES5, C2, C3, SS1, SS3, JS585.66%
Embedded Method: LASSO15CA1, CA3, ES1, C1, SS2, SS4, SL1, SL2, SL3, SL4, SL5, SL6, SL7, JS1, JS582.77%
Table 6. Coefficients for features.
FeaturesRegular Regression p-ValuesRegular Regression Standard ErrorRegression after Wrapper p-ValuesRegression after Wrapper Standard Error
SV0.0040.130.0310.13
CA0.0000.130.0010.10
ES0.8350.090.0160.08
C0.2260.170.0090.13
SS0.3000.160.0010.09
SL0.0490.19N/AN/A
JS0.7660.200.0030.07
Table 7. SVC and RFC results.
Run No.SVCRFC
AccuracyPrecisionRecallF1-ScoreAccuracyPrecisionRecallF1-Score
173.00%77.00%73.00%75.00%87.00%90.00%87.00%87.00%
287.00%84.00%87.00%84.00%97.00%93.00%97.00%94.00%
367.00%66.00%67.00%64.00%83.00%78.00%83.00%80.00%
497.00%98.00%97.00%97.00%93.00%94.00%93.00%93.00%
590.00%91.00%90.00%89.00%87.00%90.00%87.00%87.00%
677.00%74.00%77.00%75.00%91.00%88.00%91.00%88.00%
790.00%92.00%90.00%89.00%93.00%94.00%93.00%92.00%
887.00%87.00%87.00%87.00%93.00%94.00%93.00%93.00%
973.00%82.00%73.00%75.00%87.00%88.00%87.00%87.00%
1083.00%80.00%83.00%81.00%90.00%86.00%90.00%88.00%
Average82.40%83.10%82.40%81.60%90.10%89.50%90.10%88.90%
Disclaimer/Publisher’s Note: The statements, opinions and data contained in all publications are solely those of the individual author(s) and contributor(s) and not of MDPI and/or the editor(s). MDPI and/or the editor(s) disclaim responsibility for any injury to people or property resulting from any ideas, methods, instructions or products referred to in the content.

