
Impact of Climate Change on International Tourism Evidence from Baltic Sea Countries


Abstract
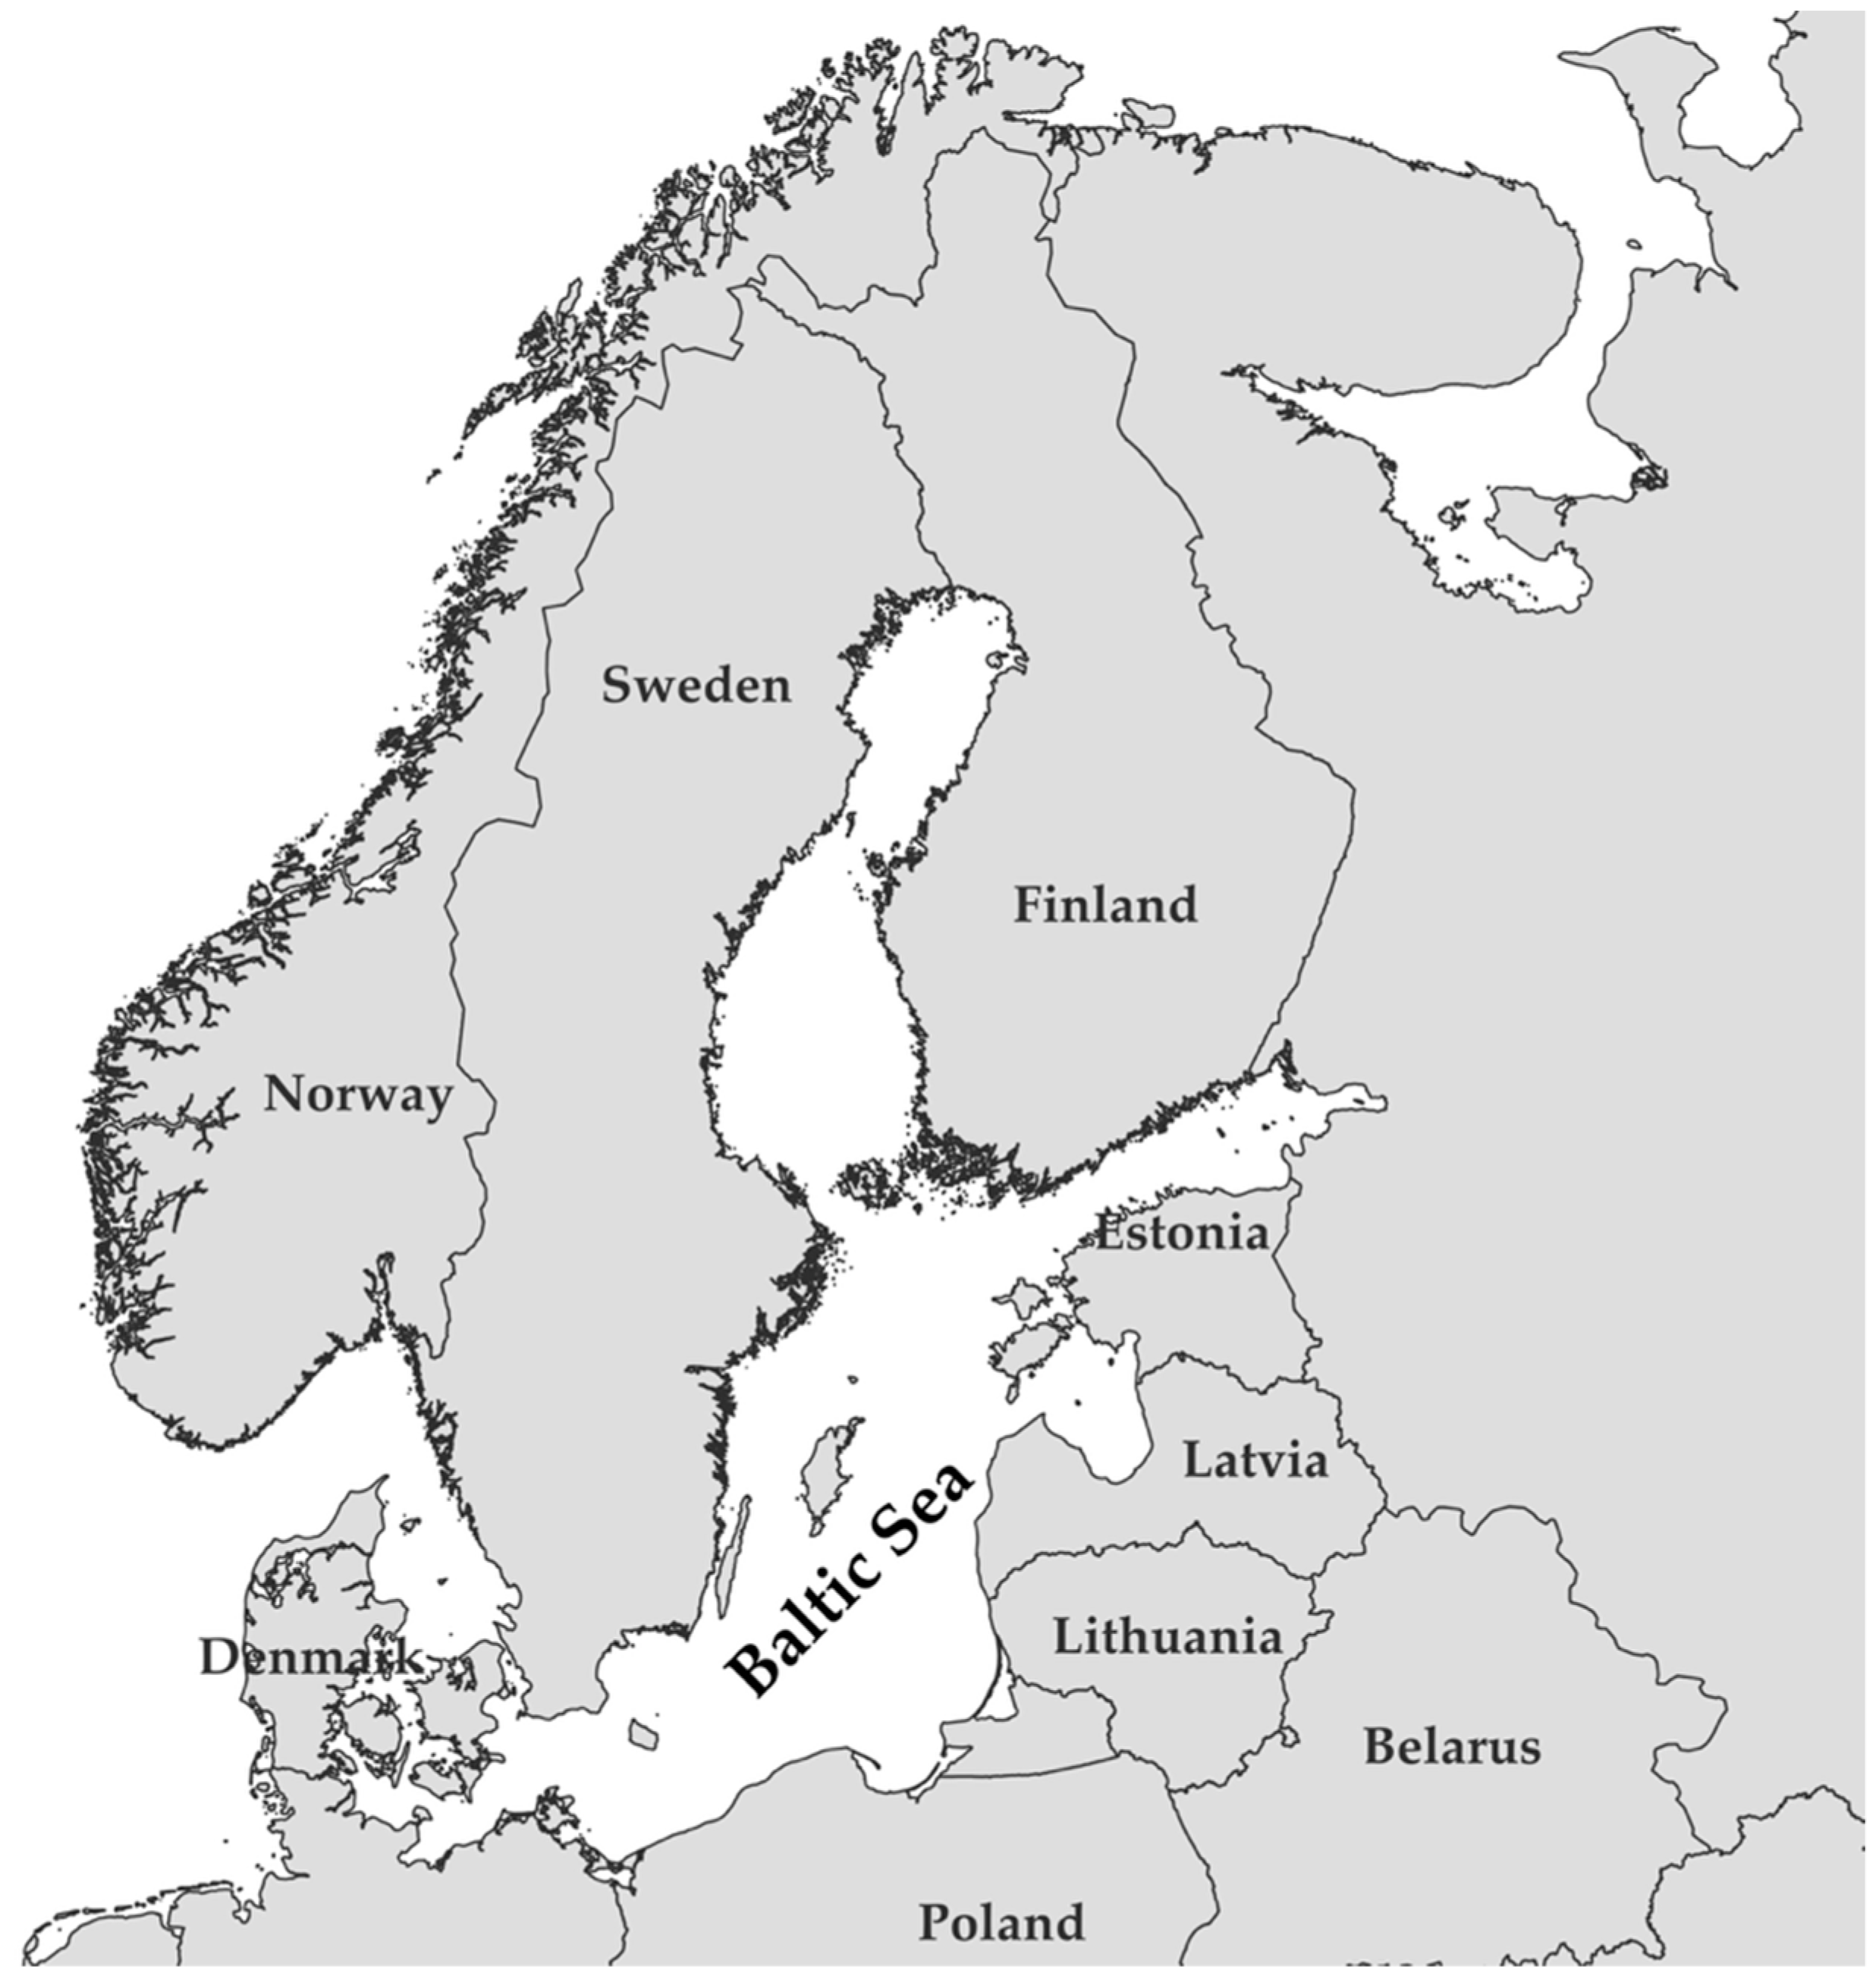
1. Introduction
2. Materials and Methods
3. A Comparative Discourse on the Sustainable Tourism Industry in the Baltic Sea Countries
4. Socio-Economic Impacts of Climate Change on Tourism
5. Literature Review
6. Empirical Analysis
6.1. Model Specification
6.2. Model Analysis
6.3. Discussion
7. Conclusions
Author Contributions
Funding
Institutional Review Board Statement
Informed Consent Statement
Data Availability Statement
Conflicts of Interest
References
- Kyrylov, Y.; Hranovska, V.; Boiko, V.; Kwilinski, A.; Boiko, L. International Tourism Development in the Context of Increasing Globalization Risks: On the Example of Ukraine’s Integration into the Global Tourism Industry. J. Risk Financ. Manag. 2020, 13, 303. [Google Scholar] [CrossRef]
- Ady, S.U.; Moslehpour, M.; Van, D.N.; Johari, S.M.; Thuy, V.V.T.; Hieu, V.M. The Impact of Sustainable Tourism Growth on the Economic Development: Evidence from a Developing Economy. Cuad. Econ. 2022, 45, 130–139. Available online: https://cude.es/submit-a-manuscript/index.php/CUDE/article/view/235/207 (accessed on 2 June 2024).
- WT & TC. Available online: https://assets-global.website-files.com/6329bc97af73223b575983ac/660fb6a499e83cb298ba50f4_EIR2024-Global-Factsheet-Launch-030424.pdf (accessed on 3 June 2024).
- WT&TC. Travel and Tourism Economic Impact; APEC: Singapore, 2023; Available online: https://assets-global.website-files.com/6329bc97af73223b575983ac/647df24b7c4bf560880560f9_EIR2023-APEC.pdf (accessed on 3 June 2024).
- Chen, X.M.; Sharma, A.; Liu, H. The Impact of Climate Change on Environmental Sustainability and Human Mortality. Environments 2023, 10, 165. [Google Scholar] [CrossRef]
- UN. Available online: https://www.un.org/en/climatechange/what-is-climate-change (accessed on 6 June 2024).
- Benhamed, A.; Osman, Y.; Ben-Salha, O.; Jaidi, Z. Unveiling the Spatial Effects of Climate Change on Economic Growth: International Evidence. Sustainability 2023, 15, 8197. [Google Scholar] [CrossRef]
- Carbon Brief. Available online: https://www.carbonbrief.org/global-co2-emissions-have-been-flat-for-a-decade-new-data-reveals/ (accessed on 6 June 2024).
- Song, J.; Tong, G.; Chao, J.; Chung, J.; Zhang, M.; Lin, W.; Zhang, T.; Bentler, P.M.; Zhu, W. Data driven pathway analysis and forecast of global warming and sea level rise. Sci. Rep. 2023, 13, 5536. [Google Scholar] [CrossRef]
- Keessen, A. What states can do to adapt to climate change in the Baltic Sea. Mar. Pol. 2018, 98, 295–300. [Google Scholar] [CrossRef]
- HELCOM. Climate Change in the Baltic Sea; HELCOM: Helsinki, Finland, 2021; Available online: https://helcom.fi/wp-content/uploads/2021/09/Baltic-Sea-Climate-Change-Fact-Sheet-2021.pdf (accessed on 12 March 2024).
- Central Statistical Bureau of Latvia. Tourism in Latvia; Central Statistical Bureau of Latvia: Riga, Latvia, 2023. Available online: https://admin.stat.gov.lv/system/files/publication/2023-08/Nr_20_Turisms_Latvija_2023_%2823_00%29_LV_EN.pdf (accessed on 28 March 2024).
- Krarup, L.O.; Dahl, K.; Peltonen, H.; Kramer, I.; Kule, L. Sectoral Impact Assessments for the Baltic Sea Region. In Coastline Reports; EUCC: Rostock, Germany, 2013; Volume 21, Available online: https://baltcoastinline.databases.eucc-d.de/files/documents/00001149_CR_21_Baltadapt.pdf#page=995 (accessed on 22 February 2024).
- UNWTO. Key Tourism Statistics. Available online: https://www.unwto.org/tourism-statistics/key-tourism-statistics. (accessed on 2 February 2024).
- Kim, D.; Purdue, R.R. The influence of image on destination attractiveness. J. Travel Tour. Mark. 2011, 28, 225–239. [Google Scholar] [CrossRef]
- Falk, M. Impact of weather conditions on tourism demand in the peak summer season over the last 50years. Tour. Manag. Persp. 2014, 9, 24–35. [Google Scholar] [CrossRef]
- Available online: https://eng.lsm.lv/article/economy/economy/09.01.2024-lithuania-might-buy-airbaltic-shares-in-future.a538256/ (accessed on 28 February 2024).
- Poz.23. Countries, 2020—Administrative Units—Dataset GEOPORTAL OF THE EUROPEAN COMMISSION (EUROSTAT). Available online: https://ec.europa.eu/eurostat/web/gisco/geodata/administrative-units/countries (accessed on 13 June 2024).
- Nilsson, J.H.; Gossling, S. Tourist Responses to Extreme Environmental Events: The case of Baltic Sea Algal Blooms. Tour. Plan. Dev. 2013, 10, 32–44. [Google Scholar] [CrossRef]
- Available online: https://www.wwfbaltic.org/newsroom/eutrophication/blue-green-algae-plague-the-baltic-sea-wwf-experts-explain-how-eutrophication-can-be-controlled (accessed on 1 June 2024).
- Available online: https://www.raceforthebaltic.com/baltic-sea#:~:text=The%20Baltic%20Sea%20is%20one,mortality%2C%20and%20poor%20water%20transparency (accessed on 1 June 2024).
- Storch, O. Second Assessment of Climate Change for the Baltic Sea Basin; Springer Int. Pub. AG: Cham, Switzerland, 2015; Available online: http://www.hvonstorch.de/klima/books/BACC/BACC-2.pdf (accessed on 1 March 2024).
- Bergström, L.; Ahtiainen, H.; Avellan, L.; Estlander, S.; Haapaniemi, J.; Haldin, J.; Hoikkala, L.; Ruiz, M.; Rowe, O.; Zweifel, U. HELCOM State-of-the-Baltic-Sea Second-HELCOM-Holistic-Assessment-2011-2016. 2018. Available online: https://stateofthebalticsea.helcom.fi/wp-content/uploads/2018/07/HELCOM_State-of-the-Baltic-Sea_Second-HELCOM-holistic-assessment-2011-2016.pdf (accessed on 1 June 2024).
- Wijaya, N.; Furqan, A. Coastal Tourism and Climate-Related Disasters in an Archipelago Country of Indonesia: Tourists’ Perspective. Procedia Eng. 2018, 212, 535–542. [Google Scholar] [CrossRef]
- Rosselló, J.; Becken, S.; Santana-Gallego, M. The effects of natural disasters on international tourism: A global analysis. Tour. Manag. 2020, 79, 104080. [Google Scholar] [CrossRef]
- Available online: https://vstt.lrv.lt/en/lithuanian-protected-areas/national-parks/ (accessed on 1 March 2024).
- UNESCO. Convention on Wetlands of International Importance Especially as Waterfowl Habitat; UNESCO: Paris, France, 1994; Available online: https://www.ramsar.org/sites/default/files/documents/library/scan_certified_e.pdf (accessed on 2 February 2024).
- European Commission. The Habitats Directive. Council Directive 92/43/EEC. 1992. Available online: https://eur-lex.europa.eu/eli/dir/1992/43/2013-07-01 (accessed on 4 February 2024).
- Kropinova, E.G. Tourism and the Sustainable Development of the Baltic Sea Region; Springer: Berlin/Heidelberg, Germany, 2020. [Google Scholar] [CrossRef]
- Available online: https://en.unesco.org/biosphere/eu-na/west-estonian-archipelago (accessed on 1 June 2024).
- Pilving, T.; Kull, T.; Suskevics, M.; Viira, A.H. The tourism partnership life cycle in Estonia: Striving towards sustainable multicultural rural tourism collaboration. Tour. Manag. Perspect. 2019, 31, 219–230. [Google Scholar] [CrossRef]
- Available online: https://assets-global.website-files.com/6329bc97af73223b575983ac/647f18df48bc9034b771baae_EIR2023-Latvia.pdf (accessed on 6 June 2024).
- Available online: https://transport.ec.europa.eu/transport-themes/infrastructure-and-investment/trans-european-transport-network-ten-t_en (accessed on 15 March 2024).
- Atstaja, D. The Way of Developing Greening Economy: Case Study–Latvia. J. Tour. Serv. 2012, 3, 39–54. Available online: https://www.jots.cz/public/site/images/kljucnikov/Full_Issue_4.pdf (accessed on 1 June 2024).
- Atstaja, D. The Main Aspects of Safety of Rural Tourism in Latvia. J. Tour. Serv. 2013, 4, 6–20. Available online: https://www.jots.cz/public/site/images/kljucnikov/Full_Issue_5-6.pdf (accessed on 1 June 2024).
- Tambovceva, T.; Atstaja, D.; Tereshina, M.; Uvarova, I.; Livina, A. Sustainability Challenges and Drivers of Cross-Border Greenway Tourism in Rural Areas. Sustainability 2020, 12, 5927. [Google Scholar] [CrossRef]
- Lukjanova, J.; Odinokova, T. Innovations as the main challenge in the field of health tourism in Latvia. Access Sci. Bus. Innov. Digit. Econ. 2020, 1, 39–52. [Google Scholar] [CrossRef]
- Parzych, K. The Polish Baltic Coast as a Tourist Area in the Light of Tourism Indicators. Stud. Perieget. 2020, 32, 71–87. [Google Scholar] [CrossRef]
- Available online: https://goodtimeczarter.pl/en/region-en/petla-zulawska.html (accessed on 24 February 2024).
- Available online: https://www.visitfinland.fi/en/liiketoiminnan-kehittaminen/vastuullinen-matkailu/sustainable-travel-finland (accessed on 24 February 2024).
- Available online: https://assets-global.website-files.com/6329bc97af73223b575983ac/647f1c26b048cde4cae402fc_EIR2023-Sweden.pdf (accessed on 1 March 2024).
- Wall, G.; Mathieson, A. Tourism: Change, Impacts, and Opportunities; Pearson & Prentice Hall: New York, NY, USA, 2006. [Google Scholar]
- Rezvani, S.M.H.S.; de Almeida, N.M.; Falcão, M.J. Climate Adaptation Measures for Enhancing Urban Resilience. Buildings 2023, 13, 2163. [Google Scholar] [CrossRef]
- Scott, D.; Lemieux, C. Weather and Climate Information for Tourism. Procedia Environ. Sci. 2010, 1, 146–183. [Google Scholar] [CrossRef]
- Cárdenas-García, P.J.; Brida, J.G.; Segarra, V. Modeling the link between tourism and economic development: Evidence from homogeneous panels of countries. Humanit. Soc. Sci. Commun. 2024, 11, 308. [Google Scholar] [CrossRef]
- Nguyen, Q.H. Impact of Investment in Tourism Infrastructure Development on Attracting International Visitors: A Nonlinear Panel ARDL Approach Using Vietnam’s Data. Economies 2021, 9, 131. [Google Scholar] [CrossRef]
- Almeida, F. Exploring the Impact of Socio-Demographic Dimensions in Choosing a City Touristic Destination. J. Tour. Serv. 2020, 3, 120–142. [Google Scholar]
- Sharma, C. Good and bad effects of corruption and political uncertainty on tourism-growth linkage: World-wide evidence. Tour. Econ. 2023, 13548166231209365. [Google Scholar] [CrossRef]
- Eurostat. Panorama on Tourism. 2008. Available online: https://ec.europa.eu/eurostat/documents/3217494/5692191/KS-30-08-550-EN.PDF.pdf/9c3151bd-5b4c-450d-9238-01be0903def2?t=1414773567000 (accessed on 1 March 2024).
- Bagus, C.; BrahmaSari, I.A.; Suryani, T. The effects of local culture on tourism products and domestic tourist satisfaction in tourism destinations: In Gianyar Regency, in the province of Bali. Arch. Bus. Res. 2020, 7, 233–243. [Google Scholar] [CrossRef]
- Koenig, N.L.; Bischoff, E.E. Seasonality Research: State of the Art. Int. J. Tour. Res. 2005, 7, 201–219. [Google Scholar] [CrossRef]
- Alshuqaiqi, A.; Omar, S.I. Causes and Implication of Seasonality in Tourism. J. Adv. Res. Dyn. Control. Syst. 2019, 11, 1480–1486. Available online: https://jardcs.org/abstract.php?id=662 (accessed on 2 June 2024).
- Penney, J. Adapting the Climate Change: Challenges for Niagara. 2012. Available online: https://npca.ca/images/uploads/common/Adapting_to_Climate_Change_-_Chalenges_for_Niagara.pdf (accessed on 12 March 2024).
- Barrelas, J.; Silva, A.; de Brito, J.; Tadeu, A. Effects of Climate Change on Rendered Facades: Expected Degradation in a Progressively Warmer and Drier Climate. A Review Based on Literature. Buildings 2023, 13, 352. [Google Scholar] [CrossRef]
- Hall, C.M.; Higham, J. Tourism, Recreation and Climate Change, Bristol, Blue; Channel View Publications, Ltd.: Bristol, UK, 2005. [Google Scholar] [CrossRef]
- Steiger, R.; Posch, E.; Tappeiner, G.; Walde, J. Seasonality matters: Simulating the impacts of climate change on winter tourism demand. Curr. Issues Tour. 2022, 26, 2777–2793. [Google Scholar] [CrossRef]
- Available online: https://ec.europa.eu/eurostat/statistics-explained/index.php?title=Seasonality_in_tourism_demand (accessed on 2 June 2024).
- Tanrisever, C.; Pamukçu, H.; Baydeniz, E. Climate Change in Tourism: Understanding the Impacts and Opportunities for Sustainability. In Future Tourism Trends Volume 1: Tourism in the Changing World; Emerald Publishing Limited: Leeds, UK, 2024; Volume 1, pp. 33–45. [Google Scholar] [CrossRef]
- Atasoy, M.; Atasoy, F.G. The Impact of Climate Change on Tourism: A Causality Analysis. Turk. J. Agric.-Food Sci. Technol. 2020, 8, 515–519. [Google Scholar] [CrossRef]
- Matzarakis, A. Climate Change and Adaptation at Regional and Local Scale. In Bridging Tourism Theory and Practice; Emerald Group Publishing Limited: Leeds, UK, 2010; Volume 3, pp. 237–259. [Google Scholar] [CrossRef]
- Kumar, V.; Ranjan, D.; Verma, K. Global climate change: The loop between cause and impact. In Global Climate Change; Elsevier: Amsterdam, The Netherlands, 2021; pp. 187–211. [Google Scholar] [CrossRef]
- Shepherd, T.G.; Sobel, A.H. Localness in Climate Change. Comp. Stud. South Asia Afr. Middle East 2020, 40, 7–16. [Google Scholar] [CrossRef]
- de Freitas, C. The Climate–Tourism Relationship and its Relevance to Climate Change Impact Assessment. In Tourism, Recreation and Climate Change; Channel View Publications: Bristol, UK, 2005; pp. 29–43. [Google Scholar] [CrossRef]
- Lopes, H.S.; Remoaldo, P.C.; Ribeiro, V.; Martín-Vide, J. Perceptions of human thermal comfort in an urban tourism destination–A case study of Porto (Portugal). Build. Environ. 2021, 205, 108246. [Google Scholar] [CrossRef]
- Moreno, A.; Amelung, B. Climate change and tourist comfort on Europe’s beaches in summer: A reassessment. Coast. Manag. 2009, 37, 550–568. [Google Scholar] [CrossRef]
- Hewer, M.J. Determining the Effect of Extreme Weather Events on Human Participation in Recreation and Tourism: A Case Study of the Toronto Zoo. Atmosphere 2020, 11, 99. [Google Scholar] [CrossRef]
- de Freitas, C. Tourism Climatology: Evaluating Environmental Information for Decision Making and Business Planning in the Recreation and Tourism Sector. Int. J. Biometeorol. 2003, 48, 45–54. [Google Scholar] [CrossRef]
- Lin, C.H.; Wang, W.C. Impacts of climate change knowledge on coastal tourists’ destination decision-making and revisit intentions. J. Hosp. Tour. Manag. 2023, 56, 322–335. [Google Scholar] [CrossRef]
- Seetanah, B.; Fauzel, S. Investigating the impact of climate change in the tourism sector: Evidence from a sample of island economies. Tour. Rev. 2018, 74, 194–203. Available online: https://www.emerald.com/insight/content/doi/10.1108/TR-12-2017-0204/full/html (accessed on 1 March 2024). [CrossRef]
- Liu, T.M. The influence of climate change on tourism demand in Taiwan national parks. Tour. Manag. Perspect. 2016, 20, 269–275. [Google Scholar] [CrossRef]
- Nunes, P.A.L.D.; Cai, M.; Ferrise, R.; Moriondo, M.; Bindi, M. An Econometric Analysis of Climate Change Impacts on Tourism Flows: An Empirical Evidence from the Region of Tuscany, Italy. Int. J. Ecol. Econ. Stat. 2013, 31, 1–20. Available online: https://hdl.handle.net/10863/5636 (accessed on 5 March 2024).
- Ngxongo, N. The impact of climate change on visitor destination selection: A case study of the Central Drakensberg Region in KwaZulu-Natal. Jamba-J. Disaster Risk Stud. 2021, 13, 10. [Google Scholar] [CrossRef]
- Day, J.; Chin, N.; Sydnor, S.; Widhalm, M.; Shah, K.U.; Dorworth, L. Implications of climate change for tourism and outdoor recreation: An Indiana, USA, case study. Clim. Chang. 2021, 169, 29. [Google Scholar] [CrossRef]
- Cevik, S.; Ghazanchyan, M. Perfect Storm: Climate Change and Tourism. IMF Work. Paper No.243, 2020. Available online: https://www.imf.org/en/Publications/WP/Issues/2020/11/13/Perfect-Storm-Climate-Change-and-Tourism-49828 (accessed on 1 March 2024).
- Matei, N.A.; Garcia, D.L.; Dosio, A.; Batista, F.S.; Ribeiro, R.B.; Ciscar, J.C.M. Regional Impact of Climate Change on European Tourism Demand; Publications Office of the European Union: Luxembourg, 2023. [Google Scholar] [CrossRef]
- Xiong, N.; Bingteng, S.; Jiang, L.; Cui, H. Spatial effects of climate change on tourism development in China: An analysis of tourism value chains. Front. Environ. Sci. 2022, 10, 952395. [Google Scholar] [CrossRef]
- Du, D. The impact of climate change on tourism economies of Greece, Spain, and Turkey. Environ. Econ. Policy Stud. 2017, 20, 431–449. [Google Scholar] [CrossRef]
- Susanto, J.; Zheng, X.; Liu, Y.; Wang, C. The impacts of climate variables and climate-related extreme events on island country’s tourism: Evidence from Indonesia. J. Clean. Prod. 2020, 276, 124204. [Google Scholar] [CrossRef]
- Pintassilgo, P.; Rosselló, J.; Santana, M.G.; Valle, E. The economic dimension of climate change impacts on tourism: The case of Portugal. Tour. Econ. 2016, 22, 685–698. [Google Scholar] [CrossRef]
- Haldane, E.; MacDonald, L.; Kressin, N.; Furlotte, Z.; Kınay, P.; Guild, R.; Wang, X. Sustainable Tourism in the Face of Climate Change: An Overview of Prince Edward Island. Sustainability 2023, 15, 4463. [Google Scholar] [CrossRef]
- Tsilogianni, D.; Cartalis, C.; Philippopoulos, K. Climate Change Impact Assessment on Ski Tourism in Greece: Case Study of the Parnassos Ski Resort. Climate 2023, 11, 140. [Google Scholar] [CrossRef]
- Mariani, G.M.; Scalise, D. Climate Change and Winter Tourism: Evidence from Italy. Bank of Italy Occasional Paper 743, 2022. Available online: https://www.bancaditalia.it/pubblicazioni/qef/2022-0743/QEF_743_22.pdf (accessed on 1 June 2024).
- Gebbisa, M.B.; Yasin, A.S.; Bacsi, Z. Impacts of Weather Variability on the International Tourism Receipts—Evidence from Ethiopia (1995–2019). Tour. Hosp. 2024, 5, 416–438. [Google Scholar] [CrossRef]
- Fauzel, S. The impact of changes in temperature and precipitation on tourists arrival: An ARDL analysis for the case of a SIDS. Curr. Issues Tour. 2019, 23, 2353–2359. [Google Scholar] [CrossRef]
- Regev, S.T.; Palatnik, R.R. Implications of Climate Change on Outdoor Recreation: The Case of National Parks in Israel. Earth 2022, 3, 345–362. [Google Scholar] [CrossRef]
- Sharma, C. Greenhouse gas effects on international tourism: A panel quantile evidence. Anatolia 2021, 33, 266–269. [Google Scholar] [CrossRef]
- Pesaran, M.H.; Smith, R. Estimating long-run relationships from dynamic heterogeneous panels. J. Econom. 1995, 68, 79–113. [Google Scholar] [CrossRef]
- Hsiao, C. Panel data analysis—Advantages and challenges. TEST 2007, 16, 1–22. [Google Scholar] [CrossRef]
- Ghouse, G.; Khan, S.A.; Rehman, A.U.; Bhatti, M.I. ARDL as an Elixir Approach to Cure for Spurious Regression in Nonstationary Time Series. Mathematics 2021, 9, 2839. [Google Scholar] [CrossRef]
- Shin, Y.; Pesaran, M.H. An Autoregressive Distributed Lag Modelling Approach to Cointegration Analysis. In Econometrics and Economic Theory in the 20th Century: The Ragnar Frish Centennial Symposium; Strom, S., Ed.; Cambridge University Press: Cambridge, UK, 1999; pp. 371–413. [Google Scholar] [CrossRef]
- Available online: https://climateknowledgeportal.worldbank.org/ (accessed on 3 February 2024).
- Available online: https://databank.worldbank.org/source/world-development-indicators (accessed on 3 February 2024).
- Huang, G. Missing data filling method based on linear interpolation and lightgbm. J. Phys. Conf. Ser. 2021, 1754, 012187. Available online: https://iopscience.iop.org/article/10.1088/1742-6596/1754/1/012187/pdf (accessed on 3 June 2024). [CrossRef]
- Pesaran, M.H.; Shin, Y.; Smith, R.J. Bounds testing approaches to the analysis of level relationships. J. Appl. Econom. 2001, 16, 289–326. [Google Scholar] [CrossRef]
- Levin, A.; Lin, C.F.; Chu, C.J. Unit Root Tests in Panel Data: Asymptotic and Finite-Sample Properties. J. Econ. 2002, 108, 1–24. [Google Scholar] [CrossRef]
- Pesaran, M.H.; Shin, Y.; Smith, R.P. Pooled Mean Group Estimation of Dynamic Heterogeneous Panels. J. Am. Stat. Assoc. 1999, 94, 621–634. [Google Scholar] [CrossRef]

| Variable | Description | Data Source |
|---|---|---|
| TREXP | Total travel inbound expenditure | UNWTO [14] |
| NIGHTS | Total number of overnight visitors | UNWTO [14] |
| TEMP | Annual average mean surface air temperature | WB Climate Change Portal [91] |
| PRECIP | Observed annual precipitation | WB Climate Change Portal [91] |
| GDP | Real gross domestic product | WDI [92] |
| GE | Government efficiency | WDI [92] |
| Variable | Coefficient | p-Value | Integration Order |
|---|---|---|---|
| TREXP | −5.10525 | 0.0000 | I (0) |
| NIGHTS | −4.37856 | 0.0000 | I (0) |
| TEMP | −6.47143 | 0.0000 | I (0) |
| PRECIP | −8.54873 | 0.0000 | I (0) |
| D(GDP) | −6.56078 | 0.0000 | I (1) |
| D(GE) | −8.89864 | 0.0000 | I (1) |
| Variable | Coefficient | St. Error | t-Statistic | p-Value |
|---|---|---|---|---|
| Long-Run Equation | ||||
| TEMP | −4.778106 | 1.315453 | −3.632290 | 0.0008 |
| PRECIP | −2.762470 | 0.847825 | −3.258303 | 0.0024 |
| GDP | 1.932705 | 0.344660 | 5.607564 | 0.0000 |
| GE | 0.374879 | 0.076302 | 4.913093 | 0.0000 |
| Short-Run VECM Equation | ||||
| COINTEQ01 | −0.287761 | 0.087555 | −3.286648 | 0.0022 |
| D (PRECIP (−1)) | −0.901406 | 0.398224 | −2.263565 | 0.0294 |
| D (GDP (−1)) | 4.601182 | 1.609756 | 2.858311 | 0.0069 |
| c | −4.655081 | 1.437900 | −3.237417 | 0.0025 |
| Variable | Coefficient | St. Error | t-Statistic | p-Value |
|---|---|---|---|---|
| Long-Run Equation | ||||
| TEMP | −2.704264 | 0.445164 | −6.074760 | 0.0000 |
| PRECIP | −3.184411 | 0.970859 | −3.279993 | 0.0022 |
| GDP | 0.301423 | 0.473165 | 0.637035 | 0.5279 |
| GE | −0.176013 | 0.313197 | −0.561986 | 0.5774 |
| Short-Run VECM Equation | ||||
| COINTEQ01 | −0.524044 | 0.098985 | −5.294164 | 0.0000 |
| D (PRECIP (−1)) | −1.157355 | 0.236478 | 2.904011 | 0.0061 |
| D (TEMP (−1)) | −0.872829 | 0.438947 | −1.988461 | 0.0540 |
| D (NIGHTS (−1)) | 0.686736 | 0.325261 | −3.558233 | 0.0010 |
| c | 13.24427 | 2.391906 | 5.537119 | 0.0000 |
Disclaimer/Publisher’s Note: The statements, opinions and data contained in all publications are solely those of the individual author(s) and contributor(s) and not of MDPI and/or the editor(s). MDPI and/or the editor(s) disclaim responsibility for any injury to people or property resulting from any ideas, methods, instructions or products referred to in the content. |
© 2024 by the authors. Licensee MDPI, Basel, Switzerland. This article is an open access article distributed under the terms and conditions of the Creative Commons Attribution (CC BY) license (https://creativecommons.org/licenses/by/4.0/).
Share and Cite
Atstāja, D.; Cakrani, E. Impact of Climate Change on International Tourism Evidence from Baltic Sea Countries. Sustainability 2024, 16, 5203. https://doi.org/10.3390/su16125203
Atstāja D, Cakrani E. Impact of Climate Change on International Tourism Evidence from Baltic Sea Countries. Sustainability. 2024; 16(12):5203. https://doi.org/10.3390/su16125203
Chicago/Turabian StyleAtstāja, Dzintra, and Edmira Cakrani. 2024. "Impact of Climate Change on International Tourism Evidence from Baltic Sea Countries" Sustainability 16, no. 12: 5203. https://doi.org/10.3390/su16125203
APA StyleAtstāja, D., & Cakrani, E. (2024). Impact of Climate Change on International Tourism Evidence from Baltic Sea Countries. Sustainability, 16(12), 5203. https://doi.org/10.3390/su16125203