Abstract
Identification of contamination sources and delineation of plumes in the geological environment stand as pivotal elements in reconstructing the conceptual site model (CSM) and devising remediation strategies tailored to specific physicochemical traits. This study endeavors to showcase the capabilities of a 3D digital interface, seamlessly integrating multi-source data, to elucidate site-specific contamination dynamics and steer the implementation of remediation strategies harmoniously aligned with the ethos of remediation geology. In a site historically marred by chlorinated solvent contamination, the digitization of stratigraphic, piezometric, chemical, and membrane interface probe (MIP) data underpins geomodeling endeavors and yields a meticulously crafted, data-driven CSM. The hydrogeochemical and hydrogeophysical data were interpolated to build a volumetric, digital 3D model illustrating data-driven elements. The comprehensive 3D clone adeptly delineates secondary contamination sources and renders visible the contamination plume within a georeferenced framework, mirroring the nuanced interplay of stratigraphic nuances and groundwater path. A data-centric approach to modeling facilitates the design of the first hydraulic virtual barrier leveraging groundwater circulation well (GCW) technology, its geometry finely attuned to intercept the contamination plume originating from source dissolution and aligning with preferential groundwater flow trajectories. Conventional hydrochemical monitoring and multilevel sampling substantiate the discernible reduction in chlorinated solvent concentrations across various depths within the aquifer horizon, affirming the efficacy of GCWs in their virtual barrier configuration. The findings highlight the effectiveness and limited groundwater consumption of the virtual barrier compared to the on-site pump-and-stock system. This research underscores the potency of a multi-faceted evidence-driven puzzle in conceptualizing contamination mechanisms within the geological milieu, thereby fostering the application of cutting-edge, effective, and sustainable remediation strategies.
1. Introduction
1.1. Understanding and Addressing Groundwater Contamination by Chlorinated Solvents
Groundwater contamination from hazardous chemicals, such as chlorinated solvents, is a global issue [1,2,3]. These compounds, belonging to the class of dense non-aqueous phase liquids (DNAPL), have been widely employed in different industrial sectors and represent the most persistent pollutants in groundwater worldwide [3,4,5]. Among these, perchloroethylene (PCE) and trichloroethylene (TCE) are well-known [6]. It is essential to address these pollutants to protect and remediate groundwater resources [7,8]. The removal and remediation of chlorinated solvents in polluted sites reflect a comprehensive understanding of the dynamic and temporal evolution of chlorinated compound contamination. In the literature, different stages of contamination source aging and the architecture of DNAPL with hydrogeological context have been recognized [6,9]. The release of DNAPL is followed by the vertical migration of the spilled product into a separate phase [5,8,9]. In the unsaturated domain, processes such as volatilization and adsorption redistribute contaminants among environmental matrices [2]. Within the saturated zone, the dissolution of DNAPL generates a contamination plume that can extend for several kilometers in the direction of groundwater flow through coarse granular formations [3]. Processes of adsorption and diffusion on fine-grained horizons can give rise to persistent plumes through back-diffusion mechanisms, resulting in the slow release of pollutants into the aquifer even after the depletion of the primary source [10,11,12]. Moreover, the well-known chain of reactions of biological reductive dechlorination (BRD) can transform PCE, sequentially generating TCE, dichloroethylene (DCE) isomers, primarily cis-DCE, vinyl chloride (VC), and finally ethene [13,14]. The above depicts an exceedingly complex physicochemical framework. Nonetheless, comprehending contaminant behavior and distribution in subsurface environments is paramount for effective site remediation [7,8]. It is important to note that the choice of remediation strategy depends on site-specific conditions, regulatory requirements, and the goals of remediation [9].
1.2. Reimagining Contaminated Site Characterization: Innovative Approaches to Advanced Conceptual Modeling
Site investigations represent the first step in reconstructing the framework and scenario of contamination, guiding subsequent remediation efforts [15,16]. The traditional characterization techniques typically involve stratigraphic drilling, the installation of piezometers, soil and groundwater sampling for chemical analysis, and a suite of hydrogeological investigations for hydraulic parameterization of aquifers [17,18,19]. Although these investigations are indispensable, they are often costly and time-consuming and frequently struggle to capture the complex architecture of contaminant redistribution in the subsurface with adequate resolution [20]. On the other hand, direct-push (DP) investigation methods rapidly acquire information about the subsurface, increasing data density and offering valuable insights into contamination status, migration pathways, and hydraulic and physical parameters [21,22,23,24]. Electrical conductivity (EC) measurements from DP methods physically parameterize geological structures [25,26,27], while the hydraulic profiling tool (HPT) can be integrated with hydraulic tomography for high-resolution site characterization [28,29,30]. The membrane interface probe (MIP) is extensively employed for detecting pollutants in the subsurface and understanding the distribution of contaminants in environmental matrices [22]. The MIP typically features three detectors. The flame ionization detector (FID) detects the presence of both aliphatic and aromatic hydrocarbons. The photoionization detector (PID) measures aromatic hydrocarbons, while the dry electrolytic conductivity detector (DELCD) is sensitive to organohalogen compounds [31,32]. These methods are essential for high-resolution site characterization (HRSC) and the reconstruction of an accurate conceptual site model (CSM) [33]. Traditional and DP information mentioned above can potentially converge into 3D digital conceptual models for the joint management of multi-source data that effectively guides decision-making, selection, and sizing of a tailored remediation strategy based on contamination dynamics in the site-specific hydrogeochemical and physical context [34,35,36,37].
1.3. Remediation Strategies for Groundwater Contaminated with DNAPL: A Spotlight on GCW
Various chemical–physical technologies are employed at contaminated sites to address groundwater pollution caused by DNAPLs and chlorinated solvents, including pump-and-treat (P&T), air sparging (AS), and permeable reactive barriers (PRB) [38,39,40,41,42,43,44]. Additionally, bioremediation approaches can be adopted to enhance pollutant degradation by microbial consortia [13,45]. A combination of these approaches may be necessary for effective and sustainable chlorinated solvent remediation [45,46,47,48]. Among the array of available technologies, groundwater circulation wells (GCWs) emerge as a promising solution for aquifer remediation [49,50,51,52]. These multiscreened vertical wells pump groundwater from a screened section. The extracted water is treated above ground and reintroduced into a different screened section of the aquifer after treatment [53,54,55]. The simultaneous extraction/re-injection of water into different screened sections of the same vertical well results in the formation of an ellipsoidal groundwater recirculation cell and the development of vertical hydraulic gradients [56,57,58,59]. Groundwater circulation systems have proven to be highly effective remediation technologies in addressing persistent contaminants in the source area, as extensively demonstrated in the literature [60,61,62,63]. GCWs accelerate the mobilization of DNAPLs trapped in zones of reduced permeability and dead-end pores [34]. Additionally, GCWs can be utilized to deliver reagents and/or nutrients into aquifers, thereby enhancing in situ bioremediation and creating in situ hydro-bio-geo-chemical reactors for the degradation of chlorinated compounds [64,65,66,67]. These systems eliminate the water consumption associated with traditional physical extraction wells and mitigate the development of groundwater table depression cones associated with P&T/pump-and-stock (P&S) systems [68].
1.4. Case Study: The First Virtual Hydraulic Barrier for Intercepting a Contamination Plume
The present research focuses on a decommissioned thermoelectric power plant located in northern Italy. Since 2005, the presence of a chlorinated hydrocarbon plume has been detected in the aquifer, although a contamination source has not been delineated by previous characterization investigations. A P&S groundwater pumping system, consisting of 15 wells with a total pumping rate of 6.8 m3/d, has been progressively installed on-site to reduce the contamination load in the aquifer (Figure S1 of Supplementary Materials). However, the remediation efforts have not led to an improvement in groundwater quality. In this context, some investigations using MIP technology have been carried out to delineate the contamination sources. The integrated management of hydrogeological, chemical, and physical information is the adopted approach to guide environmental remediation with an interactive, multisource CSM. The reconstruction of contamination dynamics and the need to reduce concentrations within the site in line with remediation objectives orientate an intervention strategy with a hydraulic barrier consisting of GCWs. To the best of our knowledge, there is no other hydraulic barrier consisting of GCWs, thus making it an absolutely innovative and unique technique for plume interception. Very few studies in the literature just hypothesize the use of hydraulic barriers consisting of recirculation systems for controlling salt intrusion in coastal areas [69,70] and plume containment. Since this technology is generally used to address contamination sources, in an unusual hydraulic containment application, we would like to define it as a virtual hydraulic barrier. The results obtained from the debut of the virtual hydraulic barrier in the first months of operation will be carefully described and discussed. The findings aim to highlight the potential of a geology-driven hydrogeochemical–physical digital clone in (i) delineating the contamination source and contamination mechanisms, (ii) reconstructing contamination migration patterns in groundwater, and (iii) guiding the deployment of an innovative remediation strategy tailored to hydrochemical characteristics and remediation objectives. Furthermore, this research has the goal of evaluating the performance and sustainability of the intervention of virtual barriers with GCWs compared to traditional P&T/P&S. The research findings emphasize the pivotal role of remediation geology in the management and remediation of contaminated sites. Besides, the outcomes paint a picture of a cutting-edge hydraulic containment approach using the virtual hydraulic barrier, outperforming the traditional P&T/P&S methods. This study aims to demonstrate the effectiveness of this multi-source approach in conceptualizing the distribution and migration of plumes originating from contamination sources. This is possible due to the spatial integration of multi-source evidence within the geological framework. This three-dimensional geospatial and hydrogeophysical approach serves as a guide for the implementation of a targeted remediation strategy aligned with the principles of remediation geology.
2. Materials and Methods
2.1. Reconstruction of Conceptual Site Model
The selection and application of appropriate remediation technologies rely on environmental characterization activities and the development of a CSM. For the reconstruction of the CSM information from geological boreholes, groundwater monitoring points, high-resolution characterization investigations, water chemistry analyses, and hydrogeological tests were digitized and archived within a 4D geodatabase (considering the time dimension). All data concerning geological characterization, including stratigraphic information deduced from 113 geological boreholes with depths of approximately 12 m from ground level, have been stored in the data archive. Boreholes were drilled using the continuous core sampling technique and some of these bores were used to place permanent open-pipe piezometers and wells. The construction scheme for 124 wells and piezometers, varying in depth on average from 4.3 to 10.3 m, has been stored in the geodatabase. Sub-surface water circulation was reconstructed using piezometric measurements collected between 2006 and 2013 from 75 monitoring wells intercepting different aquifer horizons. 16 Lefranc-type permeability tests [71], 11 stepwise pumping tests [72], and 1 long-term pumping test [73] were performed on the groundwater monitoring network to hydraulically parametrize aquifer deposits and to understand and vectorize groundwater circulation patterns. Between 2005 and 2023, chemical analyses were conducted on water samples collected from 109 monitoring stations to track the evolution of water quality status and the vertical stratification of contamination in various aquifer bodies. Further investigations were performed using the MIP technique for the screening of 53 vertical profiles with depths ranging between about 2 and 18 m. The MIP investigations have been conducted from the inner to outer portions of the industrial site. The EC profiling obtained through MIP was employed to physically parameterize subsurface deposits and enhance the geological framework, whereas the acquisition of FID, PID, and DELCD signals aimed to discretely identify the presence of contaminants at specific depths [31]. The spatial envelope of the DELCD signal in a geographic information system (GIS) environment had the purpose of identifying the potential secondary sources of contamination. Supplementary characterization information is derived from the drilling completed for the installation of 3 groundwater circulation wells (IEG-GCW®, IEG Technologie GmbH, Gruibingen, Germany), 6 multi-level piezometers (IEG-MLSW®), and 12 integrative piezometers for groundwater monitoring. Geological-stratigraphic, hydrochemical, and engineering data merge simultaneously into the relational geodatabase. A multi-criteria CSM was developed, simultaneously integrating geological, hydrochemical, and direct push information to serve as a data-driven decision support system. Geological-hydrochemical data such as elevation of geological boundaries, MIP data, TCE concentration values, and groundwater level measurements were interpolated and modeled to reconstruct the hydrogeological structure of the subsurface stratigraphic layers and depict the groundwater circulation pattern and contamination scenario in the geological framework. The modeling was performed with RockWorks 17 software (RockWare Geoscientific Software Consulting Training, Golden, CO, USA), which employs modeling methods in a GIS to generate a volumetric and voxel-based three-dimensional model of the subsurface. The hydrogeochemical and direct push data were interpolated using the inverse distance weighting (IDW) algorithm to build a solid, digital 3D model, illustrating data-driven elements overlapping multi-source information. 3D geomodeling operations with the IDW generally employed a weighted exponent of 6.5 and a neighboring set of 8 points. Additional geoprocessing options, such as a high-fidelity filter to preserve control point values and smoothing surfaces, were also employed. The mesh of the 3D model is built up of elementary components such as voxels and encompasses the entire plant, extending vertically from −16.5 m to 2.6 m a.s.l. The voxel grid is discretized at 1 m in the X and Y axes and 0.1 m in the Z direction, for a total of 426 nodes for X, 556 nodes for Y and 191 nodes for Z. Geomodeling has the purpose of generating a 3D hydrogeophysical clone capturing site-specific hydrogeochemistry, identifying the contamination source within the stratigraphic context, defining groundwater flow patterns and preferred pathways of flow and transport guided by the hydraulic gradient and subsurface stratigraphic discontinuities. All this information is combined into a 3D geo-referenced interface, building a digital CSM that allows the information to be extrapolated both for tailoring the design of the remediation technology and monitoring the performance of remedial measures. The multi-source, data-driven interface strongly influenced and oriented the design of a groundwater circulation barrier with GCWs. The goal was to intercept and treat the plume migrating towards the site.
2.2. Remediation Strategy Configuration
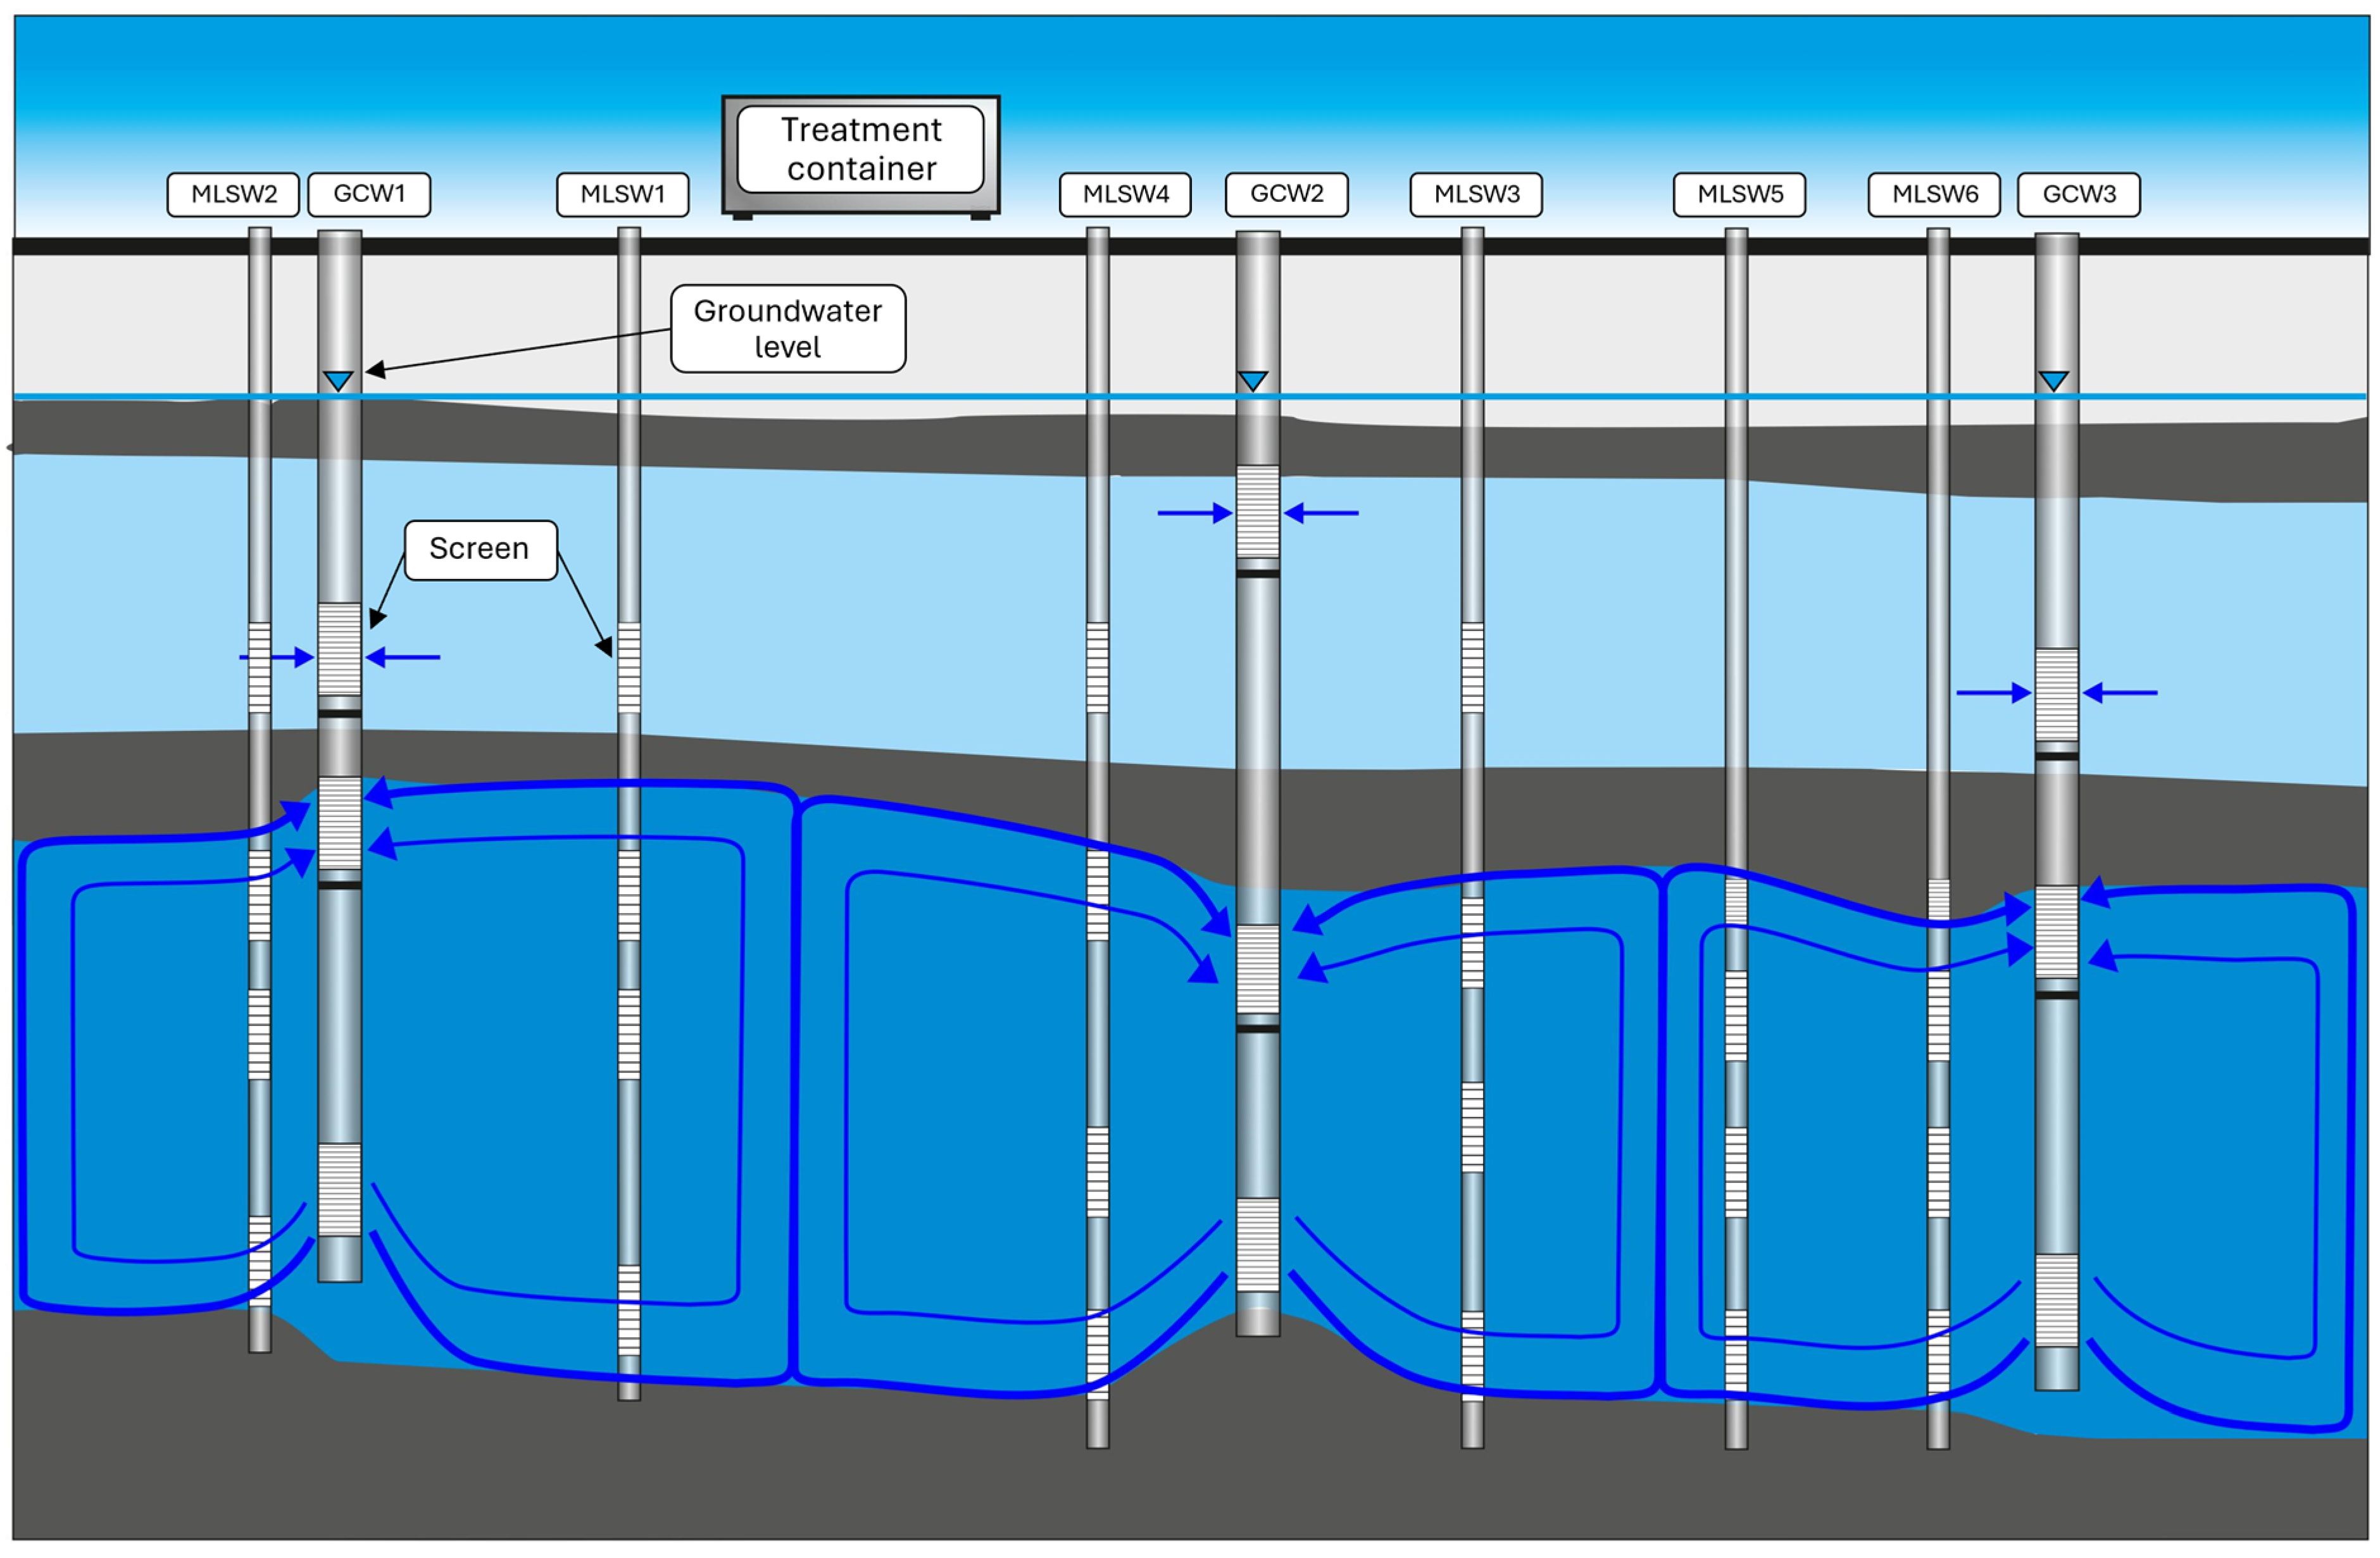
The remediation system consists of a virtual hydraulic barrier that aims to intercept and bar the contamination plume following the direction of preferential groundwater flow. Three GCWs operated by simultaneously pumping and re-injecting water from distinct hydraulically isolated screened sections. This process had the purpose of creating an overlapping recirculation cell to capture all water passing through the aquifer section intercepted by the virtual barrier. The pumped water was conveyed to a treatment plant for contaminant concentration reduction before being re-injected into the aquifer. The re-injection of treated water into the aquifer is essential for establishing the vertical pressure gradient that drives the creation of the recirculation cell, which performs the hydraulic barrage. If a portion of the treated water were to be used for other purposes, the hydraulic balance of the system would be compromised, reducing the vertical pressure gradient and consequently the radius of influence of the recirculation cell. The dimensioning and configuration of the IEG-GCW virtual barrier reflected the hydrogeochemical conditions of the site. The barrier was placed along a profile covering an aquifer section of approximately 100 m, with wells spaced approximately 30 m apart and approximately 12 m deep. Each GCW presented three screened sections at 3–4 m, 6–7 m, and 10–11 m to fit the site-specific geological conditions. The configuration of the screens had the dual purpose of pumping/re-injecting water into the contaminated aquifer levels, impacting the contamination plume, and mobilizing pollutants potentially adsorbed or absorbed on the fine layers. Six multilevel sampling wells (MLSW) were installed within the radius of influence of the recirculation wells to track the remedial impacts in the treatment area. These were equipped with four different sampling horizons, between approximatively 4–5 m, 6.5–7.5 m, 8–9 m, and 11–12 m, to monitor the TCE concentration trends over time after the remediation plant startup. The sampling levels of the MLSWs were redistributed across the entire saturated thickness of the aquifer to provide a picture of the contamination vertical stratification over time. The treatment plant is contained within a 12 m container, hosting a contaminated water storage tank, a sand filter, two IEG-compact strippers, and a decontaminated water storage tank (Figure 1).
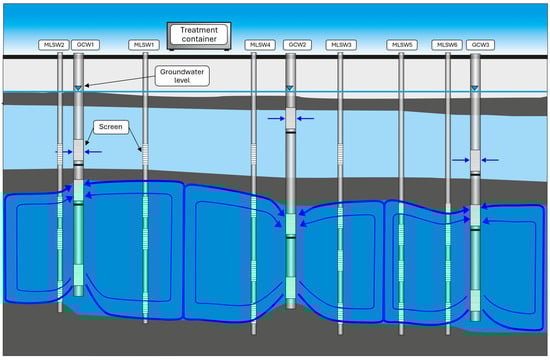
Figure 1.
Schematic of the remediation strategy configuration depicting the groundwater circulation wells (GCW1, GCW2, and GCW3) with three screened sections and six multilevel sampling wells (MLSW1, MLWS2, MLSW3, MLSW4, MLSW5, and MLSW6) with four screens.
Outside the treatment container, two carbon filters are accommodated. Treatment involved sand filtration to remove suspended solids, followed by accumulation in a tank to ensure a constant flow rate to the strippers. At the outlet of the strippers, water is stored in another reservoir and then re-injected into the aquifer. The air used for stripping was recirculated over carbon filters to ensure complete adsorption of volatilized contaminants. The plant linked to the recirculation wells operated with an average flow rate of 1.8 m3 h−1 equally distributed over the three GCW barrier wells. In the first two months after the start-up of the plant, the GCWs operated by pumping groundwater from the top and base screened sections and by re-injecting groundwater from the intermediate screened section. During these months, a progressive decrease in the pumping and re-injection flow rates of the plant was observed. To restore the initial flow rates, the recirculation configuration was reversed by pumping groundwater from the middle-screened section and re-injecting it into the deep one. Conventional hydrochemical monitoring combined with multilevel sampling aimed to validate the successful interception of the plume of contamination by the groundwater recirculation barrier. The hydrochemical monitoring of the piezometric network aimed to reveal the performance of the adopted technology in the specific configuration to impede the migration of pollutants along the groundwater pathways. Additionally, a comparative assessment of the performances of GCW and P&S is intended to highlight the sustainability of the proposed solution for treating a contamination plume compared to traditional hydraulic containment.
3. Results and Discussion
3.1. Geological and Hydrogeological Framework
Detailed stratigraphic investigations delineate six lithological layers within the geological sequence, depicting an alternation of fine and coarse sediments. The 3D model arising from data-driven geomodeling illustrates stratigraphic relationships, and discontinuities and reveals substantial thickness variations in geological strata, indicating a complex depositional environment. The site’s complex lithostratigraphic structure reflects sediment variations due to the paleogeographic evolution of the final Arno basin section [74]. The geological sequence represents a multi-layered aquifer distinguishing six distinct litho-technical horizons. After the anthropogenic deposits characterized by an average thickness of 1.8 m, the subsequent layers alternate between fine and coarse deposits. In sequence from top to bottom, the layers consist of:
- Clayey-silty deposit at depths ranging from 2 to 4 m from the ground level, which locally confines the groundwater circulation hosted in the underlying sediments,
- A horizon with an average thickness of 2.6 m, consisting of sandy-clayey deposits with gravels that form a shallow aquifer (A) and exhibit an average hydraulic conductivity of approximately 2 × 10⁻⁵ m/s,
- Light brown silty-clayey deposits at depths ranging from 6.5 to 8 m, revealing a spatially discontinuous distribution across the study area and hydraulically separating the shallow aquifer from the circulation of deeper groundwater,
- Compact gravel with sandy matrix, with an average thickness of 4 m and hydraulic conductivity of about 9 × 10⁻⁴ m/s, forming a deep aquifer (B),
- A low-permeability layer consisting of grey silty clays, encountered at a depth of approximately 12 m, acting as an aquiclude.
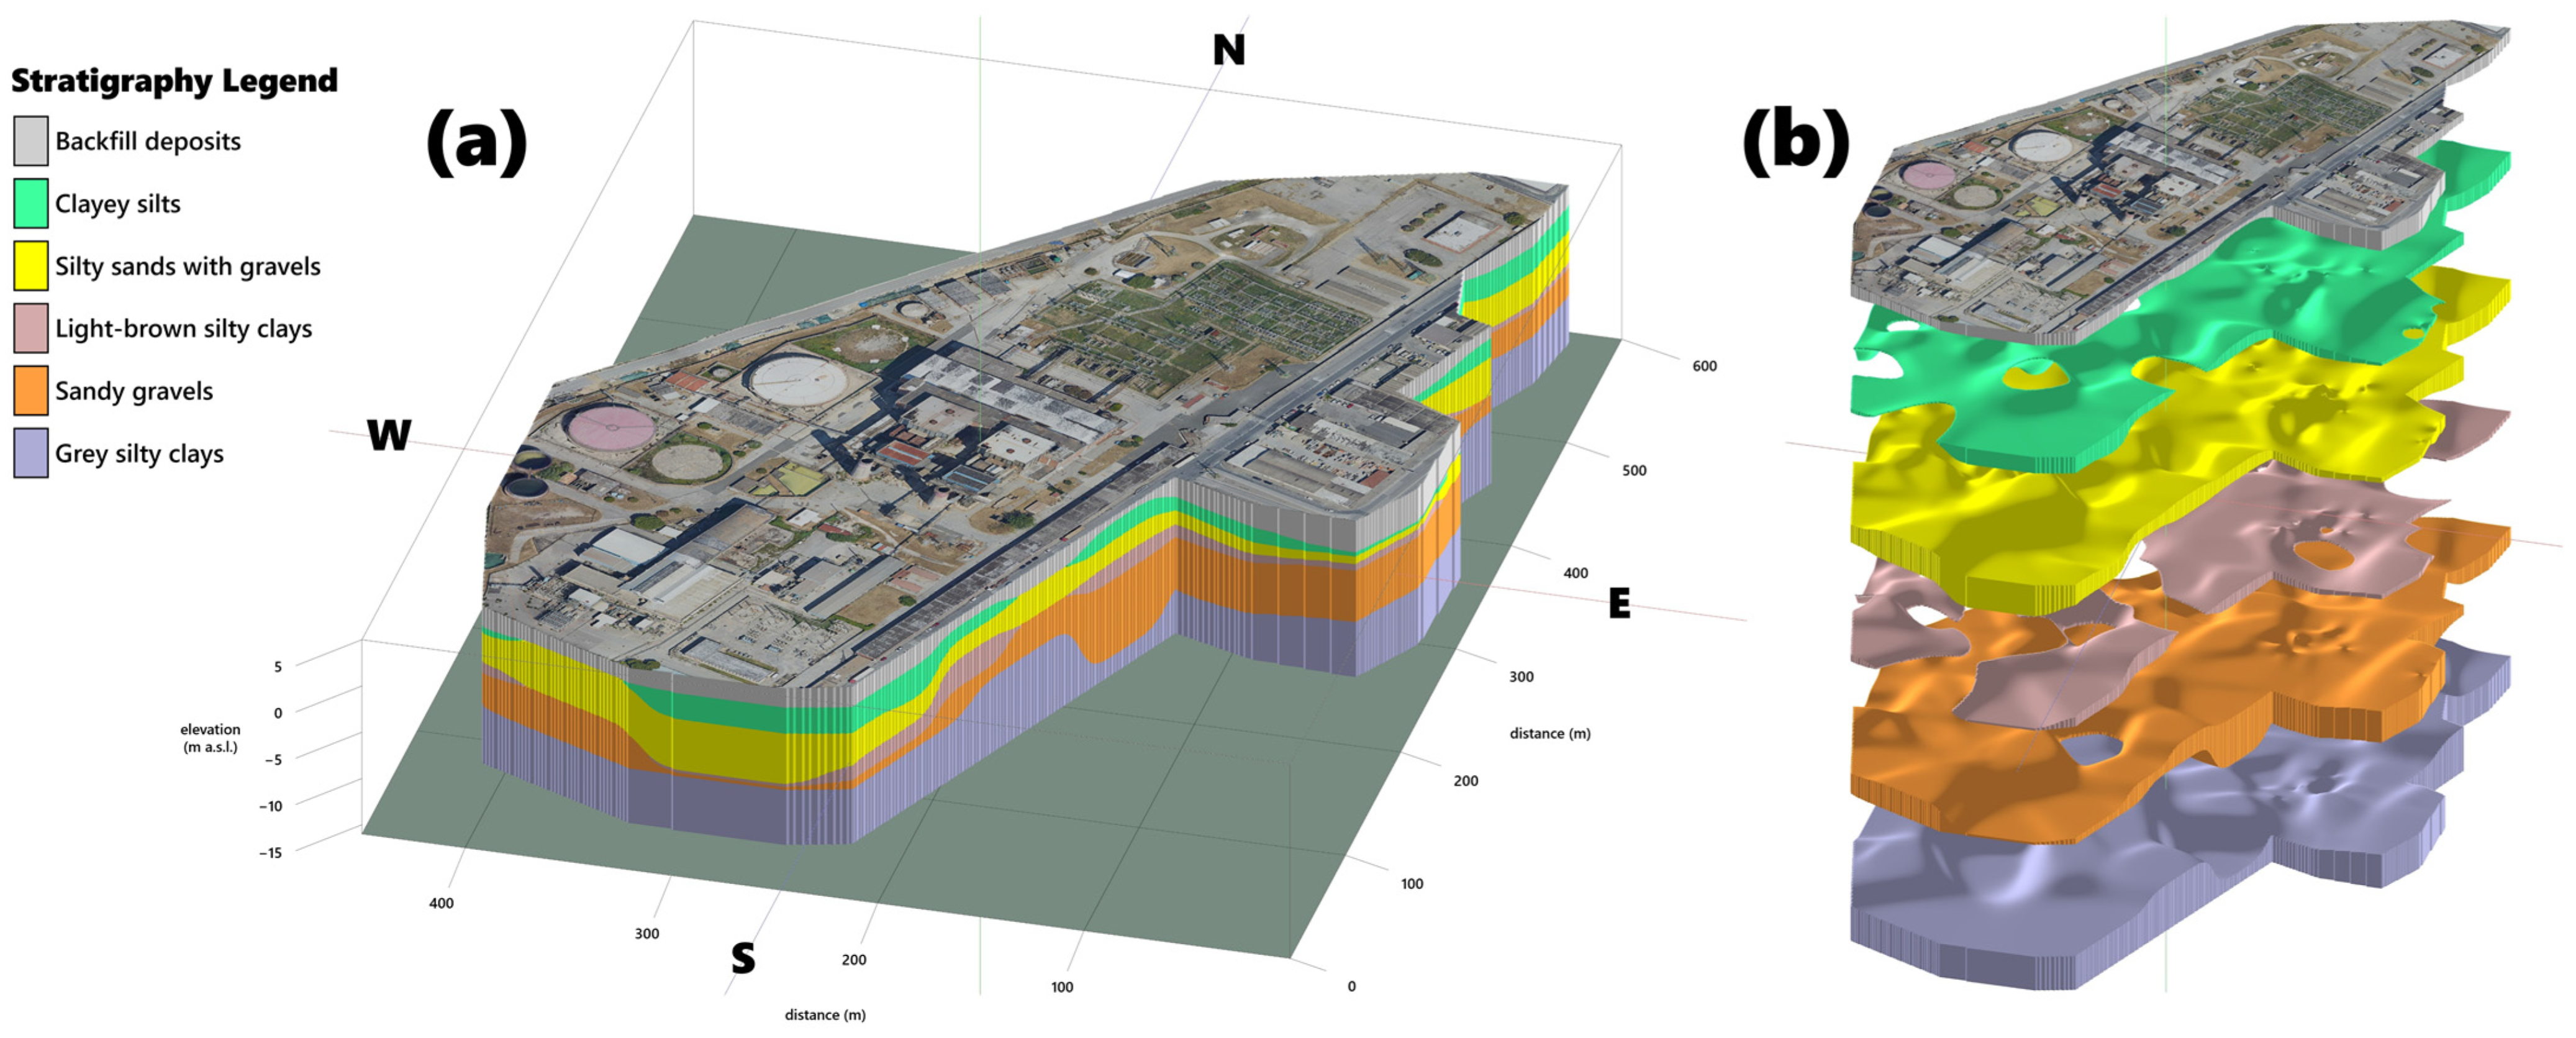
The 3D model presents a vertical exaggeration factor of 10 marking lithological transitions (Figure 2a). Additionally, the use of a representation offset between stratigraphic layers allows stratigraphic discontinuities to be identified (Figure 2b). The described geological context delineates a multi-layered aquifer.
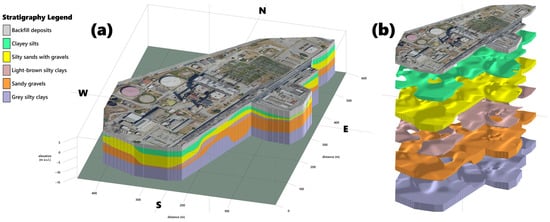
Figure 2.
Geological 3D model of the industrial plant that depicts the complex architecture of the stratigraphic layers (a) and 3D geological model “exploded” with an offset between the geological strata (b).
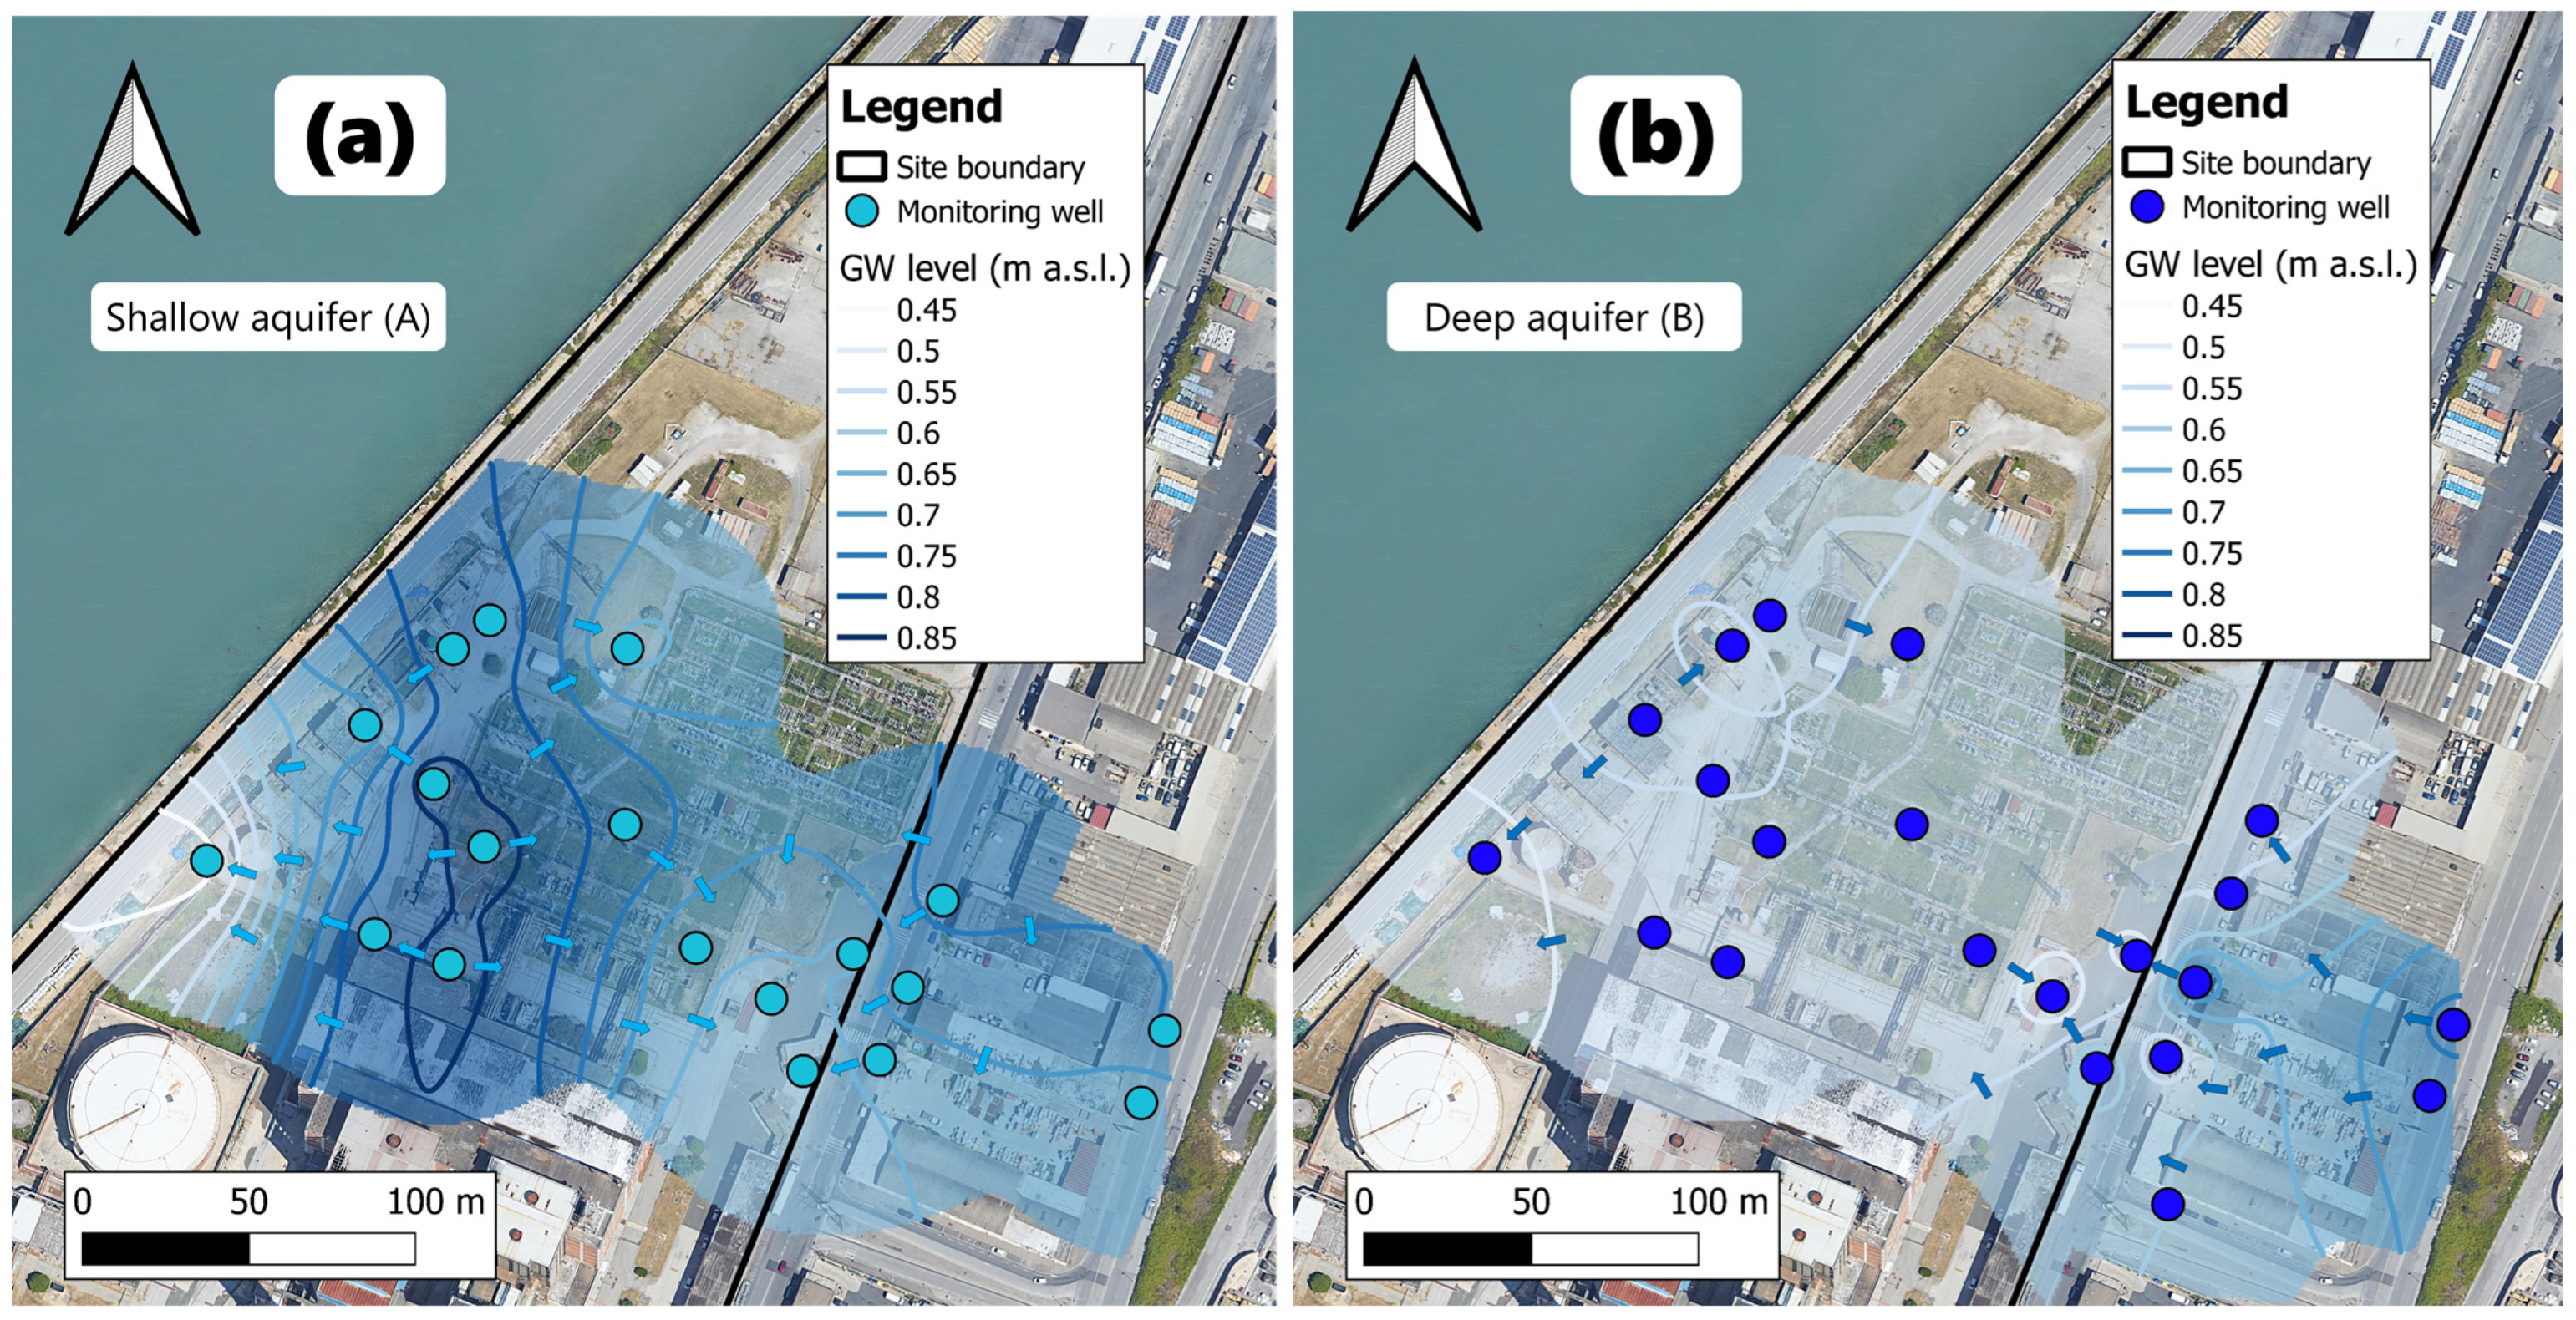
The groundwater circulation scheme reflects the fragmentation, the local confinement, and the hydraulic connectivity of aquifer horizons. The shallow aquifer (A) highlights a complex circulation pattern (Figure 3a). A high piezometric level in the vicinity of the industrial facility clearly emerges from the reconstruction of the potentiometric maps where the silty clays assume significant thicknesses. This aspect does not appear when viewing the 3D geological model, which instead emphasizes the stratigraphic discontinuities of the brown silty clays. The silty clays locally confine the shallow aquifer, generating an increase in pressure head, alternatively pore water pressure [75]. Furthermore, the groundwater level contour map reveals the convergence of groundwater flow vectors at the southeastern portion of the site, suggesting local vertical hydraulic gradients towards the underlying aquifer portions. Figure 3b illustrates the flow direction within the deep aquifer (B), which is oriented mainly from southeast (SE) to northwest (NW). The differences in grain size and hydraulic conductivity result in two distinct flow velocities for the identified aquifer bodies: 3.46 m/year for the shallow aquifer (A) and 119 m/year for the deep aquifer (B). Variations in the direction and velocity of the groundwater flow reflect the complex and heterogeneous geological framework, potentially impacting contamination distribution and migration in the hydrogeological domain.

Figure 3.
Contour maps illustrating the groundwater levels and flow vectors of groundwater circulation in aquifers A (a) and B (b).
The discontinuities in the separation level between the two aquifers and the vertical gradient in the southeastern sector may facilitate the migration of contaminants dissolved in aquifer A to B and the plume migration along the preferential direction of groundwater flow hosted in the sandy gravelly layer, transporting contaminants in groundwater to the inner portions of the site.
3.2. Identification of the Contamination Source and Reconstruction of Pollution Dynamics
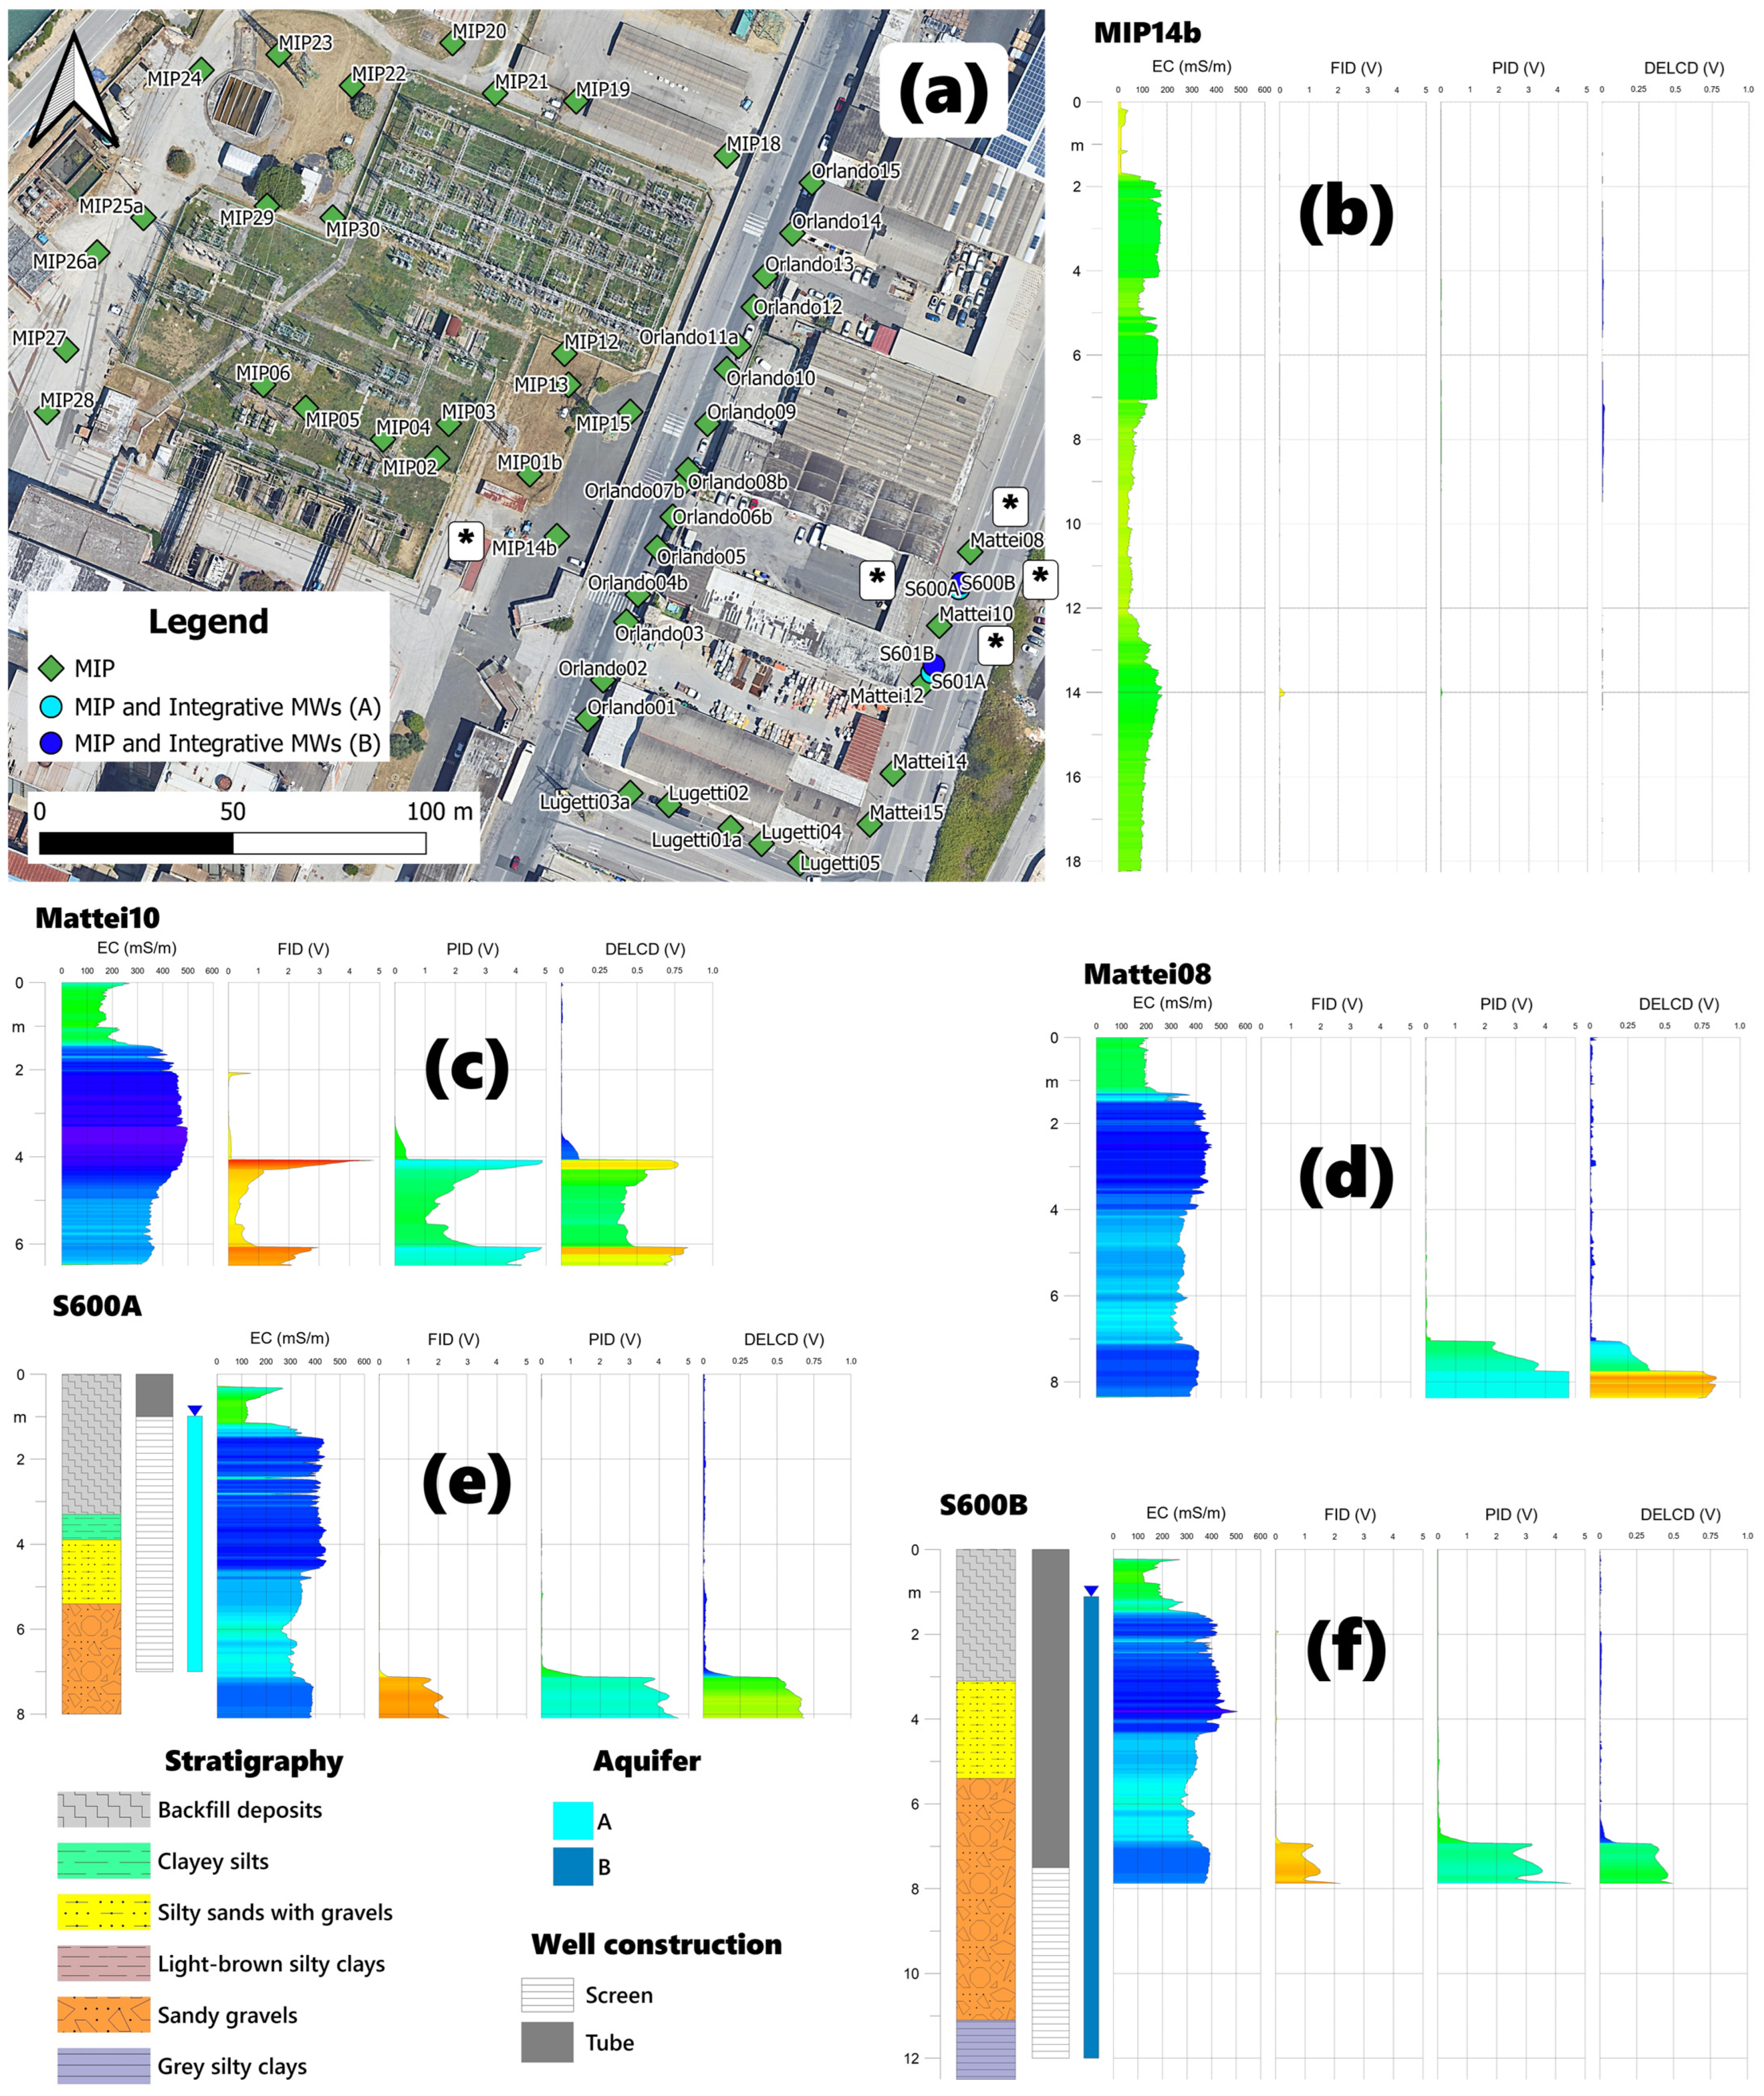
MIPs effectively identify a contamination source that generates a plume of dissolved components in groundwater. The investigations conducted from the inner to outer portions of the site led to a stepwise refinement of the local hydrogeological model and a gradual ‘approach’ to the secondary contamination source, as highlighted by the increasing signals from the FID, PID, and DELCD detectors during the operational sequence. Specifically, no measurable traces of chlorinated substances were found in any of the vertical profiles obtained within the plant (Figure 4a). MIP 14b, located at the site boundary, depicts the absence of contamination signals and significant heterogeneity in electrical conductivity, mirroring the intricate geological composition of the subsurface and physically parametrizing the geological model (Figure 4b). Outside the site, moving gradually eastwards, increasing signs of the various detectors are evident (Figure 4c,d). The implementation of boreholes to reconstruct the local geology in detail and the installation of piezometers for water sampling follow the identification of peaks attributable to the presence of pollutants in external areas, for the gradual and dynamic refinement of the CSM (Figure 4e,f). The MIPs depicted in Figure 4c–f reveal intense signal peaks for different detectors. While FID signals suggest the presence of unsaturated hydrocarbons such as methane, and PID performs a general screening of VOCs encountered at various depths, DELCD specifically identifies chlorinated solvents such as TCE [22,36]. The DELCD signals are heterogeneously distributed over depths ranging from 4 to 8 m. The maximum DELCD signal intensities, approximately 0.8 V, are recorded at around 4 and 6 m depth at the Mattei8 point and approximately 8 m depth at the Mattei10 point. DELCD signal profiles impact both aquifer bodies and are distributed over depths ranging from 1 to 2.5 m along the verticals located in the eastern portion of the study area. These pieces of evidence semi-quantitatively depict the vertical redistribution of chlorinated solvents and delineate the residual source area architecture. Furthermore, proceeding from Mattei8 to Mattei10, the signals emerge at progressively shallower depths. This pattern suggests a progressive approach to a point source of contamination.

Figure 4.
Localization of MIP screening boreholes in the investigation domain (a). Profiles of FID, PID, and DELCD acquired at points MIP14b (b), Mattei8 (c), and Mattei10 (d). MIP detector profiles were acquired at investigation points S600A (e) and S600B (f) with the association of local stratigraphy and the construction layout of the piezometers along the verticals. The localization of MIP profiles shown in (b–f) are identified with an asterisk in (a).
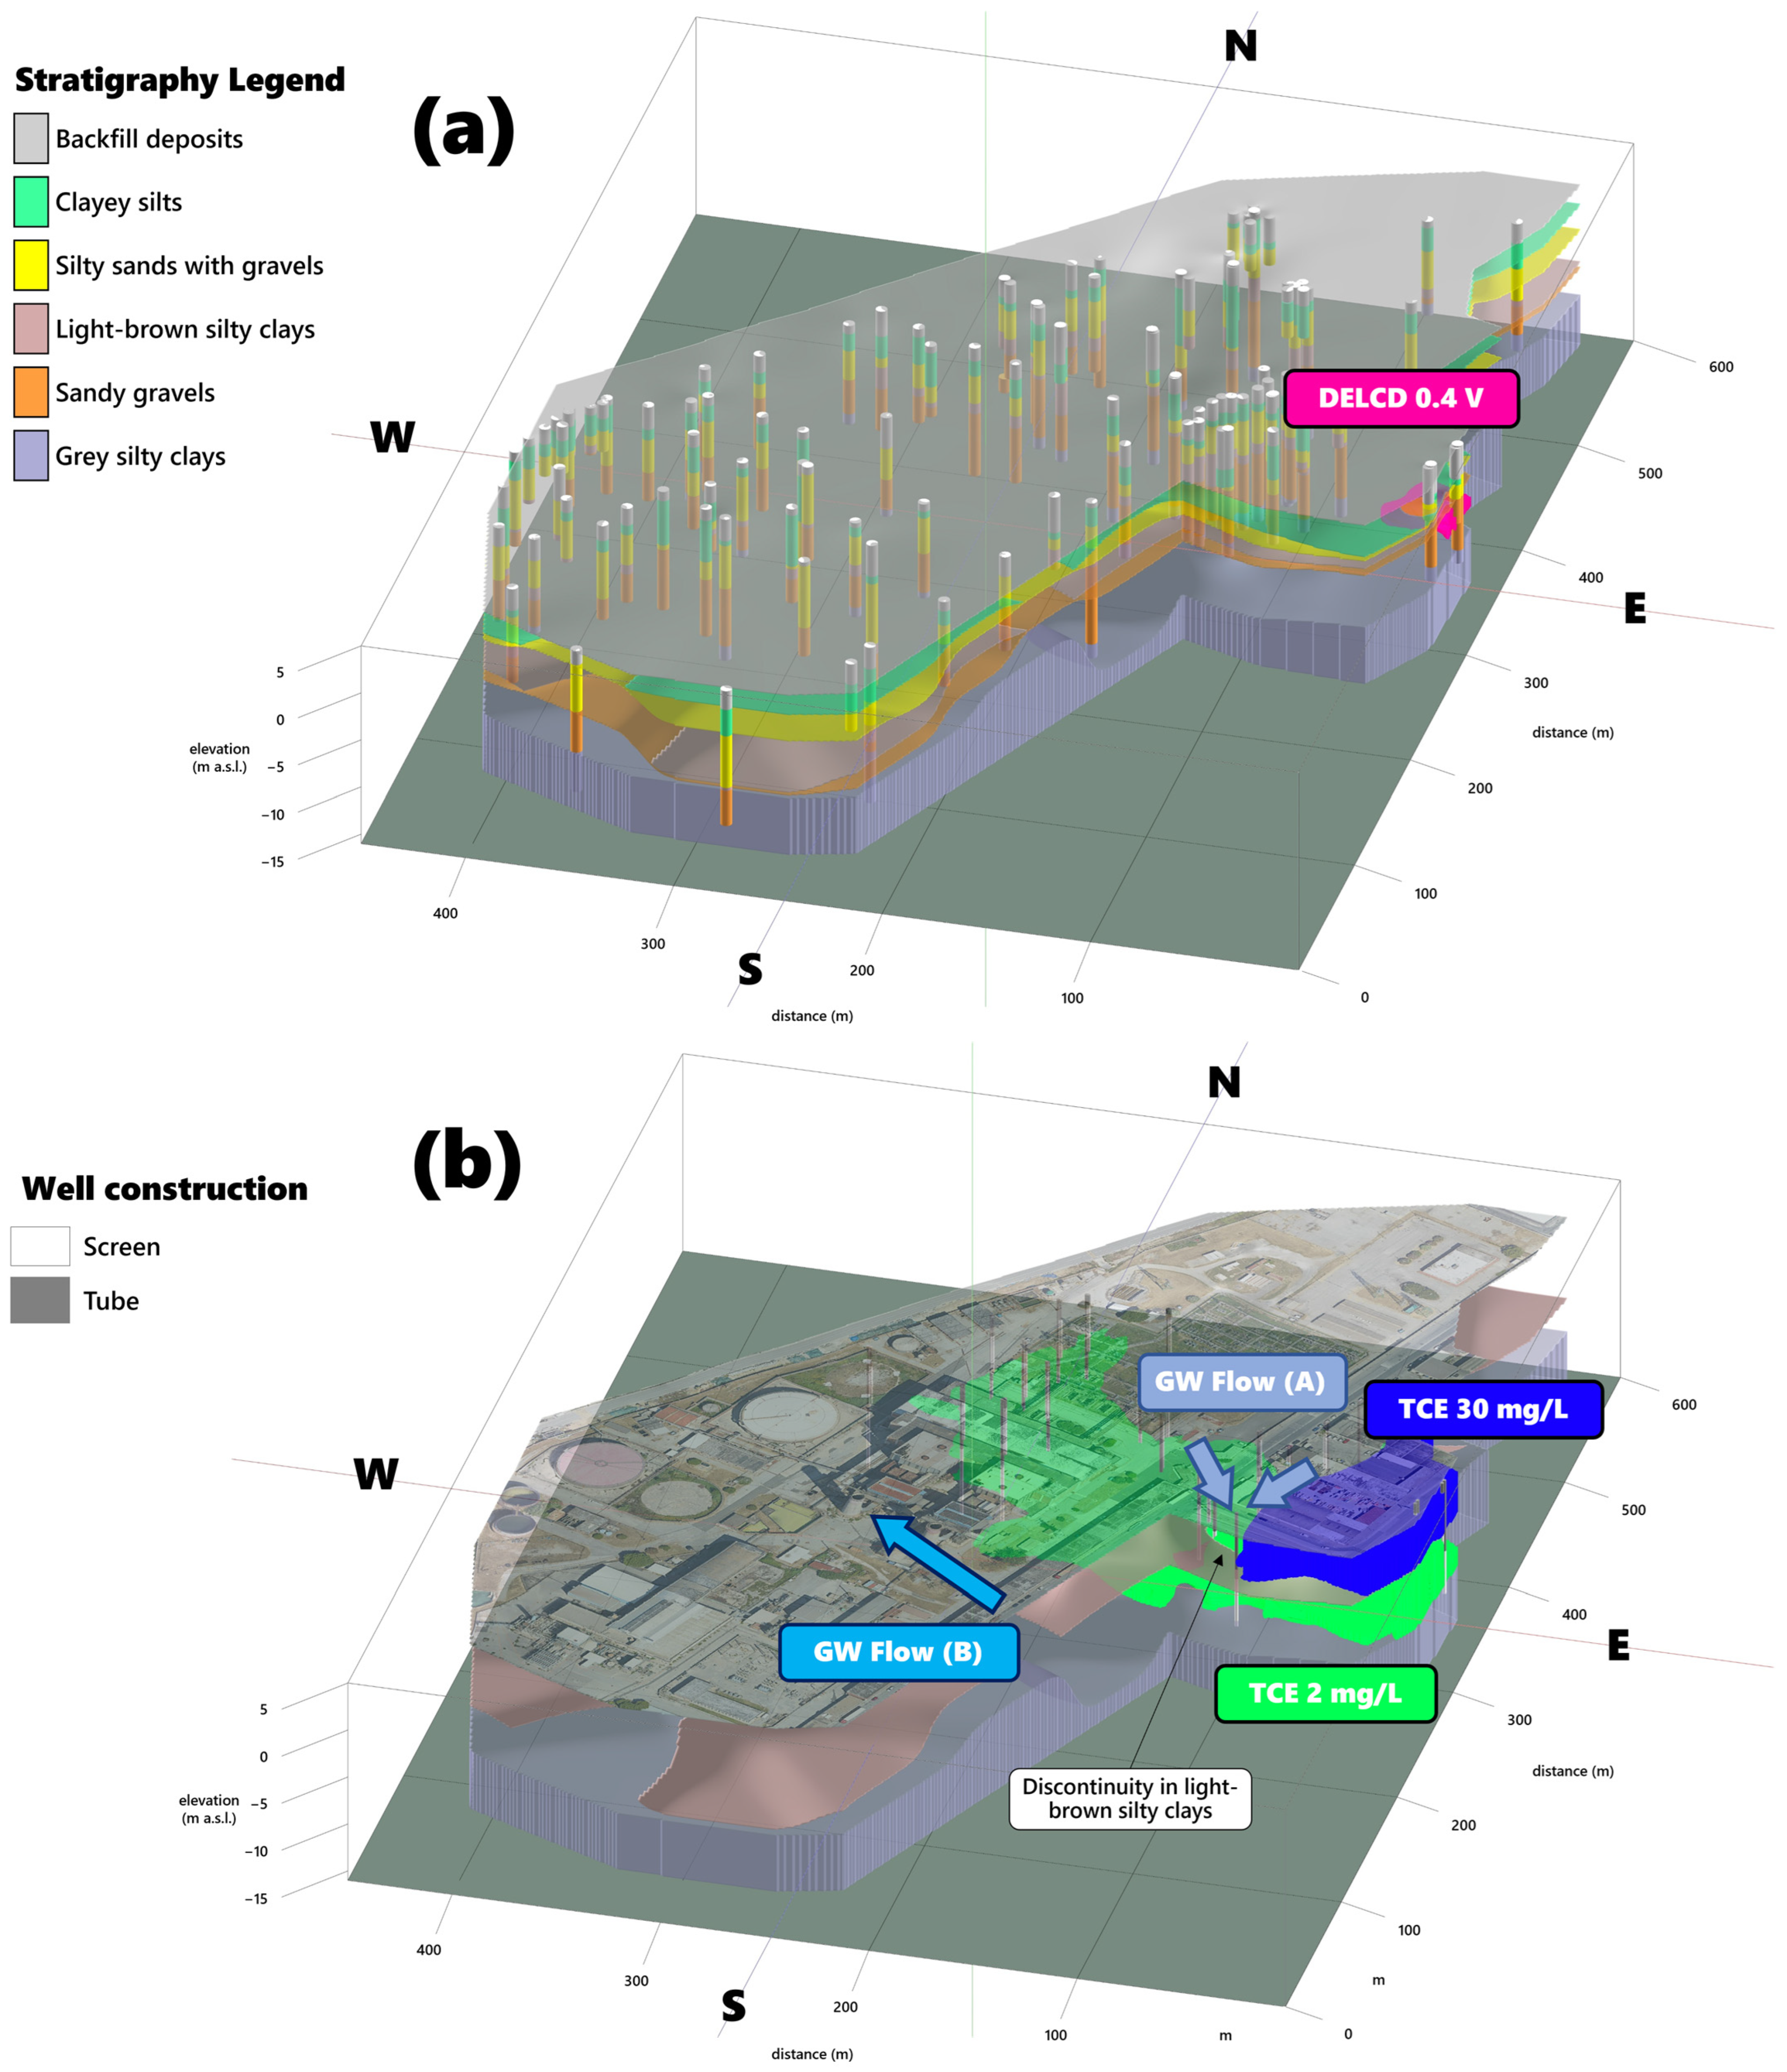
The interpolation of DELCD signals confines and delineates, using a 0.4 V isosurface, the volume impacted by secondary sources of chlorinated solvent in the residual phase within the local geological architecture. Also, the 3D rendering of the data-driven model clearly identifies and depicts a pseudo-secondary contamination source outside the site that had not been recognized through previous characterizations (Figure 5a). The overlay of geological knowledge and direct push elements in the 3D interface, combined with the reconstruction of groundwater recirculation patterns for aquifers A and B and hydrochemical information, reveals the dynamics of contamination and the mechanisms of pollutant transport in the reconstructed hydrogeochemical framework. The residual fraction of the pollutant delineated with MIPs impacts aquifer A and reaches aquifer B due to local discontinuities in the silty-clayey layer that hydraulically separates the aquifer bodies. The lack of spatial continuity of this horizon is also highlighted by the S600A and S600B drillings conducted in the source area (Figure 4e,f). In the source area, the maximum concentrations of TCE at monitoring points intercepting aquifers A and B correspond to 163 mg/L and 50 mg/L, respectively. Although these concentrations represent approximately 12% and 4% of TCE solubility in water (1349 mg/L) [76], potentially suggesting the presence of residual and trapped DNAPL ganglia, DNAPL in a separate phase was not detected. A contamination plume originates from the dissolution of the spatially delineated residual fraction component and follows the groundwater flow vectors in a particularly complex hydrogeological architecture. In the shallow portion of the aquifer (A), the transport of dissolved components in groundwater is guided both by the discontinuity in the separation layer between aquifer bodies and local vertical gradients that influence the plume migration from aquifer A to B. In the deep portion of the aquifer (B), the plume migrating along the direction of groundwater flow develops over a considerable distance until it reaches the internal sections of the site. This reflects the high flow velocities of deep groundwater in highly permeable gravelly deposits constituting aquifer B and the physicochemical properties of chlorinated solvents that poorly are absorbed in gravelly aquifers [6,77,78]. The three-dimensional representation of TCE contamination plumes in the upper (A) and deep (B) aquifers using isosurfaces with concentration values of 30 and 2 mg/L, respectively, schematizes the roles of vertical gradients and stratigraphic discontinuities in the migration of dissolved contaminants in the groundwater within the specific hydrostratigraphic context (Figure 5b). In addition, the contribution of the external source to contaminating the groundwater of the deep aquifer within the site clearly emerges. Finally, Figure 5b clearly reveals a spatial correspondence between the TCE isosurfaces and the residual source delineated through MIP (Figure 5a), depicting the origin of a plume through the dissolution of residual components of the secondary source.

Figure 5.
3D model illustrating geological boreholes, stratigraphic contacts, and the secondary contamination source delineated by a 0.4 V isosurface of DELCD signals (a). Contamination plumes of TCE reconstructed for the upper (A) and deep (B) aquifers using concentration isosurfaces of 30 and 2 mg/L, indicating the flow direction of the groundwater circulation hosted in A and B, and locating the stratigraphic discontinuities of the hydraulic separation level between the aquifer bodies (b).
3.3. Remediation Strategy Design and Decontamination Evidence
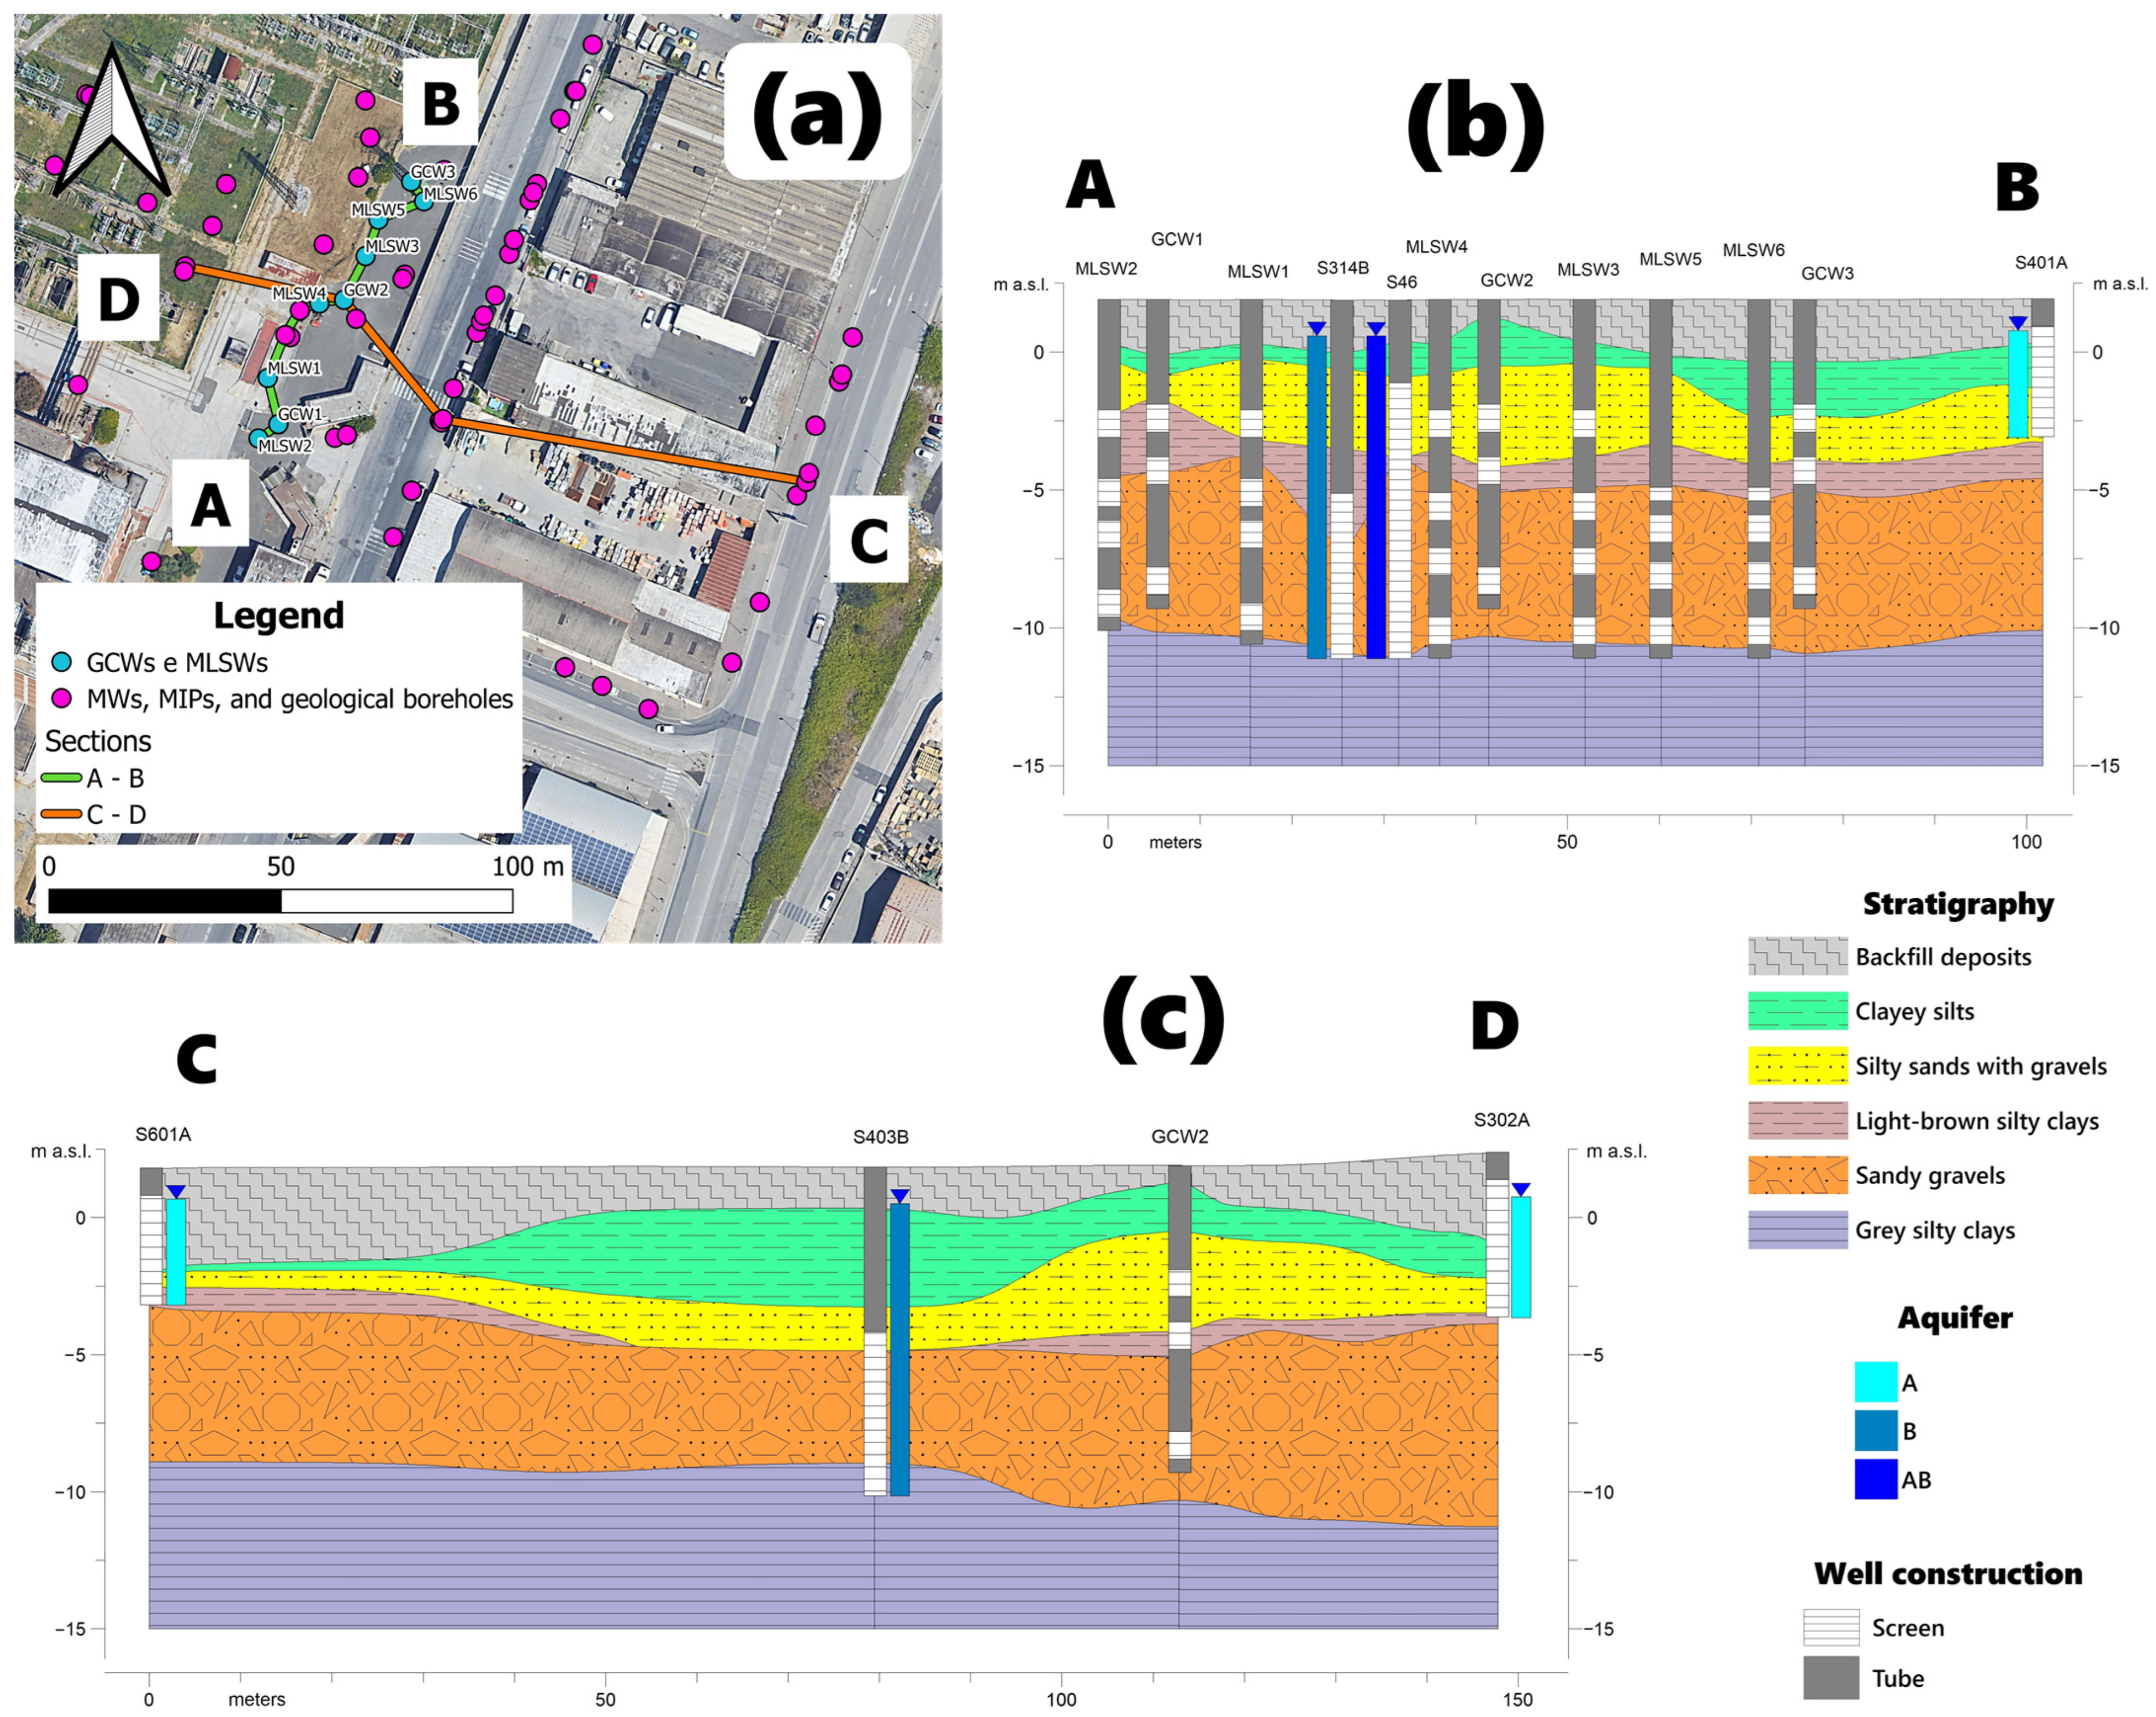
The design of the remediation strategy reflects the remediation goal of reducing the contamination load within the site. Therefore, the geometric configuration of the virtual barrier with three GCWs is strategically oriented perpendicular to the direction of groundwater flow in aquifer B (Figure 6a), intercepting the contamination plume originating from the secondary source delineated by the multi-source conceptual model (Figure 5a,b). The two-dimensional profile AB captures the distinctive hydrogeological features at the virtual barrier and provides insights into groundwater circulation and the dimensioning of a tailor-made intervention (Figure 6b). Although the silty-clayey hydraulic separation horizon between the two aquifers is continuous in the intervention area, the monitoring wells intercepting the upper (A) and deep (B) aquifers, as well as the continuously screened monitoring points across the entire saturated thickness (AB), show a comparable piezometric level. The water exchange between aquifer bodies occurs at the identified local discontinuities in the geological hydraulic separation horizon (Figure 6c), evidently facilitated by numerous on-site drilling activities for piezometer installation [79]. This process narrows the differences in hydraulic heads between the various aquifer horizons [80]. In such a complex scenario, the groundwater recirculation guided by three GCWs equipped with three screened intervals in a virtual barrier setup intercepts and treats the contamination plume originating from the upgradient hydrogeological areas and mobilizes contaminants adsorbed or absorbed to the fine geological matrix.
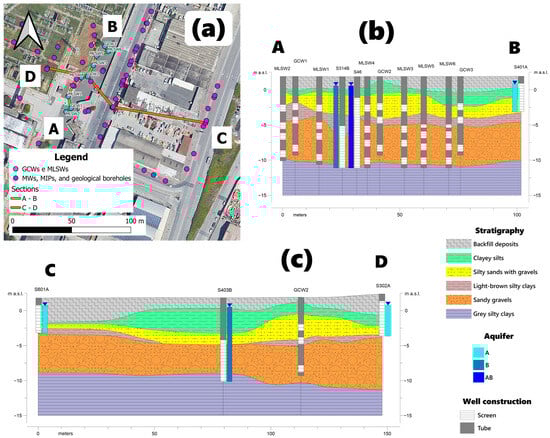
Figure 6.
Map of the geological cross-sections created along the intervention transect with GCWs and perpendicular to the virtual barrier, indicating the locations of circulation wells, MLWS, and traditional piezometers (a). Geological profiles AB (b) and CD (c) with an indication of the groundwater level measured in the piezometers intercepting various portions of the aquifer.
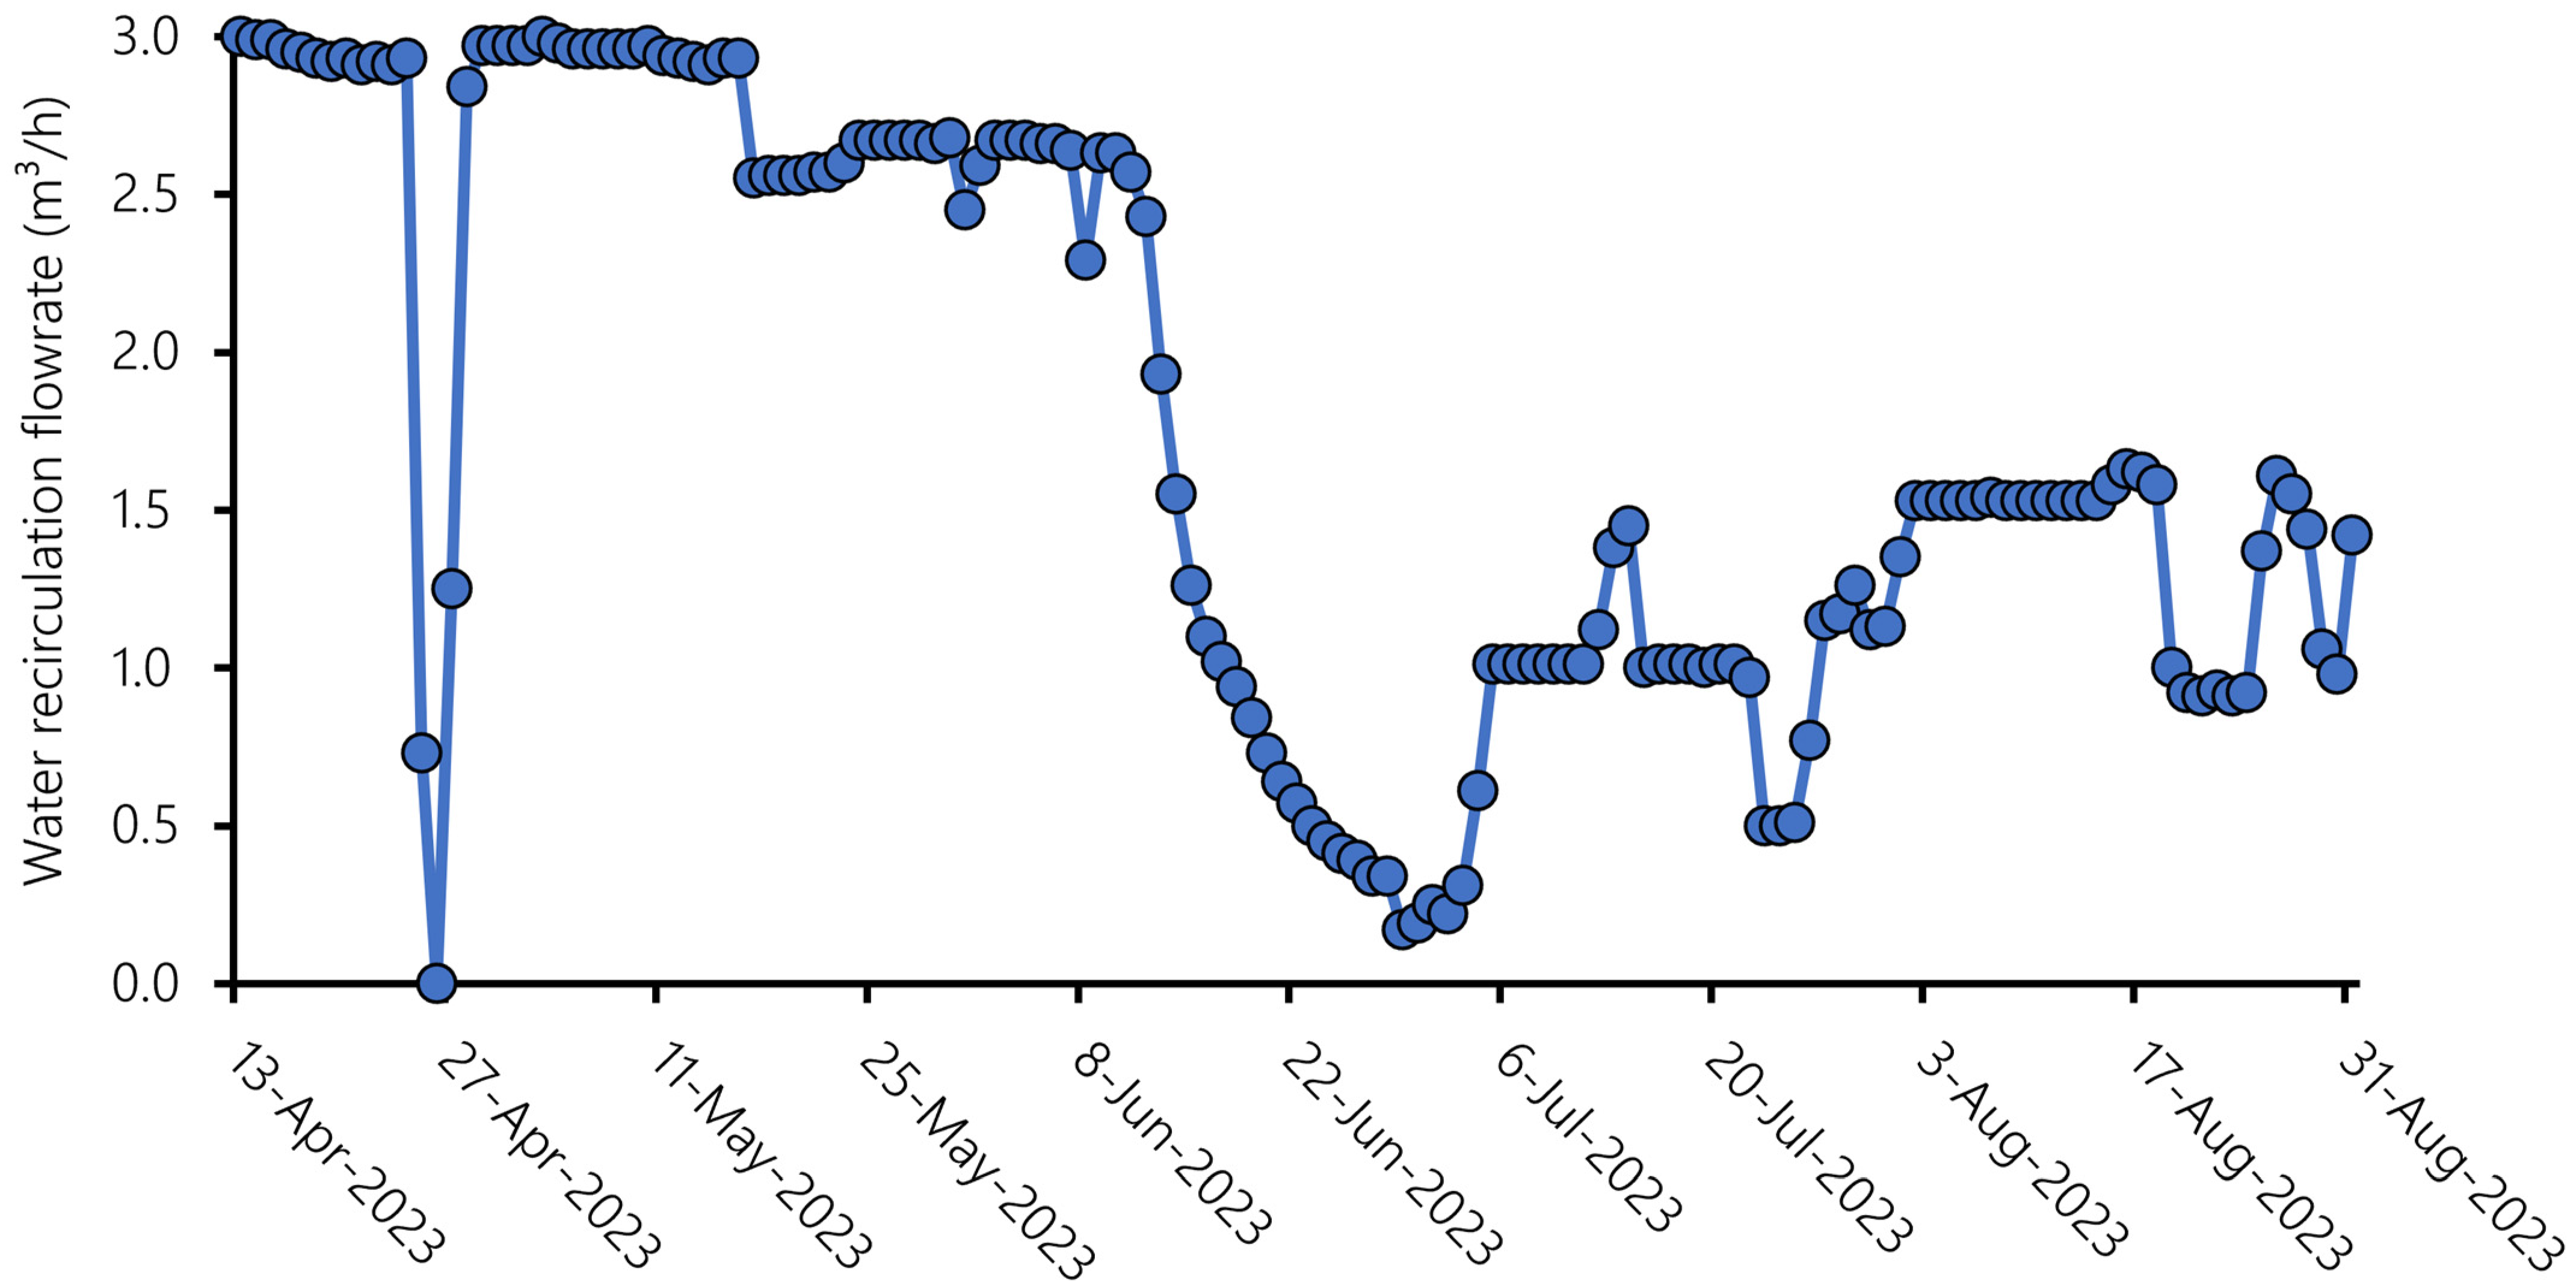
The three circulation wells were started in April 2023 and operated continuously for the following four months. In the first two months, the total recirculation rates of the virtual barrier amounted to approximately 2.7 m3/h. Subsequently, a temporary reduction in flow rates, stabilizing at around 1.1 m3/h in the last monitored month, suggests temporary issues related to well clogging [81] (Figure 7). Well clogging sounds like the sole reason for the reduction in recirculation flow rates. The high temperatures of the extracted and treated water (up to about 30 °C), which is also chemically hard, have led to the sudden appearance of calcareous fouling in the treatment plant. For this reason, a temporary increase in hydraulic head in the re-injection screen sections was associated with their clogging. A reduction in the flow rates of the GCWs could potentially compromise the integrity of the barrier, impacting the development of the individual well’s ROI and creating gaps in the virtual hydraulic containment system. The most notable drop in flow rate (<0.5 m3/h) was only observed for around 10 days, which was inadequate for the plume to totally breach the barrier. This evidence suggests a limited impact of the temporary reduction in flow rates on the remediation outcomes.
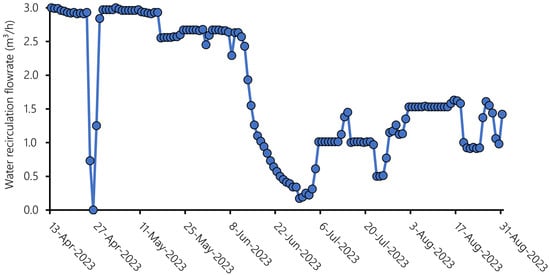
Figure 7.
Recirculation flow rates measured at the system associated with the 3 GCWs during the intervention operation period.
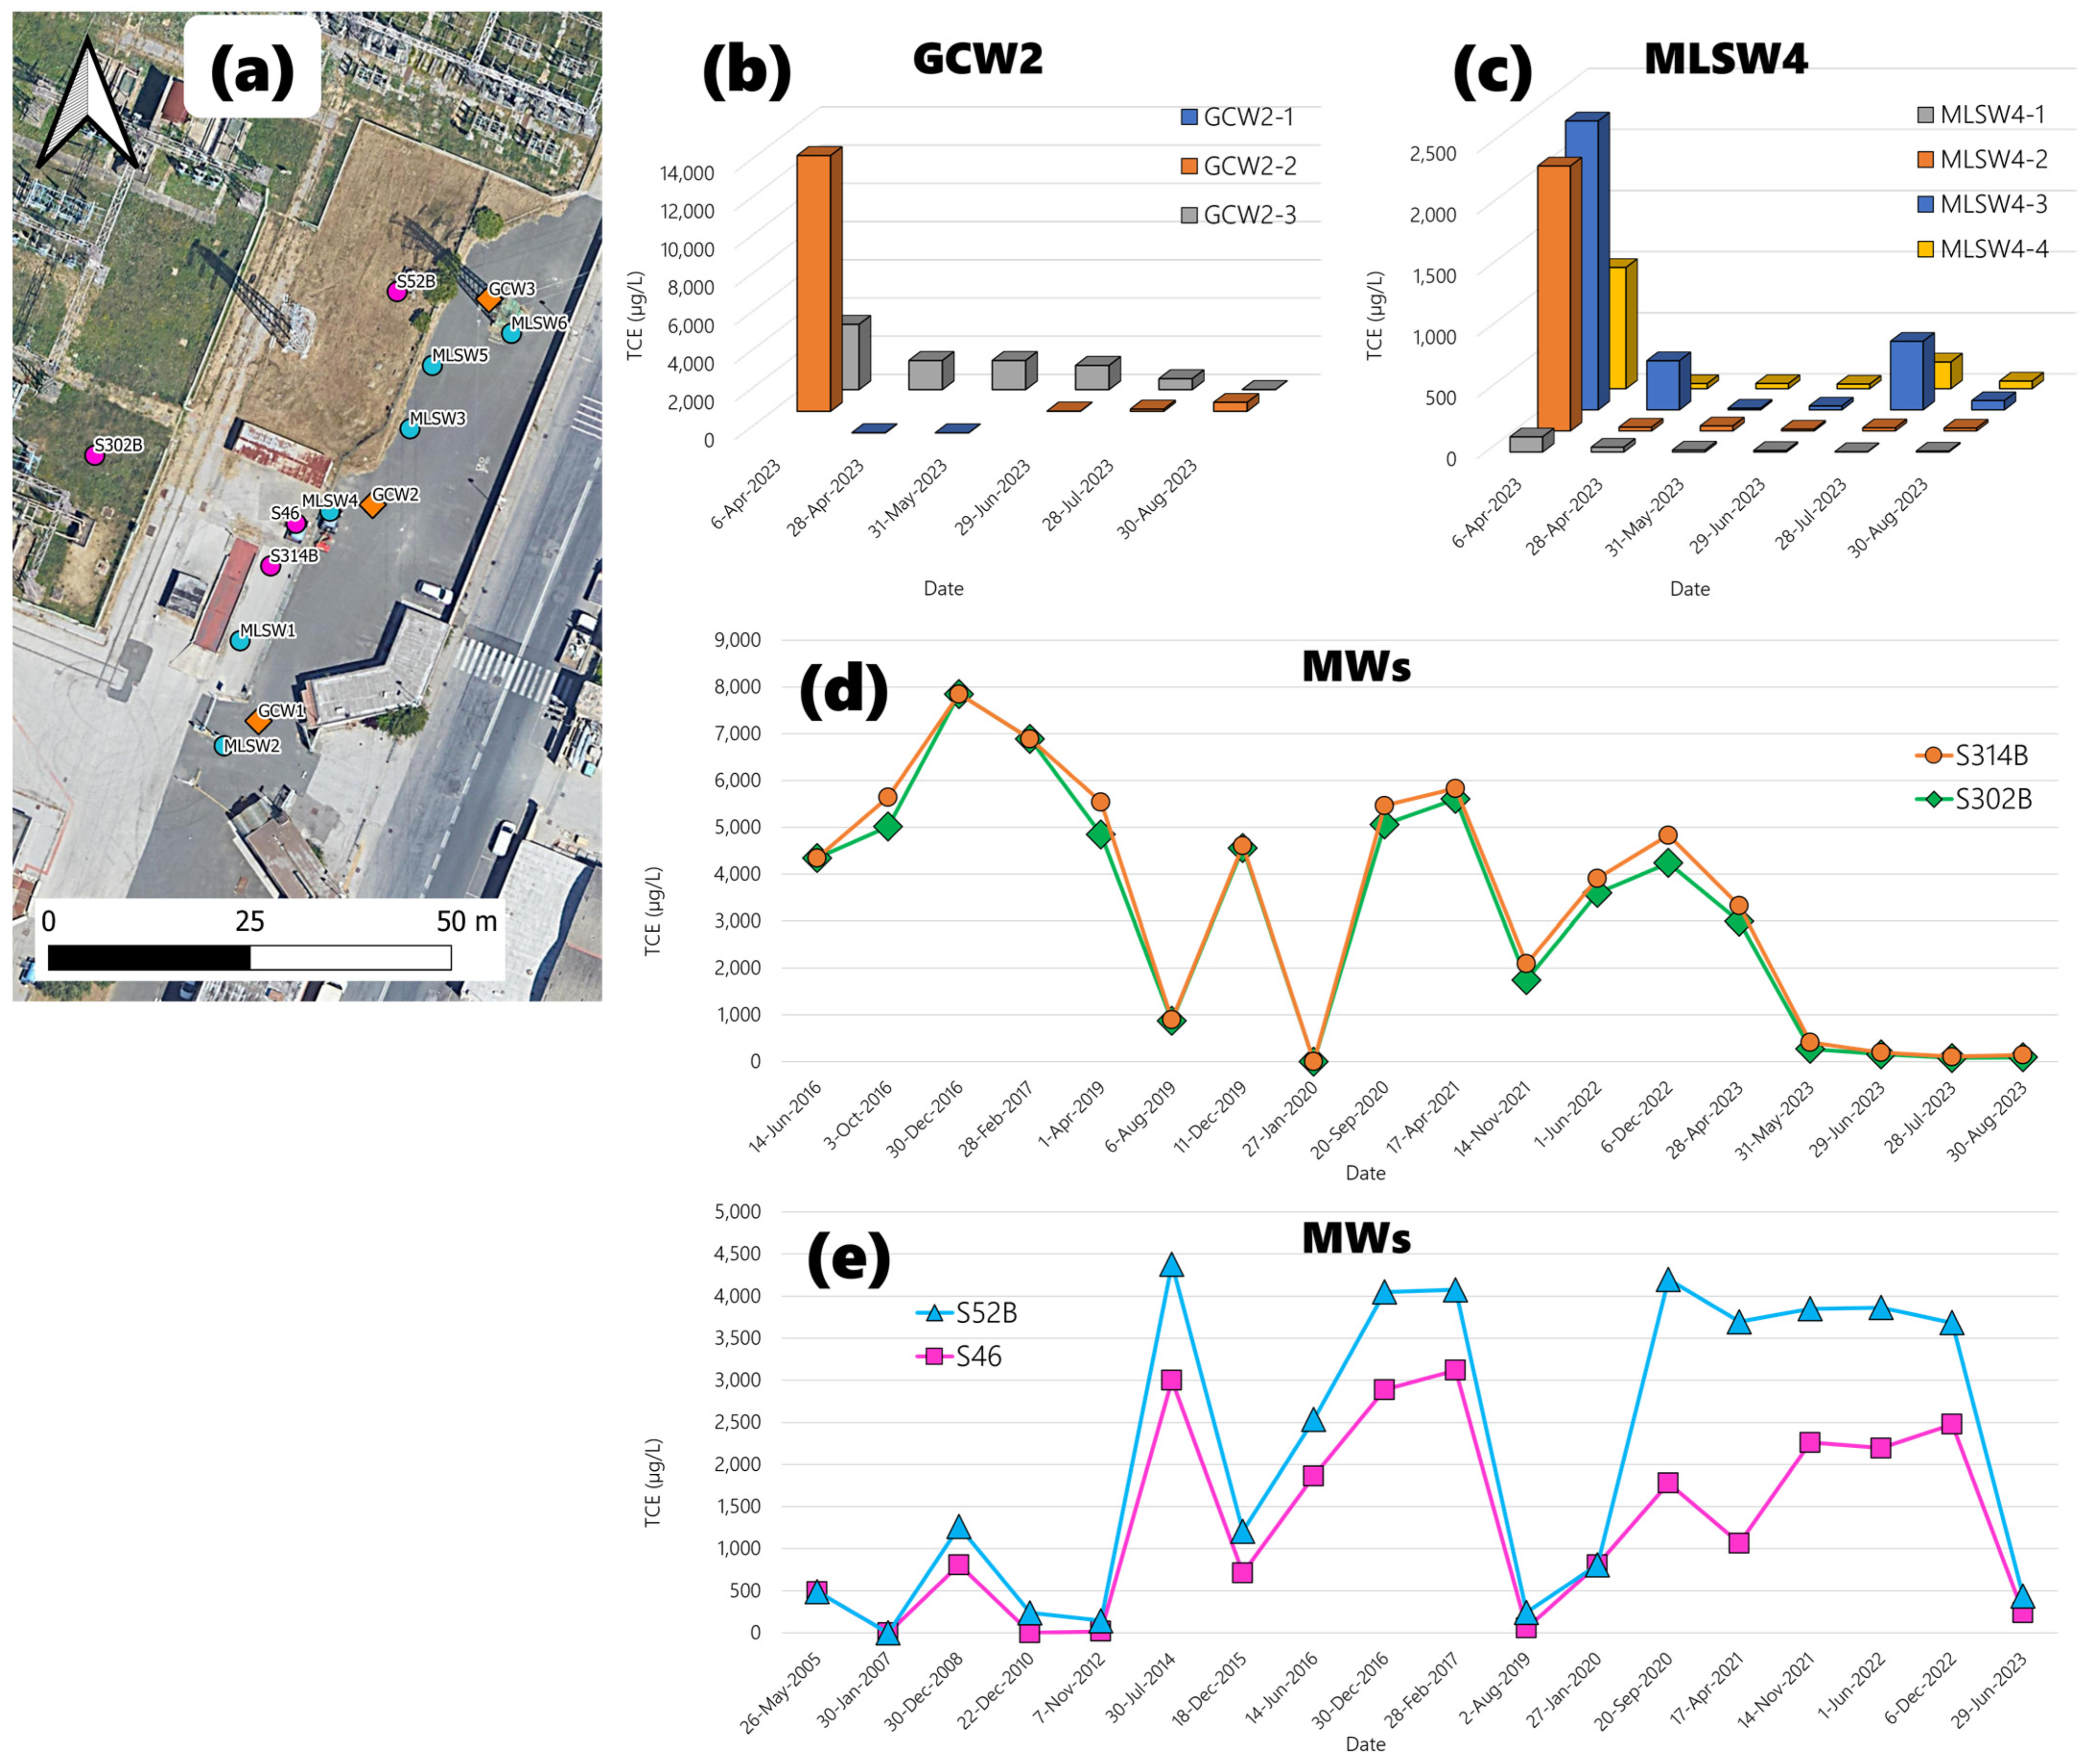
Hydrochemical monitoring at various depths at the virtual barrier highlights the rapid and significant decrease in TCE concentrations induced by the groundwater recirculation operated by the GCWs. The TCE levels measured in the screened section at a depth of 6–7 m in GCW2 (GCW2-2) decreased from approximately 14 mg/L to non-detectable values in the subsequent sampling and to 462 µg/L in the latest available campaign. Similarly, in the GCW2-3 section located at a depth of 10–11 m, a decreasing trend in measured concentrations was observed, ranging from 3414 to 1 µg/L during the monitored interval (Figure 8b). The multilevel sampling data also validates this trend. Hydrochemical data collection for the four sampling horizons of MLSW4 reveals a reduction in concentrations over time and sporadic rebounds of TCE concentrations (Figure 8c). In monitoring points, the data collected for the shallower sampling horizons, GCW2-1 and MLSW4-1, indicate significantly lower pollutant concentrations compared to the deeper aquifer sections, aligning with the conceptual model’s depiction of a contamination plume spreading in aquifer B. Besides, the central screened section of the circulation well (GCW2-2), positioned in clayey-silty deposits, reveals significantly higher initial concentrations than the other levels of vertical sampling. This signifies pollutant mobilization dynamics induced by groundwater recirculation within the radius of influence (ROI) of the GCW. Pollutants may have potentially accumulated in low-permeability layers through diffusion from the plume into the silty clay zones [6]. The capability of silty-clayey deposits to adsorb or absorb substantial amounts of contaminants and release them with slow diffusive kinetics is well-documented in the literature [82,83]. The reduced intergranular porosity and, consequently, limited hydraulic conductivity indeed restrict advective movement in these lithologies [36,84,85]. Nevertheless, groundwater recirculation induced by the GCW rapidly removes TCE retained by the light-brown silty clays, historically impacted by a contamination plume, and acting as a storage reservoir for pollutants. The mobilization and reduction effects of TCE within the ROI of the GCW are also evident in the hydrochemical monitoring of the MLSW, where local rebound effects can be linked with the development of the recirculation cell that affects masses of contaminant accumulations or the influx of dissolved pollutants into the aquifer section intercepted by the virtual barrier. These findings are consistent with numerous literature studies conducted on recirculating systems at both laboratory and field scales, highlighting the mobilization of contaminants adsorbed or absorbed on low-permeability layers and rebound effects induced by groundwater circulation [86,87]. The long-term influx of a contamination plume from the source area becomes evident from the analysis of the temporal trends in TCE concentrations measured in the traditional monitoring wells installed within the site. Since 2005, concentrations in the order of thousands of µg/L have frequently been measured in the monitoring wells intercepting aquifer B (Figure 8d,e). The variability in well-field hydrodynamics and residual source-zone discharge are potential explanations for the decline in TCE concentrations observed in 2015, 2019, and 2020 [7,40,46]. Throughout the monitoring period, the P&S wells plugged and moved, impacting the hydraulic gradient and groundwater flow. However, the continual supply of aqueous-phase contaminant mass and the inefficacy of traditional pumping systems in the specific hydrostratigraphic context are evident from the analysis in Figure 8d,e. The GCWs in virtual hydraulic barrier mode, initiated in April 2023, resulted in a sharp decrease in TCE levels measured in the onsite monitoring piezometers, testifying to the complete interception and, indeed, the break of the TCE plume that originates from the source and develops along the direction of groundwater flow. Compared to the pre-intervention sampling, the monitoring wells internal to the site and located downstream of the virtual hydraulic barrier system (whose positions are mapped in Figure 8a) show a percentage reduction in PCE concentrations of 98.2% for S46, 99.5% for S52, 98.2% for S302B, and 95.1% for S314B (Figure 8d,e).
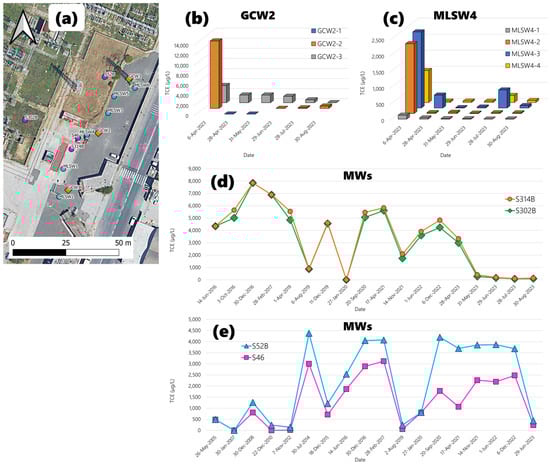
Figure 8.
Location of the GCWs that constitute the virtual barrier, the MLSWs, and the traditional monitoring wells (S46, S52, S302B, S314B) around the treatment area (a). Concentrations of TCE measured in the screened intervals of the GCW positioned at depths of 3–4 m (GCW2-1), 6–7 m (GCW2-2), and 10–11 m (GCW2-3) after groundwater circulation well startup (b). Trends in TCE concentrations detected at MLSW4 at sampling intervals installed at depths of 4–5 m (MLSW4-1), 6.5–7.5 m (MLSW4-2), 8–9 m (MLSW4-3), 11–12 m (MLSW4-4) during the hydraulic performance monitoring of the virtual barrier with the GCWs (c). TCE concentrations detected over time at the internal site monitoring wells (d,e).
The reconstructed framework provides points for reflection. Firstly, only the simultaneous management of all information related to the geological, hydrogeological, hydrogeophysical, and hydrochemical spheres allows the delineation of the contamination source not identified by previous traditional investigations, defining plume migration patterns, and understanding contaminant transport processes in a complex environment. The capability of MIPs to identify volumes impacted by residual phase pollutants is well-known in the literature [22]. In the present case, HRSC through direct push investigation guides an effective and targeted installation of groundwater monitoring points. We know the well’s behavior before drilling, adding valuable elements to the MCS. In this regard, the digital conceptual model is a multicriteria puzzle of analysis that simplifies the process of multi-source data fusion and exchange, capturing the hydrogeophysical–chemical conceptualization, decrypting the hydrogeological influences behind contamination processes and dynamics, and guiding the application of remediation technology in line with both strategic objectives and the principles of remediation geology [68,88]. Delving into the accuracy of our multi-source model, we added a high-fidelity filter to our interpolation technique as an additional gridding option. This ensures that the voxel values in the 3D digital model match the MIP data profiles, observations of stratigraphic contacts in drilled boreholes, and contaminant concentration measurements in sampling wells. By reducing the interpolation error to zero at sampling points where hydrogeochemical and hydrogeophysical data are available, we ensure a high degree of confidence in our geomodelling [89]. For this site, the integration of digital technologies such as 3D modeling and visualization of geospatial data was incorporated into environmental decision-making processes, leading to a shift in environmental procedures from safety measures to prevention-oriented approaches.
While the virtual hydraulic barrier with GCWs marks the debut of this configuration, the reduction in TCE concentrations in the influent within the treatment section inside the ROI and the disruption of the plume spatial continuity validate the effectiveness and performance of the recirculation system for intercepting dissolved contaminants and acting as hydraulic containment systems. With this configuration, the GCWs are clearly more effective than the on-site P&S system, as the P&S wells were positioned ignoring the location of the secondary source, without following any barrier criteria, and evidently do not contribute effectively to the hydraulic confinement of the site from external contamination [90]. Comparing the estimated mass of TCE removed by the 3 GCWs and the mass of TCE removed by the on-site P&S system over a 4-month period clearly and quantitatively highlights the inefficacy of traditional physical water extraction systems, which are designed on an approximate CSM, in intercepting a contamination plume. The three GCWs and the 15 wells used for the P&S system remove a mass of TCE equal to 3360 and 111 g, respectively (Figure 9a). Furthermore, during a comparable monitoring period, the volumes of water recirculated by the GCWs and pumped by traditional physical extraction wells amounted to 5922 and 821 m3, respectively (Figure 9b).
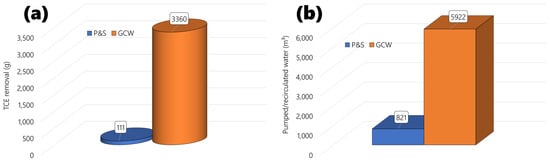
Figure 9.
Comparison between the 3 GCWs and the on-site P&S system in terms of removed TCE mass (a) and recirculated/treated groundwater (b) during the running period of the virtual barrier.
While groundwater recirculation systems eliminate water resource consumption, the P&S system generates a volume of groundwater to be allocated as waste [91]. Although the disparity in groundwater resource consumption between traditional pumping systems and groundwater recirculation systems is extensively documented in the literature [34,54,92], comparative performance assessments of these remediation systems often refer to applications in source areas [55,87]. In comparison to previous studies, the findings of this research strongly suggest that the application of a traditional hydraulic barrier, ignoring the complex architecture of the contamination source and the migration patterns of pollutants in groundwater, drastically reduces the ability to effectively intercept the plume and remove significant masses of pollutants, despite a large and well-known consumption of groundwater resources. This context, representing a worst-case scenario for a traditional hydraulic barrier relying on an approximate or even unknown conceptual model, underscores the inefficacy and unsustainability of P&S/P&T compared to GCWs even for the interception and removal of the contamination plume.
4. Conclusions
The research underscores the efficacy of a holistic, data-centric approach in conceptualizing and tackling groundwater contamination. Through the integration of geological, hydrochemical, and hydrogeophysical data, this comprehensive methodology adeptly identifies contamination sources, maps pollution dynamics, and crafts bespoke remediation strategies. The digital, data-driven, multi-source clone elucidates how intricate lithostratigraphic formations and groundwater flow patterns influence contaminant migration. The 3D hydrogeochemical model contextualizes pollution dynamics within the geological framework, serving as a dynamic platform to inform the design of advanced remediation strategies by manipulating information in space–time. The implementation of a cutting-edge virtual hydraulic barrier, comprising strategically positioned groundwater circulation wells (GCWs), successfully intercepts and treats TCE plume originating from the secondary source delineated through a membrane interface probe (MIP). This underscores the pivotal role of a precise conceptual site model in guiding effective remediation endeavors. Comparative analyses between GCWs and conventional pumping systems demonstrate greater effectiveness and sustainability of the recirculation system in pollutant removal and groundwater conservation. Field observations suggest that this approach offers a more sustainable alternative to traditional P&T/P&S methods for plume containment. In essence, these findings emphasize the importance of leveraging cutting-edge digital tools and geospatial techniques in remediation geology for sustainable and efficient groundwater management. These advancements herald a paradigm shift towards more informed and proactive approaches to environmental remediation. Embracing a 3D digital, multi-source puzzle-based approach has the potential to radically transform the management of environmental issues. Digital technologies like 3D modeling and visualization of geospatial data could increasingly integrate into environmental decision-making processes, urging authorities and companies towards a more proactive stance on environmental management.
Supplementary Materials
The following supporting information can be downloaded at: https://www.mdpi.com/article/10.3390/su16125216/s1, Figure S1: Location of the 15 P&S wells within the domain of the thermoelectric power plant.
Author Contributions
Conceptualization, P.C. and M.P.P.; methodology, G.F. and D.F.; software, P.C.; validation, M.P.P. and C.E.; formal analysis, P.C.; investigation, P.C.; resources, M.P.P.; data curation, P.C., G.F. and D.F.; writing—original draft preparation, G.F. and D.F.; writing—review and editing, P.C.; visualization, P.C., G.F. and D.F.; supervision, C.E.; project administration, M.P.P. All authors have read and agreed to the published version of the manuscript.
Funding
This research did not receive any specific grant from funding agencies in the public, commercial, or not-for-profit sectors.
Institutional Review Board Statement
Not applicable.
Informed Consent Statement
Not applicable.
Data Availability Statement
The data supporting the findings of this study are available within the article and are available from the corresponding author upon reasonable request.
Acknowledgments
We extend our heartfelt thanks to Ernst Bartsch and Eduard Alesi of IEG Technologies GmbH, as well as to Riccardo Mozzi and Paolo Stigliano of CESI, for their invaluable technical assistance and collaboration throughout the planning, investigation, and implementation stages of this research. We are deeply grateful for their contributions, which have greatly enriched our work and helped us achieve our objectives.
Conflicts of Interest
The authors declare no conflicts of interest.
References
- He, H.; Li, Y.; Shen, R.; Shim, H.; Zeng, Y.; Zhao, S.; Lu, Q.; Mai, B.; Wang, S. Environmental occurrence and remediation of emerging organohalides: A review. Environ. Pollut. 2021, 290, 118060. [Google Scholar] [CrossRef] [PubMed]
- Newell, C.J.; Cowie, I.; McGuire, T.M.; McNab, W.W. Multiyear temporal changes in chlorinated solvent concentrations at 23 monitored natural attenuation sites. J. Environ. Eng. 2006, 132, 653–663. [Google Scholar] [CrossRef]
- Rivett, M.O.; Turner, R.J.; Murcott, P.G.; Cuthbert, M.O. The legacy of chlorinated solvents in the Birmingham aquifer, UK: Observations spanning three decades and the challenge of future urban groundwater development. J. Contam. Hydrol. 2012, 140–141, 107–123. [Google Scholar] [CrossRef] [PubMed]
- Moran, M.J.; Zogorski, J.S.; Squillace, P.J. Chlorinated solvents in groundwater of the United States. J. Environ. Sci. 2007, 41, 74–81. [Google Scholar] [CrossRef] [PubMed]
- Walaszek, M.; Cary, L.; Billon, G.; Blessing, M.; Bouvet-Swialkowski, A.; George, M.; Criquet, J.; Mossmann, J.R. Dynamics of chlorinated aliphatic hydrocarbons in the Chalk aquifer of northern France. Sci. Total Environ. 2021, 757, 143742. [Google Scholar] [CrossRef]
- Kueper, B.H.; Stroo, H.F.; Vogel, C.M.; Ward, C.H. Chlorinated Solvent Source Zone Remediation; Springer: New York, NY, USA, 2014. [Google Scholar]
- Brusseau, M.L.; Pepper, I.L.; Gerba, C.P. (Eds.) Environmental and Pollution Science. In Soil and Groundwater Remediation; Academic Press: New York, NY, USA, 2019; pp. 329–335. [Google Scholar]
- Suthersan, S.S.; Horst, J.; Schnobrich, M.; Welty, N.; Mcdonough, J. Remediation Engineering, Design Concepts, 2nd ed.; CRC Press: Boca Raton, FL, USA, 2016; pp. 107–135. [Google Scholar]
- Carey, G.R.; McBean, E.A.; Feenstra, S. DNAPL Source Depletion: 2. Attainable Goals and Cost–Benefit Analyses. Remediation 2014, 24, 79–106. [Google Scholar] [CrossRef]
- Yang, L.; Wang, X.; Mendoza-Sanchez, I.; Abriola, L.M. Modeling the influence of coupled mass transfer processes on mass flux downgradient of heterogeneous DNAPL source zones. J. Contam. Hydrol. 2018, 211, 1–14. [Google Scholar] [CrossRef]
- Tatti, F.; Petrangeli Papini, M.; Raboni, M.; Viotti, P. Image analysis procedure for studying Back-Diffusion phenomena from low-permeability layers in laboratory tests. Sci. Rep. 2016, 6, 30400. [Google Scholar] [CrossRef]
- Brooks, M.C.; Yarney, E.; Huang, J. Strategies for Managing Risk due to Back Diffusion. Groundwater Monit. Remediat. 2021, 41, 76–98. [Google Scholar] [CrossRef]
- Saiyari, D.M.; Chuang, H.P.; Senoro, D.B.; Lin, T.F.; Whang, L.M.; Chiu, Y.T.; Chen, Y.H. A review in the current developments of genus Dehalococcoides, its consortia and kinetics for bioremediation options of contaminated groundwater. Sustain. Environ. Res. 2018, 28, 149–157. [Google Scholar] [CrossRef]
- Sleep, B.E.; Brown, A.J.; Lollar, B.S. Long-term tetrachloroethene degradation sustained by endogenous cell decay. J. Environ. Eng. Sci. 2005, 4, 11–17. [Google Scholar] [CrossRef]
- Abbaspour, K.; Matta, V.; Huggenberger, P.; Johnson, C.A. A contaminated site investigation: Comparison of information gained from geophysical measurements and hydrogeological modeling. J. Contam. Hydrol. 2000, 40, 365–380. [Google Scholar] [CrossRef]
- Costa, C.; Jesus-Rydin, C. Site investigation on heavy metals contaminated ground in Estarreja—Portugal. Eng. Geol. 2001, 60, 39–47. [Google Scholar] [CrossRef]
- Sandberg, S.K.; Slater, L.D.; Versteeg, R. An integrated geophysical investigation of the hydrogeology of an anisotropic unconfined aquifer. J. Hydrol. 2002, 267, 227–243. [Google Scholar] [CrossRef]
- Soupios, P.M.; Kouli, M.; Vallianatos, F.; Vafidis, A.; Stavroulakis, G. Estimation of aquifer hydraulic parameters from surficial geophysical methods: A case study of Keritis Basin in Chania (Crete–Greece). J. Hydrol. 2007, 338, 122–131. [Google Scholar] [CrossRef]
- Tizro, A.T.; Voudouris, K.S.; Salehzade, M.; Mashayekhi, H. Hydrogeological framework and estimation of aquifer hydraulic parameters using geoelectrical data: A case study from West Iran. Hydrogeol. J. 2010, 18, 917. [Google Scholar] [CrossRef]
- Hubbard, S.S.; Rubin, Y. 2000 Hydrogeological parameter estimation using geophysical data: A review of selected techniques. J. Contam. Hydrol. 2000, 45, 3–34. [Google Scholar] [CrossRef]
- McCall, W.; Christy, T.M.; Pipp, D.A.; Jaster, B.; White, J.; Goodrich, J.; Fontana, J.; Doxtader, S. Evaluation and application of the optical image profler (OIP) a direct push probe for photo-logging UV-induced fuorescence of petroleum hydrocarbons. Environ. Earth. Sci. 2018, 77, 374. [Google Scholar] [CrossRef]
- McAndrews, B.; Heinze, K.; DiGuiseppi, W. Defining TCE plume source areas using the membrane interface probe (MIP). Soil Sediment Contam. 2003, 12, 799–813. [Google Scholar] [CrossRef]
- Algreen, M.; Kalisz, M.; Stalder, M.; Martac, E.; Krupanek, J.; Trapp, S.; Bartke, S. Using pre-screening methods for an effective and reliable site characterization at megasites. Environ. Sci. Pollut. Res. 2015, 22, 14673–14686. [Google Scholar] [CrossRef]
- Dietrich, P.; Leven, C. Direct push-technologies. In Groundwater Geophysics: A Tool for Hydrogeology; Springer: Berlin/Heidelberg, Germany, 2009; pp. 347–366. [Google Scholar]
- Liu, G.; Devlin, J.F.; Dietrich, P.; Butler, J.J., Jr. High-Resolution Characterization of the Shallow Unconsolidated Subsurface Using Direct Push, Nuclear Magnetic Resonance, and Groundwater Tracing Technologies. In Advances in the Characterisation and Remediation of Sites Contaminated with Petroleum Hydrocarbons; Springer International Publishing: Cham, Switzerland, 2023; pp. 171–212. [Google Scholar]
- Schulmeister, M.K.; Butler, J.J., Jr.; Healey, J.M.; Zheng, L.; Wysocki, D.A.; McCall, G.W. Direct-push electrical conductivity logging for high-resolution hydrostratigraphic characterization. Groundwater Monit. Remediat. 2003, 23, 52–62. [Google Scholar] [CrossRef]
- McCall, W.; Christy, T.M. The hydraulic profiling tool for hydrogeologic investigation of unconsolidated formations. Grounwater Monit. Remediat. 2020, 40, 89–103. [Google Scholar] [CrossRef]
- Butler, J.J., Jr.; Healey, J.M.; McCall, G.W.; Garnett, E.J.; Loheide, S.P. Hydraulic tests with direct-push equipment. Groundwater 2002, 40, 25–36. [Google Scholar] [CrossRef] [PubMed]
- Dietrich, P.; Butler, J.J., Jr.; Faiß, K. A rapid method for hydraulic profiling in unconsolidated formations. Groundwater 2008, 46, 323–328. [Google Scholar] [CrossRef] [PubMed]
- Liu, G.; Butler, J.J., Jr.; Bohling, G.C.; Reboulet, E.; Knobbe, S.; Hyndman, D.W. A new method for high-resolution characterization of hydraulic conductivity. Water Resour. Res. 2009, 45, W08202. [Google Scholar] [CrossRef]
- Adamson, D.T.; Chapman, S.; Mahler, N.; Newell, C.; Parker, B.; Pitkin, S.; Rossi, M.; Singletary, M. Membrane interface probe protocol for contaminants in low-permeability zones. Groundwater 2014, 52, 550–565. [Google Scholar] [CrossRef]
- Kurup, P.U.; Issac, B.; Griffin, E.P. Electronic nose–membrane interface probe for geoenvironmental site characterization. J. Geotech. Geol. Eng. 2006, 132, 1133–1142. [Google Scholar] [CrossRef]
- McCall, W.; Christy, T.M.; Pipp, D.; Terkelsen, M.; Christensen, A.; Weber, K.; Engelsen, P. Field application of the combined membrane-interface probe and hydraulic profiling tool (MiHpt). Groundwater Monit. Remediat. 2014, 34, 85–95. [Google Scholar] [CrossRef]
- Ciampi, P.; Esposito, C.; Bartsch, E.; Alesi, E.J.; Petrangeli Papini, M. 3D dynamic model empowering the knowledge of the decontamination mechanisms and controlling the complex remediation strategy of a contaminated industrial site. Sci. Total Environ. 2021, 793, 148649. [Google Scholar] [CrossRef]
- Utom, A.U.; Werban, U.; Leven, C.; Müller, C.; Dietrich, P. Adaptive observation-based subsurface conceptual site modeling framework combining interdisciplinary methodologies: A case study on advancing the understanding of a groundwater nitrate plume occurrence. Environ. Sci. Pollut. Res. 2019, 26, 15754–15766. [Google Scholar] [CrossRef]
- Ciampi, P.; Esposito, C.; Bartsch, E.; Alesi, E.J.; Nielsen, C.; Ledda, L.; Lorini, L.; Petrangeli Papini, M. Coupled Hydrogeochemical Approach and Sustainable Technologies for the Remediation of a Chlorinated Solvent Plume in an Urban Area. Sustainability 2022, 14, 10317. [Google Scholar] [CrossRef]
- Jones, R.R.; Mccaffrey, K.J.W.; Clegg, P.; Wilson, R.W.; Holliman, N.S.; Holdsworth, R.E.; Imber, J.; Waggott, S. Integration of regional to outcrop digital data: 3D visualisation of multi-scale geological models. Comput. Geosci. 2009, 35, 4–18. [Google Scholar] [CrossRef]
- Parker, B.L.; Chapman, S.W.; Guilbeault, M.A. Plume persistence caused by back diffusion from thin clay layers in a sand aquifer following TCE source-zone hydraulic isolation. J. Contam. Hydrol. 2008, 102, 86–104. [Google Scholar] [CrossRef] [PubMed]
- Sale, T.; Newell, C.J. Impacts of source management on chlorinated solvent plumes. In In Situ Remediation of Chlorinated Solvent Plumes; SERDP/ESTCP Environmental Remediation Technology; Springer: New York, NY, USA, 2010; pp. 185–216. [Google Scholar]
- Brusseau, M.L.; Guo, Z. Assessing contaminant-removal conditions and plume persistence through analysis of data from long-term pump-and-treat operations. J. Contam. Hydrol. 2014, 164, 16–24. [Google Scholar] [CrossRef]
- Faisal, A.A.H.; Sulaymon, A.H.; Khaliefa, Q.M. A review of permeable reactive barrier as passive sustainable technology for groundwater remediation. Int. J. Environ. Sci. Technol. 2018, 15, 1123–1138. [Google Scholar] [CrossRef]
- Hou, D.; Al-Tabbaa, A.; O’Connor, D.; Hu, Q.; Zhu, Y.G.; Wang, L.; Kirkwood, N.; Ok, Y.S.; Tsang, D.C.W.; Bolan, N.S.; et al. Sustainable remediation and redevelopment of brownfield sites. Nat. Rev. Earth Environ. 2023, 4, 271–286. [Google Scholar] [CrossRef]
- Kuppusamy, S.; Palanisami, T.; Megharaj, M.; Venkateswarlu, K.; Naidu, R. In-Situ Remediation Approaches for the Management of Contaminated Sites: A Comprehensive Overview; Springer International Publishing: Cham, Switzerland, 2016. [Google Scholar]
- Ciampi, P.; Zeppilli, M.; Lorini, L.; Villano, M.; Esposito, C.; Nielsen, C.; Ledda, L.; Olivieri, S.; Petrangeli Papini, M. Coupling Physical and Chemical-Biological Techniques for the Remediation of Contaminated Soils and Groundwater. In The Handbook of Environmental Chemistry; Springer: Berlin/Heidelberg, Germany, 2024. [Google Scholar]
- Ebrahimbabaie, P.; Pichtel, J. Biotechnology and nanotechnology for remediation of chlorinated volatile organic compounds: Current perspectives. Environ. Sci. Pollut. Res. 2021, 28, 7710–7741. [Google Scholar] [CrossRef]
- Guo, Z.; Brusseau, M.L.; Fogg, G.E. Determining the long-term operational performance of pump and treat and the possibility of closure for a large TCE plume. J. Hazard. Mater. 2019, 365, 796–803. [Google Scholar] [CrossRef]
- Colombano, S.; Davarzani, H.; Van Hullebusch, E.D.; Huguenot, D.; Guyonnet, D.; Deparis, J.; Lion, F.; Ignatiadis, I. Comparison of thermal and chemical enhanced recovery of DNAPL in saturated porous media: 2D tank pumping experiments and two-phase flow modelling. Sci. Total Environ. 2021, 760, 143958. [Google Scholar] [CrossRef]
- Rivett, M.O.; Chapman, S.W.; Allen-King, R.M.; Feenstra, S.; Cherry, J.A. Pump-and-treat remediation of chlorinated solvent contamination at a controlled field-experiment site. Environ. Sci. Technol. 2006, 40, 6770–6781. [Google Scholar] [CrossRef]
- Herrling, B.; Stamm, J.; Buermann, W. Hydraulic circulation system for in situ bioreclamation and/or in situ remediation of strippable contamination. In In Situ Bioreclamation; Hinchee, R.E., Olfenbuttel, R.F., Eds.; Butterworth-Heinemann: Boston, MA, USA, 1991; pp. 173–195. [Google Scholar]
- Herrling, B.; Stamm, J.; Alesi, E.J.; Brinnel, P.; Hirschberger, F.; Sick, M.R. In situ groundwater remediation of strippable contaminants by vacuum vaporizer wells (UVB): Operation of the well and report about cleaned industrial sites. In Proceedings of the Third Forum on Innovative Hazardous Waste Treatment Technologies: Domestic and International, Dallas, TX, USA, 11–13 June 1991. [Google Scholar]
- Stamm, J. Vertical Circulation Flows for In-situ Bioremediation in Aquifers. In Bioremediation: Principle and Practice, Fundamentals and Applications; Sikdar, K.S., Irvine, L.R., Eds.; Technomic Publishing Co.: Lancaster, UK, 1997; Volume 1. [Google Scholar]
- Herrling, B.; Stamm, J. Numerical Results of Calculated 3D Vertical Circulation Flows Around Well with Two Screen Sections for in Situ or On-Site Aquifer Remediation. In Proceedings of the 9th International Conference on Computational Methods in Water Resources, Denver, CO, USA, 1 June 1992. [Google Scholar]
- Miller, G.R.; Elmore, A.C. Modeling of a groundwater circulation well removal action alternative. J. Hazard. Toxic Radioact. Waste 2005, 9, 122–129. [Google Scholar] [CrossRef]
- Petrangeli Papini, M.; Majone, M.; Arjmand, F.; Silvestri, D.; Sagliaschi, M.; Sucato, S.; Alesi, E.J.; Barstch, E.; Pierro, L. First pilot test on the integration of GCW (groundwater circulation well) with ENA (enhanced natural attenuation) for chlorinated solvents source remediation. Chem. Eng. 2016, 49, 91–96. [Google Scholar]
- Ciampi, P.; Esposito, C.; Petrangeli Papini, M. Review on groundwater circulation wells (GCWs) for aquifer remediation: State of the art, challenges, and future prospects. Groundw. Sustain. Dev. 2024, 24, 101068. [Google Scholar] [CrossRef]
- Xia, Q.; Zhang, Q.; Xu, M.; Tang, Y.; Teng, H. Visualizing hydraulic zones of a vertical circulation well in presence of ambient flow. Desalin. Water Treat. 2019, 159, 151–160. [Google Scholar] [CrossRef]
- Zhu, Q.; Wen, Z.; Zhan, H.; Yuan, S. Optimization strategies for in situ groundwater remediation by a vertical circulation well based on particle-tracking and node-dependent finite difference methods. Water Resour. Res. 2020, 56, e2020WR027396. [Google Scholar] [CrossRef]
- Elmore, A.C.; Graff, T. Best Available Treatment Technologies Applied to Groundwater Circulation Wells. Remediat. J. 2002, 12, 63–80. [Google Scholar] [CrossRef]
- Kahler, D.M.; Kabala, Z.J. Rapidly pulsed pumping accelerates remediation in a vertical circulation well model. Water 2018, 10, 1423. [Google Scholar] [CrossRef]
- Montgomery, M.T.; Spargo, B.J.; Mueller, J.G.; Coffin, R.B.; Smith, D.C.; Boyd, T.J. Bacterial production stimulated across the zone of influence of a ground water circulation well in a BTEX-contaminated aquifer. Groundwater Monit. Remediat. 2002, 22, 144–150. [Google Scholar] [CrossRef]
- Gandhi, R.K.; Hopkins, G.D.; Goltz, M.N.; Gorelick, S.M.; McCarty, P.L. Full-scale demonstration of in situ cometabolic biodegradation of trichloroethylene in groundwater 2. Comprehensive analysis of field data using reactive transport modeling. Water Resour. Res. 2002, 38, 11-1–11-18. [Google Scholar] [CrossRef]
- Tawabini, B.; Makkawi, M. Remediation of MTBE-contaminated groundwater by integrated circulation wells and advanced oxidation technologies. Water Supply 2018, 18, 399–407. [Google Scholar] [CrossRef]
- Knox, R.C.; Sabatini, D.A.; Harwell, J.H.; Brown, R.E.; West, C.C.; Blaha, F.; Griffin, C. Surfactant remediation field demonstration using a vertical circulation well. Groundwater 1997, 35, 948–953. [Google Scholar] [CrossRef]
- Wang, P.; Li, J.; An, P.; Yan, Z.; Xu, Y.; Pu, S. Enhanced delivery of remedial reagents in low-permeability aquifers through coupling with groundwater circulation well. J. Hydrol. 2023, 618, 129260. [Google Scholar] [CrossRef]
- Blanford, W.J.; Barackrnan, M.L.; Boing, T.B.; Klingel, E.J.; Johnson, G.R.; Brusseau, M.L. Cyclodextrin-enhanced vertical flushing of a trichloroethene contaminated aquifer. Groundwater Monit. Remediat. 2007, 21, 58–66. [Google Scholar] [CrossRef]
- McCarty, P.L.; Goltz, M.N.; Hopkins, G.D.; Dolan, M.E.; Allan, J.P.; Kawakami, B.T.; Carrothers, T.J. Full-scale evaluation of in situ cometabolic degradation of trichloroethylene in groundwater through toluene injection. Environ. Sci. Technol. 1998, 32, 88–100. [Google Scholar] [CrossRef]
- Ciampi, P.; Esposito, C.; Bartsch, E.; Alesi, E.J.; Rehner, G.; Petrangeli Papini, M. Remediation of chlorinated aliphatic hydrocarbons (CAHs) contaminated site coupling groundwater recirculation well (IEG-GCW) with a peripheral injection of soluble nutrient supplement (IEG-C-MIX) via multilevel-injection wells (IEG-MIW). Heliyon 2022, 8, e11402. [Google Scholar] [CrossRef]
- Ciampi, P.; Esposito, C.; Bartsch, E.; Alesi, E.J.; Rehner, G.; Morettin, P.; Pellegrini, M.; Olivieri, S.; Ranaldo, M.; Liali, G.; et al. A data-driven modeling approach for the sustainable remediation of persistent arsenic (As) groundwater contamination in a fractured rock aquifer through a groundwater recirculation well (IEG-GCW®). Environ. Res. 2023, 217, 114827. [Google Scholar] [CrossRef] [PubMed]
- Vats, O.P.; Sharma, B.; Stamm, J.; Bhattacharjya, R.K. Groundwater circulation well for controlling saltwater intrusion in coastal aquifers: Numerical study with experimental validation. Water Resour. Manag. 2020, 34, 3551–3563. [Google Scholar] [CrossRef]
- Saad, S.; Javadi, A.A.; Abd-Elhamid, H.F.; Farmani, R. Mitigating seawater intrusion in coastal aquifers: Novel approach with treated wastewater injection and groundwater circulation. J. Hydrol. 2023, 626, 130139. [Google Scholar] [CrossRef]
- Sanz de Ojeda, J.; Sanz, E.; Elorza, F.J.; Riaguas, C.S.; Liaño, M.D.P. Simulation of Groundwater Flow in an Aquiclude for Designing a Drainage System during Urban Construction: A Case Study in Madrid, Spain. Sustainability 2021, 13, 1526. [Google Scholar] [CrossRef]
- Chang, P.Y.; Chang, L.C.; Hsu, S.Y.; Tsai, J.P.; Chen, W.F. Estimating the hydrogeological parameters of an unconfined aquifer with the time-lapse resistivity-imaging method during pumping tests: Case studies at the Pengtsuo and Dajou sites, Taiwan. J. Appl. Geophy. 2017, 144, 134–143. [Google Scholar] [CrossRef]
- Allègre, V.; Brodsky, E.E.; Xue, L.; Nale, S.M.; Parker, B.L.; Cherry, J.A. Using earth-tide induced water pressure changes to measure in situ permeability: A comparison with long-term pumping tests. Water Resour. Res. 2016, 52, 3113–3126. [Google Scholar] [CrossRef]
- Aguzzi, M.; Amorosi, A.; Colalongo, M.L.; Lucchi, M.R.; Rossi, V.; Sarti, G.; Vaiani, S.C. Late Quaternary climatic evolution of the Arno coastal plain (Western Tuscany, Italy) from subsurface data. Sediment. Geol. 2007, 202, 211–229. [Google Scholar] [CrossRef]
- Sun, H.; Zhong, J.; Zhao, Y.; Shen, S.; Shang, Y. The influence of localized slumping on groundwater seepage and slope stability. J. Earth Sci. 2013, 24, 104–110. [Google Scholar] [CrossRef]
- Laor, Y.; Ronen, D.; Graber, E.R. Using a passive multilayer sampler for measuring detailed profiles of gas-phase VOCs in the unsaturated zone. J. Environ. Sci. 2003, 37, 352–360. [Google Scholar] [CrossRef]
- Nsir, K.; Schäfer, G.; Di Chiara Roupert, R.; Mercury, L. Pore scale modelling of DNAPL migration in a water–saturated porous medium. J. Contam. Hydrol. 2018, 215, 39–50. [Google Scholar] [CrossRef] [PubMed]
- Azzellino, A.; Colombo, L.; Lombi, S.; Marchesi, V.; Piana, A.; Merri, A.; Alberti, L. Groundwater diffuse pollution in functional urban areas: The need to define anthropogenic diffuse pollution background levels. Sci. Total Environ. 2019, 656, 1207–1222. [Google Scholar] [CrossRef]
- Sterling, S.N.; Parker, B.L.; Cherry, J.A.; Williams, J.H.; Lane, J.W., Jr.; Haeni, F.P. Vertical cross contamination of trichloroethylene in a borehole in fractured sandstone. Groundwater 2005, 43, 557–573. [Google Scholar] [CrossRef]
- Ma, C.; Shi, W.; Zhan, H. On the vertical circulation wells in a leaky-confined aquifer. J. Hydrol. 2022, 608, 127676. [Google Scholar] [CrossRef]
- Van Beek, K.; Breedveld, R.; Stuyfzand, P. Preventing two types of well clogging. J.-Am. Water Works Assoc. 2009, 101, 125–134. [Google Scholar] [CrossRef]
- Parker, B.L.; Cherry, J.A.; Chapman, S.W. Field study of TCE diffusion profiles below DNAPL to assess aquitard integrity. J. Contam. Hydrol. 2004, 74, 197–230. [Google Scholar] [CrossRef]
- Chapman, S.W.; Parker, B.L. Plume persistence due to aquitard back diffusion following dense nonaqueous phase liquid source removal or isolation. Water Resour. Res. 2005, 41, W12411. [Google Scholar] [CrossRef]
- Rasa, E.; Chapman, S.W.; Bekins, B.A.; Fogg, G.E.; Scow, K.M.; Mackay, D.M. Role of back diffusion and biodegradation reactions in sustaining an MTBE/TBA plume in alluvial media. J. Contam. Hydrol. 2011, 126, 235–247. [Google Scholar] [CrossRef] [PubMed]
- McDade, J.M.; Kulkarni, P.R.; Seyedabbasi, M.A.; Newell, C.J.; Gandhi, D.; Gallinatti, J.D.; Cocianni, V.; Ferguson, D.B.J. Matrix Diffusion Modeling Applied to Long-Term Pump-and-Treat Data: 1. Method Development. Remediat. J. 2013, 23, 71–91. [Google Scholar] [CrossRef]
- Tatti, F.; Petrangeli Papini, M.; Torretta, V.; Mancini, G.; Boni, M.R.; Viotti, P. Experimental and numerical evaluation of Groundwater Circulation Wells as a remediation technology for persistent, low permeability contaminant source zones. J. Contam. Hydrol. 2019, 222, 89–100. [Google Scholar] [CrossRef] [PubMed]
- Ciampi, P.; Esposito, C.; Bartsch, E.; Alesi, E.J.; Petrangeli Papini, M. Pump-and-treat (P&T) vs. groundwater circulation wells (GCW): Which approach delivers more sustainable and effective groundwater remediation? Environ. Res. 2023, 234, 116538. [Google Scholar] [PubMed]
- Ciampi, P.; Cassiani, G.; Deidda, G.P.; Esposito, C.; Rizzetto, P.; Pizzi, A.; Petrangeli Papini, M. Understanding the dynamics of enhanced light non-aqueous phase liquids (LNAPL) remediation at a polluted site: Insights from hydrogeophysical findings and chemical evidence. Sci. Total Environ. 2024, 932, 172934. [Google Scholar] [CrossRef] [PubMed]
- Ciampi, P.; Giannini, L.M.; Cassiani, G.; Esposito, C.; Petrangeli Papini, M. Geo-constrained clustering of resistivity data revealing the heterogeneous lithological architectures and the distinctive geoelectrical signature of shallow deposits. Eng. Geol. 2024, 337, 107589. [Google Scholar] [CrossRef]
- Truex, M.; Johnson, C.; Macbeth, T.; Becker, D.; Lynch, K.; Giaudrone, D.; Frantz, A.; Lee, H. Performance assessment of pump-and-treat systems. Groundwater Monit. Remediat. 2017, 37, 28–44. [Google Scholar] [CrossRef]
- Bardos, P. Progress in sustainable remediation. Remediat. J. 2014, 25, 23–32. [Google Scholar] [CrossRef]
- Pierro, L.; Matturro, B.; Rossetti, S.; Sagliaschi, M.; Sucato, S.; Alesi, E.; Bartsch, E.; Arjmand, F.; Petrangeli Papini, M. Polyhydroxyalkanoate as a slow-release carbon source for in situ bioremediation of contaminated aquifers: From laboratory investigation to pilot-scale testing in the field. New Biotechnol. 2017, 37, 60–68. [Google Scholar] [CrossRef]

Disclaimer/Publisher’s Note: The statements, opinions and data contained in all publications are solely those of the individual author(s) and contributor(s) and not of MDPI and/or the editor(s). MDPI and/or the editor(s) disclaim responsibility for any injury to people or property resulting from any ideas, methods, instructions or products referred to in the content. |
© 2024 by the authors. Licensee MDPI, Basel, Switzerland. This article is an open access article distributed under the terms and conditions of the Creative Commons Attribution (CC BY) license (https://creativecommons.org/licenses/by/4.0/).