Abstract
Higher education institutions (HEIs) play a key role in fostering sustainability, since students will be future active society members. By providing them with the knowledge, skills, and mindset needed to address environmental challenges, they can contribute to increasing sustainability in a long-term approach. With the effects of climate change strongly affecting water availability across the planet, it is increasingly relevant to understand whether higher education students are aware of this situation, in order to develop adequate measures to promote sustainable behaviors regarding water use. This study aimed to assess students’ perceptions regarding water efficiency through a questionnaire submitted in seven HEIs in Portugal. Students acknowledged the importance of water, with older students, women and science students demonstrating a greater awareness. Despite this, 27% of students do not know what the average water consumption in Portugal is, and only 18% accurately reported the consumption range in Portugal. There is also a lack of knowledge (>50% students) regarding whether common water efficiency measures are applied in their HEI. The main information sources identified by the students were “social communication” and “internet/social media”, revealing that water efficiency knowledge transfer in high education can be improved.
1. Introduction
Higher education institutions (HEIs) may contribute to sustainability by internal and external acts, through activities based on their sustainability policy, their campus sustainability, their environmental initiatives, and their curricula and research [1]. Universities are also expected to engage internally and externally, actively participating in the regions where they are located [2].
Previous works studied the importance of different HEI stakeholders in fostering sustainability, namely top management, teachers, and students. In fact, studies have demonstrated the key contribution made by teachers in achieving the Sustainable Development Goals (SDGs) [3]. However, few research studies have addressed students’ insights in this matter and, assuming that today’s students will soon be the world’s leaders, a better understanding of their opinions and attitudes towards the SDGs must be gathered [4].
The educational role of HEIs in society assigns them a significant responsibility in the establishment of sustainability [5]. By assembling and expressing suitable curricula and course plans, the HEIs can induce sustainability concerns into students’ characters, with the organization’s behavior and values influencing each student uniqueness, worldview, and ethics. Thus, the importance of HEIs as such and their future role in shaping the conception of a sustainable society are recognized and projected [6].
Sustainable and integrated water management should be one of the main concerns of the activity of any HEI, motivating adequate education, research, and services to the community [7]. Mismanagement and over-consumption have made the water resources scarce and endangered. In order to carry this information to the public and promote change, it is important to understand the current attitude of the students attending higher education towards the topic. This insight will help develop more effective methods to raise awareness, inspire action, and allow consumers to adopt water-saving habits or choose wisely when acquiring equipment. In fact, proper water management involves, among other things, increasing efficiency and good water consumption practices [8].
The topic of natural resource preservation has generated increased attention from individuals across the world, allowing people who are disconnected from the issue of water conservation to become aware of how water depletion may directly or indirectly affect their lives [9]. Forecasting how individuals or groups will respond to the potential risk of water scarcity is important in developing an educational curriculum, marketing campaigns, and effective conservation methods [10]. Demographic characteristics such as age, education, gender, and political orientation [11,12,13] have been shown to influence environmental consciousness and preservation.
Water availability is also being more and more influenced by climate change. According to the Aqueduct worldwide database of the World Resources Institute, 25 countries face extremely high water stress each year, regularly using up almost their entire available water supply. By 2050, an additional 1 billion people are expected to live with extremely high water stress [14]. Portugal is considered one of the countries with high water stress (20–80%), occupying the 43rd place in the ranking. Precipitation has been reduced by 15% in the last 20 years in Portugal and is expected to further decrease by 10 to 25% until the end of the century. This phenomenon has strong impacts on the water availability in the country, leading to a reduction in water availability of around 20% in the last 20 years [15].
It is therefore of extreme relevance to ensure an adequate water management and to raise awareness, since population growth, economic development and climate change can all contribute to exacerbating water stress. Higher education students play a key role in this process, since they will be the adults that will manage and have a direct influence on the way water is used over the next decades. However, little official research concerning university students has studied their insights, purposes, or actions regarding the issue of water conservation. The study carried out by Barreiros et al. [16] provided insights into water consumption and the water management approaches adopted at HEIs in Portugal, highlighting the relevance of monitoring water use, the use of reducers on taps, and the implementation of awareness campaigns as good practices. In any case, the awareness of students is not guaranteed by good water practices in HEIs, and the relevance of understanding the perceptions and behaviors regarding the sustainable use of potable water of students motivated the authors to develop the survey documented in the present study. Although there are a few studies concerning sustainability and sustainable development [4,17,18], the authors believe this to be one of the firsts of its kind, at least regarding students at Portuguese higher education institutions.
The present study was conducted by the Working Group on Efficient Use of Water (WGEUW), of the Portuguese Sustainable Campus Network (RCS-Portugal). The Portuguese Sustainable Campus Network (RCS-Portugal) was established in 2018 as a collaborative platform for academia to address sustainable development challenges. Its objectives include mobilizing the academic community, creating strategies for sustainable practices in higher education institutions (HEIs), fostering cooperation among network members, and promoting joint initiatives among HEIs for sustainability. The WGEUW focuses on implementing water efficiency measures on HEIs campuses and transforming them into hubs for demonstrating good practices. This research aims to understand attitudes and behaviors regarding water conservation in the academic community, shedding light on the diverse perspectives that students bring to the crucial topic of sustainable water use and contributing to creating awareness about the water scarcity issue, one of the biggest challenges of this century, worsened by climate change. By comprehensively examining these dimensions, the research aims to contribute valuable knowledge that can inform policies, educational initiatives, and practices aimed at promoting a more environmentally conscious and water-efficient mindset among the student population at Portuguese HEIs. Through this research, we aspire to cultivate a deeper understanding of the intricate interplay between environmental awareness, individual behaviors, and the overarching goal of sustainable water management.
The primary goal of the survey was to assess students’ knowledge, perceptions, and practices related to water efficiency, and to gather their opinions on the integration of water efficiency measures in the campus, curriculum, and future workplaces. This research had two overarching objectives. The first objective aimed to test and evaluate students’ attitudes and levels of environmental awareness regarding the sustainable use of water, while the second objective sought to analyze the role of HEIs in addressing water efficiency.
2. Methodology
2.1. Research Questions
The rationale of the current research paper is to explore the perceptions, practices, and opinions concerning water efficiency by Portuguese higher education students. The data collection instrument used was a questionnaire created by the WGEUW. The questionnaire, which was previously approved by the participants’ HEI Ethics Committee, included a free and informed Consent Form, which explicitly stated that the data collected would be treated anonymously and confidentially, that it would be used solely for academic purposes, and that the student’s participation was voluntary. The questionnaire was carried out online, through EUSurvey, between July and October 2023. The link to the questionnaire was distributed among students at seven Portuguese HEIs by email.
To achieve the objectives of this study, the following research questions (RQ) were formulated:
- RQ1. Do students understand the importance of water resources?
- RQ2. What is students’ perceptions regarding water consumption?
- RQ3. What is students’ perceptions regarding measures to reduce water consumption?
- RQ4. Are students familiar with the institution’s initiatives in the field of water efficiency?
- RQ5. What are the sources of knowledge regarding water management and water efficiency concepts?
- RQ6. What are students’ reactions regarding water efficiency issues in future employment. Is there a significant relationship between student’s pro-sustainable behaviors and their reactions.
- RQ7. Are students familiar with the relation between water management and the Sustainable Development Goals?
The respondent perspectives in each RQ were analyzed considering differences relative to age, gender, area of knowledge or region of Portugal.
2.2. Survey
The survey was divided into seven thematic sections. Section 1 concerns personal information and a general characterization of the students. Section 2 includes questions to assess the students’ perceptions on the importance of water resources. Section 3 includes questions related to the students’ water efficiency practices. Section 4 refers to water efficiency measures on campus. The final three sections dealt, respectively, with how students obtain knowledge about diverse topics related to water efficiency, students’ perspectives about water efficiency in future employment and, finally, the relation between water efficiency and the Sustainable Development Goals (SDGs), as defined by the United Nations (UN) [19].
Most of the questions are multiple choice with only one option to select, but some allow two, three, or more options from a pre-defined list. Some of these questions were asked in the form of a matrix to collect multiple data points.
Some questions used a Likert scale to assess the degree of acceptance of certain statements. The option was to use a five-point Likert scale for statements arranged in order from total rejection to complete acceptance.
The complete questionnaire is presented in Table S1 of the Supplementary Materials.
2.3. Data Analysis
Statistical analysis was conducted using SPSS software (version 29.0.1.0). The data were first analyzed using descriptive statistic methods. Each statistical test was conducted considering the significance level of 0.05 (alpha). All Likert scale questions were considered on an ordinal scale, with responses encoded as a value from 1 through 5. For this reason, instead of reporting the mean and standard deviation, the median and interquartile range (IQR) are used in the descriptive statistics, as they provide a more accurate measure of the central tendency [20]. The IQR can be interpreted as a measure of the spread of the data of the central group. In this view, if IQR = 0, then a significant number of respondents provided the same answer.
The differences in the respondent’s age (A), gender (B), scientific area (C), and region of Portugal (D) were analyzed through non-parametric tests after determining the absence of normality using the Kolmogorov–Smirnov and Shapiro–Wilk tests.
The Kruskal–Wallis one-way analysis of variance (which is an extension of the Mann–Whitney U test for more than two groups) was used to test whether the difference in distributions of three or more groups concerning one factor is significant. Since the Kruskal–Wallis test does not specify which groups are statistically significantly different, where the significant differences were found, multiple comparisons were considered. The statistically significant differences are highlighted in the results sections, and the p-values of the Kruskal–Wallis analysis are presented in Tables S2–S8 of the Supplementary Materials.
In questions that allowed multiple answers, the link between them was analyzed visually through a simplified network analysis, using Gephi software (v0.1) [21].
3. Results
3.1. Sample Characterization
The seven HEIs that participated in this study are public institutions, spread across the country, and include the two Portuguese higher education subsystems, universities and polytechnics. Table 1 shows the characterization of the students from the different HEIs participating in this research.

Table 1.
Sample characterization.
The survey gathered responses from a total of 663 students across various fields and study levels at the seven HEIs. For statistical validity, the sample size should reflect the overall student population, which numbered 45,142 in 2023. Using Cochran’s modified formula for finite populations [22], the sample size of 663 has a 99% confidence level and a maximum margin of error of 5%, which is considered a satisfactory and representative sample size.
The sample respondents included 50% females, 48.9% males, and 0.8% identifying as other genders. Most individuals (66%) were aged between 17 and 23, with 36% aged between 17 and 20 and 30% between 21 and 23, which was expected. However, 13.4% of respondents were over 33 years old. The seven HEIs are distributed across different NUTs (nomenclature of territorial units for statistics) according to the Commission Delegate Regulation 2019/1755 of 8 August.
Regarding the country of origin, 86.0% are Portuguese and 14% are foreigners. Among the students who answered the survey, 16.4% are pursuing a master’s degree and 69.4% are pursuing a graduate degree. Engineering and technologies represent 50.8% of the study areas, followed by medical and health sciences (11.8%), agricultural sciences (3.3%), exact sciences (0.8%), and natural sciences (3.2%).
3.2. Importance of Water Resources
The perceptions of students regarding the importance of water resources (RQ1) was assessed though two main questions: (1) agreement/disagreement with five different water-related statements and (2) expectations about changes in water resources that can occur in Portugal in the next 50 years.
3.2.1. Statements Related to the Importance of Water Resources
Students were asked to classify their level of agreement/disagreement with five different water-related statements:
- -
- Water resources are essential for the livelihood and health of the environment;
- -
- Water resources are essential for human activities;
- -
- The availability of fresh water is low and limited globally;
- -
- Today’s society faces the problems of water scarcity and pollution;
- -
- Drinking water is an inexpensive resource.
Most answers to these questions demonstrated agreement, except for the last one, in which there was significant dispersion, with most answers being neutral. This result is not totally unexpected and shows a relation with the geographical origin of the respondent. The answers to these questions had Median = 5 and IQR = 1, with the greatest dispersion in the last one. The left side of Figure 1 presents the overall answers, and the right side presents the median, IQR, and significant differences (Kruskal–Wallis one-way analysis of variance) for p-values < 0.05.
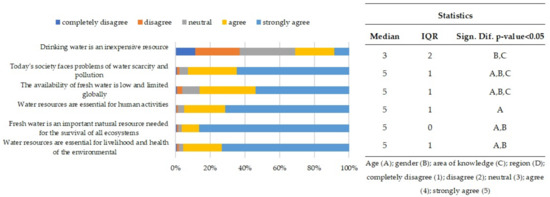
Figure 1.
Student’s perceptions regarding the importance of water resources.
Most of the answers correspond to a strong agreement, which shows that the respondents recognize the importance of the water resource and are concerned about the problems of pollution and scarcity.
There were significant differences in the distribution of responses by age group and gender on the question of whether water resources are essential for life and for the health of the environment. Students in the older age groups and the women were more likely to strongly agree (100% and 79.6%, respectively).
There were also significant differences in the distribution of responses by age group and gender when asked whether they thought fresh water was an important natural resource needed for the survival of all ecosystems. The students in the older age groups and the women were more likely to strongly agree (97.8% and 91%, respectively).
When asked whether they considered water resources to be essential for human activities, there were significant differences in the distribution of responses by age group. The students in the older age groups were more likely to strongly agree (83.1%).
There were significant differences in the distribution of responses by age group, gender, and area of knowledge when asked whether they thought the availability of fresh water worldwide was low and limited. Older students and women were more likely to strongly agree (71.9% and 63.5%, respectively). The students in exact sciences and natural sciences were more likely to agree or strongly agree (80% and 85.7%, respectively).
As to whether they think that today’s society faces the problems of water scarcity and pollution, there were significant differences in the distribution of responses by age group, gender, and area of knowledge. The students in the older age groups and the women were more likely to strongly agree (80.9% and 76.9%, respectively). A significant number of students in Exact Sciences and Natural Sciences responded only with a simple “agree”.
When asked whether they thought drinking water was an inexpensive resource, there were significant differences in the distribution of responses by gender and scientific discipline. The women were more likely to disagree or strongly disagree (41%), and the men were more likely to agree (34%). The students in social sciences and medicine were the most likely to disagree or strongly disagree (44.9% and 46.2%, respectively). The students in engineering and technology showed an even distribution of response percentages between disagree/neutral/agree. This greatest dispersion in responses to this question can be linked to the answer regarding the question about how much a liter of tap water costs. Most participants did not know how much a liter of water costs, but only 38% recognized this, and only 13% selected “less than 0.5 cents” as their response. Additionally, water prices in Portugal are not uniform across regions; a DECO study using 2021 prices states that the lowest possible value per liter is 0.03 cents, and the highest possible value is 0.2 cents [23].
3.2.2. Changes in Water Resources That Can Occur in Portugal in the Next 50 Years
The students were asked to classify the expected changes in seven issues related to water resources: (1) biodiversity, (2) average sea level, (3) drought frequency, (4) flood frequency, (5) aquifer recharge, (6) river drainage, and (7) precipitation.
For precipitation, river flow, aquifer recharge, and biodiversity, most responses show a decreasing trend (median = 3) with almost no dispersion (IQR = 1 or IQR = 0). On the other hand, for the frequency of floods and droughts and mean sea level, the vast majority of responses show an increasing trend (median = 1). The largest dispersion is seen for the frequency of floods, although the increase in flood frequency is clearly stated (62.4%) (Figure 2).
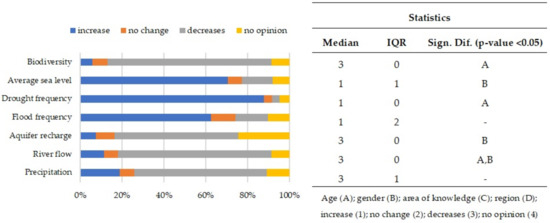
Figure 2.
Students’ perceptions of what could happen to water resources in Portugal in the next 50 years.
The majority of the responses seems to show a significant awareness of the foreseen incoming challenges in the next 50 years.
Regarding changes in river flow, there were significant differences in the distribution of responses by age group and gender. The older students were more likely to say that river flows would decrease (85.4%). The female students were more likely to say that river flows would decrease (74.3%).
As for changes in groundwater recharge, there were significant differences in the distribution of responses by gender. Female students were more likely to have no opinion (28.4%).
There were significant differences in the distribution of responses by age group about changes in the frequency of droughts. The older students were more likely to say that the frequency of droughts was increasing (93.3%).
Regarding changes in the mean sea level, there were significant differences in the distribution of responses by gender. Male students were more likely to say that there had been an increase (74.4%).
Finally, changes in biodiversity prompted significant differences in the distribution of responses by age group. The older students were more likely to say that biodiversity was decreasing (88.8%).
3.3. Water Efficiency Practices
Students’ perceptions regarding water consumption (RQ2) and their perceptions regarding measures to reduce water consumption (RQ3) were assessed in the following dimensions:
- -
- The qualitative and quantitative assessment of water consumption in daily activities;
- -
- Average daily consumption per capita in Portugal;
- -
- Overall and individual measures to promote an efficient water management;
- -
- The reduction in water waste on HEI campuses.
3.3.1. Qualification of Water Consumption in Daily Activities
Students’ perceptions regarding water consumption was evaluated in two phases, both in multiple daily practices. First, a consumption qualification (Figure 3) was conducted, followed by a consumption quantification. The activities included were “Garden irrigation”, “Use of dishwasher”, “Use of laundry machine”, “Toilet flushing”, “Hand washing” and “Daily bath”.
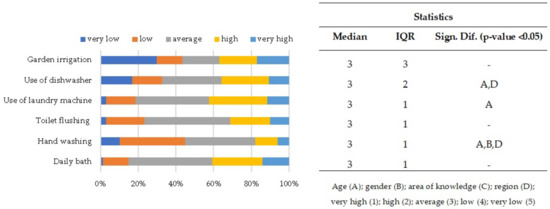
Figure 3.
Students’ perceptions regarding the qualification of water consumption.
For all activities except “Use of laundry machine”, more than 60% of responses refer to an average, low, or very low consumption, which may demonstrate care in daily practices. A median value of 3 was obtained for all questions, which corresponds to the “average”, with an almost weak dispersion (IQR = 1,) except for the inquiries concerning the “Use of dishwasher” (IQR = 2) and water consumption for “Garden irrigation” (IQR =3). Regarding water consumption for “Garden irrigation”, the participants were divided into two groups with opposite responses.
Regarding “Daily bath”, “Food preparation”, and “Use of laundry machine”, there were no significant differences in any of the classes analyzed.
Regarding “Hand washing”, there were significant differences in the distribution of responses by age group, gender, and region.
This result raises the question of whether they have an accurate understanding of the real consumption of water in the activities in which they seem to be careful.
3.3.2. Individual Water Consumption in Daily Activities
This question was designed to find out how well the students understood the different consumption patterns related to everyday activities: “5 min shower”, an “immersion bath”, “hand washing”, “toilet flushes”, “food preparation”, “Use of laundry machine”, “Machine dishwasher”, “Hand laundry”, “Hand dishwashing”, and “car washing”. This involved finding out whether the students were aware that different daily activities require significantly different amounts of water consumption. They were asked to provide estimates within a range of values.
Estimating the water consumption in different daily activities is a challenging task, as illustrated by the discrepancies between various sources in their respective consumption estimates, as shown in Table 2 and the ANIQP study [24]. The consumption in different activities is dependent upon several factors, and can vary widely, including the type of installation and the equipment installed. However, students tended to be fairly consistent in responding, with a narrow spread of responses (Figure 4). For almost all the tasks, an IQR of 1 was obtained, except for the answers for “hand washing”, with IQR = 0, and for “car washing” and “immersion bath”, with IQR = 2. Nevertheless, estimations are not always realistic. In most of the tasks, the consumption was underestimated, demonstrating a lack of knowledge of real consumption.
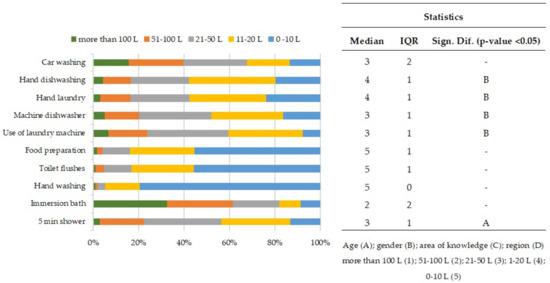
Figure 4.
Students’ perceptions regarding the quantification of water consumption.
The majority of students (43%) said they used less than 20 L of water per “5 min shower”, 34% said they used between 21 and 50 L, 20% between 51 and 100 L, and only 3% used over 100 L. In accordance with the stipulations for conferring ANQIP water efficiency labels upon shower and shower system appliances [25], the water consumption associated with a five-minute shower may vary from 25 to upwards of 150 L, contingent on the tap’s efficiency rating. These values correspond to the minimum and maximum values shown in Table 2. The aforementioned specifications stipulate that a shower tap exhibiting high efficiency shall have a flow rate ≤ 5 L/min, whereas a tap of low efficiency may display a flow rate > 30 L/min.
Although students underestimate the amount of water used in a shower, they acknowledge that it is less than in an “immersion bath”. The percentage of students who selected “more than 100 L” as their answer increased from 3% to 33%, while the percentage of those who selected the low value of less than 20 L decreased to 20%. As before, most students chose a range of values that is considerably lower. The water consumption values for an “immersion bath” can vary from 80 to 300 L, as shown in Table 2. For this reason, it would be expected that the most chosen interval would be “more than 100 L”.
It is during the manual laundry and dishwashing processes that students are least aware of the necessity of water consumption. Approximately 84% of students said that the amount of water used in manual laundry is less than 51 L, and 58% of students said that the amount of water used in manual dishwashing processes is less than 20 L. The water consumption of dishwashers and washing machines depends heavily on the type, nominal capacity, and program used (Table 2).
The most realistic choices made by the students were: “hand washing”, “toilet flushes”, and “food preparation”. For these tasks, most of the students chose a consumption between 0 and 10 L: for “hand washing”, 79%; for “toilet flushes”, 56%; and for “food preparation”, 56%.
In contrast to what Fan et al. [26] stated, there was no significant difference in response rates between genders in the daily tasks of “5 min shower”, “Immersion bath”, “Hand washing”, “Toilet flushes”, “Toilet flushes”, and “Car washing”.
However, in the daily tasks of washing clothes and dishes by hand or machine, there were significant differences based on gender. The male students tend to underestimate their consumption, particularly when it comes to hand-washing clothes and dishes.
Fan et al. (2014) [26] also observed a significant difference between age groups, but in this study, we only identified a significant difference in the estimated water consumption during a 5 min shower. In addition, in this case, as in Fan et al.’s study, the youngest underestimate consumption.
Table 2.
Consumption of water for different uses according to different references.
Table 2.
Consumption of water for different uses according to different references.
| Reference | [27] | [28] | [29] | [30] | [31] | [32] | [33] | [34] |
|---|---|---|---|---|---|---|---|---|
| 5 min shower | 30–124 L | 50–60 L | - | 50 L | 60 L | 30–150 L | 45–75 L | 25–65 L |
| Immersion bath | 150–200 L | 300 L | - | 200 L | 180 L | 80–140 L | 120 L | 80 L |
| Hand washing | - | - | 36 L | - | - | 5 L | - | - |
| Toilet flushes | 10 L | 10 L | 15 L | 10–12 L | 6–12 L | - | 4 L | 5–9 L |
| Use of laundry machine | - | - | 220 L (5 kg) | - | 25–60 L | 60–150 L | 90 per cycle | 50 L |
| Dishwasher Machine | 40 L/per cycle | 11–14 L | - | Ideal-9 L per cycle | 60–90 L | 18 L per cycle | 32 per cycle | 10–14 L |
| Hand laundry | 100 L | - | - | - | - | - | - | - |
| Car washing | 230 L | - | 40–500 L | - | - | - | - | 30–250 L |
3.3.3. Average Daily Water Consumption Per Inhabitant in Portugal
According to Pordata, Portugal’s average per capita water consumption in 2021 was 175 L/(inhab.d). However, this number varies by region. Tamega and Sousa have the lowest value, at 81 L/(inhab.d), while the Algarve has the highest value on the continent, at 319 L/(inhab.d) [35]. The answers to this question are widely distributed (IQR = 4) on a scale of 1 to 6, with most respondents (27%) selecting “I don’t know” (Figure 5). A mere 18% of the respondents accurately reported the range of 150–190 L/(inhab.d) as the average water consumption per Portuguese resident, nine percent (9%) chose a higher range of values, and the remaining forty-six percent (46%) chose ranges with lower values.
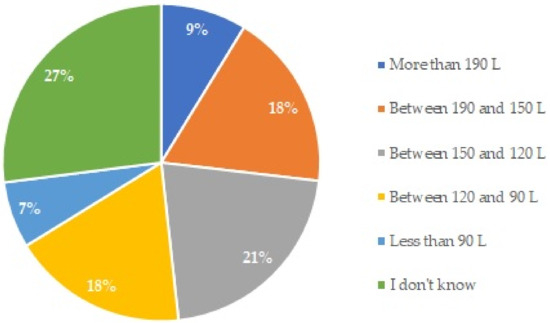
Figure 5.
Students’ perceptions regarding average daily water consumption per inhabitant in Portugal.
Since per capita consumption varies across the nation, it makes sense that there would be significant differences in the distribution of responses by region (K-W test p-values for regions is 0.010).
3.3.4. Overall Measures to Promote an Efficient Water Management
In order to assess the relevance of different management actions that can improve water efficiency, students were asked to rank four overall measures: (i) reduce leakages and waste, (ii) reduce consumption, (iii) use alternative water sources (other than potable water), and (iv) reuse and recycle previously used water. Figure 6 shows that more than 69% of students identified “Reduce leakages and waste” and “Reduce consumption” as the two main actions to improve water efficiency (ranked first or second). “Water reuse and recycling” was ranked in third place by 45% of the respondents, and the use of “Alternative water sources” was ranked fourth, demonstrating this measure was the least important for the large majority (70%) of the students. Although water reuse from treated wastewater is also considered an alternative water source, the ranking of “alternative water sources” last might be due to a lack of knowledge regarding, e.g., rainwater collection.
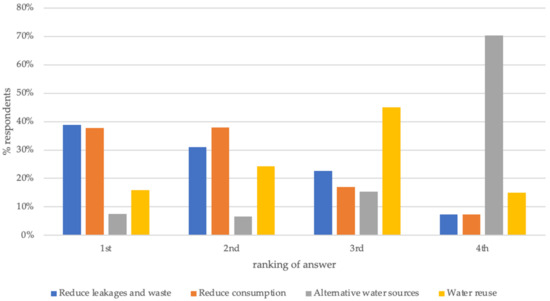
Figure 6.
Ranking of water management measures as % of respondents.
Statistical analysis was performed on the most relevant measures (ranked first and second) to understand the influence of gender, scientific area, region, and age on the importance level of different water efficiency measures. The statistical analysis revealed a significant difference only regarding the first ranked measure, where differences regarding age were statistically significant, mostly due to only a lower percentage of older students selecting “water reuse“ as the first ranked alternative (4%, 9% and 6% in 24–26, 27–22 and >33 age groups, respectively), while younger students selected “water resources” first in 19% (age group 17–20) and 39% of the answers (age group 21–23).
3.3.5. Individual Actions to Reduce Water Consumption
When asked to identify daily individual actions considered essential to reduce water consumption, the answers with more selections (between 41% and 49% of the respondents) were “taking a shower over a bath”, “taking a quick shower”, “closing the tap while soaping in the shower”, “using washing machines only when fully charged”, and “closing tap while brushing the teeth” (Figure 7).
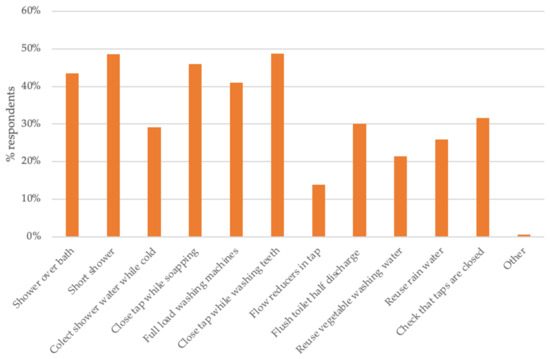
Figure 7.
Percentage of respondents that selected each individual action to reduce water consumption.
In order to reflect the different combinations of answers selected by students, pairs of answers were represented graphically in Figure 8, where each link represents two answers selected together. The width of each connection describes the number of times each pair was selected (the maximum number is represented in red), and the more frequent combinations were pairs among “taking a quick shower”, “closing the tap while soaping in the shower”, and “closing the tap while brushing the teeth”. Overall, the most popular actions are related to reducing water consumption, which is in accordance with the priorities selected in the overall measures to promote an efficient water management (see the previous section).
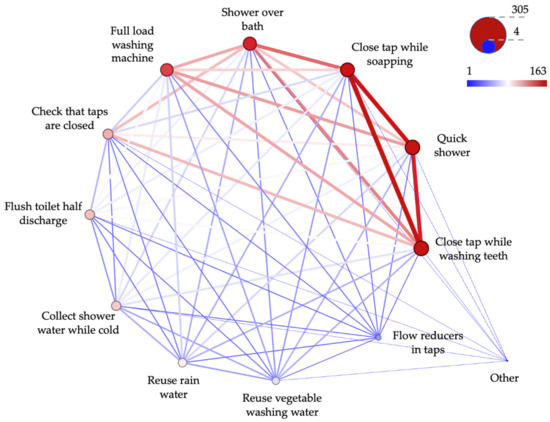
Figure 8.
Combination of responses. The size and color of the node represents the number of answers, and the thickness of the lines represents the number of times that combination was selected.
3.3.6. Specific Measures Regarding Irrigation
To assess specific measures regarding the reduction of irrigation in urban areas, students were asked to choose two or three measures from a list of seven. The action with the highest number of answers (28%) was “to collect rainwater and to use it in irrigation”, followed by “Summer irrigation at the beginning and end of the day” (23% respondents, Figure 9). The least popular measures, with less than 10% answers, included “watering directly from the plant base”, “place a protective cover to keep the soil cooler” and “reduce lawn areas”. This shows that students consider the use of alternative water sources, such as rainwater, to be relevant, and since this was not identified as an overall measure to reduce water consumption, it seems to show that students are not aware of what constitutes an alternative water source.
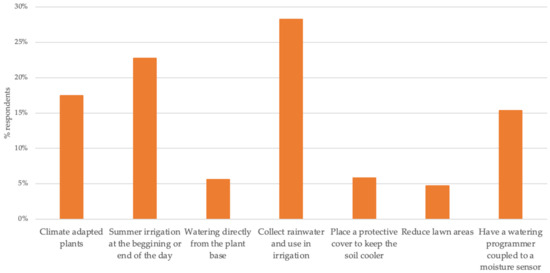
Figure 9.
Percentage of respondents that selected actions to reduce water consumption related to irrigation.
3.3.7. Attitude to Avoid Water Waste on Campus
Students were asked the frequency with which they performed seven actions aimed at reducing water waste on campus, from reporting water leaks to advising colleagues and adopting water saving measures (Figure 10). It was observed that students generally care about water loss when they see that a tap has been opened: 80.7% of students choose the “always” option when asked “turn off the tap when it’s not in use”. Nevertheless, they don’t always follow sensible water-saving habits; only 35.4% of them selected “Always”, and the majority of them acknowledge that they do so occasionally or not at all. The results are identical when it comes to water quality concerns and reports of ruptures or damage to installations (Figure 10).
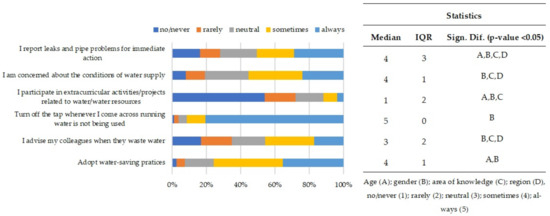
Figure 10.
Attitude to avoid water waste on HEI campus.
Nonetheless, they acknowledge that they participate in extracurricular activities that support the sustainable use of water very little or not at all; 54.0% of students say they never do, 3.6% say they do so constantly, and 8.1% say they do so occasionally.
All these attitudes differ significantly by gender, indicating that females have a more participatory attitude, as evidenced by a higher number of “sometimes” and “always” responses than males.
3.4. Water Efficiency Measures on Campus
The knowledge of students regarding their institution’s initiatives in the field of water efficiency (RQ4) was assessed by providing a list of nine actions to identify whether they were implemented in their institution or not.
The students’ response to the measures applied on their campuses reveals a lack of knowledge of what is happening at their HEIs, because in relation to “making use of rainwater (67.7%)”, “making use of grey water (73.5%)”, “publicizing the results of water consumption (55.8%)”, “choosing plants for green areas that are more suitable for the climate (57.5%)”, monitoring water consumption (67.0%), and watering lawns in periods of low heat (59.8%), the option chosen was “don’t know”. However, 43.7% and 44.8% of respondents answered “yes” to awareness campaigns and the use of taps with a timer or sensor to reduce water consumption, respectively. About dual-flush toilets, 37.3% answered “no”.
In terms of the measures applied on the campus where respondents attend, the results show that there were significant differences in the distribution of responses regarding the use of rainwater and grey water by areas of knowledge and region.
Regarding the area of knowledge, the results reveal that about 63% and 75% of respondents from business sciences and engineering and related areas, respectively, do not know whether rainwater is reused on their campy. Concerning grey water, only 5% of the students from engineering and related areas answered affirmatively.
Regarding the use of dual-flush cisterns, no significant differences were observed, but 68.8% answered “no” and/or don’t know” to the question whether this measure is applied on their campus, thus revealing poor knowledge of what is implemented on the different campuses.
There were significant differences in the distribution of responses regarding awareness campaigns to reduce water consumption by gender and areas of knowledge (Figure 11). Almost half of the women (49%), 39% of the men, and 40% of those who identified themselves as “other”, consider that awareness campaigns are measures applied on their campus. Regarding areas of knowledge, 42.7% of respondents from engineering and related areas, 60.0% from veterinary sciences, and 42.9% from unspecified area, are the ones who consider that awareness campaigns promote the reduction of water consumption and also report that these measures are applied on their campus. However, the respondents from business sciences (43.3%) and life sciences (42.9%) do not know if these measures are applied. These results seem to be expected, given that the area of knowledge of engineering and/or related areas includes environmental engineering, where these contents are covered in class, unlike the content in life sciences courses.
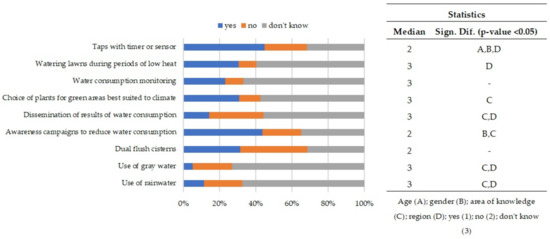
Figure 11.
Familiarity with campus initiatives.
A significant difference was observed in the distribution of responses regarding the dissemination of water consumption results, which includes reports, information campaigns, etc., and the cost associated with water consumption by areas of knowledge and region. Most respondents (55.8%) chose the answer “don’t know”, and only 14.2% replied “yes”. The exception observed by area of knowledge pertains to agriculture, forestry, and fisheries (22.7%), and by region, to Madeira (57.1%).
There were significant differences in the distribution of answers regarding the adequacy of chosen plants for green spaces to the specific climate, by area of knowledge, with 57.5% of respondents answering “don’t know” and 30.8% saying that the chosen plants are adequate to the specific climate. The exception observed by area of knowledge pertains to agriculture, forestry, and fisheries areas (68.1%) and physical science (60.0%). This result seems to be expected, given that students from these areas of knowledge can identify the type of vegetation (trees and shrubs) planted on their campus.
In relation to monitoring water consumption, no significant differences were observed, despite most of the respondents (77%) answering with “no” and/or don’t know” whether this measure is applied on their campus.
There were significant differences in the distribution of responses in relation to watering green spaces during periods of lower heat (beginning and end of the day) by region. Most respondents (59.7%) answered “don’t know”, 10% said “no”, and only 30.3% said “yes”. The positive answers were mostly from the Algarve region (53.8%) and from Madeira (71.4%).
The results show that most respondents identify the use of taps with a timer or sensor as a measure applied on their campus (44.8%), but 23.2% and 32.0% said “no” and “don’t know”, respectively. A significant difference was observed in the distribution of responses by the following variables: (a) age group: 50.4% (<23 year old) and 37% (above 23 year old) are aware of this measure; (b) gender: with the female respondents being the most aware (48.8%), the male respondents with only 41.0% of positive answers, and with a large percentage of recognized unawareness (71.4%) from the respondents who identified as other; (c) by area of knowledge: the majority (45.9%) of respondents consider that this measure is applied, 31.5% “don’t know”, and 23.5% said that this measure is not applied; (d) by region, circa 46% of respondents from Alentejo and from the Central region, and circa 61% of respondents from Algarve and from the Metropolitan area of Lisbon consider that this measure is applied, but 84% of respondents from Azores and from Madeira consider that this measure is not applied on their campus. Generally, it can be concluded that young students, female students, and students from the metropolitan area of Lisbon are more sensitive regarding the use of taps with a timer or sensor.
3.5. Learning Water Efficiency Measures
In order to assess what the sources of knowledge are regarding water management and water efficiency concepts (RQ 5), students were asked to identify the sources of knowledge among a list of six options: curricular units (subjects within courses), extracurricular units, awareness-raising information in HEI, social communication, Internet/social media, and family background. The knowledge topics considered included “urban water management measures”, “water saving equipment”, “water consumption monitoring methodologies”, “awareness raising measures” and “water reuse” (Figure 12).
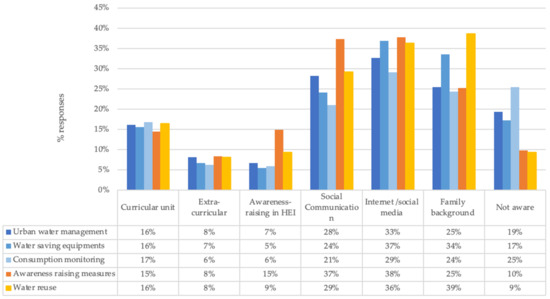
Figure 12.
Sources of knowledge reported by the students.
The main information sources identified by the students for all topics were “social communication” and “internet/social media”, which combined accounted for 61% of the students for all topics, except for “consumption monitoring”, where the same combined sources accounted for only 50% of the students’ answers. “Family background” was the third most selected source, which held special relevance regarding “water reuse”, selected by 39% of the students. Regarding the sources within HEIs, curricular units were reported by around 15% of the students as sources for all topics, while extracurricular activities and awareness-raising measures in HEIs were identified as sources of information by less than 10% of the students. A particular note must be made regarding awareness-raising measures within HEIs, which were only selected by 15% of the students, revealing that HEIs might not be very committed to implementing water efficiency on their own campus, or that they are not communicating effectively when implementing these measures.
3.6. Water Efficiency in Future Employment
The assessment of students’ reactions regarding water efficiency issues in future employment and willingness to act (RQ 6) was performed by asking if they would accept a salary 5% below average to work for a company in two situations: (i) a position where they could make a positive contribution to water efficiency and (ii) a company certified with good water management practices.
The results show that 46.2% of the total sample would opt for a job position that allows respondents to make a positive contribution to water efficiency (Table 3).
Table 3.
Students’ reactions concerning water efficiency issues in future employment.
The results also show that, concerning the possibility of accepting a job offer in a company that would allow respondents to make a positive contribution to water efficiency, there are significant differences in the distribution of responses by age group and gender, while in the areas of knowledge and region, no significant differences were observed.
The results also reveal that the young students (<20 years old) are more sensitive (56%, n = 239), showing a greater willingness to accept a job offer with equal benefits, with a salary 5% below average, provided that there was a positive contribution to water efficiency. The respondents in the remaining age groups (>21 years old) would not choose a job position that would allow them to make a positive contribution to water efficiency. This can be explained by the need to find a job or to assert themselves in the labor market.
On the other hand, regarding gender, women seem to be more sensitive (50.9%), as they chose to accept the job offer if the company was certified with good water efficiency practices, while men (59.3%) would not choose to accept the job offer if the company was certified with good water efficiency practices.
In relation to the students’ future employment, similar results were found by Aleixo et al. [4] regarding the students’ interest in working in a sustainable development (SD) company, with the youngest age group (17–19 years) preferring to work in this type of company, even if the salary is lower than average.
A proportion of 51.6% of the total respondents selected “yes” for the possibility of employment in a company certified with good water efficiency practices (Table 3). There are significant differences in the distribution of responses by gender and region. The female respondents (60.2%) and the people who identify as other gender (60.0%) are more sensitive than the male respondents (42.6%). The significant differences observed by region show that the respondents from Alentejo (50.7%), Centre (56.6%), and Azores (66.7%) would not opt primarily for employment in a company certified with good water efficiency practices. This could be explained by a lower development of these regions, with lower access to well-paid jobs. The respondents from the remaining regions (52.9%) would opt for a job in a company certified with good water efficiency practices.
3.7. Water Efficiency and the SDGs
The perceived connection between water efficiency and the Sustainable Development Goals (RQ7) was assessed by asking their opinion regarding the contribution of water efficiency to the 17 SDGs, allowing students to select between three and ten options. As the results showed, 25% selected three options, 32% selected four to six options, 28% selected seven to nine options, and 15% of the students selected ten options. The combination (pairs) of answers between the options selected by each respondent is graphically represented in Figure 13. The size and color of each SDG node represent the number of times each SDG was selected, and the width of each connection describes the number of times each pair was selected. As expected, SDG 6—Clean Water and Sanitation—was the most selected SDG, with 467 answers, representing 70% of the students. SDG 2—Zero Hunger, SDG 13—Climate Action, SDG 14—Life Below Water, and SDG15—Life on Land—had similar selection rates, between 51% and 53%.
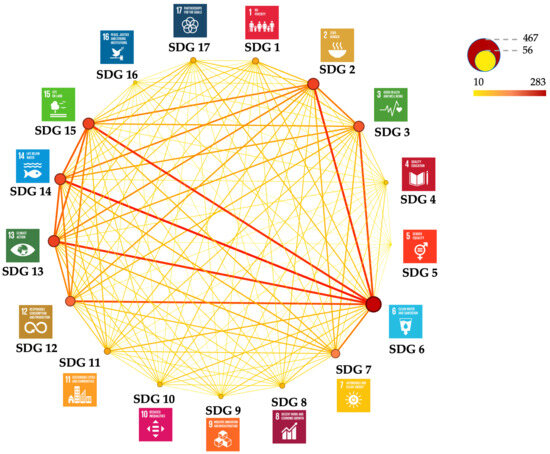
Figure 13.
Combination of responses. The size and color of the node represent the number of answers, and the thickness and color of the lines represent the number of times that combination was selected.
Regarding the combinations within the selected SDG in each answer, SDG 6 was mostly selected together with SDGs 2, 3, 12, 13, 14, and 15, but 12, 13, 14, and 15 were also selected together. These combinations suggest that students associate water efficiency in human activities to all SDGs directly related to water (SDG 6, 14, and 15) but also to human basic activities that can be affected by water (SDG 2) and climate change (SDG 13). Considering that UNWater clearly states that “Climate change is primarily a water crisis” [36], it can be concluded that the majority of the surveyed students are aware of this connection.
4. Conclusions
A survey was conducted in seven Portuguese higher education institutions, aimed at understanding students’ literacy in the sustainable use of potable water. The results revealed that students recognize the importance of water and are concerned about current water resources issues, with older students, women, and science students demonstrating greater awareness. There are variable perceptions and awareness regarding different issues, from water prices to foreseen changes in river flows and drought frequency, depending on gender and age. These findings inform targeted interventions for sustainable water management and ecosystem preservation.
Students demonstrate awareness of their water use habits, categorizing them as “average”. However, they tend to underestimate their real consumption when asked to quantify it. Male students particularly underestimate the use of water for tasks such as washing clothes and dishes by hand. There is a notable lack of knowledge about per capita water consumption, with significant regional variations in estimated values.
Students prioritized reducing water consumption to improve water efficiency, with new water sources ranking last in their preferences. Future policies should incorporate awareness campaigns and provide information on using reclaimed water to enhance public acceptance. They recognize the importance of water conservation on campus but admit inconsistent adherence, with women demonstrating more care and participation than men. It can also be concluded that young female students and respondents from the Lisbon metropolitan area are more sensitive to water efficiency measures, such as taps with timers or sensors.
The main sources of information on water efficiency identified by students were “social communication” and “internet/social networks”, but “family background” was also relevant. This highlights the relevance of transmitting accurate information through these channels, as well as the importance of the intergenerational transmission of knowledge, and reveals that the transfer of knowledge about water efficiency in higher education can be improved.
Regarding students’ responses to future employment, although younger students and women are more inclined to accept positions in companies certified for good water efficiency practices, even with lower salaries, there is no clear preference for either salary or environment. In spite of economic concerns, which lead students to prioritize salary, these results are nevertheless representative of an increasing willingness to act.
Finally, most students are aware of the link between water efficiency and the Sustainable Development Goals (SDGs), especially SDG 6—Clean Water and Sanitation. They also recognize the relevance and connections to other SDGs, namely SDG 2—Zero Hunger, SDG 13—Climate Action, SDG 14—Life Below Water, and SDG 15—Life on Earth.
The authors believe these insights can now guide future actions by higher education institutions to improve their training programs, initiatives, and practices on campuses, toward sustainable water management and the SDGs.
Supplementary Materials
The following supporting information can be downloaded at: https://www.mdpi.com/article/10.3390/su16125217/s1, Table S1: This appendix presents the questions that were included in the survey, taking into account the possible answers available; Table S2: Importance of water resources related statements; Table S3: Changes in water resources that can occur in Portugal in the next 50 years; Table S4: Water consumption qualification of daily activities; Table S5: Individual water consumption of daily activities; Table S6: Attitude to avoid water waste in campus; Table S7: Water efficiency measures in campus; Table S8: Water efficiency in future employment.
Author Contributions
Conceptualization, A.D., A.M.B., A.G., C.M., D.M., I.A., L.N. and S.M.; methodology, A.D., A.M.B., A.G., C.M., D.M., I.A., L.N. and S.M.; formal analysis, A.D., A.M.B., A.G. and S.M.; writing—original draft preparation, A.D., A.M.B., A.G., C.M., D.M., I.A. and S.M.; writing—review and editing, A.D., A.M.B., A.G., C.M., D.M., I.A., L.N. and S.M. All authors have read and agreed to the published version of the manuscript.
Funding
This work was partly funded by the Portuguese Foundation for Science and Technology under the following grants: project grant UIDB/00308/2020 with the DOI 10.54499/UIDB/00308/2020; UIDB/05183/2020 project grant and CHANGE—Instituto para as Alterações Globais e Sustentabilidade” with reference LA/P/0121/2020, with the DOI 10.54499/LA/P/0121/2020; project UDIB/04292/2020, granted to MARE, and the project LA/P/0069/2020 granted to the Associate Laboratory ARNET; project UID/05488/2020 granted to Techn&Art; and project grant UIDB/04625/2020 from the research unit CERIS (DOI 10.54499/UIDB/00308/2020).
Institutional Review Board Statement
This study was conducted in accordance with the Declaration of Helsinki and approved by the Ethics Committee of Instituto Politécnico de Beja (Parecer n. 1/2023, 3 June 2023).
Informed Consent Statement
Not applicable.
Data Availability Statement
Data is contained within the article and Supplementary Materials.
Conflicts of Interest
The authors declare no conflicts of interest.
References
- Mateus, D.M.R.; Pinho, H.J.O.; Nogueira, I.M.D.P.; Rosa, M.A.N.H.; Cartaxo, M.A.M.; Nunes, V.M.B. Participation of students in the project Valorbio: A case study to accelerate the implementation of sustainability principles in the curriculum. Int. J. Sustain. High. Educ. 2020, 21, 244–263. [Google Scholar] [CrossRef]
- Dagiliūtė, R.; Liobikienė, G. University contributions to environmental sustainability: Challenges and opportunities from the Lithuanian case. J. Clean. Prod. 2015, 108, 891–899. [Google Scholar] [CrossRef]
- Mateus, D.M.R.; Costa, M.C.O.; Gomes, M.M.M.S.; Pinho, H.J.O. Promoting Education for Sustainable Development: A Collaborative Project between a Higher Education Institution and the Surrounding School Community. In Handbook of Best Practices in Sustainable Development at University Level; Leal Filho, W., Portela de Vasconcelos, C.R., Eds.; Springer International Publishing: Cham, Switzerland, 2022; pp. 411–433. [Google Scholar] [CrossRef]
- Aleixo, A.M.; Leal, S.; Azeiteiro, U.M. Higher education students’ perceptions of sustainable development in Portugal. J. Clean. Prod. 2021, 327, 129429. [Google Scholar] [CrossRef]
- Yuan, X.; Zuo, J.; Huisingh, D. Green Universities in China—What matters? J. Clean. Prod. 2013, 61, 36–45. [Google Scholar] [CrossRef]
- Beynaghi, A.; Trencher, G.; Moztarzadeh, F.; Mozafari, M.; Maknoon, R.; Leal Filho, W. Future sustainability scenarios for universities: Moving beyond the United Nations Decade of Education for Sustainable Development. J. Clean. Prod. 2016, 112, 3464–3478. [Google Scholar] [CrossRef]
- Dawodu, A.; Dai, H.; Zou, T.; Zhou, H.; Lian, W.; Oladejo, J.; Osebor, F. Campus sustainability research: Indicators and dimensions to consider for the design and assessment of a sustainable campus. Heliyon 2022, 8, e11864. [Google Scholar] [CrossRef]
- Santos, A.; Oliveira, F.; Soares, G.; Carneiro, J.; Lima, L.; Viegas, M.; Corigo, P.; Nogueira, P.; Cardoso, P.; Quaresma, P. GT24 Uso Eficiente de Energia nos Serviços de Água; Entidade Reguladora dos Serviços de Águas e Resíduos: Lisbon, Portugal, 2018; ISBN 978-972-98996-5-2. Available online: https://www.ersar.pt/pt/publicacoes/publicacoes-tecnicas/guias (accessed on 27 May 2024).
- Lamm, A.J.; Taylor, M.R.; Lamm, K.W. Using Perceived Differences in Views of Agricultural Water Use to Inform Practice. J. Agric. Educ. 2016, 57, 180–191. [Google Scholar] [CrossRef]
- Wise, M.A. Relationship between University Student Characteristics and Water Conservation Behaviors; University of Arkansas: Fayetteville, AR, USA, 2020. [Google Scholar]
- Clark, W.A.; Finley, J.C. Determinants of Water Conservation Intention in Blagoevgrad, Bulgaria. Soc. Nat. Resour. 2007, 20, 613–627. [Google Scholar] [CrossRef]
- Corral-Verdugo, V.; Sing, B.; Pinheiro, J. Sustainable Behavior and Time Perspective: Present, Past, and Future Orientations and Their Relationship with Water Conservation Behavior. Rev. Interam. Psicol. 2006, 40, 139–147. Available online: http://pepsic.bvsalud.org/scielo.php?script=sci_arttext&pid=S0034-96902006000200001 (accessed on 5 February 2024).
- Chaudhary, A.K.; Lamm, A.J.; Warner, L.A. Using Cognitive Dissonance to Theoretically Explain Water Conservation Intentions. J. Agric. Educ. 2018, 59, 194–210. [Google Scholar] [CrossRef]
- Kuzma, S.; Saccoccia, L.; Chertock, M. 25 Countries, Housing One-quarter of the Population, Face Extremely High Water Stress. Available online: https://www.wri.org/insights/highest-water-stressed-countries (accessed on 27 May 2024).
- Agência Portuguesa do Ambiente. Avaliação das Disponibilidades Hídricas Atuais e Futuras e Aplicação do Índice de Escassez WEI+. Available online: https://participa.pt/pt/consulta/avaliacao-das-disponibilidades-hidricas-atuais-e-futuras-e-aplicacao-do-indice-de-escassez-wei (accessed on 27 May 2024).
- Barreiros, A.M.; Durão, A.; Galvão, A.; Matos, C.; Mateus, D.; Araújo, I.; Neves, L.; Matos, M.; Mourato, S. Analyzing Green Behavior and the Rational Use of Water in Portuguese Higher Education Campi. Sustainability 2023, 15, 3035. [Google Scholar] [CrossRef]
- Leal, S.; Azeiteiro, U.M.; Aleixo, A.M. Sustainable development in Portuguese higher education institutions from the faculty perspective. J. Clean. Prod. 2024, 434, 139863. [Google Scholar] [CrossRef]
- Ribeiro, J.M.P.; Hoeckesfeld, L.; Dal Magro, C.B.; Favretto, J.; Barichello, R.; Lenzi, F.C.; Secchi, L.; De Lima, C.R.M.; De Andrade, J.B.S.O. Green Campus Initiatives as sustainable development dissemination at higher education institutions: Students’ perceptions. J. Clean. Prod. 2021, 312, 127671. [Google Scholar] [CrossRef]
- United Nations. 17 Goals. Available online: https://sdgs.un.org/goals (accessed on 27 May 2024).
- Coolican, H. Multi-level analysis—Differences between more than two conditions (ANOVA). In Research Methods and Statistics in Psychology; Psychology Press: London, UK, 2014. [Google Scholar]
- Bastian, M.; Heymann, S.; Jacomy, M. Gephi: An Open Source Software for Exploring and Manipulating Networks. Proc. Int. AAAI Conf. Web Soc. Media 2009, 3, 361–362. [Google Scholar] [CrossRef]
- Cochran, W.G. Sampling Techniques, 3rd ed.; Wiley: Hoboken, NJ, USA, 1977. [Google Scholar]
- Proteste, D. Tarifas da Água: Custos Desiguais em Todo o País. Available online: https://www.deco.proteste.pt/casa-energia/agua/noticias/tarifas-agua-custos-desiguais-todo-pais (accessed on 27 May 2024).
- ANQIP—Associação Nacional para a Qualidade nas Instalações Prediais. Avaliação da Eficiência Hídrica de Edifícios Administrativos ou de Serviços de Apoio à Indústria. Available online: https://adaptis.uc.pt/uploads/article_document/file/10/Ferramenta_AdaptIS__Calculadora_.pdf (accessed on 5 February 2024).
- ANQIP—Associação Nacional para a Qualidade nas Instalações Prediais. ETA 0806—Especificações para a Atribuição de Rótulos de Eficiência Hídrica ANQIP a Chuveiros e Sistemas de Duche (Versão 4). 2020. Available online: https://repositorio.ipl.pt/bitstream/10400.21/2166/5/ETA_0806.3.pdf (accessed on 5 February 2024).
- Fan, L.; Wang, F.; Liu, G.; Yang, X.; Qin, W. Public Perception of Water Consumption and Its Effects on Water Conservation Behavior. Water 2014, 6, 1771–1784. [Google Scholar] [CrossRef]
- Abrantaqua. As 10 Maneiras Mais Fá ceis de Poupar Água. 2020. Available online: https://www.aguasdoalgarve.pt/sites/aguasdoalgarve.pt/files/publicacoes/10poupar_agua.pdf (accessed on 5 February 2024).
- Abrantaqua. Gestos Simples para um Melhor Futuro. Available online: https://www.abrantaqua.pt/index.php?id=1514 (accessed on 5 February 2024).
- EPAL. Não Deixe Que Esta Seja a Gota D’água—Poupe Hoje para ter Amanhã. Available online: https://www.epal.pt/EPAL/menu/%C3%A1gua/campanhas/n%C3%A3o-deixe-que-esta-seja-a-gota-d-%C3%A1gua (accessed on 5 February 2024).
- Região de Aveiro. Guia de Boas Práticas—Uso Sustentável da Água. Available online: https://www.cm-ilhavo.pt/cmilhavo2020/uploads/writer_file/document/1935/Guia_de_Boas_Pr_ticas__Uso_Sustent_vel_da__gua_.pdf (accessed on 5 February 2024).
- Administração dos Portos do Douro e Leixões. Boas Práticas para um Consumo Sustentável. Available online: https://www.apdl.pt/media/5i2de5un/guia-boas-pr%C3%A1ticas.pdf (accessed on 5 February 2024).
- Unitywater. Daily Water Usage Activities. Available online: https://www.unitywater.com/residential/manage-your-water-usage/why-your-water-usage-may-be-higher/water-usage-table (accessed on 5 February 2024).
- AquaSwitch. Water Footprint of Your Daily Life. Available online: https://www.aquaswitch.co.uk/blog/water-footprint-of-your-daily-life/ (accessed on 5 February 2024).
- GWMWater. How Much Water You Use. Available online: https://www.gwmwater.org.au/conserving-water/saving-water/how-much-water-you-use (accessed on 5 February 2024).
- Pordata. Água Distribuída/Consumida por Habitante. Available online: https://www.pordata.pt/municipios/agua+distribuida+consumida+por+habitante-484 (accessed on 5 February 2024).
- United Nations Water. Water and climate change. In The United Nations World Water Development Report; United Nations: New York, NY, USA, 2020; Available online: https://www.unwater.org/water-facts/water-and-climate-change (accessed on 5 February 2024).
Disclaimer/Publisher’s Note: The statements, opinions and data contained in all publications are solely those of the individual author(s) and contributor(s) and not of MDPI and/or the editor(s). MDPI and/or the editor(s) disclaim responsibility for any injury to people or property resulting from any ideas, methods, instructions or products referred to in the content. |
© 2024 by the authors. Licensee MDPI, Basel, Switzerland. This article is an open access article distributed under the terms and conditions of the Creative Commons Attribution (CC BY) license (https://creativecommons.org/licenses/by/4.0/).