Article

Cross-Cultural Behaviors: A Comparative Analysis of Driving Behaviors in Pakistan and China

by
Adnan Yousaf
1 and
Jianping Wu
1,2,3,*
1
School of Civil Engineering, Tsinghua University, Beijing 100084, China
2
Research Center for Autonomous Driving and Intelligent Transportation, Tsinghua University Research Institute at Shenzhen, Shenzhen 518000, China
3
Zero Carbon Transportation Research Center, Sichuan Tianfu Yongxing Laboratory, Chengdu 610213, China
*
Author to whom correspondence should be addressed.
Sustainability 2024, 16(12), 5225; https://doi.org/10.3390/su16125225
Submission received: 20 April 2024 / Revised: 31 May 2024 / Accepted: 4 June 2024 / Published: 19 June 2024

Abstract

:
When analyzing road safety across cultural boundaries, driver behavior is a crucial component to consider. Given that driver behavior directly affects both the likelihood of accidents and the severity of their implications, it is crucial to comprehend and analyze it. The present study examined the differences in dangerous, aberrant, and positive driving behaviors across China and Pakistan. The effects of these behaviors on road traffic accidents were also considered. In the study, 1253 respondents completed a questionnaire package consisting of the Dula Dangerous Driving Index (DDDI), Aberrant Driving Behavior Questionnaire (DBQ), Positive Driving Behavior Scale (PDBS), and items related to demographics. Generalized linear models were utilized to compare and determine the factors responsible for dangerous driving behaviors. Mean scores for DBQ and PDBS items were compared. Finally, binary logistic regression models were used to find the factors responsible for traffic accidents across both countries. The results indicated that aggressive and risky driving predicted traffic accidents in both countries, followed by errors and violations, which also predicted traffic accidents significantly. Positive driving behaviors predicted accidents negatively in both samples. Furthermore, it was found that Chinese drivers compared to Pakistani drivers are less aggressive and risk-taking and commit fewer violations and errors while driving. To increase road safety in Pakistan, traffic laws must be strictly enforced uniformly, and violations must result in severe penalties, i.e., demerit points or cancellation of a driver’s license. Programs for road safety awareness and education must be expanded. Employing national culturally concentrated road safety strategies may be a more effective way to encourage safe driving behaviors.

1. Introduction

A startling reality is that every year, 1.19 million people expire in vehicle crashes, and the toll is rising daily [1]. Significant repercussions from this worldwide problem include lost production, property damage, and most importantly human casualties. It is imperative that governments everywhere act swiftly and decisively to stop this growing issue. The disturbing estimate that 50 million individuals are injured in traffic accidents annually [2]) necessitates prompt and adequate action to solve this urgent problem. In developing countries, where the incidence of these kinds of incidents has increased dramatically, the issue is especially worrisome. It is intolerable that the number of injuries caused on roads will continue to rise if prompt action is not taken. Road accidents are caused by a multitude of factors, including human error, vehicle problems, and the overall state of the road environment [3]. It has been reported that human errors are responsible for 95 percent of accidents [4] that are eventually linked to driving behaviors. The way a driver behaves on the road can have a significant impact on traffic flow, and this includes not just technical capabilities but also psychological and social behaviors [5]. Human driving behavior is a complex idea that in general describes how the driver controls the car while operating it in a traffic situation and in relation to its surroundings [6]. Analyzing driver behavior (DB) helps to evaluate driver performance, improve traffic safety, and stimulate the emergence of smart and sustainable transportation systems [7].
Self-reported data on driving behavior might vary depending on a number of variables, including country contexts, cultural norms, and particular traffic laws. Thus, a “social desirability bias” can exist in the data. Information and communication technology (ICT) techniques have been used in several studies to gather data in order to expedite evaluations and reduce possible biases in the driving habits that drivers self-report [8]. Global positioning systems (GPSs) and in-car sensors are two of the most widely used techniques [9,10]. The use of driving simulators is another way to collect relevant driver behavior data in labs [11,12]. Notwithstanding noteworthy findings in current studies, there are issues with driving behavior data obtained using specific techniques. Among these difficulties are the significant costs associated with gathering data and the possibility of incomplete personal driving attribute records. Self-reported data are still an essential resource in these types of circumstances.
One of the most widely used tools for collecting self-report data in one form or another is the Driver Behavior Questionnaire (DBQ), developed originally by [13]. The instrument is utilized all around the world since it is based on the theory of human error, which differentiates abnormal driving behaviors from “errors and violations” [14]. Errors are inadvertent driving behaviors connected to a driver’s cognitive ability or limitations as determined by the DBQ, whereas deliberate and deviant driving behaviors are called violations [15]. The DBQ has been modified several times, resulting in forms with item counts ranging from 10 to 102, with items cut or increased to fit the convenience of the survey. Driving practices that frequently endanger other drivers or oneself are termed dangerous driving behaviors. These dangerous behaviors have three distinct forms, which are risky, negative emotions, and aggressive driving. There are various instruments apart from the DBQ that have been designed to determine dangerous driving behaviors, e.g., the Driving Anger Scale (DAS), the Driving Anger Expression Inventory (DAX), the Driver’s Angry Thought Questionnaire (DATQ), and the Propensity for Angry Driving Scale (PADS). These instruments measure anger only, whereas the instrument that can measure every form of dangerous behavior while driving was introduced by [16] and named the Dula Dangerous Driving Index (DDDI). It is an auto-report instrument that can quantify the driver’s aggressive driving, negative emotions while driving, and risky driving. The literature suggests that the DDDI is a reliable instrument for quantifying dangerous driving behaviors [16,17,18,19]. Other driving behaviors exist in addition to aberrant and dangerous driving behaviors that do not fall within the categories of errors or violations [15]. The behaviors that do not deviate from the safe driving practices are termed positive driving behaviors, as investigated by [15]. These cover a broad spectrum of behaviors, including paying attention to the driving environment, showing consideration for other drivers, and acting courteously and helpfully even when there is a risk to one’s safety. Ozkan and Lajunen [15] introduced the Positive Driver Behavior Scale (PDBS) to determine how frequently actions related to “maintaining a seamless vehicular movement” as well as “giving consideration to fellow drivers” occur. The PDBS is used as an additional factor along with the traditional DBQ used to measure aberrant driving behaviors.
Given that road deaths vary among cultures, it is imperative to examine the effects of driving behaviors through cross-cultural comparisons to obtain a greater knowledge of them. These disparities in driving behaviors are probably the result of large cultural differences. The China–Pakistan Economic Corridor (CPEC) initiative is the most recent manifestation of the long history of goodwill between China and Pakistan. After the completion of the CPEC, cross-border travel will be more frequent. China and Pakistan have different norms and cultures. Cultural differences can be the reason for the differences in driving behaviors between these two nations. By examining these variations, one might learn more about how culture affects traffic safety and perhaps put improvements into place. To the best of the authors’ knowledge, there is just one instance in the literature that looks at the driving behaviors of Chinese and Pakistani drivers together, i.e., Hussain and Shi [20], and this study only looked at aberrant driving behaviors. There has not been any published research on driving behaviors in China or Pakistan except for this one single study. This study’s primary objective is to compare driving behaviors, i.e., dangerous, aberrant, and positive, between China and Pakistan, two neighboring countries.

2. Literature Review

Aggressive driving contributes considerably to motor vehicle accidents and is a main factor in dangerous driving instances [16]. A plethora of scientific studies have been conducted in order to conceptualize and investigate this phenomenon. Aggressive driving is distinguished from risky driving by the driver’s intention to physically or psychologically harm others. An aggressive driver expresses annoyance in a variety of ways, such as verbal (e.g., yelling, cursing), physical (e.g., confrontations, fights), or by using the vehicle they are driving to intimidate others (e.g., flashing lights, honking, tailgating, cutting off) [21]. Driving infractions such as accidents and traffic citations are associated with aggressive driving. Anger, frustration, provocation, and aggravation, such as being upset or judging the acts of other drivers as inappropriate or dumb, are examples of negative cognitions and emotions when driving [16,19,22].
Errors and violations can provide serious risks and raise the possibility of collisions [23]. According to earlier studies, violations can be used to anticipate the likelihood of being engaged in crashes, whether one is looking ahead to potential hazards or back at previous instances [24,25]. Moreover, studies have shown that drivers’ self-reported propensity to commit different types of violations can predict their risk of being involved in collisions [15,26,27]. Hussain, Shi [28] found that distracted violations were the predictors of road traffic accidents in their study involving Pakistani drivers. Lajunen, Corry [29] discovered that Australian drivers had more accidents and were less concerned with safety than Finnish drivers. In a cross-cultural to study differences in driving behaviors, Özkan, Lajunen [23] revealed that drivers from Finland and Iran showed a strong correlation between the number of accidents and aggressive violations, whereas in Turkey, there was a strong correlation between errors and accident rates. This could suggest that Turkish drivers drive with narrower safety margins, which prevents them from making corrections after making a mistake and instead causes an accident. In another similar study, Warner, Özkan [26] found that compared to drivers in Greece and Turkey, drivers in Finland and Sweden report aggressive violations less frequently. Also, it was found that compared to Greek and Turkish drivers, drivers from Finland and Sweden report engaging in aberrant driving behavior and experiencing fewer accidents overall.
Ersan, Uzumcuoglu [30] conducted a study to identify cross-cultural variations in Estonian, Greek, Kosovar, Russian, and Turkish drivers’ hostile aggression, aggressive warnings, and revenge, as well as aberrant (errors and violations) and positive driving behaviors. The results revealed that compared to drivers in other nations, Turkish drivers had more aggressive driving styles. In terms of errors, Kosovar drivers scored higher than drivers from Estonia, Greece, and Russia. There was no significant difference found in the DBQ subscale scores of errors, violations, and positive driving behaviors between drivers from Greece and Estonia. Hussain, Miwa [8] evaluated self-reported and perceptions of others’ aberrant driving behaviors in a sample of drivers from China, Japan, and Vietnam. The study concluded that drivers may exhibit similar tendencies to those of their peers, and the frequency of their own aberrant driving behaviors may influence how frequently they perceive other drivers to exhibit the same behaviors. Furthermore, the examination of individual traits revealed that education levels and prior accident experiences had the most effects on the self-reported aggressive driving behavior (SADB) and the subjective assessment of others’ aggressive driving behavior OADB). In another study, the effects on fuel consumption and emissions of drivers being distracted by their phones at traffic signals were studied by Alemdar, Kayacı Çodur [31]. Roadside observations at crossroads in Turkey’s Erzurum Province were used for the study. The findings demonstrated that using a phone while waiting at a traffic light caused considerable delays, needless fuel use, and an increase in greenhouse gas emissions. In particular, the study discovered that at the chosen crossings, these diversions led to an annual fuel use of roughly 177,025 L and emissions of 0.294 kg of NOx and 251.68 kg of CO2. The study emphasizes the necessity of education and actions to lessen the negative effects that certain driving practices have on the environment and the economy [31].
Understanding driver behavior, particularly by looking at errors, violations, and positive and dangerous behavior in a cultural context, is essential to developing safer traffic systems. Therefore, the purpose of this study was to investigate how driving behaviors, which might be aberrant, dangerous, or positive differ between cultures. Self-report data on aberrant, positive, and dangerous driving behaviors were collected from China and Pakistan. There are notable differences between the two nations in terms of infrastructure, socio-cultural values, economic prosperity, and general progress. This study aimed to identify the differences in dangerous, aberrant, and positive driving behaviors in both countries and the effect of sociodemographic factors on these behaviors. Also, the effect of these behaviors on accident occurrence in the context of both countries is analyzed.

3. Research Objectives

The specific objectives of this study were:
(1)
To identify differences between the driving behavior of Chinese and Pakistani drivers in terms of dangerous, aberrant, and positive driving behaviors.
(2)
To look into the relationship between drivers’ self-reported involvement in accidents and differences in their driving behaviors.

4. Study Area

4.1. China–Pakistan Comparison of Traffic and Law Enforcement Indicators

It is important to take into account a range of socio-cultural aspects as well as other dimensions while analyzing the different driving practices in Pakistan and China. Hussain, Miwa [8] found a clear correlation between an increase in speeding and traffic law infractions and a deficiency in law enforcement. Table 1 presents information on traffic policies, registered vehicles, and crash data for each country accordingly to provide an easy comparison between the two. As is evident from the table, the number of registered vehicles in China is very high compared to Pakistan. Road traffic fatalities per 100,000 population are low in Pakistan compared to China. China also has strict enforcement of basic traffic laws compared to Pakistan. The road network in China is quite large compared to that in Pakistan.

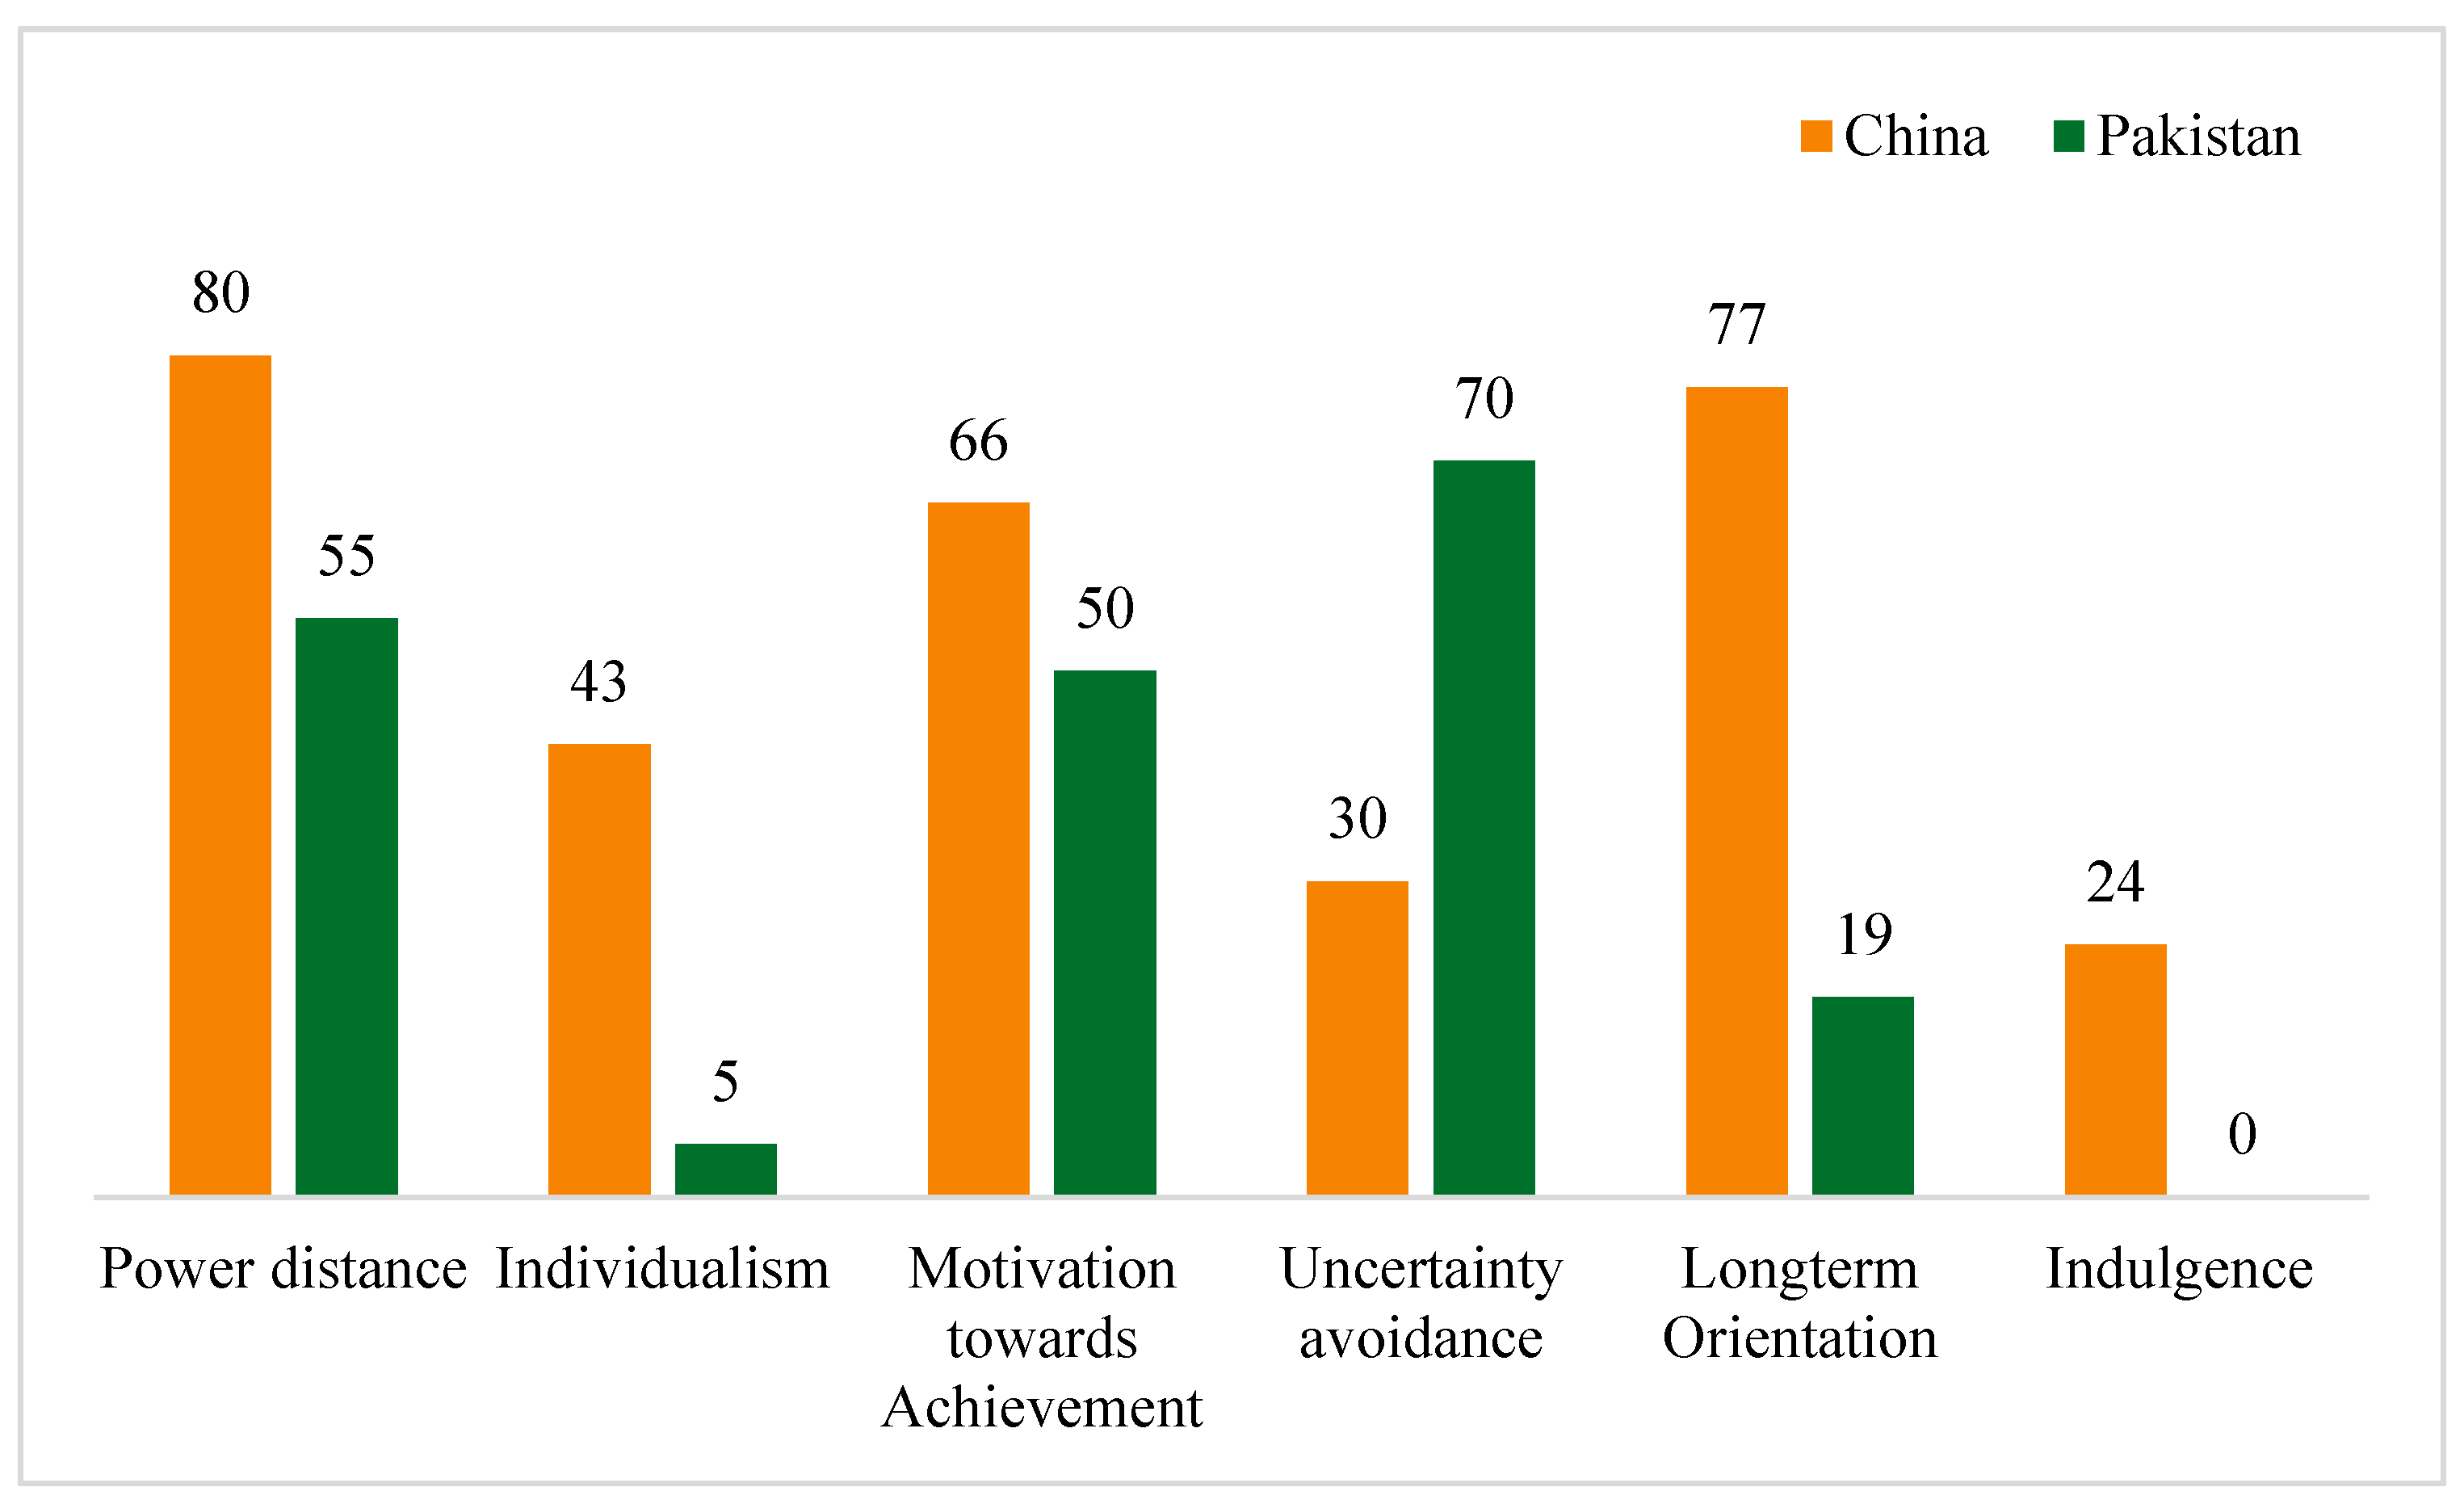
4.2. China–Pakistan Cultural Dimension Comparison

A person’s perspective and behavior are strongly correlated with a country’s cultural values. Values such as individuality and collectivism have been found to be connected with qualities unique to a culture [8]. Gaygisiz [35] in his study reported that an inverse relationship exists between crash risk and “uncertainty avoidance”, Hofstede dimensions were used to compare the cultural dimensions between China and Pakistan. Figure 1 shows comparisons on six cultural dimensions between China and Pakistan. As shown in the figure, China scored higher on the dimension of power distance. This facet, which deals with social inequality, reflects how people in a certain culture view power imbalance. The “power distance” refers to how much weaker members of an organization expect and put up with an unequal distribution of power. A higher score implies that the majority of people in lower positions have unwittingly accepted the unequal allocation of power in society. Pakistan scored very low on the individualism dimension. This dimension examines how interdependent a society is, with a particular emphasis on whether people identify as “I” or “We”, People emphasize themselves and their immediate family in individualist societies, but members of collectives that offer support in exchange for allegiance are members of collective societies. Pakistan, a collectivist nation with a low rating of 5, is characterized by a steadfast commitment to relationships, extended families, and loyalty. In this culture, strong interpersonal bonds are common and group members’ accountability is highly regarded. Employee–employer interactions are morally seen as family ties, and offenses bring shame upon both parties. Management is concerned with group dynamics, and choices about hiring and promotion take the employee’s in-group into account. Furthermore, China and Pakistan both scored nearly equal on the masculinity dimension, which indicates that the drive for success and accomplishments coupled with fierce competition drives society. Compared to China, Pakistan scored twice as high on uncertainty avoidance dimension. Uncertainty avoidance is the process by which a society decides whether to exercise control over the inevitable course of events or to let them play out. Different cultures have different ways of dealing with ambiguity. The uncertainty avoidance score indicates how much a culture’s people have built institutions and ideas to help them feel less anxious in unclear situations. Pakistan, which had a score of 70 on this category, leans heavily toward avoiding uncertainty. Societies with high levels of uncertainty avoidance, such as Pakistan, maintain rigid moral and ethical standards and are intolerant of nonconformist beliefs and behavior. These are the rule-following, efficiency-focused, hard-working, punctual cultures that may be resistant to change and heavily reliant on the security of individual motivation. China scored almost six times more on long-term orientation dimension in comparison to Pakistan. This dimension investigates how societies prioritize different aims while maintaining ties to the past and tackling current and future issues. Low-scoring societies, such as normative ones, prioritize upholding customs and traditions and are frequently averse to social change. High-scoring cultures adopt a practical stance, encouraging frugal living and making investments in cutting-edge education to get ready for the future. China is quite pragmatic, scoring 77 on this criterion. China and other pragmatic civilizations hold that truth depends on the circumstances. They have a high propensity for investing and saving, are willing to modify traditions to fit new circumstances, are frugal, and persevere in getting things done. Finally, Pakistan did not score on the indulgence dimension. This dimension measures how well people control their innate impulses and wants that are formed by their upbringing. “Restraint” indicates strong control, whereas “indulgence” indicates poor control. One can categorize cultures as indulgent or restrained. This points to a rather conservative society in which most people accept that their lives are governed by social conventions (for details, see Hofstede-Insights [36]).

4.3. China–Pakistan National Traffic Safety Laws and Traffic Accidents Comparison

4.3.1. Pakistan

In Pakistan, the transportation sector is vital to the country’s economy, accounting for roughly 6% of all jobs and 10% of the GDP [37]. In 1947, the country’s reliance on road transportation was only 8%; today, it is far over 90% [38]. Since roads carry 96% of all inland freight and 92% of all passenger travel, they can be deemed the core of Pakistan’s economy [37]. Over the past 75 years, the country’s road network has grown significantly, covering a length of roughly 50,000 km in 1947 and 500,749.27 km presently [39]. With the increase in roads, there has been a considerable increase in the number of registered vehicles as well, i.e., from 9.66 million in 2011 to 30.75 million in 2020 [34]. The National Highway Safety Ordinance, which was approved in 2000 and represents a major turning point in the regulation of road transport following 35 years of considerations and amendments (1965–2000), currently oversees the management of road transport. It is significant to remember that this legislation only applies to cars that use the national highway road network. All other roads in the nation are still governed by provincial laws and the 1965 Motor Vehicle legislation [40,41]. The national traffic safety laws are documented through the Motor Vehicle Ordinance (MVO) [41] and National Highway Safety Ordinance (NHSO) [42], but the enforcement level of the laws is very low, as can been seen from Table 1. This weak enforcement is the main cause behind the increase in road traffic accidents in Pakistan resulting in the loss of precious lives. According to the Pakistan Bureau of Statistics [34], 94,358 accidents occurred from 2011 to 2020. In these accidents, a total of 164,742 people were either injured or lost their precious lives (deaths: 49,801; injuries: 114,941). As per the WHO’s global status report on road safety, the fatality rate per 100,000 population in Pakistan is 14.3, higher than the UK’s 3.1 (18 times more motorized) and lower than China’s 18.2 (9.5 times more motorized) [2].

4.3.2. China

When the new China emerged in 1949, there were few privately owned cars, just 80,000 km of national highways and no laws governing traffic safety. China developed traffic laws and regulations during the next fifty years of development in order to control urban traffic, advance safety, and improve transit. The “Rules of Urban Traffic” were introduced by the Ministry of Public Security in 1955 in response to the demands of the national economy [43]. The “Law on Road Traffic Safety”, China’s first traffic safety legislation, was introduced in 2004. Maintaining traffic order, preventing and minimizing traffic accidents, providing physical protection for human safety, protecting property and other legal rights, and improving transit efficiency were the goals [44]. China has implemented targeted legislation and enforcement protocols pertaining to drunk driving and the wearing of seat belts. The building of transportation infrastructure has progressed quickly as a result of the quick economic expansion. To stay up with the quick changes, Sinomaps, a Chinese map company, updates its Beijing maps every three months [43]. With increased road infrastructure and economic development, the number of private vehicles also increased in China from 28.49 (10,000 units) in 1985 to 26,152.02 (10,000 units) in 2021 [32]. The increase in vehicles on roads despite the implementation of traffic safety laws has resulted in the loss of precious lives and property damage as well. As per the annual report of the National Bureau of Statistics, the number of traffic accidents in year 2021 was 0.273 million, resulting in the loss of life of 0.062 million people, 0.281 million injuries and direct property losses of CNY 1.45 billion [32]. Road traffic accidents have declined considerably from 0.61 million in 2001 to 0.273 million in 2021, subsequently decreasing the deaths, injuries, and direct property losses as well, due to strict enforcement of traffic safety policies and laws. There is still a lot of work required to lessen the fatalities and road traffic accidents in China to improve road safety. Compared to Pakistan (14.3), the fatality rate per 100,000 of population is 18.2, which is still higher [2].

5. Materials and Methods

5.1. Participants

A web-based survey was carried out in November 2021 to collect data from drivers in Pakistan, and an identical survey was carried out in July 2023 in China. The participants recruited in this study were male and female of all ages. A total of thirteen hundred respondents, comprising 650 respondents each from Pakistan and China, participated in the study. In Pakistan, for data collection, Google Forms was used to develop the online questionnaire and the links were shared through social media links. Between August and September of 2023, data were gathered in China through Wenjuanxing (https://www.wjx.cn/, accessed on 7 October 2023), the biggest online Chinese survey platform. The Wenjuanxing platform and social networks were used to disseminate the survey link. After spending an average of 17 min answering the questionnaire, participants received CNY 10 in remuneration. The questionnaire was translated into Chinese with assistance from a professor at Tsinghua University. The necessary data screening resulted in the elimination of 27 responses from the Pakistani dataset and 20 from the Chinese dataset. The final dataset used in the data analysis consisted of 623 samples from Pakistan and 630 samples from China. All the participants were briefed that their information would not be shared publicly and would be utilized for research purposes. Participant age in Pakistani sample ranged from 18 to 65 years (M: 2.41, SD: 1.44), the sample was 81.2% male (N: 506) and 18.8% female (N: 117), 72% had a valid driving license, and 56% reported having had a traffic accident. Similarly, the age of participants in the Chinese dataset also ranged from 18 to 65 years (M: 2.40, S.D: 0.98) and the sample was 63.2% male (N: 398) and 36.7% female (N: 232). In the Chinese sample, every individual stated that their driver’s license was up to date, and 48% of them said that they had been in an accident. The descriptive statistics of the sample are presented in Table 2.

5.2. Materials

The DDDI: Introduced in 2003 as a tool for self-reporting, the Dula Dangerous Driving Index (DDDI) is employed to identify individual bias for unsafe driving. Three components make up the original scale’s 28 elements: aggressive driving (7 items), negative emotional driving (9 items), and risky driving (12 items). On a 5-point Likert scale ranging from 1 (“never”) to 5 (“always”), respondents ranked the frequency of each item voluntarily.
The DBQ: An aberrant deriving behavior questionnaire with 30 items was used in this investigation. This questionnaire included 18 items from the original Driver Behavior Questionnaire (DBQ) developed by Reason, Manstead [13], 4 items from Batool and Carsten [45] and 8 items designed by the authors based on the local driving factors. The aberrant deriving behavior questionnaire categorizes aberrant driving behaviors into three categories: errors (7 items), violations (14 items), and mistakes (9 items). On a 5-point Likert scale ranging from 1 (“never”) to 5 (“always”), respondents rated the frequency of each item.
The PDBS: Positive driving behaviors are measured using the self-report instrument developed originally as an addition to the DBQ by Ozkan and Lajunen [15] in a study involving Turkish drivers. The original PDBS has 14 items that are related to safe driving. As one item failed to load in factor analysis, the final version of the PDBS that is now in use has 13 items and only one factor. On a 6-point Likert scale ranging from 1 (“never”) to 6 (“very often”), respondents rated the frequency of each item.
Sociodemographics: The demographic section included questions related to participants’ age, gender, education, driving experience, motorbike riding expertise, etc. The respondents had to state if their driver’s license were still valid or not, whether or not they used their seat belt while driving, whether or not they had received any driving training before starting to drive, and whether or not they had been involved in a traffic accident in the last three years.

5.3. Data Analysis

Data analysis was performed using the SPSS version 26 software. Principal component analysis (PCA) was performed to determine the factor structure of each questionnaire used in the study on both samples. Principal component analysis (PCA) is a statistical technique that reduces dimensionality and compresses data while maintaining the most crucial information. The suitability of data for PCA was checked on two parameters, i.e., the Kaiser–Meyer–Olkin (KMO) measure of sample adequacy and Bartlett’s test of sphericity (BTS), which examines the assumption that all the factors in the dataset are not linked. The inherent validity and dependability of the resulting components from PCA were assessed by examining the Cronbach’s alpha coefficient. In the next step, Pearson’s bivariate correlation analysis was performed to look at the relationships between sociodemographic characteristics and dangerous, aberrant, and positive driving behaviors. Furthermore, mean scores of dangerous, aberrant, and positive driving behaviors were also calculated and compared. The effects of the study variables (driving training, motorbike riding expertise, seat belt usage etc.) and demographics on positive, aberrant, and dangerous driving behaviors were examined using GLM models. The dimensions of aberrant (errors, violations, mistakes), dangerous (aggressive, risky, negative, emotional), and positive driving behaviors were the dependent variables (DVs), and the sociodemographic and study variables (driving training, motorbike riding expertise, seatbelt usage, etc.) were the independent variables in GLM models. Finally, the impact of dangerous, aberrant, or positive driving behaviors on the incidence of traffic accidents was evaluated using the binary logistic regression approach.

6. Results

6.1. Factor Structure and Reliability Analysis of Pakistani Driver Behavior Data

DDDI Factor structure: The PCA revealed three distinct types of DDDI items that provided an in-depth comprehension of a wide range of dangerous driving behaviors that Pakistani drivers engage in. Every factor was given a name based on the primary variables affecting its behavior. The factor obtained first was named “Risky driving”, as it contains four items and accounts for 17.80% of the variance. This factor is dominated by items related to risky driving, e.g., “I will drive in the shoulder lane or median to get around traffic jams”, The second factor was “Negative emotions while driving”, containing five items and accounting for 16.75% of the variance. This factor is dominated by items that reflect negative emotions of Pakistani drivers while driving, e.g., “If I have to encounter another motorist, I think I could snap”, Dominated by traits of aggressive driving, i.e., tailgating, making rude gestures, flashing lights etc., this factor was named “Aggressive driving”, It contains three items (e.g., “I flash my headlights when I am annoyed by another driver”) and accounts for 17.01% of the variance. To check the reliability of the DDDI subscales, Cronbach’s alpha coefficient was evaluated. The three factors along with overall DDDI score showed good reliability. The overall DDDI score’s Cronbach (α) value was 0.771. All the subscale α values were within the acceptable ranges, i.e., risky driving (α value: 0.702), negative emotion while driving (α value: 0.698), and aggressive driving (α value: 0.716).
DBQ Dimensions: For the aberrant driving behavior questionnaire, PCA found a three-factor structure that paints an accurate depiction of Pakistani drivers’ abnormal driving behaviors. Every factor was given a name based on the primary variables affecting its behavior. With four items and a variance of 15.85%, the first extracted component was called “violations”, This factor is dominated by items related to violations, e.g., disregarding red lights when driving late at night along an empty road. The second factor was “mistakes”, containing five items and accounting for 14.54% of the variance. The mistakes factor is dominated by items that reflects mistakes while driving of Pakistani drivers, e.g., misjudging a crossing interval when turning right and narrowly missing a collision. Dominated by traits of error while driving, e.g., attempting to drive away from traffic lights in third gear, etc., this factor was named “errors”, It contains four items (e.g., using one’s status profile or personal connections to get rid of fines/penalties) and accounts for 13.33% of the variance. To check the reliability of the DDDI subscales, Cronbach’s alpha coefficient was evaluated. The three subscales and overall DBQ score showed good reliability. The overall DBQ score’s Cronbach (α) value was 0.782. All the subscale α values were within the acceptable ranges, i.e., violations (α value: 0.756), mistakes (α value: 0.721), and errors (α value: 0.726). The results are presented in Table 3.
PDBS Dimensions: Based on the results of Ozkan and Lajunen [15] and Shen, Qu [46], the PCA was performed with one fixed factor. The results of the PCA revealed that all 13 items exhibited strong positive factor loading on the single factor, and the factor explained 34.31% of the total variation. Cronbach’s alpha (α) value, a widely used index for assessing the reliability and internal consistency of any scale, was also calculated, and was 0.825. The Cronbach alpha value obtained was well above the acceptable value of 0.7 mentioned by Cronbach [47].

6.2. Factor Structure and Reliability Analysis of Chinese Driver Behavior Data

DDDI Factor structure: The PCA revealed that the DDDI (Dangerous Driving Behavior Index) has three different groups or categories that provide a thorough comprehension of the different dangerous driving behaviors that Chinese drivers display. Similar to the results of Pakistani DDDI principal component analysis, the first factor was named negative emotional driving based on the items dominated by emotional driving and negative thoughts. The negative emotion factor consists of four items and accounts for 23.4% of variance in the sample. The second factor consists of items related to aggressive driving and was named so. The aggressive driving factor contains five items and accounts for 17.85% of the variance. The final factor, labeled risky driving behavior, corresponds to features related to risky driving. The risky driving factor consists of five items and explains 13.45% of the variance. All the three subscales, i.e., negative emotions, aggressive driving, and risky driving, also showed good internal consistency. Cronbach’s alpha (α) value for the negative emotion factor was 0.861, for aggressive driving 0.729 and for risky driving behavior 0.759 respectively. The results of PCA are shown in Table 4.
DBQ Dimensions: A three-factor solution for the Chinese DBQ emerged as a result of PCA. These factors were named mistakes (four items, 18.9% of variance), violations (four items, 17.4% of variance) and errors (four items, 15% of variance) based on the items responding to each factor. The reliability coefficients, i.e., α value for each factor, were 0.758 (mistakes), 0.816 (violations), and 0.778 (errors), showing that the Chinese DBQ has good internal consistency and validity.
PDBS Dimensions: Similar to the PCA results of the Pakistani PDBS and previous studies, the Chinese PDBS also supports a single-factor solution. All the 13 items exhibited strong positive factor loading on the single factor, and the factor explained 39.8% of the total variation. Cronbach’s α was 0.870 for the single-factor solution of the PDBS.

6.3. Pearson’s Bivariate Correlation Analysis

The associations between the driving behaviors (dangerous, aberrant, and positive), traffic accidents, demographic variables (age, gender, experience), motorbike riding expertise, seat belt usage, driving license, and driving training variables were examined using Pearson’s bivariate correlation analysis on both datasets. The results of correlation analysis for the Chinese drivers’ dataset are presented in Table 5 and for the Pakistani drivers’ dataset in Table 6. The results for Chinese driver behavior data reveal that aggressive, risky, and negative emotion factors of the DDDI are positively associated with each other, but also intercorrelated positively with the errors, violations, and mistakes dimension of aberrant driving behaviors. The PDBS is negatively associated with aggressive (r = −0.665, p-value less than 0.01), risky (r = −0.577, p-value less than 0.01), and negative emotion (r = −0.352, p-value less than 0.01) driving dimensions of DDDI. A similar trend is observed for the aberrant driving behavior dimensions and the PDBS: with increased positive driving behaviors among the Chinese drivers, the aberrant and dangerous driving behaviors are reduced. A positive relationship is observed between AD (aggressive) (r = 0.714, p-value less than 0.01), RD (risky) (r = 0.656, p-value less than 0.01), NE (negative emotions) (r = 0.323, p-value less than 0.01) and traffic accidents. A similar trend is observed for aberrant driving behavior dimensions and the traffic accidents variable: with increased dangerous and aberrant driving behavior, traffic accidents also increase. Positive driving behaviors (r = −0.777, p-value less than 0.01) and traffic accidents were found to have a significant negative association: with increased positive driving behaviors, traffic accidents tend to decrease. Regarding demographics, age showed an inverse relation with all the three dimensions of dangerous driving behaviors, i.e., aggressive (r = −0.436, p-value less than 0.01), risky (r = −0.228, p-value less than 0.01), and negative emotion (r = −0.200, p-value less than 0.01), with three dimensions of aberrant driving behaviors, i.e., errors (r = −0.308, p-value less than 0.01), violations (r = −0.269, p-value less than 0.01), and mistakes (r = −0.295, p-value less than 0.01), and with positive driving behaviors (r = 0.306, p-value less than 0.01) as well. The driving experience variable was also found to have a negative association with all the three dimensions of dangerous driving behaviors and aberrant driving behaviors as well, indicating that inexperienced Chinese drivers are prone to dangerous and aberrant driving behavior in comparison to experienced ones. The motorbike riding expertise factor was found to have a direct association with dangerous and aberrant driving behaviors, indicating that drivers who possess motorbike riding expertise are more prone to dangerous driving and aberrant driving behaviors. Furthermore, the driver training variable had negative associations with dangerous driving behaviors (aggressive (r = −0.175, p-value less than 0.01), risky (r = −0.177, p-value less than 0.01) and negative emotions (r = −0.108, p-value less than 0.05)) and aberrant driving behaviors (errors (r = −0.166, p-value less than 0.01), violations (r = −0.184, p-value less than 0.01) and mistakes (r = −0.200, p-value less than 0.01)). These negative associations indicate that Chinese drivers that have received driving training engage less in dangerous and aberrant driving behaviors and vice versa.
Similarly, the Pakistani data also reveal that aggressive, risky (r = 0.480, p-value less than 0.01), and negative emotions (r = 0.496, p-value less than 0.01), the three factors of the DDDI, are positively associated with each other, but also intercorrelated positively with the errors (r = 0.153, p-value less than 0.01), violations (r = 0.259, p-value less than 0.01), and mistakes (r = 140, p-value less than 0.01) dimensions of aberrant driving behaviors. The PDBS is negatively associated with errors (r = −0.300, p-value less than 0.01), violations (r = −0.375, p-value less than 0.01) and mistakes (r = −0.298, p-value less than 0.01) dimensions of aberrant driving behaviors. A similar trend is observed for the dangerous driving behavior dimensions and the PDBS: Pakistani drivers who exhibit positive driving behaviors engage less in dangerous and aberrant driving behaviors compared to other drivers. A positive relationship is observed between traffic accidents and errors (r = 0.102, p-value less than 0.05), violations (r = 0.312, p-value less than 0.01), and mistakes dimensions of the DBQ (r = 0.262, p-value less than 0.05) and traffic accidents. The dimensions of dangerous driving behavior and traffic accidents show a similar tendency. Regarding demographics, age was negatively correlated with all the dimensions of dangerous and aberrant driving behaviors and positively with positive driving behaviors (r = 0.380, p-value less than 0.01): young drivers exhibit more dangerous and aberrant driving behaviors and less positive driving behaviors compared to aged drivers. The driving experience variable was also found to have a negative association with all the three dimensions of dangerous driving behaviors and aberrant driving behaviors as well, indicating that inexperienced Pakistani drivers engage in dangerous and aberrant driving behavior in comparison to experienced ones. It was discovered that there is a direct correlation between the motorbike riding expertise variable and dangerous and aberrant driving behaviors. This suggests that drivers with motorbike riding expertise are more involved in dangerous driving and aberrant diving actions. For the driving training variable, similar results were obtained to the Chinese dataset.

6.4. Predictors of Dangerous Driving Behaviors

Regression analysis was performed to evaluate the impact of demographic factors, driving training, seat belt use, and motorbike riding expertise on risky driving behaviors. Our objective was to determine whether the use of seat belts, driving training, motorbike riding expertise, and demographics could predict dangerous driving practices. To accomplish this, the generalized linear model with gamma link was employed. The generalized linear model offers tried and true solution for instances, where the target variable deviates from normal distribution or the variance in several continuous variables is linked to the mean. Categorical data can also be processed using GLM. The response variable’s variability is explained by the random component of the model, while the structural part links the target variable’s mean to the forecast values [48]. Regression analysis was performed using six different GLM models to look at the relationship between study variables and DDDI dimensions as well as demographics on driver data from Pakistani and Chinese drivers.

6.5. GLM Model One: Determinants of Pakistani Drivers’ Risky Behaviors While Driving

This model examines the association between all the predictor variables and risky driving. The results of the model revealed that driver training, seat belt usage, and motorbike riding expertise were significant predictors of risky driving behaviors. It can argued that for Pakistani drivers, training at traffic police-operated schools (β: −0.398, O.R: 0.672, p-value less than 0.01), training at a private school (β: −0.229, O.R: 0.795, p-value less than 0.05), from a friend (β: −0.292, O.R: 0.747, p-value less than 0.01), and training by a family member (β: −0.242, O.R: 0.785, p-value less than 0.05) negatively predicted risky driving behaviors, which implies that trained drivers engage in less risky driving behavior relative to drivers without training. Relative to drivers who had greater than 20 years of motorbike riding expertise, those without any expertise (β: −0.395, O.R: 0.673, p-value less than 0.01) engaged in fewer risky behaviors. Those having motorbike riding expertise of up to four years (β: −0.371, O.R: 0.690, p-value less than 0.01) engaged in less risky driving relative to drivers who had over 20 years of motorbike riding expertise. When drivers with more experience were compared to those with less or no motorbike riding expertise, it was found that, albeit not significantly, the more experienced motorcyclists engaged less in risky driving practices. Furthermore, regarding demographics, age, gender and driving experience showed a strong link with risky driving. Ages 18–24 years (β: 0.150, O.R: 1.161, p-value less than 0.05) and 25–34 years (β: 0.037, O.R: 1.038, p-value less than 0.05) were significant predictors of risky driving compared to drivers aged 65 years and above. Male drivers (β: 0.056, O.R: 1.058, p-value less than 0.05) were found to be more risk-taking than female drivers. Drivers with experience of less than one year (β: 0. 53, O.R: 1.055, p-value less than 0.01) and drivers with experience of 1–5 years (β: 0.151, O.R: 1.163, p-value less than 0.01) seemed to engage in risky practices relative to those who had over 20 years of motorbike riding expertise. Education and travel time could not reach significant levels. Table 7 shows the results of the first GLM model.

6.6. GLM Model Two: Determinants of Pakistani Drivers’ Aggressive Behaviors While Driving

This model predicted the associations of predictor variables with the aggressive driving dimension of DDDI. The results showed that driver training, seat belt usage, and motorbike riding experience were significant predictors of aggressive driving behaviors. Seat belt usage (β: −0.086, O.R: 0.917, p-value less than 0.05) was a significant negative predictor of aggressive driving compared to people who do not use a seat belt. Being trained at traffic police-operated schools (β: −0.242, O.R: 0.785, p-value less than 0.05) was a negative predictor of aggressive driving relative to no training. Motorbike riding expertise influenced the aggressive driving behaviors of motorists. Motorists without any motorbike-riding expertise (β: −0.473, O.R: 0.623, p-value less than 0.01) engaged in fewer aggressive behaviors relative to those with over twenty years of motorbike expertise. Motorists with 16 to 20 years of motorbike expertise (β: 0.288, O.R: 1.333, p-value less than 0.01) engaged in aggressive driving more often relative to those who had over 20 years of motorbike expertise. When comparing drivers with minimal prior motorbike expertise to the experienced ones, drivers lacking motorbike expertise were not very susceptible to aggressive driving. Regarding demographics, gender showed a strong link with aggressive driving (β: 0.141, O.R: 1.152, p-value less than 0.01): male drivers were found to be involved in aggressive driving more compared to female drivers. Age was also a significant predictor of aggressive driving. Age 18–24 years (β: 0.426, O.R: 1.530, p-value less than 0.01), 25–34 years (β: 0.360, O.R: 1.434, p-value less than 0.05), and 35–44 years (β: 0.413, O.R: 1.511, p-value less than 0.01) came out to be a significant predictor of aggressive driving relative to those aged greater than 65 years. Having less than 1 year’s driving experience (β: 0.217, O.R: 1.346, p-value less than 0.05) and 1–5 years’ driving experience (β: 0.122, O.R: 1.130, p-value less than 0.05) turned out to be predictors of aggressive driving relative to those with experience greater than 20 years. Education, driving license, and driving training variables did not reach significant levels, as shown in Table 8.

6.7. GLM Model Three: Determinants of Pakistani Drivers’ Negative Emotional Driving

The third model was run to check the associations of predictor variables with the negative emotion (NE) dimension of DDDI, as shown in Table 9 below. The findings showed that in comparison to drivers with 20 years or more experience, drivers with 16–20 years of motorbike expertise (β: 0.314, O.R: 1.369, p-value less than 0.05) and those with 9–12 years of experience (β: 0.270, O.R: 1.310, p-value less than 0.05) seemed at greater risk of exhibiting negative emotional driving. Regarding demographics, it was found that only age and driving experience were significant predictors of negative emotional driving. Age 18–24 years (β: 0.103, O.R: 1.202, p-value less than 0.05), and 25–34 years (β: 0.160, O.R: 1.278, p-value less than 0.05) turned out to be positively associated with negative emotional driving, while age 55–64 years (β: −0.123, O.R: 0.885, p-value less than 0.05) was negatively associated. Driving experience of 16–20 years (β: −0.165, O.R: 0.880, p-value less than 0.05) came out to be a significant predictor of negative emotional driving, which suggests that drivers with more experience are less involved in negative emotional driving compared to inexperienced drivers. Gender, education, seat belt usage, driving training, and driving license variables did not turn out to be conclusive predictors.

6.8. GLM Model Four: Determinants of Risky Driving Behaviors of Chinese Drivers

The predictors of the risky driving behavior dimension of the Chinese DDDI were also determined using the GLM model. The findings revealed that age, gender, driving experience, motorbike riding expertise and driving training variables were the major indicators of risky driving behaviors in the Chinese dataset. Table 10 shows the findings of the model. Drivers aged 18–24 (β: 0.155, O.R: 1.168, p-value less than 0.05) and 25–34 (β: 0.070, O.R: 1.073, p-value less than 0.05) were shown to be engaging in risky driving behaviors more. It was noted that as age increased, risky driving behaviors decreased (β: −0.105, O.R: 0.710, p-value less than 0.05 for drivers between the ages of 55–64). In comparison to female drivers, male drivers (β: 0.046, O.R: 1.047, p-value less than 0.05) exhibited a higher propensity for risky driving.
Driving experience of up to 10 years were found to be a significant predictor of risky driving behaviors compared to experience of 16–20 years, which was negatively associated with risky driving behaviors. Drivers with no prior motorbike riding expertise (β: −0.056, O.R: 0.946, p-value less than 0.05) were found to be engaged in fewer risky driving behaviors relative to those with prior motorbike riding expertise of four years (β: 0.086, O.R: 1.292, p-value less than 0.05). Chinese drivers having received training at a traffic police-operated school (β: −0.927, O.R: 0.739, p-value less than 0.01) or at a private training school (β: −0.836, O.R: 0.833, p-value less than 0.01) seemed to engage in risky driving behaviors less relative to individuals which got training from friend or relatives.

6.9. GLM Model Five: Determinants of Aggressive Driving Behaviors of Chinese Drivers

The predictors of aggressive Chinese driving behavior were found to be age, driving experience, motorbike riding expertise, and driving training. Like risky driving behaviors, younger drivers seem to engage in aggressive driving more than older ones. Similarly, inexperienced drivers were more aggressive drivers compared to drivers with experience of more than 16 years, as shown in Table 11. It was discovered that drivers with 1–4 years (β: 0.050, O.R: 1.052, p-value less than 0.05) and 5–8 years (β: 0.015, O.R: 1.015, p-value less than 0.05) of prior motorbike riding expertise seemed to be engaged more in aggressive driving behaviors than drivers with no prior experience (β: −0.056, O.R: 0.945, p-value less than 0.05). Drivers having learnt driving at a traffic police school (β: −0.116, O.R: 0.723, p-value less than 0.05) and private driving schools (β: −0.020, O.R: 0.783, p-value less than 0.05) seemed not to be aggressive compared to drivers that had received training from friends or relatives. Gender, education, and seat belt usage did not reach significant levels.

6.10. GLM Model Six: Determinants of Chinese Drivers’ Negative Emotional Behaviors While Driving

The results of this model to determine the predictors of negative emotional dimension of DDDI revealed that age, driving experience, and motorbike riding expertise were the significant predictors of negative emotions while driving. Except for drivers aged 45–54 years, all the age groups were found to be positively associated with negative emotional driving relative to motorists aged greater than 65 years, as shown in Table 12. Inexperienced drivers were found to be more involved in negative emotional driving compared to experienced drivers. Chinese drivers with motorbike riding experience of 13–16 years (β: 0.085, O.R: 1.088, p-value less than 0.05) and 17–20 years’ experience (β: 0.041, O.R: 1.060, p-value less than 0.05) seemed to engage more in negative emotional driving relative to those with minimal or no motorbike expertise. Gender, education, driving training, and seat belt usage did not reach significant levels.

6.11. Comparison of Aberrant and Positive Driving Behaviors

Mean scores of aberrant and positive driving behaviors of Pakistani and Chinese drivers were compared to find out the behaviors that were engaged in frequently by drivers of both countries. The findings reveal that drivers in Pakistan engage in greater aberrant driver behaviors compared to Chinese drivers. Pakistani drivers commit more violations than Chinese drivers, i.e., the mean score of item 23, “Disregard the speed limit in residential areas”, came out to be 1.15 for Chinese drivers and 3.04 for Pakistani drivers. Similarly, Chinese drivers make fewer mistakes than Pakistani drivers, i.e., the mean score of item 16, “When turning around, strike anything you hadn’t seen before” came out to be 1.67 for Chinese drivers and 2.18 for Pakistani drivers. Various items corresponding to error terms had similar mean scores, i.e., mean score of item 1, “Try using third gear to escape traffic lights” was 2.13 for Chinese and 2.12 for Pakistani drivers. See Table 13 for detailed results.
Table 14 presents the mean score comparison of positive driving behaviors of Pakistani and Chinese drivers. The overall results reveal that Pakistani drivers compared to Chinese drivers are less engaged in positive driving behaviors. Chinese drivers scored highest, i.e., 5.1, on item 9, “Even though it’s legal for me to pass, let people cross”, while Pakistani drivers scored highest, 4.58, on item 11, “I’ll try my best to stay out of the way of other drivers”, Both the Chinese and Pakistani drivers scored lowest (4.52 and 3.62) on PDBS item 1: “Steer clear of closely following to avoid upsetting the driver of the vehicle ahead”, Various items, i.e., “Adjust my speed to assist the vehicle attempting to pass me”, “Return to your place so as not to block the coming car behind”, and “I gave the driver a wave of gratitude for his assistance”, etc. had similar mean scores in both countries.

6.12. Predictors of Traffic Accidents Using Sociodemographics and Dangerous, Aberrant, and Positive Driving Behaviors

The primary aim of this section is to investigate the influence of dangerous driving, aberrant driving, positive driving behaviors, seat belt usage, driving training, motorbike riding expertise, and sociodemographic variables on road traffic accident involvement. Binary logistic regression modeling was used to discover the factors responsible for road traffic accidents. In the model, road traffic accidents (RTAs) were introduced as the dependent variable (DV) and all the study variables as independent variables (IVs). The dependent variable coding used in the model is specified thus: not involved in an accident on road ever (0) and involved in an accident on road (1). A total of four (two for each Chinese and Pakistani drivers) binary logistic regression models were used to discover the variables responsible for accident involvement. The first binary logistic model was run by incorporating the dangerous, aberrant, and positive driving behaviors together to assess the impact on accident involvement (see Table 15 for detailed information).
The results implied that among the dangerous driving behaviors, aggressive driving (AD) and risky driving (RD) have a positive impact on accident involvement: Pakistani drivers engaged in aggressive driving (β: 0.473, p-value less than 0.01) and risky driving (β: 0.690, p-value less than 0.01) have a higher probability of accident involvement. Similarly, among the aberrant driving behaviors, the errors and violations dimension was a significant predictor of traffic accidents. It can be concluded that the Pakistani drivers who commit errors (β: 0.475, p-value less than 0.01) and violations (β: 0.460, p-value less than 0.01) while driving are more prone to traffic accidents compared to drivers who commit fewer errors and violations. Positive driving behaviors (β: −0.730, p-value less than 0.01) turned out to be a negative influencing factor in traffic accidents in the Pakistani sample.
In this subsequent binary logistic model, all the IVs (including demographic variables, seat belt use, motorbike riding expertise, and driving training) were introduced to assess their impact on accident involvement. Table 16 presents the results of the model. The results showed that aggressive driving (β: 0.558, p-value less than 0.01) and risky driving (β: 0.635, p-value less than 0.01) behaviors of Pakistani drivers had a significant association with traffic accidents. It was also found that the violations (β: 0.509, p-value less than 0.051) and errors (β: 0.491, p-value less than 0.05) factors of aberrant driving behaviors showed a prominent correlation with traffic accidents, i.e., drivers who commit errors and violations were more frequently involved in traffic accidents. Compared to committing errors and violations, driving aggressively, or taking more risks, positive driving behaviors (β: 0.596, p-value less than 0.01) were negatively associated with accidents. Regarding demographics, age (β: −0.059, p-value less than 0.05) and driving experience (β: −0.276, p-value less than 0.01) were found to have a negative association with traffic accidents. One could claim that in comparison to older and more experienced drivers, younger and less experienced drivers seem more inclined to be involved in traffic accidents. The motorbike riding expertise variable (β: 0.553, p-value less than 0.01) also seemed to be a prominent indicator of traffic accidents among Pakistani drivers. The motorist with greater prior motorbike expertise seems to be more susceptible to traffic accidents compared to drivers with less experience.
The third binary model was constructed to determine the association of dangerous, aberrant, and positive driving behaviors of Chinese drivers with traffic accidents. As shown in Table 17, the aggressive driving (β: 0.371, p-value less than 0.05) and risky driving (β: 0.435, p-value less than 0.05) dimensions of dangerous driving behaviors seemed to have a prominent link with traffic accidents. Chinese drivers who were more aggressive and risk-taking while driving are more prone to be involved in traffic accidents compared to less aggressive and risk-taking drivers. It was also found that drivers that committed violations (β: 0.685, p-value less than 0.01) and errors (β: 0.482, p-value less than 0.01) more often were more prone to traffic accidents compared to those who committed fewer errors and violations while driving. Apart from drivers driving aggressively, taking risks, or committing errors and violations while driving, drivers who behave positively or have positive intensions, i.e., positive behaviors (β: −0.789, p-value less than 0.01), while driving were less prone to traffic accidents.
The last and fourth binary logistic model revealed that aggressive (β: 0.398, p-value less than 0.05) and risky driving (β: 0.423, p-value less than 0.05) behaviors of Chinese drivers along with the errors (β: 0.466, p-value less than 0.01) and violations (β: 0.672, p-value less than 0.01) dimensions of aberrant driving behaviors were strong indicators of collisions. Regarding demographics, only driving experience (β: −0.308, p-value less than 0.05) came out to be an influential indicator of collisions, revealing that as Chinese drivers get more experience behind the wheel, their possibility of getting into an accident drops considerably. Apart from this, driver age, gender, and prior motorbike riding expertise lacked significance. Finally, positive driving behaviors also came out to be negative estimators of traffic accidents in the Chinese sample. With increased positive driving behaviors, a reduction in traffic accidents is observed, as shown in Table 18 below.

7. Discussion

This study offers an in-depth comparison of the dangerous, aberrant, and positive driving behaviors of Pakistani as well as Chinese drivers and the factors that predict them. Various studies have been conducted in which driving behaviors were analyzed cross-culturally [8,23,26,30], but no such study exists in which the driving behaviors of Pakistani and Chinese drivers have been studied together. This is the first instance to study and compare the driving behaviors among China and Pakistan and will be helpful in understanding the differences in driving behaviors and improving road safety for cross-border travels. China and Pakistan have a long history of friendship and trade, the most recent example of which is the construction of ongoing China–Pakistan Economic Corridor (CPEC), which will facilitate the movement of goods and people from and to China via road transport and other transportation means. This project will ease the road travel between China and Pakistan and make it more frequent, due to which it is necessary to study the driving behaviors of both countries so that road safety can be improved and differences in driving behaviors sorted out. Therefore, to compare the driving behaviors of both countries, a questionnaire survey was prepared consisting of items related to dangerous driving behaviors (DDDI), aberrant driving behaviors (DBQ) and positive driving behaviors (PDBS). Data collection through web-based surveys in both countries resulted in 1253 valid samples, 623 from Pakistan and 630 from China. The factor structure of each questionnaire, i.e., DDDI, DBQ, and PDBS, was determined using principal component analysis (PCA) with varimax rotation. The PCA generated a three-factor solution for dangerous driving behaviors (i.e., aggressive driving, risky driving, and negative emotional driving) and aberrant driving behaviors (errors, violations, and mistakes) as well, and a one-factor solution for positive driving behaviors in both datasets. These findings are consistent with previous studies that also proposed a three-factor solution for dangerous driving behaviors [16,17] and aberrant driving behaviors [13,24] and a single-factor solution for positive driving behaviors [15,46]. Each factor represents a unique set of various driving behaviors and possesses adequate reliability and internal consistency.
The Hofstede dimensions comparison between China and Pakistan demonstrates how cultural values have a substantial impact on people’s attitudes and behaviors. Pakistan displays less acceptance of social inequality, whereas China displays greater power distance, suggesting a stronger acceptance of unequal power allocation. In contrast to China’s more individualistic society, Pakistan emphasizes strong interpersonal relationships and group accountability, which is reflected in its low individualism score. In terms of masculinity, both nations rank equally, driven by achievement and rivalry. In contrast to China’s more flexible approach, Pakistan’s high score in avoiding uncertainty reflects its preference for strict moral standards and reluctance to change. In terms of long-term orientation, China does far better than Pakistan, with a pragmatic concentration on planning and adaptation while placing a higher value on tradition and resistance to social change. Pakistan does not score well on the indulgence factor, which points to a traditional society controlled by social norms. These cultural factors highlight how different factors shape societal dynamics and individual actions in China and Pakistan.
One of the objectives of this study was to compare the driving behaviors of Chinese and Pakistani drivers in terms of dangerous, aberrant, and positive driving behaviors. To achieve this objective, the variables influencing the dangerous driving behaviors of both Chinese and Pakistani drivers were determined by incorporating six generalized linear models. In the Pakistani dataset, driving training, seat belt usage, and motorbike riding expertise were explored as simultaneous predictors of risky and aggressive driving behaviors. Motorbike riding expertise was the only predictor of negative emotional driving. These results were in accordance with a previous study (Yousaf and Wu [49]. In a manner akin to motorcycling, certain motorcycle riders may exhibit excessive self-assurance in their driving abilities when transitioning to automobile operation. This could entice individuals to take chances or partake in dangerous pursuits that they think are controllable. Motorcyclists, who are familiar with traveling and are fond of wide roads, could also find car driving boring. Some motorcycle riders may not be used to the size and weight of a car, and they may be ignorant of obscured sections or alternative risks unique to driving a larger vehicle. Furthermore, transitioning from riding a motorbike to driving a car can be a big change, which is why some motorcycle riders could feel nervous or anxious. Driving education can help reduce risky driving behaviors and increase road safety by enhancing skills, risk perception, responsible attitudes, and the development of a safety-conscious driving culture [50]. The act of fastening a seat belt can serve as a reminder of the significance of driving safely and responsibly. This mental association can deter drivers from engaging in risky behavior by reminding them that they have covered one vital safety precaution. Regarding demographics, age, gender, and driving experience were significant predictors of risky and aggressive driving behaviors, while age and driving experience were significant predictors of negative emotional driving. These findings were also in line with those of previous studies [16,19,22,51] where age, gender, and driving experience were significant predictors as well. For the Chinese dataset, the results of the GLM model showed a similar trend. Motorbike riding expertise and driving training were significant predictors of dangerous (risky, aggressive, and negative emotions) driving behaviors. The motorbike riding expertise variable was used for the first time among Chinese drivers, and it was found that the less the motorbike riding expertise, the fewer aggressive and risky driving behaviors are undertaken, which is in accordance with the results of a previous study [49]. Regarding demographics, age and driving experience were significant predictors of dangerous (risky, aggressive, and negative emotions) driving behaviors, while gender was only the significant predictor of risky driving behaviors. As in the works of Qu, Ge [22], Iliescu and Sarbescu [19], Ellison-Potter, Bell [51], and Dula and Ballard [16], with increased age and driving experience, the involvement of Chinese drivers in dangerous driving behaviors is reduced.
To examine the differences in aberrant and positive driving behaviors of Chinese and Pakistani drivers, mean scores of items were evaluated and compared. The results indicate that most of the Pakistani drivers are involved in aberrant driving, i.e., commit more mistakes, errors, and violations, compared to their Chinese counterparts. The results of this study are similar to those of Hussain and Shi [52], who also concluded that Pakistani drivers exhibit more aberrant driving behaviors compared to Chinese. These aberrant driving behaviors shown by Pakistani drivers poses a significant threat to road safety. Similarly, the mean item score comparison of positive driving behaviors between the two countries showed the same trend, i.e., Chinese drivers showed more positive behaviors while driving compared to Pakistani drivers, which could be attributed to stringent laws, strict enforcement, and educational campaigns in China.
The second objective of this study was to determine driving behaviors and other factors that are responsible for road traffic accidents in China and Pakistan. To accomplish this objective, four binary logistic regression models were utilized. The results of the binary regression model indicated that aggressive and risky driving behaviors turned to be the influential indicator of vehicle crashes among both Chinese and Pakistani drivers. For Pakistani drivers, with each unit increase in aggressive driving behaviors, the probability of being involved in a traffic accident increases to 55%, while among Chinese drivers, it increases to 39%. A one-unit increase in risky driving behavior increases the probability of being involved in a traffic accident to 69%, whereas among Chinese drivers, it increases to 43%. Aggressive and risky driving behaviors are more likely to lead to traffic collisions, as reported in numerous studies. Consequently, the results of this investigation align with the existing corpus of literature concerning the subject [22,53,54,55,56,57]. The errors and violations dimension of aberrant driving behavior was also found to be a significant predictor of traffic accidents in both samples. Based on the results, it could be argued that the drivers who commit errors and violations while driving more frequently are more involved in traffic accidents. A one-unit increase in errors increases the probability of being involved in a traffic accident by 48% among Chinese drivers and 49% among Pakistani drivers. Similarly, a one-unit increase in violations increases the probability of accidents by 50% among Pakistani drivers and 68% among Chinese drivers. The results of this investigation align with the existing corpus of literature concerning the issue that drivers reporting higher levels of violations and errors were more often involved in accidents than those reporting lower levels [20,58,59,60,61,62,63]. Finally, the results of binary logistic regression showed that positive driving behaviors negatively and significantly predict road traffic accidents, which is consistent with the research of Han and Zhao [64] and Singh and Kathuria [65], but their studies were limited to commercial bus drivers only. The previous attempts of Ozkan and Lajunen [15], Gueho, Granie [66] and Shen, Qu [46] failed to find a significant association of PDBS scores with traffic accidents in a random sample of motor vehicle drivers. As such, the present study is the first to predict a significant association of PDBS scores with traffic accidents in a random sample of motor vehicle drivers. A one-unit increase in positive driving behaviors decreased the probability of being involved in traffic accidents by 59% in the Pakistani sample and 78% in the Chinese sample.
Furthermore, regarding demographics, age, driving experience, and motorbike riding expertise were significant predictors of traffic accidents in the Pakistani sample, while only driving experience came out to be a significant predictor of traffic accidents in the Chinese sample. It may be argued that the findings show how younger, inexperienced drivers seem to drive more aggressively, take risks, and let feelings over power them. This makes them more susceptible to being involved in accidents than older, more experienced drivers. It was observed that a one-unit increase in driving experience decreases the probability of traffic accidents by 27% in the Pakistani sample and 30% for Chinese drivers. These findings are in accordance with studies by Qu, Ge [22] and Dula and Ballard [16]. Among the study variables, only motorbike riding expertise came out to be a major indicator of traffic accidents for Pakistani drivers, while for Chinese drivers, it did not reach a significant level. The results indicated that a one-unit rise in prior motorbike riding expertise increases the probability of traffic accidents by 55% for Pakistani drivers. The variables of seat belt usage and driving training did not reach a significant level. For Chinese drivers, driving training was the only study variable to be a significant predictor of traffic accidents, indicating that drivers with proper training are less involved in traffic accidents compared to drivers without proper training.

8. Conclusions

Driving behaviors in China and Pakistan share similarities and variances that are affected by cultural, legislative, and infrastructure issues. Based on the results of this study, it can be concluded that driving behaviors exhibited by Chinese drivers are safer and better compared to Pakistani drivers. The reasons for such a result are that China has strict traffic laws and regulations that cover various aspects of driving. Violators of such laws end up with fines, penalties, demerit points on driver records, and in severe cases license suspension. Apart from this, the traffic infrastructure and the traffic management system in China is state of the art, which also compels drivers to be law-abiding. Furthermore, positive driving practices in China are influenced by the government’s and different groups’ ongoing efforts to educate the public about road safety. Campaigns to raise awareness frequently stress how important it is to abide by driving laws, use seat belts, and abstain from risky behavior. In the case of Pakistan, the main problem is the ineffectiveness of traffic laws and regulations throughout the country, due to which road safety is being compromised. The regulations exist, but the enforcement is not strict or effective. To increase road safety in Pakistan, traffic laws must be strictly enforced uniformly and violations must result in severe penalties, i.e., demerit points or cancellation of driving license. Programs for road safety awareness and education must be expanded. An increased risk of accidents may result from a lack of knowledge among many drivers and other road users about safe driving behaviors. In addition, road infrastructure and the traffic management system need improvement as well in order to promote and improve road safety in the country.

9. Limitations

There are a few shortcomings of the current study. The main shortcoming is the reliance on drivers’ self-reports, which are relatively inexpensive but sometimes assumed to be biased, to identify accidents and driving behaviors. Even though our study’s conclusions were based on 623 respondents—81.2% of whom were male—with very little representation from women in the Pakistani sample, we firmly believe that future research with more female participants will be able to more accurately extrapolate the findings to the entire community. Since this is the first study to compare the driving behaviors of Chinese and Pakistani drivers, more detailed research is necessary to explain the driving behaviors based on factors not covered in this study.

Author Contributions

Conceptualization and methodology: A.Y. and J.W.; data collection, analysis, and draft writing: A.Y.; final writing and review: J.W. and A.Y.; supervision and resources: J.W. All authors have read and agreed to the published version of the manuscript.

Funding

This research received no external funding.

Institutional Review Board Statement

No ethical approval was required for this study.

Informed Consent Statement

Informed consent was obtained from all subjects involved in the study.

Data Availability Statement

Data will be made available upon request from the corresponding author.

Conflicts of Interest

The others declare no conflicts of interest.

References

  1. WHO. Global Status Report on Road Safety 2023; World Health Organization: Geneva, Switzerland, 2023. [Google Scholar]
  2. WHO. Global Status Report on Road Safety 2018; World Health Organization: Geneva Switzerland, 2018. [Google Scholar]
  3. Niu, Y.; Li, Z.; Fan, Y. Analysis of truck drivers’ unsafe driving behaviors using four machine learning methods. Int. J. Ind. Ergon. 2021, 86, 103192. [Google Scholar] [CrossRef]
  4. Evans, L. The dominant role of driver behavior in traffic safety. Am. J. Public Health 1996, 86, 784–786. [Google Scholar] [CrossRef] [PubMed]
  5. Rashmi, B.S.; Marisamynathan, S. Factors affecting truck driver behavior on a road safety context: A critical systematic review of the evidence. J. Traffic Transp. Eng. 2023, 10, 835–865. [Google Scholar] [CrossRef]
  6. Martinez, C.M.; Heucke, M.; Wang, F.-Y.; Gao, B.; Cao, D. Driving Style Recognition for Intelligent Vehicle Control and Advanced Driver Assistance: A Survey. IEEE Trans. Intell. Transp. Syst. 2018, 19, 666–676. [Google Scholar] [CrossRef]
  7. Elassad, Z.E.A.; Mousannif, H.; Al Moatassime, H.; Karkouch, A. The application of machine learning techniques for driving behavior analysis: A conceptual framework and a systematic literature review. Eng. Appl. Artif. Intell. 2020, 87, 103312. [Google Scholar] [CrossRef]
  8. Hussain, B.; Miwa, T.; Sato, H.; Morikawa, T. Subjective evaluations of self and others’ driving behaviors: A comparative study involving data from drivers in Japan, China, and Vietnam. J. Saf. Res. 2023, 84, 316–329. [Google Scholar] [CrossRef] [PubMed]
  9. Grengs, J.; Wang, X.; Kostyniuk, L. Using GPS data to understand driving behavior. J. Urban Technol. 2008, 15, 33–53. [Google Scholar] [CrossRef]
  10. Stopher, P.; FitzGerald, C.; Zhang, J. Search for a global positioning system device to measure person travel. Transp. Res. Part C Emerg. Technol. 2008, 16, 350–369. [Google Scholar] [CrossRef]
  11. Gianfranchi, E.; Spoto, A.; Tagliabue, M. Risk profiles in novice road users: Relation between moped riding simulator performance, on-road aberrant behaviors and dangerous driving. Transp. Res. Part F Traffic Psychol. Behav. 2017, 49, 132–144. [Google Scholar] [CrossRef]
  12. Chebat, D.-R.; Lemarié, L.; Rotnemer, B.; Talbi, T.; Wagner, M. The young and the reckless: Social and physical warning messages reduce dangerous driving behavior in a simulator. J. Retail. Consum. Serv. 2021, 63, 102701. [Google Scholar] [CrossRef]
  13. Reason, J.; Manstead, A.; Stradling, S.; Baxter, J.; Campbell, K. Errors and violations on the roads: A real distinction? Ergonomics 1990, 33, 1315–1332. [Google Scholar] [CrossRef] [PubMed]
  14. Niezgoda, M.; Kamiński, T.; Kruszewski, M. Measuring driver behaviour-indicators for traffic safety. J. KONES Powertrain Transp. 2012, 19, 503–511. [Google Scholar] [CrossRef]
  15. Özkan, T.; Lajunen, T. A new addition to DBQ: Positive Driver Behaviours Scale. Transp. Res. Part F Traffic Psychol. Behav. 2005, 8, 355–368. [Google Scholar] [CrossRef]
  16. Dula, C.S.; Ballard, M.E. Development and evaluation of a measure of dangerous, aggressive, negative emotional, and risky driving. J. Appl. Soc. Psychol. 2003, 33, 263–282. [Google Scholar] [CrossRef]
  17. Willemsen, J.; Dula, C.S.; Declercq, F.; Verhaeghe, P. The Dula Dangerous Driving Index: An investigation of reliability and validity across cultures. Accid. Anal. Prev. 2008, 40, 798–806. [Google Scholar] [CrossRef]
  18. Richer, I.; Bergeron, J. Differentiating risky and aggressive driving: Further support of the internal validity of the Dula Dangerous Driving Index. Accid. Anal. Prev. 2012, 45, 620–627. [Google Scholar] [CrossRef] [PubMed]
  19. Iliescu, D.; Sârbescu, P. The relationship of dangerous driving with traffic offenses: A study on an adapted measure of dangerous driving. Accid. Anal. Prev. 2013, 51, 33–41. [Google Scholar] [CrossRef] [PubMed]
  20. Hussain, M.; Shi, J. Effects of proper driving training and driving license on aberrant driving behaviors of Pakistani drivers-A Proportional Odds approach. J. Transp. Saf. Secur. 2019, 13, 661–679. [Google Scholar] [CrossRef]
  21. Deffenbacher, J.L.; Lynch, R.S.; Oetting, E.R.; Swaim, R.C. The Driving Anger Expression Inventory: A measure of how people express their anger on the road. Behav. Res. Ther. 2002, 40, 717–737. [Google Scholar] [CrossRef]
  22. Qu, W.; Ge, Y.; Jiang, C.; Du, F.; Zhang, K. The Dula Dangerous Driving Index in China: An investigation of reliability and validity. Accid. Anal. Prev. 2014, 64, 62–68. [Google Scholar] [CrossRef]
  23. Özkan, T.; Lajunen, T.; Chliaoutakis, J.E.; Parker, D.; Summala, H. Cross-cultural differences in driving behaviours: A comparison of six countries. Transp. Res. Part F Traffic Psychol. Behav. 2006, 9, 227–242. [Google Scholar] [CrossRef]
  24. Parker, D.; Reason, J.T.; Manstead, A.S.R.; Stradling, S.G. Driving errors, driving violations and accident involvement. Ergonomics 1995, 38, 1036–1048. [Google Scholar] [CrossRef] [PubMed]
  25. Parker, D.; West, R.; Stradling, S.; Manstead, A.S. Behavioural characteristics and involvement in different types of traffic accident. Accid. Anal. Prev. 1995, 27, 571–581. [Google Scholar] [CrossRef] [PubMed]
  26. Warner, H.W.; Özkan, T.; Lajunen, T.; Tzamalouka, G. Cross-cultural comparison of drivers’ tendency to commit different aberrant driving behaviours. Transp. Res. Part F Traffic Psychol. Behav. 2011, 14, 390–399. [Google Scholar] [CrossRef]
  27. Aberg, L.; Rimmo, P.-A. Dimensions of aberrant driver behaviour. Ergonomics 1998, 41, 39–56. [Google Scholar] [CrossRef] [PubMed]
  28. Hussain, M.; Shi, J.; Batool, Z. An investigation of the effects of motorcycle-riding experience on aberrant driving behaviors and road traffic accidents-A case study of Pakistan. Int. J. Crashworthiness 2020, 27, 70–79. [Google Scholar] [CrossRef]
  29. Lajunen, T.; Corry, A.; Summala, H.; Hartley, L. Cross-cultural differences in Drivers’ self-assessments of their perceptual-motor and safety skills: Australians and Finns. Personal. Individ. Differ. 1998, 24, 539–550. [Google Scholar] [CrossRef]
  30. Ersan, Ö.; Üzümcüoğlu, Y.; Azık, D.; Fındık, G.; Kaçan, B.; Solmazer, G.; Özkan, T.; Lajunen, T.; Öz, B.; Pashkevich, A.; et al. Cross-cultural differences in driver aggression, aberrant, and positive driver behaviors. Transp. Res. Part F Traffic Psychol. Behav. 2020, 71, 88–97. [Google Scholar] [CrossRef]
  31. Alemdar, K.D.; Çodur, M.K.; Codur, M.Y.; Uysal, F. Environmental Effects of Driver Distraction at Traffic Lights: Mobile Phone Use. Sustainability 2023, 15, 15056. [Google Scholar] [CrossRef]
  32. National Bureau of Statistics of China. China Statistical Year Book 2022; China Statistics Press: Beijing, China, 2022. [Google Scholar]
  33. Xinhua. China Sees Surge in Registered NEVs in 2022; China Daily: China, Beijing, 2023. [Google Scholar]
  34. Pakistan Bureau of Statistics (PBS). Pakistan Statistical Year Book 2020; Ministry of Planning Development and Special Initiatives: Islamabad, Pakistan, 2020. [Google Scholar]
  35. Gaygısız, E. Cultural values and governance quality as correlates of road traffic fatalities: A nation level analysis. Accid. Anal. Prev. 2010, 42, 1894–1901. [Google Scholar] [CrossRef]
  36. Hofstede-Insights. Country Comparison Tool; The Culture Factor Group: Helsinki, Finland, 2023. [Google Scholar]
  37. Economic-Survey. Pakistan Economic Survey 2012-13. Ministry of Finance: Pakistan. 2012. Available online: https://www.finance.gov.pk/survey/chapters_13/13-Transport%20final.pdf (accessed on 21 November 2023).
  38. Shah, S.A.; Ahmad, N.; Ha, A.B. Pedestrian’s exposure to road traffic crashes in urban environment: A case study of Peshawar, Pakistan. J. Pak. Med. Assoc. 2018, 68, 615–623. [Google Scholar]
  39. NTRC. Lengths of Roads in Pakistan; National Transport Research Center: Islamabad, Pakistan, 2023. [Google Scholar]
  40. Batool, Z. Attitudes towards Road Safety and Aberrant Behaviour of Drivers in Pakistan; University of Leeds: Leeds, UK, 2012. [Google Scholar]
  41. Government of Pakistan. Motor Vehicle Ordinance (MVO). Government of Pakistan: Pakistan. 1965. Available online: http://punjablaws.gov.pk/laws/189.html (accessed on 21 November 2023).
  42. Government of Pakistan. The National Highways Safety Ordinance, 2000. Ministry of Communication Pakistan: Pakistan. 2000. Available online: https://pakistancode.gov.pk/english/UY2FqaJw1-apaUY2Fqa-apaUY2FobJ0%3D-sg-jjjjjjjjjjjjj (accessed on 21 November 2023).
  43. Atchley, P.; Shi, J.; Yamamoto, T. Cultural foundations of safety culture: A comparison of traffic safety culture in China, Japan and the United States. Transp. Res. Part F Traffic Psychol. Behav. 2014, 26, 317–325. [Google Scholar] [CrossRef]
  44. Government of China. Law of the People’s Republic of China on Road Traffic Safety. 2001. Available online: http://www.china.org.cn/china/LegislationsForm2001-2010/2011-02/14/content_21915182.htm (accessed on 21 November 2023).
  45. Batool, Z.; Carsten, O. Self-reported dimensions of aberrant behaviours among drivers in Pakistan. Transp. Res. Part F Traffic Psychol. Behav. 2017, 47, 176–186. [Google Scholar] [CrossRef]
  46. Shen, B.; Qu, W.; Ge, Y.; Sun, X.; Zhang, K. The relationship between personalities and self-report positive driving behavior in a Chinese sample. PLoS ONE 2018, 13, e0190746. [Google Scholar] [CrossRef]
  47. Cronbach, L.J. Coefficient alpha and internal structure of tests. Psychometrika 1951, 16, 297–334. [Google Scholar] [CrossRef]
  48. Dunn, P.K. Generalized linear models*. In International Encyclopedia of Education, 4th ed.; Tierney, R.J., Rizvi, F., Ercikan, K., Eds.; Elsevier: Oxford, UK, 2023; pp. 583–589. [Google Scholar] [CrossRef]
  49. Yousaf, A.; Wu, J. Motorcycle-Riding Experience: Friend or Foe? Understanding Its Effects on Driving Behavior and Accident Risk. Sustainability 2023, 15, 10709. [Google Scholar] [CrossRef]
  50. Mayhew, D.R.; Simpson, H.M.; Robinson, A. The safety value of driver education and training. Inj. Prev. 2002, 8 (Suppl. 2), ii3–ii8. [Google Scholar] [CrossRef]
  51. Ellison-Potter, P.; Bell, P.; Deffenbacher, J. The effects of trait driving anger, anonymity, and aggressive stimuli on aggressive driving behavior. J. Appl. Soc. Psychol. 2001, 31, 431–443. [Google Scholar] [CrossRef]
  52. Hussain, M.; Shi, J. Predictors of aberrant driving behaviors of Pakistani drivers by using proportional odds (PO) model. Asian Transp. Stud. 2020, 6, 100005. [Google Scholar] [CrossRef]
  53. Mohammadpour, S.I.; Nassiri, H. Aggressive driving: Do driving overconfidence and aggressive thoughts behind the wheel, drive professionals off the road? Transp. Res. Part F Traffic Psychol. Behav. 2021, 79, 170–184. [Google Scholar] [CrossRef]
  54. Sullman, M.J.; Stephens, A.N.; Yong, M. Anger, aggression and road rage behaviour in Malaysian drivers. Transp. Res. Part F Traffic Psychol. Behav. 2015, 29, 70–82. [Google Scholar] [CrossRef]
  55. Wickens, C.M.; Mann, R.E.; Ialomiteanu, A.R.; Stoduto, G. Do driver anger and aggression contribute to the odds of a crash? A population-level analysis. Transp. Res. Part F Traffic Psychol. Behav. 2016, 42, 389–399. [Google Scholar] [CrossRef]
  56. Fergusson, D.; Swain-Campbell, N.; Horwood, J. Risky driving behaviour in young people: Prevalence, personal characteristics and traffic accidents. Aust. N. Z. J. Public Health 2003, 27, 337–342. [Google Scholar] [CrossRef]
  57. Mekonnen, T.H.; Tesfaye, Y.A.; Moges, H.G.; Gebremedin, R.B. Factors associated with risky driving behaviors for road traffic crashes among professional car drivers in Bahirdar city, northwest Ethiopia, 2016: A cross-sectional study. Environ. Health Prev. Med. 2019, 24, 17. [Google Scholar] [CrossRef] [PubMed]
  58. Shao, H.-P.; Yin, J.; Yu, W.-H.; Wang, Q.-L. Aberrant Driving Behaviours on Risk Involvement among Drivers in China. J. Adv. Transp. 2020, 2020, 8878711. [Google Scholar] [CrossRef]
  59. Rowe, R.; Roman, G.D.; McKenna, F.P.; Barker, E.; Poulter, D. Measuring errors and violations on the road: A bifactor modeling approach to the Driver Behavior Questionnaire. Accid. Anal. Prev. 2015, 74, 118–125. [Google Scholar] [CrossRef] [PubMed]
  60. Gras, M.E.; Sullman, M.J.; Cunill, M.; Planes, M.; Aymerich, M.; Font-Mayolas, S. Spanish drivers and their aberrant driving behaviours. Transp. Res. Part F Traffic Psychol. Behav. 2006, 9, 129–137. [Google Scholar] [CrossRef]
  61. Sullman, M.J.; Meadows, M.L.; Pajo, K.B. Aberrant driving behaviours amongst New Zealand truck drivers. Transp. Res. Part F Traffic Psychol. Behav. 2002, 5, 217–232. [Google Scholar] [CrossRef]
  62. de Winter, J.; Dodou, D. The Driver Behaviour Questionnaire as a predictor of accidents: A meta-analysis. J. Saf. Res. 2010, 41, 463–470. [Google Scholar] [CrossRef]
  63. Haghi, A.; Ketabi, D.; Ghanbari, M.; Rajabi, H. Assessment of Human Errors in Driving Accidents; Analysis of the Causes Based on Aberrant Behaviors. Life Sci. J. 2014, 11, 414–420. [Google Scholar]
  64. Han, W.; Zhao, J. Driver behaviour and traffic accident involvement among professional urban bus drivers in China. Transp. Res. Part F Traffic Psychol. Behav. 2020, 74, 184–197. [Google Scholar] [CrossRef]
  65. Singh, H.; Kathuria, A. Self-reported aberrant driving behavior among Bus Rapid Transit drivers. J. Public Transp. 2023, 25, 100040. [Google Scholar] [CrossRef]
  66. Guého, L.; Granié, M.-A.; Abric, J.-C. French validation of a new version of the Driver Behavior Questionnaire (DBQ) for drivers of all ages and level of experiences. Accid. Anal. Prev. 2014, 63, 41–48. [Google Scholar] [CrossRef] [PubMed]
Figure 1. Hofstede six-dimensional cultural comparison of Pakistan and China (source: Hofstede-Insights [36]).
Sustainability 16 05225 g001
Table 1. Road safety indices of China and Pakistan.
DescriptionChinaPakistan
Income GroupMiddleMiddle
Roads and MobilityDesign standards for pedestrians/cyclistsYesPartial
Policies and investments in urban public transportYesYes
Registered VehiclesTotal vehicles registered as of 2022417 million30.75 million
Road Traffic FatalitiesReported road traffic fatalities as of 2015a 58,022 (Male 94% Female 6%)b 4448
WHO estimated road traffic fatalities (2016)256,18027,582
WHO estimated fatality rate per 100,000 population (2016)18.214.3
Law Enforcement IndexSpeed limit lawYes (8)Yes (4)
Seat belt lawYes (7)Yes (6)
Helmet usage lawYes (6)Yes (3)
Child restraint lawNoNo
Drunk driving lawYes (9)Yes (4)
Road NetworkLength of highways as of 2021 (10,000 km)528.0749.3089
Length of expressways as of 2021 (10,000 km)16.910.28
Source: [2,32,33,34]. a: Traffic Management Bureau of the Public Security Ministry. Died within 7 days of crash. b: Pakistan Bureau of Statistics (police records of provinces). Died at scene of crash.
Table 2. Descriptive statistics of sample.
VariableCategoryPakistan
Sample (N: 623)
Chinese
Sample (N: 630)
(%Age)(%Age)
SexMen81.263.2
Women18.836.8
Age group18–24 years37.93.2
25–34 years20.962.1
35–44 years17.227.0
45–54 years12.56.8
55–64 years9.60.8
>65 years20.2
Driving experience<1 year13.12.5
1–5 years35.734.8
5–10 years26.044.3
11–15 years12.214.0
16–20 years6.03.5
>20 years7.11.0
Driving licenseYes71.7100
No28.3-
Motorbike riding expertiseNo experience23.917.6
1–4 years30.731.2
5–8 years20.718.8
9–12 years9.310
13–16 years8.89.2
17–20 years4.79.6
>20 years2.63.6
Accidents in last 3 yearsYes55.547.8
No44.552.2
Table 3. Results of PCA on Pakistani DBQ.
Principal Component Analysis of Pakistani DBQ
ItemsDescriptionFactors
ErrorsViolationMistakes
Item 1Attempt to drive away from traffic lights in third gear.0.580
Item 3Intend to switch on the windscreen wipers, but switch on the lights instead or vice versa.0.635
Item 4Try to overtake without first checking your mirror and then get hooted at by the car behind, which has already begun its overtaking maneuver.0.456
Item 8Fail to read the signs correctly, and exit from a roundabout on the wrong road.0.612
Item 2Become impatient with a slow driver in the outer lane and overtake on the inside. 0.697
Item 5Deliberately disregard the speed limits late at night or very early in the morning.0.722
Item 12Disregard red lights when driving late at night along empty road.0.670
Item 24Fail to fasten seat belt while driving.0.466
Item 14Turn left on to a main road into the path of an oncoming vehicle that you hadn’t seen, or whose speed you had misjudged. 0.649
Item 16Hit something when reversing that you had not previously seen.0.587
Item 17Get into the wrong lane at a roundabout or approaching a road junction.0.428
Item 18Misjudge your crossing interval when turning right and narrowly miss collision.0.485
Item 19Ignore continuous white lines while changing lane/overtaking.0.565
Extraction method: principal component analysis. Rotation method: varimax with Kaiser normalization. Rotation converged in 6 iterations.
Table 4. Results of Chinese DDDI Principal Component Analysis.
Principal Component Analysis of Chinese DDDI
ItemsDescriptionFactors
Aggressive DrivingNegative EmotionsRisky Driving
DDDB2ADI make rude gestures (e.g., giving “the finger”, yelling curse words).0.793
DDDB3ADI verbally insult drivers who annoy me.0.638
DDDB4ADI deliberately use my car/truck to block drivers who tailgate me.0.541
DDDB5ADI would tailgate a driver who annoys me.0.640
DDDB6ADWhen someone cuts me off, I feel I should punish him/her.0.539
DDDB11NEBeing struck in a traffic bottleneck aggravates me. 0.843
DDDB12NEI get frustrated and/or angry when I drive and get behind schedule.0.839
DDDB15NEIf I have to encounter another motorist, I think I could snap.0.809
DDDB16NEI get irritated when a car/truck in front of me slows down for no reason.0.752
DDDB21RDI will drive if I am only mildly intoxicated or buzzed. 0.788
DDDB26RDI will drive when I am drunk.0.751
DDDB28RDI feel that most traffic “laws” could be considered as suggestions.0.453
DDDB27RDI consider myself to be a risk-taker.0.349
DDDB22RDI will cross double-yellow lines to see if I can pass a slow-moving car/truck.0.413
Extraction method: principal component analysis. Rotation method: varimax with Kaiser normalization a. a Rotation converged in 5 iterations.
Table 5. Correlation analysis results for Chinese dataset.
Chinese Drive Behavior Data Correlation Analysis
Variables12345678910111213
Aggressive Driving-
Negative Emotions0.285 **-
Risky Driving0.640 **0.324 **-
Errors0.609 **0.156 **0.463 **-
Violations0.649 **0.248 **0.648 **0.582 **-
Mistakes0.504 **0.324 **0.392 **0.516 **0.442 **-
PDBS−0.665 **−0.352 **−0.577 **−0.592 **−0.662 **−0.564 **-
Accidents0.714 **0.323 **0.656 **0.633 **0.738 **0.605 **−0.777 **-
Age−0.436 **−0.200 **−0.228 **−0.308 **−0.269 **−0.295 **0.306 **−0.315 **-
Gender0.024 *0.0460.032 *0.016 *0.016 *0.0510.0250.0280.031-
Driving Experience−0.395 **−0.180 **−0.281 **−0.274 **−0.333 **−0.293 **0.357 **−0.360 **0.695 **−0.067-
Motorcycle Experience0.304 **0.453 *0.508 **0.326 **0.296 *0.317 *−0.459 **0.656 **0.183 *−0.094 *0.194 **-
Driving Training−0.175 **−0.108 *−0.177 **−0.166 **−0.184 **−0.200 **0.207 **−0.253 **0.104 *0.0240.112 **0.008-
** Correlation is significant at the 0.01 level (2-tailed). * Correlation is significant at the 0.05 level (2-tailed).
Table 6. Correlation analysis results for Pakistani dataset.
Pakistani Driver Behavior Data Correlation Analysis
Variables12345678910111213
Aggressive Driving-
Risky Driving0.480 **-
Negative Emotions0.496 **0.630 **-
Errors0.153 **0.204 **0.254 **-
Violations0.259 **0.395 **0.395 **0.416 **-
Mistakes0.140 **0.176 **0.259 **0.446 **0.397 **-
PDBS−0.339 **−0.334 **−0.318 **−0.300 **−0.375 **−0.298 **-
Accidents0.151 **0.119 **0.142 **0.102 *0.312 **0.262 *−0.343 **-
Age−0.278 **−0.365 **−0.338 **−0.288 **−0.348 **−0.201 **0.380 **0.071-
Driving Experience−0.093 **−0.04−0.153 **−0.050 **−0.013 **−0.040 **0.029 **−0.0060.477 **-
Motorcycle Experience0.184 **0.165 **0.154 **0.085 *0.091 *0.093 *0.160 **0.463 **0.134 **0.035 **-
Seat Belt Usage−0.058 **−0.111 *−0.091 *0.128−0.060.0180.046 *−0.086 *−0.0600.018 *−0.059-
Driver Training−0.178 **−0.165 **−0.138 **−0.188 **−0.148 **−0.101 **0.280 **−0.051 *0.057 *0.043 **0.0120.028 *-
** Correlation is significant at the 0.01 level (2-tailed). * Correlation is significant at the 0.05 level (2-tailed).
Table 7. First GLM model results.
VariableBSEWaldp (Sig.)OR95% CI
LowerUpper
Risky Driving (RD)Chi-squared: 86.385, p-value less than 0.01
Age (18–24)0.1500.15943.3660.0381.1610.8501.587
Age (25–34)0.0370.16012.0530.0171.0380.7581.420
Age (over 65)0 a
Gender (male)0.0560.05461.0650.0121.0580.9511.177
Gender (female)0 a
Experience (<1 year)0.0530.12870.1720.0091.0550.8201.358
Experience (1–5 years)0.1510.09112.7620.0071.1630.9731.391
Experience (>20 years)0 a
Driving Training (from traffic police driving school)−0.3980.13039.3150.0020.6720.5200.867
Driving Training (from a private driving school)−0.2290.10994.3490.0370.7950.6410.986
Driving Training (from a friend)−0.2920.11037.0230.0080.7470.6010.927
Driving Training (from a relative/family member)−0.2420.10155.3080.0210.7850.6390.965
Driving Training (none)0 a
Seat Belt (yes)−0.0930.05043.3780.0460.9110.8261.006
Seat Belt (no)0 a
Motorbike Experience (none)−0.3950.105813.9650.0000.6730.5470.829
Motorbike Experience (1–4 years)−0.3710.104812.5200.0000.6900.5620.848
Motorbike Experience (>20 years)0 a
Driving License (yes)−0.1010.04834.4160.0360.9040.8220.993
Driving License (No)0 a
Likelihood chi-squared: 86.385, df: 30, significance: p-value less than 0.01. Akaike’s information criterion (AIC): 1403.212. Bayesian information criterion (BIC): 1531.814. B: coefficient, SE: standard error, OR: O.R, CI: confidence interval. a This parameter is set to zero because it is redundant.
Table 8. Second GLM model results.
VariableBSEWaldp (Sig.)OR95% CI
LowerUpper
Aggressive Driving (AD)Chi-squared: 57.153, p-value less than 0.01
Age (18–24)0.4260.15407.6360.0061.5301.1322.070
Age (25–34)0.3600.15495.4140.0201.4341.0581.942
Age (35–44)0.4130.15197.3720.0071.5111.1222.035
Age (over 65)0 a
Gender (Male)0.1410.05287.1560.0071.1521.0381.277
Gender (Female)0 a
Driving Training (from traffic police driving school)−0.2420.10125.7200.0170.7850.6440.957
Driving Training (none)0 a
Seat Belt (yes)−0.0860.04873.1550.0440.9170.8340.1.009
Seat Belt (no)0 a
Driving Experience (<1 year)0.2170.12213.1580.0461.3400.9751.226
Driving Experience (1–5 year)0.1220.08681.9880.0391.1300.9531.340
Driving Experience (>20 year)0 a
Motorbike Experience (none)−0.4730.090027.5850.0000.6230.5230.744
Motorbike Experience (1–4 years)−0.4490.089025.4410.0000.6380.5360.760
Motorbike Experience (5–8 years)−0.2550.09127.7840.0050.7750.6480.927
Motorbike Experience (9–12 years)0.2610.09697.2680.0071.2981.0741.570
Motorbike Experience (13–16 years)0.2860.09708.7180.0031.3321.1011.611
Motorbike Experience (17–20 years)0.2880.10587.3930.0071.3331.0841.641
Motorbike Experience (>20 years)0 a
Likelihood chi-squared: 57.153, df: 27, significance: p-value less than 0.01. Akaike’s information criterion (AIC): 1737.092, Bayesian information criterion (BIC): 1865.693. B: coefficient, SE: standard error, OR: O.R, CI: confidence interval. a This parameter is set to zero because it is redundant.
Table 9. Third GLM model results.
VariableBSEWaldp (Sig.)OR95% CI
LowerUpper
Negative Emotion (NE)Chi-squared: 56.068, p-value less than 0.01
Age (18–24)0.1030.11944.7500.0271.2021.0141.240
Age (25–34)0.1600.12095.7460.0461.2781.2731.380
Age (55–64)−0.1230.12091.0290.0300.8850.6981.121
Age (>65)0 a
Gender Not Significant
Education Not Significant
Experience (16–20 years)−0.1650.07724.5940.0320.8800.9411.372
Experience (>20 years)0 a
Motorbike Experience (9–12 years)0.2700.11885.1630.0231.3101.0381.653
Motorbike Experience (17–20 years)0.3140.13075.7770.0161.3691.0601.769
Motorbike Experience (>20 years)0 a
Likelihood chi-squared: 56.068, df: 27, significance: p-value less than 0.01. Akaike’s information criterion (AIC): 1964.977. Bayesian information criterion (BIC): 2093.597. B: coefficient, SE: standard error, OR: O.R, CI: confidence interval. a This parameter is set to zero because it is redundant.
Table 10. Fourth GLM model (China) results.
ParameterBStd. ErrorWald Chi-Squaredp (Sig.)Exp (B)95% Wald Confidence Interval for Exp (B)
LowerUpper
Risky driving CNChi-squared: 69.476, p-value less than 0.01
Age (18–24 years)0.1550.26500.3440.0471.1680.6951.964
Age (25–34 years)0.0700.25840.0740.0361.0730.6461.780
Age (35–44 years)0.1340.25650.2730.0161.1430.6921.890
Age (45–54 years)−0.1090.25080.1900.0460.8970.5481.466
Age (55–64 years)−0.1050.24800.1780.0430.7100.6831.805
Age (>65 years)0 a
Gender (male)0.0460.03831.4490.0291.0470.9711.129
Gender (female)0 a
Experience (<1 year)0.2540.21321.4210.0331.2890.8491.958
Experience (1–5 years)0.1990.20400.9560.0281.2210.8181.821
Experience (6–10 years)0.1440.20240.5070.0481.1550.7771.717
Experience (16–20 years)−0.3020.20342.2050.0140.7390.4961.101
Experience (>20 years)0 a
Motorbike Experience (none)−0.0560.12830.1880.0440.9460.7351.216
Motorbike Experience (1–4 years)0.0860.10760.6350.0261.2921.0741.533
Motorbike Experience (>20 years)0 a
Driving Training (traffic police school)−0.9270.30709.1160.0030.7390.8431.384
Driving Training (private driving school)−0.8360.30657.4420.0060.8330.7561.151
Driving Training (relative/family member)0 a
Likelihood chi-squared: 69.476, df: 24, Significance: p-value less than 0.01, Akaike’s information criterion (AIC): 1947.957, Bayesian information criterion (BIC): 2059.538. a Set to zero because this parameter is redundant.
Table 11. Fifth GLM model (China) results.
ParameterBStd. ErrorWald Chi-Squaredp (Sig.)Exp (B)95% Wald Confidence Interval for Exp (B)
LowerUpper
Aggressive driving CNChi-squared 190.715 p < 0.00
Age (18–24 years)0.8960.28979.5590.0022.4491.3884.320
Age (25–34 years)0.7590.28267.2140.0072.1361.2283.717
Age (35–44 years)0.7210.28116.5810.0102.0571.1853.568
Age (>65 years)0 a
Experience (<1 year)0.0650.23230.0780.0421.0670.6771.683
Experience (1–5 years)0.0880.22250.1560.0321.0160.5921.417
Experience (6–10 years)−0.1730.22090.6110.4340.8410.5461.297
Experience (16–20 years)−0.1240.22000.3200.0470.8830.5741.359
Experience (>20 years)0 a
Education−0.0230.25000.0080.9270.9770.5991.595
Motorbike Experience (none)−0.0560.13720.1680.0480.9450.7221.237
Motorbike Experience (1–4 years)0.0500.11360.1960.0361.0520.8421.314
Motorbike Experience (5–8 years)0.0150.11370.0170.0401.0150.8121.268
Motorbike Experience (>20 years)0 a
Driving Training (traffic police driving school)−0.1160.33210.1210.0280.7230.5852.152
Driving Training (private driving school)−0.0200.33140.0040.0430.7830.5331.953
Driving Training (relative/family member)0 a
Likelihood chi-squared: 190.715, df: 24, Significance: p-value less than 0.01, Akaike’s information criterion (AIC): 1898.23, Bayesian information criterion (BIC): 2009.97. a This parameter is set to zero because it is redundant.
Table 12. Sixth GLM model (China) results.
ParameterBStd. ErrorWald Chi-Squaredp (Sig.)Exp (B)95% Wald Confidence Interval for Exp (B)
LowerUpper
Negative Emotion CNChi-squared: 46.174, p-value less than 0.01
Age (18–24 years)0.4860.21455.1320.0231.6261.0682.475
Age (25–34 years)0.5060.20915.8570.0161.6591.1012.499
Age (35–44 years)0.4770.20765.2680.0221.6111.0722.419
Age (55–64 years)0.4770.19376.0670.0141.6121.1022.356
Age (>65 years)0 a
Experience (<1 year)0.0360.17260.0430.0361.1650.6881.353
Experience (11–15 years)−0.0400.16000.0620.0400.9610.7021.315
Experience (16–20 years)−0.1170.16110.5280.0370.8900.6491.220
Experience (>20 years)0 a
Motorbike Experience (13–16 years)0.0850.09420.8070.0371.0880.9051.309
Motorbike Experience (17–20 years)0.0410.11790.1220.0271.0600.7621.209
Motorbike Experience (>20 years)0 a
Likelihood chi-squared: 46.174, df: 24, Significance: p-value less than 0.01, Akaike’s information criterion (AIC): 1842.523, Bayesian information criterion (BIC): 1954.103. a Set to zero because this parameter is redundant.
Table 13. Mean score comparison of aberrant driving behaviors.
Item DescriptionMean Score ChinaMean Score
Pakistan
1Try using third gear to escape traffic lights.2.132.12
4Try to overtake without first checking your mirror and then get hooted at by the car behind, which has already begun its overtaking maneuver.1.262.19
7Overtake a slow-moving vehicle on the inside lane or hard shoulder of a motorway.1.582.51
12Disregard red lights when driving late at night along an empty road.1.162.88
15Take a chance and cross on lights that have turned red.1.152.27
20Use your status profile or personal connections to get rid of fines, penalties.2.22.2
23Disregard the speed limit in residential areas.1.153.04
25Get distracted when you use a mobile phone while driving.1.092.64
14Turn left onto a main road into the path of an oncoming vehicle that you hadn’t seen, or whose speed you had misjudged.1.882.31
16When turning around, strike anything you hadn’t seen before.1.672.18
17Get into the wrong lane at a roundabout or approaching a road junction.1.962.14
18Misjudge your crossing interval when turning right and narrowly miss a collision.2.132.22
Table 14. Mean score comparison of positive driving behaviors.
ItemDescriptionMean Score ChineseMean Score Pakistani
1Steer clear of closely following to avoid upsetting the driver of the vehicle ahead.4.523.62
2Use high beams less often to aid incoming motorists.5.043.91
3Parking cars by taking into other road users’ free movement.4.633.94
4Pay attention to puddles not to splash water on pedestrians or other road users.5.224.42
5Adjust my speed to assist the vehicle attempting to pass me.4.64.17
6Not blowing a horn to reduce noise.4.963.84
7To avoid obstructing the oncoming car, go back to where you were.4.664.3
8To improve the speed of traffic flow, stay out of the left lane.4.794.25
9Even though it’s legal for me to pass, let people cross.5.14.35
10I gave the driver a wave of gratitude for his assistance.4.394.57
11I’ll try my best to stay out of the way of other drivers.4.824.58
12Despite hitting the green light, don’t bother the motorist ahead of you by honking horn.4.83.96
13Let other drivers use my right of way.4.614.08
Table 15. Binary logistic regression model 1 results.
VariablesBS.E.WaldSig.Exp (B)
Accidents (criterion)0.1900.0805.5710.0181.209
Aggressive Driving Pak0.4730.14111.2820.0011.604
Risky Driving Pak0.6900.17116.2470.0001.994
Negative Emotions PakInsignificant
Errors0.4750.2374.0170.0451.608
Violations0.4600.2423.6290.0371.584
MistakesInsignificant
PDBS−0.7300.09065.1510.0000.482
Nagelkerke R2: 0.474, model chi-squared: 108.002, sig: p-value less than 0.01, model percentage correctness: 78.0%.
Table 16. Binary logistic regression model 2 results.
VariablesBS.E.WaldSig.Exp (B)
Accidents (criterion)0.1900.0805.5710.0181.209
Aggressive Driving Pak0.5580.15712.6450.0001.748
Risky Driving Pak0.6350.2337.4260.0061.887
Negative Emotions PakInsignificant
Errors0.4910.2374.2990.0381.634
Violations0.5090.2444.3640.0371.664
MistakesInsignificant
PDBS−0.5960.2326.6140.0100.551
Age−0.0590.3992.0220.0380.943
GenderInsignificant
Experience−0.2760.07912.1910.0000.759
Motorcycle Experience0.5530.08740.7460.0001.738
Seat Belt UseInsignificant
Driving TrainingInsignificant
Nagelkerke R2: 0.517, model chi-squared: 159.804, sig: p-value less than 0.01, model percentage correctness: 84.0%.
Table 17. Binary logistic regression model 3 results.
ParameterBS.E.WaldSig.Exp (B)
Accidents (criterion)0.2080.0875.7860.0161.231
Aggressive Driving CHN0.3710.1486.2660.0121.449
Risky Driving CHN0.4350.1835.6460.0171.546
Negative Emotions CHNNot Significant
Errors0.4820.1569.4930.0021.619
Violations0.6850.14921.1820.0001.984
MistakesNot Significant
PDBS−0.7890.14529.7810.0000.454
Nagelkerke R2: 0832, model chi-squared: 524.039, sig: p-value less than 0.01, model percentage correctness: 80.0%.
Table 18. Binary logistic regression model 4 results.
VariablesBS.E.WaldSig.Exp (B)
Accidents (criterion)0.2080.0875.7860.0161.231
Aggressive Driving CHN0.3980.1566.5410.0111.489
Risky Driving CHN0.4230.1885.0700.0241.526
Negative Emotions CHNNot Significant
Errors0.4660.1598.5390.0031.593
Violations0.6720.15419.1330.0001.958
MistakesNot Significant
PDBS−0.7860.14629.0590.0000.456
AgeNot Significant
Experience−0.3080.2851.1720.0180.735
Motorcycle ExperienceNot Significant
GenderNot Significant
Seat Belt UseNot significant
Driving Training−0.835.4094.1590.0410.434
Nagelkerke R2: 0.836, model chi-squared: 529.707, sig: p-value less than 0.01, model percentage correctness: 85.0%.
Disclaimer/Publisher’s Note: The statements, opinions and data contained in all publications are solely those of the individual author(s) and contributor(s) and not of MDPI and/or the editor(s). MDPI and/or the editor(s) disclaim responsibility for any injury to people or property resulting from any ideas, methods, instructions or products referred to in the content.

