Article

Generalized-Norm-Based Robustness Evaluation Model of Bus Network under Snowy Weather

School of Civil Engineering, Zhengzhou University, Zhengzhou 450001, China
*
Author to whom correspondence should be addressed.
Sustainability 2024, 16(12), 5260; https://doi.org/10.3390/su16125260
Submission received: 10 May 2024 / Revised: 8 June 2024 / Accepted: 14 June 2024 / Published: 20 June 2024

Abstract

:
Global climate change leads to frequent extreme snowfall weather, which has a significant impact on the safety and operating efficiency of urban public transportation. In order to cope with the adverse effects of extreme weather, governments should vigorously develop sustainable transportation. Since urban public transportation is a critical component of building a sustainable city, traffic management departments should quantitatively analyze the performance changes of the urban public transportation network under extreme weather conditions. Therefore, fully considering the comprehensive effects of network performance and topology to improve the robustness of urban public transportation systems requires more attention. The urban public transport network with high robustness can achieve fewer recovery costs, lower additional bus scheduling costs, and achieve the sustainable development of the public transport network. Considering the impact of travelers’ travel time tolerance and in-vehicle space congestion tolerance under snowy conditions, this paper proposes a generalized-norm-based robustness evaluation model of the bus network. Example analyses are conducted using checkerboard and ring-radial topological network structures to verify the applicability of the proposed model. The results show the following: (1) In an extreme snowfall scenario, the robustness of checkerboard and ring-radiating bus networks is reduced by 38% and 39%, respectively. (2) In the checkerboard network, the central area units are always more important to the system robustness than the peripheral units, while, in the ring-radial network, the units with higher importance are all in the ring line. (3) The failure of Ring Line 5 has a great impact on both the checkerboard and ring-radial networks, causing the system robustness to decrease by 43% and 50%, respectively.

1. Introduction

Since the concept of sustainable development was put forward in 1978, all walks of life have begun to discuss the concept of and methods for sustainable development. Sustainability in transportation is defined as “transportation that satisfies the current transportation and mobility needs without compromising the ability of future generations to meet those needs” [1]. According to the above definition, sustainable transportation systems are required to be green, efficient, and energy efficient [2]. Urban public transport is a key factor in the sustainable development of transportation. Therefore, governments should vigorously develop urban public transport in light of their national conditions. However, urban public transport has faced many challenges in recent years, especially the extreme weather caused by global warming, which is caused by the increase in greenhouse gas emissions [3]. Climate change makes extreme weather events such as winter storms more frequent and more difficult to predict in terms of intensity [4,5]. China is one of the countries most affected by extreme weather events (especially cold waves) caused by climate change [6]. Heavy snow weather poses great challenges to the normal operation of urban public transportation systems. During the evening rush hour on 15 December 2023, heavy snow caused ground bus passenger flows to increase by nearly 50% among users of the “Tianjin Bus” APP [7]. Due to the change in road surface conditions, the bus travel time and travel demand of various modes of transportation are affected under snowy conditions. The normal operation of the urban public transport network is greatly challenged [8], and the more robust urban public transport network has a smaller percentage of functional loss and stronger ability to resist risks [9].
In order to cope with the adverse effects of extreme weather, the transportation authorities should systematically assess the changes in climatic factors such as temperature and snowfall, quantify the degree of performance change in the urban public transport network under extreme weather, and identify the critical units vulnerable to disasters in the region. Therefore, fully considering the comprehensive effects of network performance and topology to establish a robustness evaluation model of public transport networks based on snowfall weather requires more attention. Under extreme weather conditions, the enhanced robustness of the urban public transport network can reduce the repair cost of the network and increase the travel cost of residents less, and the higher robustness can make the operation scheduling cost of the urban public transport system under extreme weather conditions have a smaller increase. In short, higher robustness can achieve the sustainable development of the urban public transport system.
In the research on the robustness of urban public transport networks, Bruneau et al. [10] regarded robustness as one of the ‘4R characteristics’ of resilience, and regarded robustness as the ‘purpose’ to achieve resilience. Robustness was defined as the ability of the system to maintain its function when facing disturbances [9,11,12]. However, the existing scholars pay more attention to the urban rail transit network [13,14,15,16,17,18,19,20], and there are few studies on the bus network [12,21]. However, the ground bus network still plays an important role in urban public transport due to construction costs [22], management and maintenance costs, and the passenger flow distribution of urban passengers [23]. Therefore, it is necessary to study the robustness of ground public transport in extreme weather. The bus network is related to the ‘last mile’ of travelers, and the robustness of the bus network plays an important role in ensuring the normal operation of the urban public transport network. Urban public transport systems often face many challenges in their daily operations, including natural disasters (such as hurricanes, typhoons, rainfall, snowfall) [24,25,26,27], charging infrastructure disruptions [28], traffic congestion [29], terrorist attacks, etc. These disturbance events are usually divided into two categories, deliberate attack and random attack [30], and it is usually assumed that there are only two states of failure and normal function for unit components in the network [31,32]. However, under certain weather conditions, such as rainfall and snowfall, the unit state in the bus system does not always present this extreme state. For example, for hurricanes, their strong wind speed and accompanying disasters often lead to complete disruption of traffic. The impact of rainfall on the public transport system varies with intensity, duration, and the condition of the ground drainage facilities. When the rain is light and the drainage is good, the system performance may only decrease slightly. On the other hand, continuous heavy rainfall may lead to ground bus outage and rail transit platform water accumulation, which will cause the system to be interrupted. For snowfall conditions, the state of the bus system unit is more complex. It depends on the intensity of snowfall, duration and temperature, and other factors. With slight snowfall and timely road treatment, the bus system may still be able to maintain normal operation; however, under the condition of heavy snow or ice, the safety of vehicle driving is threatened, and the bus line may be completely interrupted. In these cases, the bus system is not completely invalid but in an intermediate state between normal operation and complete interruption. At this time, although the quality of bus service has declined, the system is still transporting passenger flow, and passengers can still complete their travel through the bus system. Therefore, for the bus system under rainfall and snowfall conditions, simply setting the unit state as completely invalid or normal operation may not accurately reflect the actual situation. More detailed and complex models are needed to simulate and evaluate the impact of these weather conditions on the performance of the bus system in order to better guide the operation and management of the bus system. In the study of the robustness of critical components of urban public transport networks, critical units are often considered [17], but the importance ranking of bus lines is ignored.
From the above analysis, the following can be seen: (1) In the urban public transport system, the role of ground public transport cannot be ignored, and its robustness in the face of snowfall weather affects the travel of residents in the city. (2) In the existing research, the complete failure of the unit in the network is considered, and the unit is directly removed during the simulation. There is a lack of analysis of the performance loss and incomplete failure state of the unit in the bus network. (3) Under the condition of snow, the performance of a certain unit in the ground bus network will be reduced, which will affect the operation efficiency of the bus line. Therefore, it is necessary to analyze the importance of the bus line under the condition of snow.
According to the change in disturbance form and function of the bus network under snowfall conditions, the deceleration coefficient and congestion change coefficient are proposed to comprehensively consider travel time tolerance and vehicle space congestion tolerance. The network weighted adjacency matrix is further constructed to analyze the robustness of the bus network under snowy conditions, and find the critical units and critical lines in the network. Two classical network topologies, chessboard and ring radiation, are used to analyze the bus system.
The structure of this paper is as follows. The second part analyzes the effects of snowy conditions on the operations of the public transport network, and obtains the critical parameter indexes that affect the operation ability of public transport network under snowy conditions. The third part constructs a network robustness evaluation model based on the actual situation under snowy conditions. In the fourth part, the robustness of the bus network under snowy conditions is calculated, and the critical units and lines are determined by taking the two network structure types of chessboard and ring radiation as an example. The fifth part summarizes the article.
This paper discusses the robustness of the urban public transport network and proposes a new evaluation method. The contributions of this paper are as follows:
(1)
Considering the vehicle speed reduction and the space congestion within buses under snow conditions, the weighted adjacency matrix is constructed, and a robustness evaluation model of the bus transit network system based on the generalized norm is proposed. When there are enough data, the proposed evaluation model can analyze the network robustness under any vehicle speed and congestion;
(2)
The proposed robustness evaluation model is applied to the bus network under the two classic network topology types of chessboard and ring radiation. The results show that the robustness of the chessboard and ring-radiation bus networks is reduced by 38% and 39%, respectively;
(3)
The unit with the highest importance for the system robustness in the checkerboard network is C910, and the central area unit is always more important than the peripheral units. However, in the ring-radial network, the units that are more important for system robustness are on the ring line, such as C916. In addition, the failure of Ring Line 5 has a great impact on both the checkerboard and ring-radial networks, causing the system robustness to decrease by 43% and 50%, respectively.

2. Effects of Snowy Conditions on the Operations of Bus Network

2.1. Snow Intensity and Road Condition

In weather meteorology, according to snowfall over a period of time, the snow intensity is divided into seven grades: sporadic snow, light snow, medium snow, heavy snow, snowstorm, heavy snowstorm, and severe snowstorm [33]. The snow intensity grade and its corresponding standard are shown in Table 1.
The effect of snow on traffic vehicles mainly depends on the coefficient of friction between the vehicle tires and the road surface, and the coefficient of friction varies with different road surface conditions. Therefore, to study the effect of snowy conditions on the operation of buses, combined with the existing research on the classification of pavement conditions [34], the road surface condition under snowy conditions is divided into five categories: snow, snow covers the ice, ice, snow mixed with ice, and water pavement. The five road conditions are shown in Figure 1: Snowflakes fall and accumulate on the ground to form the snowy road surface, as shown in Figure 1a. The initial falling snowflakes form an ice sheet under the action of low temperature, and the falling snowflakes will cover the surface of the ice sheet to induce the snow covers the ice road surface, as shown in Figure 1b. The snow on the road surface experiences multiple melting and freezing processes, and finally forms the ice road surface, as shown in Figure 1c. During the daytime, the temperature rises, the vehicle tires crush the road surface, and the snow or ice sheet on the road surface melts, forming the snow mixed with ice road surface, as shown in Figure 1d. When the snow on the road completely melts, the snow water will attach to the road surface and form a water film, that is, the water road surface, as shown in Figure 1e.

2.2. Bus Speed

Snow or ice on the road will reduce the coefficient of friction between the vehicle and the tires [34]. Therefore, vehicle speed reductions differ depending on snowy conditions [35]. Due to the time constraints, only the speeds on snowy roads, water roads, and dry roads under normal weather are considered. What is more, trunk roads play a skeleton role in the urban road network, and the normal operation of its function influences the traffic operation of the whole city. By utilizing on-site vehicle operation data, a comparison of speed reductions across different road types is conducted. Since the vehicle operation data of the snowy road are collected at night, and the data of the water road are collected during the day, in order to eliminate the influence of bad light at night on the behavior of drivers, and to compare and analyze vehicle speed on different road conditions from the beginning of snow to the complete ablation of snow, the vehicle operation data not only include the snowy road at night, but also include the dry road during the day, dry road at night, and the water road during the day. The average speed is shown in Table 2.
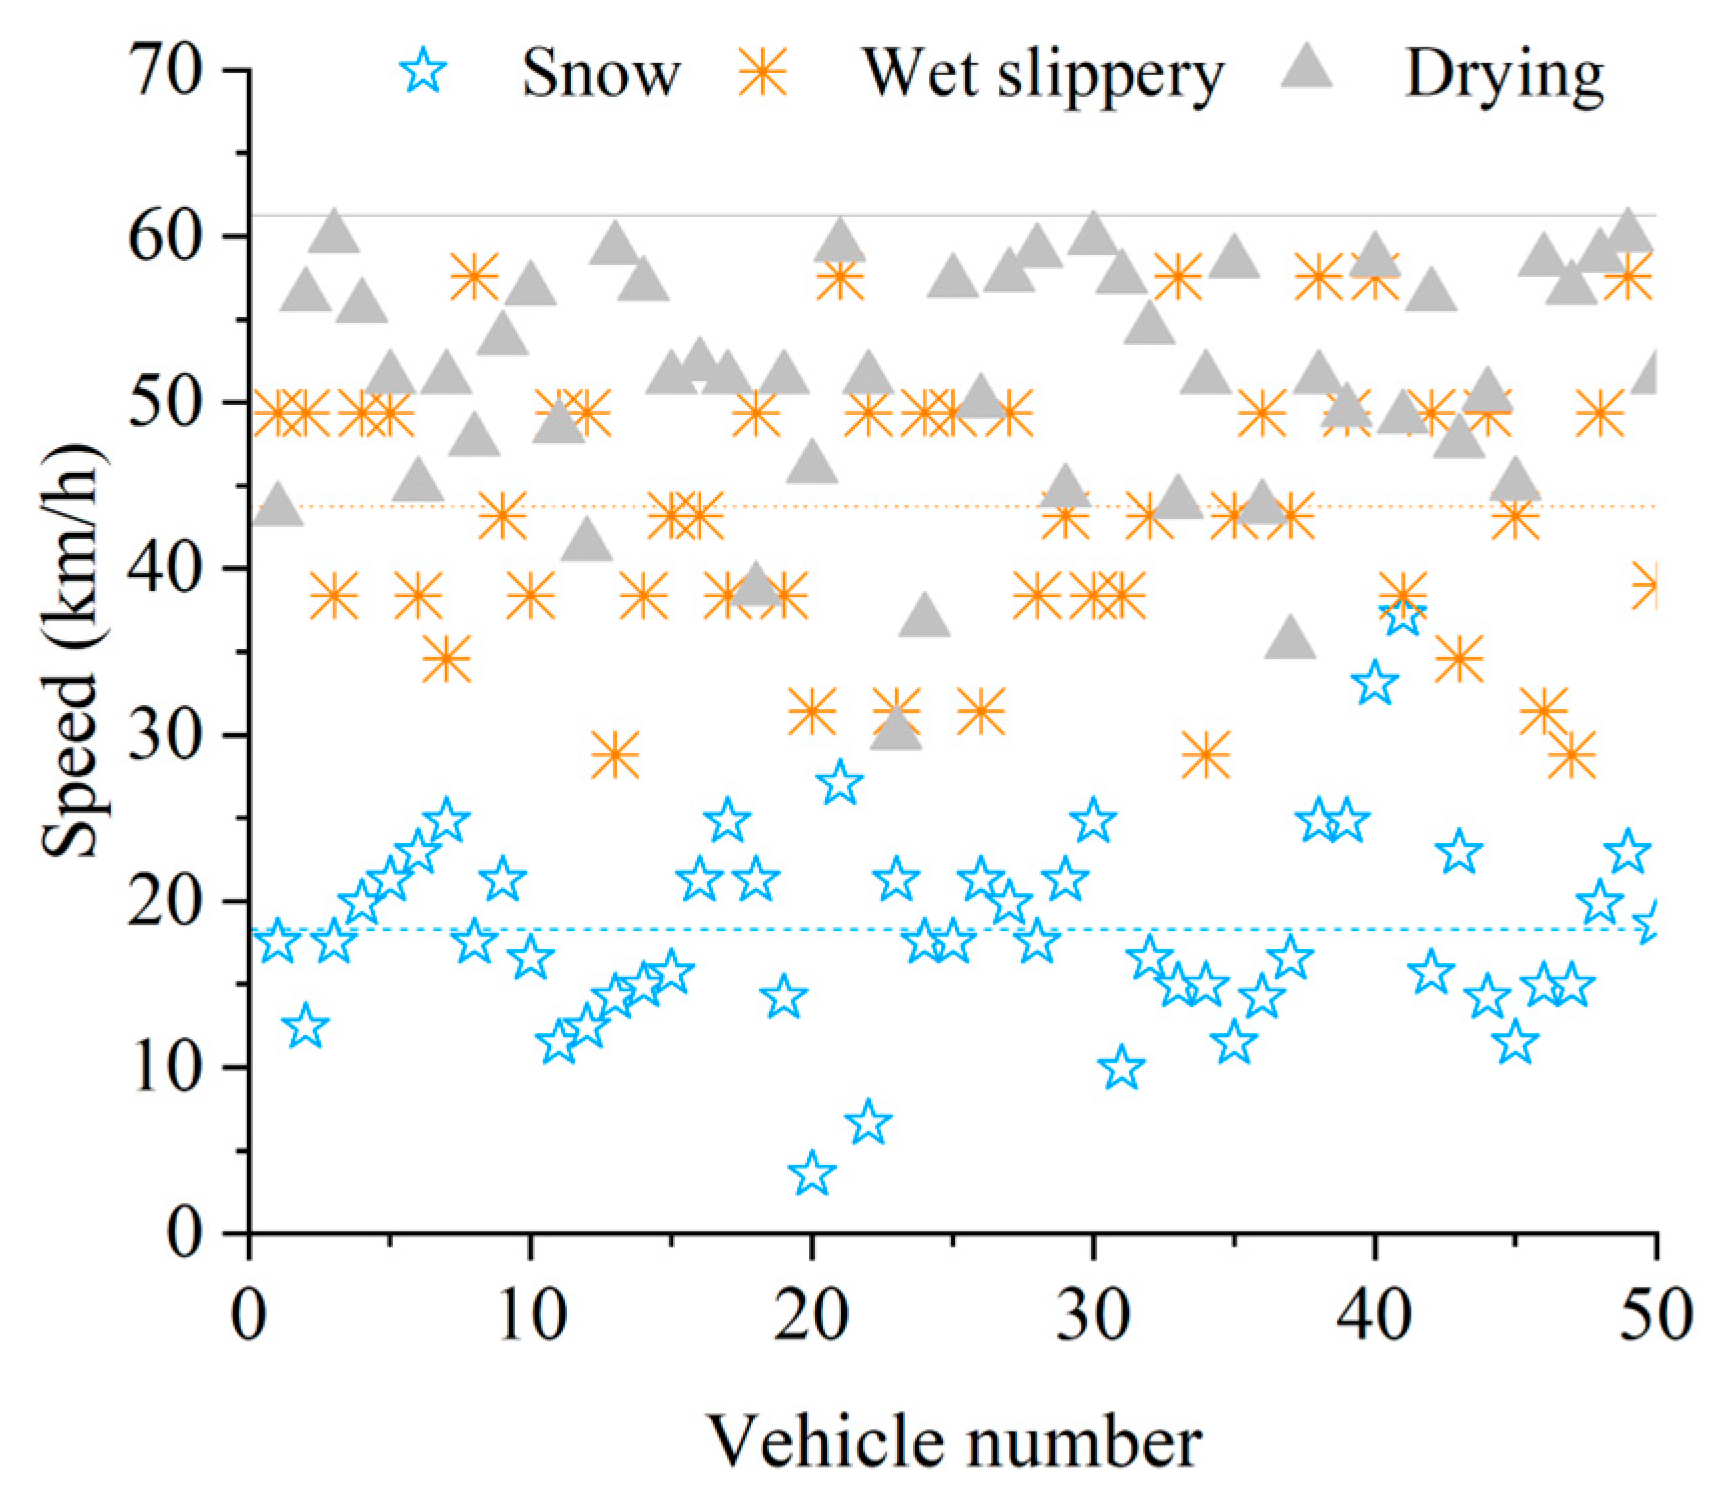
The vehicle speeds at night and day under normal weather conditions are statistically analyzed, and their speed reductions are calculated. The average speeds during the day and night on different cross-sections are compared, as shown in Table 2 and Table 3. Compared to the speed during the day, the average speed of Changchun Road and Cuizhu Street at night is reduced by 4% and 10%, respectively. The difference in the reduction ratio of the two roads is mainly due to the large number of intersections on Cuizhu Street, and there are entrances and exits of residential quarters on this road section. According to the speed reduction at night, the vehicle data on the snowy road are corrected to obtain the vehicle speed on the snowy road during the day. The vehicle speed distribution under the three road conditions is shown in Figure 2 and Figure 3.
On the whole, vehicle speeds will be reduced to varying degrees under different road conditions. The statistical analysis results of the vehicle operation data show the following:
(1)
In the free flow state, under the same road conditions, the average speed of vehicles at night is lower than that in the day. For example, on the water road, the average speeds of Changchun Road during the day and night are reduced by 16% and 19%, respectively, and the average speeds of Cuizhu Street during the day and night are reduced by 15% and 23%, respectively;
(2)
Comparing speeds of different road conditions during the day, the speeds of snowy roads are lower than that of water roads. Compared with the speeds of dry roads during the day, the average speeds of Changchun Road and Cuizhu Street are reduced by 60% and 64%, respectively, under snowy conditions. Under water road conditions, the average speeds of Changchun Road and Cuizhu Street are reduced by 16% and 15%, respectively. This is because drivers are unable to fully determine the snow thickness of the road, and the snowy conditions will affect drivers’ perception and psychology. Additionally, water roads have a higher friction coefficient than snowy roads, so, in order to ensure their safety, drivers will take lower speed;
(3)
Changchun Road and Cuizhu Street are both main roads, but the average speed of Changchun Road is higher than that of Cuizhu Street under the same road conditions, mainly because the cross-sectional structure and the surrounding environment of the two roads are different. Changchun Road is a two-way six-lane road, while Cuizhu Street is a two-way four-lane road, and there are residential areas and primary schools on Cuizhu Street. There are more pedestrians and non-motor vehicles on Cuizhu Street, and its speed will be affected.

2.3. Congestion Degree within Bus

After snow, the friction coefficient is reduced, the braking distance of the vehicle is increased, and the risk of turning and emergency braking is increased. In order to ensure driving safety, drivers will reduce vehicle speeds. This will lead to an increase in travel time. Under snowy conditions, the temperature is lower, and the comfort of residents riding electric vehicles or non-motor vehicles is reduced. Therefore, travelers are more willing to choose to travel by urban public transport. The passenger flows in the public transport system and the congestion degree within buses will increase.
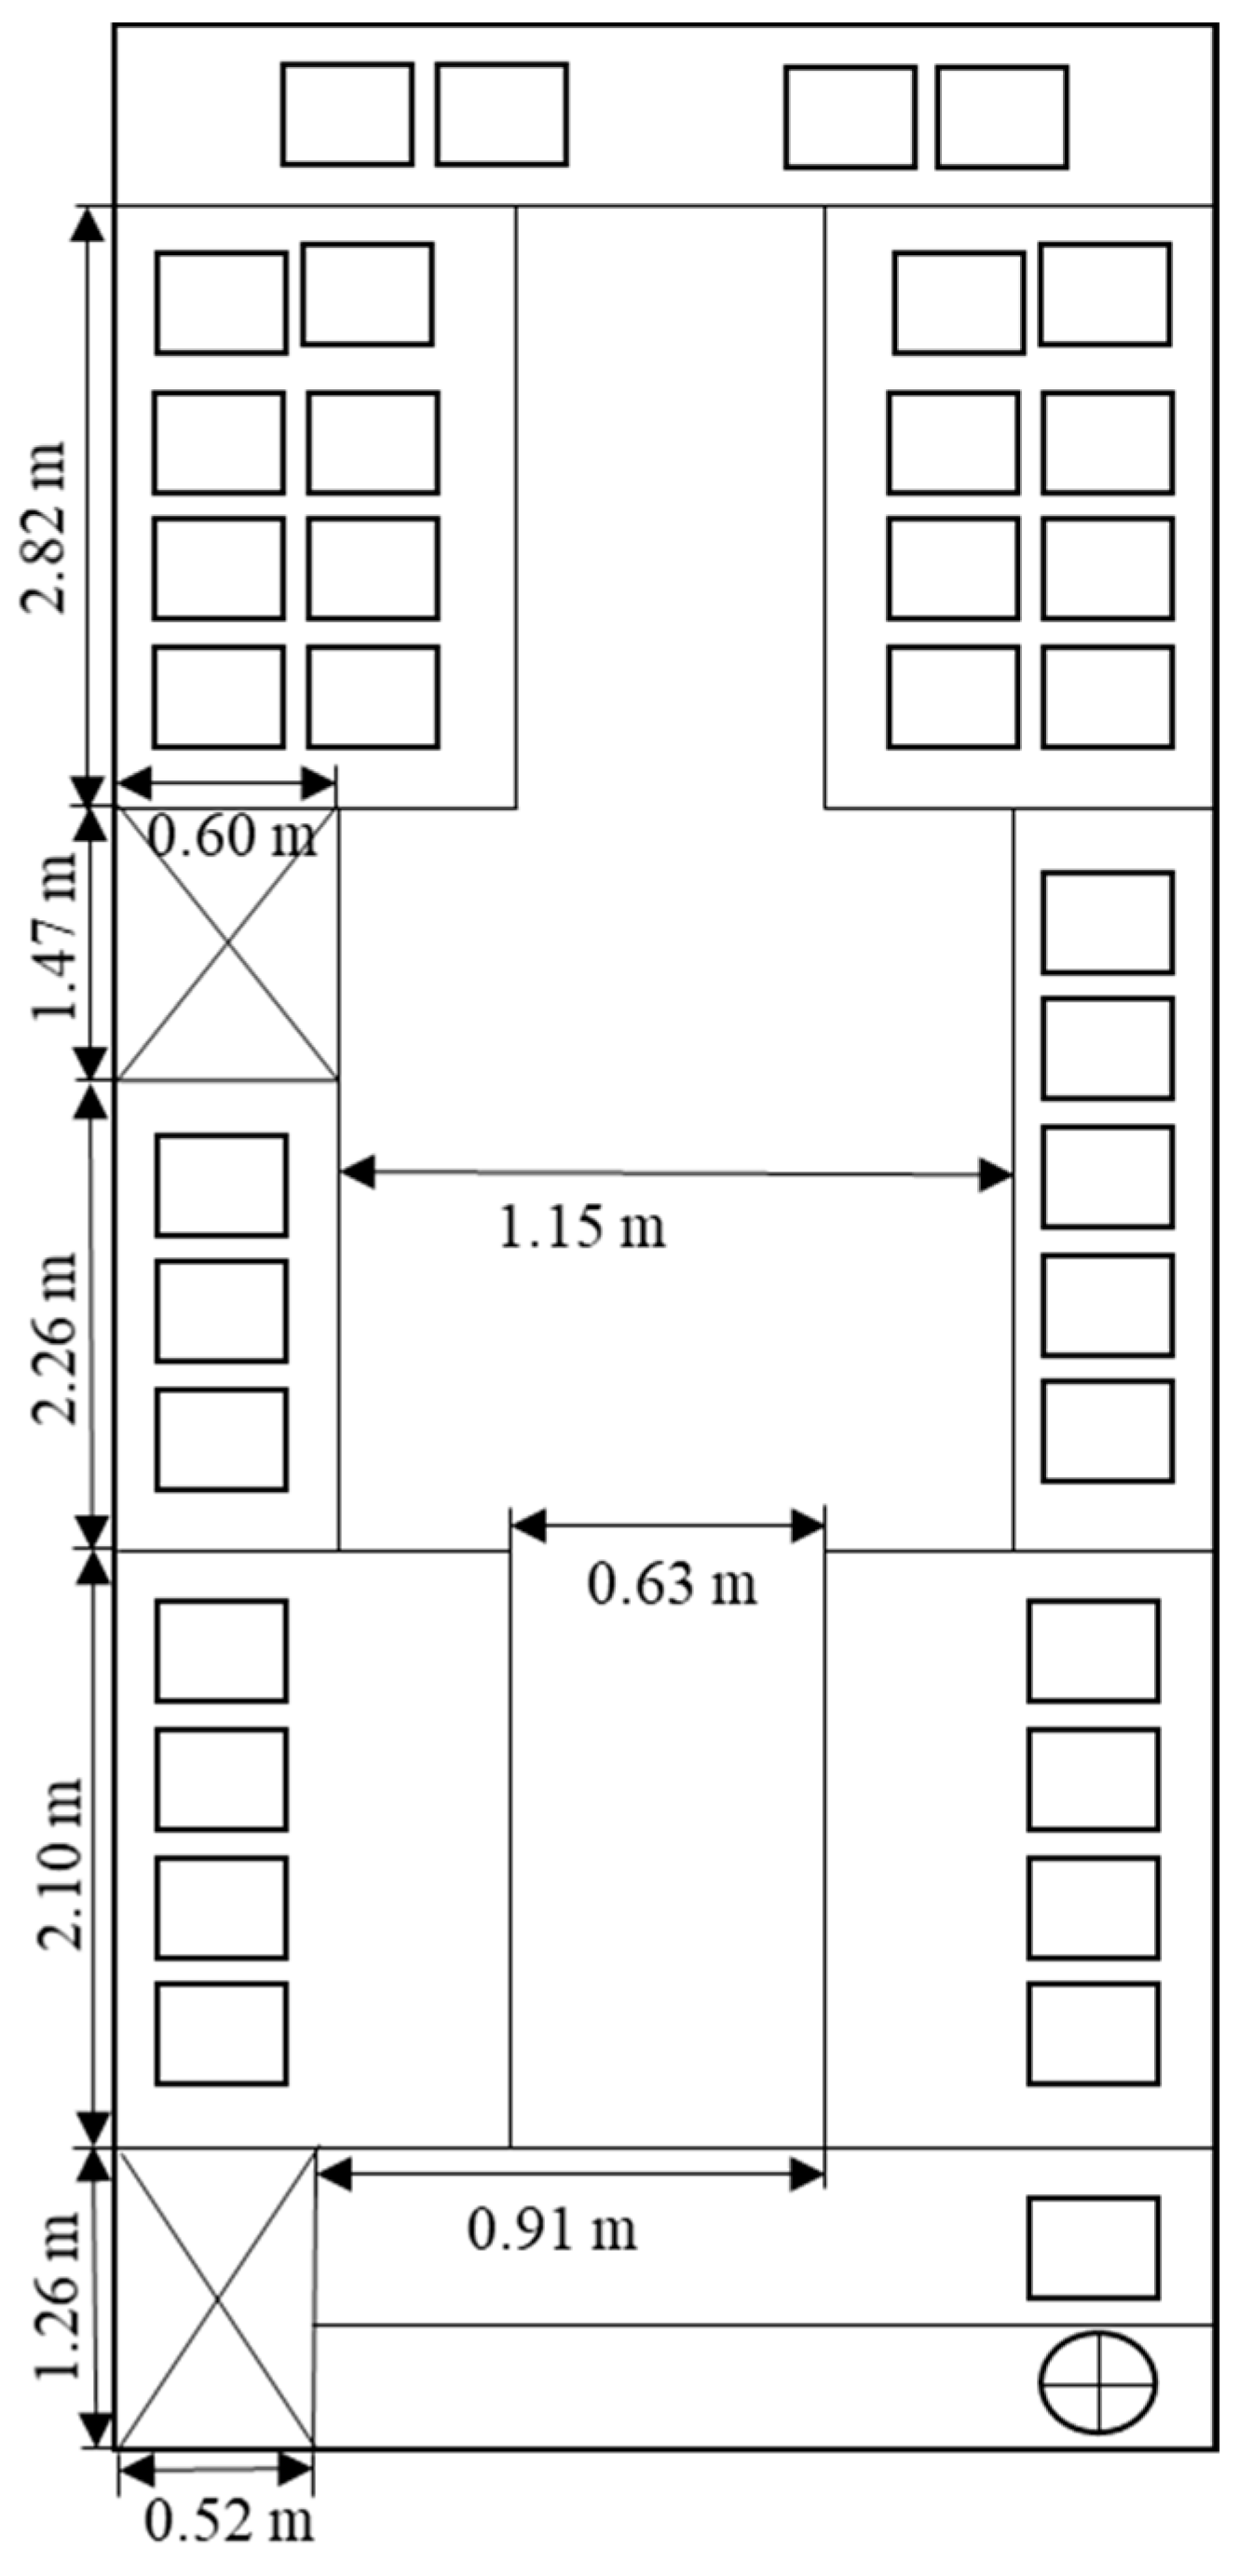
Under snowy conditions, travelers who still insist on traveling exhibit mostly rigid travel behaviors such as going to work, going to school, etc. In heavy snowy conditions, nearly one-third of the rigid travel options are canceled. As a result, passengers are more concerned with finishing the trip than with being comfortable in the car, and their tolerance for congestion degree within buses will increase. Therefore, regardless of passengers’ subjective crowding perception, the calculation of congestion degree only takes into account the objective congestion degree within buses. The formula for calculating the objective congestion degree is defined as the ratio of passengers to the rating passenger capacity in a bus, and rating passenger capacity is the sum of the number of seats and the number of rated stops in a bus [36]. For the common bus interior layout and the effective standing area shown in Figure 4, the number of passengers approved by urban public transport is calculated as not exceeding 0.125 m2 per person [37], and the rating passenger capacity is 80 people.
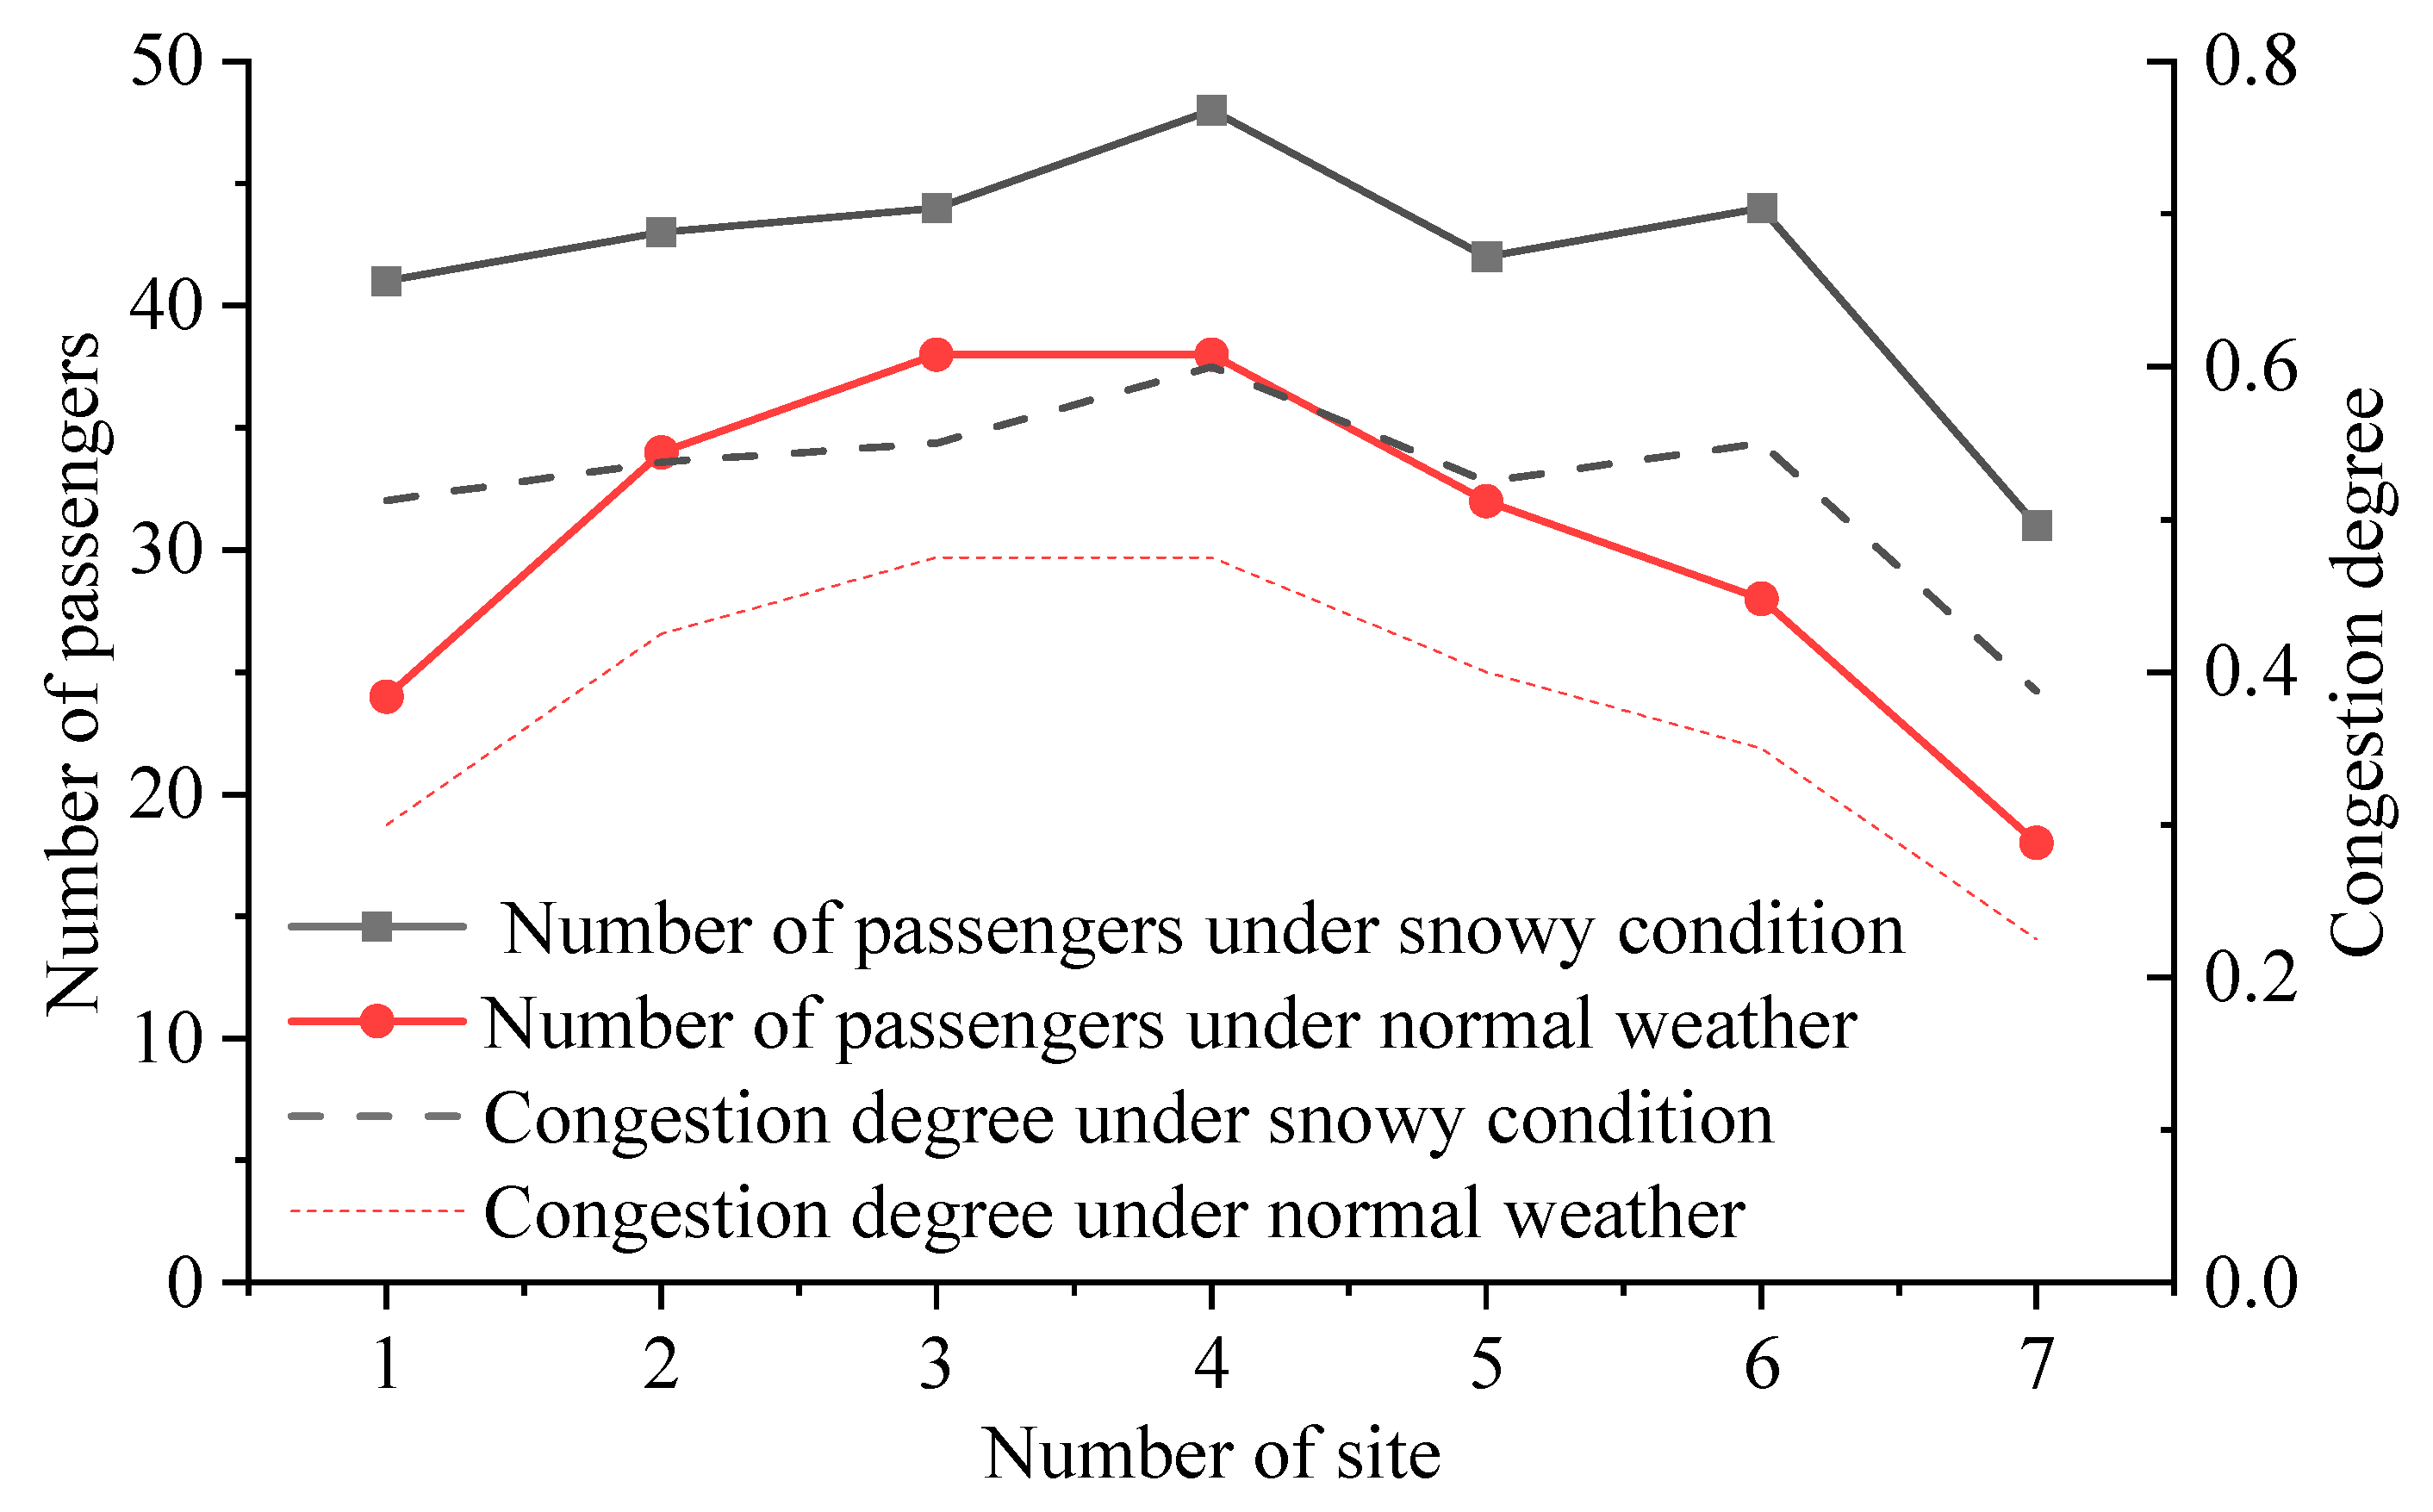
To analyze the impact of snowy conditions on passenger flows of urban public transportation, the number of passengers boarding and alighting at each stop and the number of passengers inside the bus were recorded on the second day after snow and on a normal day when riding on a certain BRT line in Zhengzhou. At the same time, to eliminate the influence of passenger travel cycles, the number of passengers inside the bus and the number of passengers boarding and alighting at bus stops on 16 January 2024 were selected as the passenger flow data for snowy days, and the passenger data on 22 January 2024 (both were Tuesdays and non-holidays) were selected as the passenger flow data for normal weather. The number of passengers boarding and alighting at some bus stops was statistically analyzed, and the number of passengers inside the bus and the congestion degree were calculated. The results are shown in Table 3 and Figure 5. The number of passengers at the stops in the figure refers to the number of passengers inside the bus during the period from that stop to the next stop. Compared with normal weather conditions, the number of bus passengers increased by 38%, and the average congestion degree inside the bus increased by 43% during snowy conditions.

3. Methodology

3.1. Spectral-Radius-Based Robustness Evaluation Model

An adjacency matrix is often used in complex network theory to describe the connection state between network nodes. Based on the Space-L method, the adjacency matrix B = b i j | i N , j N is constructed, and the element of 1 in the adjacency matrix indicates that the nodes in the network are adjacent and reachable, while 0 indicates that they are not directly reachable.
b i j = 1 , T h e   s i t e s   i   a n d   j   a r e   c o n n e c t e d ,   a n d   t h e r e   a r e   n o   o t h e r   s i t e s 0 , O t h e r
When selecting the robustness indicator, it is necessary to consider the integrity and effectiveness of the network structure and function, and the calculation of the indicators should be compatible with the characteristics of the snowy weather “attacking” the network units. When attacked, the connectivity of the bus network plays an important role in the performance and recovery of the bus network [38], and the spectral radius of the adjacency matrix represents the connectivity of the units in the network. Therefore, combining the characteristics of the adjacency matrix, the spectral radius in the generalized norm is selected as the robustness indicator. In the bus network, the spectral radius of the adjacency matrix which is calculated in Equation (2) represents the connectivity of the entire network in terms of topological structure. The larger the value of the spectral radius, the better the connectivity performance of the nodes in the network.
ρ = max { | λ i | , i = 1 , 2 , n }
where λ i is the eigenvalue of the adjacency matrix B.
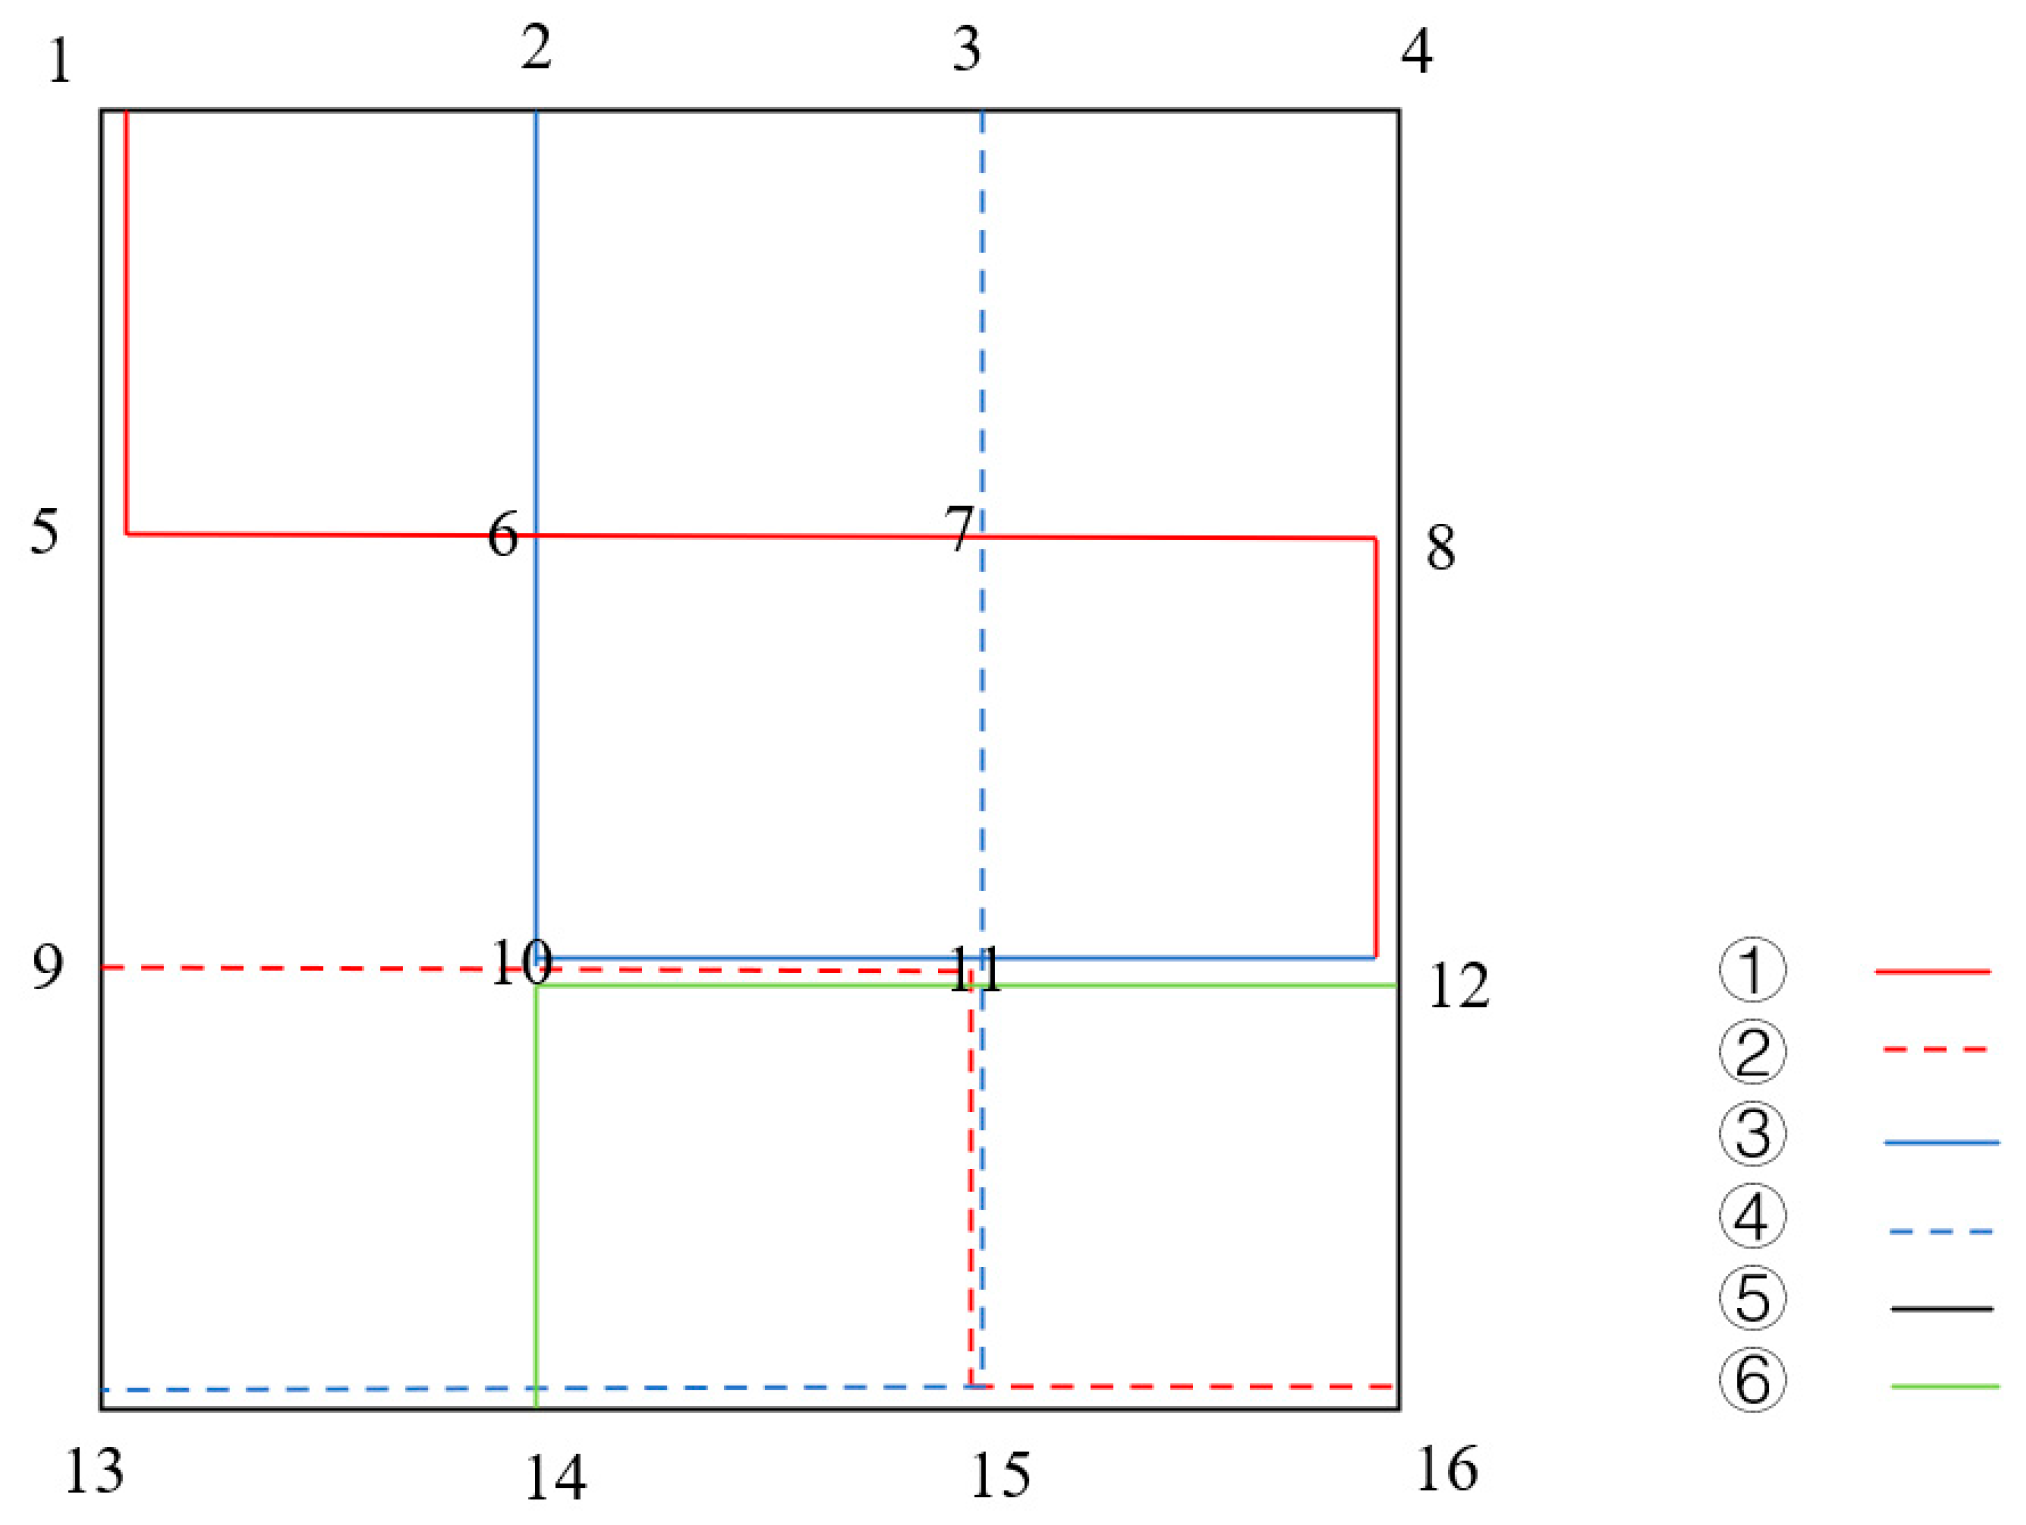
In order to verify the correctness of the spectral radius indicator in the bus network, take the network in Figure 6 as an example. Nodes in the network are continuously deleted in a certain proportion to simulate the state of the network under intentional and random attacks. Intentional attacks involve deleting nodes in descending order of node degree, while random attacks randomly select and delete nodes in the network. The spectral radius of the adjacency matrix of the network under the two attack modes is calculated and compared with the existing indicators of maximum connectivity and network connectivity to verify the correctness of the above analysis. Since different indicators have different values, the calculated data are normalized using the extreme value method. The calculation results are shown in Figure 7. The results indicate that, under both attack modes, as the number of deleted nodes increases, the spectral radius and existing indicators all show a decreasing trend. Therefore, the correctness of the spectral radius indicator is verified.

3.2. Robustness Evaluation Model under Snowy Conditions

To calculate the value of the network robustness indicator, it is necessary to first determine the adjacency matrix. Under normal weather, the units in the network operate normally, and the elements in the adjacency matrix are all 0 or 1. However, under snowy conditions, both buses’ travel speed and congestion degree will be affected. Therefore, the speed reduction coefficient and the change coefficient of congestion inside the bus are adopted to comprehensively consider temporal and spatial variations so as to determine the weight of the elements in the adjacency matrix. Subsequently, a new spectral radius value is calculated to evaluate robustness.
Due to the different speeds of buses on different road grades, the speed is normalized [39], and its formula is as follows:
V = v * v
where V is the standard speed, taking the value of 0~1; v is the speed limit value of vehicles on the road, km/h; v* is the average speed of vehicles traveling under different weather conditions, km/h.
The average speed reduction coefficient for unit m in the network is calculated as follows:
β m = V m V m V m
where β m is the speed reduction coefficient for unit m in the network; V m is the standard speed for unit m under normal weather conditions; V m is the standard speed for unit m under snowy conditions.
The average congestion degree within buses for unit m for a given period is as follows:
η m = 1 L K l = 1 L k = 1 K η l , k , m
where η m is the average congestion degree within buses for unit m during a certain period; k is the number of departures; K is the total number of departures during a certain period; η l , k , m is the congestion degree within buses for unit m for the kth bus of line l; L is the set of the total number of lines in the network.
The change coefficient of congestion inside the bus for unit m is as follows:
δ m = η m η m η f
where δ m is the change coefficient of congestion for unit m of the network; η m is the average congestion degree for unit m under snowy conditions; and η f is the congestion degree threshold, which is the congestion degree of unit m in the spatial failure state.
In the bus network, if the congestion inside the bus of a unit exceeds a threshold value, this unit is considered to be spatially failed; if the speed of buses on a unit is reduced to a certain threshold value, this unit will be considered to be temporally failed, and the unit time failure or spatial failure will lead to passengers not completing their trip. Therefore, the change coefficient of congestion is the spatial failure degree of the bus network, and the speed reduction coefficient is the time failure degree of the bus network. The product of the speed reduction coefficient and the change coefficient of congestion is used as the comprehensive failure indicator value of the time and space of the unit. At this time, the weighted adjacency matrix of the weights of the unit is as follows:
b m = 1 β m   δ m  
where b m are the weights of the unit m in the weighted adjacency matrix under snowy conditions.
Adopting Equation (2) to calculate the spectral radius of the bus network under normal weather conditions and the spectral radius of the weighted adjacency matrix under snowy conditions, respectively, we normalize the calculation results. The mathematical expression of the network robustness metrics under snowy conditions is as follows:
r = ρ ρ f ρ ρ f
where r is the value of the network robustness; ρ is the network’s spectral radius under normal weather conditions; ρ is the network’s spectral radius under snowy conditions; ρ f is the spectral radius when the network fails.

4. Case Study

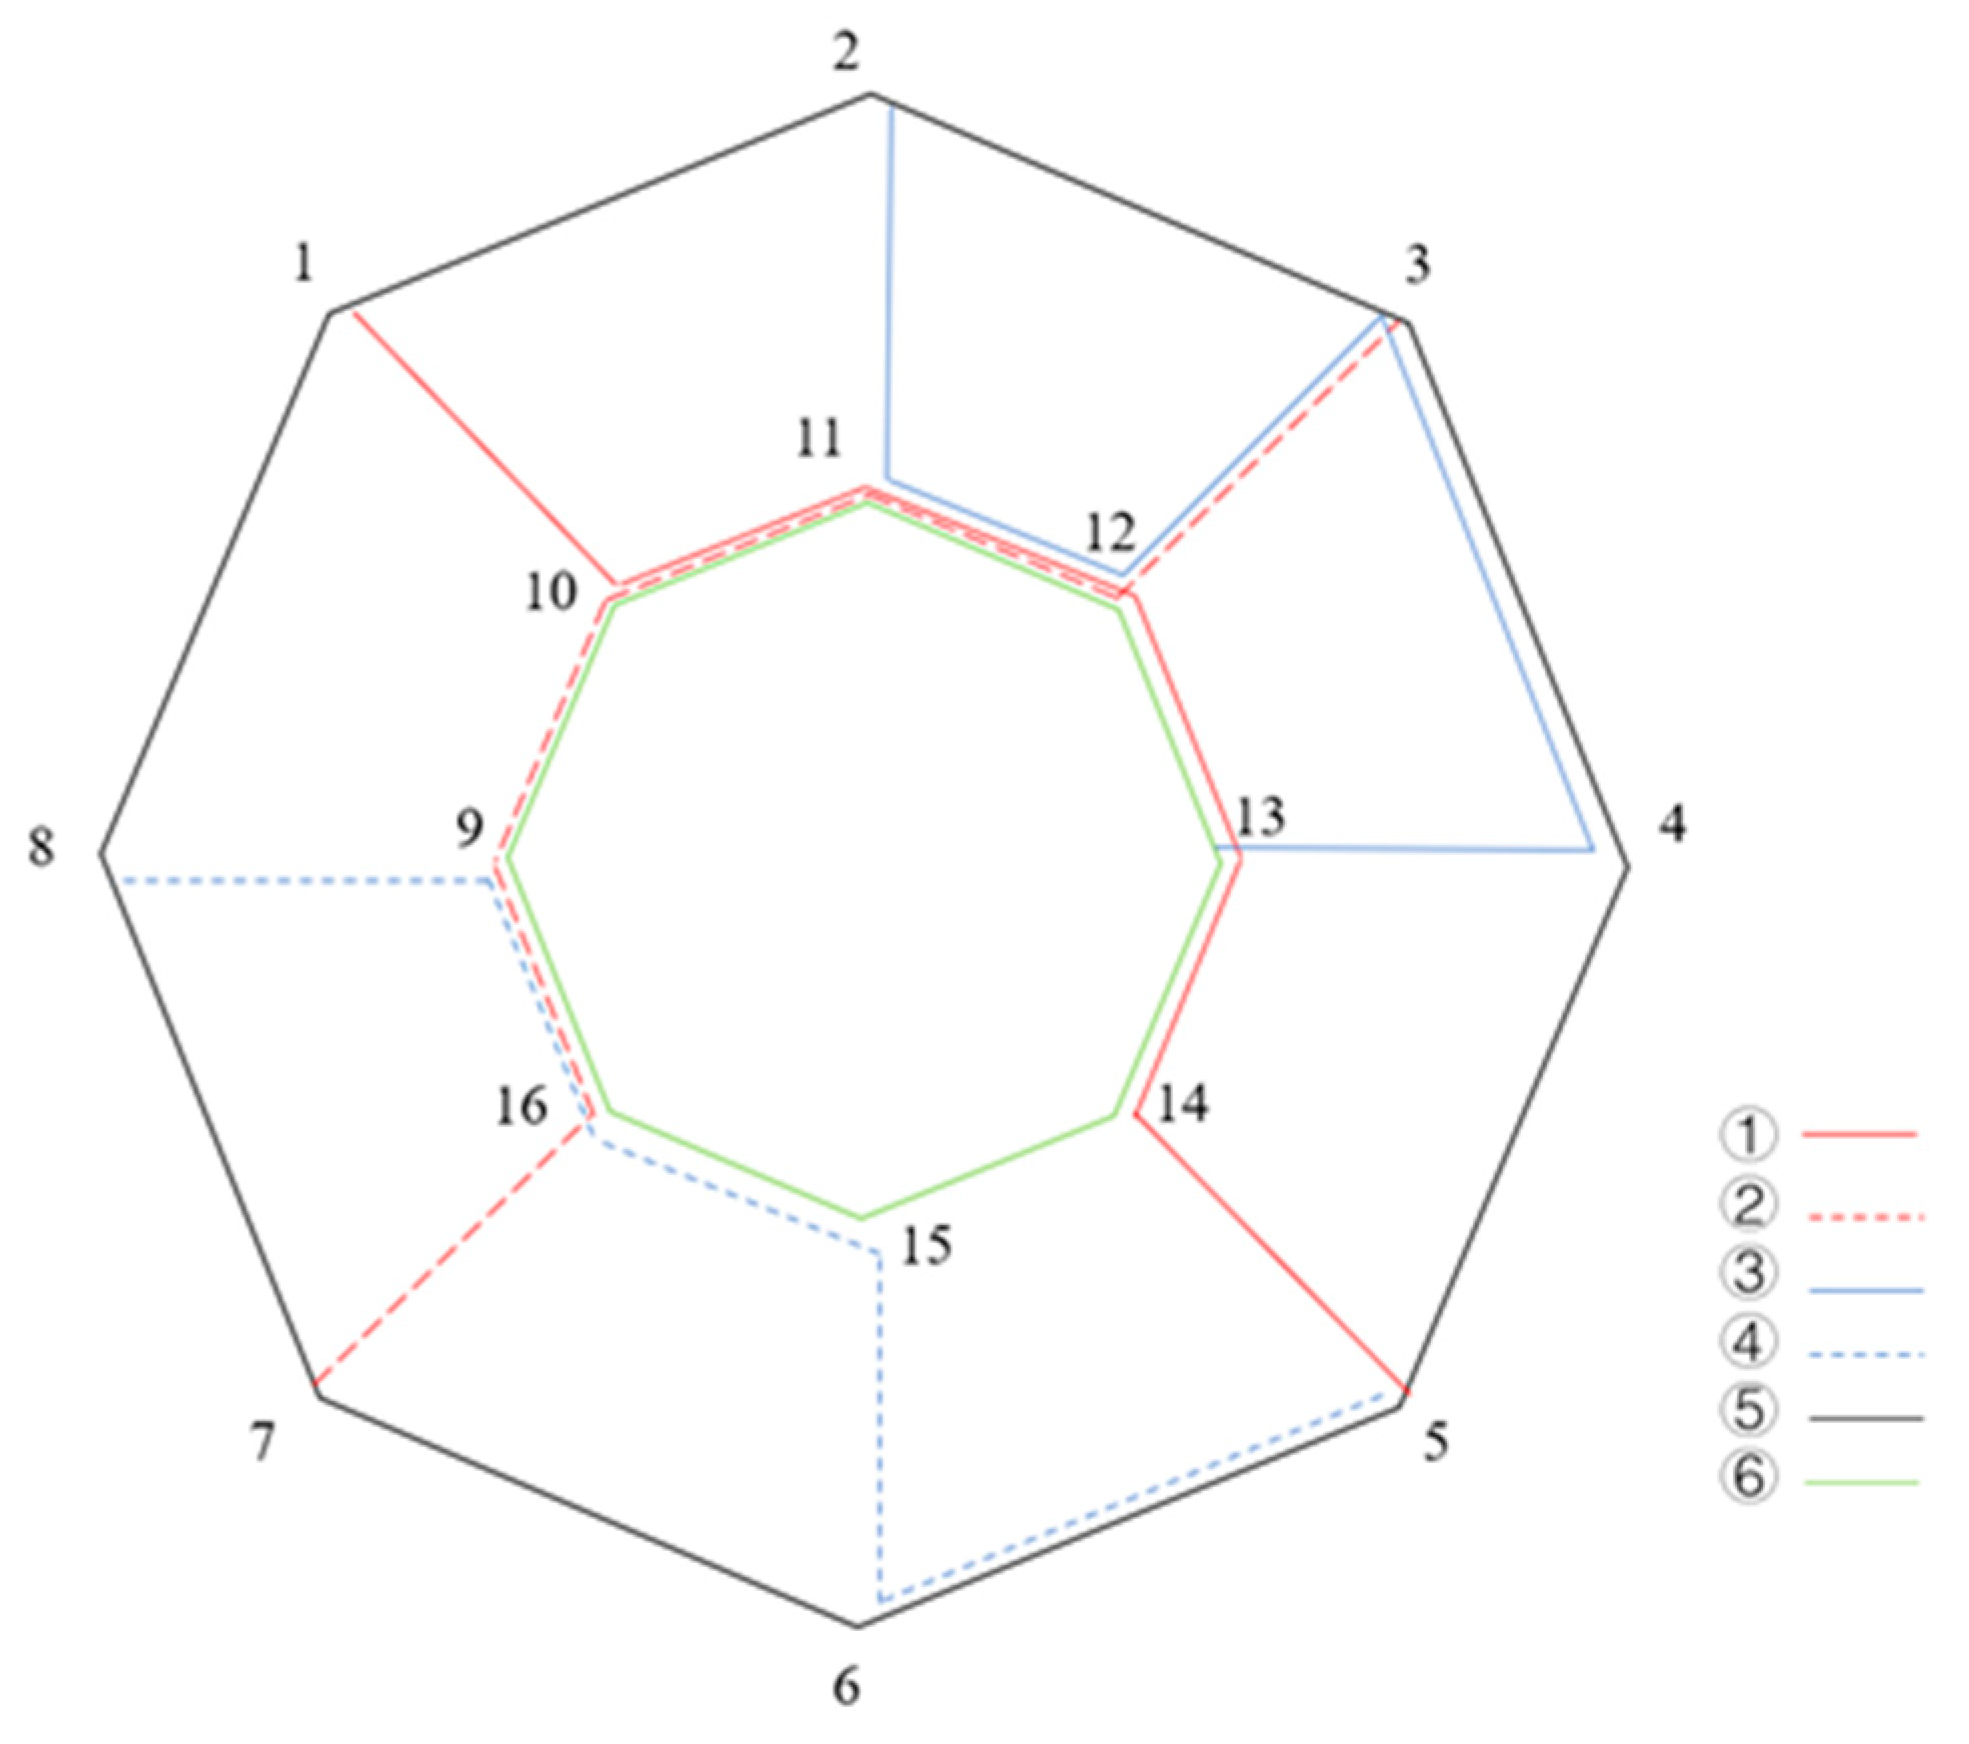
The arrangement of urban public transport lines depends on the road network of the city. Networks with different topologies have different characteristics [40]. There are two classic types of road network topology in the city, which are chessboard and ring radiation. The benefits of checkerboard include its neat design, good directionality, ease of traffic organization, and lack of complicated intersections. However, there are drawbacks as well, such as a long bypass distance, a high non-linear coefficient, poor accessibility, etc. The centrality of the ring-radial network is more obvious; therefore, the traffic pressure at the center position is large, which can easily cause congestion. In this paper, the lines of the bus network are designed based on the checkerboard and ring-radial networks, and its performance is analyzed. The network and its line design are shown in Figure 6 and Figure 8.
The calculation in this section is based on a virtual network structure, which aims to analyze the performance differences caused by different simple checkerboard and ring-radial network structures through the calculation of this example. Therefore, there are no specific data on the actual urban population and the total number of units.

4.1. Parameter Setting

(1)
Network parameters
There are 6 bus lines in the network, containing a total of 16 stops and 24 units, and the length of all units in the checkerboard network is 0.5 km. The outer ring of the ring-radial network has a diameter of 1.5 km, and the inner ring has a diameter of 0.5 km. The scenario is defined as a snowstorm scenario, and the distribution of passenger flows between OD pairs is shown in Table 4. The experiment is run on a server with an Intel(R) Core(TM) i7-8550U CPU @ 1.80 GHz, 8.00 GBRAM, and one GPU(NVIDIA GeForce MX150). The proposed model is implemented based on Python 3.9.7.
(2)
Speed
Based on the speeds under four different road conditions collected in Section 2.2, Equation (3) is used to calculate the standard speed under different road conditions and different cross-section types, and the results are shown in Table 5.
The outermost ring roads of the chessboard network and the ring-radial network are set as two-way six-lane roads, that is, the speeds of these units are the standard speed on the Changchun Road in the snowstorm scenario; other units in the network are two-way four-lane roads, and speeds on them are the standard speed of Cuizhu Street.
(3)
Congestion degree thresholds
Different countries and regions have different levels of acceptable service quality for passengers, and, in TCQSM2019, the service quality under different congestion degrees is described from the perspective of transit riders and from the perspective of enterprises [41]. When the vehicle is more than 150% full or the area of passenger standing space is less than 0.20 m2/person, the passengers need to wait for the next bus or the bus should choose not to stop at certain stops. In winter snowy conditions, the temperature is low, passengers have heavy clothes on their bodies, and the bus needs enough space to open and close the door. Therefore, 0.2 m2/person is taken as the critical value of the public transport system’s functionality failure when the public transport system’s congestion degree of failure state is 0.76.

4.2. Network Robustness

The speed of buses in the checkerboard and ring-radial networks is discounted, and the OD passenger flows in Table 5 are assigned to calculate the congestion degree of all units. Based on the congestion degree and the speed reduction coefficient, the weighted neighbor matrix is calculated, and then the value of the network robustness indicator is obtained. The specific calculation steps are as follows:
Step 1: Establish the topological network of the urban transit system, determine the OD pairs and their corresponding passenger flows, and set the station spacing and speed in the network.
Step 2: Construct the adjacency matrix of the initial network, and, according to Equation (2), calculate the spectral radius of the network.
Step 3: Simulate a snowstorm scenario, and, based on Equations (3) and (4), calculate the speed reduction coefficient and find the shortest path with the Dijkstra method based on the speed and unit’s length.
Step 4: Use a shortcut method for passenger flow allocation based on the shortest path.
Step 5: After the passenger flows are assigned, according to Equations (5) and (6), calculate the change coefficient of congestion of units and the spectral radius according to Equation (7). Update the adjacency matrix and calculate the spectral radius.
Step 6: According to Equation (8), obtain the network robustness indicator for the snowstorm scenario.
The robustness model based on the generalized norm considers the connection between different nodes in the network, and combines the influence of time and space on the network performance to analyze the robustness of the bus network at any speed and with any congestion. The specific calculation parameters are shown in Table 6.
Comparing the calculation results of the checkerboard network and the ring-radial network, the standard speed, speed reduction coefficient, congestion degree, and robustness indicators of the two networks are shown in Table 7. The results show that the robustness of the checkerboard network with the same number of nodes is slightly higher than that of the ring-radial network.

4.3. Importance Ranking of Units in Network

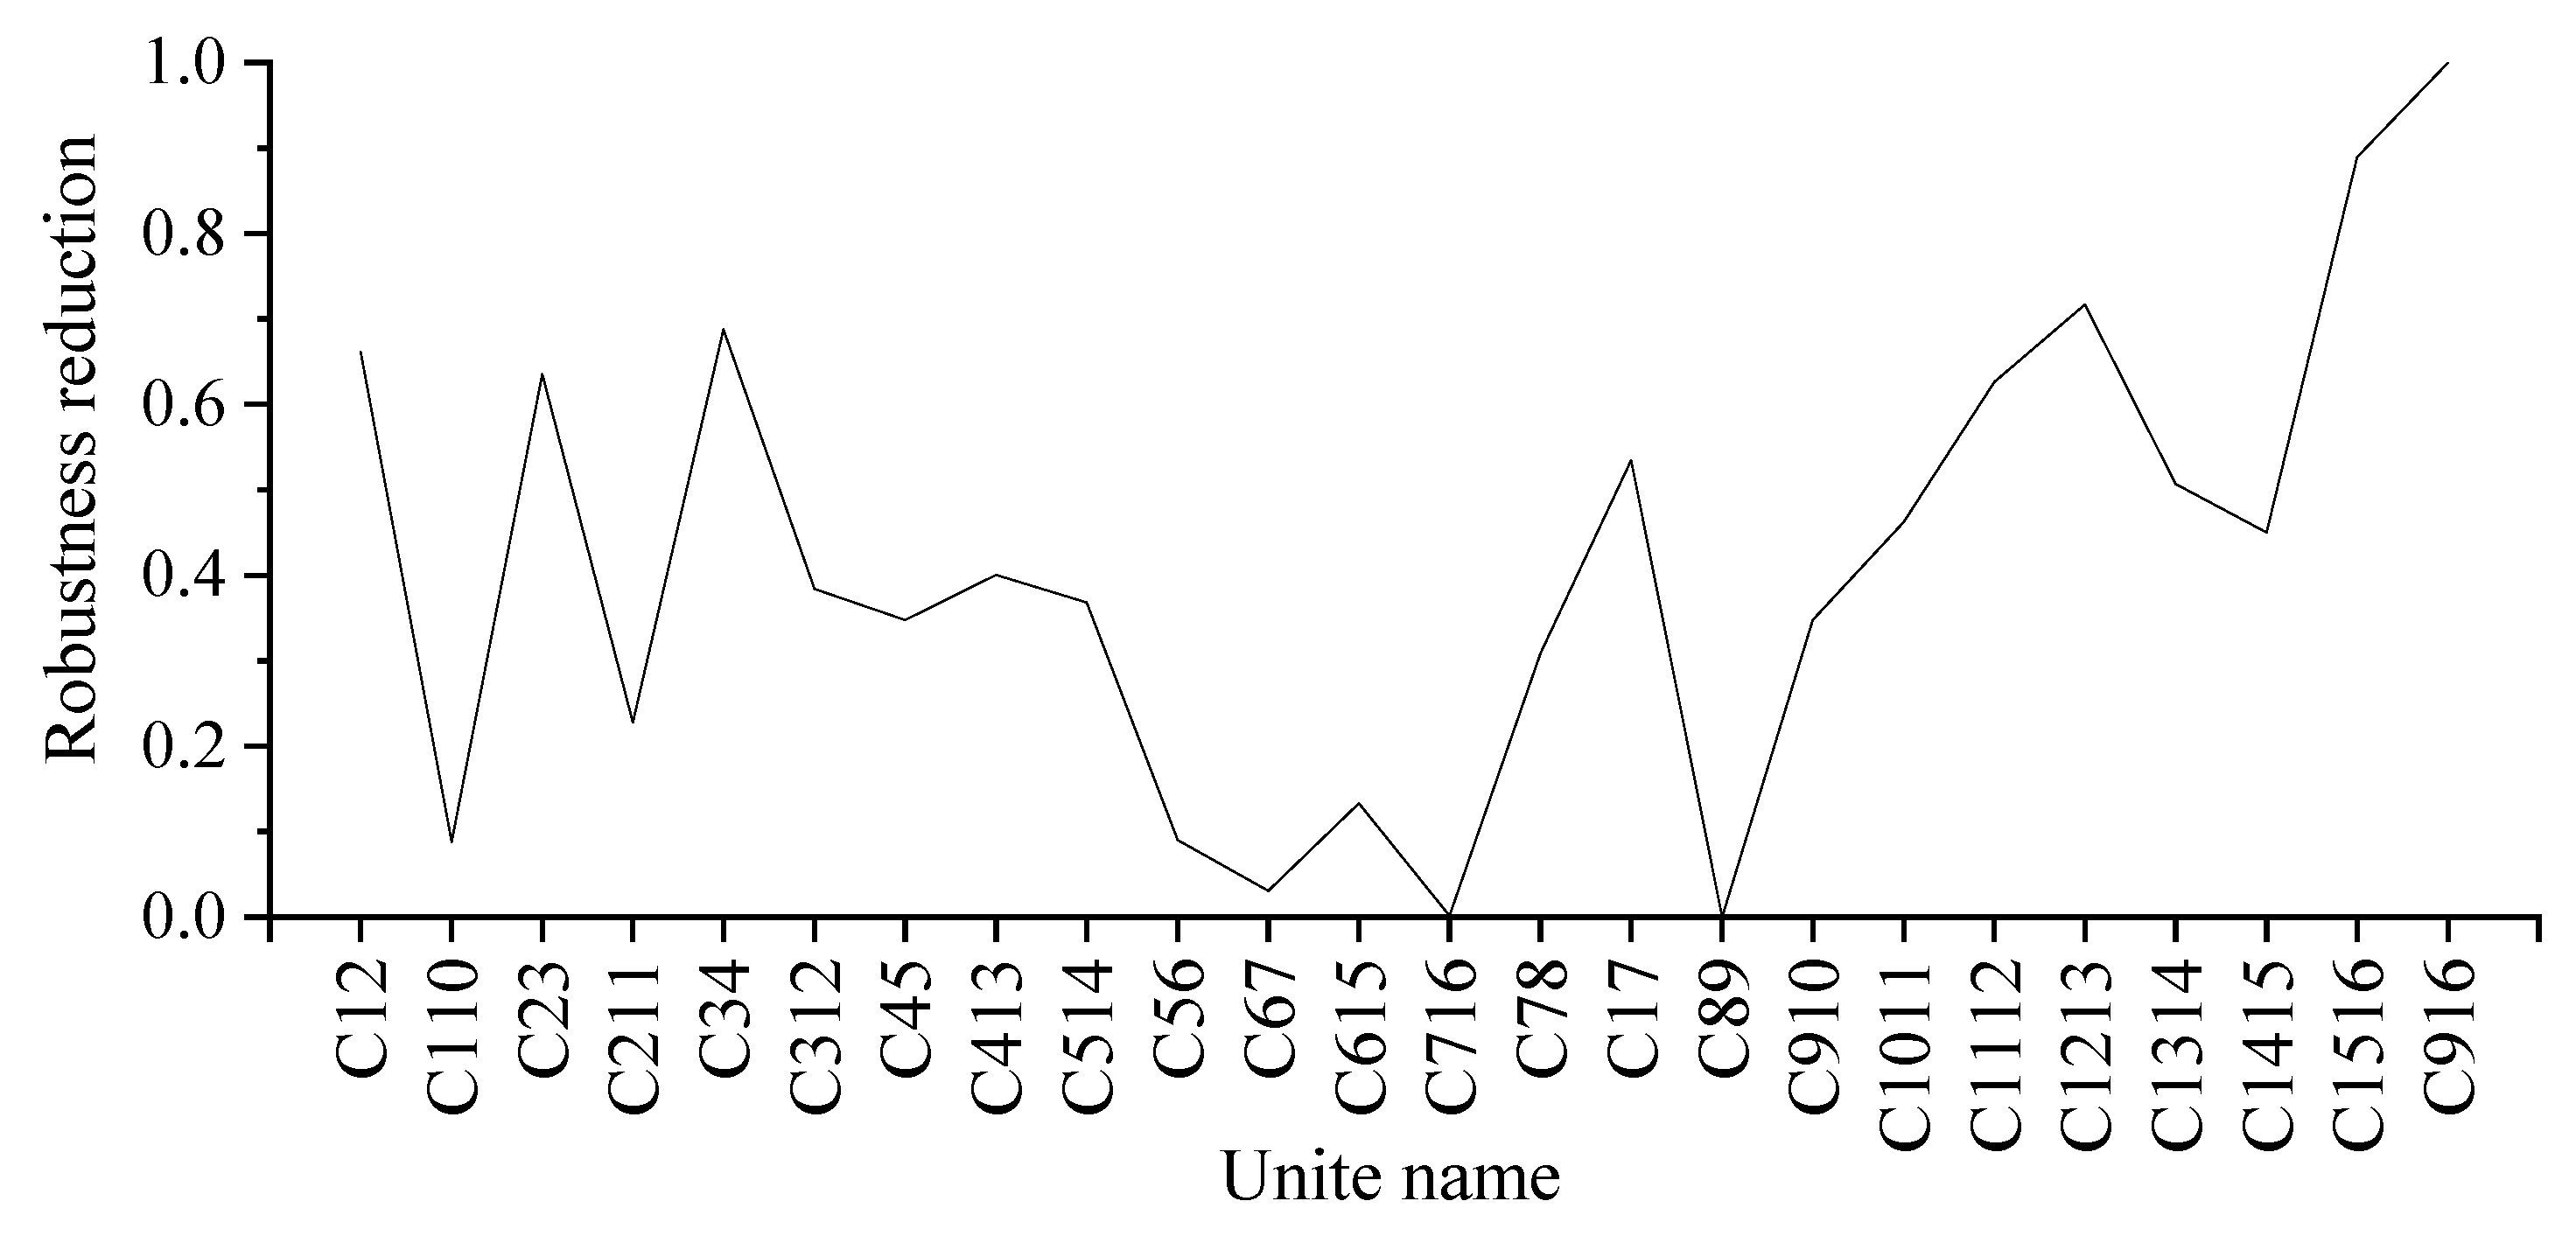
Under snowy conditions, whether the bus line can operate normally is related to the state of the roads’ condition. If the location of the unit is different, the impact of its perturbation on the performance of the network is also different. Therefore, it is necessary to analyze the importance of the different units for the network under the same snowy conditions. If the bus is unable to drive normally on a section of the road, it is considered that the bus speed of the unit is 0, and its function is completely invalid. The unit is directly deleted from the network structure during the calculation, and the network robustness is recalculated. According to the calculation results of this value, the importance of the units in the network is sorted. The units in the network are deleted sequentially (only one unit is deleted at a time), and passenger flows are redistributed. The network robustness is calculated when the unit fails, and the robustness difference before and after unit failure is standardized. Figure 9 and Figure 10 show the network robustness indicator reduction value caused by different unit failures in the checkerboard network and the ring-radial network, respectively. The results are visualized in Figure 11 and Figure 12.
By comparing the calculation results of the failure of a single unit in different network structures, it can be seen that, under the snowstorm scenario, the failure of different units in the network has different effects on the network robustness.
(1)
On the whole, the most peripheral units in the network have little effect on the network robustness, whether it is a checkerboard or a ring-radiating network topology, that is, the importance of the unit is low. This is because, in the network design, the road grade of the most peripheral unit is higher, and the standard speed is larger under snowy conditions. Although the passenger flows on the ring line are large, only one unit is deleted at a time, and there are many lines connected to the ring line. When the unit fails, there are other alternative paths, and the failure of a unit in the internal structure of the network may cause the two stations to detour far away to complete the trip;
(2)
In the ranking of the unit importance of the chessboard network, the importance of the unit at the center of the inner ring is relatively high. For example, the reduction values of the robustness of C610, C1011, and C710 are all higher than 0.6, and the unit C910 has the highest importance in the network. The main reason is that the importance of the unit is not only related to the location of the unit in the network, but also related to the passenger flows allocated on the unit, that is, the congestion degree within the bus on the unit. Under the snowstorm scenario, the bus line on the C910 unit still runs, and the congestion degree within the bus on the unit is large. If the C910 unit is deleted, the passenger flows on the unit need to be redistributed to other units in the network, which has a greater impact on the operation of other units, that is, the importance of the unit C910 is higher;
(3)
In the unit importance ranking of the ring-radial network, the importance of the unit at the center of the inner ring is also relatively high. Different from the unit importance ranking in the checkerboard network, the unit with the highest importance, C916, is located on the inner ring, followed by C1516. The direct reason is that the passenger flows from node 9 to node 16 and node 9 to node 15 in the network are large, and the shortest paths of the two pairs of OD pairs pass through unit C916.

4.4. Importance Ranking of Lines

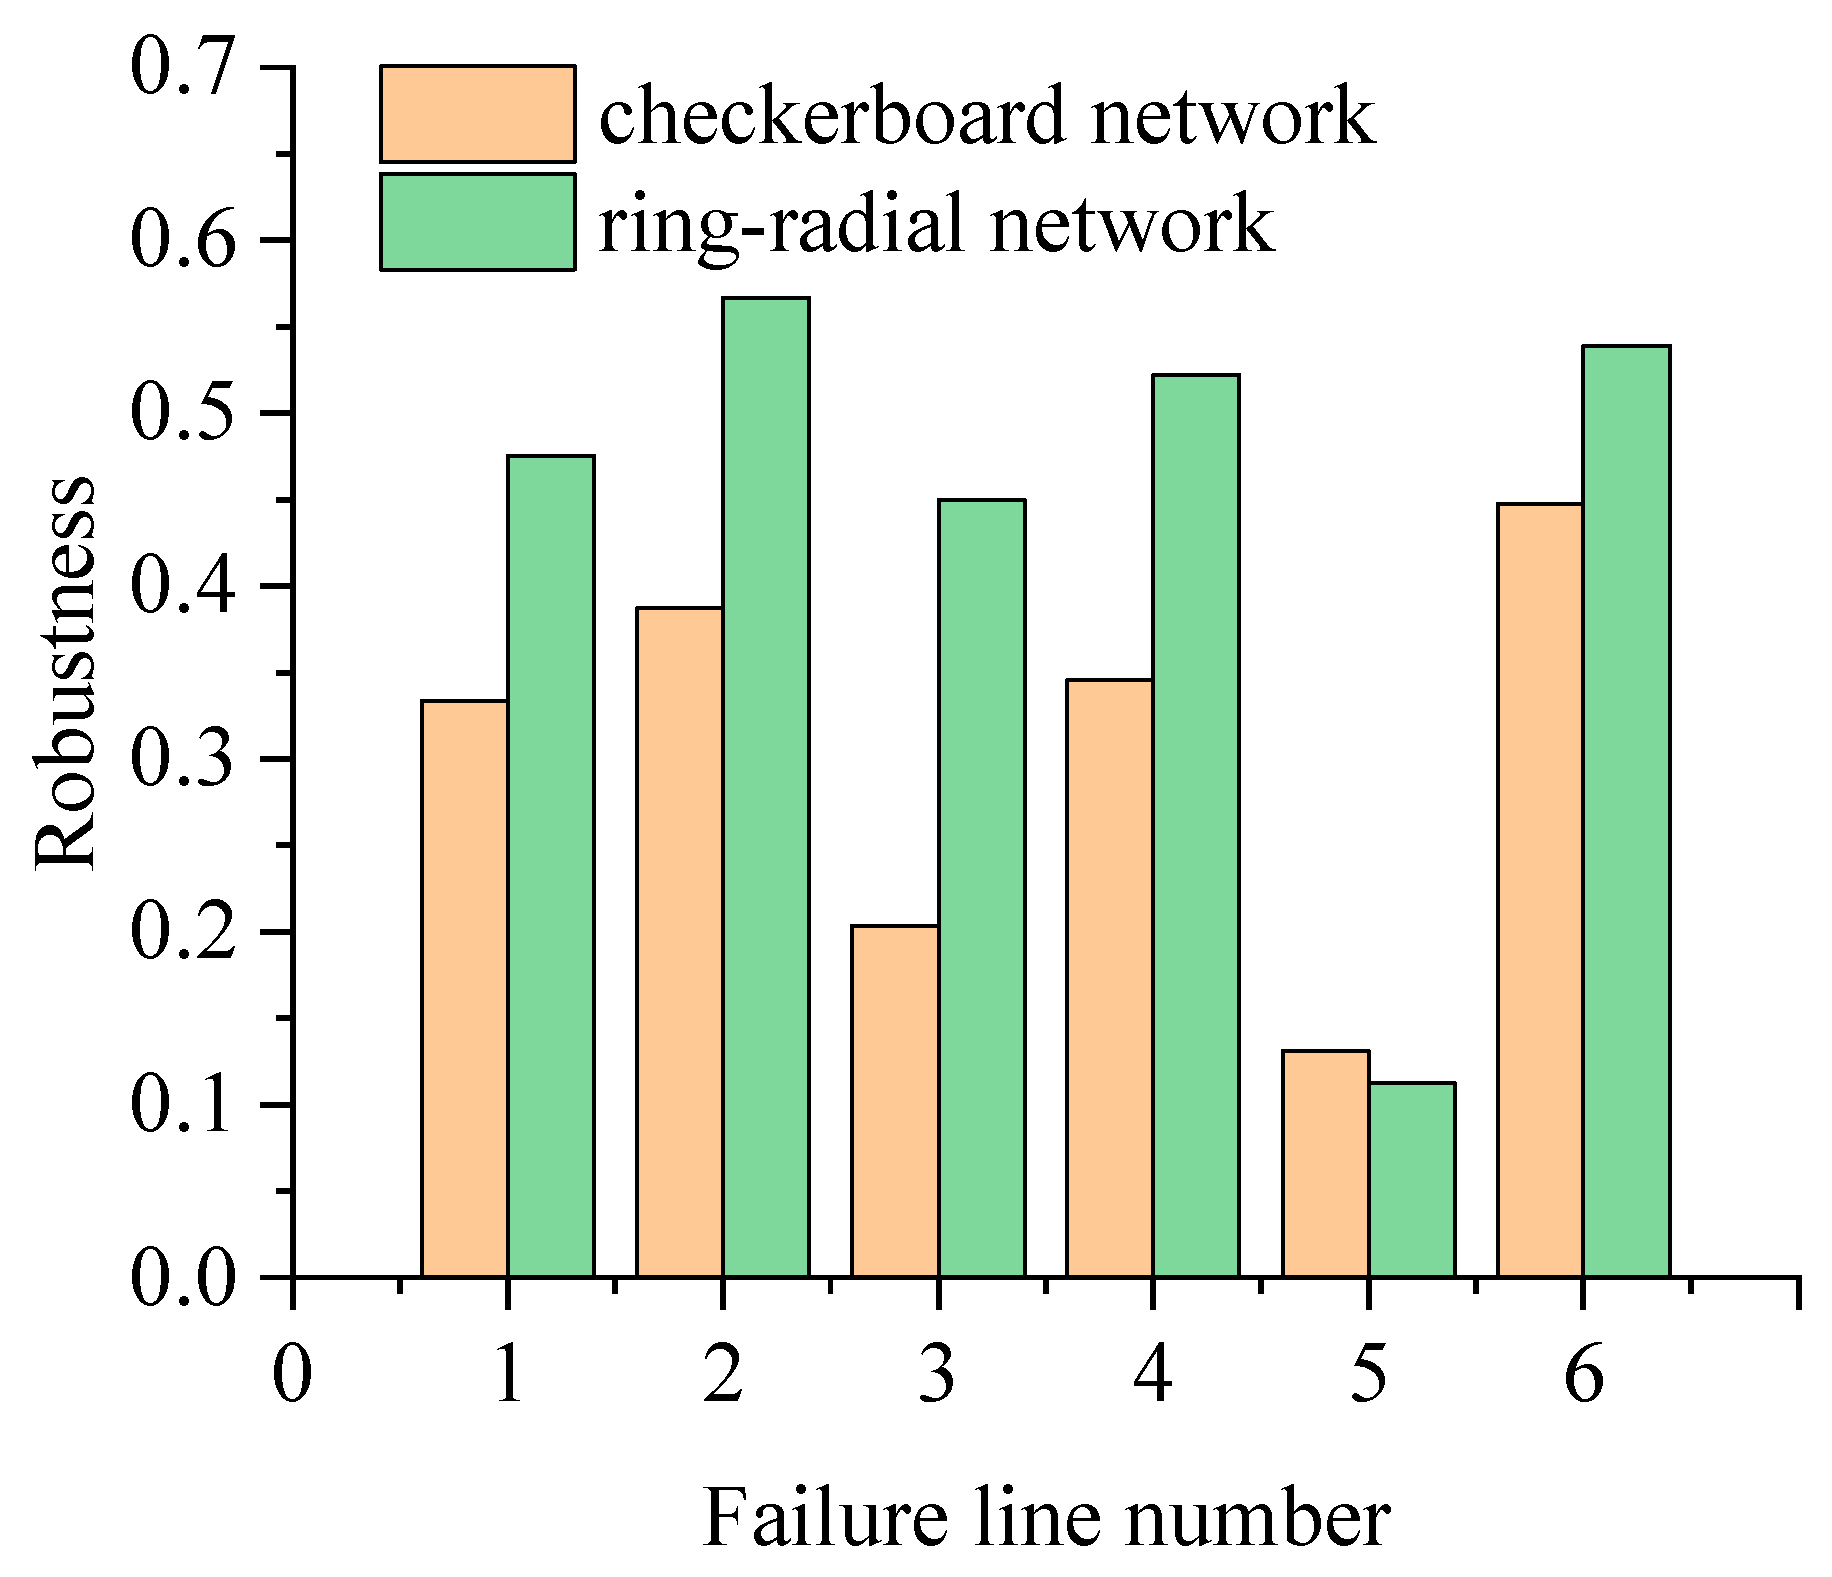
In order to reduce the performance loss of the bus network due to snowstorms, priority should be given to ensure the normal operation of critical lines, or, in the case of bus line failure, resources should be prioritized for the restoration of critical lines in the case of limited resources. To select the critical lines in the network, a bus line is deleted accordingly, and the passenger flows are redistributed, and the congestion degree and weighted adjacency matrix of the “new network” are calculated to obtain the values of the network robustness. The results are shown in Figure 13.
According to the calculation results of robustness under the snowstorm scenario, the following conclusions can be drawn:
(1)
The robustness of the two network types with the same number of bus lines is different. The robustness of the ring-radial network is about 1.14 times that of the checkerboard network;
(2)
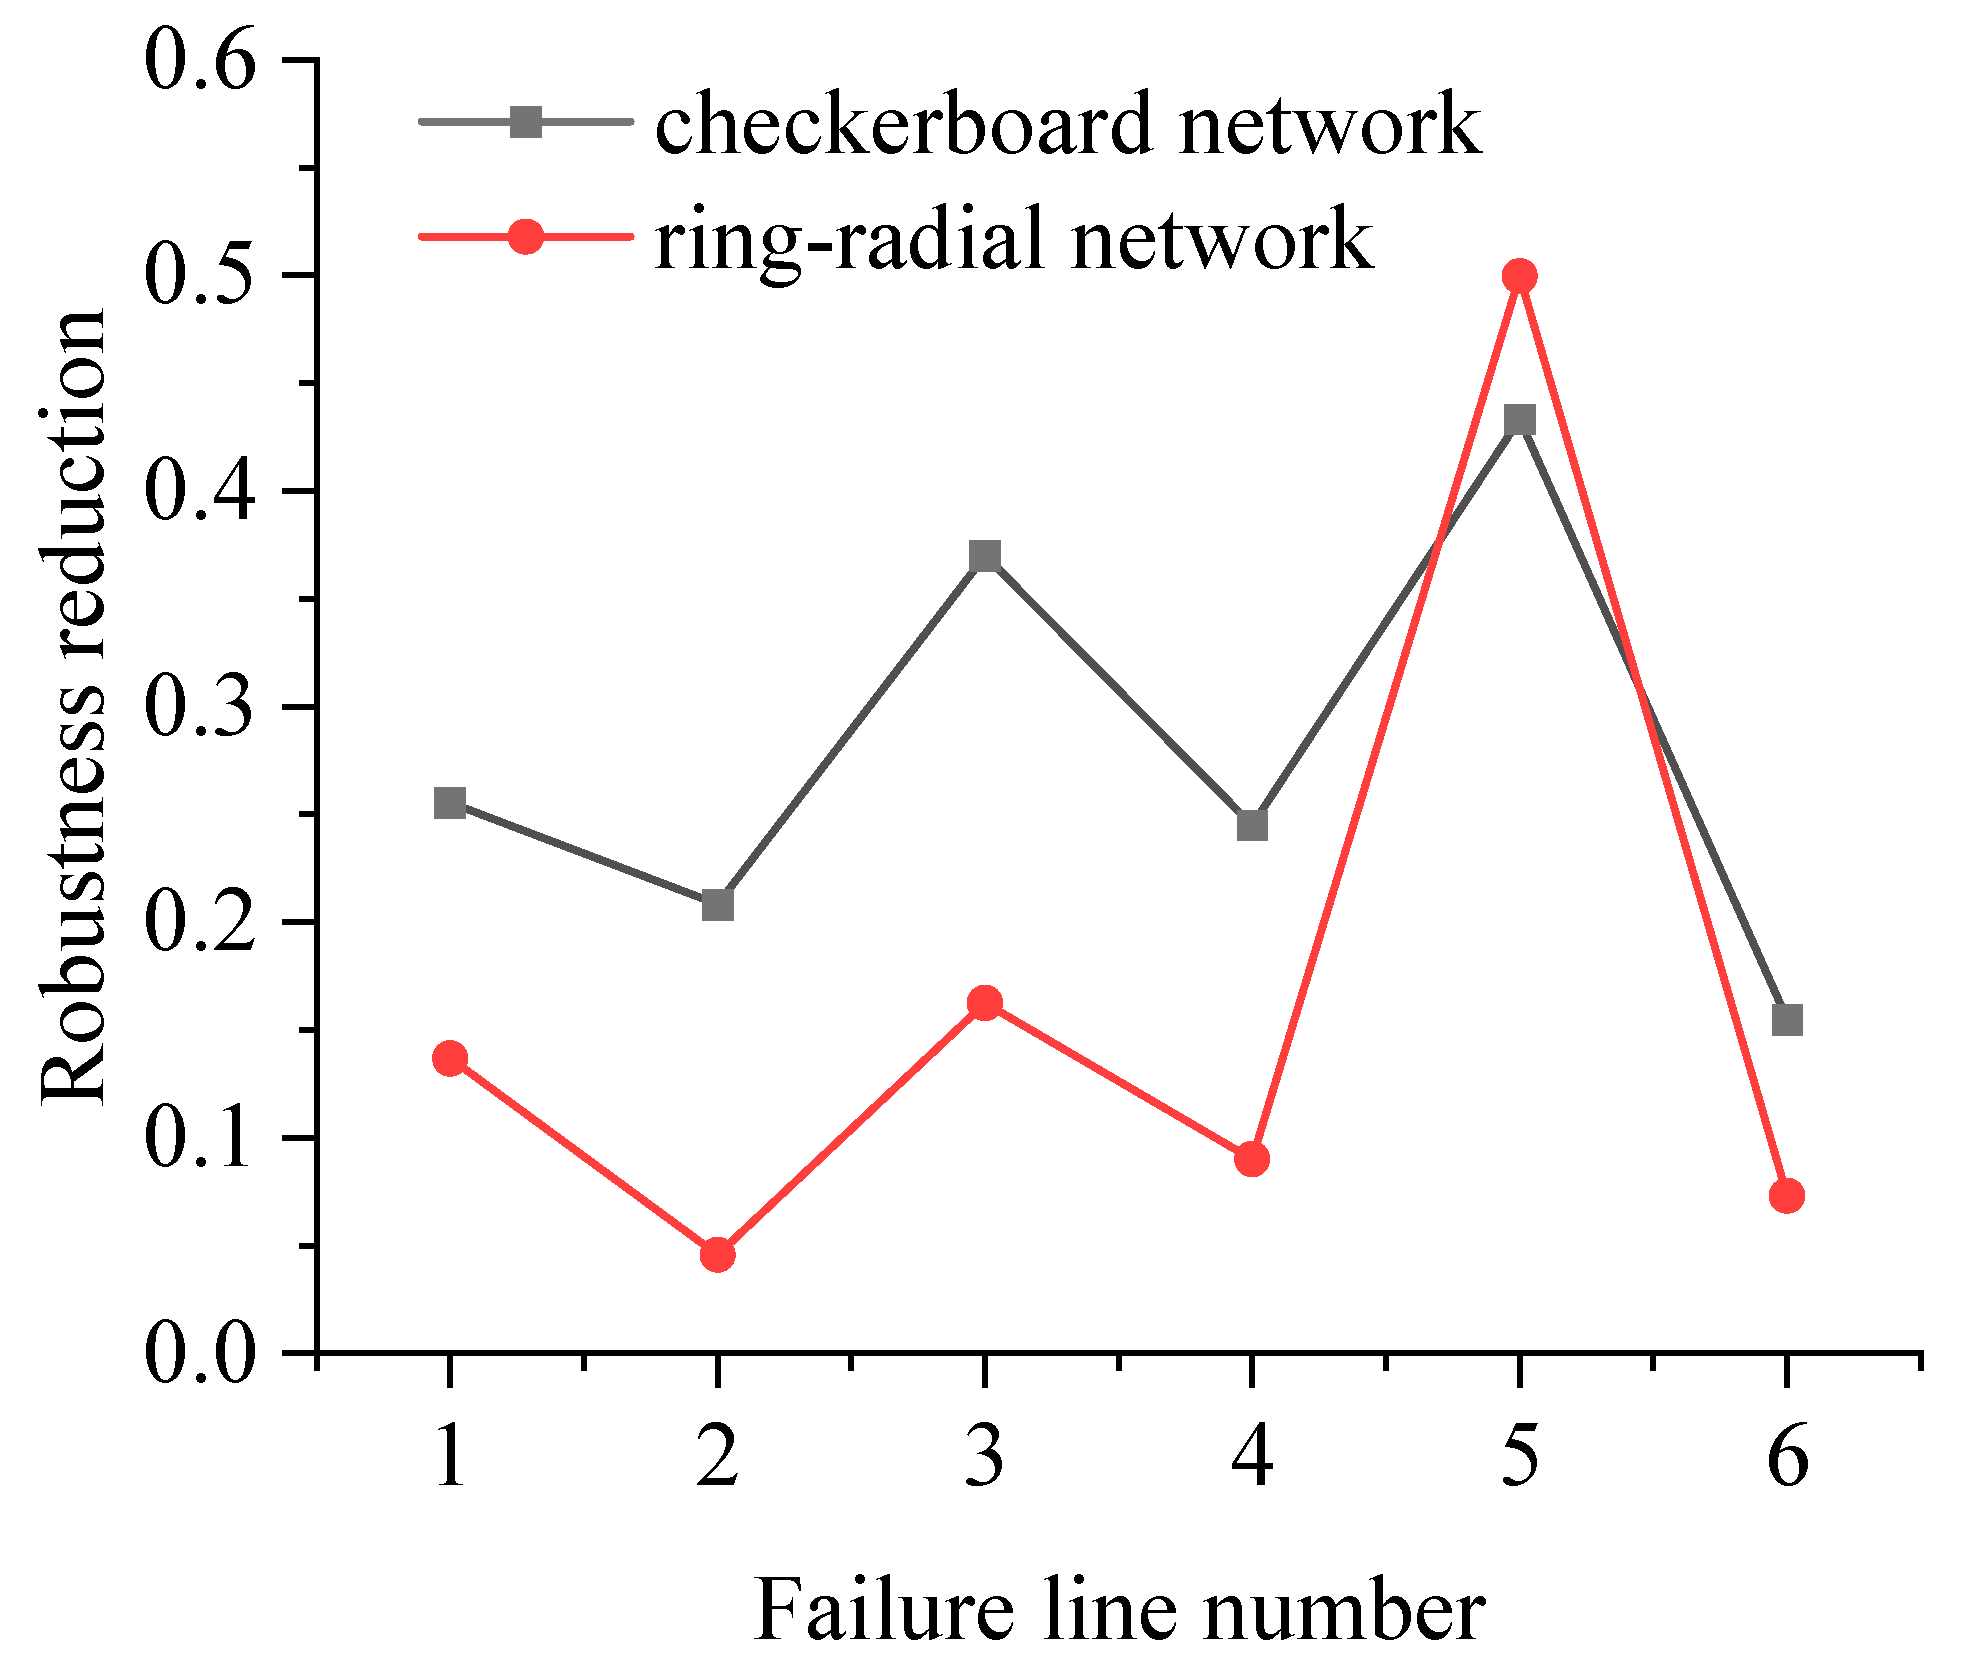
When different lines in the network fail, Ring Line 5 of both the checkerboard and the ring-radial network structure types has the highest importance, and the failure of the line will have the greatest impact on the network. If the ring line fails, the passenger flows on the line will be redistributed to other lines in the network, which will lead to a significant increase in passenger flows on other lines. Therefore, compared with other lines in the network, the ring line is more important. For both checkerboard and ring-radiation networks, the failure of Ring Line 5 significantly impacts the network, reducing system resilience by 43% and 50%, respectively;
(3)
When Line 1, 2, 3, 4, or 6 fails, the robustness reduction of the ring-radial network is smaller than that of the checkerboard network because there are more overlaps between the lines in the ring-radial network. When one of the lines fails, the passenger flows can be redistributed to other lines. When a line in the checkerboard network fails, passengers may need to bypass the path for a long time. Therefore, the failure of a single line will have a greater impact on the robustness of the checkerboard network;
(4)
Based on the robustness of the network, the results are shown in Figure 14, and the importance ranking of the lines in the checkerboard network is Line 5, 3, 1, 4, 2, and 6, and the importance ranking of the lines in the ring-radial network is Line 5, 3, 1, 4, 6, and 2.
In practical applications, the bus operation and the parameters involved in the model, such as congestion threshold, speed change coefficient, etc., will be different due to different regions. The parameter values can be determined based on the data collected in different types of regions, and the speed reduction coefficient and congestion change coefficient in the model will change accordingly.

5. Conclusions

By constructing a weighted adjacency matrix based on vehicle speed reduction and crowding degree inside the bus, this paper proposes a bus network system robustness evaluation model based on spectral radius for snowfall conditions. Example analyses are conducted using checkerboard and ring-radial topological network structures to verify the applicability of the proposed model. The results show that, compared with under normal weather, the robustness of the chessboard and ring-radial bus networks under snowfall conditions is reduced by 38% and 39%, respectively. The unit with the highest importance to the system robustness in the checkerboard network is C910, and the central area unit is always more important than the peripheral units. However, in the ring-radial network, the units that are more important for system robustness are on the ring line, such as C916. In addition, the failure of Ring Line 5 has a great impact on both the checkerboard and ring-radial networks, causing the system robustness to decrease by 43% and 50%, respectively.
Through the analysis of the results in this study, it can be seen that snowfall will lead to a reduction in the robustness of the bus network, and the failure of units at different locations in the network has different effects on the robustness of the network. Therefore, if, in the planning and design stage of the bus network, the network performance before and after snowfall is predicted according to the traffic flow data, and the ‘anti-attack’ performance of specific units (units whose unit failure has a greater impact on the network robustness) is enhanced, the recovery cost of the bus network robustness under snow conditions will be reduced, and the sustainability of the network will be enhanced. From the perspective of network routes, in the network planning and design stage, enhancing the ‘anti-attack’ performance of specific routes can also enhance the robustness of the bus network under snowy conditions. That is, in the snowy conditions, for the sustainable bus network, the network recovery to the initial level of the speed is faster, and its cost increase is small. However, the specific change ratio needs further calculation.
Due to the lack of relevant data, this paper only evaluates the snowfall robustness of ground buses in the urban public transportation system. In future research, we will focus on the following:
(1)
Under different snowfall intensities, urban road surface conditions and residents’ travel choice behaviors are different, which leads to different changes in bus speed and in-vehicle congestion, and the corresponding weighted adjacency matrix pages of the network change accordingly. Therefore, future research can further analyze the selection of model parameter thresholds and the application of the model under different snowfall intensities;
(2)
There are differences in the initial robustness of different cities. For example, cities with perennial snow cover have higher robustness to deal with snowfall, and their speed reduction coefficients and congestion change coefficients are different. In the follow-up study, the network structure of specific cities can be used to analyze the robustness of different structural networks;
(3)
When calculating the robustness of the network in this paper, only the ground bus network is considered, but the actual urban bus network also has rail transit, taxi, and other modes, and other public transport will be considered in the future;
(4)
The model in this paper only evaluates the robust performance of the network, but the future research will consider the robust performance of the bus system, operating costs, passenger satisfaction, and other factors [42,43], and an optimization model will be established to find an urban bus optimization scheme for snowy conditions and provide the basis for the operation of the urban bus system.

Author Contributions

Conceptualization, Y.Y. and Z.C.; methodology, Z.C.; validation, B.S. and Z.C.; investigation, B.S.; writing—original draft preparation, B.S., Z.C. and Y.Y.; writing—review and editing, B.S., Z.C. and Y.Y. All authors have read and agreed to the published version of the manuscript.

Funding

This research was funded by the Henan Province Science and Technology Research Project, grant number 242102240034.

Institutional Review Board Statement

Not applicable.

Informed Consent Statement

Not applicable.

Data Availability Statement

No new data were created or analyzed in this study. Data sharing is not applicable to this article.

Conflicts of Interest

The authors declare no conflicts of interest.

References

  1. Horner, M.W. Sustainable Transportation: Problems and Solutions. Ann. Assoc. Am. Geogr. 2011, 101, 454–456. [Google Scholar] [CrossRef]
  2. Miller, P.; de Barros, A.G.; Kattan, L.; Wirasinghe, S.C. Public transportation and sustainability: A review. Ksce J. Civ. Eng. 2016, 20, 1076–1083. [Google Scholar] [CrossRef]
  3. Climate Change Center of China Meteorological Administration. China Climate Change Blue Book(2023); Science Press: Beijing, China, 2023. [Google Scholar]
  4. Hao, Z.C.; Singh, V.P. Compound Events under Global Warming: A Dependence Perspective. J. Hydrol. Eng. 2020, 25, 03120001. [Google Scholar] [CrossRef]
  5. Zhou, L.; Chen, Z.H. Measuring the performance of airport resilience to severe weather events. Transp. Res. Part D Transp. Environ. 2020, 83, 102362. [Google Scholar] [CrossRef]
  6. AR6 Synthesis Eport: Climate Change 2023. Available online: https://www.ipcc.ch/ar6-syr/ (accessed on 9 May 2024).
  7. Tianjin Public Transportation Group (Holdings) Co., Ltd. Tianjin Bus. Urban Public Transp. 2024, 307, 45. [Google Scholar]
  8. Chester, M.V.; Allenby, B. Toward adaptive infrastructure: Flexibility and agility in a non-stationarity age. Sustain. Resilient Infrastruct. 2019, 4, 173–191. [Google Scholar] [CrossRef]
  9. Markolf, S.A.; Hoehne, C.; Fraser, A.; Chester, M.V.; Underwood, B.S. Transportation resilience to climate change and extreme weather events—Beyond risk and robustness. Transp. Policy 2019, 74, 174–186. [Google Scholar] [CrossRef]
  10. Bruneau, M.; Reinhorn, A. Exploring the concept of seismic resilience for acute care facilities. Earthq. Spectra 2007, 23, 41–62. [Google Scholar] [CrossRef]
  11. Cats, O. The robustness value of public transport development plans. J. Transp. Geogr. 2016, 51, 236–246. [Google Scholar] [CrossRef]
  12. Kim, H.; Kim, C.; Chun, Y. Network Reliability and Resilience of Rapid Transit Systems. Prof. Geogr. 2016, 68, 53–65. [Google Scholar] [CrossRef]
  13. Xing, Y.; Lu, J.; Chen, S.; Dissanayake, S. Vulnerability analysis of urban rail transit based on complex network theory: A case study of Shanghai Metro. Public Transp. 2017, 9, 501–525. [Google Scholar] [CrossRef]
  14. Yang, Y.H.; Liu, Y.X.; Zhou, M.X.; Li, F.X.; Sun, C. Robustness assessment of urban rail transit based on complex network theory: A case study of the Beijing Subway. Saf. Sci. 2015, 79, 149–162. [Google Scholar] [CrossRef]
  15. Derrible, S.; Kennedy, C. The complexity and robustness of metro networks. Phys. A Stat. Mech. Appl. 2010, 389, 3678–3691. [Google Scholar] [CrossRef]
  16. Wang, X.; Koc, Y.; Derrible, S.; Ahmad, S.N.; Pino, W.J.A.; Kooij, R.E. Multi-criteria robustness analysis of metro networks. Phys. A Stat. Mech. Appl. 2017, 474, 19–31. [Google Scholar] [CrossRef]
  17. Tang, J.J.; Li, Z.T.; Gao, F.; Zong, F. Identifying critical metro stations in multiplex network based on D-S evidence theory. Phys. A Stat. Mech. Appl. 2021, 574, 126018. [Google Scholar] [CrossRef]
  18. Qi, Q.J.; Meng, Y.Y.; Zhao, X.F.; Liu, J.Z. Resilience Assessment of an Urban Metro Complex Network: A Case Study of the Zhengzhou Metro. Sustainability 2022, 14, 11555. [Google Scholar] [CrossRef]
  19. Ding, R.; Fu, J.; Du, Y.M.; Du, L.Y.; Zhou, T.; Zhang, Y.L.; Shen, S.W.; Zhu, Y.Q.; Chen, S.H. Structural Evolution and Community Detection of China Rail Transit Route Network. Sustainability 2022, 14, 12342. [Google Scholar] [CrossRef]
  20. Yu, W.; Chen, J.; Yan, X.C. Space-Time Evolution Analysis of the Nanjing Metro Network Based on a Complex Network. Sustainability 2019, 11, 523. [Google Scholar] [CrossRef]
  21. Li, J.Y.; Teng, J.; Wang, H. Measuring robustness in uncertain topologies: A study of on-demand bus networks. Transp. A Transp. Sci. 2024, 1–27. [Google Scholar] [CrossRef]
  22. Liao, J.; Guo, C.; Xu, Y.; Zhang, J.; Yang, K. Quantitative analysis and calculation of traffic social cost during the construction of open-cut subway station. IOP Conf. Ser. Mater. Sci. Eng. 2020, 741, 012032. [Google Scholar] [CrossRef]
  23. Bajaj, G.; Singh, P. Understanding Preferences of Delhi Metro Users Using Choice-Based Conjoint Analysis. IEEE Trans. Intell. Transp. Syst. 2021, 22, 384–393. [Google Scholar] [CrossRef]
  24. Zhou, C.; Chen, P.Y.; Yang, S.F.; Zheng, F.; Yu, H.; Tang, J.; Lu, Y.; Chen, G.M.; Lu, X.Q.; Zhang, X.P.; et al. The impact of Typhoon Lekima (2019) on East China: A postevent survey in Wenzhou City and Taizhou City. Front. Earth Sci. 2022, 16, 109–120. [Google Scholar] [CrossRef]
  25. Zhang, L.J.; Li, L.S. People-oriented emergency response mechanism-An example of the emergency work when typhoon Meranti stroked Xiamen. Int. J. Disaster Risk Reduct. 2019, 38, 101185. [Google Scholar] [CrossRef]
  26. Jain, D.; Singh, S. Adaptation of trips by metro rail users at two stations in extreme weather conditions: Delhi. Urban Clim. 2021, 36, 100766. [Google Scholar] [CrossRef]
  27. Novales, M.; Orro, A.; Pérez-López, J.B.; Feal, J.; Bugarín, M.R. Increasing Boarding Lost Time at Regular Bus Stops during Rainy Conditions: A Case Study. J. Public Transp. 2021, 23, 63–80. [Google Scholar] [CrossRef]
  28. Abdelaty, H.; Foda, A.; Mohamed, M. The Robustness of Battery Electric Bus Transit Networks under Charging Infrastructure Disruptions. Sustainability 2023, 15, 3642. [Google Scholar] [CrossRef]
  29. Li, Z.C.; Huang, J.L. How to Mitigate Traffic Congestion Based on Improved Ant Colony Algorithm: A Case Study of a Congested Old Area of a Metropolis. Sustainability 2019, 11, 1140. [Google Scholar] [CrossRef]
  30. Cao, N.; Cao, H.Q. Exploring the robustness of urban bus network: A case from Southern China. Chin. J. Phys. 2020, 65, 389–397. [Google Scholar] [CrossRef]
  31. Abdelaty, H.; Mohamed, M.; Ezzeldin, M.; El-Dakhakhni, W. Quantifying and classifying the robustness of bus transit networks. Transp. A Transp. Sci. 2020, 16, 1176–1216. [Google Scholar] [CrossRef]
  32. Pan, H.Y.; Zhang, W.H.; Hu, B.Y.; Liu, Z.Y.; Wang, Y.G.; Zhang, X. Construction and robustness analysis of urban weighted subway-bus composite network. J. Jilin Univ. (Eng. Technol. Ed.) 2022, 52, 2582–2591. [Google Scholar]
  33. GB/T 28592-2012; Grade Division of Precipitation. Standards Press of China: Beijing, China, 2012.
  34. Cheng, G.Z.; Mo, X.Y.; Mao, C.Y. Urban Road Traffic Safety Evaluation Method under the Condition of lce and Snow Pavement. J. Transp. Syst. Eng. Inf. Technol. 2011, 11, 130–134. [Google Scholar]
  35. Sun, H.Y.; Yang, J.S.; Li, L.B.; Wu, B. Research Review of the lmpacts of Adverse Weather Events on RoadTransport System. J. Transp. Inf. Saf. 2012, 30, 26–32. [Google Scholar]
  36. CJJ/T 119-2008; Terminology Standard for Urban Public Transport Engineering. China Building Industry Press: Beijing, China, 2008.
  37. GB7258-2017; Safety Technical Conditions for Motor Vehicle Operation. Standards Press of China: Beijing, China, 2017.
  38. Reggiani, A.; Nijkamp, P.; Lanzi, D. Transport resilience and vulnerability: The role of connectivity. Transp. Res. Part A-Policy Pract. 2015, 81, 4–15. [Google Scholar] [CrossRef]
  39. Lyu, S.Y. Redundancy Analysis and Optimization Design of Urban Road Network under the Influence of Rainfall. Master’s Thesis, Zhengzhou University, Zhengzhou, China, 2022. [Google Scholar]
  40. Hong, J.; Tamakloe, R.; Lee, S.; Park, D. Exploring the Topological Characteristics of Complex Public Transportation Networks: Focus on Variations in Both Single and Integrated Systems in the Seoul Metropolitan Area. Sustainability 2019, 11, 5404. [Google Scholar] [CrossRef]
  41. American Transportation Research Council. Transit Capacity and Quality of Service Manual, 3rd ed.; The National Academies Press: Washington, DC, USA, 2019. [Google Scholar]
  42. Ji, J.; Bie, Y.; Shi, H.; Wang, L. Energy-saving speed profile planning for a connected and automated electric bus considering motor characteristic. J. Clean. Prod. 2024, 448, 141721. [Google Scholar] [CrossRef]
  43. Ji, J.; Bie, Y.; Wang, L. Optimal electric bus fleet scheduling for a route with charging facility sharing. Transp. Res. Part C Emerg. Technol. 2023, 147, 104010. [Google Scholar] [CrossRef]
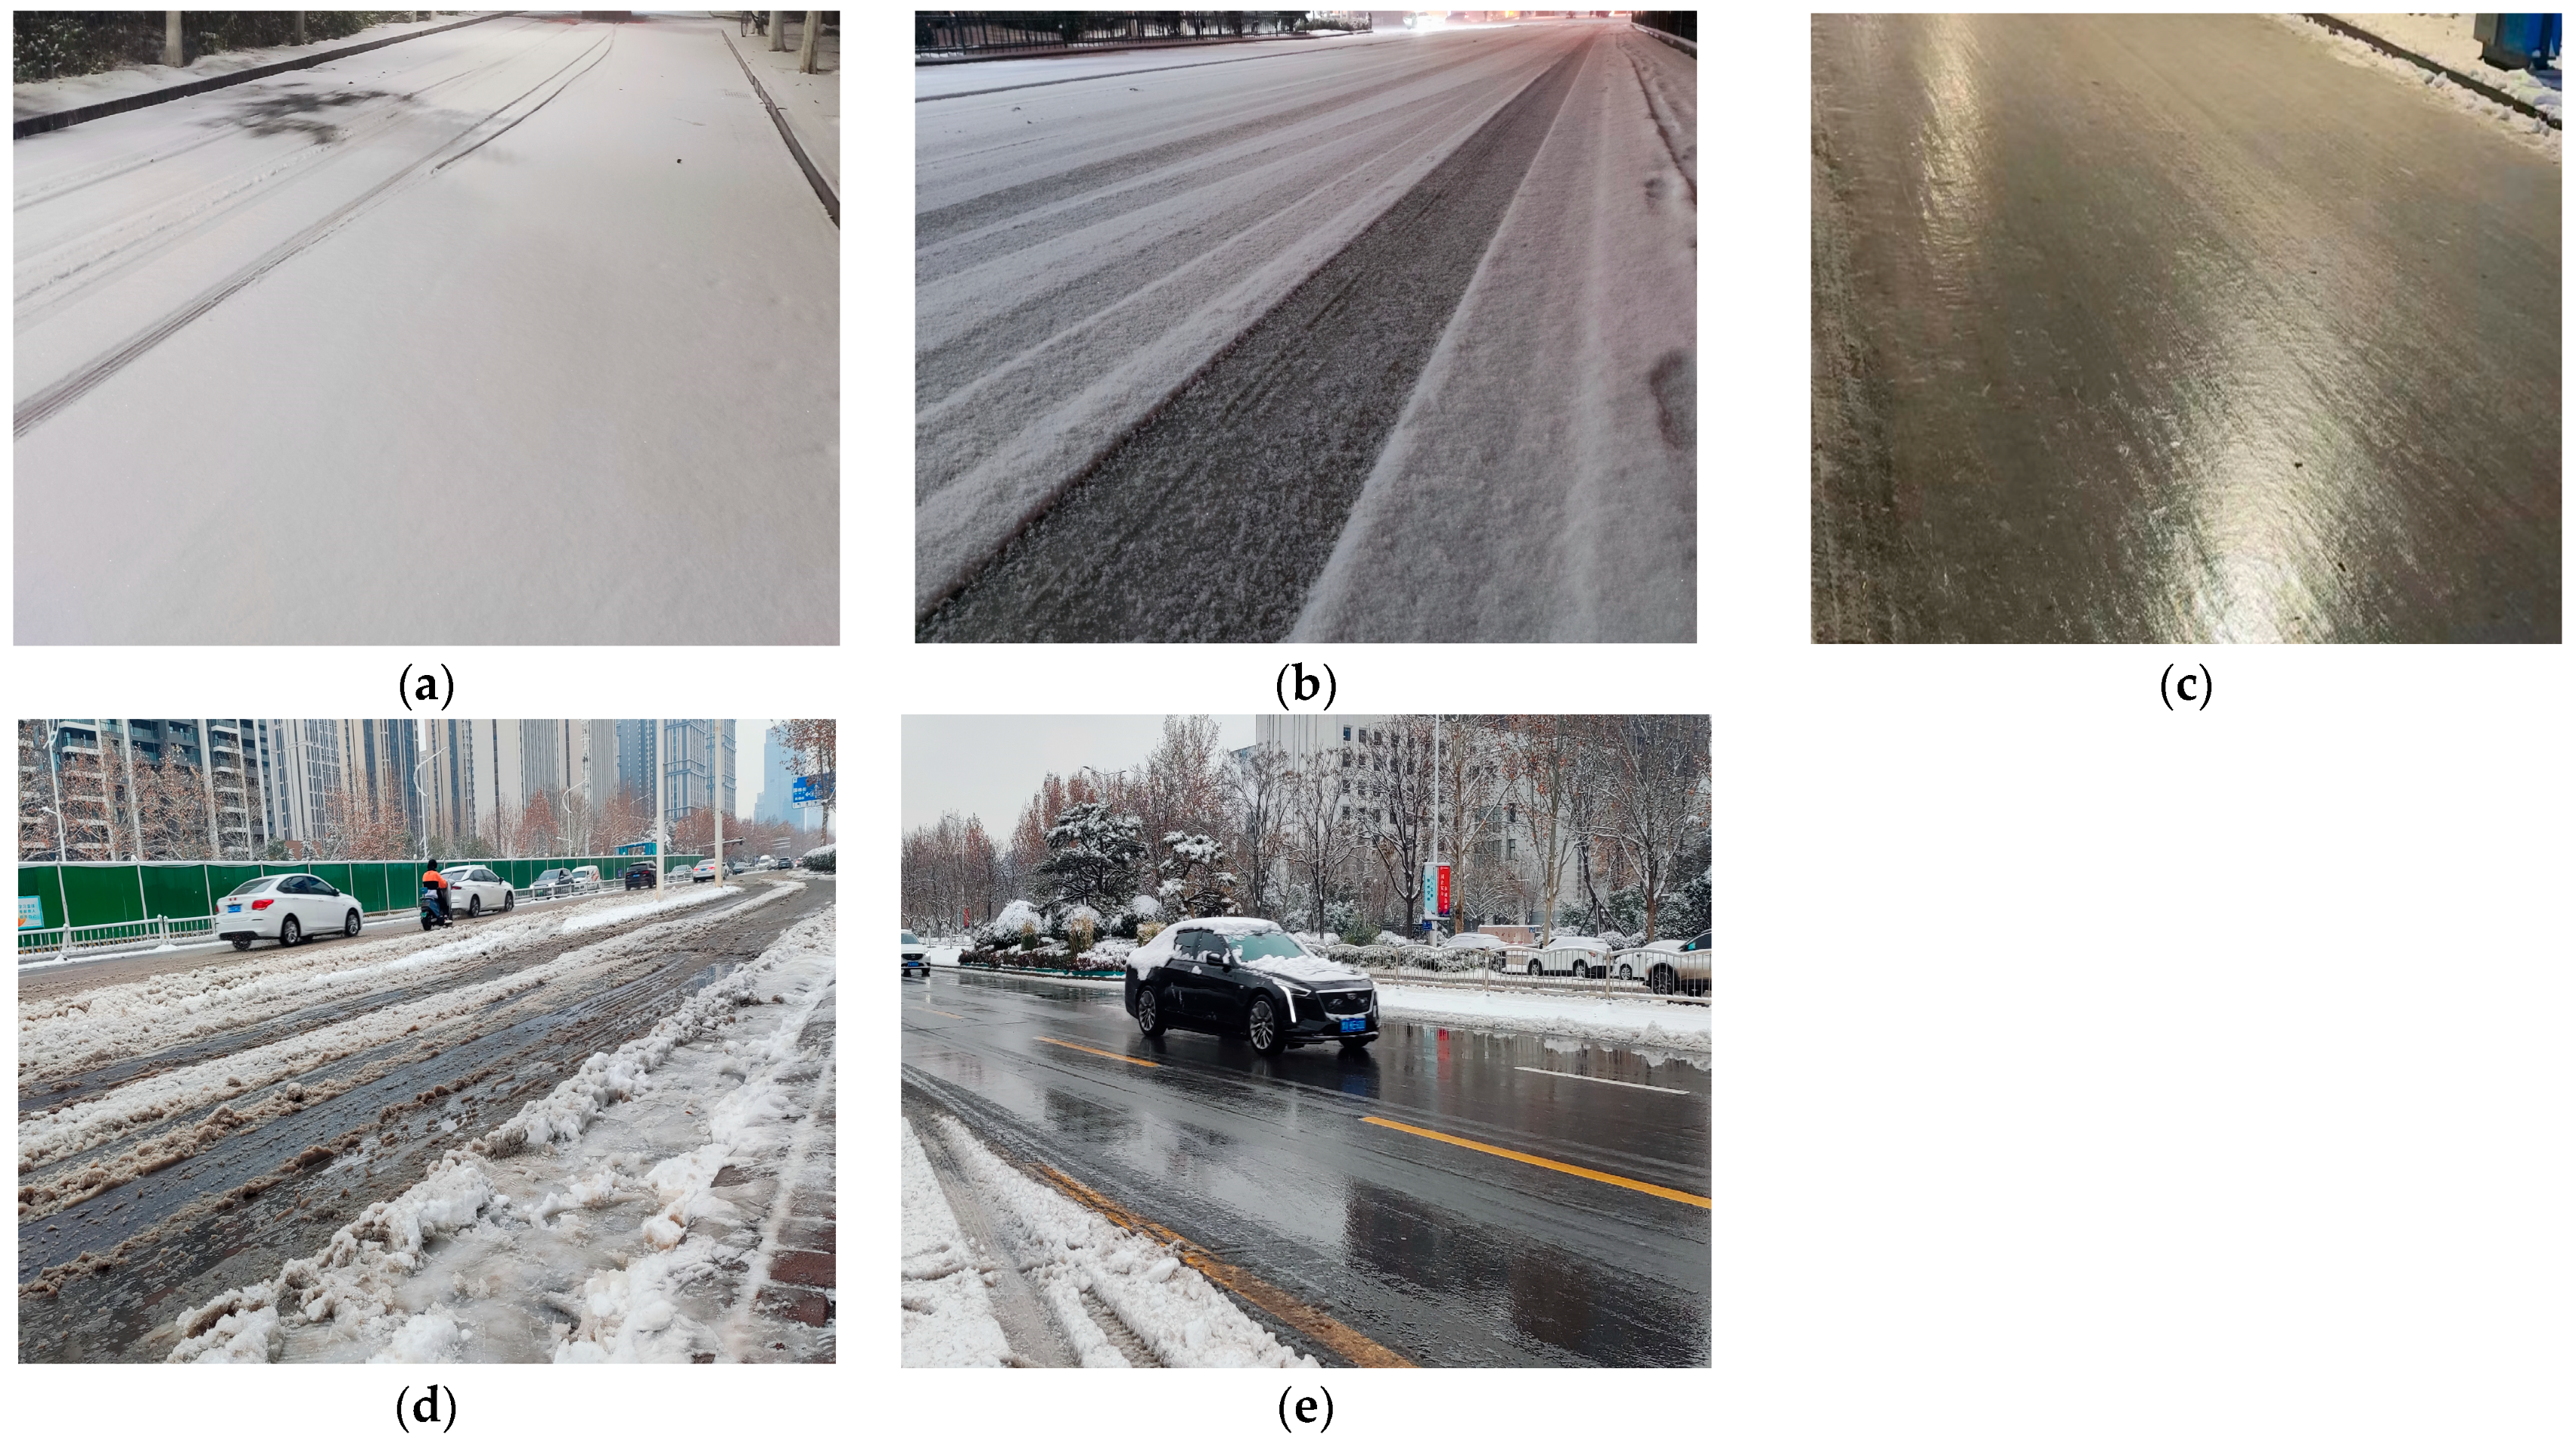
Figure 1. Types of pavement in snowy conditions: (a) snow; (b) snow covers the ice; (c) ice; (d) snow mixed with ice; (e) water.
Sustainability 16 05260 g001
Figure 2. The speed distribution of Changchun Road under different road conditions.
Sustainability 16 05260 g002
Figure 3. The speed distribution of Cuizhu Street under different road conditions.
Sustainability 16 05260 g003
Figure 4. A schematic diagram of the effective standing area within bus.
Sustainability 16 05260 g004
Figure 5. The number of passengers and congestion degree within bus under different weather conditions.
Sustainability 16 05260 g005
Figure 6. Sixteen-node chessboard network with six bus lines.
Sustainability 16 05260 g006
Figure 7. Network robustness under node attack: (a) robustness to deliberate attack; (b) robustness to random attack.
Sustainability 16 05260 g007
Figure 8. Ring-radial network with 6 bus lines.
Sustainability 16 05260 g008
Figure 9. Robustness reduction value when the unit of checkerboard network fails.
Sustainability 16 05260 g009
Figure 10. Robustness reduction value when the unit of ring-radial network fails.
Sustainability 16 05260 g010
Figure 11. The importance ranking of chessboard network units.
Sustainability 16 05260 g011
Figure 12. The importance ranking of ring-radial network units.
Sustainability 16 05260 g012
Figure 13. Robustness of two networks when the line of two networks failed.
Sustainability 16 05260 g013
Figure 14. Robustness reduction value when the line of two networks failed.
Sustainability 16 05260 g014
Table 1. The classification standard of snow intensity grade [33].
Snow Intensity Grade12 h of Snowfall (mm)24 h of Snowfall (mm)
sporadic snow<0.1<0.1
light snow0.1–0.90.1–2.4
medium snow1.0–2.92.5–4.9
heavy snow3.0–5.95.0–9.9
snowstorm6.0–9.910.0–19.9
heavy snowstorm10.0–14.920.0–29.9
severe snowstorm≥15.0≥30.0
Table 2. Average speed distribution under different road conditions (km/h).
RoadCross-Sectional
Type
DayNight
DryWaterDrySnowy
Changchun RoadFour52.6344.3750.4420.46
Cuizhu StreetThree51.2743.7146.0216.57
Table 3. Congestion degree within bus at some bus stops.
Weather Conditions1234567Mean Value
Normal weather0.30000.42500.47500.47500.40000.35000.22500.3786
Snowy conditions0.51250.53750.55000.60000.52500.55000.38750.5232
Table 4. Passenger flow distribution between OD pairs.
O12345678910111213141516
D
104230464122393350262215814106
24201425241426234834373223464230
330140121441210141513313427
4462510000022455131614
5412420000023578233029
6221410000000011467
7392640000000123132225
8332340000000147305674
95048122200000014204567
102634102300000000136
112237144501100000148
121532155712410000001
13823135813740000001
14144631132341330201100000
15104234163062256453400000
1663027142972574676811000
Table 5. Standard speed under different road conditions.
RoadCross-Sectional
Type
DayNight
DryWaterSnowyDryWaterSnowy
Changchun RoadFour0.87720.73950.35700.84070.70870.3410
Cuizhu StreetThree0.85450.72850.30500.76700.68850.2762
Table 6. Related indicators and robustness of different networks under snowstorm scenario.
Network StructureStandard SpeedSpeed Reduction CoefficientCongestion DegreeRobustness
Inside UnitsOutside UnitsInside UnitsOutside Units
Chessboard0.30500.35700.64300.59300.43430.6238
Ring-radial0.30500.35700.64300.59300.37550.6132
Table 7. Robustness reductions when different lines fail.
Failure Line NumberChessboard NetworkRing-Radial Network
10.25540.1367
20.20820.0457
30.36990.1625
40.24490.0902
50.43320.4996
60.15500.0731
Disclaimer/Publisher’s Note: The statements, opinions and data contained in all publications are solely those of the individual author(s) and contributor(s) and not of MDPI and/or the editor(s). MDPI and/or the editor(s) disclaim responsibility for any injury to people or property resulting from any ideas, methods, instructions or products referred to in the content.