


Soil Heavy Metal(loid) Pollution Evaluation, Risk Assessment, and Source Analysis of a Mineral Processing Plant
Abstract
1. Introduction
2. Materials and Methods
2.1. Overview of the Study Area
2.2. Sample Collection and Analysis
- (1)
- Location program
- (2)
- Soil control point layout
- (3)
- Solid waste samples
2.3. Human Health Risk Assessment Methods
2.4. Ecological Risk Evaluation Methods and Standards
- (1)
- Single-factor indices
- (2)
- Nemero Composite Pollution Index Method
3. Results and Discussion
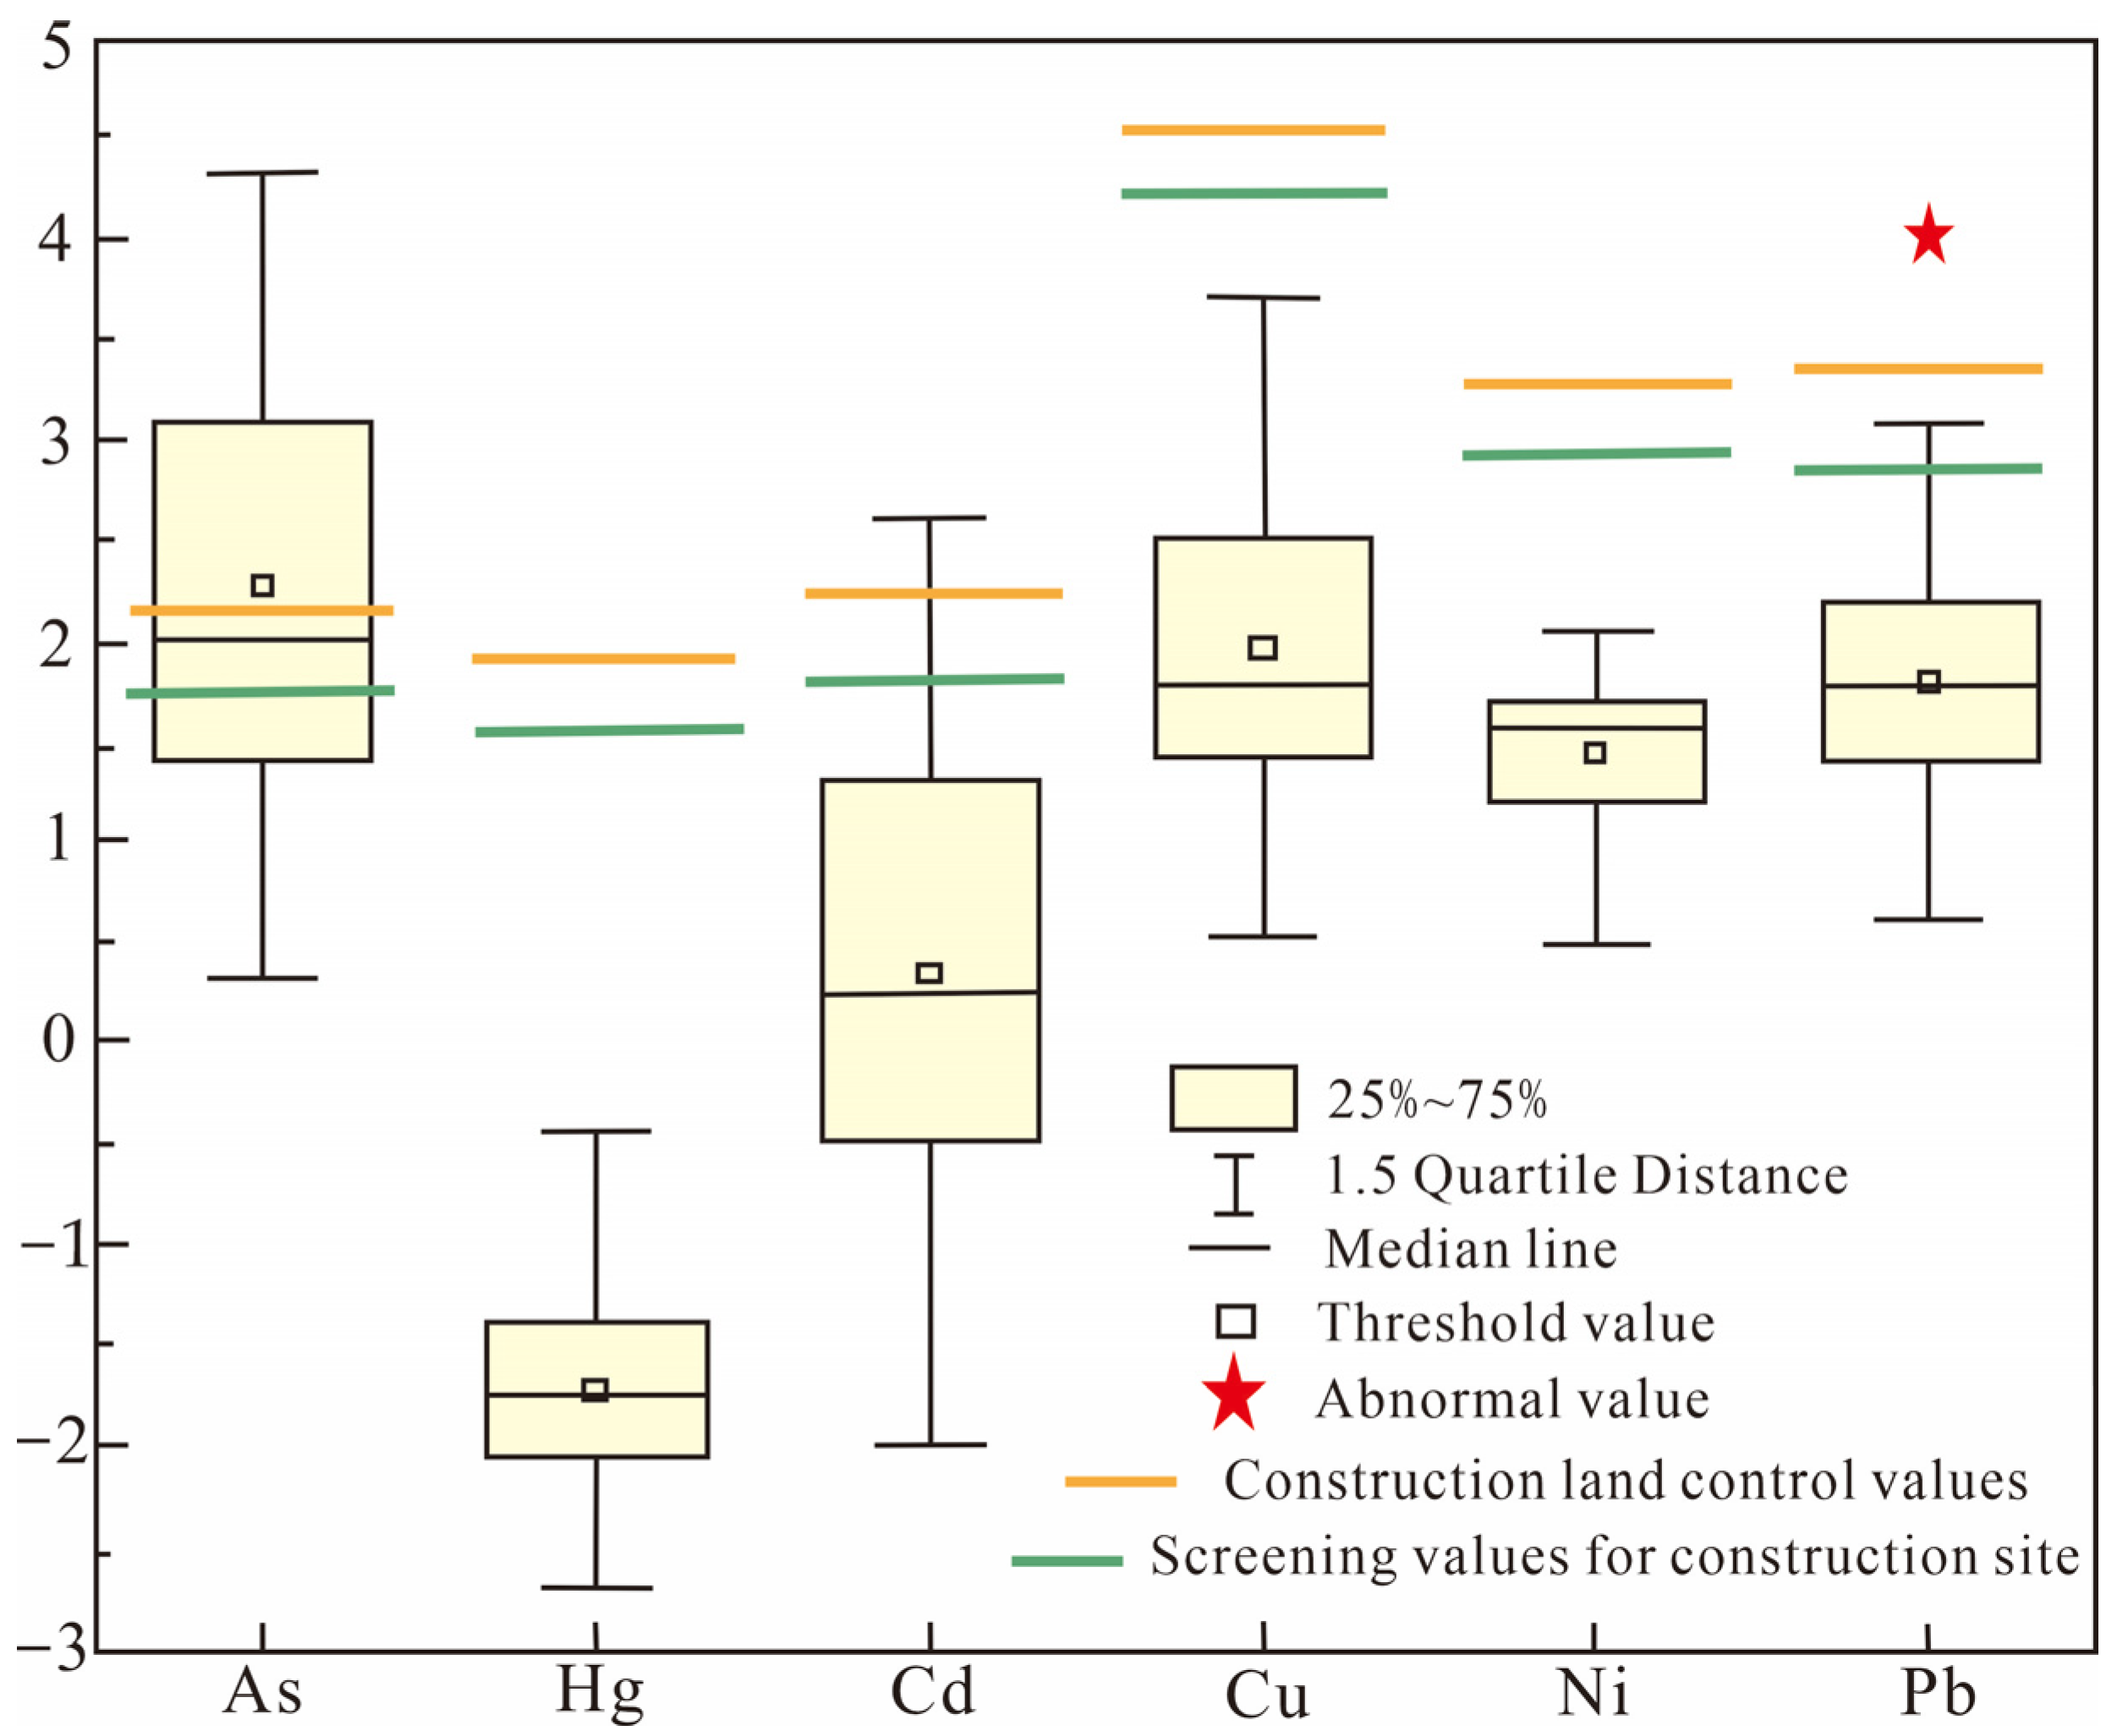
3.1. Characteristics of Soil Heavy Metal(loid) Content
3.2. Characterization of Heavy Metal(loid) Content in Solid Waste
3.2.1. Characterization of Building (Structure) Content
3.2.2. Characteristics of Waste Slag Content
3.3. Spatial Distribution Characteristics of Soil Heavy Metal(loid)s
3.4. Soil Pollution Risk Evaluation
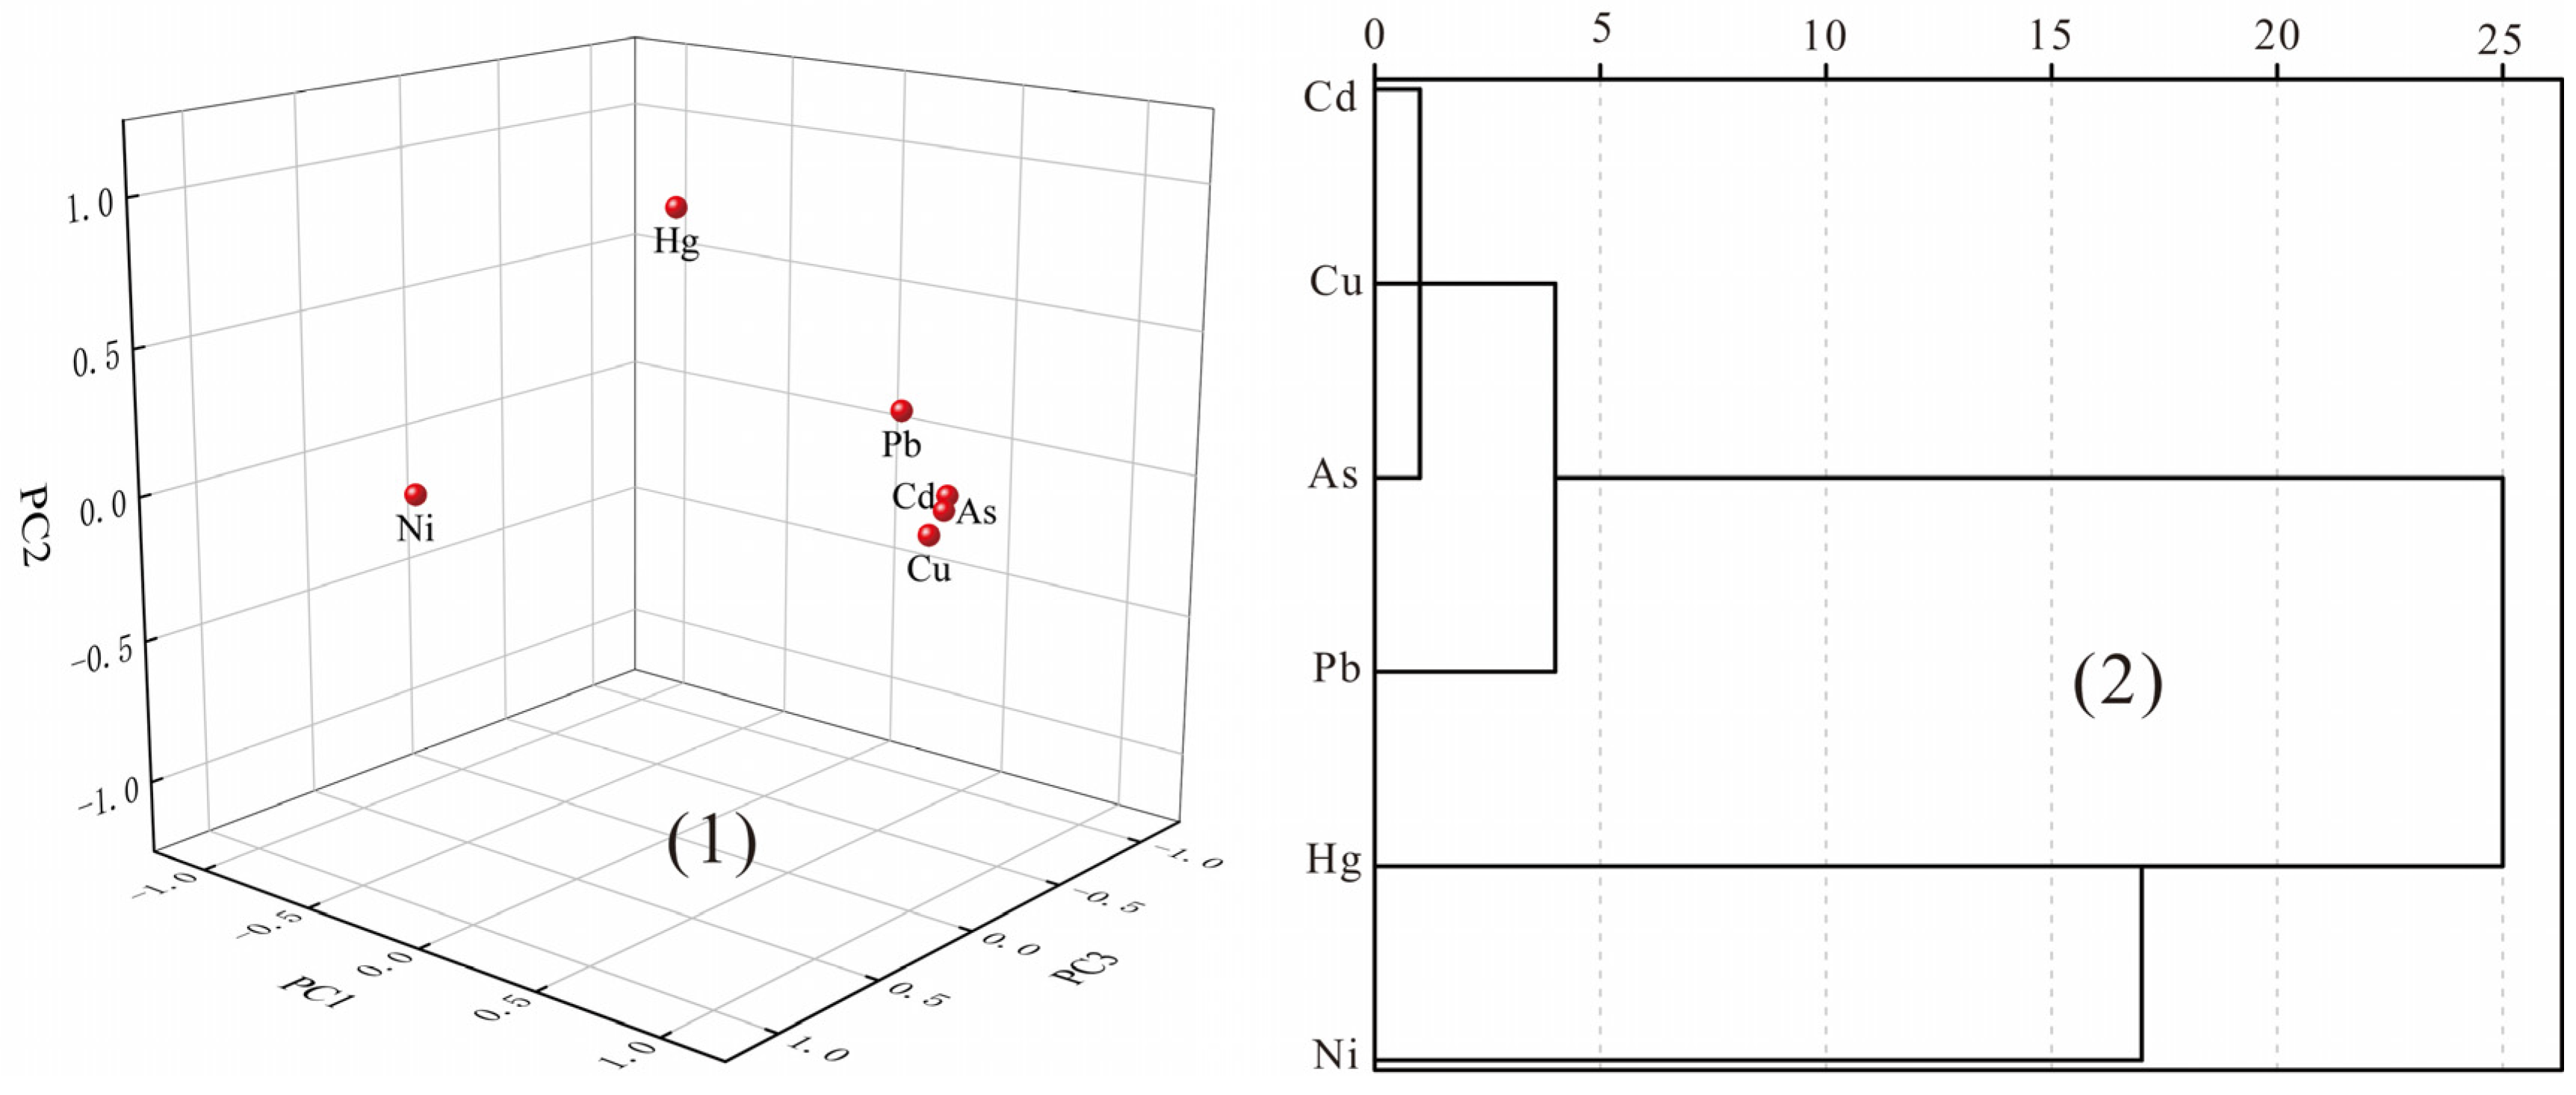
3.5. Analysis of Heavy Metal Sources
3.6. Risk Prevention and Control
4. Conclusions
- (1)
- The average value of soil pH in the sample points of the study area is 6.56, and the whole is acidic; the average value of Hg and Ni elements is lower than the content of the control points and the background value of the soil in Yunnan Province and higher than the national background value of the soil; the average content of As, Cd, Pb, and Cu is significantly higher than the background value of the soil in Yunnan Province, which indicates that there is a certain degree of enrichment of them in the soil of the study area; the coefficients of variation for As, Cd, Pb, and Cu are all greater than 1, which may be affected by human activities; the main exceeding heavy metal(loid)s are As, Cd, and Pb, and at the same time, the main pollution factors in solid waste are As, Cd, Pb, and Cu.
- (2)
- Pollution in the study area was mainly distributed in the southeast, and the spatial distribution of most heavy metal(loid)s was concentrated in lumber mills, factories, and waste dumps in the study area.
- (3)
- The evaluation results of the single-factor and Nemero composite pollution indices were consistent as follows: As > Pb > Cd > Cu > Ni > Hg. The proportion of the heavy pollution degree of the single-factor index was As > Cd > Pb > Hg = Cu = Ni.
- (4)
- For the exposure assessment analysis, non-carcinogenic, and carcinogenic average daily intake of different heavy metal(loid)s, it is in the order of As > Cu > Pb > Ni > Cd > Hg, with the different pathways for ADDinh < ADDderm < ADDing, and for the health risk evaluation, adults and children in the order of different pathways for cancer risk are CRing > CRderm > CRinh. The order of non-cancer risk is HQing > HQderm > HQinh. The carcinogenic risk of element As is the largest, and the carcinogenic risk of Cd, Ni, and Pb in some sampling points is within the acceptable range. Hg does not pose a carcinogenic risk to humans.
- (5)
- The sources of soil heavy metal(loid)s in the study area can be divided into three categories: As, Cd, Cu, and Pb, which are mainly derived from mineral extraction and metallurgy; Hg is related to the combustion of fossil fuels, and soil-forming matrices are the main sources of Ni.
Author Contributions
Funding
Institutional Review Board Statement
Informed Consent Statement
Data Availability Statement
Conflicts of Interest
References
- Zhang, Y.X.; Song, B.; Pang, R.; Zhou, L. Risk assessment of lead intake via food among residents in the mining areas of Nandan County China. Environ. Geochem. Health 2020, 42, 3841–3850. [Google Scholar] [CrossRef] [PubMed]
- Fang, B.; Xiao, T.W.; Su, N.N.; Xia, Y.; Shen, Z.G.; Cui, J. Research progress on cadmium uptake and its transport and accumulation in various organs of rice. Chin. J. Rice Sci. 2021, 35, 225–237. [Google Scholar]
- Ministry of Environmental Protection of the People’s Republic of China. Priority Control Chemicals List (First Batch). China Environment Yearbook 2017. Available online: https://www.mee.gov.cn/gkml/hbb/bgg/201712/t20171229_428832.htm (accessed on 1 February 2024).
- Ministry of Ecology and Environment of the People’s Republic of China. List of Toxic and Harmful Water Pollutants (First Batch). China Environment Yearbook 2019. Available online: https://www.mee.gov.cn/xxgk2018/xxgk/xxgk01/201907/t20190729_712633.html (accessed on 1 February 2024).
- Ministry of Ecology and Environment of the People’s Republic of China. List of Toxic and Harmful Air Pollutants (2018). China Environment Yearbook 2019. Available online: https://www.mee.gov.cn/xxgk2018/xxgk/xxgk01/201901/t20190131_691779.html (accessed on 1 February 2024).
- Abdelaziz, S.; Anis, C.; Chiraz, A.B.; Amine, M.H.; Ferid, D.; Fredj, C. Evaluation of pollution by heavy metals of an abandoned Pb-Zn mine in northern Tunisia using sequential fractionation and geostatistical mapping. Environ. Sci. Pollut. Res. 2020, 27, 43942–43957. [Google Scholar]
- Simatupang, A.C.; Santhaweesuk, K.; Strezov, V.; Pongkiatkul, P.; Boontanon, N.; Jindal, R.; Boontanon, K.S. Health risk assessment of soil contamination with heavy metals in a child care center co-located in vicinity to small scale industrial area: Case study of Thailand. Case Stud. Chem. Environ. Eng. 2024, 9, 100727. [Google Scholar] [CrossRef]
- Skrobala, V.; Popovych, V.; Tyndyk, O.; Voloshchyshyn, A. Chemical pollution peculiarities of the Nadiya mine rock dumps in the Chervonohrad Mining District, Ukraine. Min. Miner. Depos. 2022, 16, 71–79. [Google Scholar] [CrossRef]
- Asma, Y.; Rim, A.B. Environmental Contamination and Health Risk Assessment of Heavy Metals in the Stream Sediments of Oued Kasseb (Northerwest of Tunisia) in the Vicinity of Abandoned Pb-Zn Mine. Water Air Soil Pollut. 2024, 235, 230. [Google Scholar]
- Said, M.; Rizwan, U. Spatial distribution of heavy metals contamination in sediments of alpine lakes and potential risk indices, Northern Pakistan. Int. J. Environ. Anal. Chem. 2024, 104, 1610–1623. [Google Scholar]
- Parisa, P.; Samad, A.; Soroush, M.; David, C. Using multivariate statistical analysis in assessment of surface water quality and identification of heavy metal pollution sources in Sarough watershed, NW of Iran. Min. Miner. Depos. 2021, 193, 564. [Google Scholar]
- Račić, N.; Malvić, T. Relation between air and soil pollution based on statistical analysis and interpolation of Nickel (Ni) and Lead (Pb): Case study of Zagreb, Croatia. Min. Miner. Depos. 2023, 17, 112–120. [Google Scholar] [CrossRef]
- Franklin, N.O.; Jude, O.Q.; Sandra, V.A.; Obed, F.F.; Collins, O.; Samuel, K.D.; Anthony, Y.K. Determination of threshold values and heavy metal pollution assessment of soils in an industrial area in Ghana. Environ. Monit. Assess. 2024, 196, 546. [Google Scholar]
- Priyajit, S.; Kumar, A.M.; Somnath, K.; Somnath, K.; Patitapaban, M.; Kadari, R. Health risk assessment and hydrogeochemical modelling of groundwater due to heavy metals contaminants at Basundhara coal mining region, India. Int. J. Environ. Anal. Chem. 2024, 104, 735–754. [Google Scholar]
- Zhang, L.Y.; Ji, Y.F.; Ma, J.Z.; Qiao, P.; Shang, X.F.; Zhou, J.Q. Research on environmental hazards and management countermeasures of contaminated sites in China. China Environ. Prot. Ind. 2015, 147, 46–48. [Google Scholar]
- Liu, H.B.; Qu, M.K.; Zhang, J.L.; Kang, J.F.; Zhao, Y.C.; Huang, B. Research Progress of Source Analysis Technology for Soil Pollutants. Environ. Monit. Forewarning 2021, 13, 1–6+19. [Google Scholar]
- Jagupilla, C.S.; Wazne, M.; Moon, H.D. Assessment of ferrous chloride and Portland cement for the remediation of chromite ore processing residue. Chemosphere 2015, 136, 95–101. [Google Scholar] [CrossRef] [PubMed]
- Barati, S.; Tabatabaie Shourijeh, P.; Samani, N.; Asadi, S. Stabilization of iron ore tailings with cement and bentonite: A case study on Golgohar mine. Bull. Eng. Geol. Environ. 2020, 79, 4151–4166. [Google Scholar] [CrossRef]
- Wang, H.J.; Ju, C.X.; Zhou, M.; Chen, J.A.; Dong, Y.Q.; Hou, H.B. Sustainable and efficient stabilization/solidification of Pb, Cr, and Cd in lead-zinc tailings by using highly reactive pozzolanic solid waste. J. Environ. Manag. 2022, 306, 11447. [Google Scholar] [CrossRef] [PubMed]
- Alieh, S.; Ahmad, J.Z.; Mehdi, M.; Ahmad, K.D. Mechanical activation for sulfidic tailings treatment by tailings: Environmental aspects and cement consumption reduction. Case Stud. Constr. Mater. 2023, 19, e02632. [Google Scholar]
- Golik, V.I.; Klyuev, R.V.; Martyushev, N.V.; Zyukin, D.A.; Karlina, A.I. Prospects for Return of Valuable Components Lost in Tailings of Light Metals Ore Processing. Metallurgist 2023, 67, 96–103. [Google Scholar] [CrossRef]
- Su, Z.J.; Zhang, Y.M.; Xu, H.W.; Xu, W.M.; Liu, C.; Rui, S.; Tuo, Y.F.; He, X.H.; Xiang, P. Preparation and applications of iron/biochar composites in remediation of heavy metal contaminated soils: Current status and further perspectives. Environ. Technol. Innov. 2024, 35, 103671. [Google Scholar] [CrossRef]
- Zhao, Z.R.; Dong, Z.T.; Wang, F.H.; Wang, F.Y.; Xia, M.Z. Innovative strategy of turning waste into treasure: High-efficiency adsorption of heavy metals pollutants by modified amorphous calcium phosphate prepared with phosphogypsum waste. J. Environ. Chem. Eng. 2024, 12, 112994. [Google Scholar]
- Aransiola, A.S.; Josiah, J.U.I.; Abioye, P.O.; Bala, D.J.F.; Rivadeneira-Mendoza, B.; Prasad, R.; Luque, R.; Rodríguez-Díaz, M.J.; Maddela, R.N. Micro and vermicompost assisted remediation of heavy metal contaminated soils using phytoextractors. Case Stud. Chem. Environ. Eng. 2024, 9, 100755. [Google Scholar] [CrossRef]
- State Council of the People’s Republic of the China. The State Council on the Comprehensive Prevention and Control of Heavy Metal Pollution ‘Twelfth Five-Year Plan’ Approval. 2011. Available online: https://news.sciencenet.cn/htmlnews/2011/2/244257.shtm (accessed on 1 February 2024).
- State Council of the People’s Republic of the China. Action Plan for Soil Pollution Control. 2016. Available online: https://www.mohrss.gov.cn/SYrlzyhshbzb/dongtaixinwen/shizhengyaowen/201606/t20160601_241077.html (accessed on 1 February 2024).
- Ministry of Ecology and Environment of the People’s Republic of China. Opinions on Strengthening Pollution Prevention and Control in Heavy Metal-Related Industries. 2018. Available online: https://www.mee.gov.cn/ywgz/gtfwyhxpgl/zjshjgl/201904/t20190410_699166.shtml (accessed on 1 February 2024).
- Ministry of Ecology and Environment of the People’s Republic of China. Opinions on Further Strengthening the Prevention and Control of Heavy Metal Pollution. Resour. Regen. 2022, 236, 54–57. [Google Scholar]
- Wu, Y.J. To make the ‘nonferrous metal kingdom’ more ‘nonferrous’—China Copper Co., Ltd. ‘Central Enterprises Entering Yunnan’ Development Documentary. China Nonferrous Met. 2022, 50–51. [Google Scholar]
- Liu, G.N.; Wang, J.; Liu, X.; Li, X.S.; Ren, Y.Q.; Wang, J.; Dong, L.M. Partitioning and geochemical fractions of heavy metals from geogenic and anthropogenic sources in various soil particle size fractions. Geoderma 2018, 312, 104–113. [Google Scholar] [CrossRef]
- Zhang, L.; Zhang, Y.X.; Song, B.; Wu, Y.; Zhou, Z.Y. Heavy metal enrichment characteristics and application potential of dominant plants in Lanping lead-zinc mining area, Yunnan. Environ. Sci. 2020, 41, 4210–4217. [Google Scholar]
- Chen, W.D.; Zhu, K.; Yao, W.W.; Huang, Z.X.; He, Z.W. Evaluation of heavy metal pollution in soil of Xuejiping copper mining area in Yunnan. Plateau Sci. Res. 2021, 5, 5–12+26. [Google Scholar]
- Liu, Y.; He, C.H.; Niu, X.K.; Zhang, D.; Pan, B. Health risk assessment of soil heavy metals in a small watershed of a mining area in Yunnan. Environ. Sci. 2022, 43, 936–945. [Google Scholar]
- Liu, Y.; Liu, M.Q.; Wang, L.; Yin, A.J.; Huang, Z.L.; Yao, D.D.; Dai, W.; Wang, L.; Wang, H. Evaluation of heavy metal pollution in farmland soil around an abandoned silicon plant in Yunnan. J. Agro-Environ. Sci. 2022, 41, 785–793. [Google Scholar]
- Yin, B.K.; Huang, M.H.; Li, G.M.; Zhang, D.L.; Chen, L. Heavy metal pollution and ecological risk assessment of farmland soil around a smelter in Yunnan. Nonferrous Met. Eng. 2017, 7, 92–96. [Google Scholar]
- Song, S.M. Application of Efficient Treatment of High-Salinity Wastewater Containing Heavy Metals in a Lead-Zinc Smelter in Yunnan. Master’s Thesis, Kunming University of Science and Technology, Kunming, China, 2019. [Google Scholar]
- Guo, W. Experimental Study on Leaching Remediation of Heavy Metal Contaminated Soil in an Abandoned Non-Ferrous Metal Smelter in Yunnan. Master’s Thesis, China University of Geosciences, Beijing, China, 2019. [Google Scholar]
- Zhang, Y.X.; Song, B.; Zhou, Z.Y. Pollution assessment and source apportionment of heavy metals in soil from lead: Zinc mining areas of south China. J. Environ. Chem. Eng. 2023, 11, 109320. [Google Scholar] [CrossRef]
- Dey, S.; Tripathy, B.; Kumar, M.S.; Das, P.A. Ecotoxicological consequences of manganese mining pollutants and their biological remediation. Environ. Chem. Ecotoxicol. 2023, 5, 55–61. [Google Scholar] [CrossRef]
- Zhu, Y.Z. Indium Accumulation State and Distribution Pattern in the Zinc-Tin Deposits of Dulong, Southeast Yunnan. Master’s Thesis, Kunming University of Science and Technology, Kunming, China, 2021. [Google Scholar]
- HJ/T 166-2004; General Administration of Environmental Protection of the People’s Republic of China. Technical Specification for Soil Environmental Monitoring. China Environment Press: Beijing, China, 2004.
- Ministry of Ecological and Environmental Protection of the People’s Republic of China. Technical Guide for Investigation and Evaluation of Soil Environment in Construction Land; China Environment Press: Beijing, China, 2017.
- HJ 25.1-2014; Ministry of Ecological and Environmental Protection of the People’s Republic of China. Technical Guidelines for Site Environmental Investigation. China Environment Press: Beijing, China, 2014.
- GB/T6679-2003; China Petroleum and Chemical Industry Federation; General Administration of Quality Supervision, Inspection and Quarantine of the People’s Republic of China. General Principles for Sampling of Solid Chemical Products. China Environment Press: Beijing, China, 2004.
- HJ/T20-1998; General Administration of Environmental Protection of the People’s Republic of China. Technical Specification for Sampling and Sample Preparation of Industrial Solid Waste. China Environment Press: Beijing, China, 1998.
- Liu, T.; Liu, C.P.; Deng, J.; Kang, P.Y.; Wang, K.K.; Zhao, Y.Y. Ecological health risk assessment of soil heavy metals in eastern Yinan County, Shandong Province. Geol. China 2022, 49, 1497–1508. [Google Scholar]
- HJ 25.3-2019; Ministry of Ecology and Environment of the People’s Republic of China. Technical guidelines for risk assessment of soil contamination of land for Construction. China Environment Press: Beijing, China, 2019.
- USEPA. Exposure Factors Handbook; Environment Protection Agency: Washington, DC, USA, 2011.
- USEPA. Regional Screening Levels (RSLs)-Generic Tables [EB/OL]; Environment Protection Agency: Washington, DC, USA, 2017.
- Cheng, X.M.; Sun, B.B.; Wu, C.; He, L.; Zeng, D.M.; Zhao, C. Heavy metal content characteristics and health risks of farmland soils in typical pyrite mining areas in central Zhejiang. Environ. Sci. 2022, 43, 442–453. [Google Scholar]
- Rohra, H.; Tiwari, R.; Khandelwal, N.; Taneja, A. Mass distribution and health risk assessment of size segregated particulate in varied indoor microenvironments of Agra, India—A case study. Urban Clim. 2018, 24, 139–152. [Google Scholar] [CrossRef]
- Rehman, I.U.; Ishaq, M.; Ali, L.; Khan, S.; Ahmad, I.; Din, I.U.; Ullah, H. Enrichment, spatial distribution of potential ecological and human health risk assessment via toxic metals in soil and surface water ingestion in the vicinity of Sewakht mines, district Chitral, Northern Pakistan. Ecotoxicol. Environ. Saf. 2018, 154, 127–136. [Google Scholar] [CrossRef] [PubMed]
- Tao, H.; Zhang, X.H.; Wang, Y.J.; Wang, Y.J.; Tao, E.Z.; Wang, F. Distribution characteristics of surface dust heavy metal pollution and health risk evaluation in Yinchuan City. Environ. Chem. 2022, 41, 2573–2585. [Google Scholar]
- GB36600-2018; Ministry of Ecology and Environment of the People’s Republic of China. Soil Environmental Quality—Risk Control Standard for Soil Contamination of Development Land (Trial). China Environmental Science Press: Beijing, China, 2018.
- China National Environmental Monitoring Centre. Background Value of Soil Elements in China; China Environmental Science Press: Beijing, China, 1990. [Google Scholar]
- Wei, F.S.; Chen, J.S.; Wu, Y.Y.; Zheng, C.J. Background Values of Soil Environment in China. Environ. Sci. 1991, 12, 1220. [Google Scholar]
- Li, X.Y.; Mao, Y.; Chen, Z.L.; Liu, W.J.; Cheng, C.; Shi, M.M.; Xu, A.; Su, Y.W.; Hu, T.P.; Qi, S.H.; et al. Characteristics and Health Risk Assessment of Heavy Metals in PM 2.5 Under Winter Haze Conditions in Central China: A Case Study of Huanggang, Hubei Province. Environ. Sci. 2021, 42, 4593–4601. [Google Scholar]
- GB 5085.3-2007; General Administration of Environmental Protection of the People’s Republic of China. General Administration of Quality Supervision, Inspection and Quarantine of the People’s Republic of China. Hazardous Waste Identification Standard Diffuse Toxicity Identification. China Environmental Science Press: Beijing, China, 2007.
- Li, H.J.; Yang, Y.J.; Lv, H.M. Process research and application of indium recovery from intermediate slag of indium smelting. World Nonferrous Met. 2018, 30–31. [Google Scholar]
- Abraham, M.R.; Susan, T.B. Water contamination with heavy metals and trace elements from Kilembe copper mine and tailing sites in Western Uganda; implications for domestic water quality. Chemosphere 2017, 169, 281–287. [Google Scholar]
- Al-Hwaiti, S.M.; Brumsack, J.H.; Schnetger, B. Heavy metal contamination and health risk assessment in waste mine water dewatering using phosphate beneficiation processes in Jordan. Environ. Earth Sci. 2018, 77, 661. [Google Scholar] [CrossRef]
- Kadriu, S.; Sadiku, M.; Kelmend, M.; Sadriu, E. Studying the heavy metals concentration in discharged water from the Trepça Mine and flotation, Kosovo. Min. Miner. Depos. 2020, 14, 47–52. [Google Scholar] [CrossRef]
- Giri, S.; Singh, A.K. Risk assessment, statistical source identification and seasonal fluctuation of dissolved metals in the Subarnarekha River, India. J. Hazard. Mater. 2014, 265, 305–314. [Google Scholar] [CrossRef] [PubMed]
- Muhammad, S. Evaluation of heavy metals in water and sediments, pollution, and risk indices of Naltar Lakes, Pakistan. Environ. Sci. Pollut. Res. 2022, 30, 28217–28226. [Google Scholar] [CrossRef] [PubMed]
- Li, L.M.; Wu, J.; Lu, J.; Min, X.Y.; Xu, J.; Yang, L. Distribution, pollution, bioaccumulation, and ecological risks of trace elements in soils of the northeastern Qinghai-Tibet Plateau. Ecotox. Environ. Safe 2018, 166, 345–353. [Google Scholar] [CrossRef] [PubMed]
- Song, Y.; Wang, H.; Ji, J.T.; Du, Y.L. Characteristics of heavy metal contamination in the soil of a legacy site of a zinc sand smelter evaluation. Environ. Earth Sci. 2023, 82, 521. [Google Scholar]
- Wang, Y.; Xin, C.L.; Yu, S.; Xue, H.L.; Zeng, P.; Sun, P.A.; Liu, F. Soil heavy metal content, source and potential ecological risk assessment in hilly areas of southern China. Environ. Sci. 2022, 43, 4756–4766. [Google Scholar]
- Xie, S.C.; Lam, T.; Xing, A.; Chen, C.; Meng, C.; Wang, S.P.; Xu, M.M.; Hong, M. Spatial distribution and ecological risk of heavy metals and their source apportionment in soils from a typical mining area, Inner Mongolia, China. J. Arid. Land 2023, 15, 1196–1215. [Google Scholar] [CrossRef]
- Chen, Y.F.; Guo, J.; Guo, S.Y.; Chen, J.X.; Li, T.; Ma, S.; Chen, H.L. Evaluation and source analysis of heavy metal pollution in surface water of Wunan River in Changzhou. Acta Sci. Circumstantiae 2024, 44, 157–166. [Google Scholar]
- Wei, X.D.; Zhou, Y.T.; Jiang, Y.J.; Tsang, D.C.W.; Zhang, C.S.; Liu, J.; Zhou, Y.C.; Yin, M.L.; Wang, J.; Shen, N.P.; et al. Health risks of metal(lloid)s in maize (Zea mays L.) in an artisanal zinc smelting zone and source fingerprinting by lead isotope. Sci. Total Environ. 2020, 742, 140321. [Google Scholar] [CrossRef]
- Zhao, X.Q.; Huang, J.; Zhu, X.Y.; Chai, J.C.; Ji, X.L. Ecological effects of heavy metal pollution on soil microbial community structure and diversity on both sides of a river around a mining area. Int. J. Environ. Res. Public Health 2021, 17, 5680. [Google Scholar] [CrossRef]
- Cao, J.; Xie, C.Y.; Hou, Z.R. Ecological evaluation of heavy metal pollution in the soil of Pb-Zn mines. Ecotoxicology 2022, 31, 259–270. [Google Scholar] [CrossRef] [PubMed]
- Tao, Z.H.; Su, H.; Wei, W.B.; Dao, X.Q. Structural evolution and ore-controlling of north-south faults in Dulong mining area, southeastern Yunnan. Acta Mineral. Sin. 2016, 36, 497–502. [Google Scholar]
- Ye, L.; Bao, T.; Liu, Y.P.; Zhang, Q.; Wang, X.J.; He, F.; Wang, D.P.; Lan, J.B. Metallogenic stage and ore-forming fluid of Dulong tin-zinc polymetallic deposit in Yunnan. Acta Mineral. Sin. 2016, 36, 503–509. [Google Scholar]
- Xu, J.; Cook, J.N.; Ciobanu, L.C.; Li, X.F.; Kontonikas-Charos, A.; Gilbert, S.; Lv, Y.H. Indium distribution in sphalerite from sulfide–oxide–silicate skarn assemblages: A case study of the Dulong Zn–Sn–In deposit, Southwest China. Min. Depos. 2020, 56, 307–324. [Google Scholar] [CrossRef]
- Liu, S.Y.; Liu, Y.P.; Ye, L.; Wang, D.P. LA-ICPMS trace element composition of pyrite from the Dulong super-large tin-zinc polymetallic deposit in southeastern Yunnan. Acta Petrol. Sin. 2021, 37, 1196–1212. [Google Scholar]
- Wang, Q.L.; Song, Y.T.; Wang, C.W.; Xu, R.T.; Peng, M.; Zhou, Y.L.; Han, W. Source analysis and spatial distribution of soil heavy metals in western Yunnan. China Environ. Sci. 2021, 41, 3693–3703. [Google Scholar]
- Chen, H.; Wang, Y.; Wang, S. Source apportionment and pollution assessment of heavy metals in farmland soil around Tongshan mining area. Environ. Sci. 2022, 43, 2719–2731. [Google Scholar]
- Cai, L.M.; Wang, Q.S.; Wen, H.H.; Luo, J.; Wang, s. Heavy metals in agricultural soils from a typical township in Guangdong Province, China: Occurrences and spatial distribution. Ecotoxicol. Environ. Safe 2019, 168, 184–191. [Google Scholar] [CrossRef]
- Xia, Z.S.; Bai, Y.R.; Wang, Y.Q.; Gao, X.L.; Ruan, X.H.; Zhong, Y.X. Spatial distribution and source apportionment of soil heavy metals in small watersheds in mountainous areas of southern Ningxia based on PMF model. Environ. Sci. 2022, 43, 432–441. [Google Scholar]
- Tang, J.C.; Wang, M.; Wang, F.; Sun, Q.; Zhou, Q.X. Eco-toxicity of petroleum hydrocarbon contaminated soil. J. Environ. Sci. 2011, 23, 845–851. [Google Scholar] [CrossRef] [PubMed]
- Zeng, J.Q.; Gao, W.Y.; Li, X.; Li, C.X.; Tang, L.; Ke, W.S.; Luo, X.H.; Xue, S.G. Research progress on heavy metal pollution characteristics and remediation of non-ferrous smelting sites. Chin. J. Nonferrous Met. 2023, 33, 3440–3461. [Google Scholar]


| Parameters | Reference Value | |
|---|---|---|
| Child | Adult | |
| Ring (mg·d−1) | 200 | 100 |
| EF(d·a−1) | 350 | 350 |
| ED (a) | 6 | 24 |
| BW (kg) | 15.9 | 56.8 |
| AT (d) | 25,550 (carcinogenic) | 25,550 (carcinogenic) |
| 2190 (non-carcinogenic) | 8760 (non-carcinogenic) | |
| Rinh (m3·d−1) | 7.5 | 14.5 |
| PEF (m3·kg−1) | 1.36 × 10⁹ | 1.36 × 10⁹ |
| SL (mg·(cm2·d) −1) | 0.2 | 0.07 |
| SA (cm2) | 2800 | 5700 |
| ABF (zero dimension) | 0.01 (carcinogenic) | 0.01 (carcinogenic) |
| 0.001 (non-carcinogenic) | 0.001 (non-carcinogenic) | |
| Heavy Metal(loid) | RfD/(mg·(kg·d)−1) | SF/(kg·d)·mg−1) | ||||
|---|---|---|---|---|---|---|
| Oral Intake | Inhalation | Skin Exposure | Oral Intake | Inhalation | Skin Exposure | |
| Cu | 4.00 × 10⁻² | 4.02 × 10⁻² | 1.20 × 10⁻² | - | - | - |
| Zn | 3.00 × 10⁻¹ | 3.00 × 10⁻¹ | 6.00 × 10⁻² | - | - | - |
| Cr | 3.00 × 10⁻³ | 2.86 × 10⁻⁵ | 6.00 × 10⁻⁵ | 0.5 | 42.00 | 20.00 |
| Ni | 2.00 × 10⁻² | 2.06 × 10⁻² | 5.40 × 10⁻³ | 1.70 | 0.84 | 42.50 |
| Pb | 3.50 × 10⁻³ | 3.52 × 10⁻³ | 5.25 × 10⁻⁴ | 8.5 × 10⁻³ | 4.2 × 10⁻² | 1.7 × 10⁻² |
| Cd | 1.00 × 10⁻³ | 1.00 × 10⁻⁵ | 1.00 × 10⁻⁵ | 6.10 | 6.30 | 6.10 |
| As | 3.00 × 10⁻⁴ | 1.23 × 10⁻⁴ | 1.23 × 10⁻⁴ | 1.50 | 15.10 | 3.66 |
| Hg | 3.00 × 10⁻⁴ | 8.57 × 10⁻⁵ | 2.10 × 10⁻⁵ | 0.0003 | 0.0003 | 3 × 10⁻⁷ |
| Parameterization | pH | As | Hg | Cd | Cu | Ni | Pb | |
|---|---|---|---|---|---|---|---|---|
| Sample point of a study area | Min | 2.700 | 2.090 | 0.002 | 0.010 | 3.500 | 3.230 | 4.240 |
| Max | 8.900 | 21,764.000 | 0.364 | 414.000 | 5101.000 | 113.000 | 15,007.000 | |
| Ave | 6.545 | 2210.248 | 0.041 | 21.264 | 318.038 | 34.267 | 286.881 | |
| Median | 7.29 | 105.000 | 0.019 | 2.090 | 64.800 | 37.700 | 63.400 | |
| Comparison point | Min | 5.490 | 1.280 | 0.006 | 0.010 | 10.700 | 43.200 | 5.910 |
| Max | 7.880 | 52.200 | 0.088 | 0.880 | 192.000 | 63.200 | 45.800 | |
| Ave | 6.833 | 23.282 | 0.037 | 0.177 | 52.983 | 51.675 | 28.131 | |
| Median | 6.95 | 19.15 | 0.028 | 0.12 | 39.55 | 49.9 | 27.8 | |
| SD | 4931.624 | 0.063 | 48.047 | 558.125 | 19.434 | 1389.251 | ||
| CV | 2.373 | 1.521 | 2.403 | 1.848 | 0.550 | 5.121 | ||
| Background value for Yunnan Province | 18.400 | 0.058 | 0.218 | 46.300 | 42.500 | 40.600 | ||
| K1 | 120.122 | 0.707 | 97.541 | 6.869 | 0.806 | 7.066 | ||
| Soil background value for China | 9.600 | 0.038 | 0.079 | 20.700 | 24.900 | 23.500 | ||
| K2 | 230.234 | 1.079 | 269.165 | 15.364 | 1.376 | 12.208 | ||
| Screening value (% exceedance) | 13.37 | 0 | 9.63 | 0 | 0 | 2.14 | ||
| Control value (% exceedance) | 47.59 | 0 | 1.07 | 0 | 0 | 1.07 |
| Item | As | Hg | Cr | Cd | Cu | Ni | Pb | ||
|---|---|---|---|---|---|---|---|---|---|
| Buildings | mg·kg−1 | Staff dormitory | 78.8 | 0.007 | <2.00 | 1.08 | 34.7 | 30.6 | 38.9 |
| Timber mill | 89.2 | 0.006 | <2.00 | 0.37 | 43.6 | 54.7 | 50.7 | ||
| Analysis laboratory | 634 | 0.021 | <2.00 | 2.73 | 85.7 | 33.0 | 42.2 | ||
| Workshop | 344 | 0.013 | <2.00 | 3.72 | 140 | 40.2 | 103 | ||
| Residue deposit | 47.5 | 0.010 | <2.00 | 0.81 | 17.2 | 2.73 | 15.9 | ||
| Sedimentation tank | 683 | 0.017 | <2.00 | 12.2 | 188 | 12.4 | 50.9 | ||
| Acid leaching toxicity (mg·L−1) | Standard limit value | 5 | 0.1 | 5 | 1 | 100 | 5 | 5 | |
| Staff dormitory | 0.0925 | <0.00002 | <0.004 | <0.0012 | 0.0125 | <0.0038 | <0.0042 | ||
| Timber mill | 1.339 | <0.00002 | <0.004 | <0.0012 | <0.0025 | <0.0038 | <0.0042 | ||
| Analysis laboratory | 0.0947 | <0.00002 | 0.005 | <0.0012 | <0.0025 | <0.0038 | <0.0042 | ||
| Workshop | 0.0205 | <0.00002 | 0.005 | <0.0012 | 0.0089 | <0.0038 | <0.0042 | ||
| Residue deposit | 0.0019 | <0.00002 | 0.006 | <0.0012 | <0.0025 | <0.0038 | <0.0042 | ||
| Slag | mg·kg−1 | G1 | 9685 | 0.016 | <2 | 16.9 | 426 | 6.84 | 326 |
| G2 | 26,803 | 0.015 | <2 | 72.9 | 1750 | 17 | 357 | ||
| G3 | 17,995 | 0.012 | <2 | 36.1 | 928 | 12 | 294 | ||
| G4 | 23,010 | 0.011 | <2 | 71 | 1518 | 17.7 | 325 | ||
| G5 | 8809 | 0.006 | <2 | 1.68 | 117 | 1.37 | 230 | ||
| Acid leaching toxicity (μg·L−1) | Standard limit value | 5000 | 100 | 5000 | 1000 | 100,000 | 5000 | 5000 | |
| G1 | 35,584 | <0.02 | <0.004 | 832 | 20,053 | 259 | 10.6 | ||
| G2 | 21,946 | <0.02 | <0.004 | 3494 | 57,736 | 732 | 7.5 | ||
| G3 | 16,425 | <0.02 | <0.004 | 1826 | 36,853 | 511 | 17.6 | ||
| G4 | 9450 | <0.02 | <0.004 | 2608 | 26,779 | 546 | 32.1 | ||
| G5 | 6172 | <0.02 | <0.004 | 129 | 2481 | 21.8 | <4.2 | ||
| Item | Parameterization | As | Hg | Cd | Cu | Ni | Pb |
|---|---|---|---|---|---|---|---|
| Single-factor index (percentage of each sample, %) | Uncontaminated | 39.037 | 100 | 89.305 | 100 | 100 | 96.791 |
| Light pollution | 12.299 | 0 | 9.091 | 0 | 0 | 2.139 | |
| medium pollution | 4.278 | 0 | 0.535 | 0 | 0 | 0 | |
| High pollution | 44.385 | 0 | 1.070 | 0 | 0 | 1.070 | |
| Single-factor exponential distribution values | Max | 362.733 | 0.010 | 6.369 | 0.283 | 0.126 | 18.759 |
| Min | 0.035 | 5.3 × 10⁻⁵ | 0.0002 | 0.0002 | 0.004 | 0.005 | |
| Avg | 36.837 | 0.001 | 0.327 | 0.018 | 0.038 | 0.359 | |
| PN | 257.810 | 0.007 | 4.510 | 0.201 | 0.090 | 13.327 | |
| Pollution degree | High pollution | Uncontaminated | High pollution | Uncontaminated | Uncontaminated | High pollution |
| Heavy Metal(loid) | ADDing | ADDinh | ADDderm | ADD | |||||
|---|---|---|---|---|---|---|---|---|---|
| Adult | Child | Adult | Child | Adult | Child | Adult | Child | ||
| Non-carcinogenic | As | 0.0037 | 0.0267 | 3.98 × 10⁻⁷ | 7.35 × 10⁻⁷ | 1.49 × 10⁻⁵ | 7.46 × 10⁻⁵ | 3.75 × 10⁻³ | 2.67 × 10⁻² |
| Hg | 6.99 × 10⁻⁸ | 4.99 × 10⁻⁷ | 7.45 × 10⁻¹² | 1.38 × 10⁻¹¹ | 2.79 × 10⁻¹⁰ | 1.40 × 10⁻⁹ | 7.02 × 10⁻⁸ | 5.01 × 10⁻⁷ | |
| Cd | 3.59 × 10⁻⁵ | 0.0003 | 3.83 × 10⁻⁹ | 7.07 × 10⁻⁹ | 1.43 × 10⁻⁷ | 7.18 × 10⁻⁷ | 3.60 × 10⁻⁵ | 2.57 × 10⁻⁴ | |
| Cu | 0.0005 | 0.0038 | 5.72 × 10⁻⁸ | 1.06 × 10⁻⁷ | 2.14 × 10⁻⁶ | 1.07 × 10⁻⁵ | 5.39 × 10⁻⁴ | 3.85 × 10⁻³ | |
| Ni | 5.96 × 10⁻⁵ | 0.0004 | 6.17 × 10⁻⁹ | 1.14 × 10⁻⁸ | 2.31 × 10⁻⁷ | 1.16 × 10⁻⁶ | 5.99 × 10⁻⁵ | 4.14 × 10⁻⁴ | |
| Pb | 0.0005 | 0.0035 | 5.16 × 10⁻⁸ | 9.54 × 10⁻⁸ | 1.93 × 10⁻⁶ | 9.69 × 10⁻⁶ | 4.86 × 10⁻⁴ | 3.47 × 10⁻³ | |
| ADD | 0.0048 | 0.0346 | 5.17 × 10⁻⁷ | 9.55 × 10⁻⁷ | 1.93 × 10⁻⁵ | 9.70 × 10⁻⁵ | 4.87 × 10⁻³ | 3.47 × 10⁻² | |
| Carcinogenic | As | 0.0013 | 0.0023 | 1.36 × 10⁻⁷ | 6.30 × 10⁻⁸ | 5.10 × 10⁻⁵ | 6.40 × 10⁻⁵ | 1.33 × 10⁻³ | 2.35 × 10⁻³ |
| Hg | 2.40 × 10⁻⁸ | 4.28 × 10⁻⁸ | 2.55 × 10⁻¹² | 1.18 × 10⁻¹² | 9.56 × 10⁻¹⁰ | 1.20 × 10⁻⁹ | 2.49 × 10⁻⁸ | 4.40 × 10⁻⁸ | |
| Cd | 1.23 × 10⁻⁵ | 2.20 × 10⁻⁵ | 1.31 × 10⁻⁹ | 6.06 × 10⁻¹⁰ | 4.91 × 10⁻⁷ | 6.16 × 10⁻⁷ | 1.28 × 10⁻⁵ | 2.26 × 10⁻⁵ | |
| Cu | 0.0002 | 0.0003 | 1.96 × 10⁻⁸ | 9.07 × 10⁻⁹ | 7.34 × 10⁻⁶ | 9.21 × 10⁻⁶ | 1.91 × 10⁻⁴ | 3.38 × 10⁻⁴ | |
| Ni | 1.98 × 10⁻⁵ | 3.54 × 10⁻⁵ | 2.11 × 10⁻⁹ | 9.77 × 10⁻¹⁰ | 7.91 × 10⁻⁷ | 9.92 × 10⁻⁷ | 2.06 × 10⁻⁵ | 3.64 × 10⁻⁵ | |
| Pb | 0.0002 | 0.0003 | 1.77 × 10⁻⁸ | 8.18 × 10⁻⁹ | 6.63 × 10⁻⁶ | 8.30 × 10⁻⁶ | 1.73 × 10⁻⁴ | 3.05 × 10⁻⁴ | |
| ADD | 0.0017 | 0.0030 | 1.77 × 10⁻⁷ | 8.18 × 10⁻⁸ | 6.63 × 10⁻⁵ | 8.31 × 10⁻⁵ | 1.73 × 10⁻³ | 3.05 × 10⁻³ | |
| Heavy Metal(loid) | CRing | CRinh | CRderm | TCR | ||||||
|---|---|---|---|---|---|---|---|---|---|---|
| Adult | Child | Adult | Child | Adult | Child | Adult | Child | |||
| Carcinogenic | As | Min | 1.81 × 10⁻⁶ | 3.24 × 10⁻⁶ | 1.95 × 10⁻⁹ | 9.00 × 10⁻¹⁰ | 1.77 × 10⁻⁷ | 2.21 × 10⁻⁷ | 1.99 × 10⁻⁶ | 3.46 × 10⁻⁶ |
| Max | 0.0189 | 0.0338 | 2.03 × 10⁻⁵ | 9.37 × 10⁻⁶ | 0.0018 | 0.0023 | 0.0208 | 0.0361 | ||
| Avg | 0.0019 | 0.0034 | 2.06 × 10⁻⁶ | 9.51 × 10⁻⁷ | 0.0002 | 0.0002 | 0.0021 | 0.0037 | ||
| Hg | Min | 3.47 × 10⁻¹³ | 6.20 × 10⁻¹³ | 3.70 × 10⁻¹⁷ | 1.71 × 10⁻¹⁷ | 1.39 × 10⁻¹⁷ | 1.74 × 10⁻¹⁷ | 3.47 × 10⁻¹³ | 6.20 × 10⁻¹³ | |
| Max | 6.32 × 10⁻¹¹ | 1.13 × 10⁻¹⁰ | 6.74 × 10⁻¹⁵ | 3.11 × 10⁻¹⁵ | 2.52 × 10⁻¹⁵ | 3.16 × 10⁻¹⁵ | 6.32 × 10⁻¹¹ | 1.13 × 10⁻¹⁰ | ||
| Avg | 7.19 × 10⁻¹² | 1.28 × 10⁻¹¹ | 7.66 × 10⁻¹⁶ | 3.54 × 10⁻¹⁶ | 2.87 × 10⁻¹⁶ | 3.59 × 10⁻¹⁶ | 7.19 × 10⁻¹² | 1.28 × 10⁻¹¹ | ||
| Cd | Min | 3.53 × 10⁻⁸ | 6.31 × 10⁻⁸ | 3.89 × 10⁻¹² | 1.80 × 10⁻¹² | 1.41 × 10⁻⁹ | 1.77 × 10⁻⁹ | 3.67 × 10⁻⁸ | 6.48 × 10⁻⁸ | |
| Max | 0.0015 | 0.0026 | 1.61 × 10⁻⁷ | 7.44 × 10⁻⁸ | 5.83 × 10⁻⁵ | 7.31 × 10⁻⁵ | 0.0015 | 0.0027 | ||
| Avg | 7.51 × 10⁻⁵ | 0.0001 | 8.27 × 10⁻⁹ | 3.82 × 10⁻⁹ | 3.00 × 10⁻⁶ | 3.75 × 10⁻⁶ | 7.80 × 10⁻⁵ | 0.0001 | ||
| Cu | Min | - | - | - | - | - | - | |||
| Max | - | - | - | - | - | - | ||||
| Avg | - | - | - | - | - | - | ||||
| Ni | Min | 3.18 × 10⁻⁶ | 5.68 × 10⁻⁶ | 1.67 × 10⁻¹⁰ | 7.73 × 10⁻¹¹ | 3.17 × 10⁻⁶ | 3.97 × 10⁻⁶ | 3.97 × 10⁻⁶ | 9.65 × 10⁻⁶ | |
| Max | 0.0001 | 0.0002 | 5.86 × 10⁻⁹ | 2.71 × 10⁻⁹ | 0.0001 | 0.0001 | 0.0001 | 0.0003 | ||
| Avg | 3.37 × 10⁻⁵ | 6.02 × 10⁻⁵ | 1.78 × 10⁻⁹ | 8.21 × 10⁻¹⁰ | 3.36 × 10⁻⁵ | 4.35 × 10⁻⁵ | 4.21 × 10⁻⁵ | 0.0001 | ||
| Pb | Min | 2.09 × 10⁻⁸ | 3.73 × 10⁻⁸ | 1.10 × 10⁻¹¹ | 5.08 × 10⁻¹² | 1.66 × 10⁻⁹ | 2.09 × 10⁻⁹ | 2.25 × 10⁻⁸ | 3.94 × 10⁻⁸ | |
| Max | 7.38 × 10⁻⁵ | 0.0001 | 3.89 × 10⁻⁸ | 1.80 × 10⁻⁸ | 5.89 × 10⁻⁶ | 7.39 × 10⁻⁶ | 7.98 × 10⁻⁵ | 0.0001 | ||
| Avg | 1.41 × 10⁻⁶ | 2.52 × 10⁻⁶ | 7.44 × 10⁻¹⁰ | 3.43 × 10⁻¹⁰ | 1.13 × 10⁻⁷ | 1.41 × 10⁻⁷ | 1.52 × 10⁻⁶ | 2.66 × 10⁻⁶ | ||
| Heavy metal(loid) | HQing | HQinh | HQd × 10rm | HI | ||||||
| Adult | Child | Adult | Child | Adult | Child | Adult | Child | |||
| Non-carcinogenic | As | Min | 0.0118 | 0.0840 | 1.14 × 10⁻⁴ | 5.65 × 10⁻⁶ | 7.01 × 10⁻⁵ | 0.0006 | 0.0119 | 0.0846 |
| Max | 122.4741 | 875.0352 | 1.1919 | 0.0588 | 1.1919 | 5.9759 | 124.8579 | 881.0699 | ||
| Avg | 12.4379 | 88.8644 | 0.1210 | 0.0060 | 0.1138 | 0.6069 | 12.6728 | 89.4773 | ||
| Hg | Min | 1.13 × 10⁻⁵ | 8.04 × 10⁻⁵ | 4.20 × 10⁻⁹ | 7.76 × 10⁻⁹ | 6.42 × 10⁻⁷ | 3.22 × 10⁻⁶ | 1.19 × 10⁻⁵ | 8.36 × 10⁻⁵ | |
| Max | 0.0020 | 0.0146 | 7.64 × 10⁻⁷ | 1.41 × 10⁻⁶ | 0.0001 | 0.0006 | 0.0022 | 0.0152 | ||
| Avg | 0.0002 | 0.0017 | 8.69 × 10⁻⁸ | 1.61 × 10⁻⁷ | 1.33 × 10⁻⁵ | 6.66 × 10⁻⁵ | 0.0002 | 0.0017 | ||
| Cd | Min | 1.69 × 10⁻⁵ | 0.0001 | 1.80 × 10⁻⁷ | 3.33 × 10⁻⁷ | 6.74 × 10⁻⁶ | 3.38 × 10⁻⁵ | 2.38 × 10⁻⁵ | 0.0002 | |
| Max | 0.6989 | 4.9935 | 0.0075 | 0.0138 | 0.2789 | 1.3982 | 0.9852 | 6.4055 | ||
| Avg | 0.0359 | 0.2565 | 0.0004 | 0.0007 | 0.0143 | 0.0718 | 0.0506 | 0.3290 | ||
| Cu | Min | 0.0001 | 0.0011 | 1.57 × 10⁻⁸ | 2.90 × 10⁻⁸ | 1.96 × 10⁻⁶ | 9.85 × 10⁻⁶ | 0.0001 | 0.0011 | |
| Max | 0.2153 | 1.5382 | 2.28 × 10⁻⁵ | 4.22 × 10⁻⁵ | 0.0029 | 0.0144 | 0.2182 | 1.5526 | ||
| Avg | 0.0134 | 0.0959 | 1.42 × 10⁻⁶ | 2.63 × 10⁻⁶ | 0.0002 | 0.0009 | 0.0136 | 0.0968 | ||
| Ni | Min | 0.0003 | 0.0019 | 2.82 × 10⁻⁸ | 5.21 × 10⁻⁸ | 4.03 × 10⁻⁶ | 2.02 × 10⁻⁵ | 0.0003 | 0.0020 | |
| Max | 0.0095 | 0.0681 | 9.87 × 10⁻⁷ | 1.82 × 10⁻⁶ | 0.0001 | 0.0007 | 0.0097 | 0.0689 | ||
| Avg | 0.0030 | 0.0207 | 2.99 × 10⁻⁷ | 5.53 × 10⁻⁷ | 4.27 × 10⁻⁵ | 0.0002 | 0.0030 | 0.0209 | ||
| Pb | Min | 0.0020 | 0.0146 | 2.17 × 10⁻⁷ | 4.01 × 10⁻⁷ | 5.44 × 10⁻⁵ | 0.0003 | 0.0021 | 0.0149 | |
| Max | 7.2386 | 51.7171 | 0.0008 | 0.0014 | 0.1925 | 0.9654 | 7.4319 | 52.6839 | ||
| Avg | 0.1384 | 0.9886 | 1.47 × 10⁻⁵ | 2.71 × 10⁻⁵ | 0.0037 | 0.0185 | 0.1421 | 1.0071 | ||
| As | Hg | Cd | Cu | Ni | Pb | |
|---|---|---|---|---|---|---|
| As | 1 | |||||
| Hg | 0.122 | 1 | ||||
| Cd | 0.893 ** | 0.153 * | 1 | |||
| Cu | 0.902 ** | 0.101 | 0.899 ** | 1 | ||
| Ni | −0.471 ** | 0.214 ** | −0.493 ** | −0.367 ** | 1 | |
| Pb | 0.759 ** | 0.376 ** | 0.760 ** | 0.777 ** | −0.309 ** | 1 |
| Element | Component | ||
|---|---|---|---|
| PC1 | PC2 | PC3 | |
| Eigenvalue | 3.382 | 1.116 | 1.093 |
| Variance (%) | 56.372 | 18.605 | 18.216 |
| As | 0.925 | 0.038 | −0.243 |
| Hg | 0.106 | 0.977 | 0.123 |
| Cd | 0.911 | 0.078 | −0.280 |
| Cu | 0.968 | −0.004 | −0.103 |
| Ni | −0.268 | 0.129 | 0.954 |
| Pb | 0.822 | 0.372 | −0.142 |
Disclaimer/Publisher’s Note: The statements, opinions and data contained in all publications are solely those of the individual author(s) and contributor(s) and not of MDPI and/or the editor(s). MDPI and/or the editor(s) disclaim responsibility for any injury to people or property resulting from any ideas, methods, instructions or products referred to in the content. |
© 2024 by the authors. Licensee MDPI, Basel, Switzerland. This article is an open access article distributed under the terms and conditions of the Creative Commons Attribution (CC BY) license (https://creativecommons.org/licenses/by/4.0/).
Share and Cite
Luo, W.; Wei, P.; Zhang, Y.; Sun, C. Soil Heavy Metal(loid) Pollution Evaluation, Risk Assessment, and Source Analysis of a Mineral Processing Plant. Sustainability 2024, 16, 5271. https://doi.org/10.3390/su16125271
Luo W, Wei P, Zhang Y, Sun C. Soil Heavy Metal(loid) Pollution Evaluation, Risk Assessment, and Source Analysis of a Mineral Processing Plant. Sustainability. 2024; 16(12):5271. https://doi.org/10.3390/su16125271
Chicago/Turabian StyleLuo, Wenping, Pingtang Wei, Yan Zhang, and Chengshuai Sun. 2024. "Soil Heavy Metal(loid) Pollution Evaluation, Risk Assessment, and Source Analysis of a Mineral Processing Plant" Sustainability 16, no. 12: 5271. https://doi.org/10.3390/su16125271
APA StyleLuo, W., Wei, P., Zhang, Y., & Sun, C. (2024). Soil Heavy Metal(loid) Pollution Evaluation, Risk Assessment, and Source Analysis of a Mineral Processing Plant. Sustainability, 16(12), 5271. https://doi.org/10.3390/su16125271