Article

Human Activities Have Altered Sediment Transport in the Yihe River, the Longest River Originating from Shandong Province, China

1
College of Geography and Environment, Shandong Normal University, Jinan 250358, China
2
Hydrology Bureau (Information Center) of Huaihe River Commission, Bengbu 233001, China
*
Authors to whom correspondence should be addressed.
Sustainability 2024, 16(13), 5396; https://doi.org/10.3390/su16135396
Submission received: 23 April 2024 / Revised: 27 May 2024 / Accepted: 19 June 2024 / Published: 25 June 2024
(This article belongs to the Topic Advances in Hydrogeological Research)

Abstract

:
Climate change and human activities affect regional sediment transport and ecological environment construction. Investigating sediment transport and its influencing factors in the Yihe River Basin (YHRB) will provide guidance for regional soil and water conservation and sustainable development. We analyzed the chronological changes, cycles, spatial distribution and influencing factors using Mann–Kendall (M-K) trend analysis, wavelet analysis, and the Pettitt mutation point (PMP) test, then quantified the role of precipitation and human activities in sediment transport changes. The results showed that annual precipitation decreased marginally, whereas sediment load has noticeably declined. Four precipitation cycles were observed: 4–8a, 9–14a, 16–19a, and 20–28a, where 9–14a was dominant; sediment transport cycles were tracked: 3–5a, 9–15a, and 30a, where 30a was dominant with a decreasing trend. The sediment load was higher in the central, northern, and southwestern sub-basins of the YHRB, while it was lower in the southeast. The contribution of human activities and precipitation changes to sediment transport was 73.14% and 26.86% in transitional phase I (1965–1980) and 71.97% and 28.03% in transitional phase II (1981–2020), respectively. Hydraulic engineering construction, water resource development, land-use changes, and soil and water conservation measures intercepted precipitation and sediment, making them the primary factor affecting sediment transport changes in the YHRB.

1. Introduction

The alteration of sediment load is a crucial component of hydrological processes and is of great significance to regional water and soil resources, food security, and ecosystem functions [1]. Climate change predominantly affects sediment delivery under natural conditions [2]. Moreover, in recent decades, human activities have accelerated the changes in river sediment loads. According to statistics, nearly 50% of the 142 representative rivers in the world show a decreasing trend in sediment load [2]. Based on the China Water Resources Bulletin, the total annual sediment load from the 35 major river stations in China in 2020 was 4.77 × 10⁸ t, which was 67% lower than the average annual sediment load over the past decades. Nonetheless, owing to regional and scale differences, the degree of influence of climate change and human activities on sediment delivery in basins varies between regions. Wang and Shi identified precipitation as the primary driver of changes in the sediment load in the Yellow River Basin (YRB) prior to 1968 [3]. Chen and Wang discovered that human activities have been the main instigators of the significant decline in annual sediment load in the upper course of the Yangtze River over the last 60 years [4]. Wu et al. confirmed that human activities, including deforestation, reservoir construction, and soil and water conservation, significantly affected the sediment load in the Pearl River Basin [5]. Ye et al. identified changes in sediment load in the Tarim River, largely owing to climate change; certain tributaries showed an increase, whereas others showed a decrease in sediment load [6]. However, the knowledge of to what degree human activities influence sediment transport is still lacking.
Variations in sediment transport trends, series abruptness, the quantitative contribution of influencing factors, and future forecasting are critical areas within hydrological research [7]. Studies addressing sediment loads in basins typically employ the Mann–Kendall (M-K) test [8], sliding t-test [9], wavelet analysis [10], and Pettitt mutation point (PMP) test [11] for determining the trend characteristics of sediment load changes, mutation points, and cycling patterns. Changes in sediment load can usually be determined by empirical statistical methods, such as double cumulative curves (DCCs) [12], cumulative slope change [13], elasticity coefficient [14], and other empirical statistical methods, as well as distributed hydrological models, such as the Soil and Water Assessment Tool (SWAT) [15], New Split-Parameter Structure Used in Distributed (TETIS) models [16], and Sediment Delivery Distributed (SEDD) [17] models. Among these, the M-K trend analysis is extensively employed for the trend analysis of hydrological elements [18] and aids in revealing the characteristics of hydrological series, such as the periodic fluctuation, energy magnitude, and mutation [10]. Conversely, the PMP test is better at identifying the mutation points of hydrological time series [19,20,21]. Empirical statistical methods, such as the DCC method, can be used to effectively identify the contribution of human activities and precipitation to water-sediment changes. The aforementioned approaches are the simplest, most intuitive, and widespread methods currently applied to the analysis of trends and attribution of hydrological elements in long series [12].
The Yihe River Basin (YHRB) is an important part of the Huaihe River Basin (HRB). It is located in the hilly area of central and southern Lu, with low vegetation cover, loose and shallow soil, heavy rainfall, and serious soil erosion, making it an area with the most severe water erosion in China. It is also a key area for soil erosion control in the National Soil and Water Conservation Plan of China. Nevertheless, how human activities influenced the sediment transport in the YHRB is still unknown. In particular, a series of government soil and water conservation policies have been implemented from the 1990s to the 21st century. These policies are bound to have an impact on the YHRB’s sediment transport. Therefore, the main research objectives of this study are to (1) analyze the characteristics of intra-annual and cyclical changes in sediment transport, as well as its inter-annual trends and spatial variations; (2) analyze the human activities affecting the changes in sediment transport; and (3) quantify the contribution of human activities to the changes in sediment transport during different periods in the YHRB. The results can improve knowledge of how human activities impact on sediment transport in the YHRB, as well as mountainous rivers with serious soil erosion similar to the YHRB in the world.

2. Materials and Methods
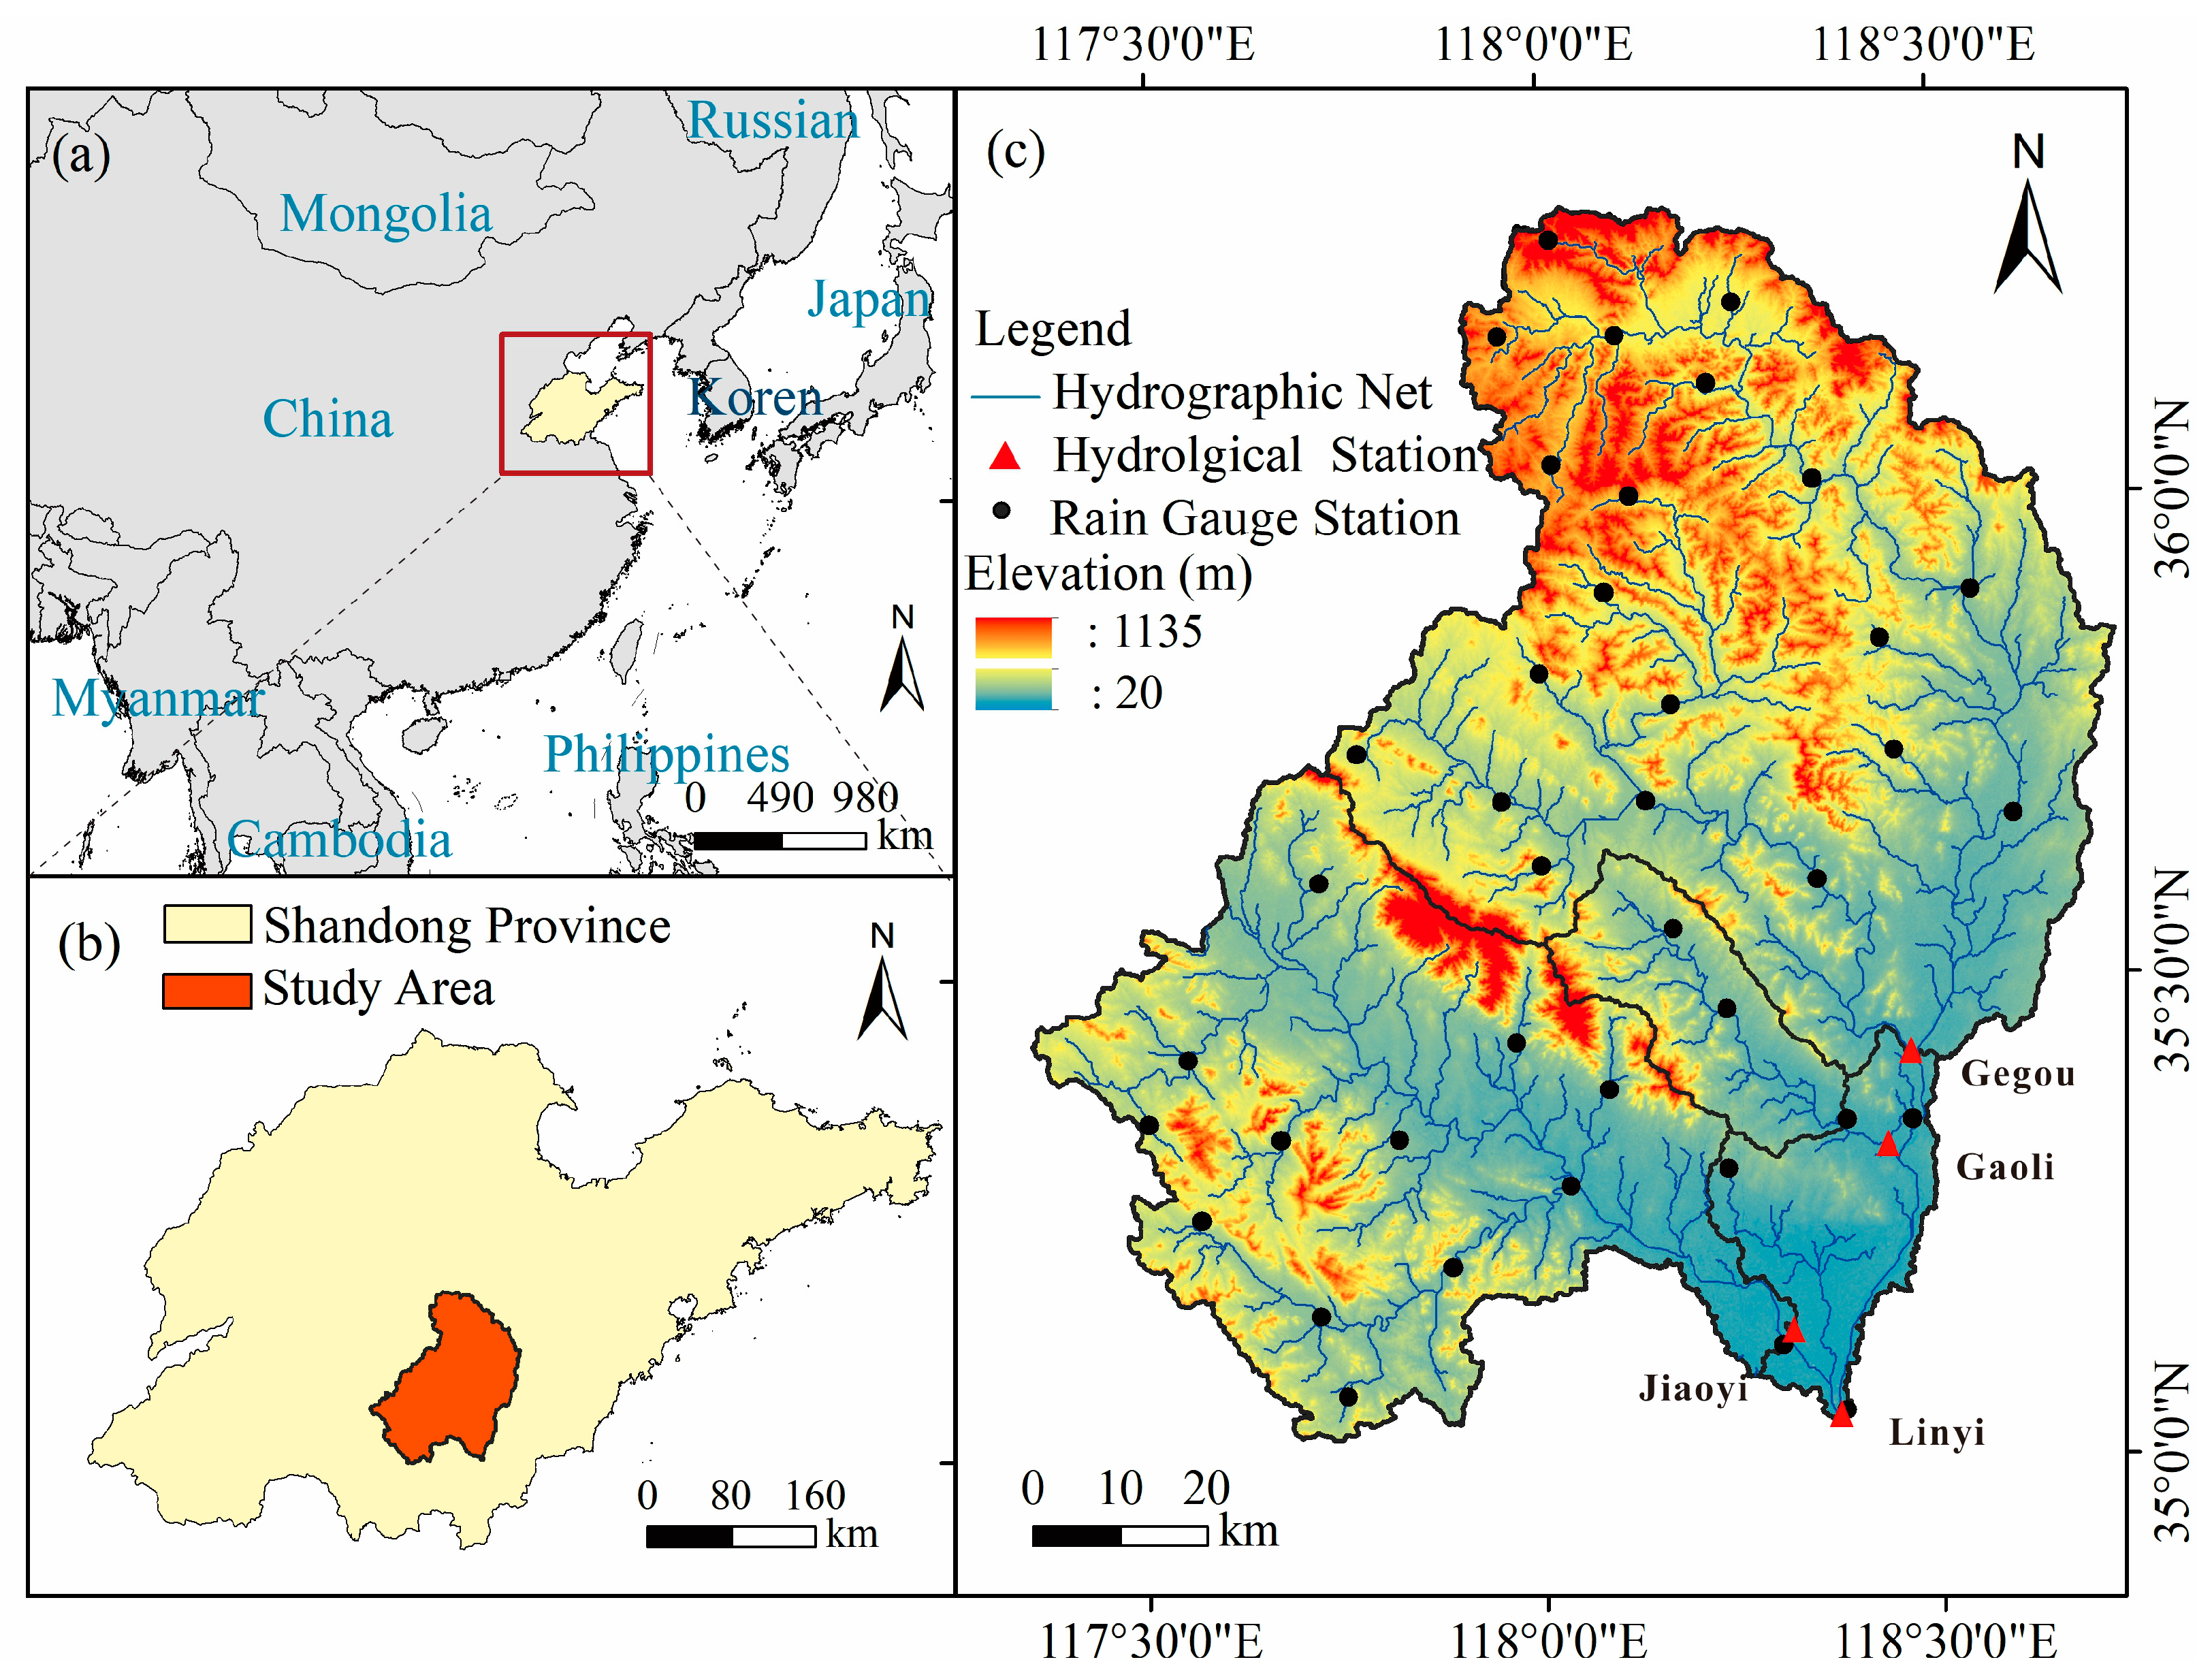
2.1. Study Area

The Yihe River originates from the southern foot of the Lushan Mountains in Yiyuan County. It is the longest river in Shandong Province and flows into Luo Ma Lake in Jiangsu Province from north to south. It has a total length of 500 km and a basin area of 17,325 km2. The YHRB in this study refers to the part above the Linyi Hydrological Station, which is located between 33°30′–36°20′ N and 117°25′–119°49′ E, with an area of approximately 10,026.43 km2 (Figure 1). The terrain in the basin is high in the northwest and low in the southeast, with mountains and hills as the main areas, and plains and valleys on both sides of the river. The climate is a warm temperate continental monsoon climate, with an average precipitation of 815 mm, concentrated in summer and autumn. The basin has a dense water network with many tributaries, mainly distributed on the right side of the main stream, with short and rapid sources, such as the Dongwen, Meng, and Beng Rivers. The main types of soil are coarse bone soil and brown soil. Coarse bone soil is shallow and thin with high gravel content, making the soil relatively infertile. There are 40 rain gauge stations and four hydrological stations in the basin. The four hydrological stations are Linyi, Gegou, Jiaoyi, and Gaoli, with Linyi being the hydrological control station at the basin outlet.

2.2. Data Sources

Monthly precipitation and sediment load data from 1956 to 2020 were obtained from the hydrological data of the HRB. The reservoir capacity and other data for the basin were mainly derived from the Compendium of Large and Medium-sized Reservoir Registration Data of Shandong Province and the Statistical Yearbook of Water Resources of Shandong Province (http://wr.shandong.gov.cn/ (accessed on 1 May 2021)). Data on water consumption in the basin were obtained from the Linyi Water Resource Bulletin (https://slj.linyi.gov.cn/xxgk/tjsj.htm (accessed on 22 June 2021)), the Zibo Water Resource Bulletin (https://sl.zibo.gov.cn/ (accessed on 1 March 2022)), and other sources. Data on soil and water conservation management in the basin were mainly obtained from the Linyi Water Resource Bureau (https://slj.linyi.gov.cn/dt/xqss/247.htm (accessed on 20 June 2021)), Zibo Water Resource Bureau (https://sl.zibo.gov.cn/ (accessed on 1 Mar 2022)), and other relevant departments. Base information on land use was interpreted from the relevant year’s remote sensing images using the original Multispectral Scanner (MSS) imagery (United States Geological Survey, https://www.usgs.gov/ (accessed on 10 June 2022)) at a spatial resolution of 40 m, with data from 1995 to 2020 being acquired using Landsat TM/ETM+ (Geospatial Data Cloud, http://www.gscloud.cn/ (accessed on 15 July 2022)) at a spatial resolution of 30 m.

2.3. Methods

2.3.1. Mann–Kendall Trend Analysis

The M-K trend analysis is widely used for trend analysis of time series of precipitation, runoff, temperature, and other elements, and is a widely used non-parametric test. Assuming that H0 is the time-series data, x1, …, xn are independent samples with the same distribution of random variables; the alternative hypothesis H1 is a bilateral test, for all i, jn, and ij; the distributions of xi and xj are not the same; and the statistic of the test, S, is calculated using the following equation [8]:
S = i = 2 n j = 1 i 1 s i g n x i x j
Z c = S 1 / V a r S , S > 0 0 , S = 0 S + 1 / V a r S , S < 0
V a r S = n n 1 2 n + 5 / 18
where xi and xj are the sample data values, n is the sample capacity, and sign (xixj) is 1, 0, and −1, respectively, based on the positivity or negativity of (xixj). At a given α confidence level, the original hypothesis H0 is accepted if Zc ≤ |Z1a/2| and rejected if Zc ≥ |Z1a/2|. Positive and negative values of Zc indicate that the trend of the series is increasing or decreasing, respectively; |Zc| values ≥ 1.64, 1.96, and 2.58 indicate that they pass the test of significance at 90, 95, and 99%, respectively.

2.3.2. Wavelet Analysis

Wavelet analysis is used to fragment the hydrological time series into low- and high-frequency ranges through scale [10]. The Morlet wavelet, an intricate variant of the wavelet, boasts advantages over its real form in applications, offering effective resolution of oscillations during transformations and enabling the separation of modes and phases. It is often employed in hydrological and climatological research [10]. The mathematical equation is as follows:
W f a , b = a 1 2 R f t Ψ ¯ t b a d t
where Wf(a,b) is the wavelet transform coefficient, f(t) is a signal or square-integrable function, a is the telescoping scale, b is a translation parameter, and Ψ ¯ t     b a is a complex conjugate function. Positive values of the real part of the wavelet coefficients indicate periods of abundance, negative values indicate periods of dryness, and zero values indicate turning points from periods of abundance to dryness, or from dryness to periods of abundance.
Integrating the squared values of the wavelet transform coefficients over the b-domain yields the wavelet variance, which varies with the scale a:
v a r a = + W f a , b 2 d b
where var(a) is the wavelet variance, and W f   a , b 2 d b is the integration of the squared values of the wavelet transform coefficients over the b-domain.

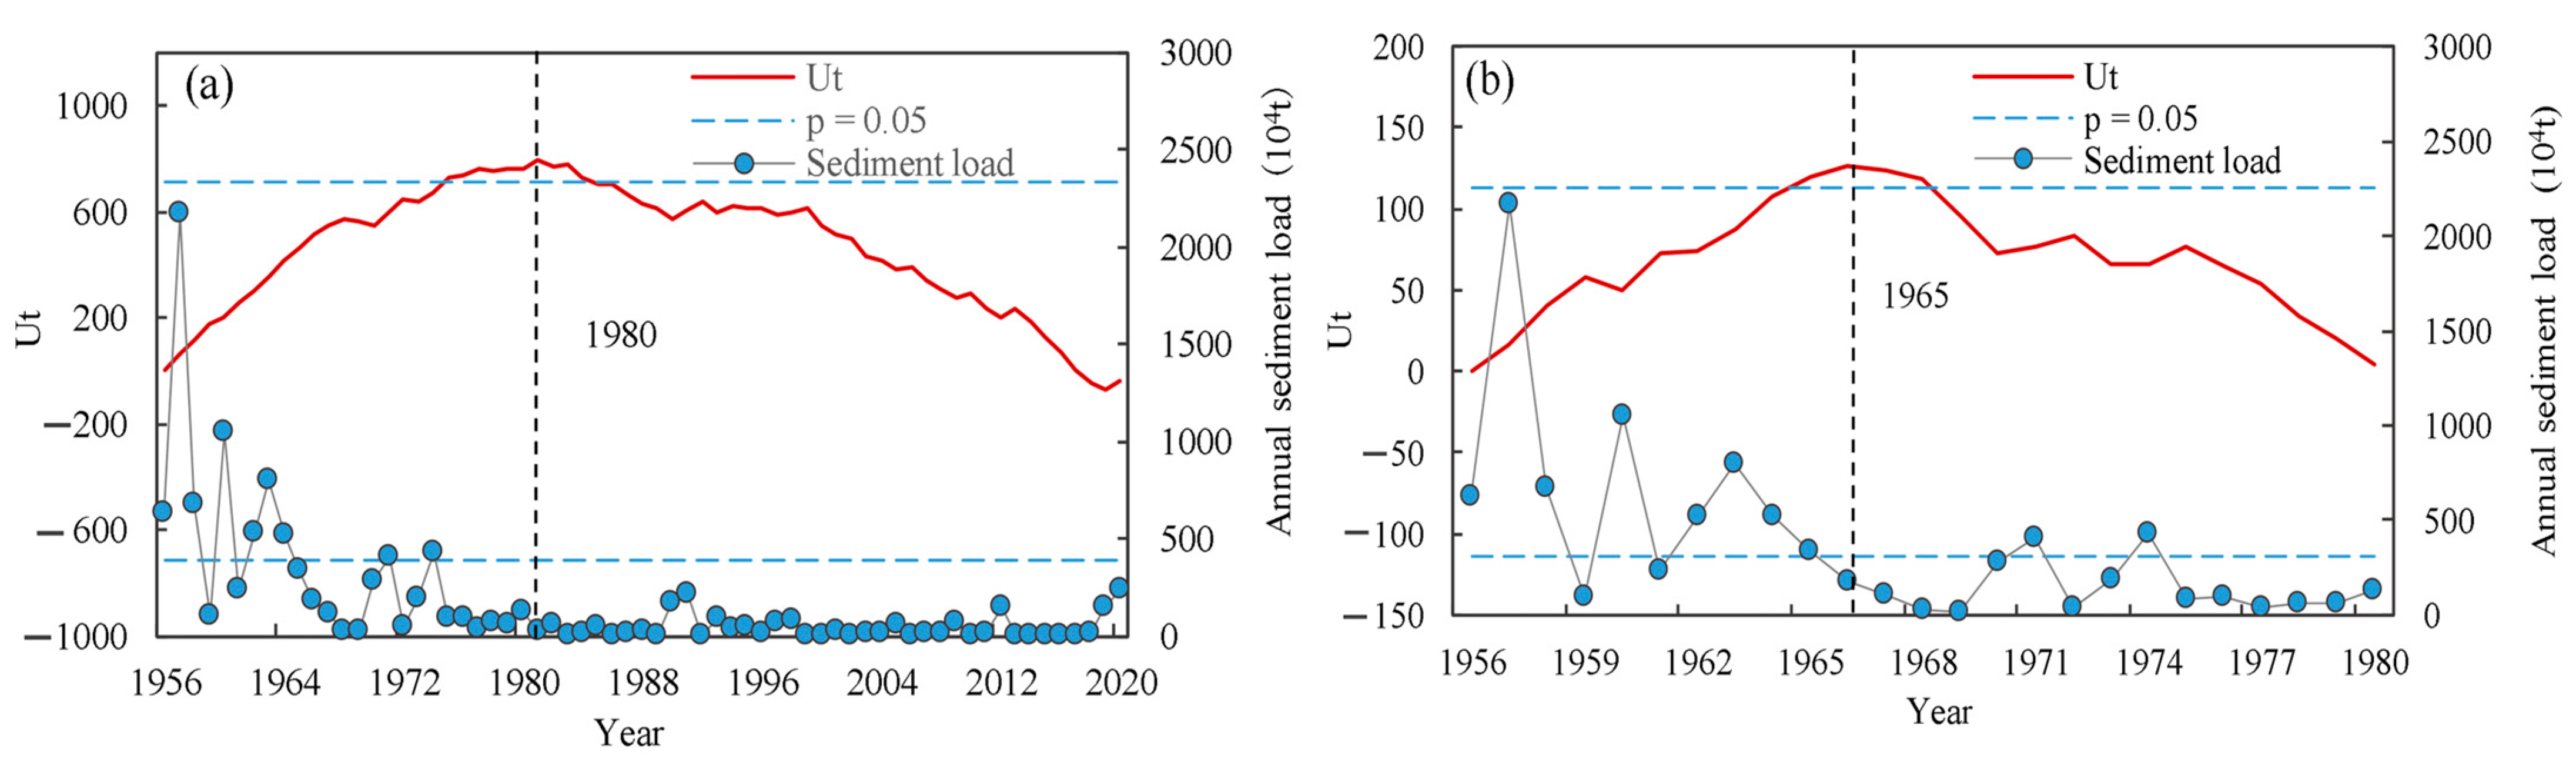
2.3.3. Pettitt Mutation Point Test

The PMP test employs the Mann–Whitney non-parametric test for the mutation analysis of hydrometeorological variables, yielding mutation points that quantify their significance [19]. The original (H0) and alternative (H1) hypotheses of the PMP test were as follows: no mutation occurs at time t in the time series of hydrometeorological elements, and a mutation occurs at time t in the time series of hydrometeorological elements, respectively. For the hydrometeorological element time series x = (x1, …, xn), the mutation point is assumed to be xt such that the original time series can be divided into two parts: x1, x2, …, xt and xt+1, xt+2, …, xn. For the possible occurrence time t of the mutation point, the statistic Ut,n is defined as follows [21]:
U t , n = U t 1 , n + i = 1 n s g n x t x i       t = 2 ,   3 ,   ,   n
For time t at which a mutation point may occur, the statistic Kt is defined to determine the most likely mutation point:
K t , n = m a x U t , n
where 1 ≤ tn, and the significance level Pt is calculated using the following equation after determining the mutation point according to Equation (7):
P t = 2 e x p 6 K t , n 2 / n 3 + n 2
For a given confidence level α, if Pt > α, the original hypothesis is accepted, and no significant mutation occurs at time t. If Pt < α, the original hypothesis is rejected, and a significant mutation occurs at time t. In general, a mutation point is considered to be present in the data when Pt ≤ 0.05.

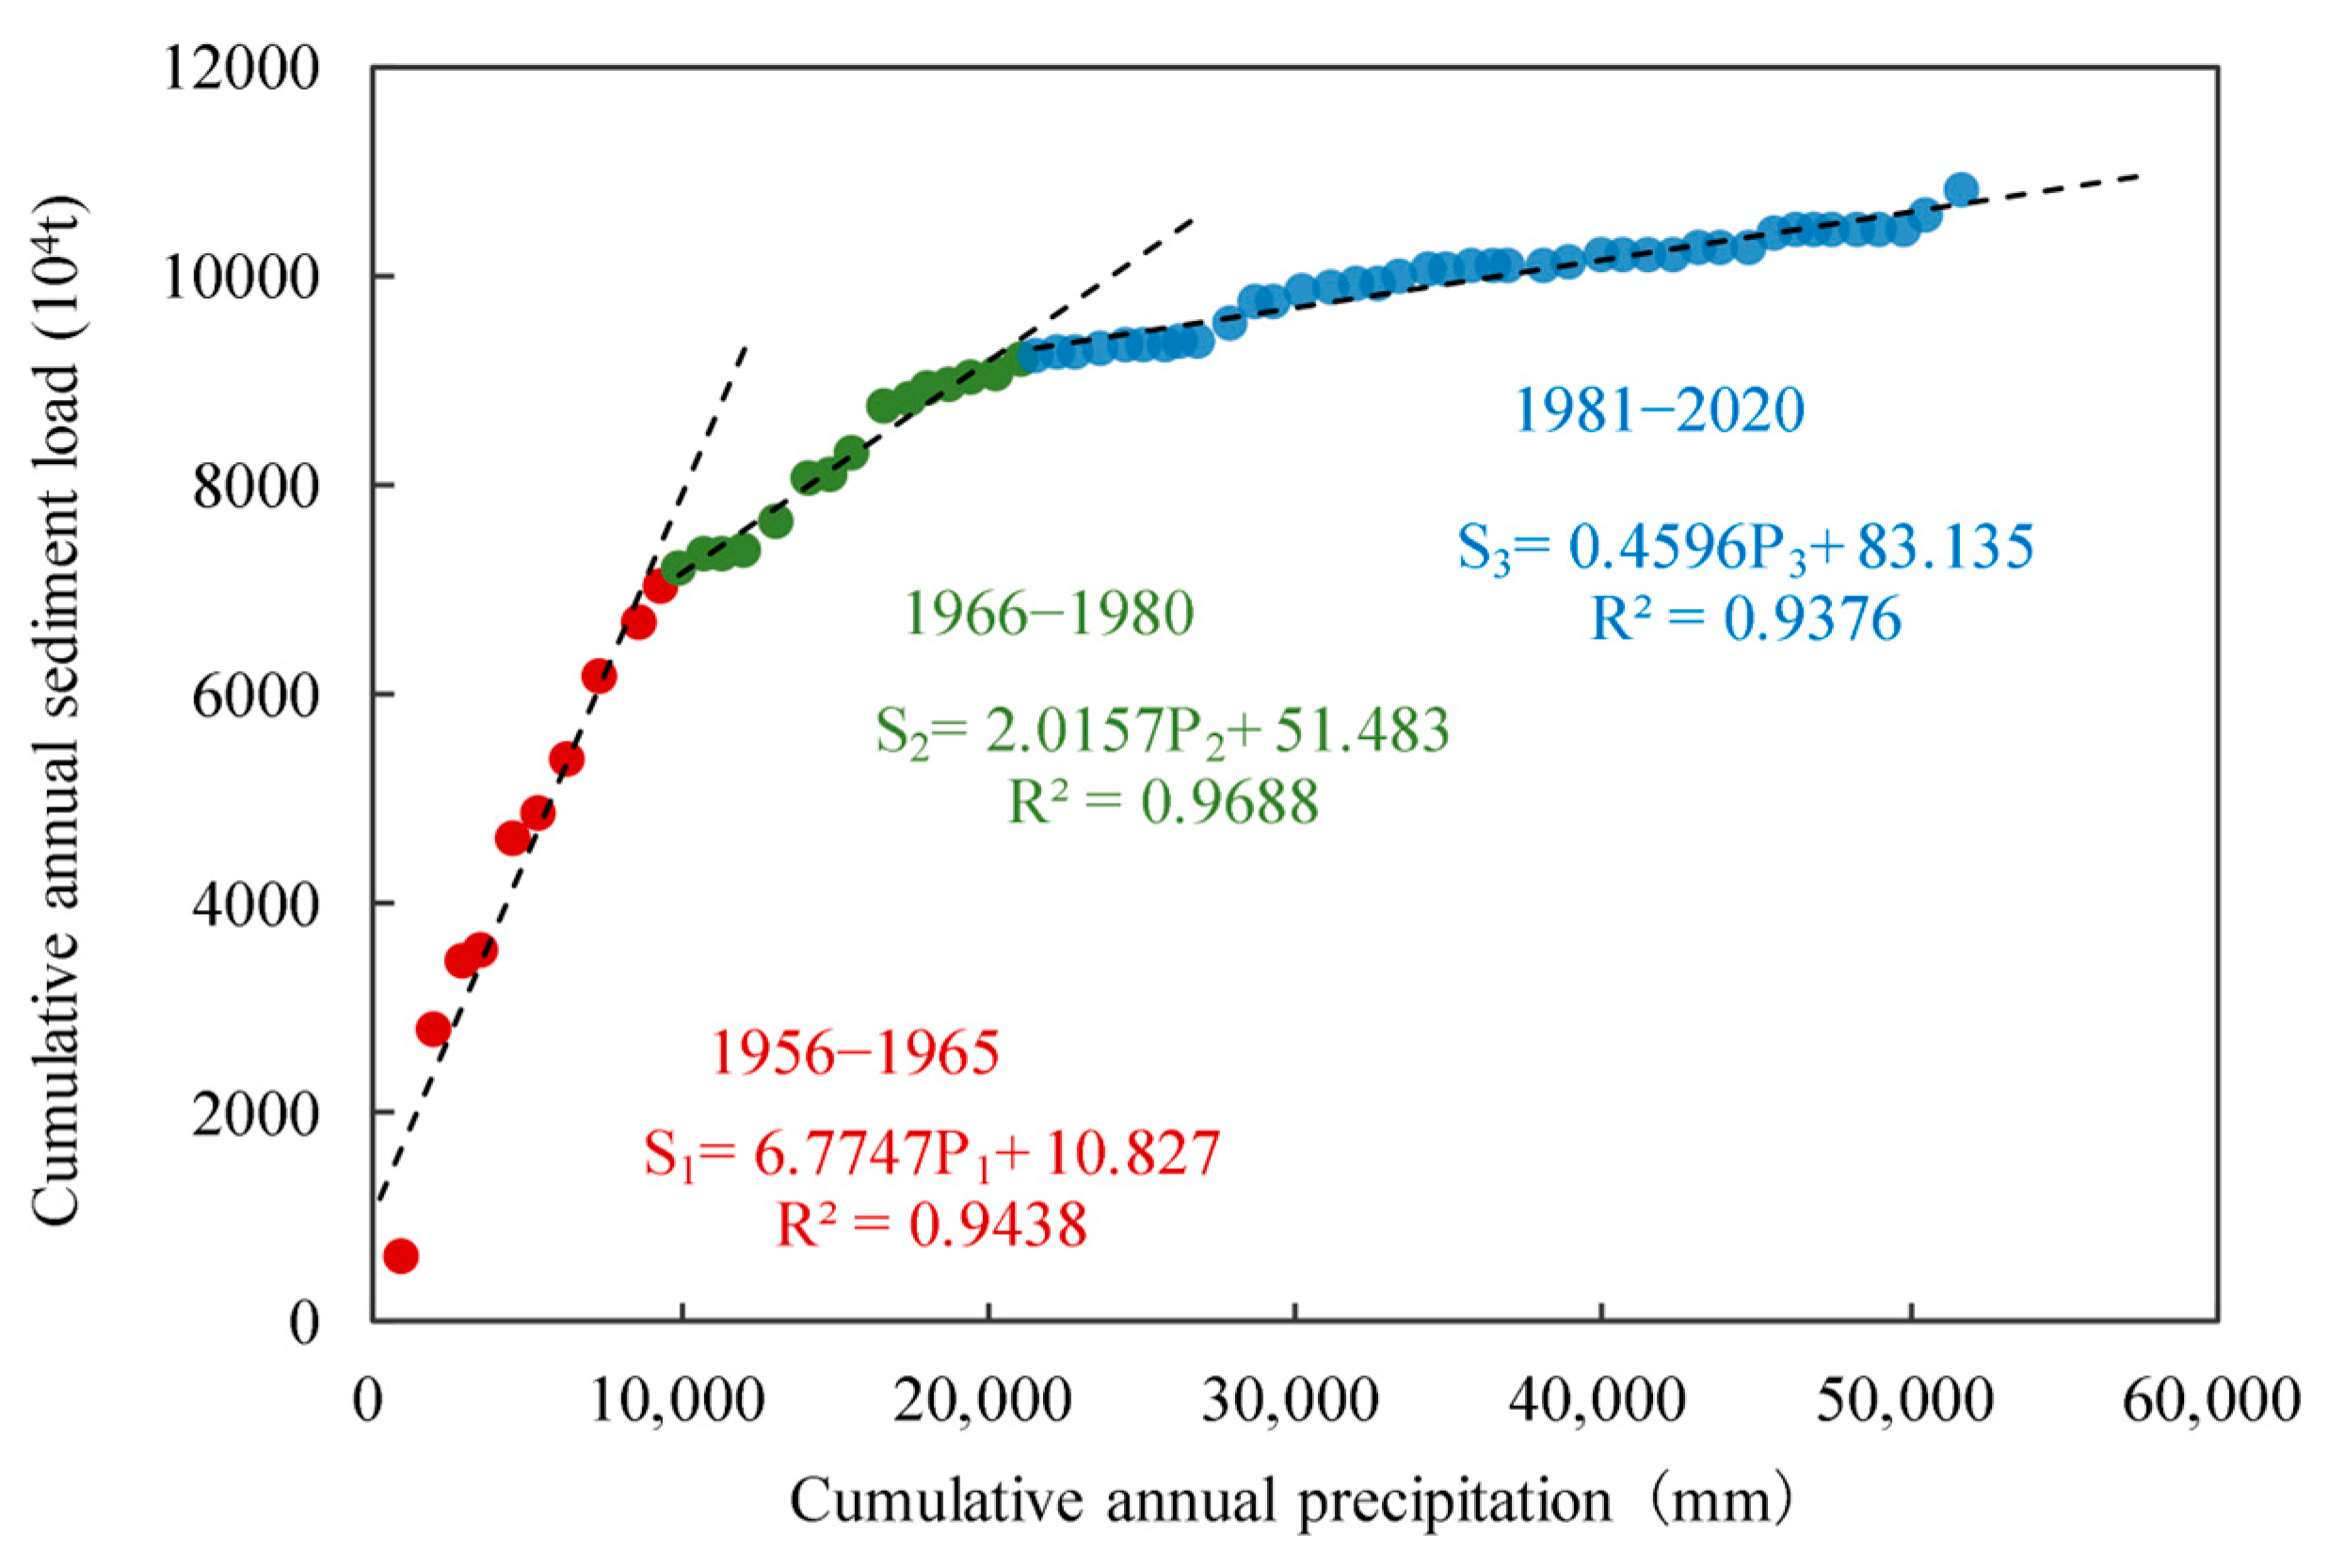
2.3.4. Double Cumulative Curves

DCCs are a common method to test the consistency of the relationship between two parameters and their changes; they can be used to test the consistency of hydrometeorological elements, interpolate missing values, correct data, and analyze trend changes of hydrometeorological elements and their intensity [12].
The basic method of building a DCC is as follows: Two variables are used, namely, X (reference or baseline variable) and Y (tested variable), with observations Xi and Yi over an observation period of n years, where i = 1, 2, 3, …, n. First, the respective cumulative values of variables X and Y are calculated in a year-wise manner to obtain the new year-wise cumulative series X′i and Y′i, where i = 1, 2, 3, …, n, namely:
X i = i n X i , Y i = i n Y i
We plotted the relationship between the cumulative values of the two variables at corresponding points in a right-angled coordinate system. In general, when plotting the graphs, the vertical (Y-axis) and horizontal (X-axis) coordinates represent the variable being tested and reference or benchmark variable, respectively.

3. Results and Analysis

3.1. Temporal Variations in Precipitation and Sediment Load

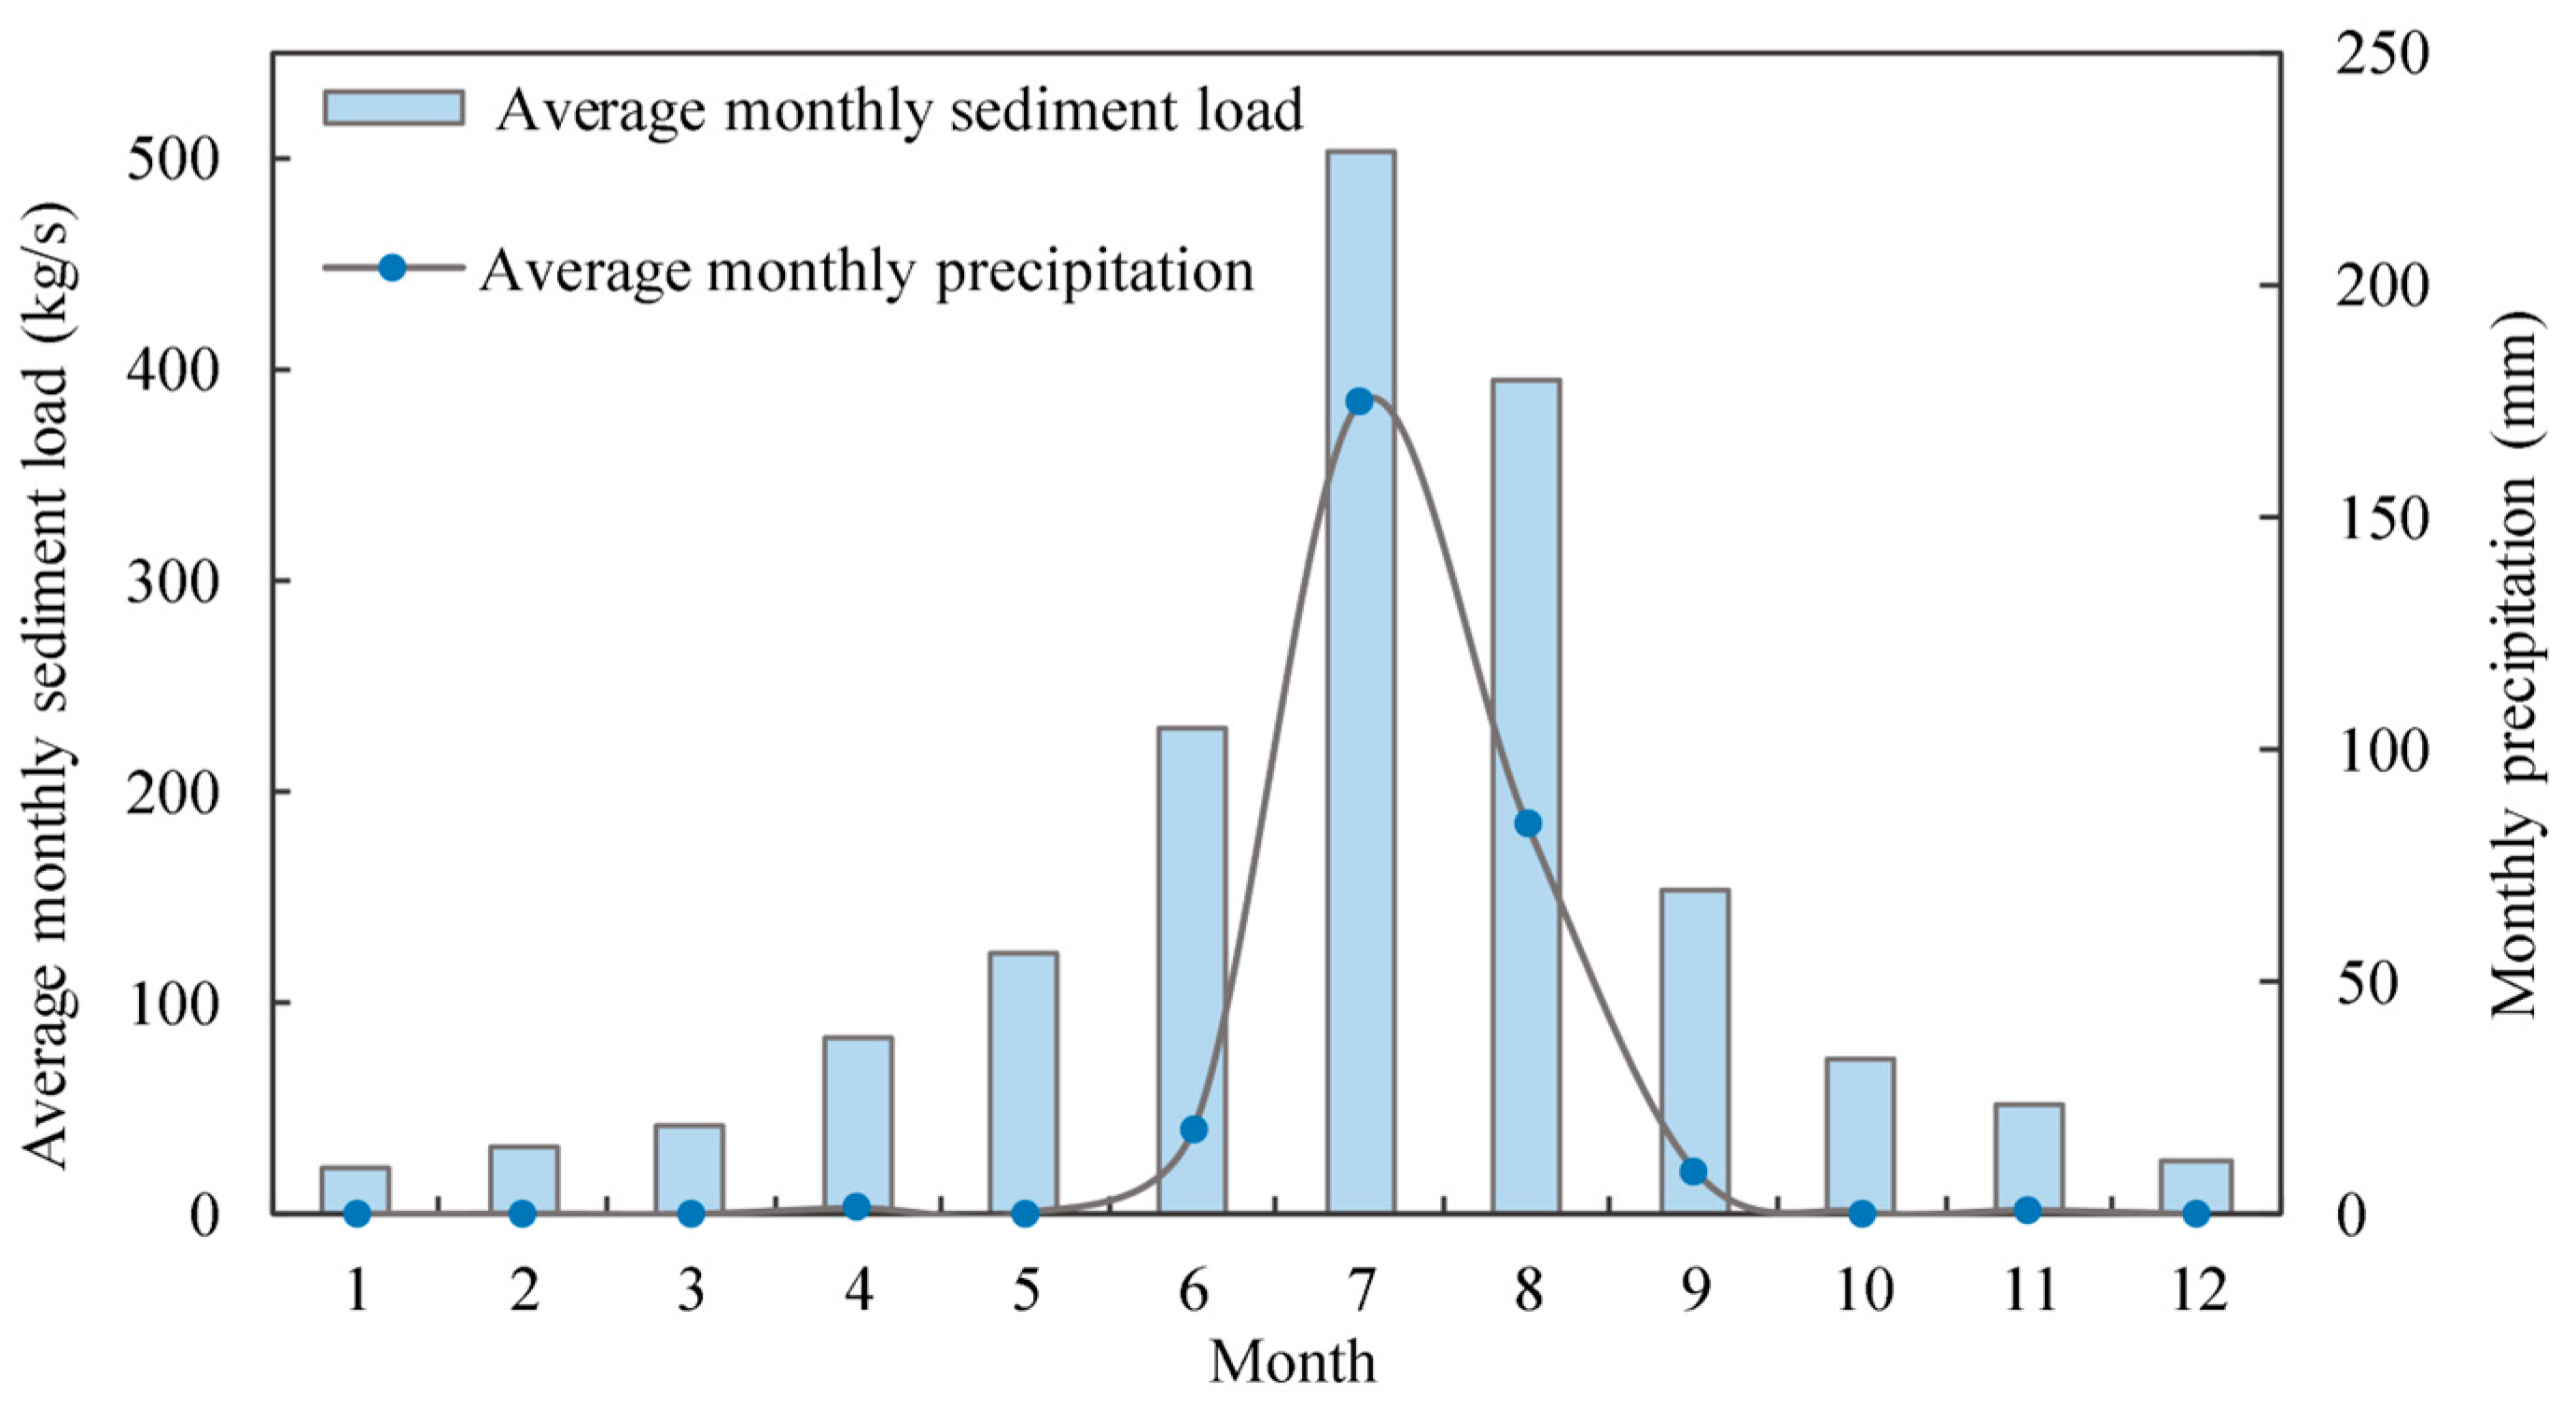
3.1.1. Characteristics of Intra-Annual Variability in Precipitation and Sediment Load

The intra-annual distributions of precipitation and sediment load in the YHRB were uneven, with large seasonal differences mainly concentrated in summer and autumn (Figure 2). The average monthly precipitation and sediment load were 65.72 mm and 52.92 kg/s, with peaks in July, at 228.44 mm and 384.11 kg/s, representing 28.97 and 60.48% of total annual precipitation and sediment load, respectively. The coefficients of variation of the average monthly precipitation and sediment load were both greater than 1, indicating strong variation. The average monthly precipitation and sediment load in summer and autumn were significantly higher than in winter and spring, and the average monthly precipitation and sediment load in June and August accounted for 64.91 and 95.77% of the total annual precipitation and sediment load, respectively. The proportions of average monthly precipitation and sediment load in other months were small; in particular, the sediment load was less than 5% of that in the entire year. Additionally, the phenomenon of “water without sediment” was observed during some months.

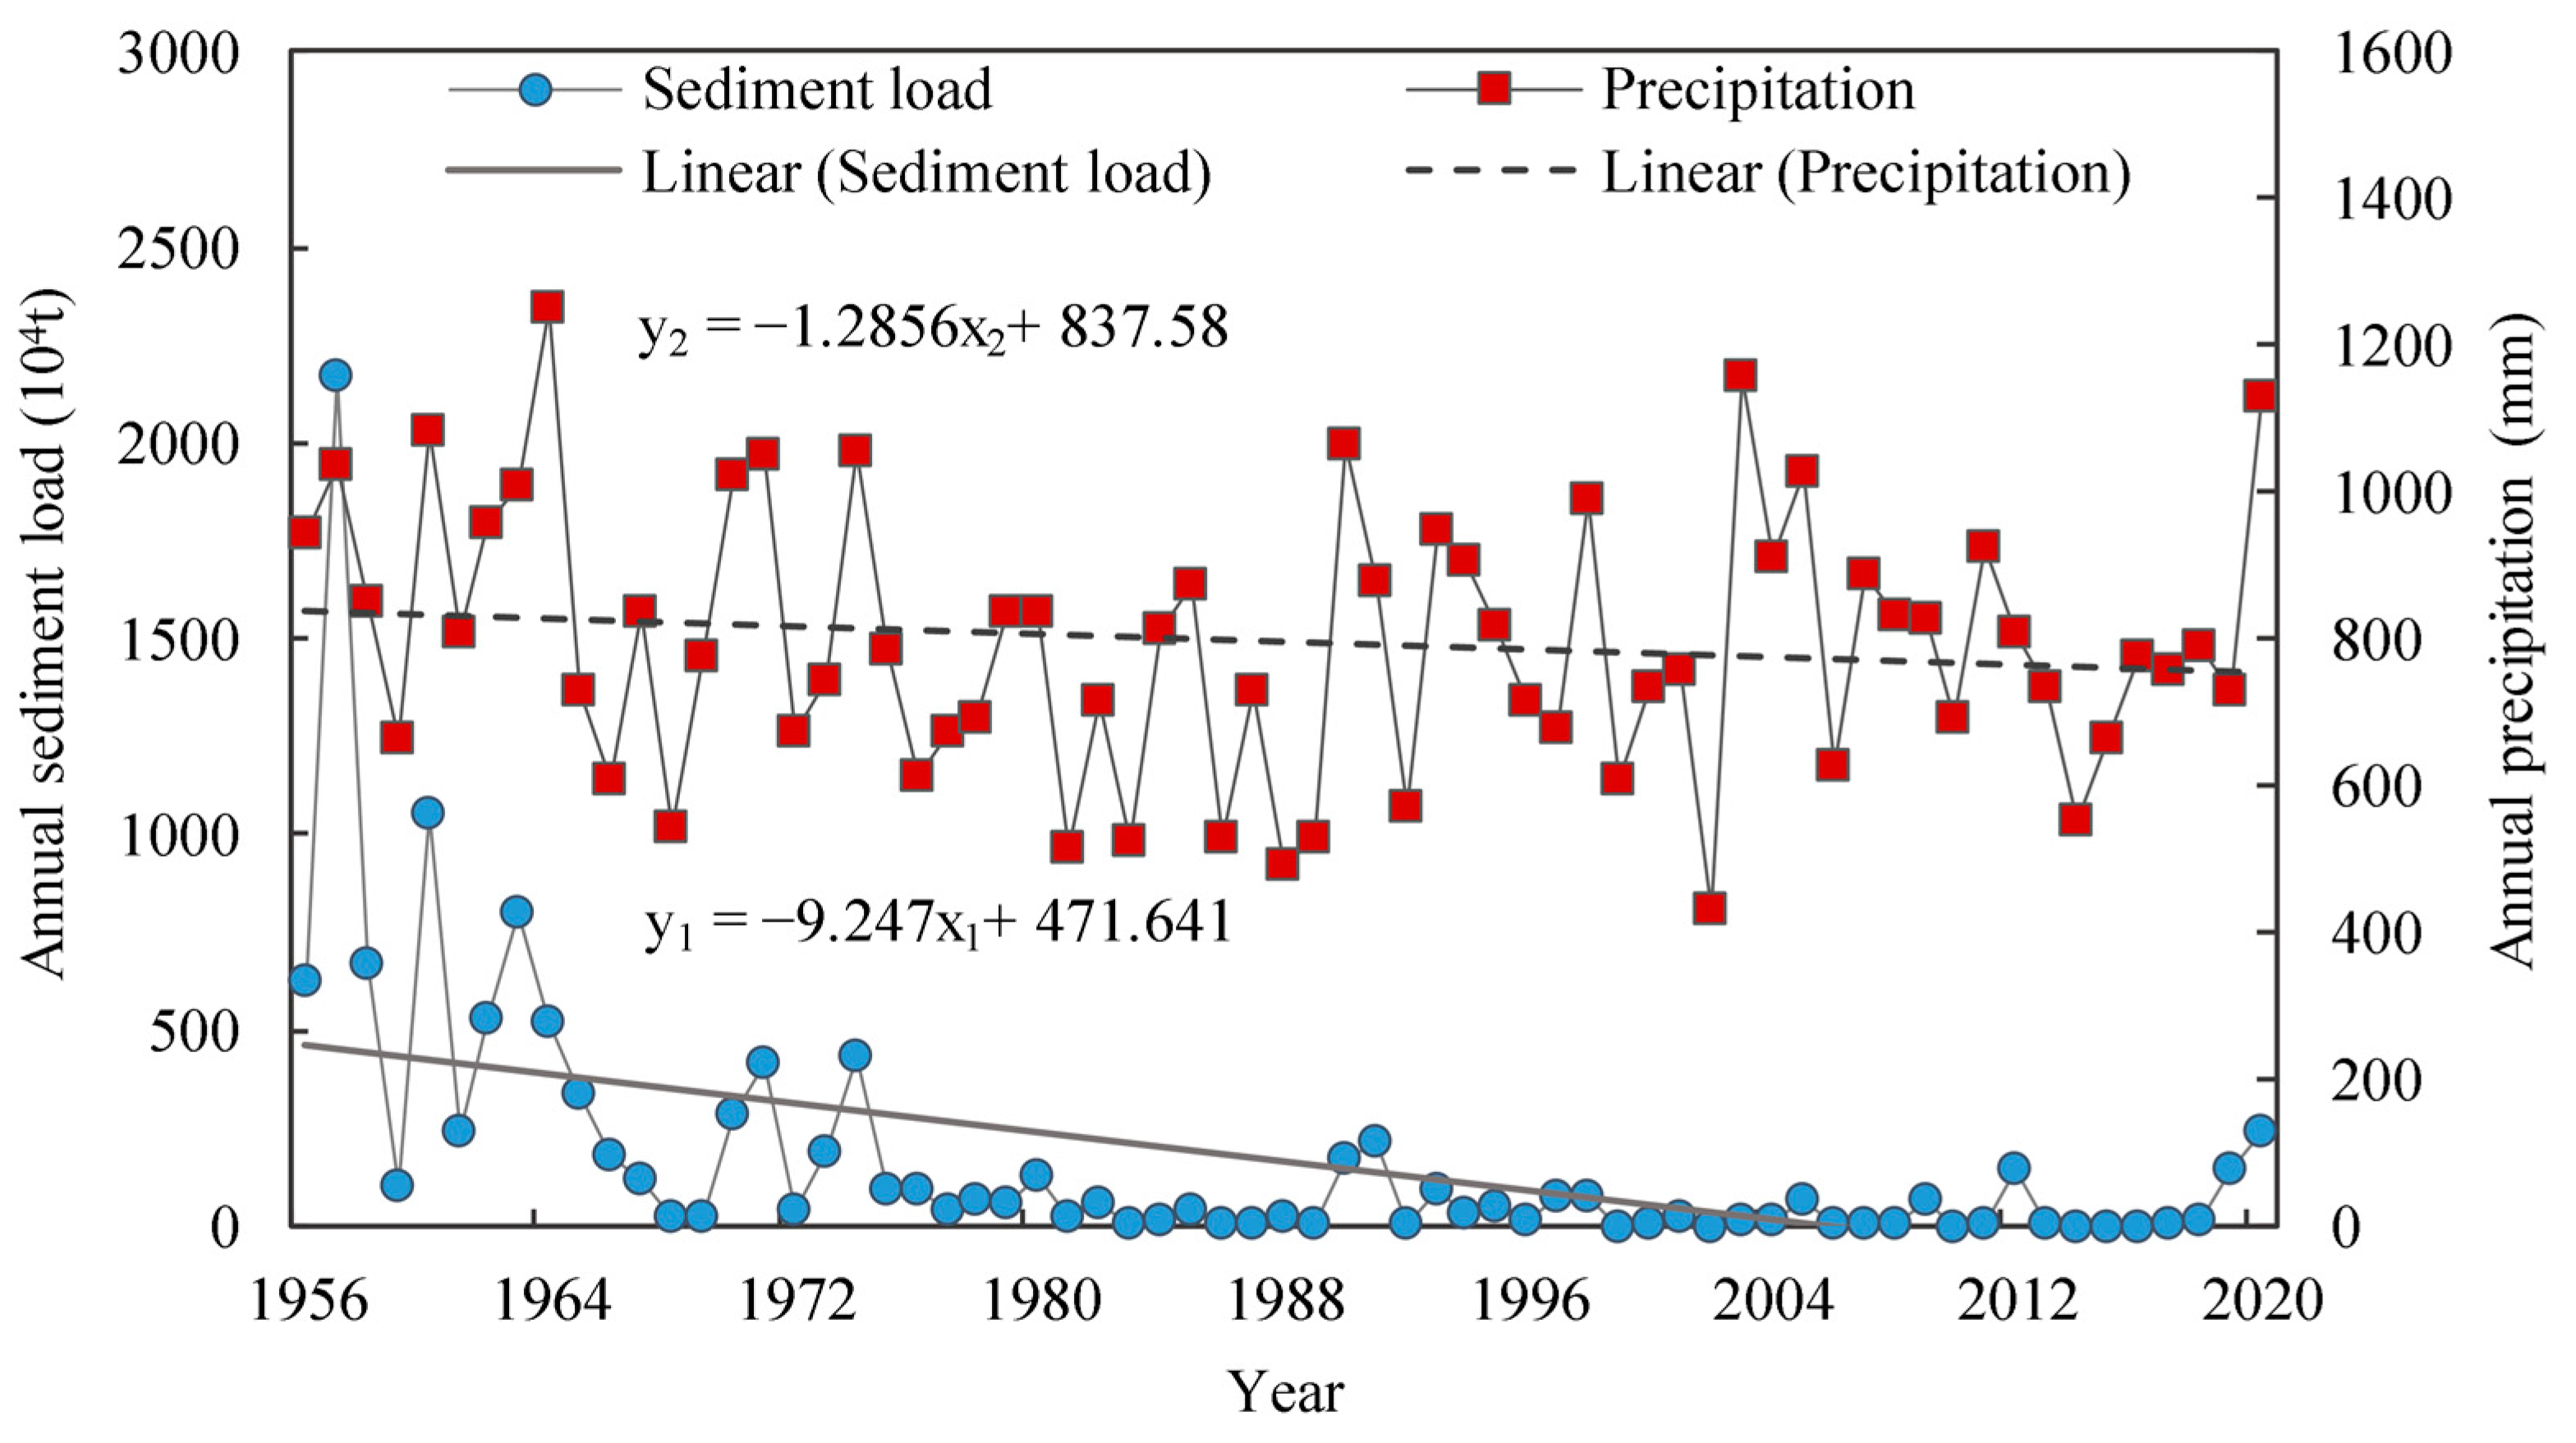
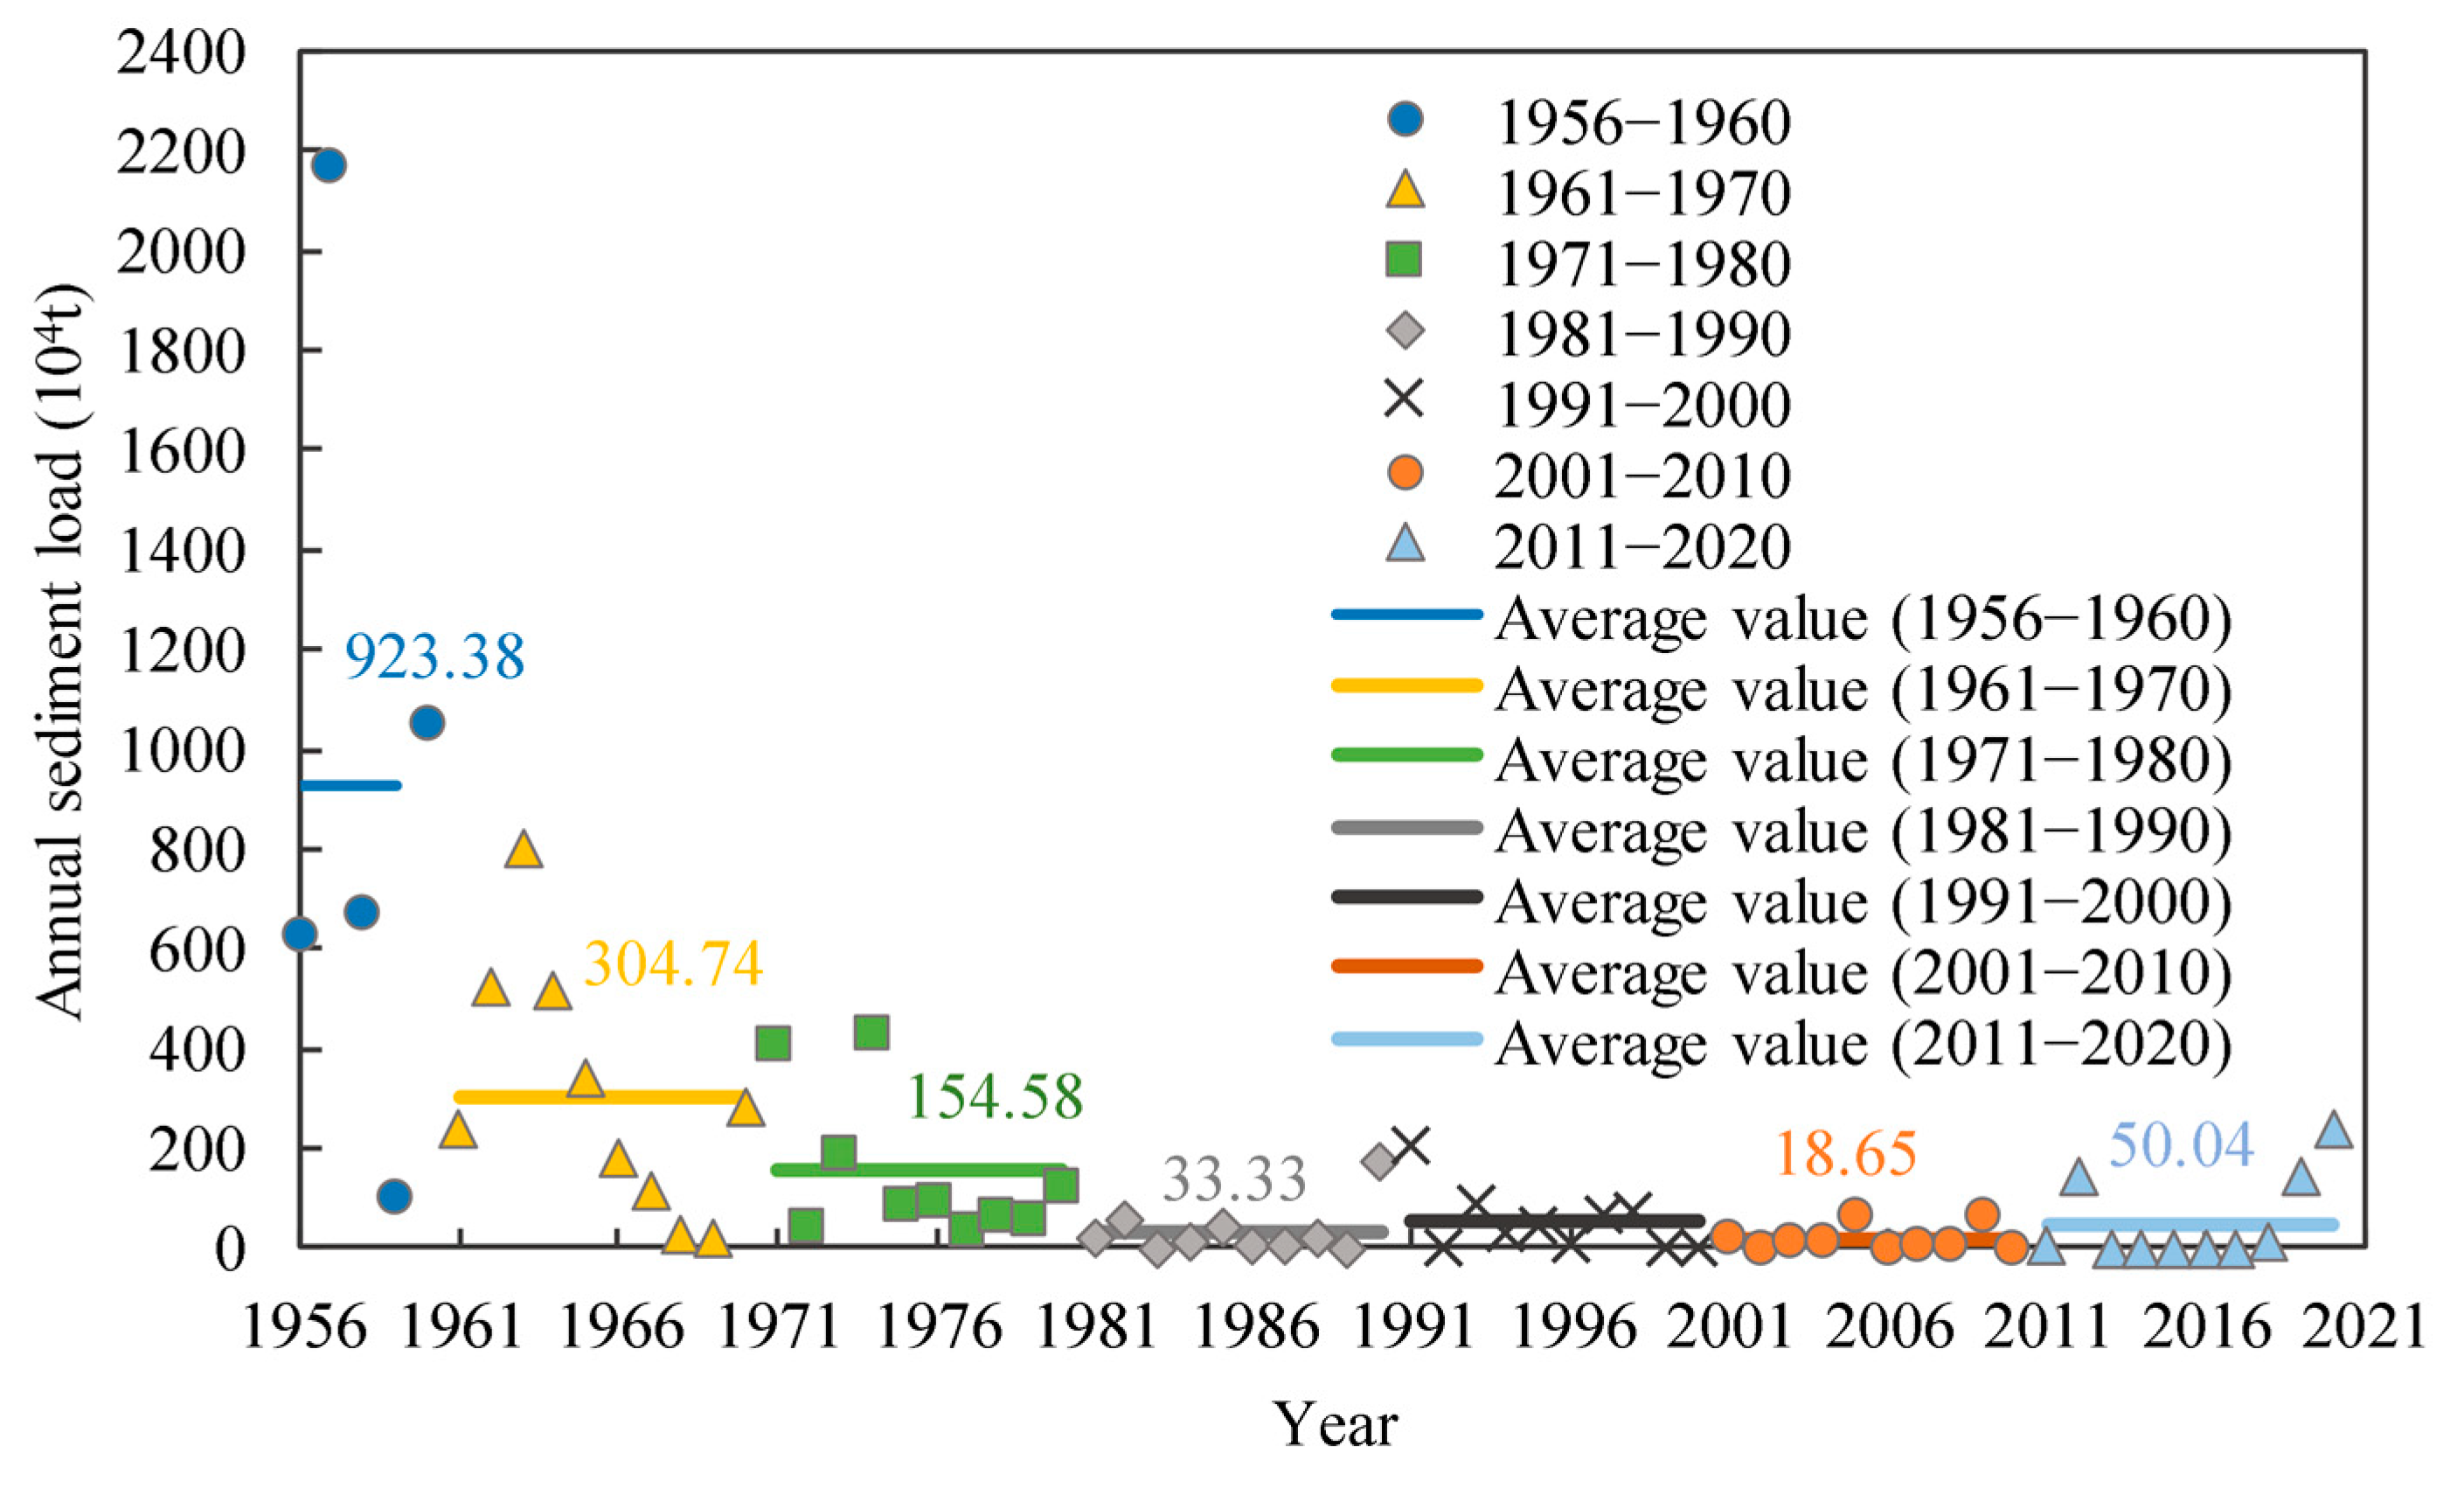
3.1.2. Characteristics of Inter-Annual Variability in Precipitation and Sediment Load

The M-K trend analysis was used to analyze the trends of annual precipitation and annual sediment load over time in the YHRB from 1956 to 2020, and the M-K standard variations of annual precipitation and annual sediment load were Zp = −0.93 and Zs = −5.8142, respectively. Considering the significance level α = 0.05, the corresponding test critical value |Z1a/2| = 1.96. As Zp < 0, Zs < 0, and |Zp| < |Z1 − a/2|, |Zs| > |Z1 − a/2|, both precipitation and sediment load in the YHRB showed a decreasing trend, and the decreasing trend of precipitation was not obvious, whereas that of sediment load was considerably obvious.
As presented in Table 1 and shown in Figure 3, the average precipitation and sediment load in the YHRB were 795.16 mm and 166.49 × 10⁴ t, respectively. The highest annual precipitation and annual sediment load were 1248.93 mm (recorded in 1964) and 2170 × 104 t (recorded in 1957), respectively. Within different decades, the average values of precipitation in 1956–1960, 1961–1970, 1971–1980, 1981–1990, 1991–2000, 2001–2010, and 2011–2020 were 914.89, 853.55, 795.01, 678.67, 784.57, 814.33, and 784.96 mm, and the average values of sediment load in each decade were 923.38, 304.74, 154.58, 33.33, 54.15, 18.65, and 55.04 × 10⁴ t, respectively. The coefficients of variations of the inter-annual precipitation and average annual precipitation in the basin showed medium variability. The degree of variability in the sediment load in the basin varied considerably in each decade, with moderate variability in 1956–1960, 1961–1970, and 1971–1980, and strong variability in 1981–1990, 1991–2000, 2001–2010, and 2011–2020. The coefficient of variation of the average annual sediment load was 5.02, indicating high variability.
By combining 65 years of precipitation and sediment load changes in the basin, the coefficient of variation, and M-K trend analysis, we found that the decreasing trend of annual sediment load was considerably greater than that of annual precipitation (Figure 3), and the change was particularly obvious after the 1980s. Additionally, years with the phenomenon of “water without sediment” suggested that changes in sediment load were increasingly influenced by precipitation variations alongside anthropogenic impacts.

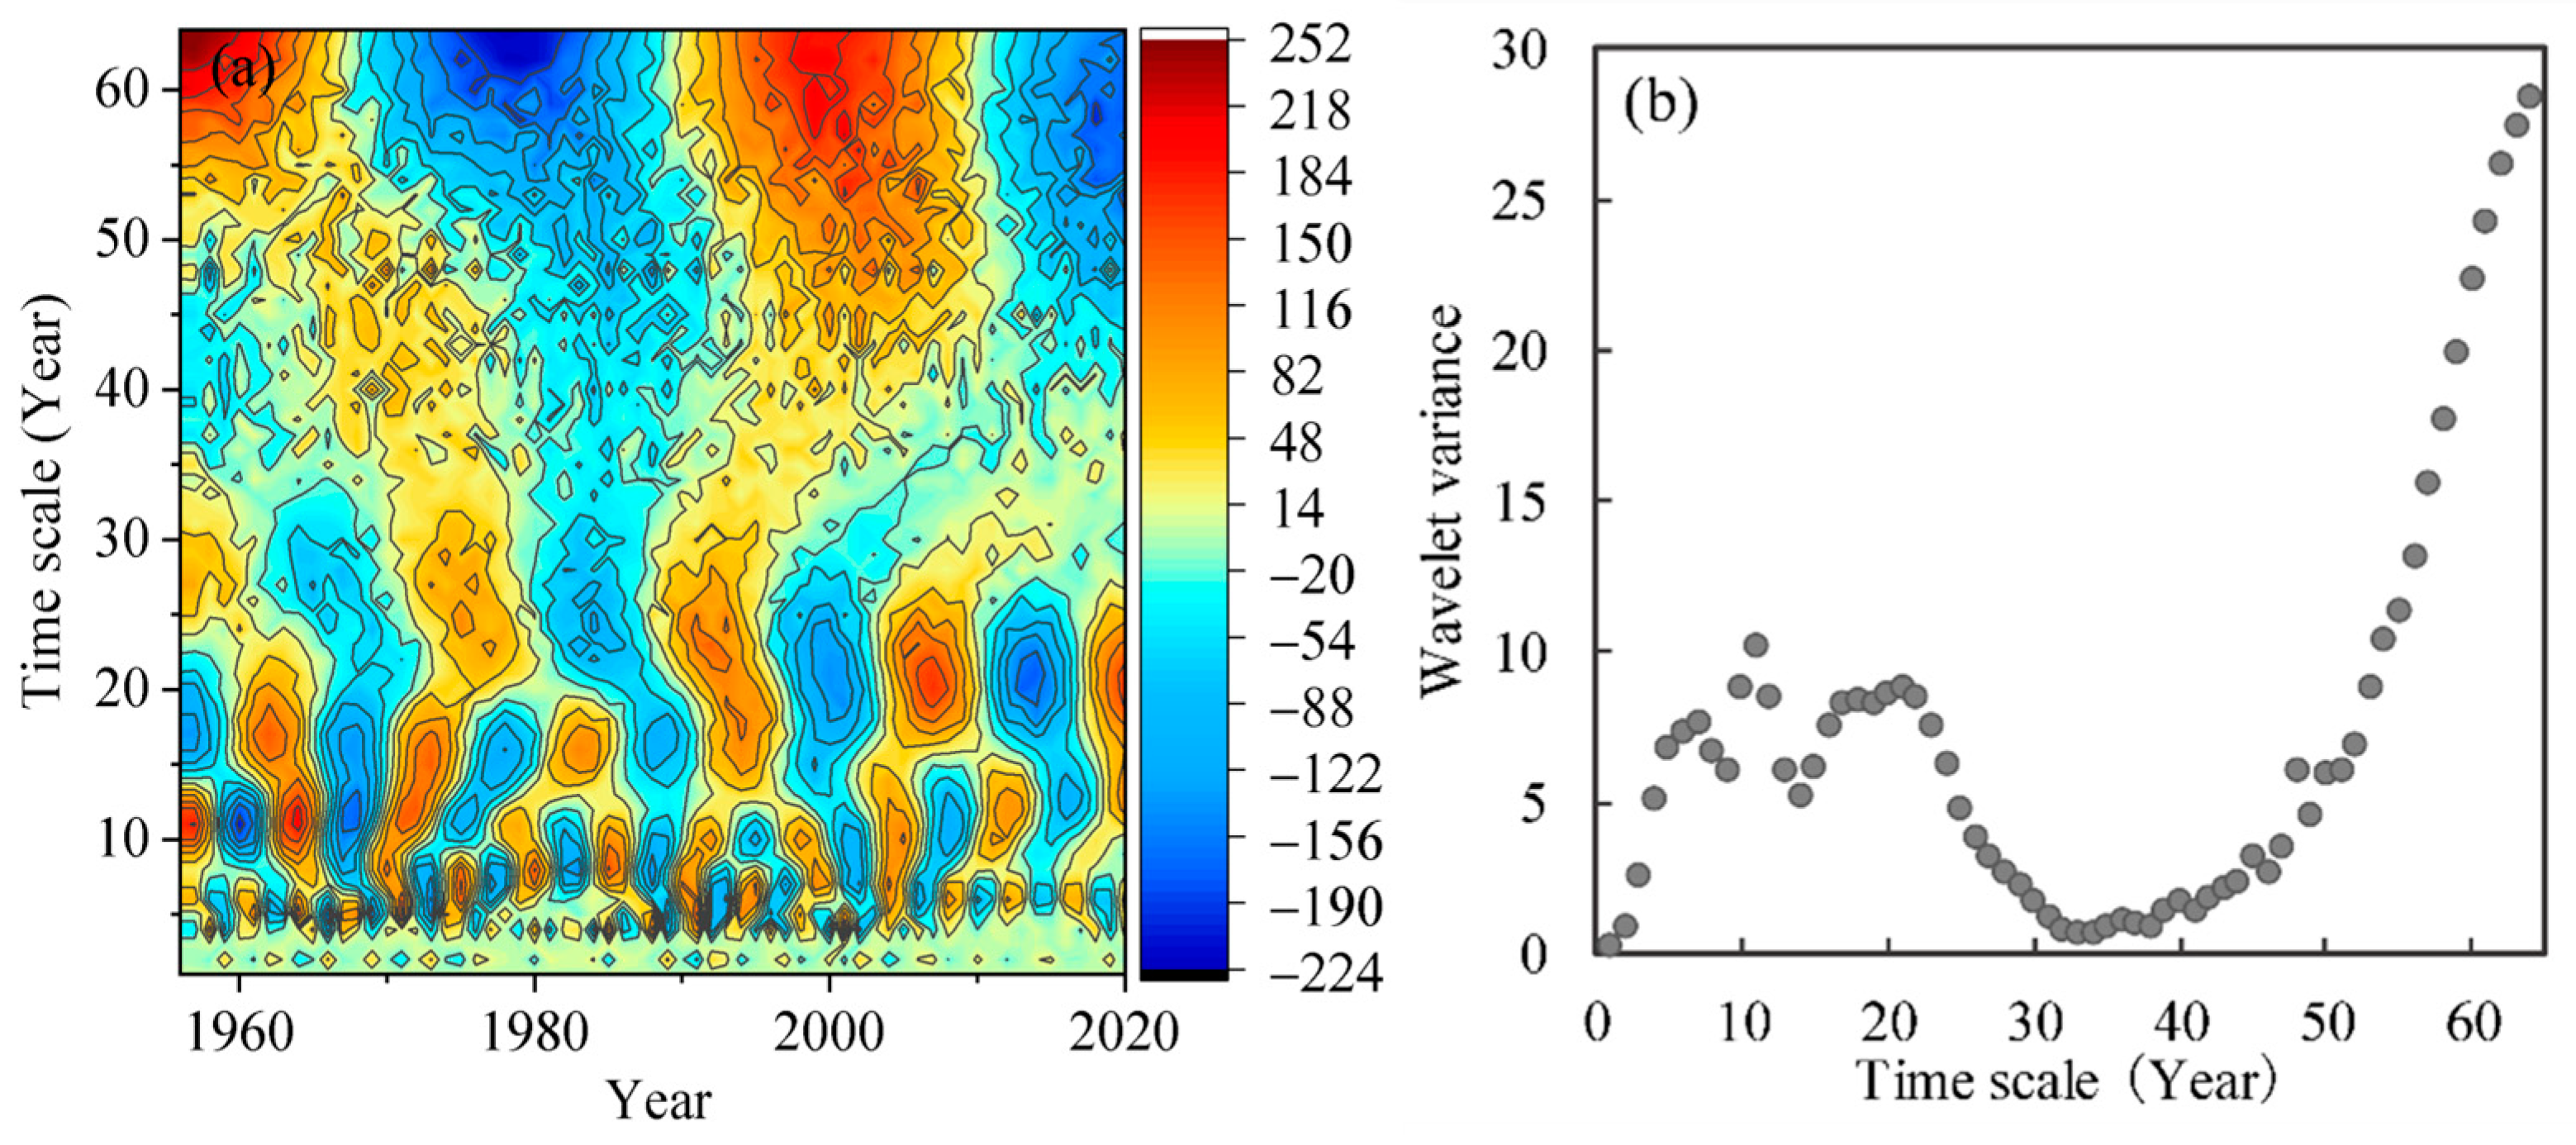
3.1.3. Cycle Analysis of the Changes in Precipitation and Sediment Load

A significant difference was observed between the annual precipitation and sediment load cycles in the YHRB (Figure 4 and Figure 5).
The annual precipitation cycle of the basin was clear (Figure 4a). We observed four peaks with oscillation cycles of 4–8a, 9–14a, 16–19a, and 20–28a (Figure 4b). The energy of the time scale of 9–14 years was the strongest, which was the main cycle of precipitation change in the basin, and 4–8a, 16–19a, and 20–28a represented the secondary cycles. In the time scale of 9–14a, we observed multiple oscillations of “abundant–dry” in the precipitation of the basin, and the oscillations in 1956–1976 were the most obvious.
A series of three distinct wavelet variance chart peaks for the annual sediment load are shown in Figure 5b. These oscillations were more prominent in cycles 3–5a, 9–15a, and 30a. The 30a time scale displayed the highest energy and a decreasing tendency, representing a principal annual sediment load change cycle. The secondary cycles included 3–5a and 9–15a. The 9–15a time scale showed most significant oscillation, with six occurrences of “abundant–dry–abundant–dry–abundant–dry” events observed primarily in 1956–1969. This period witnessed a cyclical “abundant–dry” sediment load process, wherein the first “abundant season” isoline was not fully encircled, suggesting that there were periods of drought before 1980. After 1980, the oscillation of the isoline chart of the real part of the wavelet coefficient was undetectable, signifying a lack of significant periodic changes in the annual sediment load after 1980.

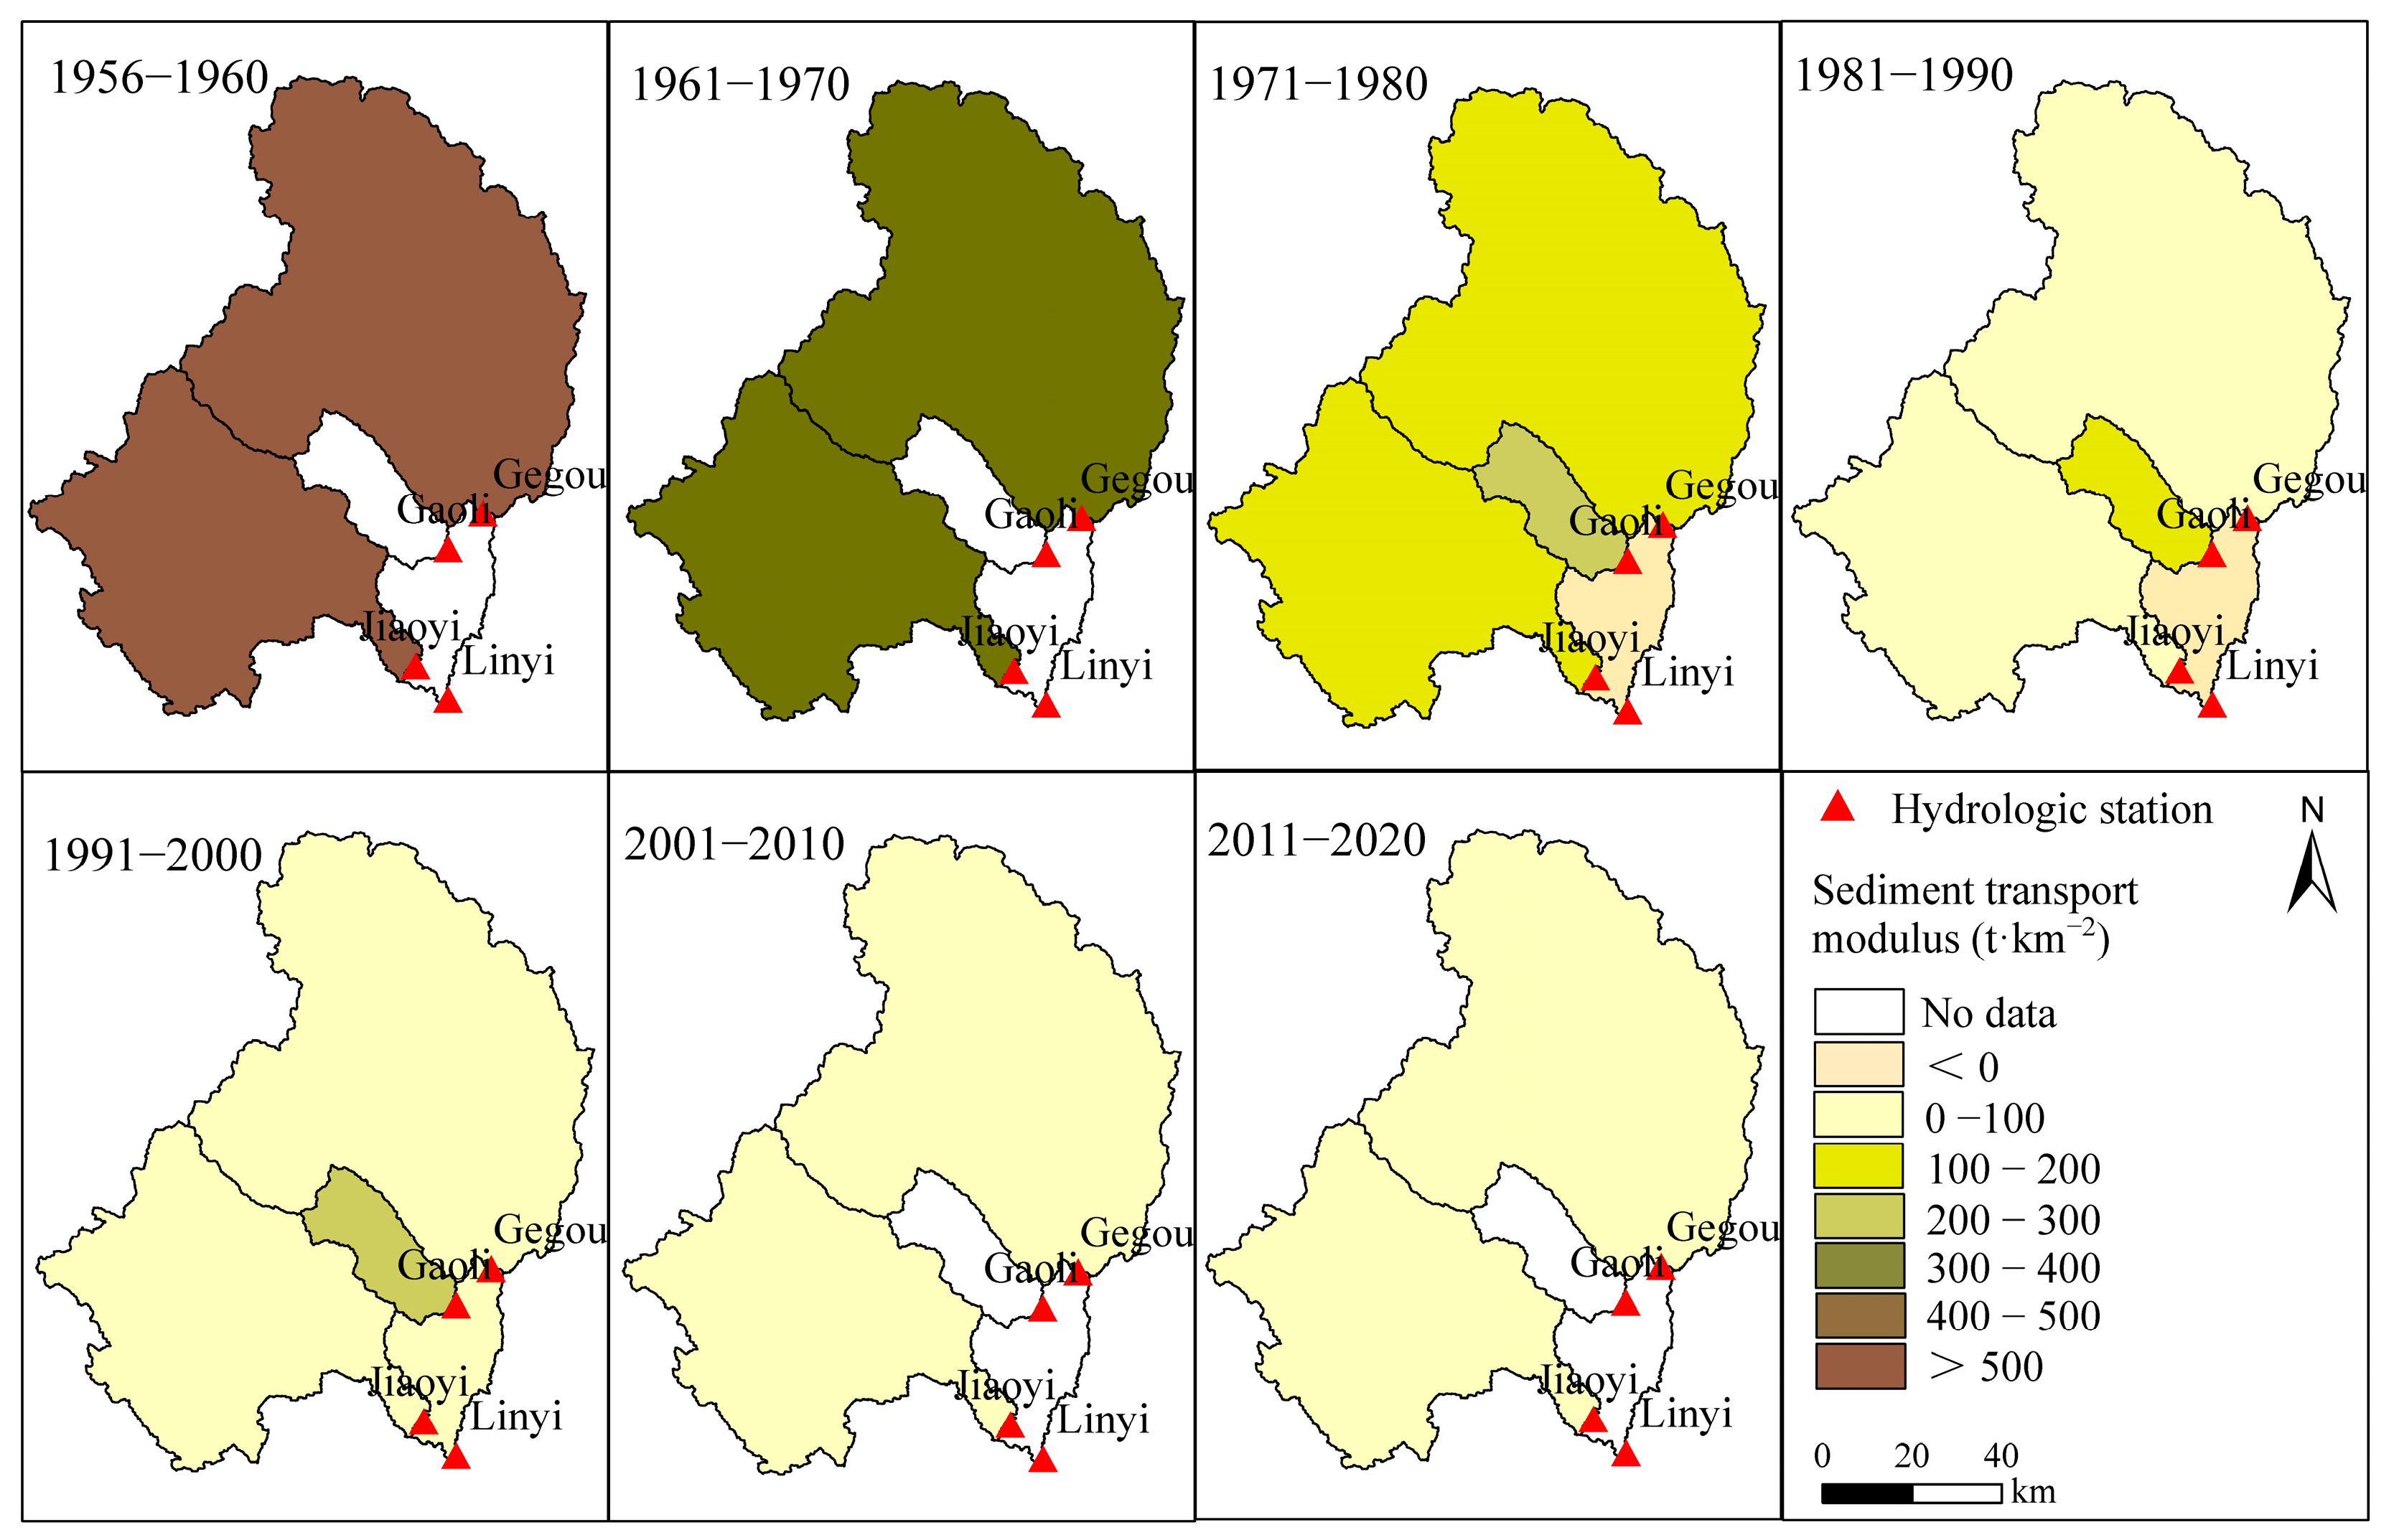
3.2. Spatial Variations in Sediment Load

Four sub-basins (Sub1, Sub2, Sub3, and Sub4) have been divided based on DEM, hydrological system condition, and the relationship between main streams and tributaries. Among them, Gegou station controls Sub1, Gaoli station controls Sub2, Jiaoyi station controls Sub3, and Sub4 is the area where the main stream meets the tributaries (Figure 1c).
As can be seen from Table 2, the average annual sediment transport in the sub-basins, except for Sub4, increased with basin area. According to the analysis of available data, the sediment transport modulus for Sub1, Sub2, and Sub3 were 90.88, 190.45, and 224.13 (t·km−2), respectively. This indicated that Sub3 had the most severe soil erosion, followed by Sub2, and Sub1 had the least severe soil erosion. From 1976 to 1997, the average annual sediment transport and sediment transport modulus in Sub4 were negative, indicating that the sediment deposition in this sub-basin was higher than the erosion. Sub4 is flat and is dominated by plains. Sediment transportation in the upper sub-basin was slowed down and allowed to accumulate at the confluence (Sub4) due to the influence of topography.
Between 1956 and 2020, the sediment transport modulus of Sub1 and Sub3 decreased significantly from more than 500 (t·km−2) to less than 100 (t·km−2). The sediment transport modulus of Sub2 showed a slight downward and then upward trend successively from 1976 to 1998 (Figure 6). The sediment transport modulus in Sub4 was smaller than other sub-basins from 1976 to 1998, although it showed a small upward trend from below 0 (t·km−2) to below 100 (t·km−2). Analyzing the spatial changes of the sediment transport modulus in the sub-basins, it can be seen that it showed a decreasing trend as a whole.

3.3. Human Activities Affecting the Variations in Annual Sediment Load

Changes in the sediment load in the YHRB are the result of the combined effects of precipitation and human activities. Precipitation influences the change in sediment load by affecting basin runoff. Human activities, such as soil and water conservation, land use, and industrial, agricultural, and domestic water use, not only change the hydrological cycle process and spatial–temporal distribution law but also have a significant impact on the sediment production conditions of the basin [22].

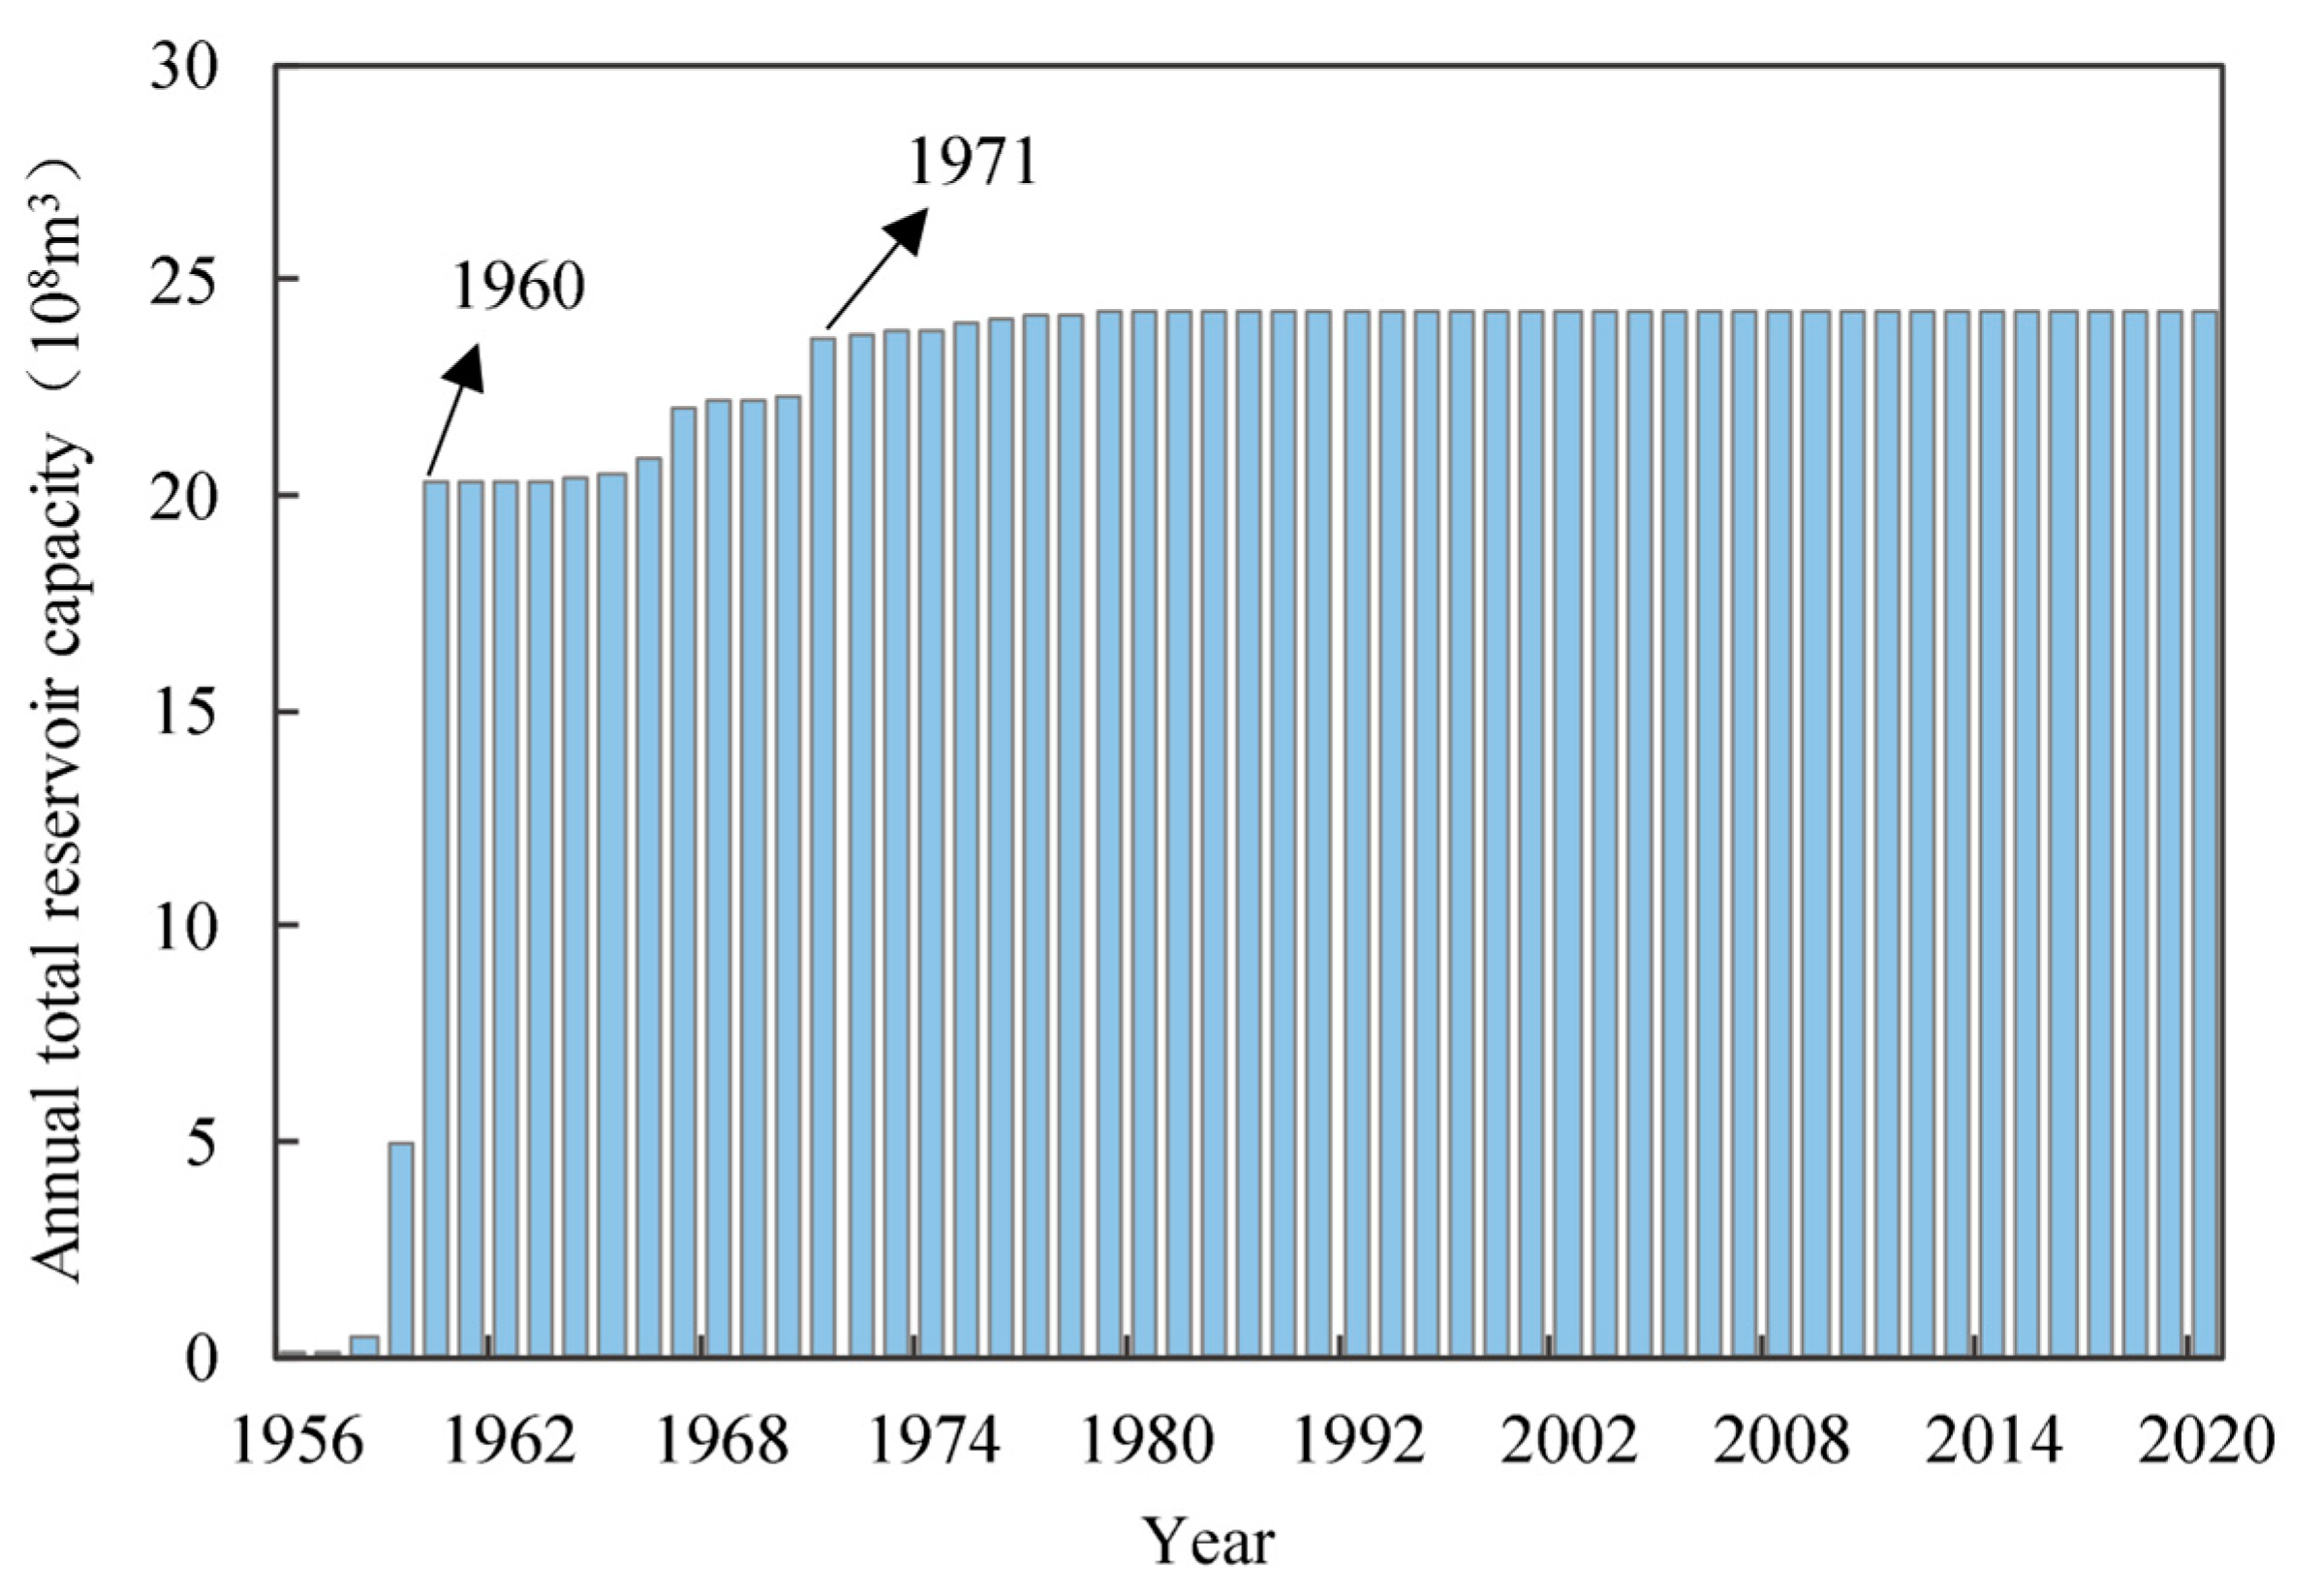
3.3.1. Impact of Hydraulic Engineering Construction on Sediment Load

Since the construction of water conservancy projects in the mid-1950s, there are 5525 large, medium, and small reservoirs and ponds in the YHRB as of 2020, including five large reservoirs (Tianzhuang, Bashan, Andi, Tangcun, and Xujiaya Reservoirs), 22 medium-sized reservoirs, 562 small type-I and small type-II reservoirs, and 4936 ponds and dams. The total reservoir capacity of the basin is 24.29 × 10⁸ m3 (Figure 7), and the utilizable capacity is 10.96 × 10⁸ m3.
Reservoirs, ponds, and other storage projects are used to impound floodwaters during flood seasons and release utilizable flows during non-flood seasons to level out the flow process throughout the year, thus achieving the efficient allocation of water resources. Their impact on river sediment transport is mainly manifested in two aspects: On the one hand, they can directly intercept the sediment in the upper reaches of the basin, reduce the sediment input in the lower reaches, and effectively alleviate sedimentation in the lower reaches. Conversely, through artificial flood peaks, water and sediment regulation, and other water storage and detention processes, the downstream peak discharge, sediment-carrying capacity of the flow, and sediment load are reduced [23]. Figure 7 shows that the change in the reservoir capacity in the basin was mainly concentrated from the late 1950s to the early 1970s. As presented in Table 1 and shown in Figure 3, the average and coefficient of variation of the sediment load in the basin during this time period were considerably different from those of the last 50 years. Notably, the construction and use of various types of water conservancy projects in this period played an important role in the reduction of sediment transport in the basin in the subsequent period.

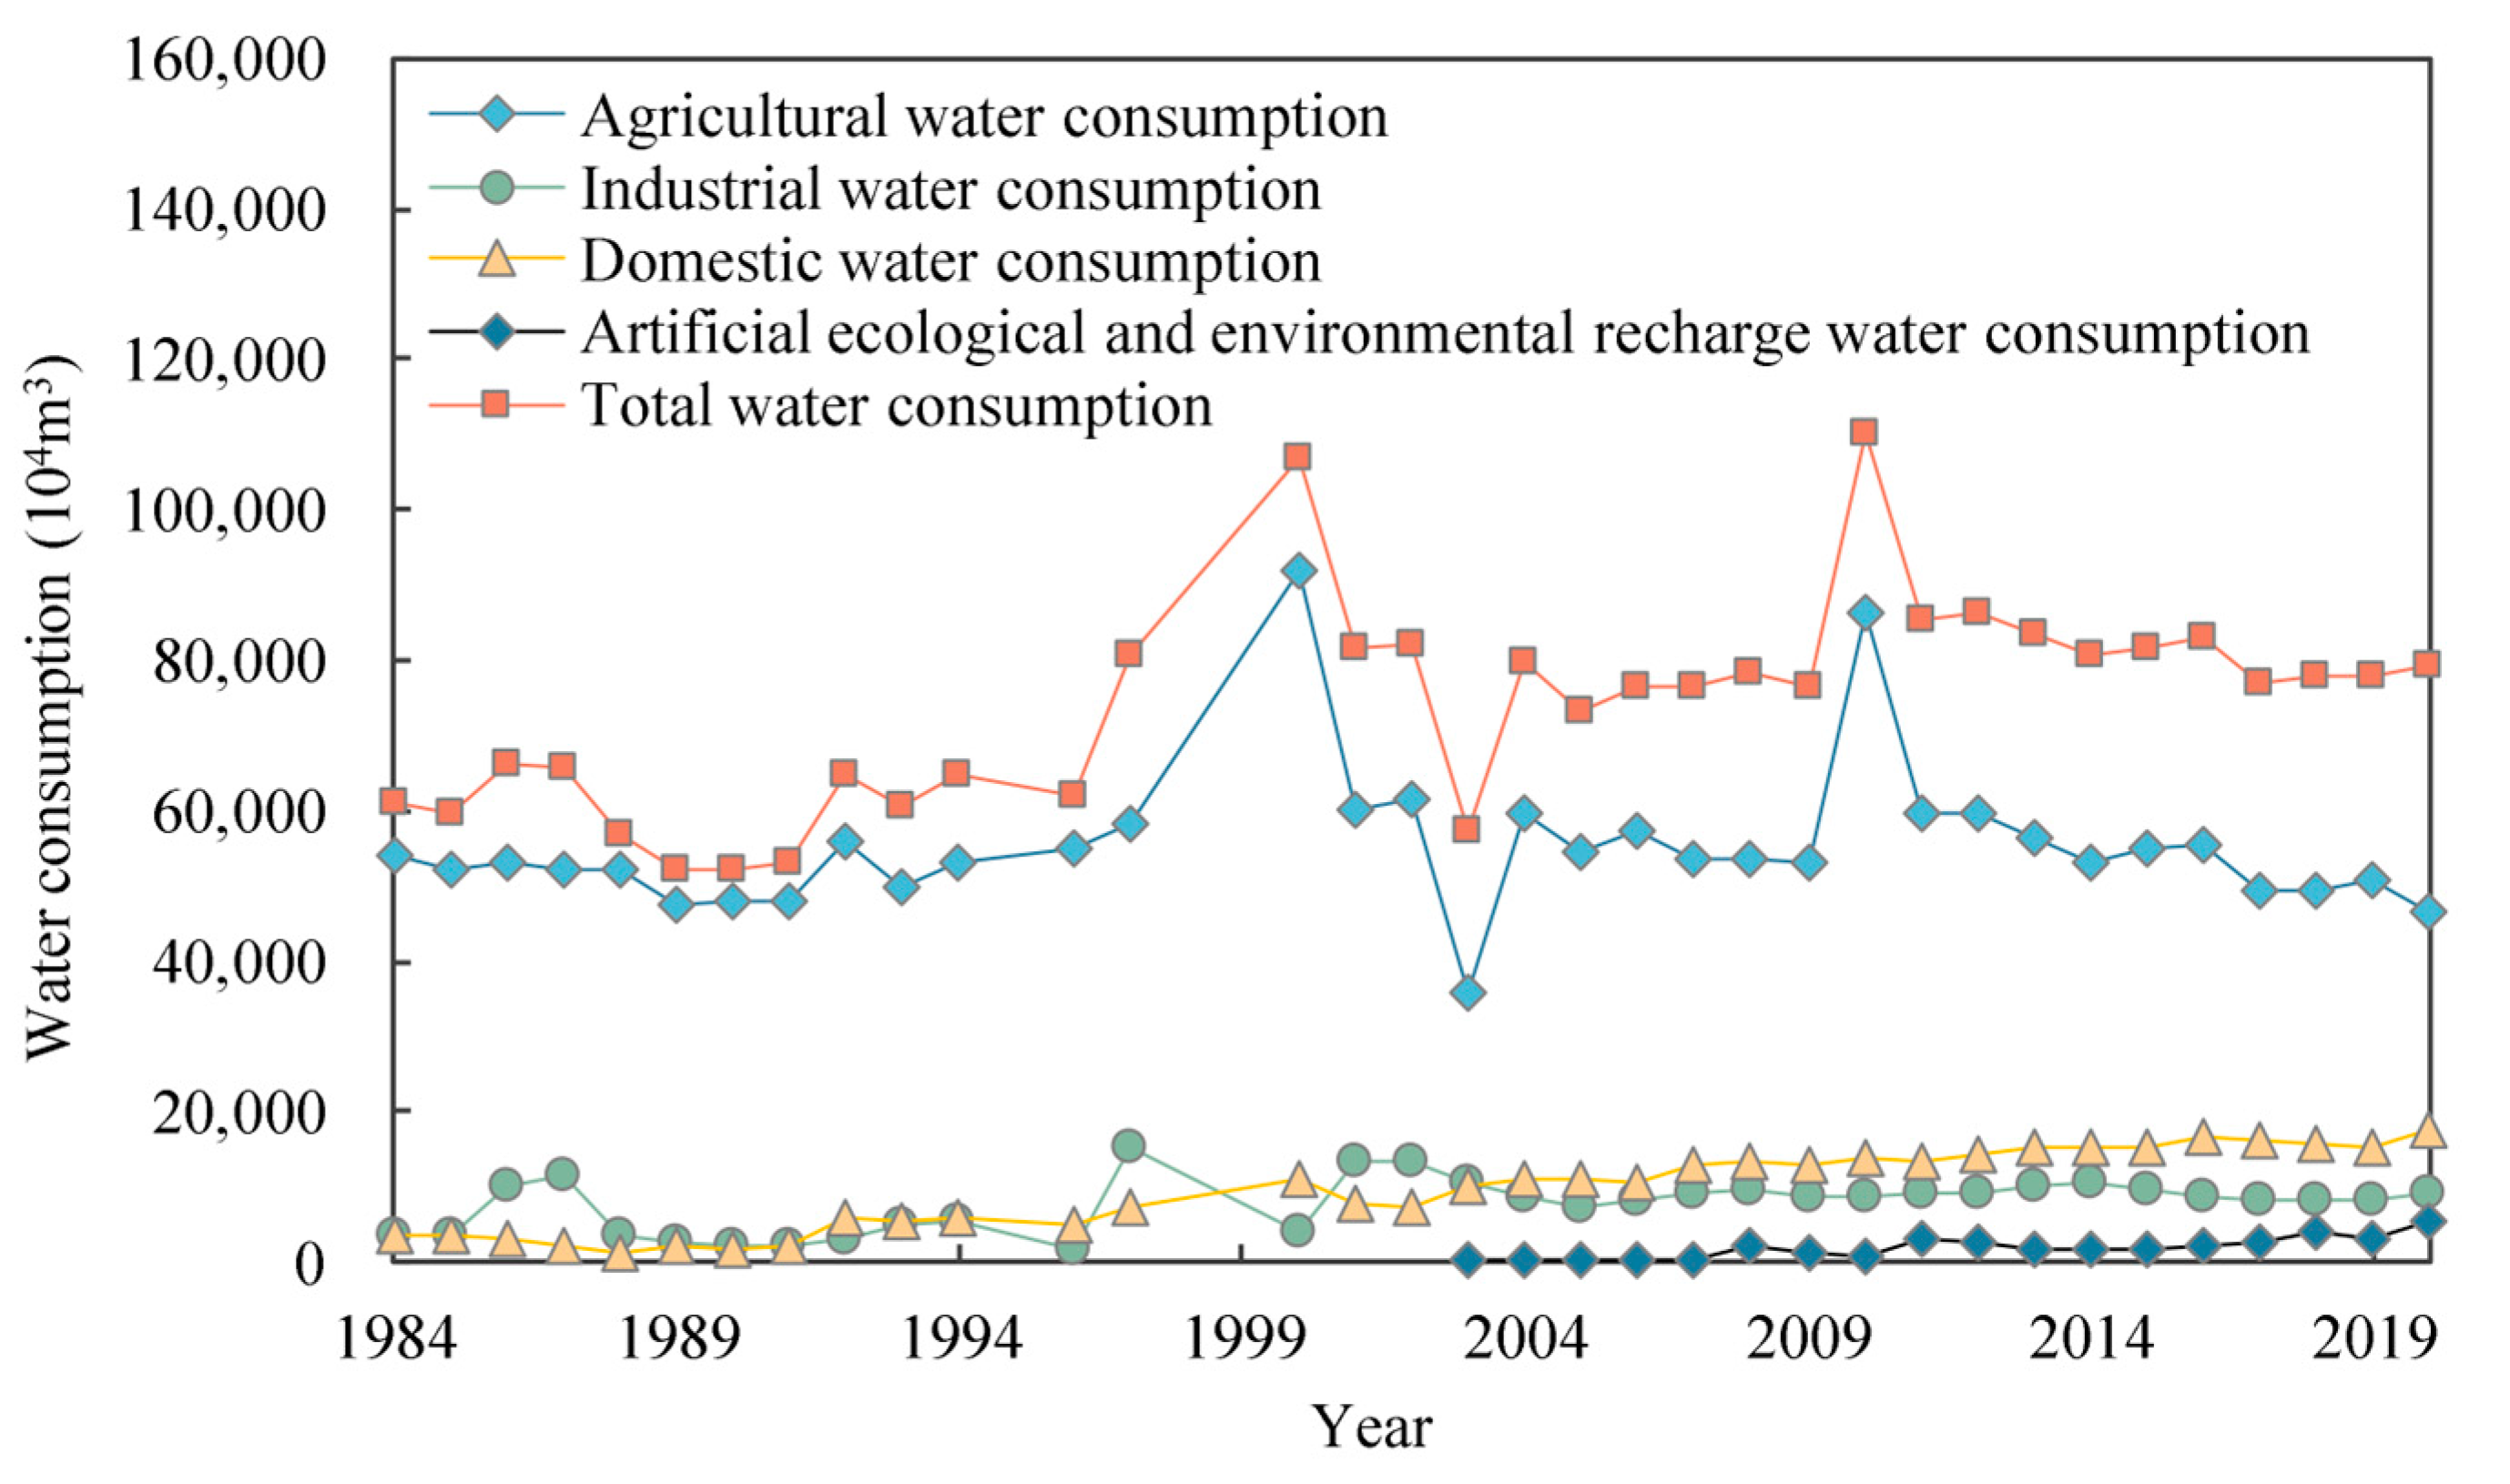
3.3.2. Impact of Changes in Water Use and Runoff on Sediment Load

The development and utilization of water resources affects the land-based water cycle, and hydraulic changes occur in the basin. In particular, changes in agricultural water consumption have a certain impact on runoff, sediment transport, and evaporation [24]. Figure 8 shows the changes in the YHRB’s agricultural water use, industrial water use, domestic water use, artificial ecological and environmental recharge water use, and total water use from 1984 to 2020. Overall, there was an upward trend in all categories of water use and total water use. The trend in agricultural water consumption was consistent with that of total water consumption. The annual average agricultural water consumption was 74.05% of the total water consumption. Moreover, the annual average industrial water consumption, annual average domestic water consumption, and annual average artificial ecological and environmental recharge water consumption accounted for 10.45, 12.90, and 2.60% of the total water consumption, respectively. This indicates that agricultural water consumption was the main mode of water consumption. As a result, the runoff of the YHRB has had a decreasing trend in recent decades. Thus, a large amount of runoff has been diverted out of the river, leading to a reduction in river runoff, and consequently, the amount of sediment load.

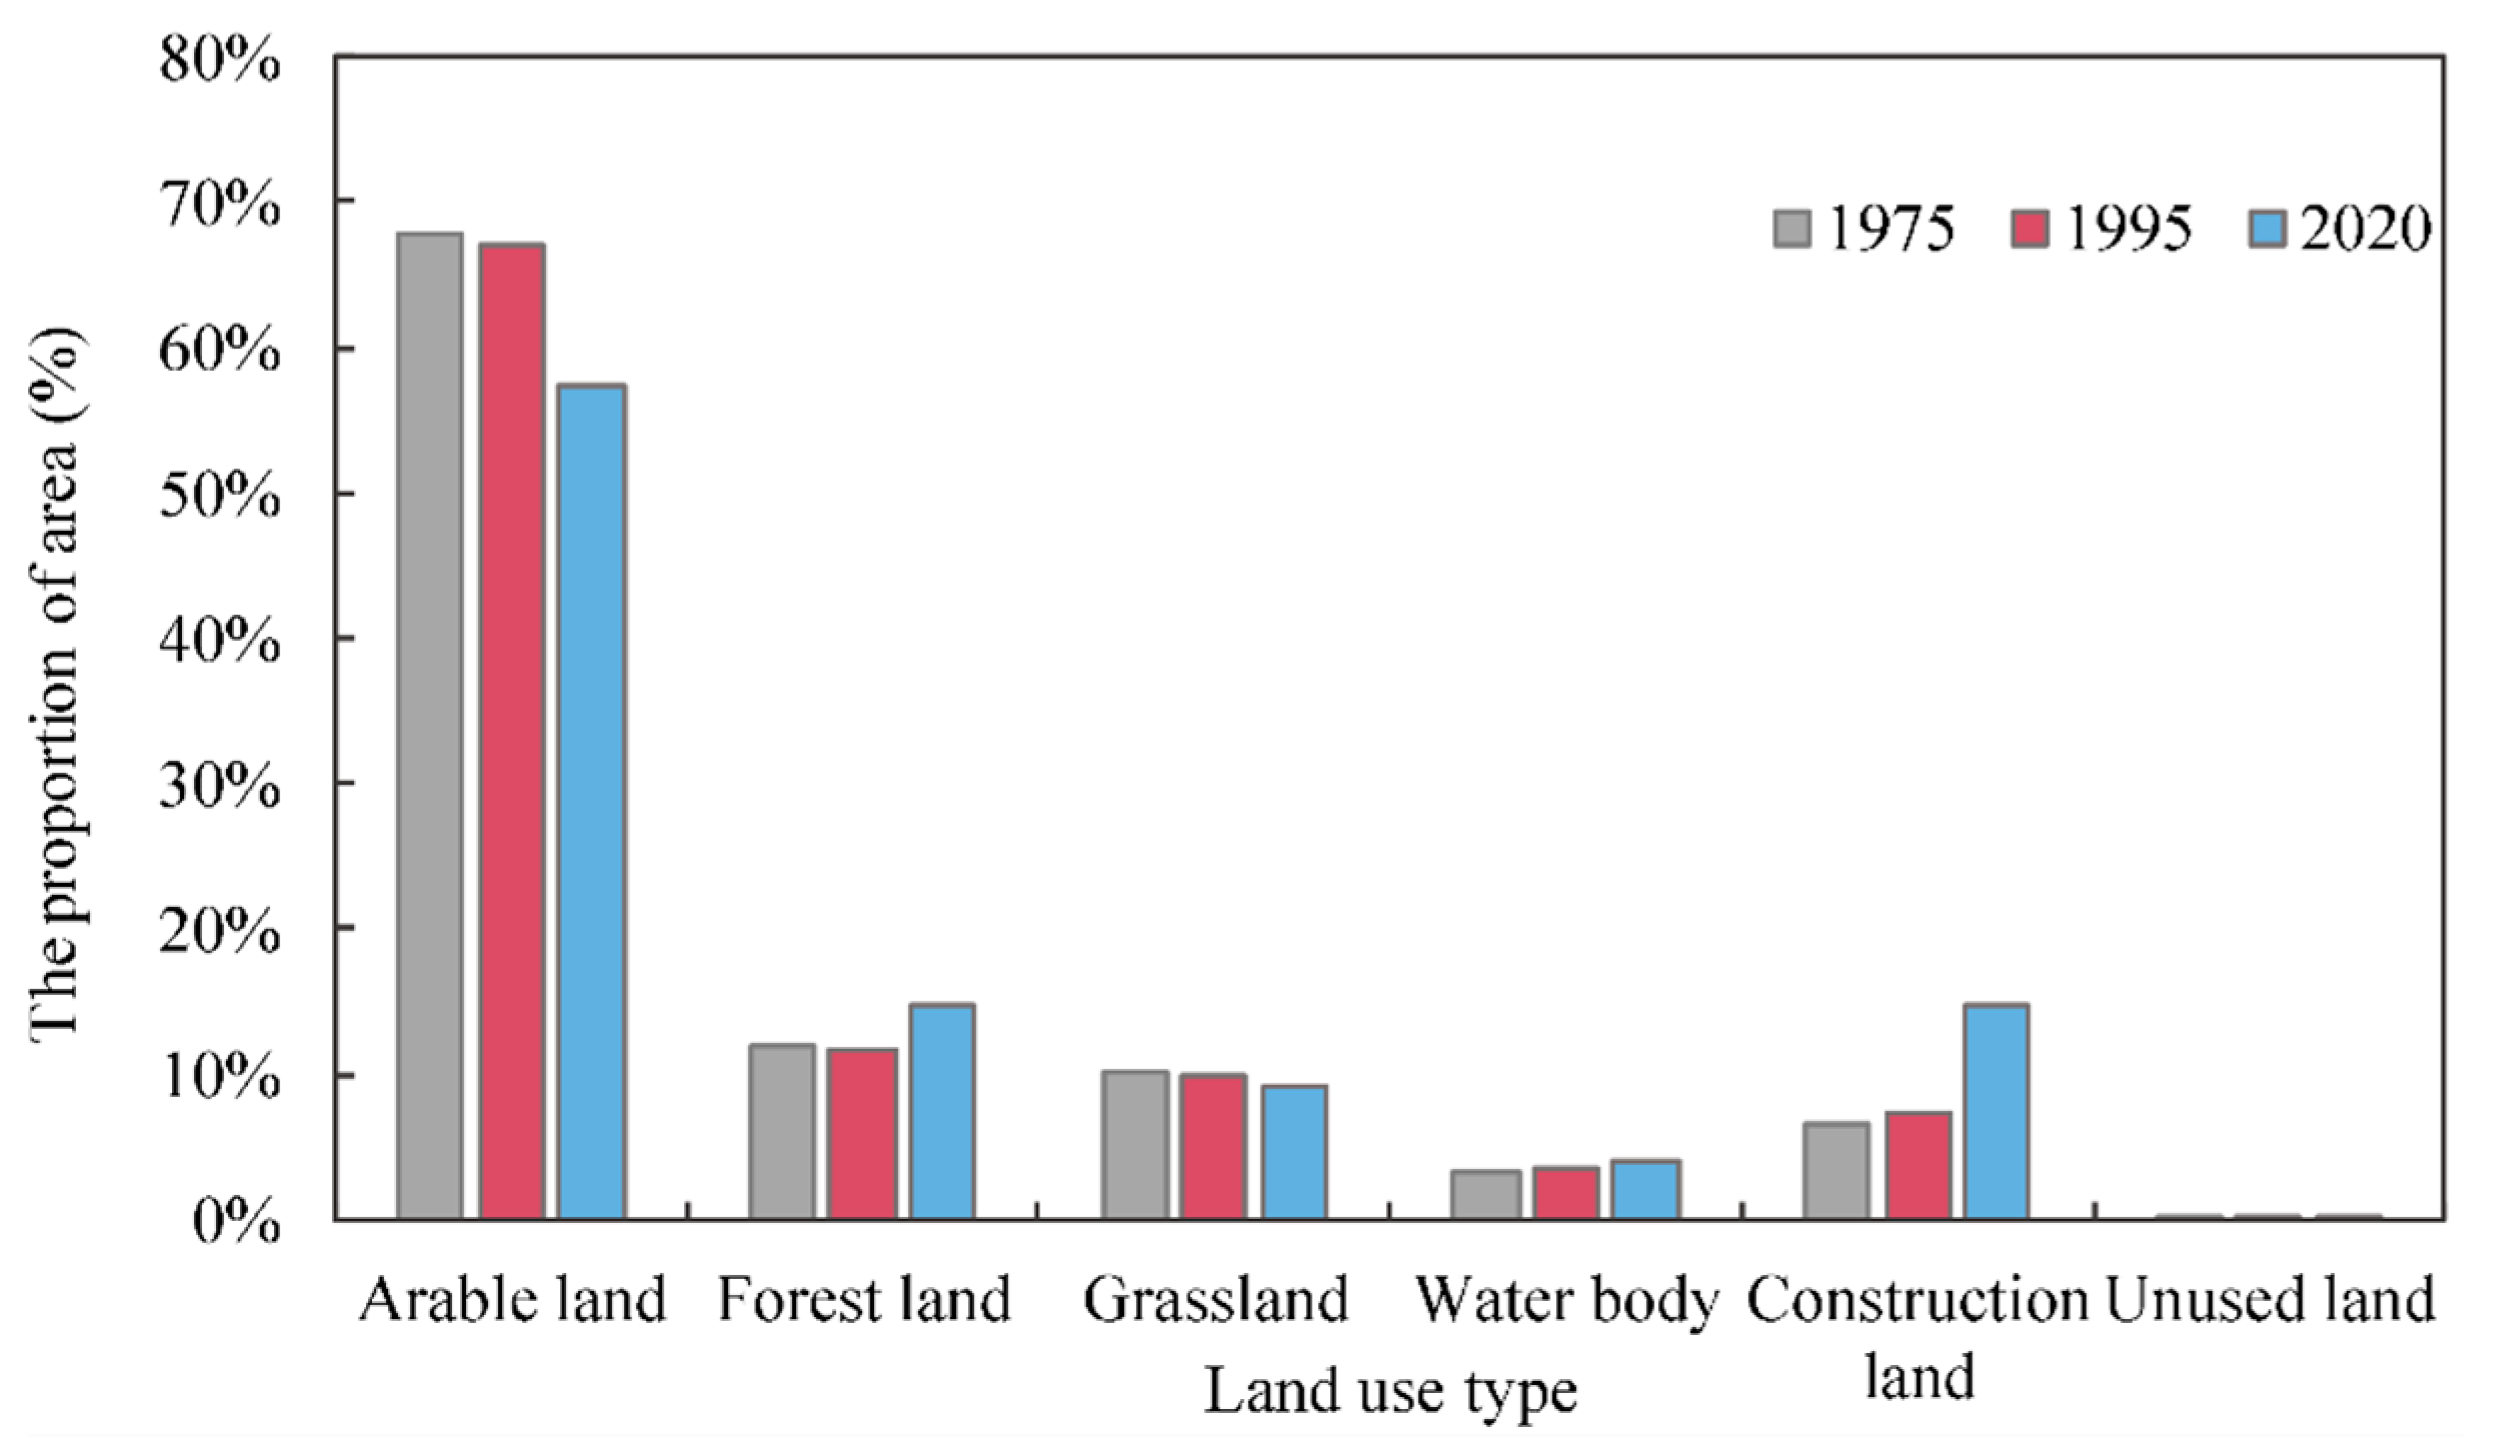
3.3.3. Impact of Land-Use Change on Sediment Load

Three remote sensing images of the YHRB from 1975, 1995, and 2020 were interpreted, and the percentage of each land-use type was calculated. As shown in Figure 9, the land-use types in the basin were dominated by arable land, followed by forest land. From 1975 to 1995, arable land mainly shifted to grassland and construction land, whereas grassland shifted to forest land (Figure 10). From 1995 to 2020, arable land mainly shifted to construction land, forest land, and grassland, whereas grassland shifted to arable land (Figure 10). From 1975 to 2020, land-use changes in the basin were characterized by an increase in the area of construction land and forest land and a decrease in the area of arable land and grassland. The areas of construction land and forest land increased by 806.71 and 274.91 km2, respectively, whereas those of arable land and grassland decreased by 1057.88 and 108.96 km2, respectively. The decrease in the area of arable land and grassland and increase in the area of forest land and construction land were mainly related to population growth, urbanization, and ecological construction in recent years. On the one hand, urbanization has accelerated the process of encroachment of construction land into arable land, resulting in a significant expansion of construction land and further aggravation of the trend of arable land shrinkage. Conversely, the implementation of soil and water conservation projects, such as returning arable land to forest land, afforestation of barren mountains, and conversion of slopes to terraces, which were conducted from the 1990s to the beginning of the 21st century, led to a better restoration of forest land resources [25], and the area of grasslands has shown a decreasing trend overall [26]. Therefore, an increase in forest land area can improve soil and water conservation and reduce the sediment load from the basin.

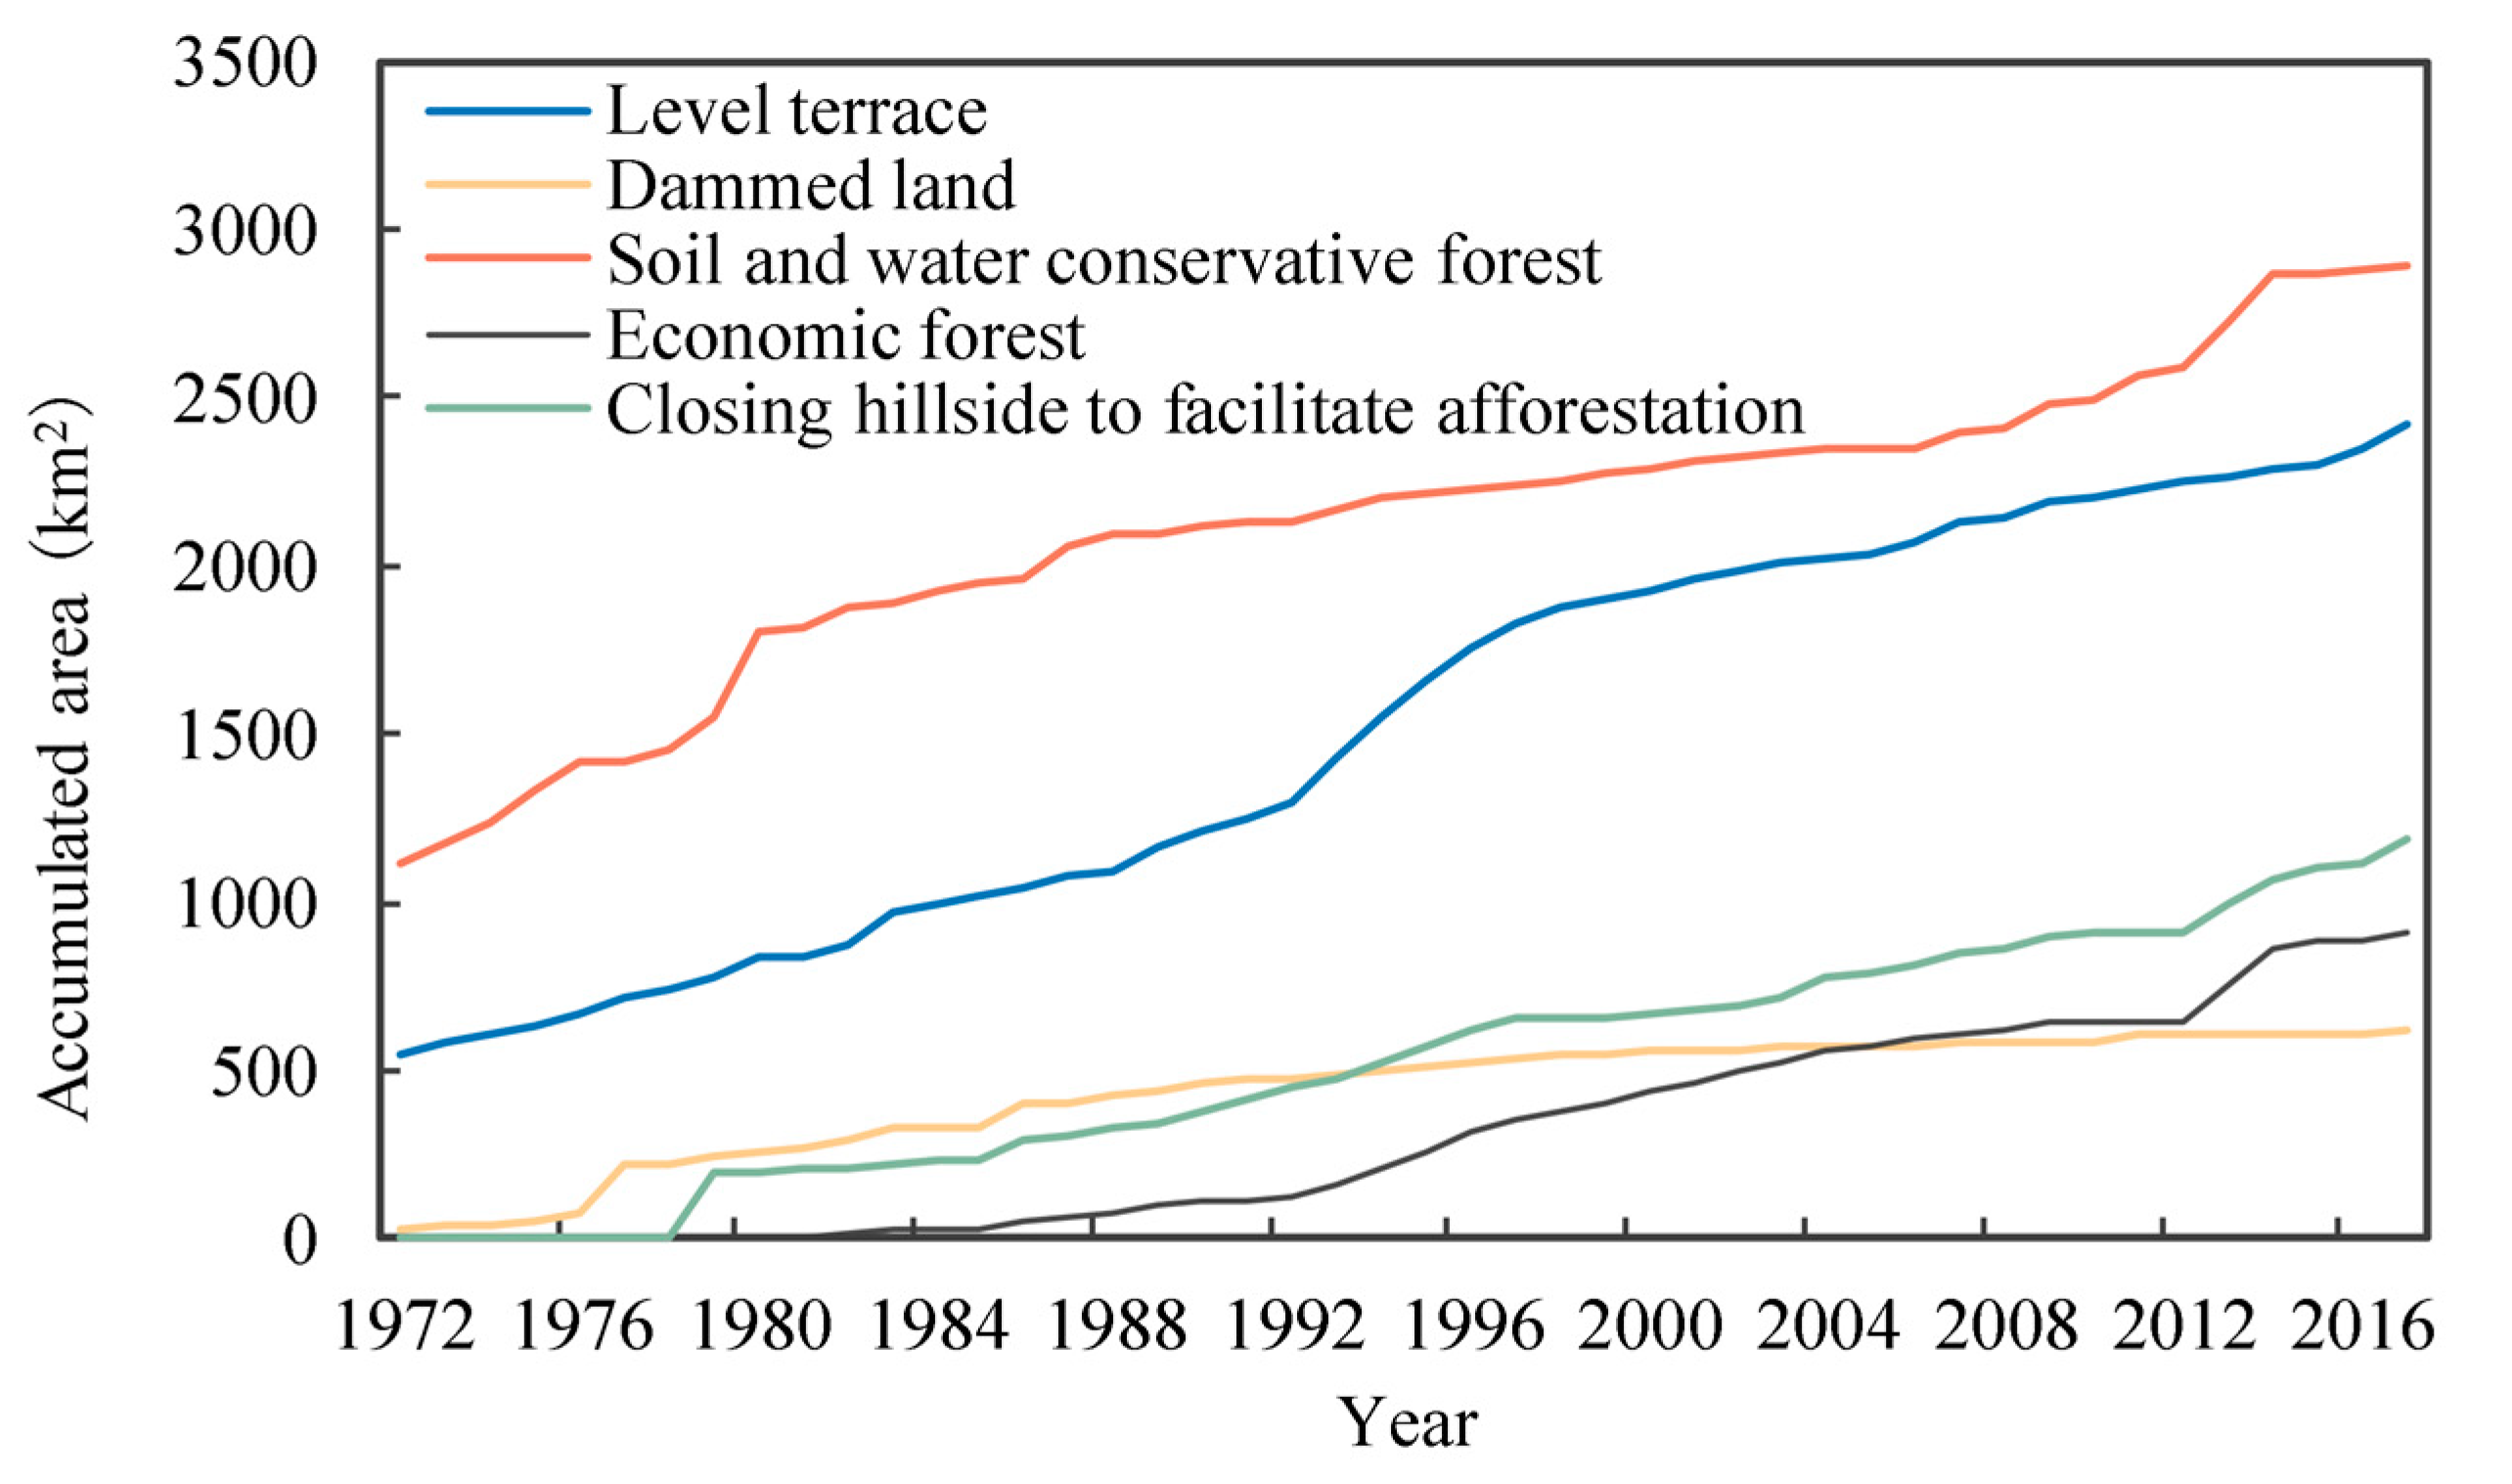
3.3.4. Impact of Changes in Soil and Water Conservation Measures on Sediment Load

At the end of the 1950s, backward economic development and the influence of policies, large areas of indiscriminate cultivation and deforestation, reclamation, and other phenomena severely damaged mountain vegetation in the basin, resulting in a sharp decline in forest coverage, severe damage to the ecological environment, and intensification of soil erosion. To improve land productivity, accelerate the process of soil erosion control, and guarantee regional ecological security, the local government has combined local natural conditions to establish the conversion of slopes to terraces, soil and water conservation forests, and economic forests as key projects of basin management, and adopted soil and water conservation measures, such as sealing control and the construction of dams, to improve the coverage rate of forest land and control soil erosion [27]. Figure 11 shows the status of the changes in the cumulative area of all types of soil and water conservation measures over time in the YHRB from 1972 to 2017. As of 2017, the cumulative area of soil and water conservation forests in the basin amounted to 2890.89 km2, which accounted for the highest proportion among all types of soil and water conservation measures, with a growth rate of 157.34%. Subsequently, the cumulative area of level terrace accounted for the second-highest proportion among conservation measures, namely, 2416.10 km2, which has increased by 1797.00 km2 in the past 45 years. Additionally, the cumulative area of soil and water conservation measures, such as dammed land, economic forests, and closing hillsides to facilitate afforestation, showed a steady increase. The cumulative areas of dammed land, economic forest, and closed control reached 615.28, 913.81, and 1183.41 km2, respectively, and the cumulative area of comprehensive soil erosion control reached 5384.96 km2.
As early as the 1980s, a series of soil and water conservation measures were conducted in the basin, such as terrace repair, construction of dammed land, remediation of ravines, creation of soil and water conservation forests, and control of soil and water erosion [28]. However, the effects of soil and water conservation were limited because in the early days, the people in mountainous areas seriously damaged the vegetation cover to increase food production by planting a wide range of crops, destroying forests, and clearing land. After the 1980s, large-scale comprehensive management of small basin and soil and water conservation projects were implemented, such as returning arable land to forests, afforestation of barren mountains, and shifting slopes to terraces in accordance with local conditions to constantly improve the level of soil erosion control. These conservation projects played an important role in preventing and controlling soil erosion in basin and reducing the sediment load [29].

3.4. Temporal Coupling of Influencing Factors with Changes in Basin Sediment Load

To analyze the influence of the aforementioned influencing factors on the sediment load in the YHRB, DCCs were used to analyze the trends in cumulative annual precipitation and sediment transport in the basin from 1956 to 2020. As shown in Figure 12, the DCCs of precipitation–sediment transport in the basin from 1956 to 2020 were deflected thrice, and the slope of the DCCs showed a trend of continuous decrease, with significant changes in the slope value. Therefore, the changes in sediment load in the basin can be divided into three stages.
(1) From 1956 to 1965: During this period, more precipitation occurred in the basin, the hydraulic engineering was in the construction stage, and the surface runoff and sediment load in the basin were less disturbed by human activities, indicating that the changes in sediment load in this period were mainly affected by precipitation.
(2) From 1966 to 1980: During this period, reservoirs, ponds, and other water storage projects in the basin were gradually established and put into operation. This increased the storage effect on the surface runoff and sediment, and subsequently led to a decrease in the amount of sediment load; thus, the DCCs deflected to the right.
(3) From 1981 to 2020: The basin had more erosive rainfall in the years 1987–1988, 1990–1992, 2001–2003, and 2008–2010, wherein all rainfall values were higher than the average annual erosive rainfall [30]. However, the annual sediment load showed a decreasing trend, suggesting that human activities gradually played an important role. After 1981, the large-scale comprehensive management of the small basin was conducted, and soil and water conservation projects, such as returning arable land to forest land, converting slopes to level terraces, covering mountains with forests, and reforesting barren hills, were implemented according to local conditions. The increase in forested and terraced areas promotes the retention of precipitation and seepage, changes the spatial distribution pattern of surface runoff, and effectively plays a role in water conservation and the reduction of soil and water erosion. Moreover, the annual sediment load showed a decreasing trend owing to the influence of the continuous storage of water in reservoirs and other water conservancy projects to stop sediment accumulation, along with the low precipitation during that period and the increase in water use for human production and domestic use, especially for agriculture and industry. These anthropogenic factors caused the DCCs to shift to the right.

3.5. Quantitative Relationship between the Variation in Precipitation, Human Activities, and Sediment Load

3.5.1. Delineation of the Initial Phase and Transitional Phases

The PMP test was used to examine the transformability of the sediment transport sequence from 1956 to 2020 in the YHRB, revealing a mutation in 1980 (Figure 13a). The same procedure was applied to the sediment transport sequence in the basin during 1956–1980 based on Figure 13a, which revealed an additional mutation in 1966 (Figure 13b).
Owing to alterations in precipitation and human activities in the YHRB, we found that sediment transport evolved through three phases using DCCs and change point quantification: the initial phase (1956–1965), transitional phase I (1966–1980), and transitional phase II (1981–2020).

3.5.2. Effects of the Variability of Precipitation and Human Activities on Sediment Load

Figure 12 shows the strong correlation between the precipitation and sediment load equation and initial phase, with an R2 value of 0.94. To quantify sediment transport during this period, the cumulative annual precipitation was included in the equation for each non-initial phase, namely, transitional phase I (1966–1980) and transitional phase II (1981–2020), and the corresponding theoretical annual sediment loads were derived. This enabled the assessment of the relative influence of climate change and human activity on changes in sediment load [31].
The equation for the initial phase is:
S 1 = 6.7747 P 1 + 10.827 ( R 2 = 0.9438 )
where S1 and P1 represent the sediment load and precipitation in the initial phase, respectively.
Compared with that in the initial phase (1956–1965), the amount of influence of precipitation changes on the sediment load in the basin during transitional phase I (1966–1980) was 150.31 × 10⁴ t, contributing 26.86% to the annual sediment load in the basin (Table 3). The amount of influence of human activities on the sediment load in the basin was 409.34 × 10⁴ t, with a contribution rate of 73.14%, indicating that human activities were the dominant factor in the change in sediment load at this stage. Additionally, the amount of influence of precipitation on the annual sediment load in the basin in transitional phase II (1981–2020) reduced by 185.50 × 10⁴ t compared with that in the initial phase, and the measured sediment load reduced by 661.69 × 10⁴ t compared with that in the year of the initial phase (1956–1965). Moreover, human activities under this precipitation condition led to a decrease of 476.28 × 10⁴ t in sediment load in the basin, and its contribution rate decreased from 73.14 to 71.97% in transitional phase I (1966–1980); the contribution rate of precipitation increased from 26.86% in transitional phase I (1966–1980) to 28.03%, with a smaller change in the contribution rate. Throughout the transitional phase, the contributions of human activities and precipitation changes to the sediment load in the basin were 72.32 and 27.68%, respectively, indicating that human activities played the leading role in controlling the sediment transport in the basin.

4. Discussion

4.1. Impact of Precipitation and Runoff Changes on Sediment Load

The impact of climate change, e.g., precipitation, on river sediment load has garnered global attention; river sediment load mainly originates from channel scour, gully erosion, and surface erosion, which are mainly influenced by precipitation and runoff [32,33]. Before 1965, owing to the relatively low level of economic development in the YHRB, human activities had less impact on the runoff and sediment load in the YHRB. Thus, the annual precipitation in the YHRB during initial phase I (1956–1965) showed a small decreasing trend, and the sediment load decreased significantly. Moreover, the contribution rates of precipitation changes to the decrease in sediment load in the YHRB during transitional phases I (1966–1980) and II (1981–2020) were 26.86 and 28.03%, respectively, indicating that the reduction in precipitation played a role in the reduction of sediment load in the YHRB.
Considering different time periods, the average correlation coefficients between sediment load and precipitation for each decade were 0.754, 0.680, 0.878, 0.787, 0.559, 0.404, and 0.638 for 1956–1960, 1961–1970, 1971–1980, 1981–1990, 1991–2000, 2001–2010, and 2011–2020, respectively, with an overall decreasing trend. However, the decrease in correlation coefficients may not imply that the physical mechanism of the relationship between precipitation and sediment load has weakened and that human activities can mask the true physical processes and local hydrological characteristics of sediment load in the basin.
To further investigate the influence of precipitation and runoff changes on sediment transport in the YHRB, the annual precipitation within the basin was divided into abundance and dryness states, and the ratio between precipitation and average precipitation in each era was expressed as K. The bias threshold K of abundance was 1.10 times the multi-year average for the period of 1956–2020, and the bias threshold K of dryness was 0.90 times the multi-year average for the period of 1956–2020. The ratios of precipitation to the average annual precipitation for 1956–1960, 1961–1970, 1971–1980, 1981–1990, 1991–2000, 2001–2010, and 2011–2020 were 1.15, 1.08, 1.00, 0.85, 0.99, 1.02, and 0.99 (Table 4), representing the period of “abundant–flat–flat–dry–flat–flat–flat”. Combined with the change characteristics of the sediment load in the YHRB in each era (Figure 14), the abundant (1956–1960) and dry (1981–1990) water periods showed obvious sediment production and reduction in the YHRB, respectively. This indicated that the inter-annual change characteristics of precipitation affected those of sediment transport.
In recent years, few studies have investigated the influence of meteorological factors, such as precipitation changes, on sediment load in the YHRB. The results of Jia [34] showed that before the 1970s, owing to the low exploitation rate of the YHRB and the weak influence of human activities, the change in the basin’s sediment load in this time period was greatly influenced by precipitation; after the 1970s, the influence of precipitation changes on the basin’s sediment load gradually reduced, which is in line with the conclusions of our study. Owing to the influence of climate change and human activities, many scholars have conducted relevant research on the characteristics of temporal changes in sediment load and the influencing factors of various basins in China. Scholars studying the change pattern of sediment load in rivers in northern China, such as the HRB [35], Songhua River Basin [36], Daling River Basin [37], Chaohe River Basin [38], and YRB [39] and its sub-basins [40], have also found that in recent years, most rivers showed a decreasing trend in sediment load, and the change in precipitation played a certain role in the change in sediment transport.

4.2. Impacts of Human Activities on the Sediment Load

As can be seen from Figure 3 and Figure 6, the temporal and spatial variation in sediment transport in the YHRB showed a significant decreasing trend. Meanwhile, the precipitation showed a slight decreasing trend (Figure 3), which indicates the obvious role of human activities in the reduction of sediment transport in the YHRB. The reduction in sediment load and sediment transport modulus in the sub-basins also indicates that the ecological environment of the YHRB has been better improved in recent years. Human activities mainly affected the change in sediment load at two levels. First, human activities change the subsurface conditions of the basin through soil and water conservation measures and land-use changes, among others, which affect the process of sediment production and the hydrological cycle of the basin; this subsequently affects the change in sediment load in the basin [41]. Second, water resources in the basin are reallocated by hydraulic engineering and changes in water use. These processes alter the spatial and temporal distribution of river runoff in its natural state and regulate the intra-annual distribution of basin runoff and sediment load, thus affecting intra- and inter-annual variations in sediment load in the basin [42]. Since the 1950s, the construction of reservoirs, ponds, and other water storage projects in the YHRB and the increase in industrial and agricultural water consumption, artificial ecological and environmental recharge water consumption, and domestic water consumption have affected the spatial and temporal distribution characteristics of surface water and reduced the amount of surface runoff, leading to a downward trend in the annual sediment load in the YHRB. Moreover, from the 1970s to the beginning of the 21st century, changes in land-use areas, such as arable land, grassland, forest land, and construction land, and the large-scale implementation of soil and water conservation measures, such as terraces, construction of dammed land, soil and water conservation forests, and economic forests in the YHRB, have resulted in significant changes in surface cover conditions. Available studies have investigated the hypothesis that extreme rainfall stimulates the formation and development of slope erosion, and in particular, that rainfall intensity and slope significantly affect channel erosion [43,44]. In some cases of extreme rainfall, the human activities described above have strongly interfered with the hydrological cycle and changed the conditions for sediment production, sinking, and transportation on the slopes of the YHRB, greatly affecting the intra- and inter-annual variation in sediment transport in the basin.
Combined with the contribution of human activities to sediment reduction in the YHRB during transitional phases I (1966–1980) and II (1981–2020) (73.14 and 71.97%, respectively) and the above analyses, it can be seen that human activities, such as the construction of hydraulic engineering, changes in water consumption, changes in land use, and soil and water conservation measures, were the main factors affecting the changes in sediment load in the YHRB in recent years. Shi et al. studied the spatial and temporal distribution characteristics of sediment transport in the Huaihe River and its tributaries using measured annual runoff and annual sediment load data covering more than 50 years and found that the annual sediment load of its tributary, namely, the YHRB, showed a significant decreasing trend [45]. The research showed that human activities, especially the construction of reservoirs in mountainous rivers in the basin, were the main reason for the decrease in sediment load in the basin, which is consistent with the results of our study. Qiao et al. found a decreasing trend of sediment transport from 1956 to 2020 when they studied the change of sediment transport in the YHRB [46]. The research showed that the areas with higher erosion intensity were distributed upstream with higher elevation and slope, and the sub-basin in the confluence area of the main stream and tributaries was less eroded. Human activities such as hydraulic engineering construction and soil and water conservation measures played an important role in the reduction in sediment transport in the YHRB, which is consistent with the findings of this paper. Many scholars have also found a significant downward trend in sediment load in large rivers in northern China, such as the Liaohe River Basin [47], Haihe River Basin [48], HRB [45], Songhua River Basin [49], and YRB [50] and its sub-basins [51]. An attribution analysis of the factors affecting sediment load in the above basins showed that changes in precipitation were not the main cause of the significant reduction in sediment transport in the basins. Moreover, human activities, such as landscape projects, terracing, construction of reservoirs, changes in the use of water resources, changes in land use, adjustments in the structure of industries, and large-scale vegetation restoration projects, were the main factors affecting the reduction in sediment transport in the basins.

4.3. Limitations

In this study, we utilized simple linear regression and DCCs for the attribution analysis of sediment load, which require limited data and are easy to calculate. However, neglecting factors such as evapotranspiration and extreme precipitation while solely focusing on precipitation may present a bias, potentially overstating the effects of human activities. In this study, we assumed that the effects of precipitation and human activities on sediment transport are independent of each other and that precipitation and human activities are regarded as separate factors that play a role in the attribution analysis of sediment load. However, in reality, climate change and human activity interact; climate change intensifies human activity, whereas humans adapt to it [52]. Moreover, differences in human activities across different regions and scales introduce variations in their effects, warranting the integration of hydrology, meteorology, and ecohydrology disciplines along with advanced techniques, such as multi-model coupling and field monitoring [53], to better quantify the impacts of human activities.

5. Conclusions

Over the past 65 years, the precipitation and sediment load in the YHRB were concentrated in summer and autumn. Inter-annual precipitation and sediment load fluctuations demonstrated decreasing trends. The sediment load in the YHRB was influenced by both precipitation and human activity. Spatially, the upper sub-basin of the YHRB was more severely eroded, especially Sub3, which had a higher sediment load. On the other hand, the sediment load of Sub4, located downstream, is lighter and dominated by sedimentation. Prior to 1965, human activities minimally influenced the sediment load. However, human activities contributed to 72.32% of the reduction in sediment load in the transitional phase (1966–2020), significantly exceeding precipitation. Hydraulic engineering construction, water resource development, land-use changes, and soil and water conservation measures have significantly influenced the pattern of sediment transportation. Therefore, it is necessary to reduce watershed erosion in the future in the following aspects: conversion of sloping arable land into level terraces, afforestation, enclosure management, and other soil and water conservation measures. This study can provide a reference for the ecological construction and sustainable development in the basin.

Author Contributions

Conceptualization, J.L. (Jinkuo Lin) and Z.L. (Zhijie Lu); methodology, S.Z.; software, J.L. (Jiayuan Liu); validation, Z.L. (Zijun Li), S.Z., and B.C.; formal analysis, J.L. (Jinkuo Lin); investigation, Y.M.; resources, B.C.; data curation, F.W.; writing—original draft preparation, J.L. (Jiayuan Liu); writing—review and editing, M.Z.; visualization, S.Z.; supervision, M.Z.; project administration, F.W.; funding acquisition, M.Z. and Z.L. (Zijun Li). All authors have read and agreed to the published version of the manuscript.

Funding

This research was funded by the Significant Science and Technology Project of the Ministry of Water Resources (grant number SKS-2022013) and the National Natural Science Foundation of China (grant number 41101079).

Institutional Review Board Statement

Not applicable.

Informed Consent Statement

Not applicable.

Data Availability Statement

The data presented in this study are available on request from the corresponding author.

Acknowledgments

We thank the anonymous reviewers for their good advice.

Conflicts of Interest

The authors declare no conflicts of interest.

References

  1. Abebe, S.; Qin, T.; Zhang, X.; Yan, D. Wavelet transform-based trend analysis of streamflow and precipitation in Upper Blue Nile River basin. J. Hydrol. Reg. Stud. 2022, 44, 101251. [Google Scholar] [CrossRef]
  2. Walling, D.; Fang, D. Recent trends in the suspended sediment loads of the world’s rivers. Glob. Planet. Chang. 2003, 39, 111–126. [Google Scholar] [CrossRef]
  3. Wang, J.; Shi, B.; Zhao, E.; Yuan, Q.; Chen, X. The long-term spatial and temporal variations of sediment loads and their causes of the Yellow River Basin. Catena 2022, 209, 105850. [Google Scholar] [CrossRef]
  4. Chen, Y.; Wang, Y. Variations in basin sediment yield and channel sediment transport in the upper Yangtze River and influencing factors. J. Hydrol. Eng. 2019, 24, 05019016. [Google Scholar] [CrossRef]
  5. Wu, C.; Ji, C.; Shi, B.; Wang, W.; Gao, J.; Yang, Y.; Mu, J. The impact of climate change and human activities on streamflow and sediment load in the Pearl River basin. Int. J. Sediment Res. 2019, 34, 307–321. [Google Scholar] [CrossRef]
  6. Ye, Z.; Chen, Y.; Zhang, Q.; Liu, Y.; Zhang, X. Research on sediment discharge variations and driving factors in the Tarim River Basin. Remote. Sens. 2022, 14, 5848. [Google Scholar] [CrossRef]
  7. Su, X.; Li, X.; Niu, Z.; Wang, N.; Liang, X. A new complexity-based three-stage method to comprehensively quantify positive/negative contribution rates of climate change and human activities to changes in runoff in the upper Yellow River. J. Clean. Prod. 2021, 287, 125017. [Google Scholar] [CrossRef]
  8. Güçlü, Y. Improved visualization for trend analysis by comparing with classical Mann-Kendall test and ITA. J. Hydrol. 2020, 584, 124674. [Google Scholar] [CrossRef]
  9. Liu, X.; Xu, Z. Spatial and temporal pattern of extreme temperature during 1961–2018 in China. J. Water Clim. Chang. 2020, 11, 1633–1644. [Google Scholar] [CrossRef]
  10. Wang, T.; Song, C.; Chen, X. Clarifying the relationship between annual maximum daily precipitation and climate variables by wavelet analysis. Atmos. Res. 2023, 295, 106981. [Google Scholar] [CrossRef]
  11. Luiza, C.; Débora, M.; Fábio, M. Bootstrap Pettitt test for detecting change points in hydroclimatological data: Case study of Itaipu Hydroelectric Plant, Brazil. Hydrolog. Sci. J. 2019, 64, 1312–1326. [Google Scholar]
  12. Gao, P.; Deng, J.; Chai, X.; Mu, X. Dynamic sediment discharge in the Hekou–Longmen region of Yellow River and soil and water conservation implications. Sci. Total Environ. 2017, 578, 56–66. [Google Scholar] [CrossRef] [PubMed]
  13. Chen, H.; Chen, L. Response of runoff variation to the changing environments of karst regions in southwest China. Hydrolog. Sci. J. 2022, 67, 2344–2357. [Google Scholar] [CrossRef]
  14. Zhou, S.; Yu, B.; Huang, Y.; Wang, G. The complementary relationship and generation of the Budyko function. Geophys. Res. Lett. 2015, 42, 1781–1790. [Google Scholar] [CrossRef]
  15. Luo, Y.; Wang, H.; Meersmans, J.; Green, S.; Quine, T.; Feng, S. Modeling soil erosion between 1985 and 2014 in three watersheds on the carbonate-rock dominated Guizhou Plateau, SW China, using WaTEM/SEDEM. Prog. Phys. Geog. 2020, 45, 53–81. [Google Scholar] [CrossRef]
  16. Ruiz-Pérez, G.; Medici, C.; Latron, J.; Llorens, P.; Gallart, F.; Francés, F. Investigating the behaviour of a small Mediterranean catchment using three different hydrological models as hypotheses. Hydrol. Process. 2016, 30, 2050–2062. [Google Scholar] [CrossRef]
  17. Porto, P.; Callegari, G. Using 7Be measurements to explore the performance of the SEDD model to predict sediment yield at event scale. Catena 2021, 196, 104904. [Google Scholar] [CrossRef]
  18. Gao, H.; Jin, J. Analysis of water yield changes from 1981 to 2018 using an improved Mann-Kendall Test. Remote. Sens. 2022, 14, 2009. [Google Scholar] [CrossRef]
  19. Karen, R.; Glenn, A.; Robert, W. Change points in annual peak streamflows: Method comparisons and historical change points in the United States. J. Hydrol. 2020, 583, 124307. [Google Scholar]
  20. Martínez-Fernández, V.; Solana-Gutiérrez, J.; González del Tánago, M.; García de Jalón, D. Automatic procedures for river reach delineation: Univariate and multivariate approaches in a fluvial context. Geomorphology 2016, 253, 38–47. [Google Scholar] [CrossRef]
  21. Pettitt, A.N. A Non-Parametric Approach to the Change-Point Problem. J. R. Stat. Soc. C-Appl. 1979, 28, 126–135. [Google Scholar] [CrossRef]
  22. Sun, P.; Wu, Y.; Gao, J.; Yao, Y.; Zhao, F.; Lei, X.; Qiu, L. Shifts of sediment transport regime caused by ecological restoration in the Middle Yellow River Basin. Sci. Total. Environ. 2020, 698, 134261. [Google Scholar] [CrossRef] [PubMed]
  23. Wang, H.; Sun, F. Variability of annual sediment load and runoff in the Yellow River for the last 100 years (1919–2018). Sci. Total Environ. 2020, 758, 143715. [Google Scholar] [CrossRef]
  24. Quan, J.; Xu, Y.; Ma, T.; Wilson, J.; Zhao, N.; Ni, Y. Improving surface water quality of the Yellow River Basin due to anthropogenic changes. Sci. Total Environ. 2022, 836, 155607. [Google Scholar] [CrossRef]
  25. Yu, Y.; Li, Z.; Lin, J.; Liu, J.; Wang, S. TUPU characteristics of spatiotemporal variation for land use in the Yihe River Basin. J. Nat. Resour. 2019, 34, 975–988. [Google Scholar] [CrossRef]
  26. He, Y.; Song, J.; Hu, Y.; Tu, X.; Zhao, Y. Impacts of different weather conditions and landuse change on runoff variations in the Beiluo River Watershed, China. Sustain. Cities Soc. 2019, 50, 101674. [Google Scholar] [CrossRef]
  27. Jia, S.; Zheng, C.; Zhuang, H.; Sang, G.; Wu, W. Evaluation of sustainable utilization of water resources in the Yihe River based on driving Force-Pressure-State-Impact-Response Model. Hydrology 2022, 42, 61–66. [Google Scholar]
  28. Liu, D.; Ma, C.; Xiang, Y.; Jiang, Z. Hazards of soil erosion and its prevention and control in the hilly area of southcentral Shandong Province. Bull. Soil Water Conser. 1983, 1, 38–45. [Google Scholar]
  29. Li, Z.; Xu, Y.; Wang, H.; Ma, L.; Jiang, A.X. Modeling soil erosion and sediment yield using WaTEM/SEDEM for Yihe River Basin. Geo. Res. 2021, 40, 2380–2396. [Google Scholar]
  30. Zhang, Y.; Zhao, Q.; Ai, M.; Sang, G.; Zhao, S. Spatial-temporal scale analysis of rainfall and rainfall erosivity in Yihe River Basin. J. Shandong Univ. Eng. Sci. Ed. 2023, 53, 122–132. [Google Scholar]
  31. Liu, Y.; Wang, H.; Lin, Y.; Cao, L.; Zhang, S.; Ge, W.; Han, G.; Chen, H.; Shi, S. Assessing the contributions of human activities to runoff and sediment transport change: A method for break point identification in double mass curves based on model fittin. J. Hydrol. Reg. Stud. 2023, 50, 101589. [Google Scholar] [CrossRef]
  32. Duan, J.; Zhu, H.; Dan, L.; Tang, Q. Recent progress in studies on the influences of human activity on regional climate over China. Adv. Atmos. Sci. 2023, 40, 1362–1378. [Google Scholar] [CrossRef]
  33. Wei, Y.; Jiao, J.; Zhao, G.; Zhao, H.; He, Z.; Mu, X. Spatial–temporal variation and periodic change in streamflow and suspended sediment discharge along the mainstream of the Yellow River during 1950–2013. Catena 2016, 140, 105–115. [Google Scholar] [CrossRef]
  34. Jia, Y. Analysis of variation trends and cause of runoff and sediment in Yihe River Basin. Res. Soil Water Conserv. 2017, 24, 142–145. [Google Scholar]
  35. Zhang, H.; Yu, B.; Ni, J.; Wang, J. Susceptibility and periodicity of water and sediment characteristics of mainstream Huaihe River in recent 66 years. J. Yangtze River Sci. Res. Inst. 2020, 37, 6–11. [Google Scholar]
  36. Zhong, K.; Zheng, F.; Liu, G.; Zheng, X.; Qin, C.; Xu, X. Effects of variations in precipitation extremes on sediment load in the Second Songhua River Basin, Northeast China. J. Soils Sediments 2023, 23, 1971–1984. [Google Scholar] [CrossRef]
  37. Sun, S.; Zhu, L.; Hu, K.; Li, Y.; Nie, Y. Quantitatively distinguishing the factors driving sediment flux variations in the Daling River Basin, North China. Catena 2022, 212, 106094. [Google Scholar] [CrossRef]
  38. An, C.; Fang, H.; Wang, F. Characteristics of runoff and sediment yield on slopes and their responses to rainfalls in the upstream of the Miyun Reservoir: A case study of the Shixia Watershed. Sci. Soil Water Conserv. 2020, 18, 43–51. [Google Scholar]
  39. Chen, X.; An, Y.; Zhang, Z.; Hu, C. Equilibrium relations for water and sediment transport in the Yellow River. Int. J. Sediment Res. 2021, 36, 328–334. [Google Scholar] [CrossRef]
  40. Sui, J.; He, Y.; Liu, C. Changes in sediment transport in the Kuye River in the Loess Plateau in China. Int. J. Sediment Res. 2009, 24, 201–213. [Google Scholar] [CrossRef]
  41. Wharton, G.; Mohajeri, S.; Righetti, M. The pernicious problem of streambed colmation: A multi-disciplinary reflection on the mechanisms, causes, impacts, and management challenges. WIREs Water 2017, 4, E1231. [Google Scholar] [CrossRef]
  42. Wang, Z.; Wu, B.; Wang, G. Fluvial processes and morphological response in the Yellow and Weihe Rivers to closure and operation of Sanmenxia Dam. Geomorphology 2007, 91, 65–79. [Google Scholar] [CrossRef]
  43. Yan, Y.; Tu, N.; Cen, L.; Gan, F.; Dai, Q.; Mei, L. Characteristics and dynamic mechanism of rill erosion driven by extreme rainfall on karst plateau slopes, SW China. Catena 2024, 238, 107890. [Google Scholar] [CrossRef]
  44. Zhu, Q.; Yang, X.; Ji, F.; Liu, D.; Yu, Q. Extreme rainfall, rainfall erosivity, and hillslope erosion in Australian Alpine region and their future changes. Int. J. Climatol. 2020, 40, 1213–1227. [Google Scholar] [CrossRef]
  45. Shi, H.; Hu, C.; Wang, Y.; Tian, Q. Variation trend and cause of runoff and sediment load variations in Huaihe River. J. Hydraul. Eng. 2012, 43, 571–579. [Google Scholar]
  46. Qiao, X.; Li, Z.; Lin, J.; Wang, H.; Zheng, S.; Yang, S. Assessing current and future soil erosion under changing land use based on InVEST and FLUS models in the Yihe River Basin, North China. Int. Soil Water Conserv. Res. 2024, 12, 298–312. [Google Scholar] [CrossRef]
  47. Zhang, Y.; Hu, C.; Wang, Y. Analysis on variation characteristics and influential factors of runoff and sediment of Liaohe River Basin. Yangtze River 2014, 45, 32–35+68. [Google Scholar]
  48. Liu, C.; Wang, Z.; Sui, J. Analysis on variation of seagoing water and sediment load in main rivers of China. J. Hydraul. Eng. 2007, 12, 1444–1452. [Google Scholar]
  49. Zhang, X.; Chen, C.; Jia, D. Processes of water-sediment and channel pattern of the Songhua River. J. Sediment Res. 2021, 46, 37–43. [Google Scholar]
  50. Wang, S.; Fu, B.; Piao, S.; Lu, Y.; Ciais, P.; Feng, X.; Wang, Y. Reduced sediment transport in the Yellow River due to anthropogenic changes. Nat. Geosci. 2016, 9, 38–41. [Google Scholar] [CrossRef]
  51. Shi, H.; Hu, C.; Wang, Y.; Liu, C.; Li, H. Analyses of trends and causes for variations in runoff and sediment load of the Yellow River. Int. J. Sediment Res. 2017, 32, 171–179. [Google Scholar] [CrossRef]
  52. Wei, D.; Liu, S.; Wu, Y.; Feng, S.; Gao, H.; Qin, C.; Ren, D.; Tang, W.; Zhang, Y. Impacts of human activities and climate change on water and sediment evolution in four large subtropical river basins in China. Ecol. Indic. 2023, 155, 110958. [Google Scholar] [CrossRef]
  53. Zhao, G.; Mu, X.; Jiao, J.; Gao, P.; Sun, W.; Li, E.; Wei, Y.; Huang, J. Assessing response of sediment load variation to climate change and human activities with six different approaches. Sci. Total Environ. 2018, 639, 73–784. [Google Scholar] [CrossRef] [PubMed]
Figure 1. Distribution of the water system, rain gauge stations, and hydrological station in the YHRB. (a,b) Locations of Shandong Province and the YHRB; (c) Dem, sub-basin, and locations of the hydrological and rain gauge stations of the YHRB.
Sustainability 16 05396 g001
Figure 2. Changes in average monthly precipitation and sediment load in the YHRB.
Sustainability 16 05396 g002
Figure 3. Changes in the annual precipitation and annual sediment load in the YHRB from 1956 to 2020.
Sustainability 16 05396 g003
Figure 4. Wavelet analysis of precipitation in the YHRB from 1956 to 2020. (a) Wavelet-transformed real part plot of annual precipitation; (b) wavelet variance plot of annual precipitation.
Sustainability 16 05396 g004
Figure 5. Wavelet analysis of sediment load in the YHRB from 1956 to 2020. (a) Wavelet-transformed real part plot of annual sediment load; (b) wavelet variance plot of annual sediment load.
Sustainability 16 05396 g005
Figure 6. Changes in the spatial distribution of sediment transport modulus in the YHRB.
Sustainability 16 05396 g006
Figure 7. Annual total reservoir capacity change of the YHRB from 1956 to 2020.
Sustainability 16 05396 g007
Figure 8. Temporal variations in annual water consumption in the YHRB from 1984 to 2020 (artificial ecological and environmental recharge water consumption refers to the transfer of water to ecosystems damaged by the failure to meet minimum ecological water demand through the adoption of engineering or non-engineering measures to replenish their ecosystem water consumption, to curb the destruction of ecosystem structure and loss of function, and to gradually restore the ecosystem’s original ability to self-regulate function; industrial and domestic water consumption refers to the amount of water extracted and does not include the amount of water reused).
Sustainability 16 05396 g008
Figure 9. Land-use structures in the YHRB in 1975, 1995, and 2020.
Sustainability 16 05396 g009
Figure 10. Characteristics of land-use transfer in the YHRB in 1975, 1995, and 2020.
Sustainability 16 05396 g010
Figure 11. Temporal variations in the cumulative area of soil and water conservation measures in the YHRB from 1972 to 2017 (dammed land refers to the arable land formed by damming in the gully and blocking the soil washed down from the mountain).
Sustainability 16 05396 g011
Figure 12. DCCs of annual sediment load and precipitation in the YHRB.
Sustainability 16 05396 g012
Figure 13. Test of abrupt points of annual sediment transport in the YHRB. (a) Test of abrupt points of annual sediment transport from 1956 to 2020 using the PMP test; (b) test of abrupt points of annual sediment transport from 1956 to 1980 using the PMP test.
Sustainability 16 05396 g013
Figure 14. The characteristics of inter-annual variation in sediment load in the YHRB from 1956 to 2020.
Sustainability 16 05396 g014
Table 1. Changes in average annual precipitation and sediment load in the YHRB from 1956 to 2020.
PeriodPrecipitationSediment Load
Average Value
(mm)
Variation
Coefficient
Average Value
(104 t)
Variation
Coefficient
1956–1960914.890.16923.380.72
1961–1970853.550.23304.740.78
1971–1980795.010.18154.580.90
1981–1990678.670.2733.331.48
1991–2000784.570.1754.151.13
2001–2010814.330.2418.651.28
2011–2020784.960.1955.041.51
1956–2020795.160.23166.495.02
Table 2. Sediment transport in sub-basins of the YHRB.
Sub-BasinPeriodControlled Area (km2)Average Sediment Load (104 t)Sediment Transport Modulus (t·km−2)
Sub11957–1967, 1970–20205509.6250.0790.88
Sub21976–1997542.9210.34190.45
Sub31956–1967, 1970–20203356.5875.23224.13
Sub41976–1997615.586−2.76−44.77
Table 3. Impacts of precipitation changes and human activities on the annual sediment load in the YHRB from 1956 to 2020.
PeriodTheoretical Sediment Load (104 t/a)Measured Sediment Load (104 t/a)Impact of Human ActivitiesImpact of Precipitation
Influence Quantity (104 t/a)Contribution (%)Influence Quantity (104 t/a)Contribution (%)
1966–1980553.88144.54409.3473.14150.3126.86
1981–2020518.6942.41476.2871.97185.5028.03
1966–2020528.2968.73459.5672.32175.9027.68
Note: Sediment load reduction owing to precipitation changes was determined by subtracting the theoretical sediment load from the average sediment load of 7,041,900 t/a during the initial phase.
Table 4. Characteristics of precipitation fluctuation in the YHRB from 1956 to 2020.
PeriodAverage Precipitation (mm)K-ValueDivision
1956–1960914.891.15Abundant water
1961–1970853.551.08Flat water
1971–1980795.011.00Flat water
1981–1990678.670.85Dry water
1991–2000784.570.99Flat water
2001–2010814.331.02Flat water
2011–2020784.960.99Flat water
Disclaimer/Publisher’s Note: The statements, opinions and data contained in all publications are solely those of the individual author(s) and contributor(s) and not of MDPI and/or the editor(s). MDPI and/or the editor(s) disclaim responsibility for any injury to people or property resulting from any ideas, methods, instructions or products referred to in the content.

