Article

Assessing Salinity Reduction by Environmental Restoration in the Seomjin River Estuary (South Korea): A Numerical Model Approach for Corbicula Habitat Conservation

1
Research Center for Water, ECOLABS 50, Yeosu-si 59626, Republic of Korea
2
Environmental Assessment Group, Korea Environment Institute, Sejong 30147, Republic of Korea
3
Forecast and Control Division, Han River Flood Control Office, Seoul 06501, Republic of Korea
4
Department of Aquaculture, College of Fisheries and Ocean Sciences, Chonnam National University, Yeosu-si 59626, Republic of Korea
*
Author to whom correspondence should be addressed.
Sustainability 2024, 16(13), 5653; https://doi.org/10.3390/su16135653
Submission received: 11 March 2024 / Revised: 25 June 2024 / Accepted: 26 June 2024 / Published: 2 July 2024
(This article belongs to the Section Environmental Sustainability and Applications)

Abstract

:
This study modelled possible ways of reducing salinity in the Seomjin River estuary to improve habitats for corbicula, which are important components of the ecosystem (ecologically and commercially) in the Seomjin River. Additionally, we analyzed the salinity reduction effects of structural measures to sustain optimal salinity. To do this, salinity measurement facilities were installed at crucial habitat locations in the Seomjin River estuary. After ensuring the reliability of the model, numerical simulations were conducted. Salinity changes were analyzed for four major locations (Dugok, Shinbi, Mokdo, Hwamok) and simulated under various conditions, resulting in concentrations of 4.7 psu in Dugok, 16.0 psu in Shinbi, 19.2 psu in Mokdo, and 28.2 psu in Hwamok. Additionally, this study analyzed reduction effects by applying three reduction scenarios (riverbed restoration, submerged weir, and groyne) by simulating the numerical model. The reductions in salinity for the submerged weir (SWS-1 to 3) and groyne (GS-1 to 3) scenarios were minimal, below 1 psu, indicating a very limited reduction effect. In conclusion, the salinity concentration in the Seomjin River estuary is dominated by the neap tide, and the salinity intrusion distance is influenced more by the spring tide. The Songjeong discharge strongly impacts the spring tide, while the neap tide is less dominant due to salinity stratification. Among the salinity reduction scenarios, riverbed restoration has the most critical effect, but artificial reduction measures may pose challenges in terms of cost and practicality.

1. Introduction

An estuary is a transitional zone where freshwater and seawater mix and is dominated by factors such as river flow, tidal currents, wave actions, topography, and density differences between freshwater and saltwater. Coastal areas where rivers reach the sea serve as habitats for diverse fauna and act as natural harbors, functioning in supporting industrial development and natural pollution treatment [1]. Estuarine areas experience large variations in salinity, not only geographically but also temporally, depending on seasons and precipitation. In particular, the Seomjin River is the fourth largest river in South Korea among the five major rivers, maintaining its natural state without embankments, dams, or riverside development. The habitat of the Corbiculidae genus, specifically the corbicula, has drastically decreased in the Seomjin River estuary, leading to a decline in corbicula resources, but there is no clear scientific review of the causes and alternatives to these issues [1]. Corbiculas belong to the phylum Molluska, order Bivalvia, and family Corbiculidae and include species such as Japanese corbiculas, princess corbiculas, genuine corbiculas, and thin corbiculas. They are small filter-feeding bivalves that inhabit freshwater or brackish environments at shallow depths. Corbiculas not only hold great commercial value as important fisheries resources but are also crucial for purifying aquatic ecosystems as filter-feeding bivalves. In the Seomjin River, Japanese corbiculas are predominant, constituting approximately 30% of corbicula production in South Korea. However, the intrusion of high salinity due to seawater encroachment in the Seomjin River estuary is expected to affect not only the habitat reduction of corbiculas but also their size and growth [2].
Most researchers focus on changes in salinity due to variations in flow rates. However, this numerical modelling study focuses on restoration management practices for reducing saltwater intrusion using physical structures to restrict tidal intrusion. In South Korea, several studies have been completed to enhance the management of saltwater intrusion. For example, Son [3] reevaluated saltwater intrusion and the prevention of salinity-induced damage in the Nakdong River Estuary using the EFDC model, and Han [4] conducted numerical model experiments using finite-difference grid systems to investigate the characteristics of average tides in Gwangyang and Jinju Bays. Nevertheless, there has been a limitation of modeling regarding alternative arrangements for salinity intrusion in the Seomjin River estuary.
In the upper reaches of the Seomjin River, major facilities such as the Seomjin Dam and the Jueom Dam have been established. Due to the construction of the Seomjin Dam in 1965 and the completion of the Jueom Dam in 1992, downstream water levels fluctuated, and the water discharge decreased as part of the government’s economic development plan [5]. Furthermore, various environmental impacts, such as sedimentation and landfilling in estuaries, have caused an influx of seawater into the upper reaches of estuaries, leading to the gradual expansion of estuarine freshwater areas. To address these environmental issues, various measures have been proposed, including increasing the discharge volume from the Seomjin Dam and the Jueom Dam, converting the water stored for hydropower generation to maintenance water, improving the management system for the Yeongsan River and Seomjin River to support estuarine salinity, and developing plans for water distribution in the Seomjin River basin. However, these measures have not been reflected in practical projects based on objective scientific knowledge regarding their pre-project effects and impacts [6]. Globally, such regional conflicts have always been at odds, and despite this, previous studies have focused on identifying the damage caused by salinity to crops. However, this study aims to investigate the damage caused by salinity to marine resources, particularly corbicula, and it is expected that this issue will become more severe with global issues like climate change [7,8].
Under specific conditions, there are inevitable issues in the Seomjin River estuary. Sea-level rise due to global climate change is a grave concern, and the increase in saltwater intrusion and salinity stratification in estuaries due to rising sea levels is rapidly increasing worldwide. For the Korean Peninsula, a sea-level rise of 0.75 m under RCP4.5 is estimated at the coast line in the East Sea by 2100, followed by the South Sea (0.58 m) and the West Sea (0.57 m) [9]. As the open estuary of the Seomjin River Estuary is very vulnerable to rising sea levels due to climate change, strategies for mitigating sustainable aquatic ecosystems through sea-level rise should be developed at the state or local government level. Therefore, we aimed (1) to construct a three-dimensional numerical model using the Environmental Fluid Dynamics Code (EFDC) for the main stream and estuarine area of the Seomjin River and (2) to validate the model based on measured tidal levels, water levels, and salinity data in the target area. Subsequently, (3) salinity reduction effects were evaluated using the validated model through structural management practices (scenarios). Finally, quantitative assessments of the salinity intrusion distance in estuaries under different scenarios were performed to provide insights into strategies for sustainable aquatic ecosystems during corbicula growth.

2. Materials and Methods
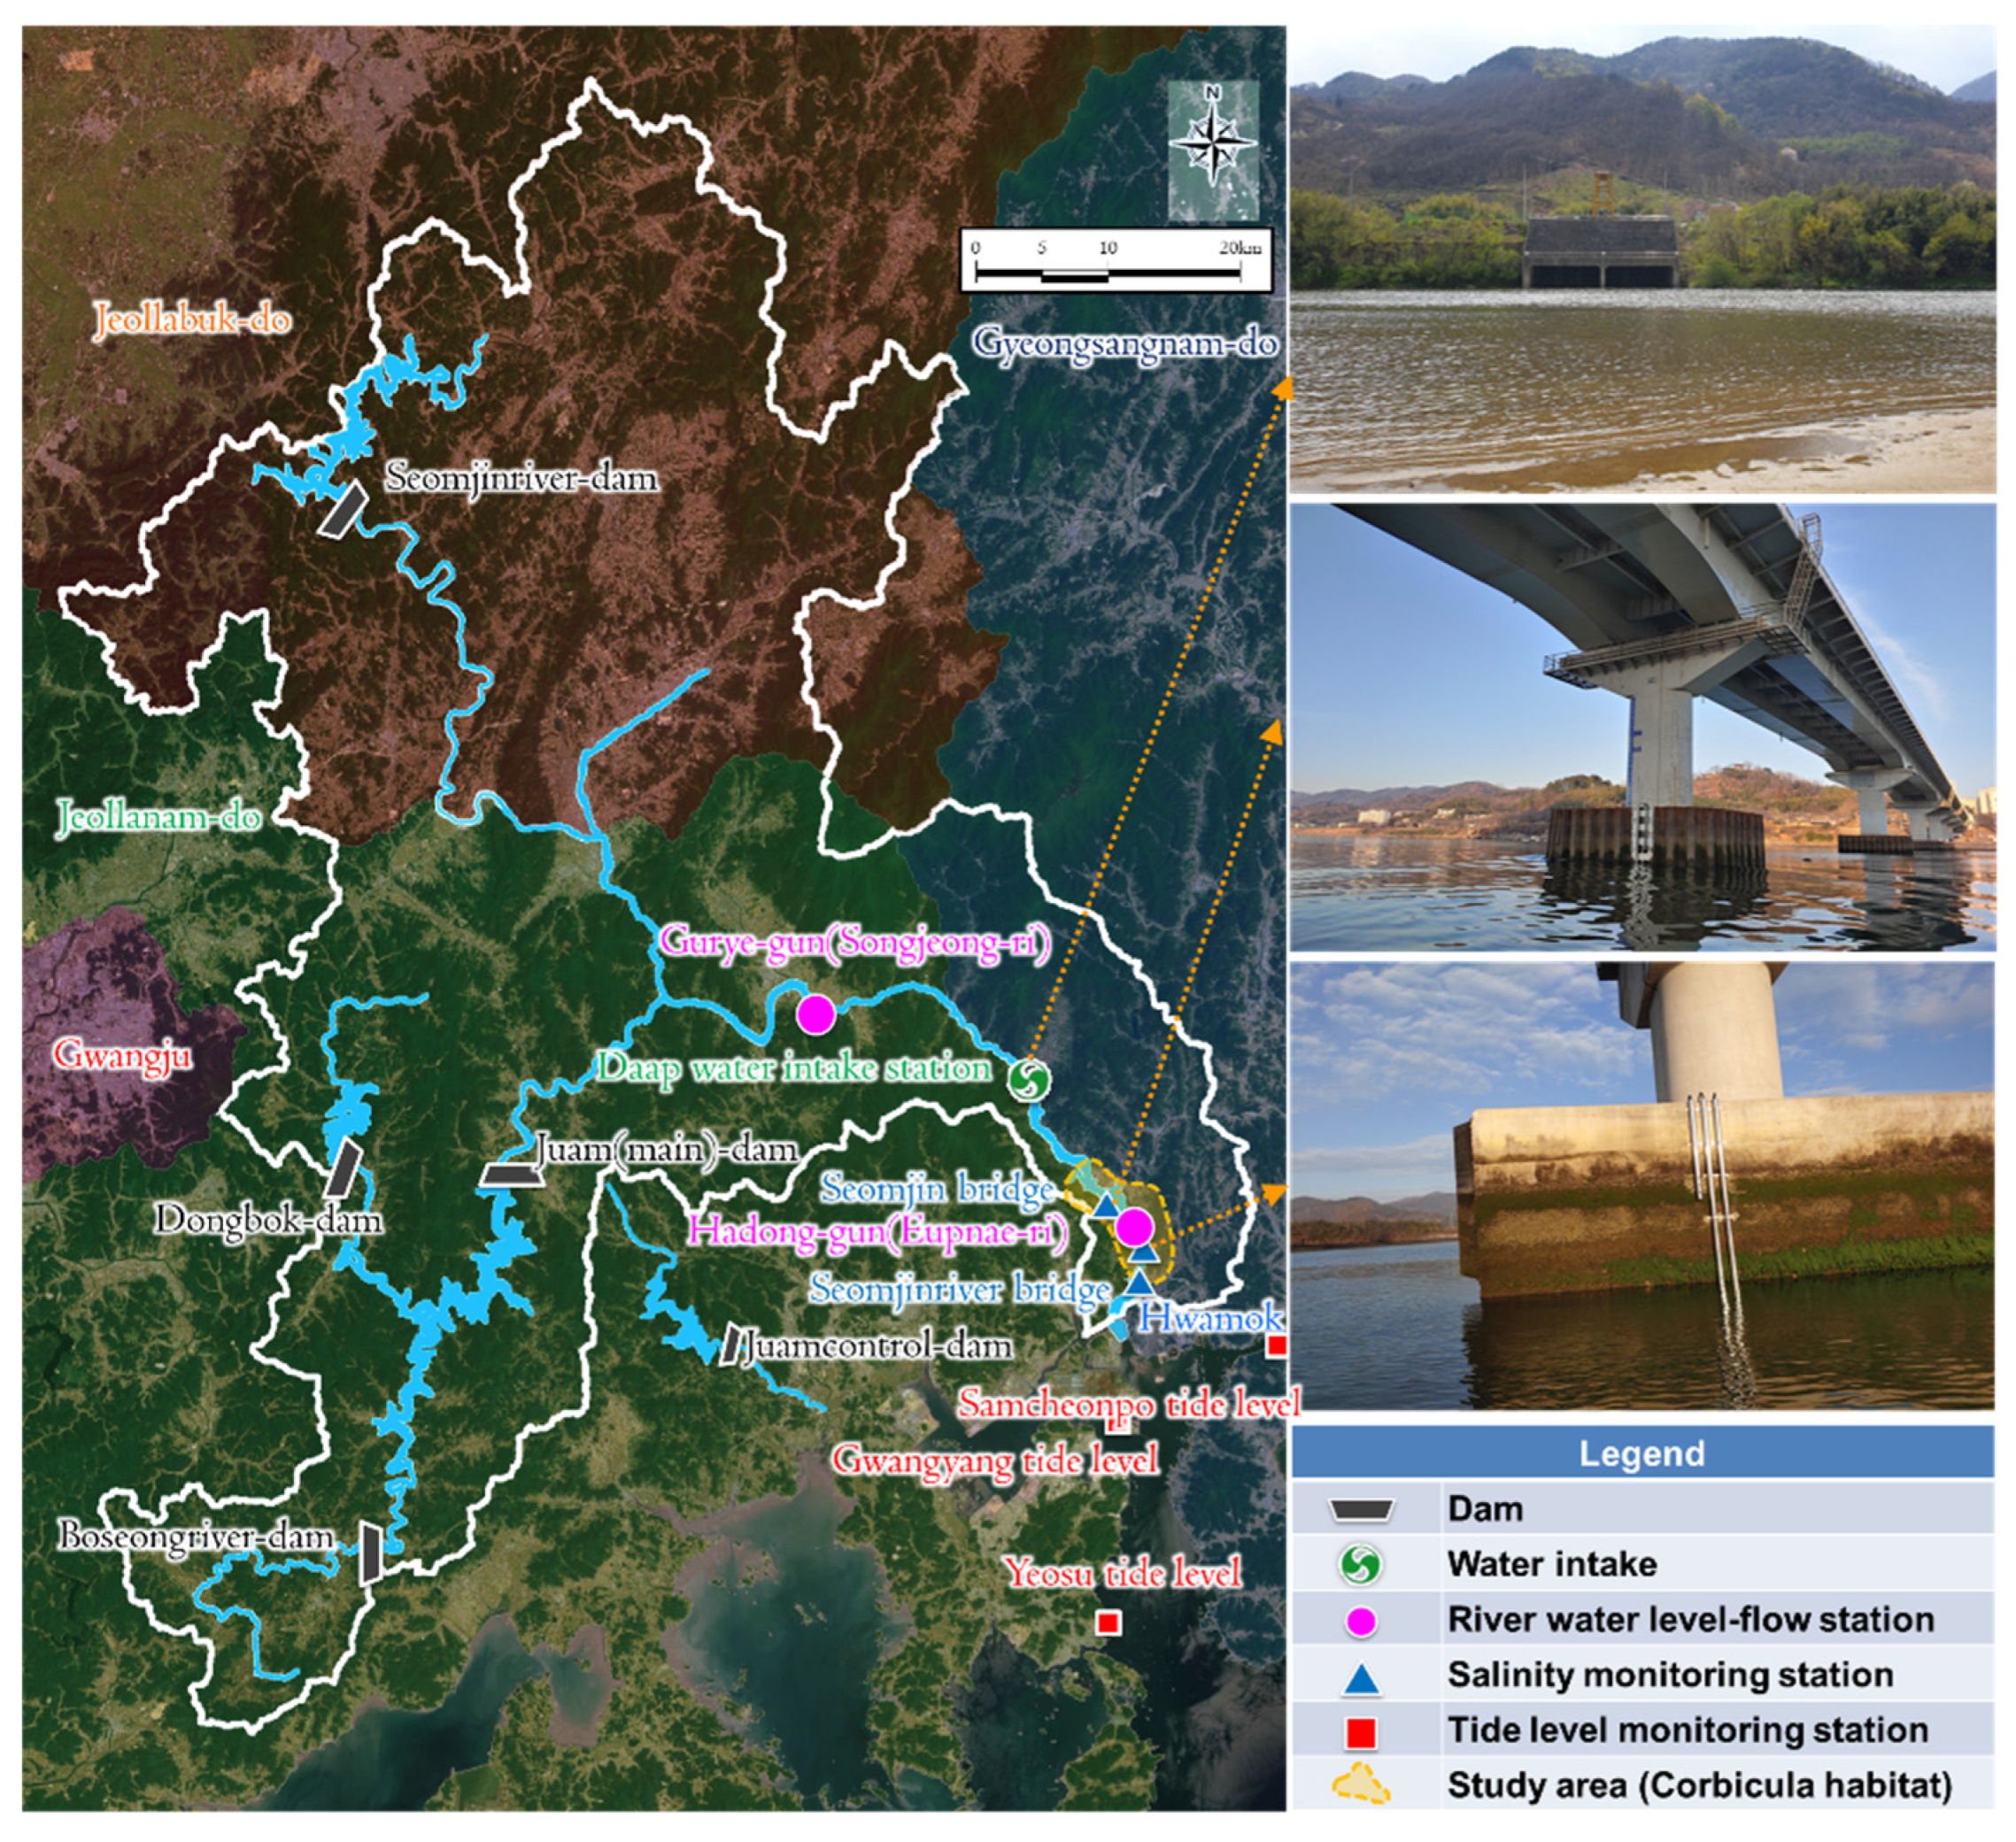
2.1. Study Area

The Seomjin River basin, in the central-western region of the southern coast of South Korea, is one of the five major river basins in South Korea. Geographically, it is situated between east longitude 126°51′50″~127°53′05″ and north latitude 34°40′26″~35°50′0″. The Seomjin River basin spans 4913.22 km2 in area, with a river length of 222.14 km. The mean elevation is recorded at EL. 301.58 m [8] (Figure 1). The land use distribution comprises 876.29 km2 of arable land, 3400.61 km2 of forested area, 67.12 km2 of developed land, and other areas totaling 567.86 km2, with approximately 69.2% of the total watershed area consisting of forested land [10]. Key facilities such as the Seomjin Dam and the Juam Dam on the Boseong River are strategically located upstream of Seomjin River’s main stream. Due to the expansion of the Seomjin Dam in 1965 and the completion of the Juam Dam in 1992, downstream sulfur fluctuations and reduced discharge have occurred, primarily to supply a substantial amount of water outside the watershed in line with the government’s economic development plan. Concurrently, various impacts, such as sand mining and landfilling in estuaries, have led to the influx of saline water into upstream estuaries, causing long-term ecological changes in watersheds [10].
This study area represents an open estuary approximately 10–15 km from the estuary, where corbicula harvesting is predominantly conducted by local fishermen, as corbiculas mainly inhabit this region. However, since the early 2000s, there have been persistent complaints from fishermen due to the intrusion of high-salinity seawater into the corbicula habitat, resulting in corbicula damage. In this study, our aim was to quantify the penetration amount and intrusion distance of high salinity, which affects the corbicula habitat, by selecting the optimal salinity concentration for the corbicula habitat based on the literature, specifically 15 to 20 psu [11]. As shown in Figure 1, the Seomjin River estuary is a habitat for corbiculas, with the major breeding grounds located approximately 10–15 km downstream from the estuary, particularly around the Seomjin Bridge and Seomjin River Bridge. Although local fishermen claim that the Hwamok area, 5–10 km downstream from the estuary, serves as a habitat for corbiculas, this has not been verified. Moreover, this area has undergone marine transformation, causing the likelihood of corbicula habitats to be extremely low. Therefore, in the analysis of the EFDC modeling results in this study, we aimed to include not only the major corbicula breeding grounds at the Seomjin Bridge and Seomjin River Bridge (Dugok, Sinbi, Mokdo areas) but also the Hwamok area as an additional focal area for analysis.

2.2. EFDC Model Description

The environmental fluid dynamics code (EFDC) is a three-dimensional numerical model developed by the Virginia Institute of Marine Science in the United States. It is designed to simulate fluid dynamics and material transport in coastal, estuarine, reservoir, wetland, and lake environments. The model facilitates the reproduction of seawater flow and material movement, facilitating two-dimensional and three-dimensional vertical and horizontal modeling. The EFDC is a comprehensive model applicable to both marine and freshwater environments that predicts water flow and water quality changes. It consists of four major components: hydrodynamics, water quality, sediment transport, and toxicological analysis. The hydrodynamic component employs a three-dimensional groundwater equation that considers temperature and salinity. It models 22 state variables, including temperature, salinity, dissolved oxygen, three groups of phytoplankton, the carbon cycle, the nitrogen cycle, the phosphorus cycle, and the silica cycle [12]. Because the EFDC model is used worldwide, it is recommended to refer to various literature sources, including Kim [13], for a comprehensive understanding of the model’s hydraulic and water quality analysis structure [14]. In South Korea, several studies have been completed on the use of models to understand flow dynamics and improve the management of saltwater intrusion. For example, Son [3] reevaluated saltwater intrusion and the prevention of salinity-induced damage in the Nakdong River Estuary using the EFDC model, and [12] developed the Hydrological Simulation Program-Fortran (HSPF) and Environmental Fluid Dynamics Code (EFDC). The EFDC model was modified to effectively simulate the operational conditions and flow of multifunctional weirs constructed in the main river channels. The model was tested against hydrologic, water quality, and algal data collected at the right upstream sites of two weirs in 2014. More detailed descriptions of the model can be found in references [15,16].

2.3. Data Setup for a Simulation Model

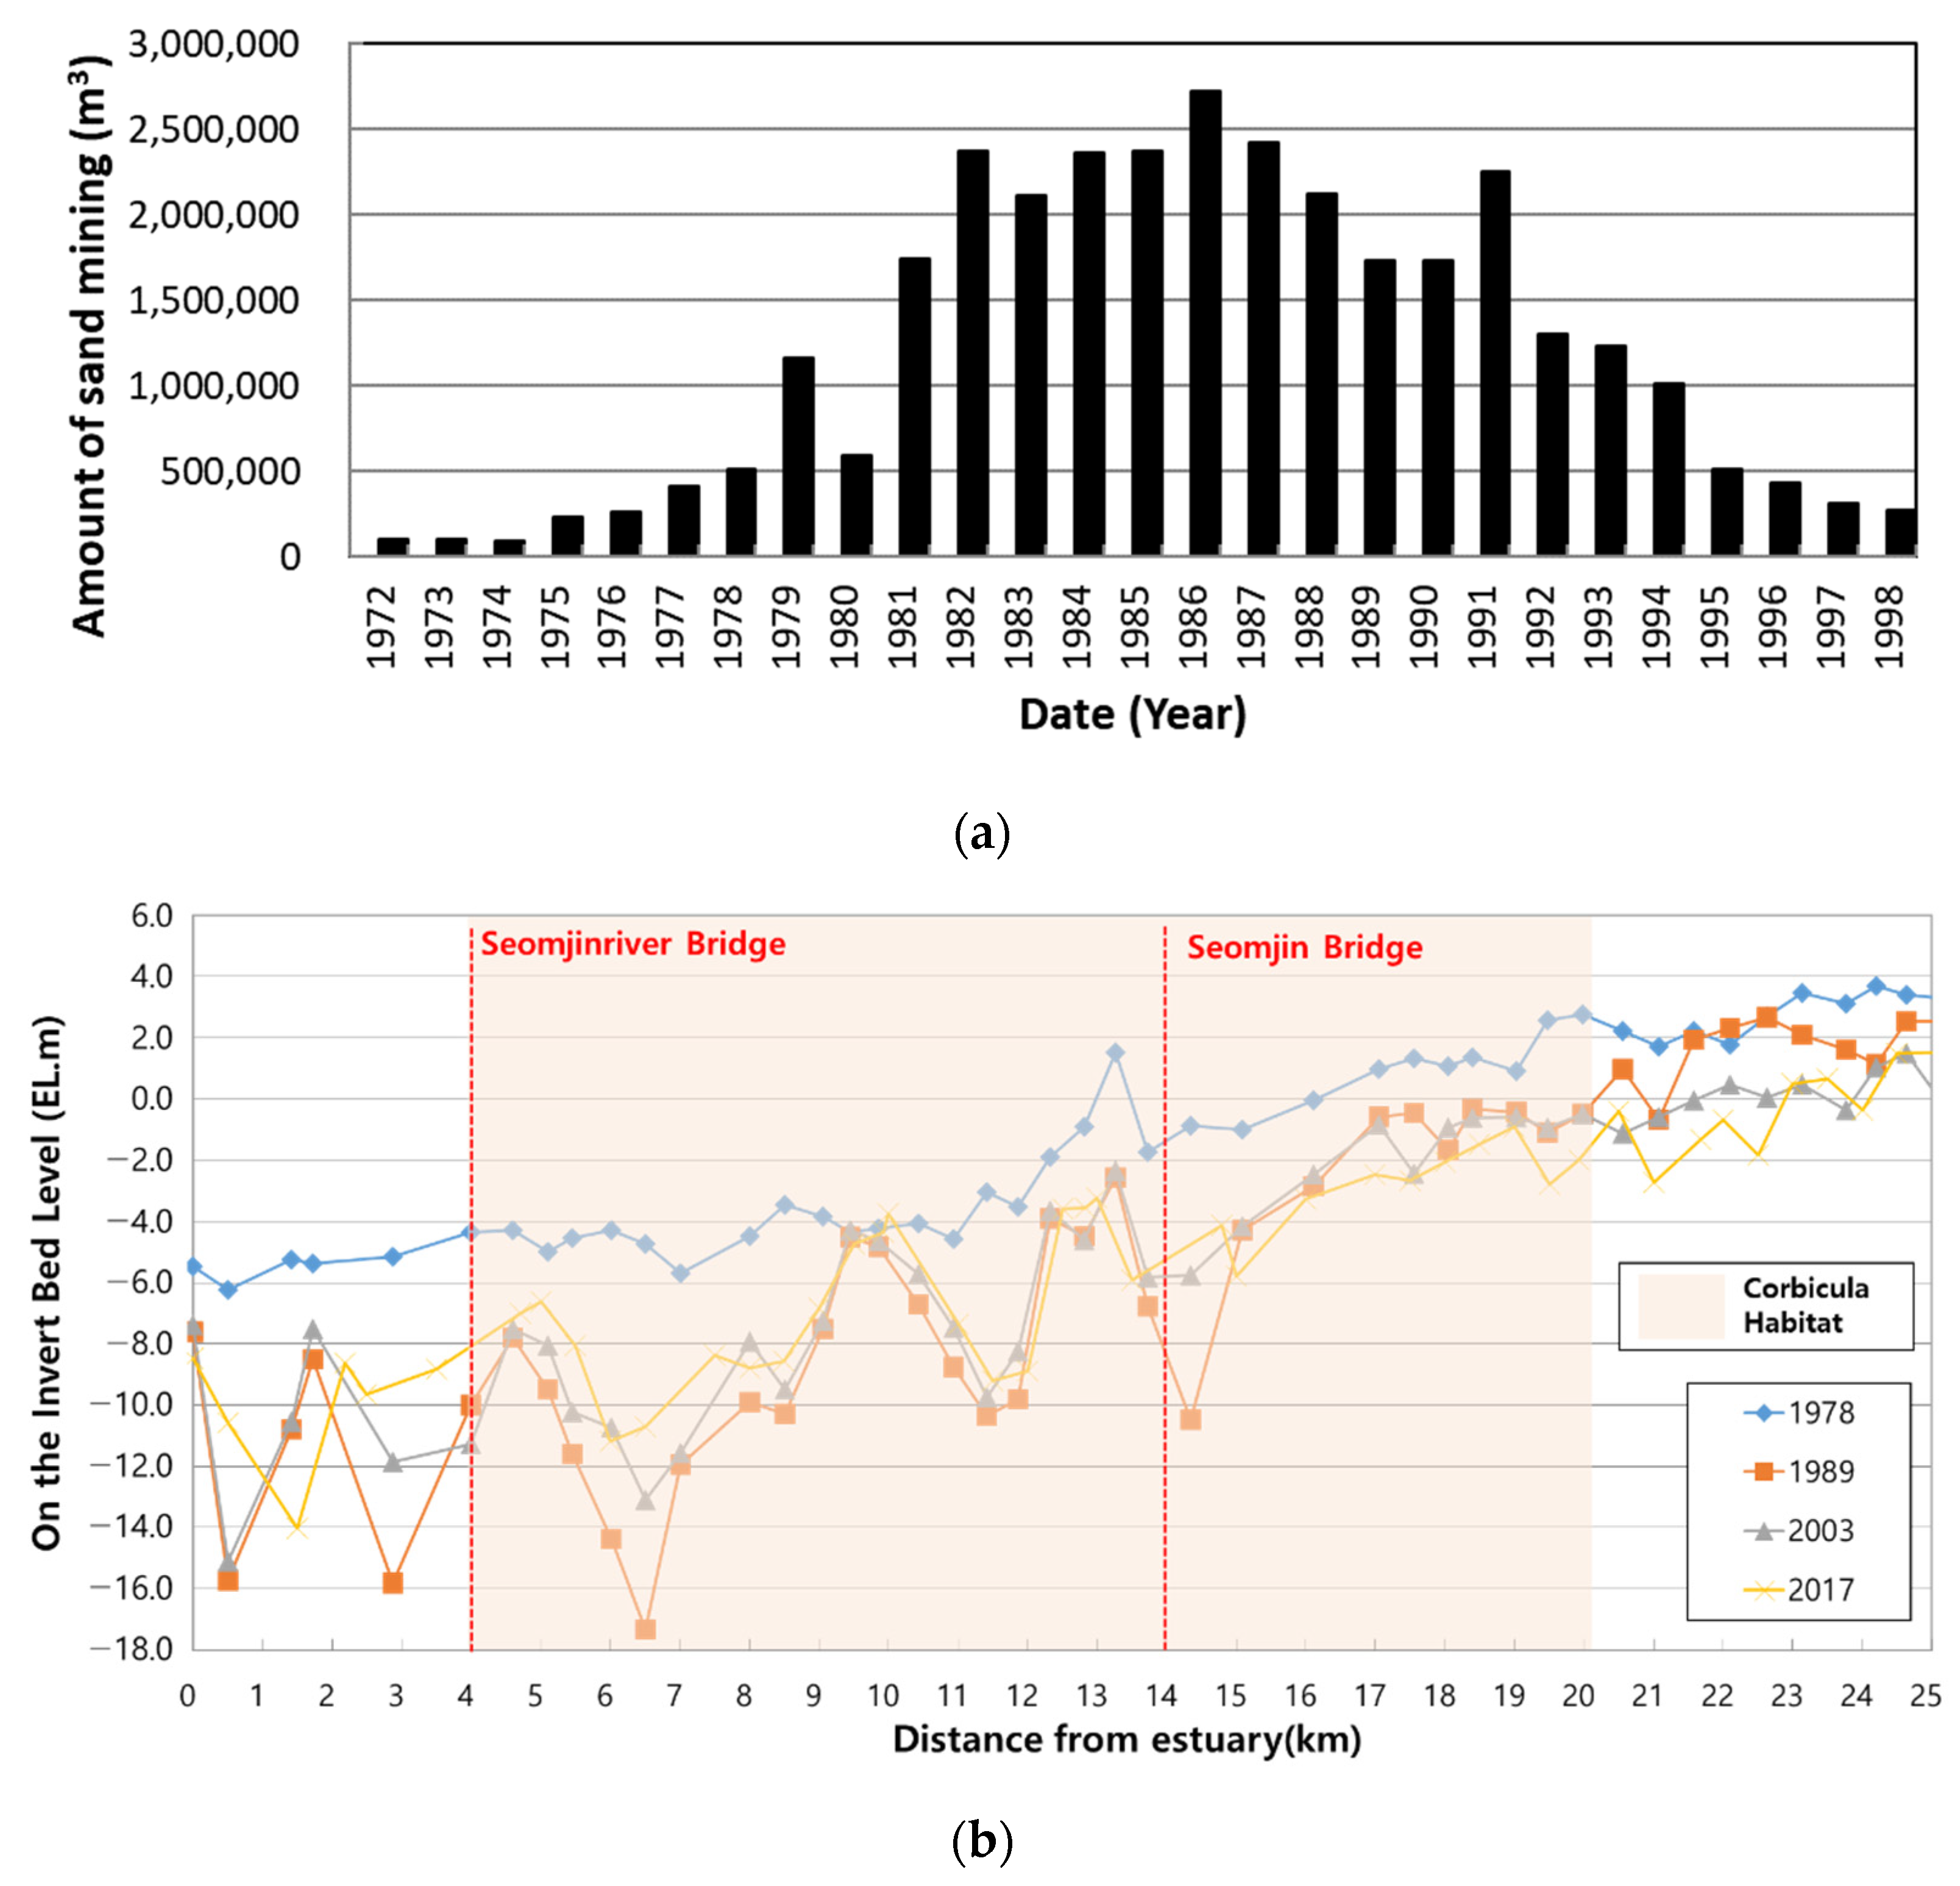
2.3.1. Environmental Changes at Daap Water Intake and Sand Mining Works

The Daap Water Intake Facility is in Gosari, Gwangyang City, Jeollanam-do, approximately 26 km upstream from the mouth of the Seomjin River. It supplies up to 400,000 tons of water daily (including 178,000 tons from the Seomjin Dam, 160,000 tons from the Juam Dam, and 62,000 tons from the Seomjin River) to support residential and industrial water needs in the Jeonnam Eastern Region, including the Yeosu National Industrial Complex. Since water extraction commenced in 1978, challenges arose due to the lowering of the riverbed levels at the intake location by approximately EL. 2.0 m in 1994 through sand mining activities on rivers, raising concerns about seawater intrusion and causing water extraction to be difficult. To address these issues, the intake location was relocated 4.2 km upstream in 2005, and the facility’s capacity was increased to its current state.
Sand mining in the Seomjin River persisted from 1972 to 1998. In 1999, to protect the Seomjin River, the government imposed a ban on sand mining permits [8]. Figure 2a depicts the annual quantity of sand mining in the Seomjin River basin. From 1981 to 1994, sand mining exceeded one million m3 annually, reaching a maximum of 2.7 million m3 in 1994 (2.5 times that of 1978) [17]. Figure 2b illustrates the changes in riverbed elevation due to sand mining over the past 40 years. As shown in Figure 2, critical sand mining occurred from 1978 to 1989 in the primary corbicula habitat zone extending from the Seomjin River Bridge to the Seomjin Bridge. During this period, the maximum riverbed elevation decrease reached 12.58 m, with an average reduction of 4.94 m throughout the habitat zone period. This decrease in riverbed elevation directly contributed to a rise in salinity intrusion.

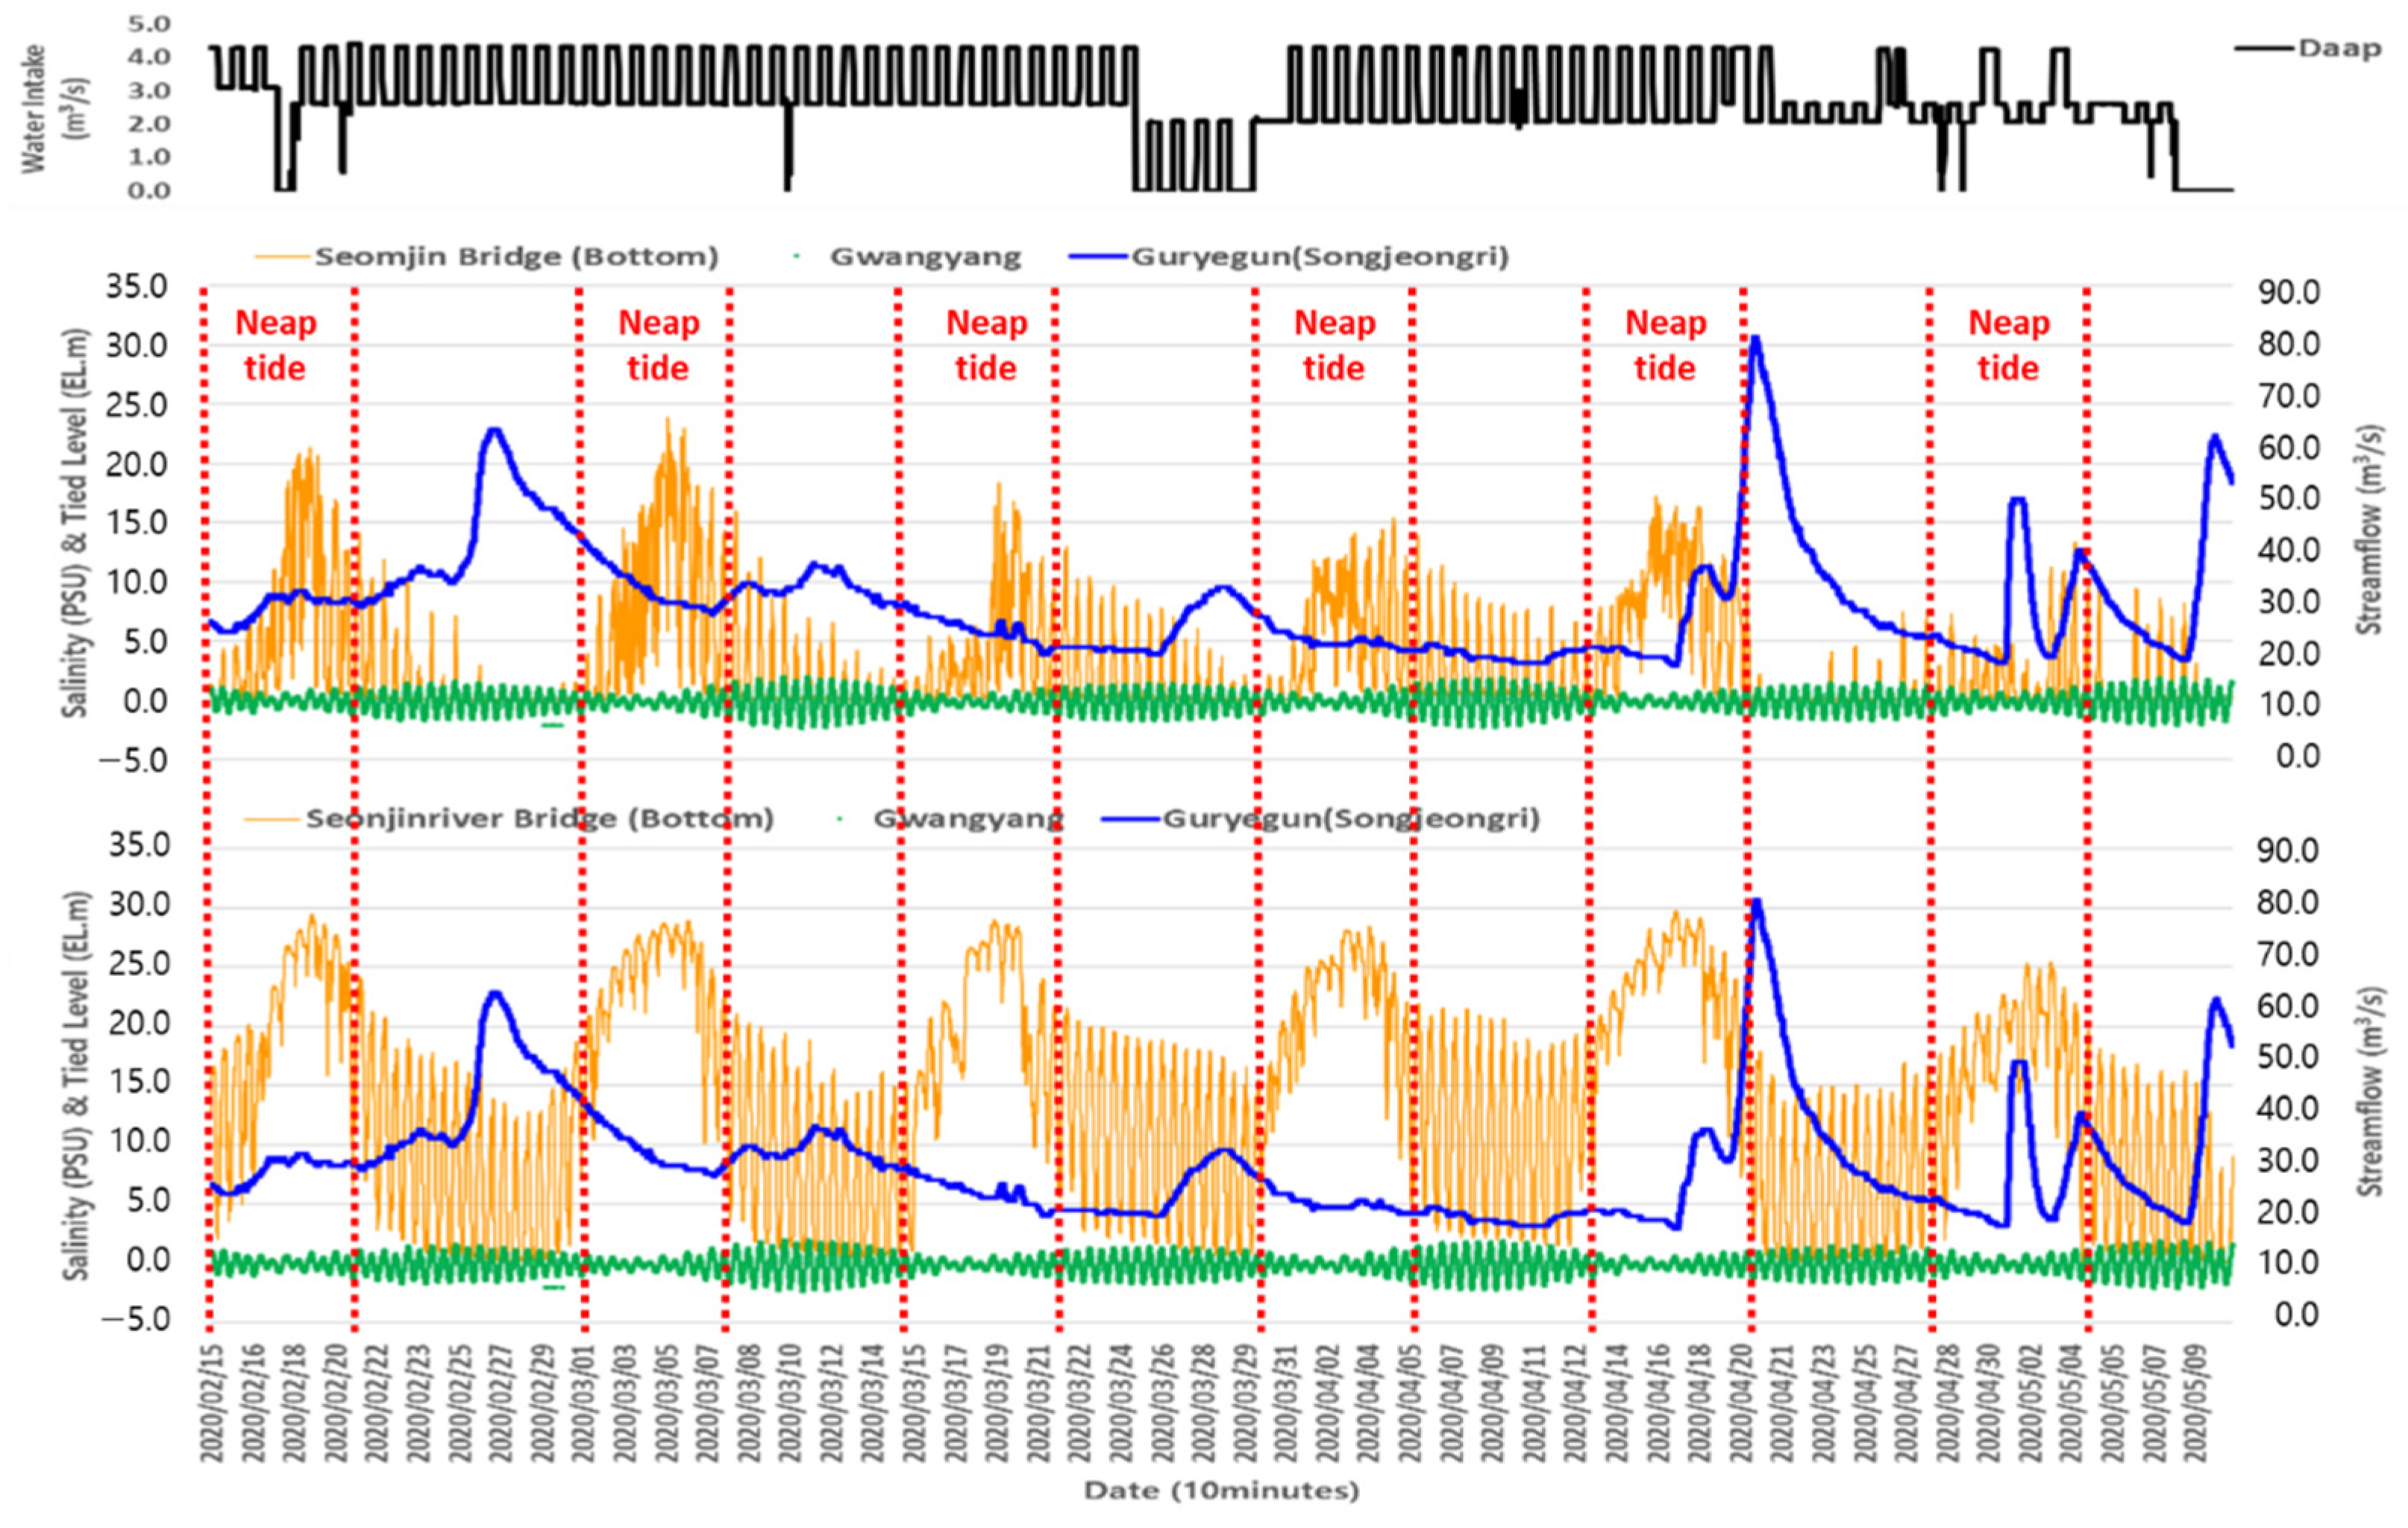
2.3.2. Measured Hydrological Data for Simulations of the EFDC Model

In this section, we focused on the measured data required for the calibration of the EFDC model, as shown in Figure 3. In this study, our goal was to measure salinity in the Seomjin River estuary and explore its correlation with factors such as river discharge, riverbed change, and tidal level. To achieve this goal, fixed salinity gauges were installed at two locations (Seomjin Bridge and Seomjin River Bridge) to construct a time-series dataset of salinity concentrations (Figure 1). Fixed salinity gauges, which have been operational since 15 February 2020, were installed at three intervals (upper, middle, and bottom) at each location on the riverbed, and the salinity was monitored continuously. The salinity data utilized the lower layer (bottom) data from the Seomjin River Bridge and Seomjin River Grand Bridge, considering density current measurements. The salinity range at Seomjin Bridge was 0.0 to 23.8 psu, with an average of 3.3 psu. The salinity of the Seomjin River Bridge ranged from 0.0 to 29.7 psu, with an average of 14.3 psu. Typically, the average salinity of seawater is defined as more than 30 psu [18]. Thus, during neap tides, the Seomjin River Bridge experienced river water transformation into seawater, maintaining a high salinity concentration, which was influenced by tidal variations from EL.m −2.36 to EL.m 2.0 at the Gwangyang station. The stream flow in Guryegun (Songjeongri) varied according to precipitation and increased with rainfall. In the absence of rainfall, it was maintained between a minimum of 17 and 20 m3/s, including artificial dam supply.

2.4. Model Application for Salinity Simulation

In this study, we focused on the modeling and simulation of the Seomjin River estuary, incorporating the downstream river and the adjacent estuarine region. To accurately represent the downstream flow dynamics of the Seomjin River, the Gurye-gun (Songjeong-ri) and Hadong-gun (Eupnae-ri) streamflow observation stations were designated as the upstream boundary conditions. Downstream boundary conditions were established by expanding to include tidal level observation stations located south and east of Gwangyang Bay, extending from Yeosu to Samcheonpo (Figure 4). The modeling domain included facilities related to river flow, with an intake facility extracting a constant daily flow from the river. The river water temperature and meteorological data utilized real-time data from the Hadonggun observation stations (Figure 1).
The topographic and bathymetric data for the Seomjin River were obtained from the “Seomjin River Basic Plan, 2021”, covering approximately 41 km from the Seomjin River estuary to Guryegun (Songjeongri). Marine data were extracted from the National Maritime Institute’s numerical bathymetric data and adjusted based on mean sea level (MSL) standards (Figure 4). Marine elevation was converted from digital low (DL) to elevation low (EL). The bottom elevation ranged from −41.035 to 7.225 m, showing an increasing trend upstream. The river and marine depths ranged from 0.05 to 41.908 m (Figure 4).

2.5. Ranges of Salinity for Habitable Environments of Corbicula

To derive the appropriate habitat criteria for the corbicula, we aimed to estimate the criteria through an investigation of the experimental literature. The experimental results for species such as corbicula in the Seomjin River system included the growth and survival of Japanese (Kisu) corbicula larvae under different breeding conditions [19], infiltration and mortality of Corbicula japonica in seawater from the West Sea based on salinity [20], salt tolerance of Yamato shijimi [21], and guidelines for improving fishing grounds in lakes and ponds [22]. Although the species were the same as those of the Seomjin River corbicula, there were limitations in directly applying the habitat criteria of the Seomjin River corbicula due to differences in habitat areas.
Domestic research, such as the study of the distribution and growth characteristics of Japanese corbiculas in the Seomjin Estuary according to salinity gradients [23], has investigated salinity changes (spring tide, neap tide, high tide, low tide) and corbicula habitat density through Seomjin River monitoring. In [23], the corbicula habitat density was greatest at points with salinity changes ranging from 10 to 15 psu. However, the salinity measurements were not continuous and were taken temporarily, indicating limitations. Researchers in [11,24] used corbiculas and employed feeding filtration experiments to directly assess the impact of salinity in the Seomjin River.
In this study, information from [11,24,25] was applied to propose habitat criteria for corbiculas. Most corbicula in the Seomjin river are freshwater corbicula that can inhabit in low salinity concentrations, and 15 psu is suggested as the optimal salinity concentration.
According to these results, the optimal feeding salinity for Seomjin River corbiculas was determined to be 15 psu through plankton-feeding experiments, indicating optimal growth conditions. Therefore, the habitat condition of the Seomjin River for corbicula related to salinity was defined as 15 psu in this study. Afterward, this study analyzes the model results of scenarios for reducing saltwater intrusion by comparing mean salinity and intrusion distances to sustain optimal salinity of 15 psu.

3. Results

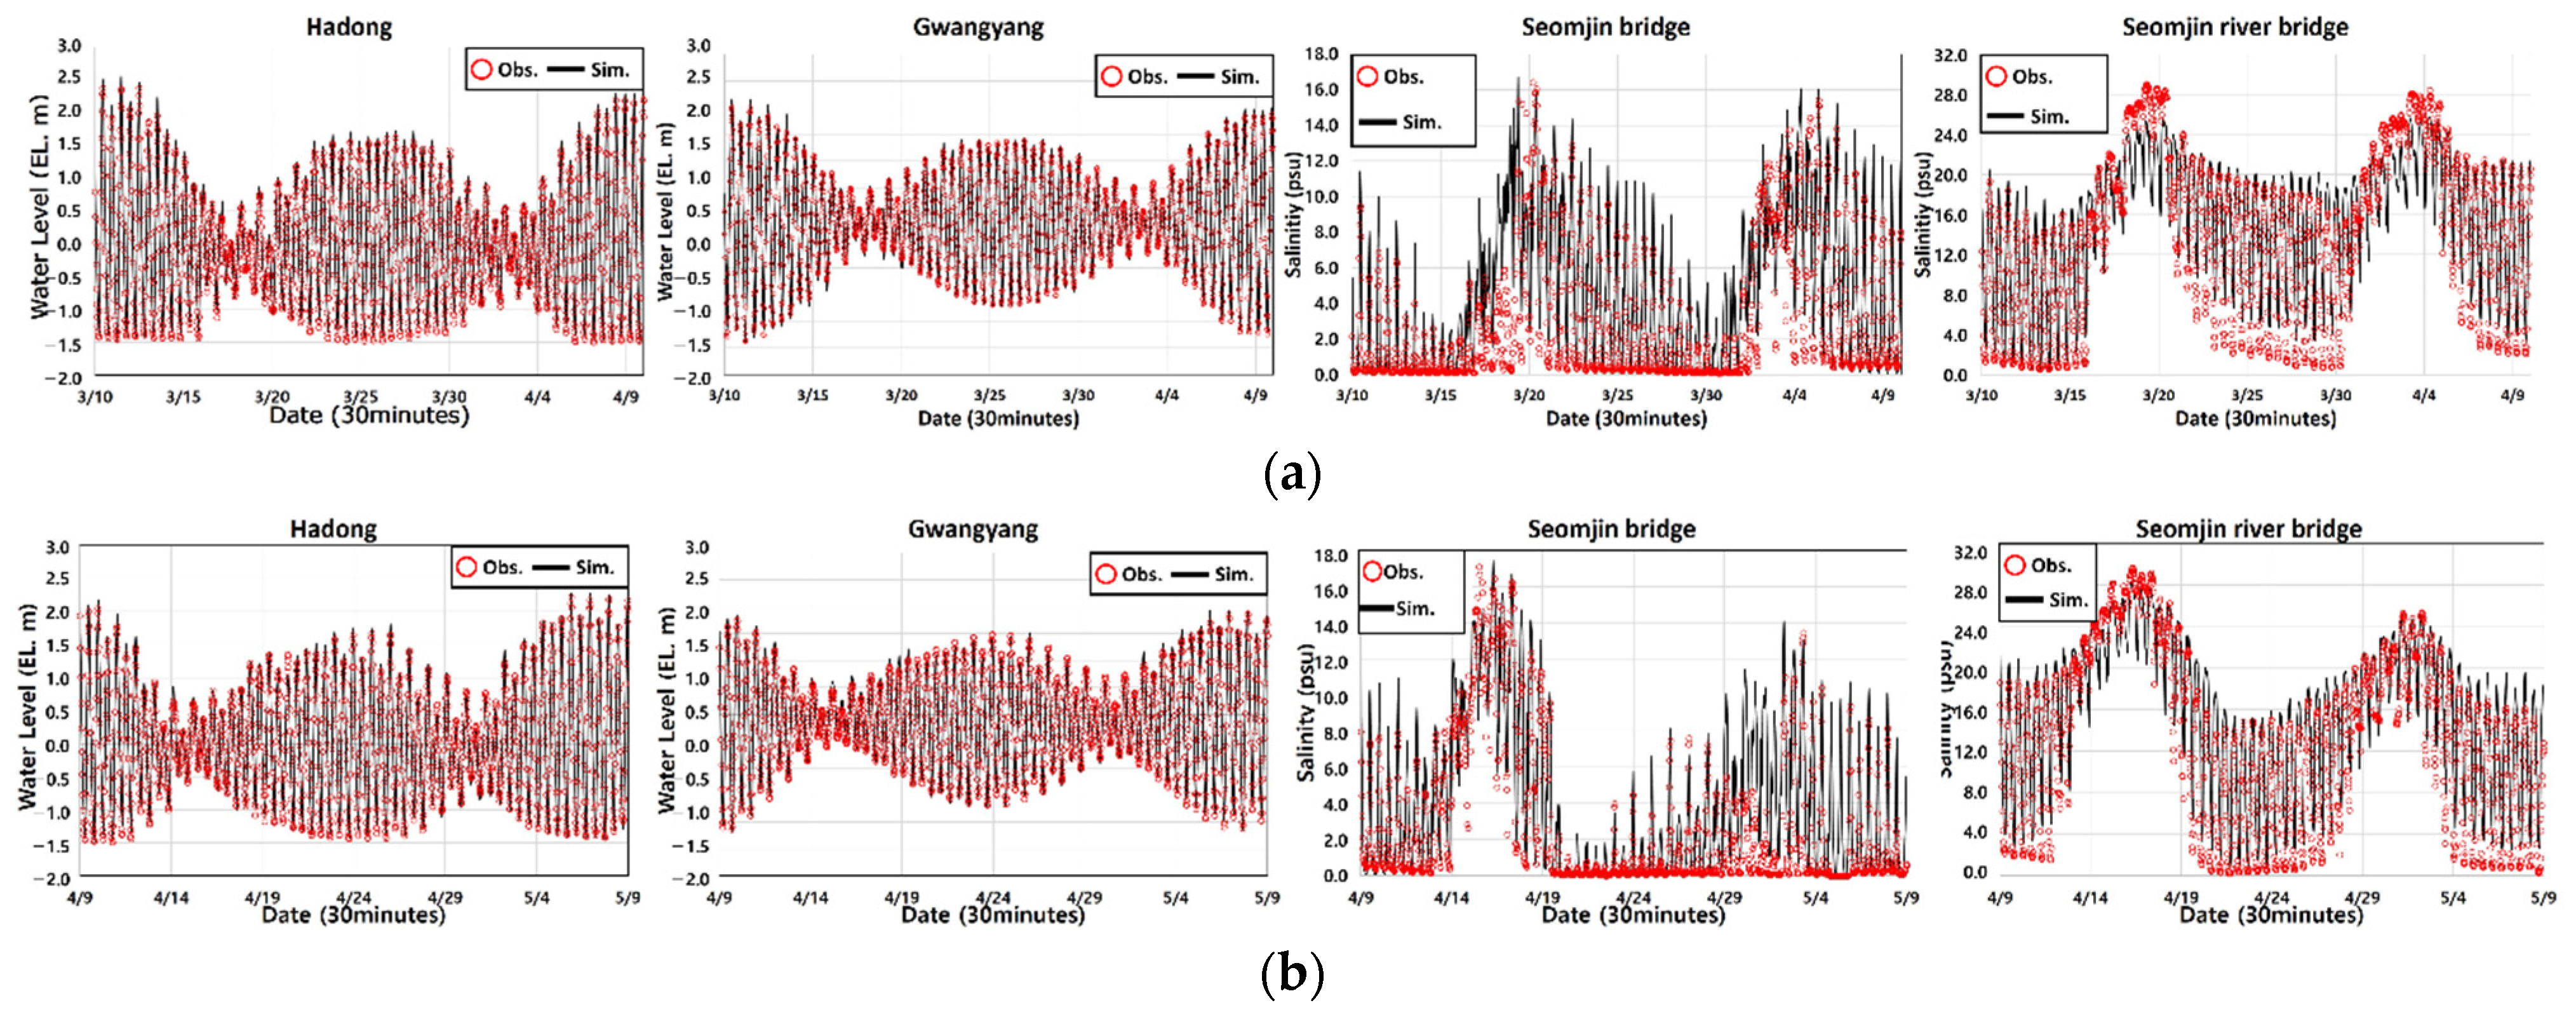
3.1. Model Calibration and Validation

Model calibration and validation are essential steps for assessing the suitability of numerical models. In this study, for model calibration and validation, observed river water levels at the Hadong water observation station, observed water levels at the Gwangyang tidal observation station, and salinity measurement data obtained through salinity sensors at locations relevant to the corbicula habitat—specifically, the Seomjin Bridge and Seomjin River Bridge—were utilized.
In hydrology, the Nash–Sutcliffe efficiency (NSE) is a widely used metric for assessing the performance of hydrological models. It quantifies the accuracy of a model by comparing its simulated values to the observed values, with a range of −∞ to 1. A value closer to 1 indicates a better match between model predictions and observations [26]. The model calibration utilized time-series data from 10 March 2020 to 10 April 2020 (1 month). The model performance, evaluated through various indices, was mostly deemed acceptable. Notably, the Nash–Sutcliffe efficiencies (NSEs) for tidal levels and water levels were 0.98 and 0.95, respectively. Salinity was corrected using observed data from the Seomjin River Bridge and Seomjin Bridge for the same period as tidal levels and water levels. The corrected salinity results are presented in Figure 5, with NSE values of 0.75 and 0.46 in the model results, indicating a satisfactory level of model calibration. Model validation utilized time-series data from 10 April 2020 to 10 May 2020 (1 month), with tidal levels verified using data from the Gwangyang tidal station and water levels verified using data from the Gurye gun (Songjeong-ri) water level observation station. The validation results for tidal levels and water levels are presented in Figure 5. The NSE values of the models were satisfactory at 0.98 and 0.95, indicating that the model was successfully validated.
The salinity concentrations were evaluated using the NSE metric, with values of 0.46 (Seomjin Bridge) and 0.75 (Seomjin River Bridge), indicating good and satisfactory performance, respectively. The observed errors in salinity concentration were mitigated by initially calibrating the sensors during installation using standard reagents of 5, 10, 15, 20, 25, 30, and 40 psu for sensor settings. Ensuring reliability in salinity observations below 5 psu was challenging, particularly in the case of the Seomjin Bridge, where many days exhibited salinity levels below 5 psu, resulting in increased errors. Therefore, for observations with salinity levels above 10 psu, 0.85 for the NSE was highly stable, indicating that the errors were mitigated, especially considering that we utilized salinity values of 10 psu or higher in the model results.

3.2. Derivation of the Optimal Discharge for Habitable Corbicula Environments

We conducted EFDC modeling to estimate the appropriate discharge necessary to satisfy the recommended habitat range (15–20 psu) for corbicula, considering the water management conditions in the Seomjin River estuary. The analysis period covered the calibration period from 10 February 2020 to 10 June 2020, during which the modeling results were examined. The Seomjin River estuary receives river discharge from the upstream boundary at the Gurye-gun (Songjeong-ri) water level observation station, and a multi-intake facility between the corbicula habitat zone and the Gurye-gun (Songjeong-ri) station can extract up to 400,000 tons/day from the river. Modeling of salinity changes based on discharge and multi-intake discharge was performed by categorizing the average flow rates during the low-flow season (November to March) over the past 10 years at the Gurye-gun (Songjeong-Ri) water level observation point into seven stages. The Songjeong discharge ranged from 5 to 35 cm, and the multi-intensity discharge rates were 2.523, 3.125, 3.912, and 4.630 m3/s.
Table 1 summarizes the salinity behavior analysis of the Seomjin Bridge, Seomjin River Bridge, and Hwamok sites downstream of the multi-intake facility, based on discharge rates ranging from 5 to 35 m3/s at the Gurye-gun (Songjeong-ri) discharge, obtained through EFDC modeling. At the Gurye-gun (Songjeong-ri) discharges of 5 to 35 m3/s, the average salinity concentrations during total tides at the Seomjin Bridge, Seomjin River Bridge, and Hwamok sites were simulated to be 8.4, 11.8, and 15.5 psu, respectively, with a multi-intake discharge of 2.523 m3/s. Similarly, at a multi-intake discharge of 3.125 m3/s, the salinity concentrations were 8.4, 11.8, and 15.8 psu, and at a discharge of 3.912 m3/s, they were 8.6, 12.2 and 16.3 psu, respectively. When the multi-intake increased to 4.630 m3/s, the salinity concentrations were 8.7, 12.4, and 16.7 psu, respectively. As the multi-intake increased, the salinity concentrations at each location increased, while higher Gurye-gun (Songjeong-ri) discharge led to a decrease in the salinity concentration.
A comparison of the recommended habitat criteria for salinity concentrations between 15 and 20 psu, as shown in Table 1, revealed that at the Seomjin Bridge and the downstream Hwamok site, the salinity concentrations during neap tide consistently exceeded 20 psu regardless of the multi-intake discharge and river discharge. This suggested potential challenges for corbicula growth near the Seomjin Bridge during neap tide. Conversely, at the upstream Seomjin Bridge point, even during a low river discharge of 5 m3/s and high multi-intake discharge of 4.63 m3/s, the salinity remained within the required 15–20 psu range, indicating consistent maintenance of the necessary conditions for corbicula habitats. However, at the Seomjin Bridge, regardless of multi-intake discharge, during neap tide, the salinity remained within the 15–20 psu range between river discharge rates of 10 and 15 m3/s. This result highlights the importance of maintaining adequate salinity levels for corbicula ecology, as a decrease in river discharge to below 10 m3/s during neap tide could lead to difficulty in maintaining optimal salinity conditions, potentially leading to corbicula mortality. Therefore, the threshold represents crucial ecological flow rates for maintaining optimal salinity levels and should be utilized as an essential metric for ecological management in the future.

3.3. Analysis of Salinity Reduction Effects under Various Scenarios

The Seomjin River has experienced a decrease in lower riverbed elevation due to past activities, such as sand mining, resulting in an increase in seawater influx and, consequently, greater salinity concentrations and greater intrusion distances. Therefore, we analyzed the effects of salinity reduction by setting realistic conditions for riverbed restoration, installing underwater dams and artificial structures, and implementing dam-flushing methods. The analysis period covered the calibration period from 10 February 2020 to 10 June 2020, during which the modeling results were examined. The effects of salinity reduction were examined through changes in salinity concentrations, intrusion distances, and the spatial distribution of salinity concentrations in both horizontal and vertical planes. The analysis was based on a river discharge of 10 m3/s and a multi-intake discharge of 3.912 m3/s (338,000 tons/day). The analysis areas for salinity reduction effects included three locations: the Seomjin Bridge and Seomjin River Bridge (Dugok, Sinbi, Mokdo areas) and the Hwamok area. Table 2 provides an explanation for the definitions of the salinity reduction scenarios and the application methodology of the EFDC model. In the section dedicated to the analysis of scenario results, detailed explanations regarding this matter will be omitted.

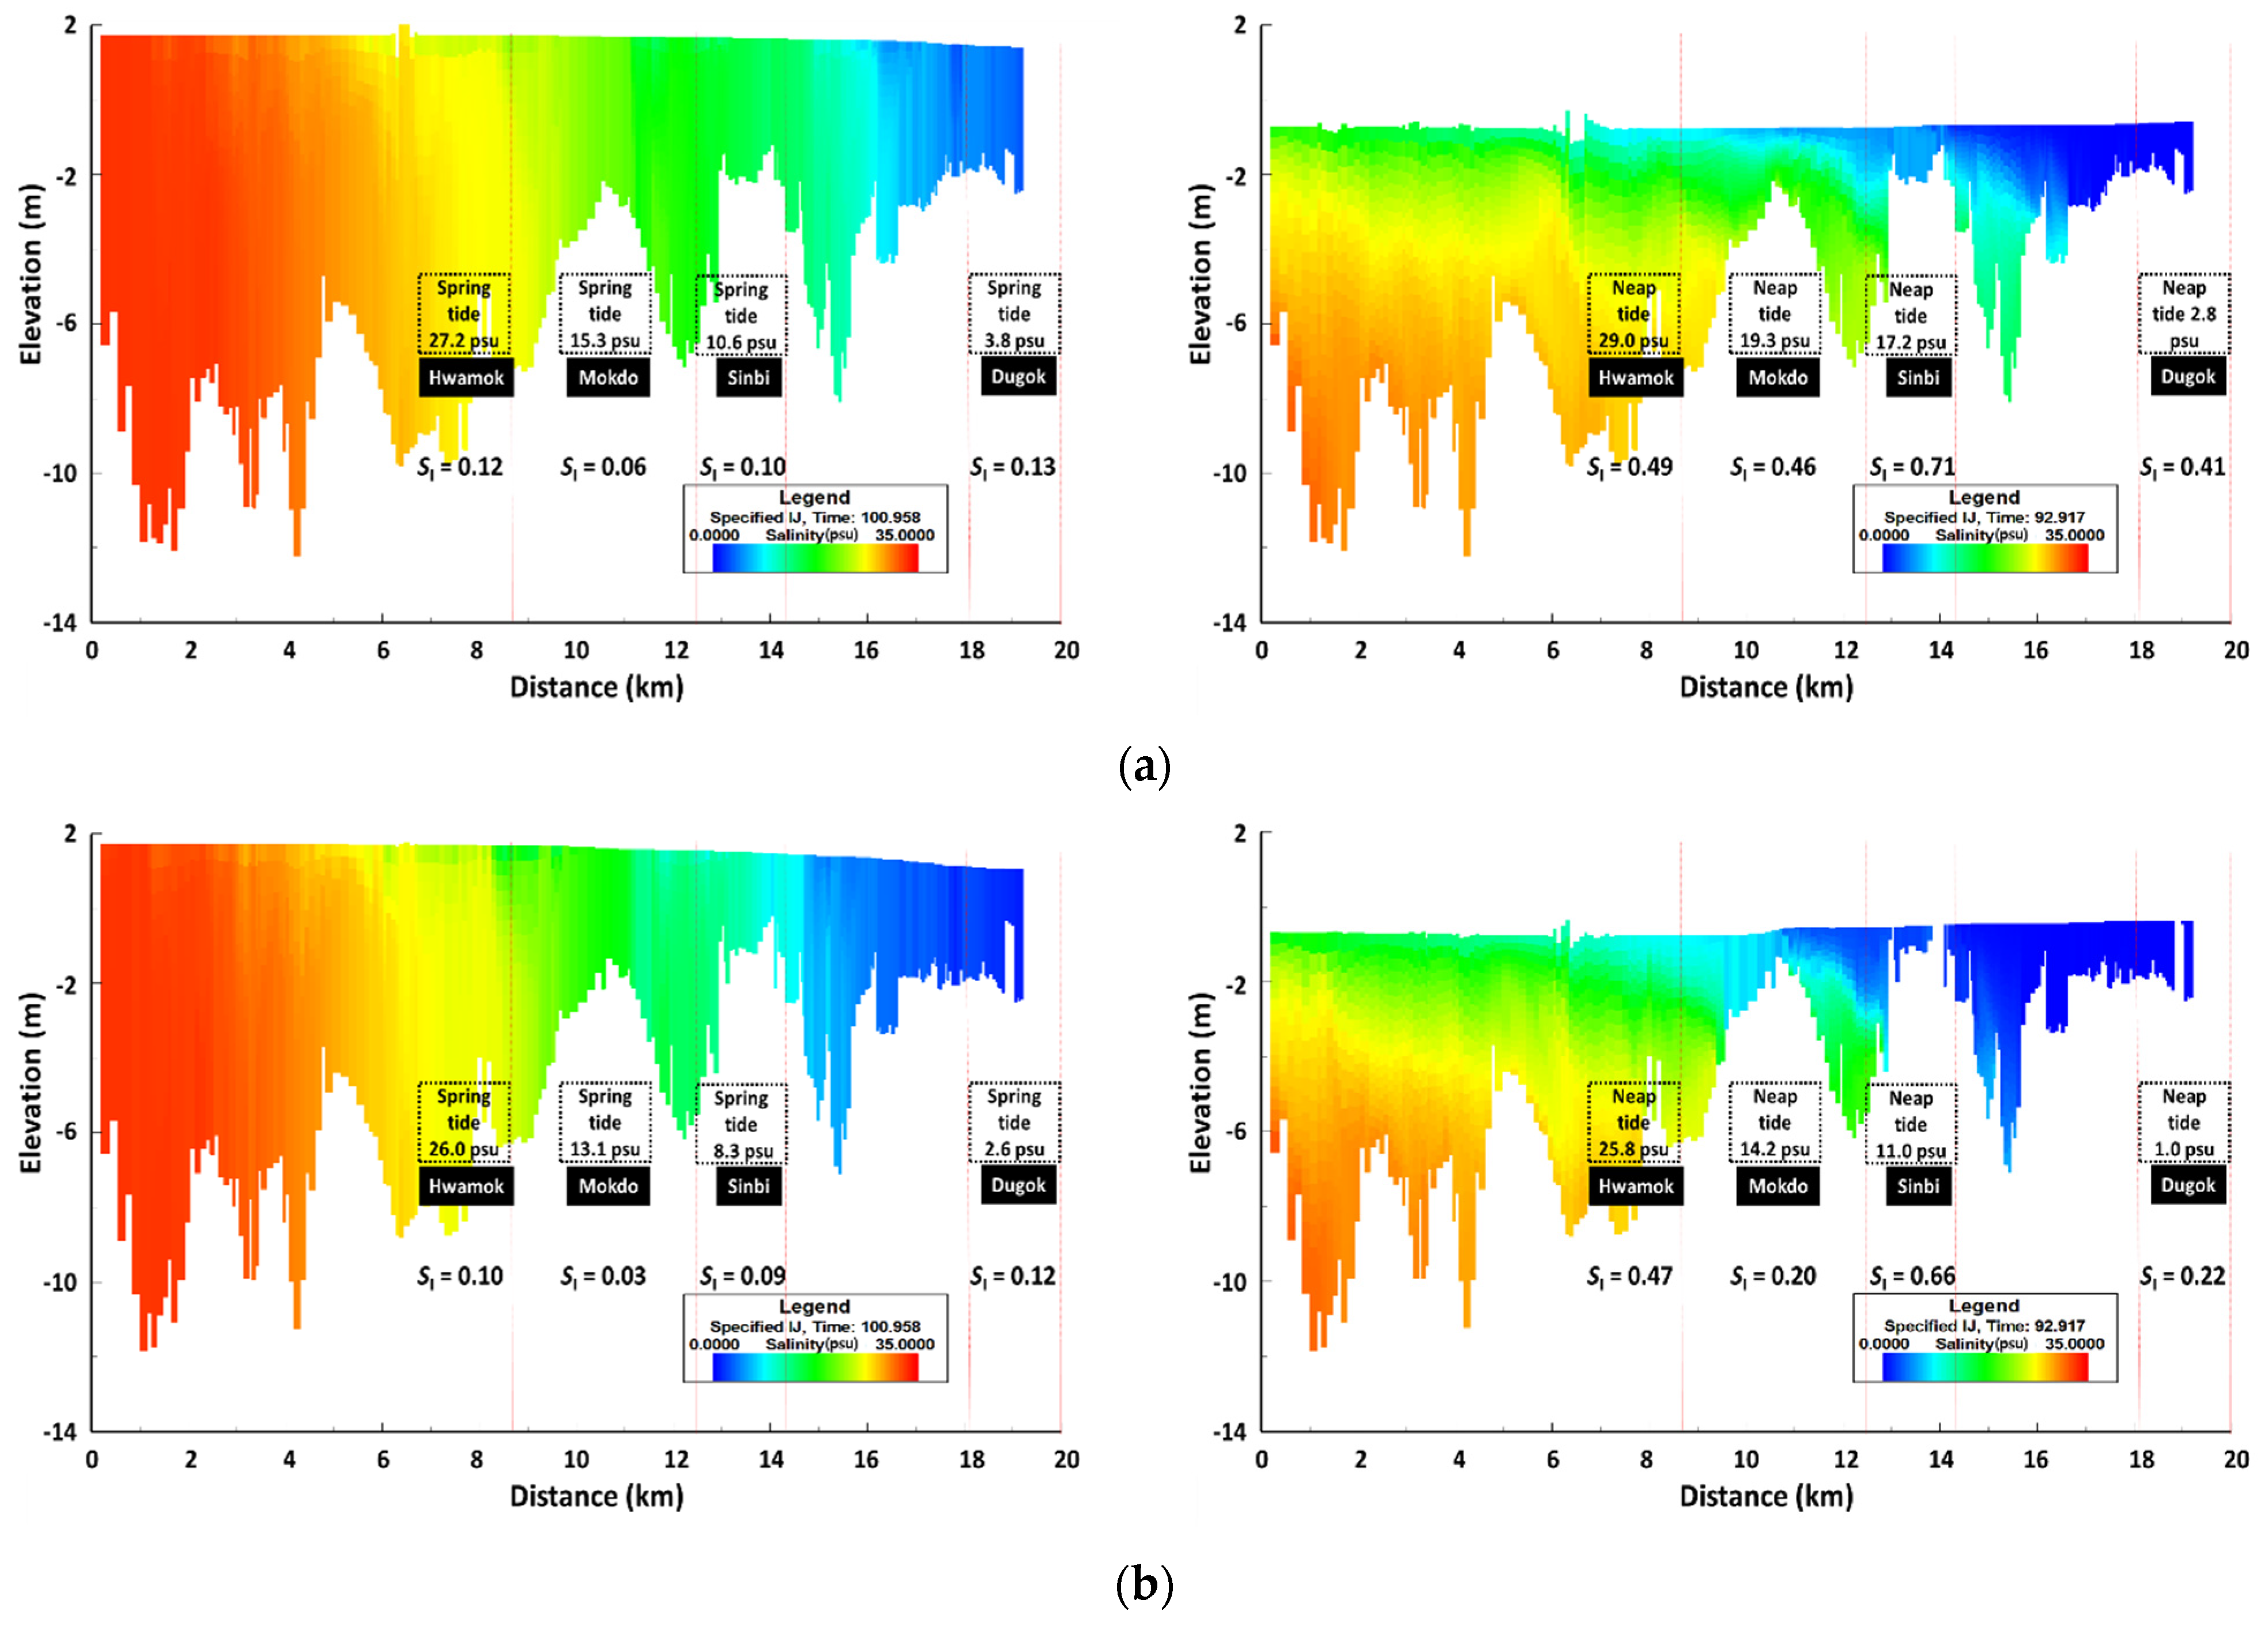
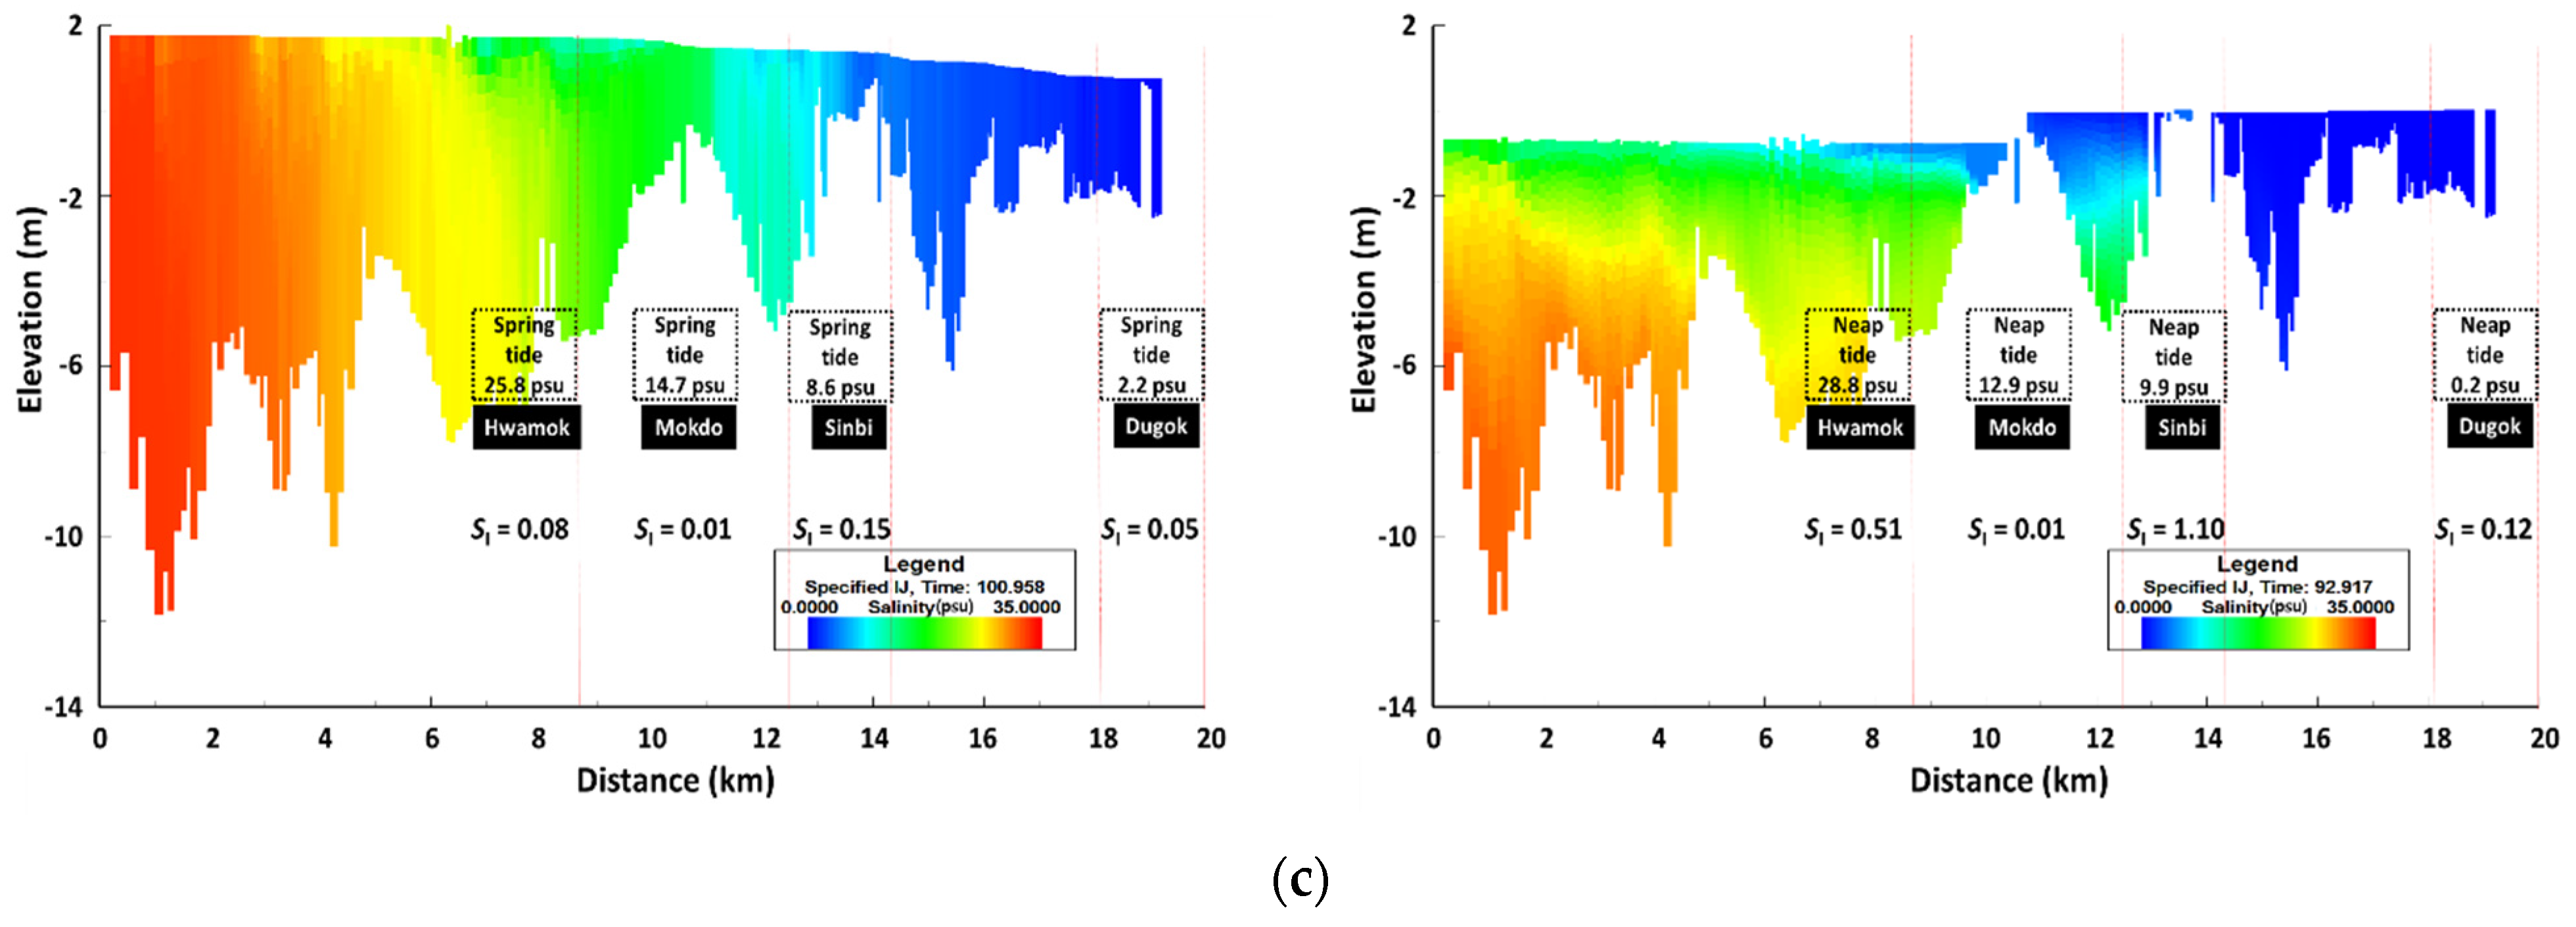
3.3.1. Riverbed Restoration

The scenario for the salinity reduction effect analysis was based on the lower reaches of the Seomjin River estuary, with a reference to the current (2017) lower limit. The scenarios involved increasing (restoring) the lower limit from the estuary to 20 km downstream (the DuGok region) uniformly by 1 m (riverbed restoration scenario 1, RRS-1), 2 m (riverbed restoration scenario 2, RRS-2), and 3 m (riverbed restoration scenario 3, RRS-3) compared with maintaining the current conditions (riverbed restoration scenario 0, RRS-0). The effects of salinity reduction during both the dry and wet seasons were analyzed using EFDC modeling, focusing on four key regions where major corbicula habitats are located: DuGok (18–20 km from the estuary), ShinBi (13–15 km), MokDo (9–13 km), and HwaMok (7–9 km).
Table 3 presents the average salinity concentrations for each scenario during both the spring and neap tides. The results indicated that in the DuGok region, the salinity concentration decreased by up to −4.4 psu during the spring tide and −8.9 psu during the neap tide under RRS-3. The DuGok region is predominantly influenced by freshwater, and the linear decrease in salinity with the increased height of riverbed restoration suggested the maintenance of a lower salinity concentration, causing it to be a suitable corbicula habitat. In the ShinBi region, the salinity decreased by a maximum of −4.6 psu during the spring tide under RRS-2 and significantly by −13.0 psu during the neap tide under RRS-3. The MokDo region showed a maximum salinity reduction of −6.1 psu during the spring tide under RRS-2 and a substantial reduction of −11.5 psu during the neap tide under RRS-3. Both the ShinBi and MokDo regions were influenced by both seawater and freshwater, and a greater riverbed height led to a significant reduction in salinity, preventing saltwater intrusion during the spring tide.
In the HwaMok region, HwaMok is a marine-influenced area, and the minimal salinity reduction indicated that further lower limit restoration might not have significantly affected the salinity levels, maintaining an average concentration above 20 psu and causing it to be unsuitable for corbicula habitation. DuGok was more influenced by freshwater, while HwaMok was more influenced by seawater, resulting in a lower salinity reduction effect than that at the ShinBi and MokDo points. The salinity reduction efficiency decreased in the order of DuGok (56.6–82.9%), ShinBi (29.9–50.3%), MokDo (22.6–37.3%), and HwaMok (3.5–6.9%). This was attributed to the decrease in average depth with higher lower limit restoration, leading to a reduction in seawater inflow and subsequent salinity reduction.

3.3.2. Submerged Weir

As another scenario, we explored an alternative scenario involving the installation of underwater weirs to achieve similar effects. The analysis focused on the effects of salinity reduction when installing three underwater weirs at 1–6 km intervals from the Seomjin River estuary, with heights of 2 m, 3 m, and 4 m, using the scenario where no underwater weirs were installed as a baseline. In the model, the implementation of underwater weirs involved selecting the grid line from the left bank to the right bank in the river grid and applying the corresponding lower layer height to the selected grid line.
The salinity reduction effects of underwater weirs throughout the period were analyzed, and the results showed overall low effects ranging from 0.0 to 0.1 psu for DuGok, ShinBi, and HwaMok and from 0.1 to 0.3 psu for MokDo. The salinity reduction effects were notably low overall, and there were no significant hydraulic changes compared with the preinstallation conditions, indicating minimal salinity reduction effects (Table 4).

3.3.3. Groynes

The analysis was conducted for the salinity reduction effects when installing four embankments, two on the left bank and two on the right bank, at a distance of 4–6 km from the Seomjin River estuary, with heights ranging from 1 to 3 m, using the scenario where no embankments were installed as a baseline. Throughout this period, the salinity reduction effects for embankment installation ranged from 0.2 to 0.6 psu for DuGok, 0.1 to 0.5 psu for ShinBi, 0.3 to 1.1 psu for MokDo, and 0.1 to 0.5 psu for HwaMok. Overall, the salinity reduction effects were found to be quite low; however, compared with those of the underwater weirs, they were relatively greater (Table 5). The salinity reduction effects slightly increased with embankment height in all regions. Nevertheless, in the ShinBi region, the salinity reduction effects decreased when the height exceeded 3 m, which was attributed to the influence of salinity stratification than increased seawater inflow.

3.3.4. Comprehensive Evaluation of Structural Scenarios

As a result of submerged weirs and groynes, two scenarios had minimal reduction effects. Submerged weirs were installed at the bottom to remain underwater, reducing the flow speed and maintaining a consistent water level. These structures also prevented high salinity levels from entering the river when density currents formed as seawater met freshwater, leading to high salinity stratification in the lower layers. Unlike submerged weirs, levees could interrupt sediment movement, affecting factors other than salinity while preventing high salinity from entering the river. However, submerged weirs and levees installed at certain points have shown limited effectiveness in reducing salinity, as they did not significantly impact seawater or high-salinity inflows. Although submerged weirs or levees could block lower-layer salinity, the salinity could flow over them into the river, and as the salinity entered the river, the river could escape back to the sea due to tidal movements, which appeared to be the cause of the observed low salinity reduction effect.
Thus, we aimed to derive comprehensive results by applying all scenarios, including those with minimal effects. After analyzing the salinity reduction effects of each scenario, additional analysis was conducted to determine the maximum salinity reduction effect in the habitat area of Corbicula (freshwater clam) in the Seomjin River estuary under all scenarios. The final scenario, which applied all the scenarios, involved implementing the conditions that showed the greatest salinity reduction in each scenario using the EFDC model to simulate salinity.
Table 6 shows the salinity reduction effects when all the scenarios were applied. The results of all the scenarios, including 3 m of bed restoration, 4 m of submerged weir, and 3 m of groyne, showed greater reductions in the Sinbi and Mokdo areas than in the scenario in which no measures were applied. In the Sinbi area, the average salinity decreased to 6.7 psu during the spring tide and 13.4 psu during the neap tide. In the Mokdo area, the average salinity decreased to 5.1 psu during the spring tide and 13.3 psu during the neap tide.
The most positive result from the model was the salinity reduction in the Mokdo area. The average salinity, including during the spring and neap tides, was maintained below 15 psu, which was the appropriate salinity concentration for the habitat of Corbicula, as suggested. This indicated that natural growth and transplantation projects for Corbicula in the Mokdo area could be promoted, contributing to the revitalization of the local economy. However, for the Hwamok area, which has been heavily affected by seawater intrusion, even with the application of complex structural management, the average salinity remained above 25 psu during both the spring and neap tides. Thus, efforts to secure habitat for Corbicula in this area would be minimally effective.

4. Discussion

In this study, the effect of salinity intrusion on corbicula habitats was investigated by employing EFDC modeling with topographic data (river cross-sections) and hydrological changes (flow rates and intake rates). In addition, our goal of this study was to analyze the effects of reducing salinity by applying structural scenarios at each site using optimal salinity ranges for corbicula habitats derived from references. The results indicated that the riverbed restoration scenario effectively prevented high salinity concentrations from intruding into corbicula habitats. It is difficult to secure sustainable optimal salinity ranges at Mokdo in the current water system; however, the RRS-2 and RRS-3 scenarios can extend the habitat area for corbicula by preventing saltwater stratification during the neap tide. To analyze saltwater stratification, this section suggests an index ( S I ) of saltwater stratification (Equation (1)).
S I = S b S s S a v e ,
Here, S b represents the salinity of the bottom water, S s is the salinity of the surface water, and S a v e is the average salinity at depth. The salinity stratification index can classify estuaries with relatively strong weak mixing when the stratification index is 0.32 or higher [27]. In this study, the EFDC model was divided into 20 layers, with S s extracted from the results of the top layer (1st layer) among the 20 layers and S b extracted from the bottom-most layer (20th layer).
Figure 6 illustrates the vertical spatial distribution of salinity concentrations resulting from the lower limit restoration scenario and the stratification index results for key regions calculated in this study. The spatial distribution of salinity stratification during the dry season showed that as the lower limit restoration height increased, the point where stratification occurred shifted downstream, resulting in a decrease in salinity concentrations at the same location due to reduced seawater inflow. During the wet season, stratification occurred from the estuary, but the surface was dominated by freshwater due to decreased seawater inflow. Particularly in the MokDo region under RRS-1 conditions during the wet season, the average salinity concentration was 19.3 psu, satisfying the optimal salinity level for corbicula habitation. However, considering the growth characteristics of the riverbed, the salinity concentration in the riverbed was greater than 20 psu.
The analysis of the salinity reduction effect through structural measure implementation indicated the environmental conditions under which corbicula (a type of freshwater clam) can adequately grow. To create an optimal habitat for corbicula, further analysis of the intrusion distance at specific salinity concentrations is necessary. Table 7 quantitatively presents the intrusion distances of salinity concentrations at the riverbed under the different scenarios. Salinity concentrations of 15 psu, which are optimal for corbicula, permeated up to 17.9 km from the estuary. However, when scenarios involving riverbed restoration, submerged weirs, and groyne measures were all applied, the intrusion distance from the estuary was reduced to 14.2 km, thereby increasing the habitable area for corbicula by 3.7 km. When the contribution of each scenario was distinguished, riverbed restoration accounted for 92% (3.4/3.7 km) of the contribution, indicating that this measure can be more directly used as a quantitative indicator for securing habitat than merely comparing salinity reduction effects. The results of structural measure preparations and scenario-based modeling can be summarized and utilized in the following three ways:
(1)
The analysis of average salinity reduction effects enables the assessment of whether the structural scenarios applied as models fulfill the overall salinity concentration conditions suitable for corbicula growth by delaying or preventing natural seawater flow.
(2)
By analyzing the vertical distribution of salinity concentrations to investigate saltwater stratification during neap tides, it is possible to identify sections of the riverbed where corbicula growth is feasible despite an overall reduction in average salinity concentrations. This distinction is based on the salinity distribution in the riverbed where corbicula grows.
(3)
By analyzing the penetration distance of salinity concentrations into the riverbed, it is possible to evaluate the sections suitable for optimal corbicula habitat conditions, considering both the average salinity concentration and the high salinity stagnation phenomenon at the riverbed.

5. Conclusions

In conclusion, we present two major findings. First, to establish structural or nonstructural measures for corbicula growth, it is crucial to consider the vertical distribution trend of salinity rather than the average salinity concentration on a planar surface. Second, while riverbed restoration most crucially impacts salinity reduction, its practical implementation is challenging. Furthermore, regarding the criteria for the height of riverbed restoration, there may be unintended consequences, such as a change in the main river flow path and seawater intrusion routes, leading to the retention of high salinity concentrations in the corbicula habitat. Therefore, even if the results suggested that riverbed restoration beyond 3 m has reduced salinity, it may negatively impact the natural flow of the ecosystem.
Our goal of this study was to analyze the effects of structural management measures by constructing scenarios using numerical modeling. Accordingly, the salinity reduction effects and vertical salinity distribution for each scenario were analyzed to identify saltwater stratification during the neap tide. Finally, the salinity intrusion distance at the riverbed was calculated to suggest potential areas for expanding the habitat of corbicula (freshwater clam) in the Seomjin River estuary.
Based on the results shown in Table 7, we conclude that the bed restoration scenario has the greatest reduction effect among the structural scenarios. Additionally, by identifying saltwater stratification, the salinity intrusion distance at the riverbed was analyzed, revealing that the bed restoration scenario contributed 92% of the salinity penetration distance reduction. Furthermore, applying the scenarios could expand the area meeting the optimal conditions for corbicula habitat by up to 3.7 km, suggesting the potential to extend the habitats in the Dugok and Sinbi areas downstream to the Mokdo area (9–13 km). Therefore, for the restoration of the corbicula ecological environment in the Seomjin River estuary, it is proposed that structural measures be planned with the aim of expanding the habitat area to include the Mokdo area.
The lack of long-term observed salinity data in this study limited our capacity to model the intricate salinity dynamics in the tidal creek. Therefore, for future research, securing long-term salinity data is essential to enhance the applicability of the model and further investigate the direct relationship between salinity and corbicula growth in the observed tidal creek. Klaus Michor et al. [28] estimated that the cost of riverbed stabilization for a 15 m wide and 7 km long river would be approximately 7 million dollars. Consequently, the comprehensive riverbed restoration of the Seomjin River estuary is not feasible from a financial perspective.
Apart from cost, there are some side effects when applying structural alternatives in reality. Changes in salinity can have broad effects on ecology, impacting various aspects of ecosystems and biodiversity. Changes in salinity can alter the composition of species within an ecosystem. Some species are more tolerant of saline conditions, while others are not. This can lead to shifts in species diversity and community structure. Also, salinity changes can modify habitat availability. For example, increased salinity in freshwater habitats may reduce the suitability of these habitats for certain species, leading to habitat loss or fragmentation. In addition, salinity changes can alter ecosystem processes such as nutrient cycling, decomposition rates, and primary productivity [29]. These changes can have implications for the overall functioning and resilience of ecosystems. Thus, it will be necessary to carry out riverbed restoration projects sequentially through long-term planning considering budget allocation and side effects on the ecosystem.
Finally, we analyzed the efficiency of salinity reduction according to structural scenarios. Structural measures interfere with salinity infiltration by reducing the salinity concentration and infiltration distance but do not address the vertical salinity stratification phenomenon. Therefore, for the continued ecological health of the Seomjin River estuary, future efforts should focus on combining the findings of this study with nonstructural measures (river flow, water management, habitat changes, etc.) to maximize their effectiveness.

Author Contributions

Funding acquisition, supervision, J.P.; methodology, data curation, original draft, G.L.; conceptualization, methodology, data curation, original draft, writing, revising—review and editing, supervision, C.J.; corbicula habitat and characteristics, Y.A. All authors have read and agreed to the published version of the manuscript.

Funding

This research was supported by the Environmental Fundamental Data Examination project of the River Youngsan and River Seomjin Basin Management Committee.

Institutional Review Board Statement

Not applicable.

Informed Consent Statement

Not applicable.

Data Availability Statement

The data presented in this study are available upon request from the corresponding author. The data are not publicly available due to our laboratory’s policy and confidentiality agreements.

Conflicts of Interest

The authors declare no conflicts of interest.

References

  1. Noh, J.; Lee, J.Y.; Shin, J.K. Analysis of saltwater intrusion by flushing discharge in the Seomjin River estuary. J. Environ. Impact Assess. 2011, 20, 325–335. [Google Scholar]
  2. Baek, S.H.; Seo, J.Y.; Choi, J.W. Growth characteristics and distribution pattern of a brackish water clam, Corbicula japonica along an estuarine salinity gradient in Seomjin River. J. Korea Acad.-Ind. Coop. Soc. 2015, 16, 6852–6859. [Google Scholar] [CrossRef]
  3. Son, Y.G. A Numerical Simulation for Salinity Intrusion in Nakdong River Estuary Using EFDC. Ph.D. Dissertation, Kongju University Graduate School, Kongju, Republic of Korea, 2009. (In Korean). [Google Scholar]
  4. Han, S.D. Evaluation of mean tidal currents at Kwangyang and Chinju Bay, Connected into Noryang Channel. Theses Collect. 1995, 13, 161–170. [Google Scholar]
  5. Lee, J.J.; Kim, Y.J. Analysis of flow duration characteristics due to environmental change in Korea River Basin. J. Korean Soc. Hazard Mitig. 2011, 11, 67–75. [Google Scholar] [CrossRef]
  6. Kang, S.; Choi, S.; Lee, D. Evaluation and re-estimation of instream flow considering the water quality and aquatic ecosystem of the Seomjingang River Watershed. J. Korean Soc. Hazard Mitig. 2021, 21, 347–355. [Google Scholar] [CrossRef]
  7. Minhas, P.S.; Ramos, T.B.; Ben-Gal, A.; Pereira, L.S. Coping with salinity in irrigated agriculture: Crop evapotranspiration and water management issues. Agric. Water Manag. 2020, 20, 105832. [Google Scholar] [CrossRef]
  8. Krishna, P.; Mina, D.; Meisam, R.; Roland, O. Managing salinity for sustainable agricultural production in salt-affected soils of irrigated drylands. Agric. Syst. 2022, 198, 103390. [Google Scholar] [CrossRef]
  9. Chun, J.A.; Lim, C.; Kim, D.; Kim, J.S. Assessing Impacts of Climate Change and Sea-Level Rise on Seawater Intrusion in a Coastal Aquifer. Water 2018, 10, 357. [Google Scholar] [CrossRef]
  10. Ministry of Land, Infrastructure and Transport. Seomjin River Basic Plan; Ministry of Land, Infrastructure and Transport: Seoul, Republic of Korea, 2021.
  11. Seo, J.Y.; Kim, J.H.; Choi, J.W. A comparative study on the ecological characters of Corbicula japonica populations inhabiting at the subtidal estuary of the Seomjin River and the intertidal eulsuk sand flat of the Nakdong River, Korea. Korean J. Malacol. 2018, 34, 135–146. [Google Scholar] [CrossRef]
  12. Song, C.G.; Kim, H.J.; Rhee, D.S. Analysis of flow reversal by tidal elevation and discharge conditions in a Tidal River. J. Korean Soc. Saf. 2014, 29, 104–110. [Google Scholar] [CrossRef]
  13. Kim, S. Research on Methodology of Hydrodynamic-Water Quality and Stratification Modeling in Reservoir Using EFDC. Ph.D. Dissertation, Chungnam University Graduate School, Daejeon, Republic of Korea, 2010. [Google Scholar]
  14. Shin, C.M.; Min, J.H.; Park, S.Y.; Choi, J.; Park, J.H.; Song, Y.S.; Kim, K. Operational water quality forecast for the Yeongsan River using EFDC model. J. Korean Soc. Water Environ. 2017, 33, 219–229. [Google Scholar]
  15. Moustafa, M.Z.; Ji, Z.G.; Hamrick, J. Impacts of freshwater sources on salinity structure in a large, shallow estuary. Environments 2024, 11, 72. [Google Scholar] [CrossRef]
  16. Jeong, S.M.; Yeon, K.S.; Hur, Y.T.; Oh, K.R. Salinity intrusion characteristics analysis using EFDC model in the downstream of Geum River. J. Environ. Sci. 2010, 22, 934–939. [Google Scholar] [CrossRef]
  17. Ceon, I.K.; Kim, M.H. The prediction and analysis of bed changes characteristics in the Seomjin River Downstream. J. Korean Soc. Hazard Mitig. 2009, 9, 115–121. [Google Scholar]
  18. Crone, T. The basic sediment transport equations made ridiculously simple. In Ocean/Ess 410 Marine Geology and Geophysics; Marine Sciences Building: Savannah, GA, USA, 2004. [Google Scholar]
  19. Lee, J.Y.; Kim, W.K.; Lee, C.S. Growth and survival of the brackish water clam, Corbicula japonica larvae according to rearing conditions. Korean J. Malacol. 2011, 27, 337–343. [Google Scholar] [CrossRef]
  20. Lee, M.H.; Choi, J.D.; Noh, G.H.; Shin, S.J.; Ryu, D.K. Distribution and biomass estimation of Corbicula japonica in the Seomjin River, Korea. Korean J. Malacol. 2021, 37, 17–24. [Google Scholar]
  21. Nakamura, M.; Aki, S.; Takahashi, F.; Shinagawa, A.; Nakao, S. Salt tolerance of yamato shijimi (Corbicula japonica). Aquaculture 1996, 44, 31–35. [Google Scholar]
  22. Japan Fisheries Agency. Guidelines for Improvement Techniques in Lakes and Ponds Fisheries; Japan Fisheries Agency: Tokyo, Japan, 2009.
  23. Seo, J.; Kim, J.; Chung, J.; Lee, Y.; Choi, J. Distribution patterns of a marsh clam, Corbicula japonica on the eulsuk tidal flat of the Nakdong River estuary, Korea. Korean J. Malacol. 2017, 33, 185–193. [Google Scholar] [CrossRef]
  24. Korea Institute of Ocean Science and Technology. Environmental Changes in the Seomjin River Estuary: Sedimentological-Geochemical Monitoring and Management Strategy; Korea Institute of Ocean Science and Technology: Busan, Republic of Korea, 2018. [Google Scholar]
  25. Lee, Y.; Choi, H.; Kim, W.; Cheong, C. Evaluation of acute toxicity of salinity, ammonia and nitrite to corbicula. J. Korean Soc. Environ. Technol. 2016, 17, 542–547. [Google Scholar]
  26. Moriasi, D.N.; Arnold, J.G.; Van Liew, M.W.; Bingner, R.L.; Harmel, R.D.; Veith, T.L. Model evaluation guidelines for systematic quantification of accuracy in watershed simulations. Trans. ASABE 2007, 50, 885–900. [Google Scholar] [CrossRef]
  27. Shaha, D.; Cho, Y. Comparison of empirical models with intensively observed data for prediction of salt intrusion in the Sumjin River estuary, Korea. Hydrol. Earth Syst. Sci. 2009, 13, 923–933. [Google Scholar] [CrossRef]
  28. Michor, K.; Senfter, S.; Nemmert, A.; Unterlercher, M.; Reisinger, M. River Restoration Concept Based on Calculations of Optimal River Width; Euronatur, RIZA Rapport; Institute for Inland Water Management and Waste Water Treatment: Lelystad, The Netherlands, 2021. [Google Scholar] [CrossRef]
  29. Krishna, P.D.; Mina, D.; Meisam, R.; Roland, O. Human-induced salinity changes impact marine organisms and ecosystems. Glob. Change Biol. 2023, 29, 4731–4749. [Google Scholar] [CrossRef]
Figure 1. The monitoring locations in the study area: Seomjin River Basin with the white line and Seomjin main stream with the blue line.
Sustainability 16 05653 g001
Figure 2. Graphs of environmental change data over the past 40 years. (a) The annual quantity of sand mining in the Seomjin River basin from 1972 to 1998, (b) Changes in the riverbed level over the past 40 years.
Sustainability 16 05653 g002
Figure 3. Graphs of the measured hydrological data.
Sustainability 16 05653 g003
Figure 4. Setup for the EFDC model in this study. (a) Grid composition; (b) Sea elevation distribution map.
Sustainability 16 05653 g004
Figure 5. Comparison graphs of the observed and simulated results: water levels of the Hadong River and the Gwangyang River and salinities of the Seomjin Bridge and the Seomjin River Bridge. (a) Calibration. (b) Validation.
Sustainability 16 05653 g005
Figure 6. Vertical spatial distribution of the salinity and index (SI) of saltwater stratification under the riverbed restoration scenario (RRS) in the study area for describing the salinity stratification phenomenon. (a) RRS-1. (b) RRS-2. (c) RRS-3.
Sustainability 16 05653 g006aSustainability 16 05653 g006b
Table 1. The simulated results using EFDC modeling at major sites.
Daap Intake
(m3/s)
Discharge at
Gurye-gun
(Songjeong-ri) (m3/s)
Model Simulated Result (psu)
Seomjin BridgeSeomjin River BridgeHwamok
Spring TideNeap TideSpring TideNeap TideSpring TideNeap Tide
2.523516.4519.9421.7925.7026.3827.94
1012.6419.1218.7625.5224.5027.60
157.9818.0115.6824.9622.2027.16
203.6016.7512.8824.5420.3425.98
252.1715.5211.6223.9919.2226.29
301.4614.3310.4123.4918.2525.98
350.9813.169.9823.0117.9425.74
3.125516.8320.0722.0325.7526.4427.94
1013.1319.2919.1525.5424.6927.61
158.4418.1016.0425.1222.3227.22
203.7716.9112.8924.6920.3826.02
252.2515.6511.8224.0519.2926.29
301.4814.4410.5123.6118.2926.02
351.0113.3210.2323.1018.0225.80
3.912517.3220.0922.4725.8126.6827.96
1013.4519.3719.4825.5824.7427.66
159.2218.3416.4825.2122.6127.28
204.2217.1513.3724.7720.6026.32
252.3915.8411.9024.1719.2926.37
301.6014.8210.8923.9518.6526.32
351.0713.5310.2923.3018.0525.89
4.630517.8320.1922.8525.8926.8428.04
1014.1319.5819.8925.6724.9027.68
159.5718.5416.8925.3222.7427.34
204.3417.3613.5224.8820.7126.11
252.4316.0312.0324.3019.2926.43
301.6014.8210.6523.7818.4526.11
351.1213.7210.4723.3518.1825.92
Table 2. Description of salinity reduction scenarios and model application.
ScenariosDescriptionModel ApplicationApplication Map
Riverbed RestorationA method of raising the downstream water level by uniformly elevating the existing riverbed throughout the 1 to 17 km stretch from the Seomjin River estuary, achieved through activities such as sand mining.For EFDC grid (i, j)
Grids 63–69 and 70–215:
Increasing the existing downstream water level values by ① 1 m, ② 2 m, and ③ 3 m
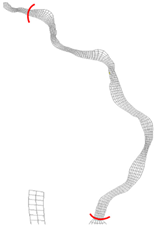
Sustainability 16 05653 i001
Submerged WeirThe installation of three underwater dams between the 1 to 6 km stretch from the Seomjin River estuary, designed to maintain a constant water level or slow the water flow.For EFDC grid (i, j)
① Grids 63–69 and 71: An increase of 2 m, 3 m, and 4 m from the existing downstream water level values.
② Grids 63–69 and 87: An increase of 2 m, 3 m, and 4 m from the existing downstream water level values.
③ Grids 63–69 and 98: An increase of 2 m, 3 m, and 4 m from the existing downstream water level values.
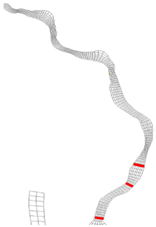
Sustainability 16 05653 i002
GroynesTo prevent the flow, four weirs are installed within the river channel, positioned between the 4 and 6 km stretch from the Seomjin River estuary.For EFDC grid (i, j):
① Grids 63–66 and 90: Implementing a method to raise the existing downstream water level values by 1 m, 2 m, and 3 m.
② Grids 66–69 and 92: Implementing a method to raise the existing downstream water level values by 1 m, 2 m, and 3 m.
③ Grids 63–66 and 94: Implementing a method to raise the existing downstream water level values by 1 m, 2 m, and 3 m.
④ Grids 66–69 and 96: Implementing a method to raise the existing downstream water level values by 1 m, 2 m, and 3 m.
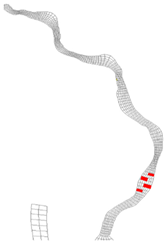
Sustainability 16 05653 i003
Table 3. The results of simulated salinity and reducing salinity under riverbed restoration scenarios (RRSs).
ScenariosDischarge at
Gurye-gun
(Songjeong-ri) (m3/s)
Water
Intake
at Daap (m3/s)
Riverbed Restoration
(m)
Average Salinity (psu),
Salinity Reduction (psu, RRS-0 Minus Each Scenarios)
Dugok
(Spring/Neap Tides)
Sinbi
(Spring/Neap Tides)
Mokdo
(Spring/Neap Tides)
Hwamok
(Spring/Neap Tides)
RRS-0103.91206.6/9.1,
-
15.2/22.9,
-
19.2/24.4,
-
28.6/29.4,
-
RRS-113.8/2.8,
−2.8/−6.3
10.6/17.2,
−4.6/−5.7
15.3/19.3,
−3.9/−5.1
27.2/29.0,
−1.4/−0.4
RRS-222.6/1.0,
−4.0/−8.1
8.3/11.0,
−6.9/−11.9
13.1/14.2,
−6.1/−10.2
26.0/28.5,
−2.6/−0.9
RRS-332.2/0.2,
−4.4/−8.9
8.6/9.9,
−6.6/−13.0
14.7/12.9,
−4.5/−11.5
25.8/28.8,
−2.8/−0.6
Table 4. The results of simulated salinity and reduced salinity under submerged weir scenarios (SWSs).
ScenariosDischarge at
Gurye-gun
(Songjeong-ri) (m3/s)
Water
Intake
at Daap (m3/s)
Submerged Weir Height
(m)
Salinity (psu),
Salinity Reduction (psu, RRS-0 Minus Each Scenarios)
Dugok
(Spring/Neap Tides)
Sinbi
(Spring/Neap Tides)
Mokdo
(Spring/Neap Tides)
Hwamok
(Spring/Neap Tides)
SWS-0103.91206.6/9.1,
-
15.2/22.9,
-
19.2/24.4,
-
28.6/29.4,
-
SWS-126.6/9.1,
−0.0/−0.0
15.2/22.8,
−0.0/−0.1
19.2/24.4,
−0.0/−0.0
28.6/29.4,
−0.0/−0.0
SWS-236.6/9.1,
−0.0/−0.0
15.2/22.8,
−0.0/−0.1
19.1/24.4,
−0.1/−0.0
28.5/29.3,
−0.1/−0.1
SWS-346.6/9.0,
−0.0/−0.1
15.1/22.7,
−0.1/−0.2
19.1/24.2,
−0.1/−0.2
28.5/29.3,
−0.1/−0.1
Table 5. The results of simulated salinity and reducing salinity under Groynes scenarios (GS).
ScenariosDischarge at Gurye-gun
(Songjeong-ri) (m3/s)
Water
Intake
at Daap (m3/s)
Groynes Height
(m)
Salinity (psu),
Salinity Reduction (psu, RRS-0 Minus Each Scenarios)
Dugok
(Spring/Neap Tides)
Sinbi
(Spring/Neap Tides)
Mokdo
(Spring/Neap Tides)
Hwamok
(Spring/Neap Tides)
GS-0103.91206.6/9.1,
-
15.2/22.9,
-
19.2/24.4,
-
28.6/29.4,
-
GS-116.5/8.9,
−0.1/−0.2
15.0/22.6,
−0.2/−0.3
19.0/24.2,
−0.2/−0.2
28.4/29.4,
−0.2/−0.0
GS-226.4/8.7,
−0.2/−0.4
14.8/22.2,
−0.4/−0.7
18.7/23.8,
−0.5/−0.6
28.1/29.4,
−0.5/−0.1
GS-336.2/8.3,
−0.4/−0.8
15.1/22.7,
−0.1/−0.2
18.4/23.1,
−0.8/−1.3
27.7/29.3,
−0.9/−0.1
Table 6. The results of simulated salinity and reducing salinity when all the scenarios were applied.
ScenariosDischarge at
Gurye-gun
(Songjeong-ri) (m3/s)
Water
Intake
at Daap (m3/s)
Height
(m)
Salinity (psu),
Salinity Reduction (psu, RRS-0 Minus Each Scenarios)
Dugok
(Spring/Neap tides)
Sinbi
(Spring/Neap Tides)
Mokdo
(Spring/Neap Tides)
Hwamok
(Spring/Neap Tides)
No103.91206.6/9.1,
-
15.2/22.9,
-
19.2/24.4,
-
28.6/29.4,
-
AllRiverbed restoration
3 m+ Submerged Weir 4 m + Groyne 3 m
2.0/0.1,
−4.6/−9.0
8.5/9.5,
−6.7/−13.4
14.1/11.1,
−5.1/−13.3
25.5/28.5,
−3.4/−0.9
Table 7. The results of each simulated intrusion distance by high salinity concentrations under riverbed restoration scenarios (RRS).
ScenariosHeight (m)Salinity (15 psu)
Intrusion Distance (km)
Salinity (20 psu) Intrusion Distance (km)Salinity (25 psu)
Intrusion Distance (km)
No-17.915.913.1
Riverbed restoration3 m14.5
(−3.4)
12.0
(−3.9)
9.6
(−3.5)
Submerged Weir4 m17.9
(−0.0)
15.9
(−0.0)
13.0
(−0.1)
Groyne3 m17.7
(−0.2)
15.8
(−0.1)
12.7
(−0.4)
AllRiverbed restoration
3 m + Submerged Weir 4 m + Groyne 3 m
14.2
(−3.7)
11.9
(−4.0)
9.5
(−3.6)
Disclaimer/Publisher’s Note: The statements, opinions and data contained in all publications are solely those of the individual author(s) and contributor(s) and not of MDPI and/or the editor(s). MDPI and/or the editor(s) disclaim responsibility for any injury to people or property resulting from any ideas, methods, instructions or products referred to in the content.

