Article

The Carbon Footprint of Spanish University Websites

by
Sonia Sanchez-Cuadrado
1 and
Jorge Morato
2,*
1
Department of Library and Information Science, Complutense University of Madrid, 28010 Madrid, Spain
2
Department of Computer Science, Carlos III University of Madrid, Leganes, 28911 Madrid, Spain
*
Author to whom correspondence should be addressed.
Sustainability 2024, 16(13), 5670; https://doi.org/10.3390/su16135670
Submission received: 31 May 2024 / Revised: 22 June 2024 / Accepted: 23 June 2024 / Published: 3 July 2024

Abstract

:
The consumption of digital content is essential for economic and scientific development, leading to a high dependence on information and communication technologies, which significantly impacts the environment. Quantifying this ecological impact is challenging due to its intangible nature and the diversity of factors. This research focuses on assessing the energy consumption and CO2 production of Spanish university websites to evaluate their levels of digital pollution and environmental impact. The calculation of the carbon footprint considers factors related to energy consumption and the use of green or renewable energies. The findings indicate that only 17% of university websites can be considered environmentally friendly. There are significant differences in CO2 consumption and emissions depending on whether the websites implement environmentally sound practices. This study highlights the lack of initiatives aimed at reducing energy consumption and greenhouse gas emissions associated with web information management. The study shows that Spanish universities have the potential to contribute to the reduction in CO2 emissions by implementing sustainable development practices on their websites. Furthermore, it fosters awareness about technology usage and its environmental impact, promoting the adoption of green and sustainable approaches.

1. Introduction

The 2030 Agenda recognizes the potential of Information and Communication Technologies (ICTs) to facilitate the achievement of the Sustainable Development Goals (SDGs) [1]. This recognition implies a reduction in actions that are harmful to the planet and consumption. Moreover, ICTs offer unprecedented opportunities to promote development and social inclusion. These opportunities range from facilitating access to education and health services to driving innovation and improving efficiency in resource management. ICTs also play a pivotal role in the advancement of sustainable development on a global scale. These technologies facilitate the promotion of distance education, the implementation of real-time environmental monitoring systems, and the management of resources for the elderly [2]. However, it is essential to ensure that these technologies are accessible, affordable, and environmentally friendly, in order to increase their positive impact and effectively contribute to the achievement of the SDGs. It is possible that the implementation of these technologies may have unintended consequences, such as increased resource consumption [3].
ICTs have promoted the intensive use of the Internet through various electronic devices [4], to the extent that the practice of searching for and reading information in digital format has become an everyday activity. This phenomenon implies a favorable impact on reducing paper consumption and the deforestation associated with its production, and consequently, energy savings. These tasks related to the search and consultation of web information, which are carried out daily on the Internet, also have an impact on the environment. There is a clear relationship between the increase in digitalization and ICT actions and the increase in energy demand and its carbon footprint [5].
Global Internet consumption is subject to fluctuations due to the growth and evolution of the infrastructure, as well as the increase in the number of connected users and devices. In recent years, a significant increase in online data consumption has been observed due to the increased demand for digital services such as video streaming, video conferencing, social networking, e-commerce, and remote work [6,7]. The forecast for the coming years is that consumption will continue to increase [8,9]. This is driven by the proliferation of internet-connected devices, the advancement of technologies such as the Internet of Things (IoT) and the development of augmented reality [10].
In terms of global energy consumption, the Internet is estimated to consume 416.2 TWh per year [11] of the 178,899 TWh consumed worldwide between primary energy and other renewable sources [12]. This means that Internet electricity consumption exceeds that of an entire country such as the United Kingdom, which is in eleventh position in the ranking of countries with the highest electricity consumption, according to data provided by the CIA World Factbook in 2020 [13]. Spain is in fifteenth position with a consumption of 240 TWh.
Internet use undoubtedly provides significant benefits for the environment by reducing the ecological footprint associated with everyday activities (e.g., commuting, broadcasting, monitoring environmental actions) and by enabling more efficient management of resources and processes [14,15]. However, the consumption data indicate a considerable contribution to CO2 emissions and an additional contribution to global warming. The resulting implications highlight the importance of addressing Internet consumption from a sustainability perspective, considering both the benefits and the environmental impact associated with the increasing digitization of society [16].
This article aims to quantify the ecological impact of the websites of Spanish universities. The paper begins by reviewing the literature that has analyzed the digital pollution produced by ICT and websites in relation to the measurement of their environmental impact (Section 2). Although the use of the Internet has enormous benefits for process reduction, it also entails significant energy consumption and a carbon footprint for each activity undertaken. In Section 3, data on the carbon footprint and energy consumption of Spanish university websites are analyzed. Section 4 presents the results on the estimation of whether a website is considered clean or not with respect to the CO2 emissions emitted to the environment. Finally, the discussion is developed, and then the conclusions of the study are presented, confirming that energy consumption can be reduced in the specific field of Spanish university websites, contributing to a more sustainable environment.

2. Background

2.1. Digital Pollution and Environmental Impact

Digital pollution refers to the environmental impact generated by each digital activity. This pollution is caused by the extensive use of digital technologies such as the consumption of data centers, transmission networks and devices. The environmental impact of a product or service is calculated in terms of greenhouse gas emissions measured in metric tons of CO2 equivalent, which encompasses various harmful gases emitted into the atmosphere. The term digital pollution can address several aspects, including e-waste generation, energy consumption and pollution from the production and disposal of digital devices. In other cases, e-pollution refers to the waste generated by electronic products at the end of their useful life (e.g., computers, mobile phones, televisions, or household appliances). Energy analysis is influenced by many factors, such as hardware, the number of users and services on the Internet, and even the evolution of technology towards greater efficiency.
Regarding the energy consumption aspect of manufacturing the devices, data varies, but experts [17] have calculated that manufacturing a computer requires 240 kilos of fossil fuels, 22 kilos of chemicals and 1.5 tons of water. These data serve as an example of dematerialization, where the value and utility of the product significantly outweigh the environmental impact of the materials used in its production.
The energy consumption figures for computers are substantial, and their environmental impact is notable, especially when considering the cumulative production in a single year. According to Canalys (2022) [18], a company specializing in technology market analysis, computer sales showed an increase in 2021 registering 341 million units, whose production alone must have generated a consumption of more than 80 billion kilos of fossil fuels, 7 billion kilos of chemical products and 511 million tons of water. These data illustrate that computing devices contribute significantly to the environmental footprint associated with Internet access, emphasizing the need to examine their environmental influence.
Furthermore, the manufacturing of electronic devices contributes to the generation of waste electrical and electronic equipment. Globally, the production of technological waste is increasing every year, exceeding sixty million metric tons of waste [19]. However, the production of technological waste is uneven across countries, with China and the United States being the largest producers [20,21] and the United Kingdom being the leader in waste production per capita (23.9 kg). These factors collectively contribute to the escalating trend of digital pollution, presenting a substantial environmental challenge. Projections predict an increase in ICT emissions [22,23,24] and if current trends persist, waste production could exceed eighty million metric tons by 2030 [25]. This growth trend poses a major global challenge for governments and institutions to ensure digital sustainability.
The concept of digital pollution has evolved as the understanding of how digital technologies affect the environment has deepened, encompassing not only the production and disposal of devices but also the energy consumption associated with digital infrastructure and device lifecycle management.

2.2. Internet Consumption

In the field of Information Technologies, pollution from data centers and transmission networks is mainly linked to the electricity consumption of the Internet. Some authors [26] attribute 7% of global electricity consumption to ICT and data traffic in digital networks. This is a worrying figure considering that this study forecasts a 20% increase by 2030. As noted by [27], data centers collectively account for approximately 1% of global energy demand. Despite the substantial expansion in data center storage capacity, this growth has occurred alongside enhanced energy efficiency, resulting in a relatively modest increase in energy consumption.
Consumption is attributed both to overall demand and to the individual usage of each user. To estimate digital consumption, activities related to the equipment used to access the Internet are considered, including routers, access networks, cabling, antennas, data centers, computers, laptops, or tablets. The creation of every video, every stored photo, or every message sent contributes to digital pollution. Emerging technologies such as 5G, AI and cryptocurrencies are contributing to the global increase in electricity consumption, even with the improvement of energy efficiency of services and products associated with ICT [28].
Empirical evidence suggests that higher ICT adoption correlates with increased energy demand [29,30,31]. However, there are some discrepancies in terms of energy consumption trends. Recent studies [32,33] have identified a negative and significant correlation between ICT and energy demand, consistent with earlier research [34,35]. These works show a stagnation of the carbon footprint generated by ICTs, with values at the same level as in 2010. According to these studies, the divergences may be attributed to the widespread adoption of smartphones and more energy-efficient systems. Additionally, differences in data could be influenced by varying classification criteria within the ICT sector.
Cloud computing is a cost-effective and environmentally friendly option for reducing economic costs and environmental impact. The shared use of computing resources offers both economic and environmental benefits [36]. However, the technology and data that are stored in the cloud also require substantial amounts of energy, contributing significantly to the carbon footprint. The measurement of operations considers energy consumption in data centers, communication networks, user devices, and the energy required to manufacture the equipment.
In terms of information exchange, a vast amount of data is created daily through various communication channels, including instant messaging, video conferencing, emails, videos, social media postings, and streaming platforms. Each of these web-based interactions generates data that must be stored in data centers, consuming significant amounts of energy and water to cool the servers [35,37,38]. Finally, unused data take up space, contributing to digital pollution.
In relation to web information retrieval, Google estimated the electricity used for a simple internet search in 2009 at 0.2 g of CO2. Google currently handles about 3.5 billion queries per day, which amounts to 630,000 tons of CO2 per year. Although the figure is large, these emissions represented less than 0.0001% of humanity’s carbon footprint, according to Berners-Lee [39], who tried to calculate the carbon footprint of all human activities. However, concerns remained, as [40] tried to address the question of how to set a green research agenda for information retrieval systems by addressing the issues of climate change and environmental sustainability. For some authors, the consumption of a search is also influenced by various factors such as the browser installed, the search engine used, the response time, or the use of click prediction [41,42].
Regarding the consumption of information on the Internet, the amount of energy consumed when consulting a web page could vary significantly depending on several factors, such as the design and content of the page, the efficiency of the servers, the content delivery network, and the type of device used to access the page, among other elements.
Global data on the ICT sector’s carbon emissions also vary according to the literature. Some studies attribute 1.7% of global CO2 emissions to the ICT sector [43], in particular the ITU report estimates a production of 620 tons of carbon dioxide in 2020 [44]. Figures for digital pollution in 2022 indicate that it accounts for 4% of global greenhouse gas emissions [45].

2.3. How to Measure a Website’s Carbon Footprint

Each website can be evaluated in terms of energy consumption and CO2 emissions. On average, for each page visited, 1.76 g of CO2 is produced, or seven grams in the case of a Google search. Consequently, the ecological impact is conditioned by the following: (1) the number of requests made to the http server; (2) the weight of the page in bytes; and (3) the loading time. Therefore, the greater the amount of content, media and animations on the page, the higher the energy consumption. In the early years of the Internet, web pages were generally lighter due to the scarcity of audiovisual content. However, over time, heavier resources such as images, videos, JavaScript and other technologies have been introduced. Despite technological advancements aimed at improving efficiency and optimization, the average size of web pages has continued to increase steadily.
To assess the carbon footprint of a website, several resources are available, such as Greenpixie (Greenpixie Website Carbon Calculator Available online: https://greenpixie.com/website-carbon-calculator (accessed on 19 June 2024)), Digital Beacom (Digital Beacom Beacon Available online: https://digitalbeacon.co/ (accessed on 19 June 2024)), Ecograder (Mightybytes Ecograder Available online: https://ecograder.com/ (accessed on 19 June 2024)) or Website Carbon Calculator (Wholegrain Digital Website Carbon Calculator v3|What’s Your Site’s Carbon Footprint? Available online: https://www.websitecarbon.com/ (accessed on 19 June 2024)), which offer a CO2 calculator. Greenpixie offers a minimalist view providing the CO2 consumption data and the percentage of the CO2 producer with respect to the rest of the pages. Other tools are aimed at developers and provide reports with detailed data to help implement strategies to improve page efficiency (e.g., Google Lighthouse). These applications generate an analysis with varying degrees of depth of selected pages of websites by scoring the pages out of 100. The reports typically include information on page loading speed, accessibility, and SEO performance. In this line, Ecograder assigns a score out of 100 to websites and includes aspects such as performance, efficiency, user experience, and emissions in the report. The overall score is broken down into categories such as accessibility and page size, providing measurements of the weight and emissions of images, scripts, and code.
The Digital Beacon tool, accessible through its website or browser extensions, provides detailed information on the carbon footprint of a website, categorizing emissions by file type. It includes data on CO2 generated on the first visit and after caching of the site, along with details on the size of necessary data transfers. In addition, it shows a history of the tests performed, recording both size metrics and emitted CO2. Digital Beacon claims to calculate the impact based on data transmission using the OneByte methodology [35]. In addition, Wholegrain Digital provides a carbon calculator (Website Carbon Calculator v3) to measure the impact of websites on the planet. According to Wholegrain Digital’s data, the average website analyzed produces approximately 0.5 g of CO2 per page view. This amounts to 60 kg of CO2 per year for a website with 10,000 visits per month. Considering these values, an acceptable carbon footprint should be below these figures. To estimate the energy consumption and emissions associated with a website, Website Carbon Calculator considers the amount of data transferred via cable, the energy intensity inherent in the web data, the primary energy source used by the respective data center, and the carbon intensity associated with the electricity consumed by the center. In addition, a value is provided for the volume of traffic generated by the website, which could be a determining factor in the calculation of its environmental footprint.

3. Materials and Methods
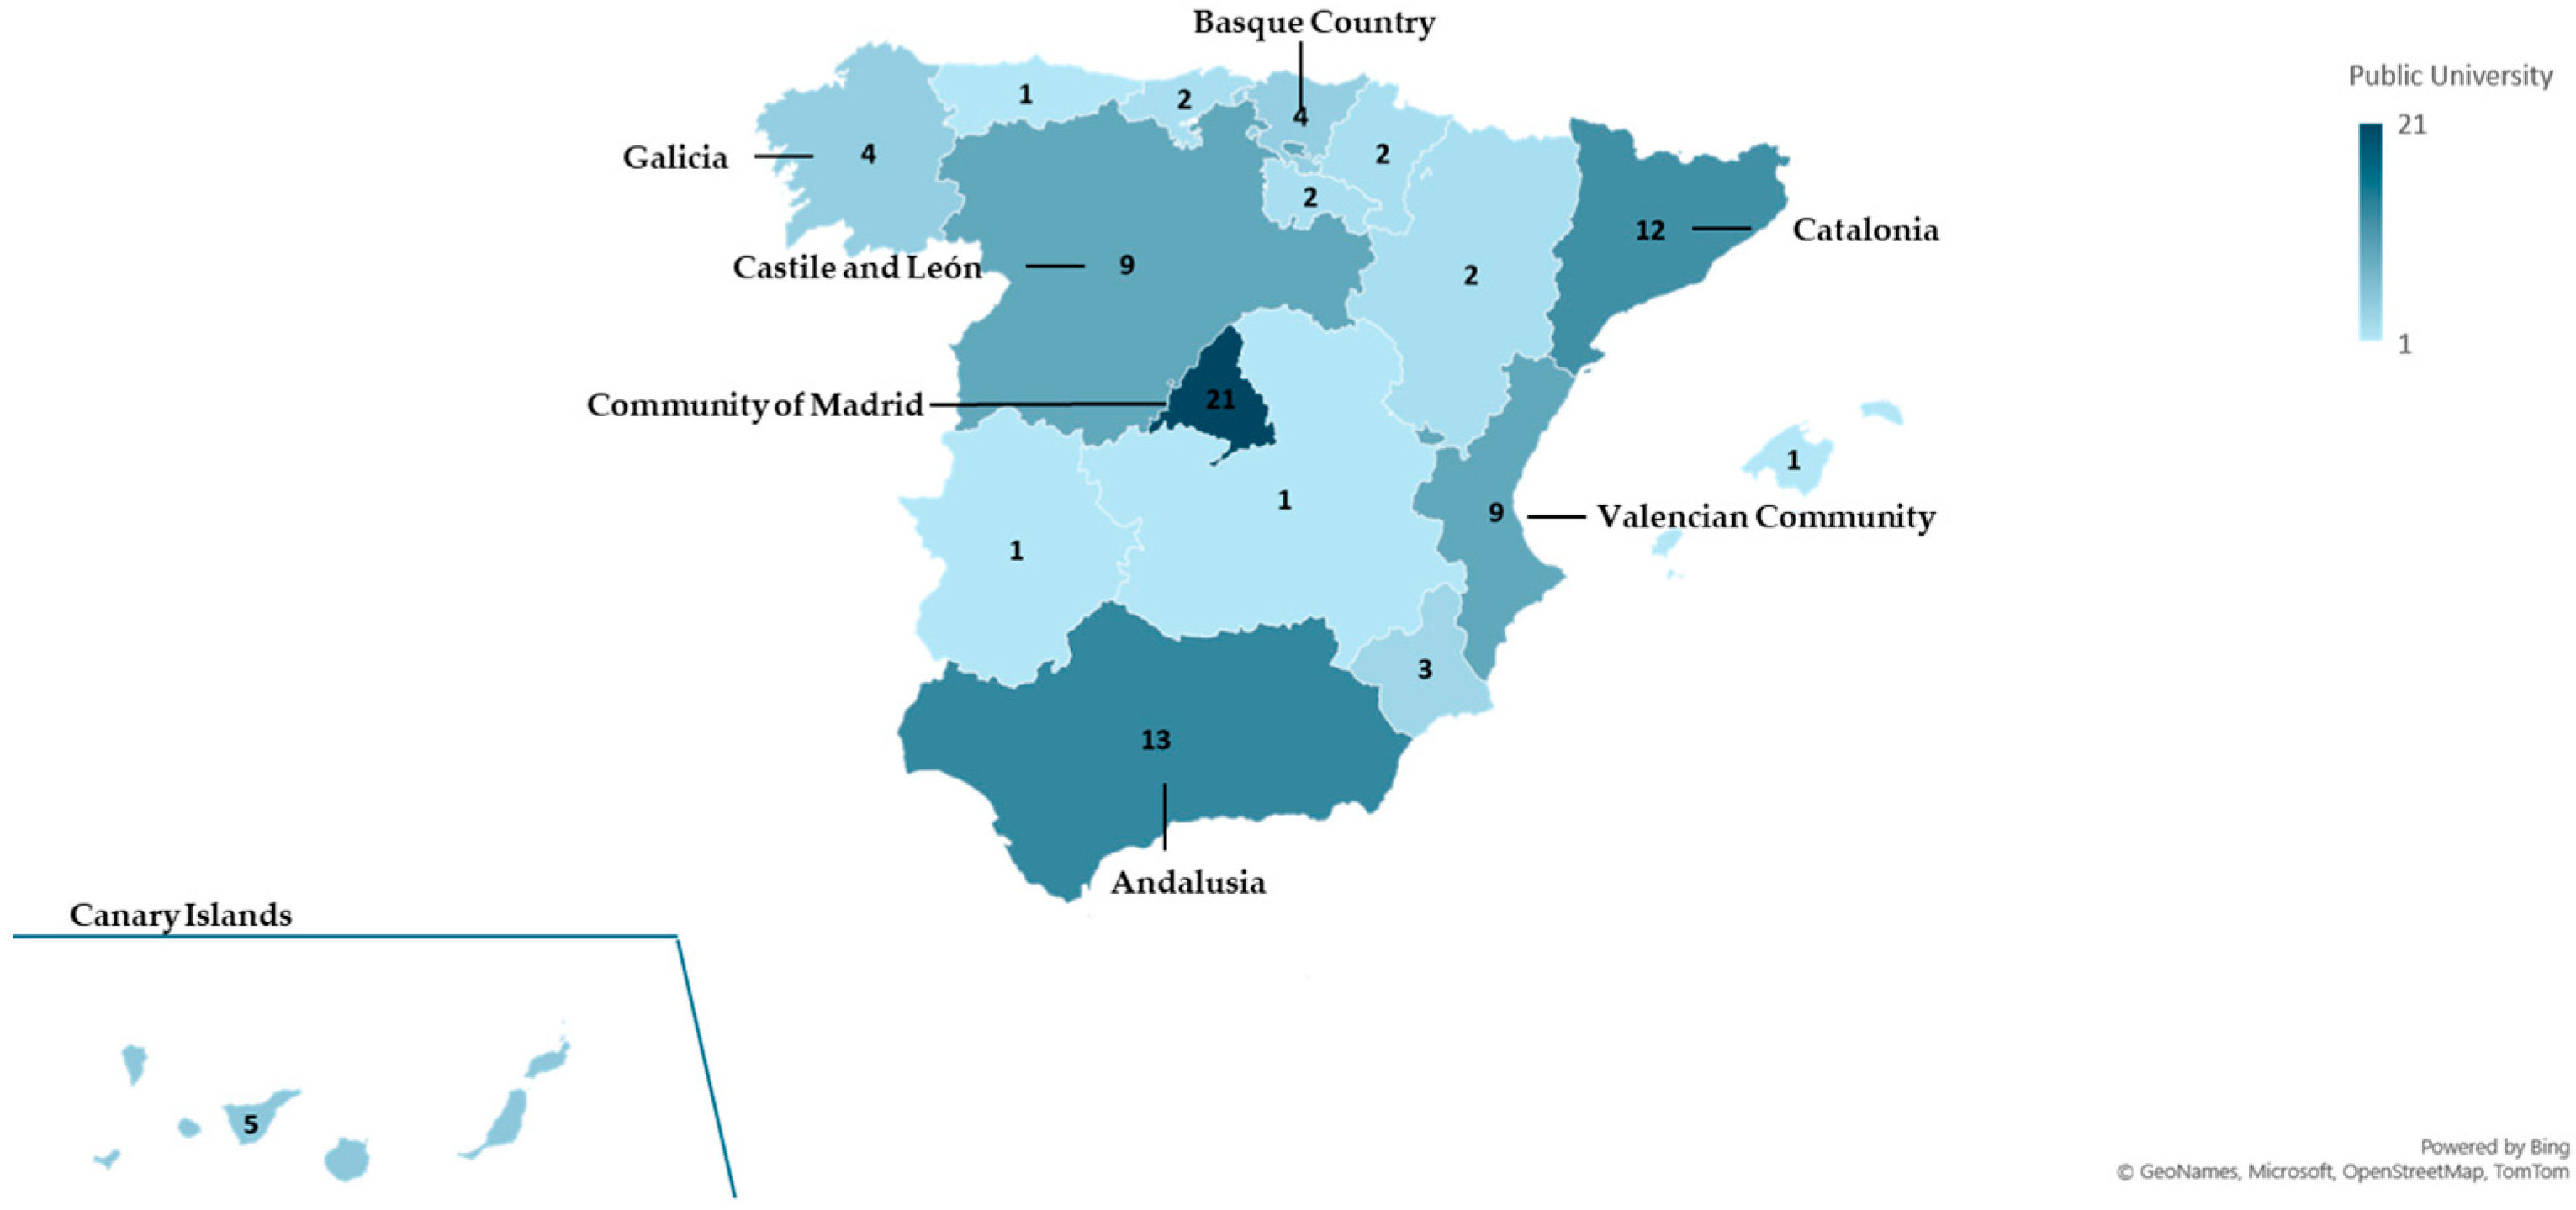
This paper presents an empirical assessment of the energy consumption of Spanish university websites and their impact on greenhouse gas emissions. This research focuses on analyzing the carbon footprint based on energy consumption. This methodological approach is suitable to show, through observation and data quantification, whether there are initiatives to reduce the digital footprint in higher education institutions. The findings enable an evaluation of universities’ dedication to Sustainable Development Goals (SDGs) concerning digital sustainability. The study employs a methodology that combines a literature review with analysis of data gathered from various sources.

3.1. Sample

The websites of 93 Spanish universities were selected for this study. The sample is complete in terms of the Spanish scope, including public and private, on-site and/or distance learning educational centers. According to their type of funding and governance, Spanish universities are 47% private and 54% public. The distribution across the different Spanish regions is unequal, with the largest number of institutions concentrated in the Community of Madrid, Catalonia and Andalusia, respectively (Figure 1). The consultation and evaluation of the websites were carried out between April and May 2023 and data were collected from 92 websites; only in one case were no valid values obtained. These data have been revised and completed in 2024.

3.2. Variables

For each website, Cleaner and Dirtier values were collected for the carbon footprint analysis. Cleaner represents the percentage of cleanliness compared to other websites and dirtier is the percentage of dirtiness compared to other websites analyzed. These rating data were transformed into the following two categories: Green or No Green to facilitate their processing. The classification is determined based on several variables, including grams of CO2 emitted per visit; the production of CO2 in kilograms produced per 10,000 monthly visits over a year; type of energy used; the number of trees needed to absorb the amount of carbon emitted during a year; and the energy consumption in kilowatt-hours.
Data were also collected regarding the characteristics of the universities including their funding sources, the number of students enrolled in the 2023 academic year, and the autonomous community where they are located This information aims to determine whether funding sources or student enrollment significantly influence environmental impact. Finally, the values relating to the organic traffic of the page were collected and correlations analyzed.

3.3. Data Collection and Analysis

The tool employed to collect data on the carbon footprint was the Wholegrain Digital Website Carbon Calculator V3 [11]. The collected values include energy-related factors such as data transfer, energy intensity, source of energy used in data centers, and carbon intensity of electricity, according to the Sustainable Web Design Model (Estimating Digital Emissions Available online: https://sustainablewebdesign.org/estimating-digital-emissions/ (accessed on 20 June 2024)).
  • The wired data transfer accounts for the energy required to load a website. This value is proportional to the data transferred and considers an adjustment for users who have visited the website. It is measured in gigabytes (GB).
  • Energy intensity calculates the average value (Kwh/GB), as the criteria involved vary for each website and visitor.
  • To determine the source of energy used in the data centers, it is checked whether the data center uses green energy, and if so, the carbon emissions are reduced in the calculation. If there is no information yet on the type of energy they use, it is assumed that they use a standard grid. In the case of information regarding the use of green or renewable energy, Wholegrain Digital Website Carbon Calculator V3 applies a reduction to the calculation, although only the adjustment for green hosting is considered in the formula, if the provider has registered the IP on the Green Web Foundation server.
  • Carbon intensity of electricity (g CO2/Kwh) utilizes an international average and a lower value for renewable electricity.
  • Website traffic is measured in thousands (K).
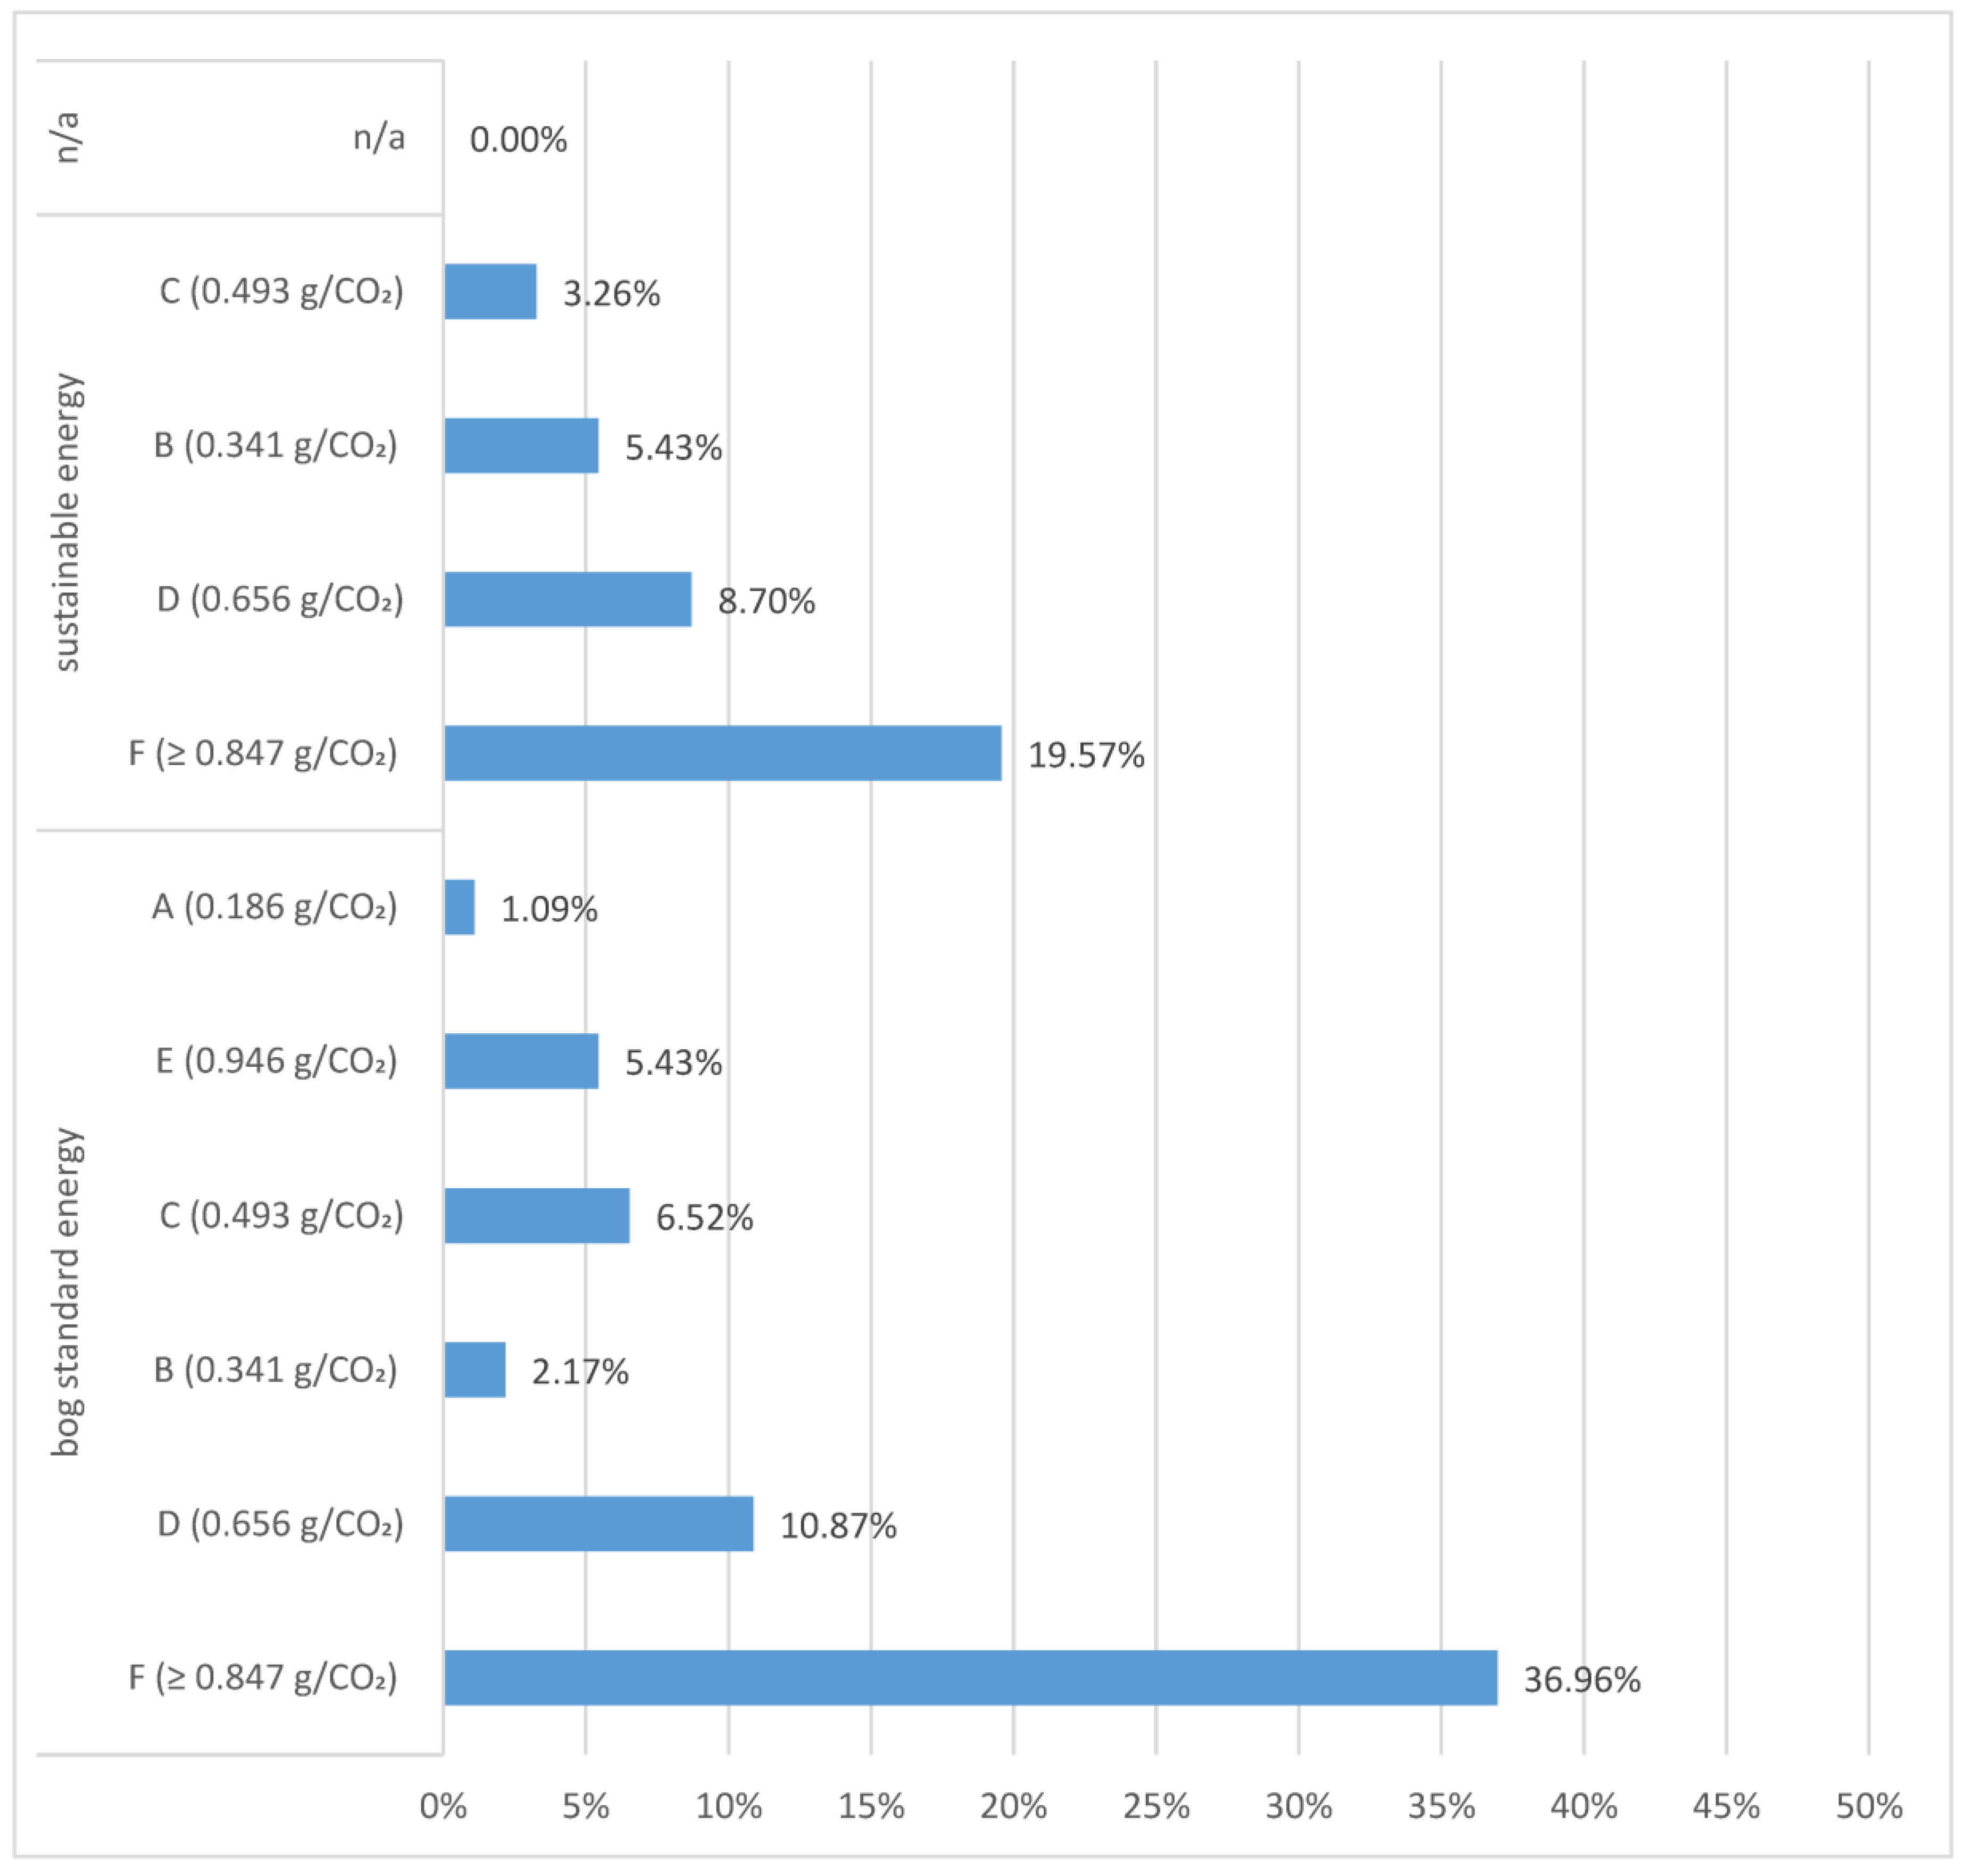
Standardized and average-adjusted values are used for these factors. The total annual CO2 emissions are calculated from the factors related to the energy consumed, supplemented by emissions from an average user visiting a website. This carbon footprint calculation is computed by the number of annual visits and data is provided on kilos of CO2 per 10,000 visits per month. Data is also collected on the number of trees that need to be planted to offset the digital carbon footprint. In order to contextualize this data, the equivalent kilometers travelled with an electric car are provided. As a result of the assessment of these factors, it is estimated (as a percentage) whether the site is clean or not, with respect to the CO2 emissions emitted to the environment. In its 2024 revision, the application assigns a rating ranging across seven levels (from A+ to F) according to CO2 emissions. University characteristics are sourced from the Ministry of Science and Innovation data catalog. Organic traffic is extracted using the online SEO tool ahref.com (accessed on 12 March 2023).

4. Results

The values obtained for the websites of Spanish universities illustrate their environmental impact. Descriptive statistics reveal that only 17% of university websites can be considered clean (Green). Therefore, it stands out that most of them turn out to be non-sustainable websites (83%), although it should also be noted that in one case no data was available (n/a) (Table 1). The highest proportion of sustainable websites is attributed to private universities (11%), while only 7% is attributed to public universities. Regarding the pages labelled as polluting (No Green), between public and private, there are 76 universities that could improve their consumption and CO2 emission rates. Globally, the energy consumption of each university website marked as No Green (44,585 kWh) is more than 5 times that of universities with pages labelled as Green (1607 kWh) (Table 1).
The pages evaluated represent a total energy consumption of 46,192 kWh, with the highest consumption corresponding to public universities labelled as No Green (27,281 kWh). The average expenditure is 502.09 kWh, which represents more than the average monthly consumption of a household in Spain (270 kWh (according to Red Eléctrica Española (REE)). However, the average consumption of the pages labelled as green represents less than one fifth of the energy consumption (100.44 kWh).
With regard to environmental alteration, the universities with Green pages have an average value of 0.35 g of CO2, not exceeding the emission of 0.47 g, while the average of the No Green pages shows mean values of 2.04, with a maximum of 10.57 and a standard deviation of 2.13. Considering that most universities have a No Green page, the difference in total CO2 emissions is significant, reporting more than 149.5 g of difference. The total impact of the universities’ pages is estimated at 160.67 g of CO2 (Table 2).
In terms of CO2 produced per visit to the website, the data indicate that a user generates an average of 1.75 g each time a page is visited. However, there is a significant difference between Green and No Green values. When the page is clean/Green, the average consumption is 0.35 g of CO2. When the page is considered No Green, the average is 2.04 g of CO2, but it should be noted that in 16% of cases, the values exceed this value, even reaching 10 g of CO2.
When considering data on organic website traffic and the number of students enrolled at the university, a positive correlation (0.891) is observed between the number of students enrolled and traffic. Consequently, higher enrollment numbers correlate with increased traffic, amplifying the environmental impact on No Green pages.
For every 10,000 monthly visits to a website, Spanish universities collectively produce 19,211.37 kg of CO2 per month. These values mean that offsetting the carbon footprint with trees would mean planting 921 trees per year and 290,813 km could be covered by an electric car (Table 3).
The data show significant differences in CO2 production, measured in kg per 10,000 visits per month. For pages labelled as clean, emissions range from 20 to 55 kg. In contrast, pages categorized as dirty have an average value of 207.27, with some exceeding 1267 kg of CO2 emissions.
In this study, the servers hosting the analyzed websites predominantly used bog standard energy, with sustainable energy employed in only in only 37% of cases. Interestingly, some websites managed to achieve a clean label without using sustainable energy. However, in more than 73% of the sites that used sustainable energy, the websites were classified as No Green.
A review of the rating based on CO2 emissions and the type of energy used (Figure 2) reveals that none of the pages achieved the A+ rating assigned to pages with a lower environmental impact (A+ = 0.095 g CO2 per pageview). Most of them are rated F, which is considered the least sustainable and means that they emit values greater than or equal to (≥0.847 g CO2). Figure 1 shows that the majority of those using a non-sustainable server also have the lowest rating (F), but also the best grade for this assessment (A) is obtained by a site with a conventionally powered server. It also stands out that almost 20% of the websites using a sustainable server obtained the lowest grade (F) in terms of sustainability.
In relation to energy consumption and CO2 emissions related to the region where the university is located, the data indicate that the regions with the highest number of universities tend to have higher total energy consumption and CO2 emissions (e.g., the Community of Madrid and Andalusia). However, this relationship is not necessarily directly proportional. For instance, Andalusia, with thirteen universities, is the region with the highest energy consumption (7966 KWh) and the highest CO2 emissions (28.84 g) in absolute terms. However, Aragon, with two universities, has the highest average consumption and CO2 emissions (Table 4). Only La Rioja would be within the classification of sustainable and environmentally friendly emissions.

5. Discussion

Digital pollution is a growing problem linked to electricity consumption in the Information Technology (IT) sector. It implies a consumption significant enough to consider the implementation of clean energy and to advocate for sustainability. Digital sustainability aims to meet current needs related to technology manufacturing, data center infrastructure, and the vast number of internet users, without compromising the right of future generations to use this technology [46]. Both businesses and governments are committed to digital sustainability to reduce the environmental footprint and conserve resources within the framework of sustainable goals. However, a scientific assessment of the political impacts of the SDGs concluded that, to date, they have had only a limited transformative political impact in terms of sustainable development [35]. In relation to sustainability efforts on Spanish university websites, the findings of this study show the poor implementation of adequate policies. Despite the efforts made, further progress seems necessary to achieve a substantial impact. Beyond institutional actions, there is a need for a change in human awareness and behavior to ensure users understand the environmental consequences of their consumption. For this reason, sustainability experts emphasize the need to measure the energy required to store and access information as a key element in promoting digital sustainability. Data from this study revealed that the type of energy used is not decisive for achieving a low energy rating, highlighting the need to focus design efforts on minimizing the HTTP file transfer size. Enhancing web platform efficiency is crucial to enabling all institutions to contribute effectively toward achieving the SDGs by 2030.
Furthermore, it is essential to recognize that overconsumption and overexploitation of natural resources pose a significant threat to long-term sustainability. The 2030 Agenda highlights the need to address this sustainable problem [1], as irresponsible consumption carries a considerable environmental burden, depleting natural resources and exacerbating challenges related to climate change, biodiversity loss and pollution. In this sense, the adoption of more sustainable consumption practices and promoting a culture of responsible consumption become key elements in moving towards sustainable development.
The carbon footprint is a widely used metric in environmental studies in various sectors, including the textile industry, tourism, automotive, agriculture and the technology and computer industry. So far, in this field of ICT, the carbon footprint has focused especially on the waste of technological materials such as devices or batteries. The development of ICTs and new habits in information management and communication are also linked to digital consumption that impacts the environment. Digital consumption is a phenomenon that is difficult to measure, partly because it seems invisible due to the high consumption of intangible elements. According to previous studies [47], users do not perceive a negative impact on the environment when using technology. In fact, it is often regarded as a relatively harmless activity, possibly because the alternative of not using it implies a higher CO2 production. In this study, we have only analyzed whether universities reflect digital sustainability on their websites, but the fact is that the volume of websites worldwide raises the emissions data to that of developed countries. It is therefore timely to report on the carbon footprint generated by web resources and the actions of internet users. By becoming aware of the impact on the environment, initiatives can be promoted to educate populations on both the optimization of web resource management processes and responsible and sustainable use.
It is only a matter of time before the university education community also applies sustainability criteria to its website, as academia and research can educate populations on the responsible use of energy resources and the responsible consumption of information. In order to control man-triggered climate changes, the commitment of the institutions is required, which must implement a strategy to reduce emissions. This purpose involves calculating the carbon footprint to adapt to some of the European policies such as Spanish Law 7/2021 [48] on climate change and energy transition (whereby they must publish their carbon footprint), and Law 11/2018 [49] on non-financial and diversified information (information on carbon emissions and planning to reduce them) or the green procurement plan of the General State Administration to include commitment to the environment as a criterion for awarding contracts. It is expected that the increase in energy demand will be offset by energy efficiency (data centers, servers, storage devices, network and infrastructures), but for this to happen, sustainable web design (SWD) must be implemented. The results of this study indicate that the web pages of Spanish universities have not yet reached the optimal values to be classified as clean pages according to the Sustainable Web Design Model [50].

6. Conclusions

This paper examines the carbon footprint associated with the use of web information in relation to the websites of Spanish universities. The results of this study indicate that the web pages of Spanish universities have not yet reached the optimal values to be classified as clean pages. Although in many cases, they use servers powered by sustainable energy sources, there is still room for improvement. In general, neither public nor private universities are yet making sufficiently efficient use of resources to reduce CO2 emissions. Given the high volume of traffic on university websites, the resulting high energy consumption leads to considerable CO2 emissions and thus a significant carbon footprint.
This work is a novel contribution to the awareness of consumption in this area and promotes the adoption of ecological and sustainable approaches. It confirms that significant energy consumption can result from seemingly innocuous choices, such as accessing websites of Spanish universities. If other non-university websites are considered, all data point to a substantial increase in energy demand, driven not only by the growing volume of websites, but also by the increasing number of users in our increasingly digitized society.
There are various methodologies for calculating the carbon footprint, and the choice of a specific methodology may influence the results. Our study has followed the SWD model, but we recognize that using different approaches may produce slightly different results. It is suggested that the environmental benefits come from applying sustainable web design practices, so in future work, we aim to determine which technical differences are the most relevant to determine the best practices to achieve the greatest environmental benefit. Also, we intend to conduct a comparative analysis between the results obtained in Spain and those from other EU member countries to compare behavior and commitment to European policies. To develop this approach, we will analyze reference websites that provide comparable and reliable data. Additionally, it is essential to identify and utilize a model that serves as a reference for other countries to follow the same CO2 reduction criteria, thereby facilitating a more consistent and effective evaluation of the strategies implemented in different geographical contexts.

Author Contributions

Conceptualization, S.S.-C. and J.M.; methodology, S.S.-C. and J.M.; formal analysis, S.S.-C. and J.M.; investigation, S.S.-C. and J.M.; writing—original draft preparation, S.S.-C. and J.M. All authors have read and agreed to the published version of the manuscript.

Funding

This research received no external funding.

Institutional Review Board Statement

Not applicable.

Informed Consent Statement

Not applicable.

Data Availability Statement

Data presented in this study are openly available on the web and in the Web of Science and Scopus repositories.

Conflicts of Interest

The authors declare no conflicts of interest.

References

  1. UN. General Assembly Resolution A/RES/70/1. Transforming Our World: The 2030 Agenda for Sustainable Development. 2015. Available online: https://www.unfpa.org/sites/default/files/resource-pdf/Resolution_A_RES_70_1_EN.pdf (accessed on 26 April 2024).
  2. Morato, J.; Sanchez-Cuadrado, S.; Iglesias, A.; Campillo, A.; Fernández-Panadero, C. Sustainable Technologies for Older Adults. Sustainability 2021, 13, 8465. [Google Scholar] [CrossRef]
  3. Fich, L.E.; Viola, S.; Bentsen, N.S. Jevons Paradox: Sustainable Development Goals and Energy Rebound in Complex Economic Systems. Energies 2022, 15, 5821. [Google Scholar] [CrossRef]
  4. European Commission EU Action Plan on Digitalising the Energy System. Available online: https://ec.europa.eu/commission/presscorner/detail/en/qanda_22_6229 (accessed on 1 July 2023).
  5. The Shift Project. Lean ICT: Towards Digital Sobriety—Report of the Working Group Directed by Hugues Ferreboeuf for the Think Tank. The Shift Project. March 2019. Available online: https://theshiftproject.org/wp-content/uploads/2019/03/Lean-ICT-Report_The-Shift-Project_2019.pdf (accessed on 6 February 2023).
  6. Wang, E.-Z.; Lee, C.-C. The Impact of Information Communication Technology on Energy Demand: Some International Evidence. Int. Rev. Econ. Financ. 2022, 81, 128–146. [Google Scholar] [CrossRef]
  7. Kettle, J. The Internet Consumes Extraordinary Amounts of Energy. Here’s How We Can Make It More Sustainable. 2021. Available online: http://theconversation.com/the-internet-consumes-extraordinary-amounts-of-energy-heres-how-we-can-make-it-more-sustainable-160639 (accessed on 28 April 2024).
  8. Cisco. The Zettabyte Era: Trends and Analysis, Whitepaper. Cisco Public. 2017. Available online: https://www.hit.bme.hu/~jakab/edu/HTI18/Litr/Cisco_The_Zettabyte_Era_2017June__vni-hyperconnectivity-wp.pdf (accessed on 22 May 2024).
  9. Cisco. Cisco Global Cloud Index, Forecast and Methodology 2016–2021, Whitepaper. 2018. Available online: https://virtualization.network/Resources/Whitepapers/0b75cf2e-0c53-4891-918e-b542a5d364c5_white-paper-c11-738085.pdf (accessed on 22 May 2024).
  10. Das, S.; Mao, E. The Global Energy Footprint of Information and Communication Technology Electronics in Connected Internet-of-Things Devices. Sustain. Energy Grids Netw. 2020, 24, 100408. [Google Scholar] [CrossRef]
  11. Wholegrain Digital Website Carbon Calculator v3|What’s Your Site’s Carbon Footprint? Available online: https://www.websitecarbon.com/ (accessed on 28 April 2024).
  12. Ritchie, H.; Rosado, P.; Roser, M. Energy Production and Consumption. Available online: https://ourworldindata.org/energy-production-consumption (accessed on 28 April 2024).
  13. CIA World Factbook: Energy: Electricity—Consumption, Indexmundi.com. 2020. Available online: https://www.indexmundi.com/g/r.aspx?v=81 (accessed on 25 April 2024).
  14. Baliga, J.; Hinton, K.; Ayre, R.; Tucker, R.S. Carbon Footprint of the Internet. Telecommun. J. Aust. 2009, 59, 5.1–5.14. [Google Scholar] [CrossRef]
  15. Raghavan, B.; Ma, J. The Energy and Emergy of the Internet. In Proceedings of the 10th ACM Workshop on Hot Topics in Networks, Cambridge, MA, USA, 14 November 2011; ACM: Cambridge, MA, USA, 2011; pp. 1–6. [Google Scholar]
  16. Johnson, J. Worldwide Digital Population as of January 2022. Available online: https://www.statista.com/statistics/617136/digital-population-worldwide/ (accessed on 28 April 2024).
  17. Kuehr, R.; Velasquez, G.T.; Williams, E. Computers and the Environment—An Introduction to Understanding and Managing Their Impacts. In Computers and the Environment: Understanding and Managing Their Impacts; Kuehr, R., Williams, E., Eds.; Springer: Dordrecht, The Netherlands, 2003; pp. 1–15. ISBN 978-94-010-0033-8. [Google Scholar]
  18. Canalys Global PC Shipments Pass 340 Million in 2021 and 2022 Is Set to Be Even Stronger. Available online: https://canalys-prod-public.s3.eu-west-1.amazonaws.com/static/press_release/2022/1722929869Canalys_PR-_Global-PC_Shipments-Q4-2021.pdf (accessed on 28 April 2024).
  19. United Nations Institute for Training and Research. Electronic Waste Generated Worldwide from 2010 to 2022 (in Million Metric tons) [Graph]. In Statista. 22 May 2024. Available online: https://www.statista.com/statistics/499891/projection-ewaste-generation-worldwide/ (accessed on 26 April 2024).
  20. Forti, V.; Baldé, C.P.; Kuehr, R.; Bel, G. The Global E-Waste Monitor 2020: Quantities, Flows and the Circular Economy Potential; UNU/UNITAR: Bonn, Germany; ITU: Geneva, Switzerland; ISWA: Rotterdam, The Netherlands, 2020; p. 120. ISBN 978-92-808-9114-0. [Google Scholar]
  21. United Nations Institute for Training and Research. Leading Countries Based on Electronic Waste Generation Worldwide in 2022 (in 1000 Metric Tons) [Graph] In Statista. 19 March 2024. Available online: https://www.statista.com/statistics/499952/ewaste-generation-worldwide-by-major-country/ (accessed on 26 April 2024).
  22. Belkhir, L.; Elmeligi, A. Assessing ICT Global Emissions Footprint: Trends to 2040 & Recommendations. J. Clean. Prod. 2018, 177, 448–463. [Google Scholar] [CrossRef]
  23. Andrae, A.S.G. Hypotheses for Primary Energy Use, Electricity Use and CO2 Emissions of Global Computing and Its Shares of the Total Between 2020 and 2030. WSEAS Trans. Power Syst. 2020, 15, 50–59. [Google Scholar] [CrossRef]
  24. Bruna, A. Global E-Waste-Statistics & Facts; Statista: Hamburg, Germany, 2023; Available online: https://www.statista.com/topics/3409/electronic-waste-worldwide/ (accessed on 3 July 2023).
  25. United Nations Institute for Training and Research. Electronic Waste Generation Worldwide in 2022, with a Projection for 2030 (in Million Metric Tons) [Graph] In Statista lnc. 19 March 2024, p. 26. Available online: https://www.statista.com/statistics/1067081/generation-electronic-waste-globally-forecast/ (accessed on 26 April 2024).
  26. Gailhofer, P.; Herold, A.; Schemmel, J.P.; Sherf, C.-S.; Urrutia, C.; Kóhler, A.; Braungardt, S. The Role of Artificial Intelligence in the European Green Deal; Policy Department for Economic, Scientific and Quality of Life Policies Directorate-General for Internal Policies; European Union: Brussels, Belgium, 2021; Available online: https://www.europarl.europa.eu/RegData/etudes/STUD/2021/662906/IPOL_STU(2021)662906_EN.pdf (accessed on 25 April 2024).
  27. Masanet, E.; Shehabi, A.; Lei, N.; Smith, S.; Koomey, J. Recalibrating Global Data Center Energy-Use Estimates. Science 2020, 367, 984–986. [Google Scholar] [CrossRef]
  28. Gelenbe, E. Electricity Consumption by ICT: Facts, Trends, and Measurements. Ubiquity 2023, 2023, 1–15. [Google Scholar] [CrossRef]
  29. Kouton, J. Information Communication Technology Development and Energy Demand in African Countries. Energy 2019, 189, 116192. [Google Scholar] [CrossRef]
  30. Arshad, Z.; Robaina, M.; Botelho, A. The Role of ICT in Energy Consumption and Environment: An Empirical Investigation of Asian Economies with Cluster Analysis. Environ. Sci. Pollut. Res. 2020, 27, 32913–32932. [Google Scholar] [CrossRef]
  31. Lange, S.; Pohl, J.; Santarius, T. Digitalization and Energy Consumption. Does ICT Reduce Energy Demand? Ecol. Econ. 2020, 176, 106760. [Google Scholar] [CrossRef]
  32. Usman, A.; Ozturk, I.; Hassan, A.; Maria Zafar, S.; Ullah, S. The Effect of ICT on Energy Consumption and Economic Growth in South Asian Economies: An Empirical Analysis. Telemat. Inform. 2021, 58, 101537. [Google Scholar] [CrossRef]
  33. Zhao, S.; Hafeez, M.; Faisal, C.M.N. Does ICT Diffusion Lead to Energy Efficiency and Environmental Sustainability in Emerging Asian Economies? Environ. Sci. Pollut. Res. 2022, 29, 12198–12207. [Google Scholar] [CrossRef]
  34. Shehabi, A.; Smith, J.S.; Sartor, D.A.; Brown, R.E.; Herrlin, M.; Koomey, J.G.; Masanet, E.R.; Horner, N.; Azevedo, I.L.; Lintner, W. United States Data Center Energy Usage Report|Energy Technologies Area; Lawrence Berkeley National Laboratory: Berkeley, CA, USA, 2016.
  35. Malmodin, J.; Lundén, D. The Energy and Carbon Footprint of the Global ICT and E&M Sectors 2010–2015. Sustainability 2018, 10, 3027. [Google Scholar] [CrossRef]
  36. Armbrust, M.; Fox, A.; Griffith, R.; Joseph, J.D.; Katz, R.H.; Konwinski, A.; Lee, G.; Patterson, D.A.; Rabkin, A.; Stoica, I.; et al. Above the Clouds: A Berkeley View of Cloud Computing; Technical Report No. UCB/EECS-2009 28; EECS Department, University of California: Berkeley, CA, USA, 2009. [Google Scholar]
  37. Ong, D.; Moors, T.; Sivaraman, V. Comparison of the Energy, Carbon and Time Costs of Videoconferencing and in-Person Meetings. Comput. Commun. 2014, 50, 86–94. [Google Scholar] [CrossRef]
  38. Aslan, J.; Mayers, K.; Koomey, J.G.; France, C. Electricity Intensity of Internet Data Transmission: Untangling the Estimates. J. Ind. Ecol. 2018, 22, 785–798. [Google Scholar] [CrossRef]
  39. Berners-Lee, M. How Bad Are Bananas? The Carbon Footprint of Everything, Revised 2020th ed.; New Edition-Updated and Expanded; Profile Books: London, UK, 2020; ISBN 9781788163811. [Google Scholar]
  40. Chowdhury, G. An Agenda for Green Information Retrieval Research. Inf. Process. Manag. 2012, 48, 1067–1077. [Google Scholar] [CrossRef]
  41. Dubovoi, V.; Moskvin, O. Impact of the Internet Resources Structure on Energy Consumption While Searching for Information. In Green IT Engineering: Concepts, Models, Complex Systems Architectures; Kharchenko, V., Kondratenko, Y., Kacprzyk, J., Eds.; Springer International Publishing: Cham, Switzerland, 2017; Volume 74, pp. 125–146. ISBN 9783319441610. [Google Scholar]
  42. Bai, X.; Arapakis, I.; Cambazoglu, B.B.; Freire, A. Understanding and Leveraging the Impact of Response Latency on User Behaviour in Web Search. ACM Trans. Inf. Syst. 2018, 36, 1–42. [Google Scholar] [CrossRef]
  43. The Word Bank and ITU. Measuring the Emissions & Energy Footprint of the ICT Sector: Implications for Climate Action; A Joint ITU/WB Report; The World Bank and International Telecommunication Union: Washington, DC, USA; Geneva, Switzerland, 2024; ISBN 978-92-61-38541-5. [Google Scholar]
  44. International Telecommunication Union. Greenhouse Gas Emissions Trajectories for the Information and Communication Technology Sector Compatible with the UNFCCC Paris Agreement; Series l: Environment and ICTS, Climate Change, e-Waste, Energy Efficiency; Construction, Installation and Protection of Cables and Other Elements of Outside Plant; International Telecommunication Union: Geneva, Switzerland, 2020; L.1470 ITU-T; Available online: http://handle.itu.int/11.1002/1000/14084 (accessed on 12 September 2023).
  45. ADEME Evaluation de l’impact environnemental du numérique en France et analyse prospective. Les Actes L’arcep 2022, 17. Available online: https://librairie.ademe.fr/consommer-autrement/5226-evaluation-de-l-impact-environnemental-du-numerique-en-france-et-analyse-prospective.html (accessed on 16 April 2024).
  46. United Nations. Report of the World Commission on Environment and Development: Our Common Future; United Nations: New York, NY, USA, 1987. Available online: https://www.are.admin.ch/dam/are/en/dokumente/nachhaltige_entwicklung/dokumente/bericht/our_common_futurebrundtlandreport1987.pdf.download.pdf/our_common_futurebrundtlandreport1987.pdf (accessed on 12 April 2024).
  47. Elgaaied-Gambier, L.; Bertrandias, L.; Bernard, Y. Cutting the Internet’s Environmental Footprint: An Analysis of Consumers’ Self-Attribution of Responsibility. J. Interact. Mark. 2020, 50, 120–135. [Google Scholar] [CrossRef]
  48. BOE-A-2021-8447 Ley 7/2021, de 20 de Mayo, de Cambio Climático y Transición Energética. Available online: https://www.boe.es/buscar/act.php?id=BOE-A-2021-8447 (accessed on 16 April 2024).
  49. BOE-A-2018-17989 Ley 11/2018, de 28 de Diciembre, por la que se Modifica el Código de Comercio, el Texto Refundido de la Ley de Sociedades de Capital Aprobado por el Real Decreto Legislativo 1/2010, de 2 de Julio, y la Ley 22/2015, de 20 de Julio, de Auditoría de Cuentas, en Materia de Información no Financiera y Diversidad. Available online: https://www.boe.es/buscar/doc.php?id=BOE-A-2018-17989 (accessed on 16 April 2024).
  50. Estimating Digital Emissions. Available online: https://sustainablewebdesign.org/estimating-digital-emissions/ (accessed on 20 June 2024).
Figure 1. Distribution of Spanish universities by region.
Sustainability 16 05670 g001
Figure 2. Assigned classification (A–F) and type of energy (bog standard and sustainable energy) used by the universities’ website infrastructure. The grading scale, offered by Website Carbon Calculator, ranges from A+ to F, correlating the page weight from HTTP Archive with estimated CO2 emissions per page view. Assigned n/a when data unavailable. Bog standard energy refers to conventional energy without advanced technologies to reduce carbon emissions.
Sustainability 16 05670 g002
Table 1. Energy consumption in kWh of the websites of Spanish universities.
UniversitiesUniversities (%)Mean ± SDMax kWh of EnergyMin kWh of Energy
Green1617100.4 ± 25.1113946
Private1011103.80 ± 17.2413882
Public6794.83 ± 36.0013946
No Green7683586.64 ± 631.663.309131
Private3336524.36 ± 598.903.309135
Public4347634.44 ± 658.653.309131
n/a 0
Public10
Total93100502.09 ± 602.733.30946
Table 2. CO2 emissions (g) from the websites of 94 Spanish universities.
UniversitiesMean ± SDMax. CO2Min CO2Total CO2
Green160.35 ± 0.090.470.175.56
Private100.36 ± 0.070.450.283.56
Public60.33 ±0.120.470.172.00
No Green762.04 ± 2.1310.570.48155.08
Private331.73 ± 1.9010.570.5156.95
Public432.28 ± 2.2810.570.4898.13
Total921.75 ± 2.0410.570.17160.64
Table 3. Data obtained for 93 Spanish universities according to Green or No Green classification. Category n/a no data available on Wholegrain Digital Website.
Σ Organic Traffic (in K)Σ Enrolled in 2023Σ 10,000 Visits per Month (kg)Σ Trees to CompensateΣ km in Electric Car
Green3050.80282,334667.763910,281
No Green9406.501,312,40718,543.61882280,532
n/a398.3053,620
Total12,855.601,648,36119,211.37921290,813
Table 4. Energy consumption and CO2 emissions by Spanish region.
RegionUniversitiesMean kWh EnergyΣ kWhMean CO2 (g)Σ CO2 (g)
Aragon2174834965.911.17
Canary Island5104652313.3816.91
Valencian Community961755492.2420.13
Andalusia1361379662.2228.84
Navarre260112012.044.08
Castilla y Leon950945811.8616.77
State14924921.811.81
Catalonia1243648001.5116.66
Region of Murcia336110841.333.99
Balearic Islands13623621.331.33
Community of Madrid2136977421.2526.35
Basque Country432613031.084.32
Castilla-La Mancha13243241.041.04
Galicia427911160.963.84
Asturias12022020.740.74
Cantabria22014020.701.40
Extremadura11861860.690.69
La Rioja2781550.290.57
Disclaimer/Publisher’s Note: The statements, opinions and data contained in all publications are solely those of the individual author(s) and contributor(s) and not of MDPI and/or the editor(s). MDPI and/or the editor(s) disclaim responsibility for any injury to people or property resulting from any ideas, methods, instructions or products referred to in the content.

