Article

Climate Change Adaptation Strategies and Its Impact on Household Vulnerability to Food Insecurity: A Micro-Level Evidence from Southwest Ethiopia

1
Department of Economics, Mizan Tepi University, Mizan Aman P.O. Box 260, Ethiopia
2
Ethiopian Economics Association, Addis Ababa P.O. Box 34282, Ethiopia
3
International Institute of Tropical Agriculture (IITA), Headquarters & West African Hub, Ibadan P.O. Box 5320, Nigeria
*
Author to whom correspondence should be addressed.
Sustainability 2024, 16(13), 5766; https://doi.org/10.3390/su16135766
Submission received: 31 May 2024 / Revised: 21 June 2024 / Accepted: 26 June 2024 / Published: 6 July 2024

Abstract

:
Smallholder farmers in Ethiopia face increasing challenges from climate change and variability, which threaten their food security and livelihoods. This study examines how adopting single and combined climate change adaptation practices affects their vulnerability to food insecurity in Bench Maji Zone, southwest Ethiopia. Through multistage sampling, data were gathered from 390 rural households in four climate-prone districts. The study examines the impacts resulting from both individual and combined implementations of adaptation techniques. These techniques encompass crop management practices, soil and water conservation measures, and livelihood portfolio diversification strategies. The study employed the multinomial endogenous treatment effect regression model to address selection bias and endogeneity resulting from various sources of heterogeneity, whether observed or unobserved. The results show that farmers who adopted adaptation practices were less vulnerable to food insecurity than those who did not. The study also finds that adopting multiple practices has a more significant impact than adopting single practices. Our findings suggest that implementing climate change adaptation strategies can increase the resilience of smallholder farmers in the study area and decrease their vulnerability to food insecurity. The study recommends supporting farmers in adopting these strategies through research and development, information dissemination, and collaborations among farmers, researchers, and extension services.

1. Introduction

It is widely agreed upon that the global climate has undergone significant changes and will continue to do so. The IPCC’s Sixth Assessment Report (AR6) offers vital information about the physical science underpinnings of climate change. According to the report, human activity raised the average global surface temperature during the pre-industrial era. From 1850–1900 to 2010–2019, the global surface temperature has increased by 0.8 °C to 1.3 °C, with the most accurate estimate being 1.07 °C [1]. It is crucial to comprehend the far-reaching impacts of global warming on the delicate balance of the planet’s climate and environmental systems. Rising temperatures are expected to lead to more frequent severe weather events like droughts, storms, and floods. Additionally, ripple effects could include disruptions in ocean currents, altered rainfall patterns, and a worrisome rise in sea levels [2].
The impacts of global climate change are felt differently across the world, with developing countries bearing the brunt due to their limited capacity for climate change adaptation, technology, and resources [3,4]. Food security remains a pressing issue in developing nations, including Ethiopia, where instability and fluctuations persist due to various factors such as shocks, environmental threats, and resilience to challenges. Households in these regions face unpredictable access to food as a result of natural disasters and economic shocks [5,6]. Understanding the dynamic nature of food insecurity is essential for policymakers and researchers to devise effective strategies and interventions to enhance food security in these vulnerable areas. The resilience of households to cope with and recover from these events plays a crucial role in determining the availability and accessibility of food.
The World Food Programme [7] has reported a distressing surge in the number of Ethiopians requiring humanitarian food assistance. It is estimated that 15.4 million people have been impacted due to ongoing instability and climate-related disruptions. This crisis is expected to continue, resulting in a prolonged period of heightened need throughout 2024. The vulnerability of Ethiopia’s rural livelihood systems, which rely on agricultural, pastoral, and agropastoral systems, to climate change is a pressing concern. Rainfall is a primary climatic factor that significantly influences food production and access in Ethiopia since the agricultural system relies mainly on rainwater rather than irrigation [8].
Adaptation strategies play a vital role in ensuring the sustainability of agriculture in Ethiopia, especially in the face of climate change. The ability of farmers to adapt to environmental and economic challenges is key to building resilience in the agricultural sector. Farmers’ ability to adapt to environmental and economic disturbances is essential for the resilience of the sector [9]. Limited adaptation skills among farmers can result in economic setbacks. According to the [10] characterization, smallholder farmers in Ethiopia typically cultivate less than 2 hectares of land. They engage in mixed farming, involving both crop production and animal husbandry, and heavily rely on family labor for agricultural tasks. Due to their limited access to modern agricultural inputs, technology, and extension services, their output is primarily for subsistence, with a minimal surplus for commercial purposes. Additionally, the [10] report highlighted that Ethiopian smallholder farmers are particularly susceptible to external shocks such as market fluctuations, diseases, pests, and climate variability. To combat the adverse effects of climate change and variability, smallholder farmers and local governments are implementing various strategies, such as soil and water conservation, crop diversification, and livelihood diversification. These strategies are aimed at reducing vulnerability to food insecurity.
Despite the importance of adaptation strategies, there has been a lack of comprehensive analysis of their impact on farmers’ vulnerability to food insecurity. Up to now, far too little attention has been paid to analyzing the impacts of different adaptation strategies to climate change and variability on farmers’ welfare in a rigorous fashion. Few studies have primarily focused on examining the impacts of individual or single adaptation practices, such as crop diversification or soil and water conservation [11,12,13]. While these studies have greatly enhanced our understanding of adaptation and its impact on farmers’ well-being, they fail to consider a range of complementary, alternative, and supplemental approaches to address climate change and variability. Moreover, [14] highlighted that farmers often employ a combination of strategies to cope with climate variability and argued for the importance of analyzing the synergistic effects of these practices. Similarly, [15] noted that adopting a single adaptation strategy may be insufficient and emphasized the need to consider the joint impacts of complementary adaptation measures. Therefore, ignoring the likely interrelationships between the various strategies in adoption and impact analysis may lead to biased conclusions [16].
Few studies have explored the impact of adaptation practices on farmers’ welfare in Ethiopia, utilizing a variety of adaptation strategies [17,18]. However, these studies often fail to delve into the specific areas of adaptation to climate change, resulting in limited insights into the effectiveness of different strategies. Neglecting the diverse adaptation strategies and capacities across different contexts and locations can lead to inaccurate conclusions regarding the true impact of these measures [19].
Against this backdrop, this study focuses on examining how various adaptation practices influence household vulnerability to food insecurity at the micro level. By evaluating both individual and combined adaptation strategies, this research aims to offer a comprehensive understanding of farmers’ adaptation behaviors and their implications for food security.
The results of this study hold significant potential to inform policymakers, development organizations, and international research initiatives about crafting more targeted and effective adaptation strategies for the agricultural sector. By contributing valuable insights to the existing literature on climate change adaptation, this study sheds light on how farmers can adapt to the challenges posed by a changing climate. Through identifying the impact of adaptation practices on vulnerability to food insecurity, our research aims to enhance our understanding of sustainable adaptation measures within the agricultural sector, ultimately fostering resilience in the face of climate change. Additionally, the study can provide crucial information to policymakers and agricultural extension services, improving their comprehension of farmers’ interpretations of climate change and the constraints that hinder them from implementing more robust adaptation measures. This understanding, in turn, will guide policymakers in promoting adaptation and developing a more participatory plan for climate change and variability. Furthermore, the study results will benefit non-governmental organizations (NGOs) and donor countries engaged in development activities by offering location-specific insights that may influence their development intervention approaches.

2. Materials and Methods

2.1. Research Design

The study employed a quantitative research design using cross-sectional data. Survey data were collected from smallholder farmers to assess the impacts of climate change adaptation practices on households’ vulnerability to food insecurity. The survey covered adopters and non-adopters of climate change adaptation practices, using a non-experimental approach. To ensure the representativeness of the sample and wider generalizability of the results, we used a multi-stage sampling procedure involving both purposive and random selection. Data analysis was carried out using descriptive statistics and econometric models, such as a multinomial endogenous treatment effect (METE) model. This rigorous quantitative approach allowed us to generate robust, evidence-based findings that can inform policies and interventions to enhance the climate resilience of smallholder farmers.

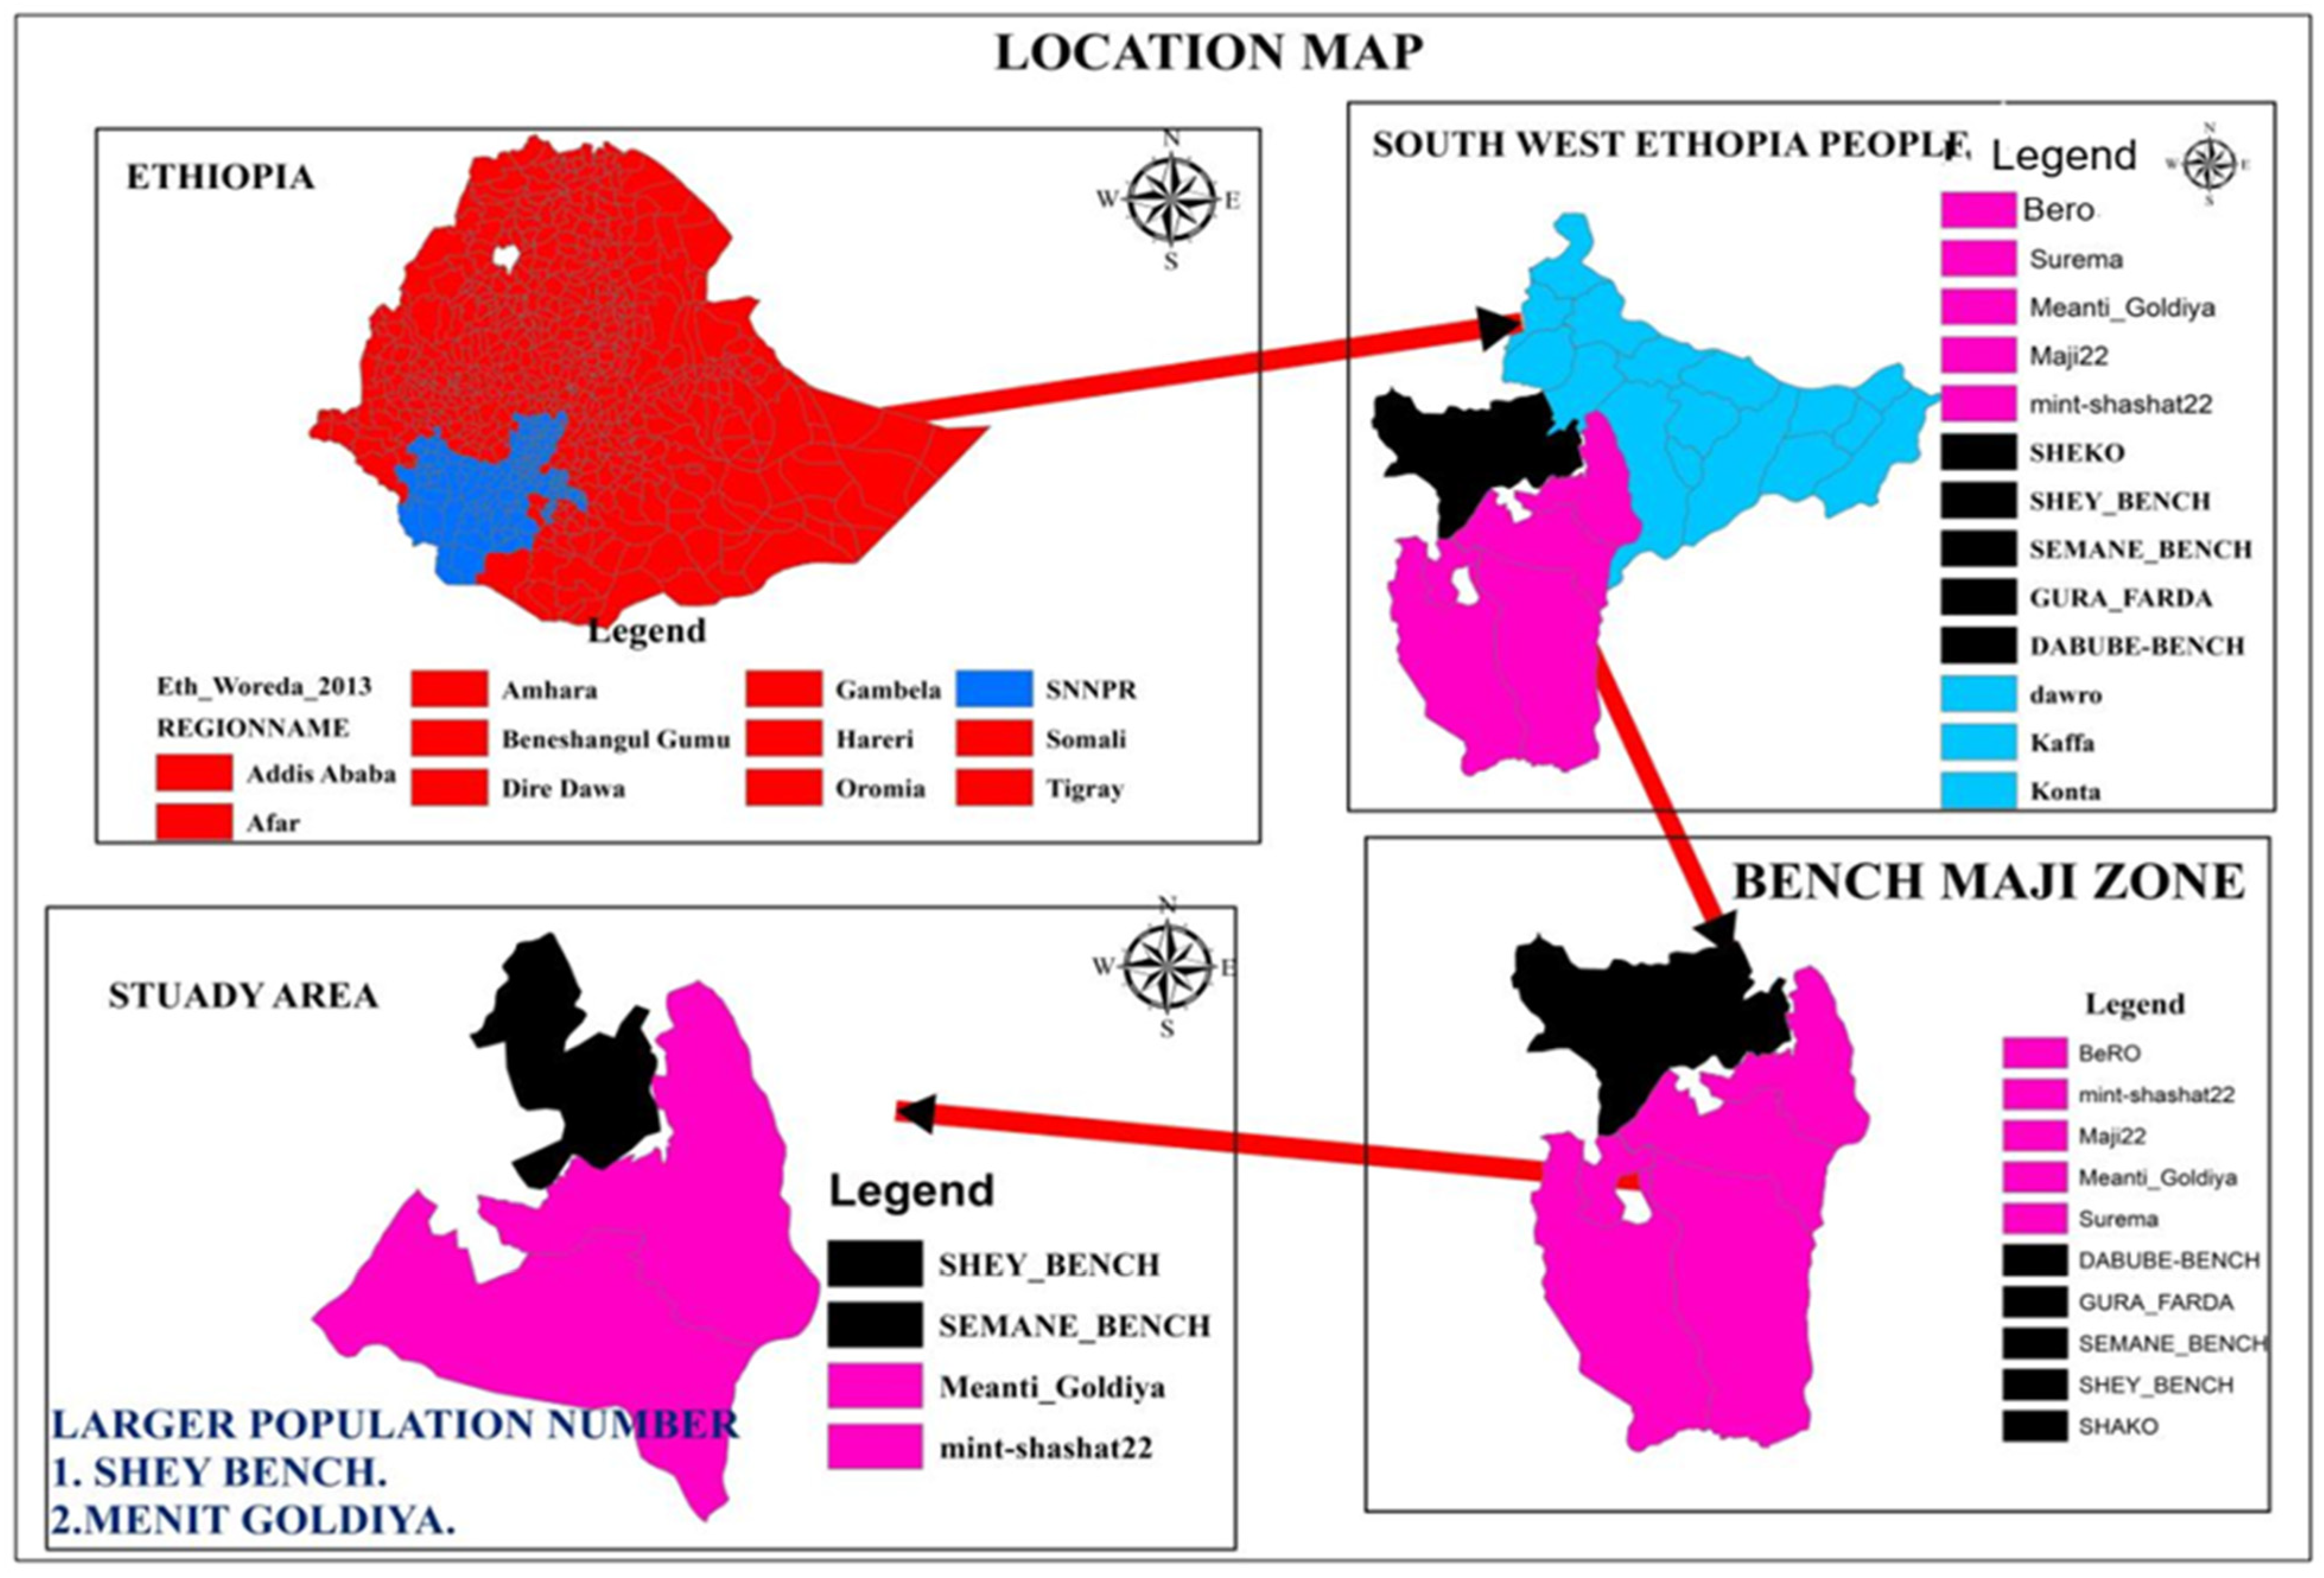
2.2. The Study Areas

Bench Maji Zone is one of the zones in Southwest Ethiopia Peoples Regional State (SWEPR) that makes up the southwest part of the country and lies between 5.34–7.53° N latitude and 35.13–36.23° E longitude, covering about 19,326.59 km2 (see Figure 1). The mean temperature in the zone typically ranges between 15 and 27 °C, making it moderate for the residents. Additionally, the average annual rainfall varies from 400 to 2000 mm, contributing to the environmental conditions of the area. According to the 2007 census projection by the Central Statistical Agency of Ethiopia [20], the estimated population size in 2018 is around 918,792 individuals. Among them, approximately 50.4% are female, highlighting the gender distribution within the zone. Moreover, a significant 87% of the population are rural dwellers, emphasizing the rural lifestyle prevalent in the area.
Rain-fed agriculture is the primary sector that dominates the livelihood of the Bench Maji Zone, except for limited areas where traditional and small-scale irrigation methods are employed for vegetable cultivation. Agricultural activities encompass both crop cultivation and livestock production. Two distinct rainy seasons, Kiremt and Belg, are utilized to cultivate long-cycle crops. The Meher season is commonly defined as an extended period of precipitation, typically spanning from June to September. The term “Belg season” often denotes the short yet timely rainy season, typically observed between February and May, but in specific regions of the country [21]. Coffee, spices, and fruit crops are among the essential perennial cash crops in the zone. Among the annual crops, maize, sorghum, root crops, and tubers cover the bulk of crop production [22]. In the zone, the natural forest resource has been excessively utilized, leading to a rapid increase in deforestation and environmental degradation. This issue is closely intertwined with factors such as re-settlement, unplanned land use management, and unrestrained use of natural resources. The consequences of these actions are severe and far-reaching [23].

2.3. Data Collection and Sampling Technique

The study meticulously collected quantitative data to comprehensively examine how adapting to climate change and variability affects farmers’ vulnerability to food insecurity. To determine the current household food insecurity status, we considered information about all the foods that the household bought with money, ate from their own farm or garden, or obtained from other people, such as friends, someone a family member worked for, or the government. To ensure the robustness and accuracy of the survey, a well-structured questionnaire with a mix of open-ended and closed-ended questions was developed and pilot-tested. Additionally, field training was conducted to familiarize the enumerators with the study’s objectives and the farm household survey. The instruments focused on crucial areas such as past climate-related shock experiences, socioeconomic factors, crop and domestic livestock practices, land ownership, agricultural resources, access to institutional services, climate change and variability awareness, existing adaptation strategies, and food consumption and spending. Secondary materials were also reviewed to complement the primary data and identify any existing gaps.
This study employed a rigorous multistage sampling method, which combined both probability and non-probability techniques, to identify the most appropriate districts, kebeles, and households. In the initial phase, four districts, namely Semen Bench, Shey Bench, Menit Goldiya, and Menit Shasha, were deliberately chosen from the districts of the Bench Maji Zone due to their high vulnerability to climate-related threats such as crop pests, livestock diseases, food production shortages, seasonal flooding, and recurrent landslides [23]. For the second stage, four kebeles (A kebele is the smallest administrative unit in Ethiopia’s decentralized government structure. It is typically a named peasant association and is considered the lowest level of government administration in the country.) were randomly selected from the Semen Bench district, three from the Shey Bench district, four from the Menit Goldiya district, and three from the Menit Shasha district based on their distribution in each sample district. In the third step, 390 farmers were randomly selected as a representative sample using the probability proportional to the sample size sampling technique based on the number of farm households in Kebeles.
In line with the methodology suggested by [24,25], this study utilized the following formula to ascertain the minimum sample size required for a representative sample from the known population:
n = Z 2 p 1 p N e 2 ( N 1 ) + Z 2 p 1 p
The sample size computation for the selection of households from each district took into account (i) a 5% margin of error (e = 0.05) at 95% confidence (Z = 1.96); (ii) N = 84,980; (iii) the proportion (p) for the different variables under investigation (p = 0.88). Moreover, to be consistent with many previous studies of this type [26,27,28], which factored in a design effect ranging from 1.5 to 2.5, this calculation has also considered a design effect of 2.5 to address the multistage sampling inherent errors. Additionally, a 5% non-response rate (NRR) has been accounted for to accommodate households that may be unavailable, inaccessible, uncooperative, or have any other hindrance preventing survey teams from reaching the selected household.

2.4. Methods of Data Analysis

2.4.1. Theoretical Framework

This study used a random utility framework to analyze how climate change adaptation strategies impact household vulnerability to food insecurity. The model is framed on the principle that an individual derives utility by choosing some alternatives [27,29]. The model assumes that a farm household will only adopt an adaptation strategy if the benefits exceed those of not adopting it. However, the utility derived from adaptation is not directly observed but inferred through the farmers’ choices. The standard formulation of the linear random utility model is as follows:
U A = α A Z i + ε A
U N = α N Z i + ε N
Relevant explanatory variables represented by Z i influence the perceived utility of adaptation. The parameter estimates for choosing an adaptation strategy and not adapting are α A and α N , respectively. The correlation of error terms of the adaptation equations determines the type of qualitative choice model used in the analysis. This implies that a household i will decide to adapt to climate change and variability if
A = E ( U i A ) E ( U i N ) > 0
where E ( U i A ) and E ( U i N ) are the expected utility of implementing the strategy and not adapting, respectively.

2.4.2. Analytical Techniques for the Impact of Adaptation to Climate Change

This study utilizes a multinomial endogenous treatment effect (METE) model to examine the impact of climate change adaptation strategies on a household’s vulnerability to food insecurity. The model has two stages [30]. In the first stage, farm households face choices regarding climate change adaptation practices. We introduce the latent variable G i j , representing expected welfare outcomes (vulnerability to food insecurity), when adopting the climate change adaptation strategy j   ( j = 1 J ) instead of another strategy ( k ) :
G i j = X i j φ j + j J δ i l i j + ε i j
X i represents factors affecting strategy j , such as household and plot characteristics, market access, climate change perception, and shock variables. The parameter φ captures the impact of each factor on the adoption decision, while the error term ε i j accounts for unobserved characteristics and E ε i j X i = 0 . Additionally, a latent factor l i j considers the hidden characteristics that influence decision-making, such as farmers’ technical knowledge and managerial skills in adapting to climate change (Abdulai and Huffman 2014).
In line with [30], we define j = 0 as nonadopters, with G i 0 = 0 remaining unobserved. Instead, binary variables d i = ( d i 1 , d i 2 , d i 3 , . , d i J ) are employed to determine responses to climate change, while corresponding latent components l i = ( l i 1 , l i 2 , l i 3 , . , l i J ) influence the choice of adaptation strategies. The probability of adopting strategies is expressed as:
P r d i X i l i = g ( X ´ i φ 1 + j J δ 1 j l i j + X ´ i φ 2 j J δ 2 j l i j + X ´ j φ j j J δ J j l i j )
If g confirms a mixed multinomial logit (MMNL) structure and represents an appropriate ate multinomial probability distribution:
P r d i X i l i = e x p X ´ i φ j + δ i l i j 1 + j = 1 J e x p X ´ i φ j + δ i l i j
In the second stage, the METE model assesses how climate change adaptation practices impact vulnerability to food insecurity [31,32], represented by the expected outcome equation:
E V F I i = 1 z i , d i , l i = z i ϑ + j = 1 J d i γ + j = 1 J l i τ
This equation considers exogenous covariates z i , parameter vectors ϑ , and the impact of adaptation strategies on vulnerability to food insecurity (VFI) relative to non-adaptation, denoted by parameter γ . Additionally, the factor-loading parameter ( τ ) influences the correlation between climate change adaptation strategies and outcomes, where a positive value suggests positive selection and a negative value indicates negative selection [30,32].
For the METE model to be identified, [30] recommends using at least one selection instrument that affects the adaptation decisions of farming households but does not affect the outcome variables among the households. However, finding an instrumental variable is tedious and challenging in empirical analysis [11]. A simple falsification test was conducted on the excluded instruments, i.e., climate change perception [17,33,34]. Through this test, the instrument (climate change perception) influences the adoption of climate change adaptation strategies in all cases, but not consumption per adult equivalence. The model estimation utilized the mtreatreg command within the Stata software package 15. This particular command ensured the precise and accurate estimation of the model.

2.4.3. Assessing Household Vulnerability to Food Insecurity

This study adopts the Vulnerability as Expected Poverty (VEP) approach to assess households’ vulnerability to food insecurity. This approach estimates the likelihood of households experiencing food insecurity using consumption expenditure per adult equivalent (FCEAE) as an indicator of household well-being [35]. Household vulnerability to food insecurity, denoted as V h , t , indicates the likelihood of a household falling into poverty in the following time ( t + 1 ) period due to consumption, such that:
V h , t = P r ( C h , t + 1 z )
where C h , t + 1 represents the welfare indicator level of household (FCEAE) h at time t + 1 , and z is the food poverty line, indicating the value of food necessary to meet the recommended minimum daily calorie requirement of 2200 kilocalories per adult equivalent.
The FCEAE of the household can be expressed as a function of observed and unobserved characteristics:
l n C h = X h β + ε h ,
X h represents a set of observable household characteristics, and ε h is a mean-zero disturbance term that captures personal factors affecting per-capita food consumption. The variance of the unexplained portion of FCEAE ε h contingent upon the household’s farm and socioeconomic characteristics:
σ 2 ε , h = X h θ + ω h
where θ represents a vector of parameters that need to be estimated, ω h is the vector of residuals of this second estimation. To address heteroscedasticity, a three-step feasible generalized least squares (FGLS) method is employed to obtain consistent estimates of β and θ . The variance of the idiosyncratic element of household consumption is estimated as:
σ ^ ε , h = X h θ ^ F G L S
This variance is used to define the homoscedastic consumption function in Equation (9), and the predicted log household food spending per adult equivalent per day is estimated using Equation (10).
l n C h σ ^ ε , h = X h σ ^ ε , h β + ε h σ ^ ε , h
l n C h = X h β + ε h
E ^ l n C h X h = X h β ^
The variation in each household’s log food consumption expenditure is as follows:
ψ ^ l n C h X h = σ ^ ε , h = X h θ ^
Assuming that food consumption per adult equivalent is log-normally distributed [36], we can determine each household’s probability of food insecurity at a future time
V h ^ = P ^ l n C h < l n z X h = l n z l n X h β ^ X h θ ^
where ( . ) indicates the log-normal distribution of food consumption expenditures. Based on the vulnerability coefficient V h ^ , households can be categorized as vulnerable or non-vulnerable. Households with a vulnerability coefficient of 0.5 or higher are considered at risk of food insecurity [6]. This study follows a consistent procedure for categorizing vulnerable and non-vulnerable households based on their vulnerability coefficients.
The study uses 2200 kcal per day per adult as the food poverty line, the minimum energy requirement for a nutritionally adequate essential diet [37]. Household food insecurity is identified when the money spent on food is insufficient to meet this daily dietary need. Thus, households are considered food insecure when their food expenditure is inadequate to purchase a nutritionally adequate diet. This approach provides insights into households’ vulnerability to food insecurity based on their consumption expenditure and the likelihood of falling below the minimum energy requirement in the future.

3. Results

3.1. Descriptive Results

Table 1 presents the features of sample households according to socioeconomic factors and the strategies they have adopted to adapt to climate change. Notably, households headed by men comprised 78% of adopters, with women making up the remaining 22%. There were 8.14% non-adopters and 91.86% adopters among the 86 households headed by women. The table also shows that 38 percent of the sample as a whole had yet to complete any form of education. Nearly half of the entire sample (48 percent) achieved a primary level of education, and those who attained senior secondary education represent around a quarter of the sample respondents.
Furthermore, the data reveal a significant mean difference (at a 5% significance level) in education levels between adopters and nonadopters, with 36.08 percent of adopters and 57.89 percent of nonadopters having no formal education. This finding underscores the crucial role of education in climate change adaptation. Off-farm job opportunities are generally limited in the study area. Only 43.59% of sample households were employed in off-farm activities, with 44.6% of adopters and 34.21% of nonadopters engaged in such activities.
A significant percentage of farmers (42.05%) did not have regular contact with extension service agents at least six times a year. On the other hand, a substantial proportion of 57.95 percent received regular technical advice and support at least six times a year. In the adopter group, 59.38 percent of respondents reached out to extension service agents at least six times per year, compared to 40.63 percent in the nonadopter group. There is a noticeable difference in the frequency of contact with the extension agents between the two groups.
Participation in socioeconomic groups serves as a powerful indicator of social capital endowment, a key factor in climate change adaptation. Forty percent of respondents were members of at least two socioeconomic groups, indicating a significant level of social capital. Among adopters, 39.5% belonged to at least two groups, while 60.5% did not. Similarly, 40 percent of nonadopters were also members of at least two groups. This fact emphasizes the importance of community involvement in climate change adaptation and the need to strengthen social capital for more effective adaptation strategies.
The survey asked participants whether they were entitled to early warning information and climate change-related content. The results revealed a significant disparity, with only 34.1 percent of households receiving this crucial information, while a staggering 65.9 percent were still in need. This lack of early warning information has had a profound impact, preventing households from appropriately anticipating and adapting to the effects of climate change and its variability.
Among the respondents, a significant disparity in perceptions of the impact of climate change was observed. Nearly half, 48.72 percent, of sample farmers perceived their plots as severely eroded, while the remaining 51.28 percent did not. Interestingly, 51% of adopters and 26% of nonadopters perceived their farms as severely eroded. This disparity in perception underscores the need for increased awareness and action. In terms of climate change impact, 34% of adopters and 68% of nonadopters were perceived as having a low impact, 47% of adopters and 26% of nonadopters had a medium impact, and 18% of adopters and 8% of nonadopters perceived a high impact.
Table 2 reveals a significant age difference between adopters and nonadopters, with adopters being older. Most respondents (96%) fell within the productive age range of 21 to 64, indicating their potential for active participation in climate change adaptation strategies. The youngest and oldest respondents were 21 and 71, respectively, with the average age of all respondents being 42 years. The mean family size of the sample population is 4.7, which is almost identical to the national average of 4.6 people per household [20]. Furthermore, the mean family size of nonadopters and adopters is 4.6 and 4.7, respectively.
The average number of animals owned by the sampled households, measured in Tropical Livestock Units (TLUs), is 3.5. Notably, nonadopters of climate change adaptation strategies have an average livestock ownership of 1.92 TLUs, while adopters have an average ownership of 3.71 TLUs. The statistically significant mean difference (less than 1%) in livestock ownership between adopters and nonadopters suggests that households with greater livestock holdings are more inclined to adopt adaptation strategies compared to those with fewer animals (Table 2).
In the study area, the average farm size for sample households is 1.42 hectares of farmland. Specifically, nonadopters’ households have an average size of 1.28 hectares, while adopters’ households have a slightly larger average size of 1.44 hectares. The mean perception value for the combined sample is 1.01. Notably, nonadopters have an average perception value of 0.86, while adopters exhibit a slightly higher average value of 1.02. These results highlight a statistically significant difference between adopter and nonadopter households at a 1% significance level, emphasizing the role of perception in shaping the adoption of climate change adaptation strategies.

3.2. Comparing Conditional and Unconditional Climate Change Adoption Strategies (%)

Table 3 provides a comprehensive view of the unconditional and conditional probabilities of the sample. Notably, around two-thirds of the farmers have implemented crop management strategies, 53% use soil and water conservation techniques, and 41% diversify their livelihood portfolios. The table also highlights the interdependence among these three strategies for adaptation. Specifically, about 70% of farmers who practice crop management also use soil and water conservation measures, and 47% have diversified their livelihood portfolios. It is worth noting that adopting soil and water conservation actions increases the likelihood of implementing crop management practices by 4%. Similarly, farmers who use crop management techniques are more likely to conserve water and soil (56%) and diversify their livelihood portfolios (42%). Notably, these strategies exhibit intricate interdependence, mutually influencing each other.

3.3. Assessing Food Insecurity Vulnerability in the Study Areas

This study assessed rural households for food insecurity vulnerability using a <0.5 or ≥0.5 score, categorizing them as vulnerable or non-vulnerable [38]. The assessment of food insecurity status involved comparing consumption per adult equivalent to the food poverty line. Households below the threshold were classified as food insecure. Table 4 exhibits the categorization of households by their vulnerability level and food security status. The study revealed that 65.3% of households in the study areas were vulnerable to food insecurity. Interestingly, those who have adapted to climate change (65.9%) exhibited lower vulnerability levels, whereas the remaining 34% of households still face a high risk. This result suggests that despite efforts to address climate change, some households still face food insecurity. It is important to note that even individuals who have embraced climate change may not be completely shielded from its negative impacts, as some other factors or limitations likely contribute to their vulnerability.
As per Table 4, it is apparent that out of the 196 currently food-secure households, a significant majority (around two-thirds of the total households) displayed a high level of food security. This figure indicates that these households are unlikely to experience food insecurity shortly, as they have reliable access to sufficient and nutritious food. This access, in turn, reduces the risk of food insecurity and its negative impacts on their overall well-being. However, the fact that around 25% of the food-secured households (49 out of 196) were found to be vulnerable to food insecurity, which is a cause for concern. Despite their current food security status, these households are more likely to experience food insecurity in the future. They may have limited or unstable access to food resources, which puts them at a higher risk of insufficient food intake or poor dietary quality. This potential future food insecurity among currently food-secure households highlights the need for immediate action to prevent the worsening of the situation.

3.4. The Impact of Climate Change Adaptation on Vulnerability to Food Insecurity

We focus on analyzing the impact of climate change adaptation strategies on vulnerability to food insecurity. However, we need to delve into the factors that affect adopting these strategies, which is the initial phase of the METE model. The estimation results for the first stage are included in Appendix A.
As previously stated, this study utilized the METE model to examine the correlation between adaptation practices and households’ susceptibility to food insecurity. The findings are presented in Table 5. Simply put, numerous selection correction terms are significant at the 1% level. Implementing various climate change adaptation practices will impact nonadopters differently if they choose to implement them. The results indicate that implementing both individual and combined adaptation strategies substantially reduces the likelihood of experiencing food insecurity across various outcome measures. Farmers should adopt climate change adaptation strategies to reduce their vulnerability to food insecurity during unpredictable climate events.
The results, as shown in Table 5, show that the combined use of all the climate change adaptation strategies (A1S1L1) and the adoption of crop management practices alone (A1S0L0) both decrease the likelihood of vulnerability to food insecurity. The vulnerability reduction is 12% and 8% points lower, respectively, compared to non-adoption. Adopting soil and water conservation measures in isolation (A0S1L0) also reduces the probability of vulnerability to food insecurity by 14%. These findings are particularly relevant for farmers in the study area, where climate change significantly threatens food security. This reduction demonstrates that implementing soil and water conservation measures can enhance the resilience of cropping systems against climate change-induced water stresses such as floods and droughts. These results confirm earlier findings by [39] for farmers in eastern Ethiopia that adopting soil and water conservation practices reduces the probability of farmers being food insecure, vulnerable to food insecurity, and transient and chronically food insecure.
More importantly, the highest reduction in the probability of vulnerability to food insecurity (24% points) is realized through crop management practices combined with soil and water management measures (A1S1L0). This result is probably because using inputs and resources, such as improved seed varieties, proper fertilizer application, and pest and disease management techniques, can significantly increase crop productivity. By implementing soil and water conservation practices like terracing, contour ploughing, and mulching, soil fertility is maintained, leading to healthier crops and higher yields. This increased productivity ensures a more stable food supply and reduces vulnerability to food insecurity. Previous studies [40,41] show that adopting different agricultural technologies would likely positively impact crop yield, consumption expenditure, food security, and alleviating poverty.
Livelihood portfolio diversification strategies (A0S0L1) have been found to be effective in reducing vulnerability when implemented alone or in combination with crop management practices or soil and water conservation measures (A1S0L1 or A1S0L1). These strategies, both alone and in combination, have higher vulnerability reduction effects (16.9%, 15.2%, and 16.8% points, respectively) compared to other combinations. Hence, adopting climate change adaptation measures can improve crop production’s environmental and economic aspects. This improvement allows farmers to spend more on food items than they would have if they had not adopted the practices.

4. Conclusions

Agriculture plays a vital role in alleviating poverty and fostering economic development in numerous agrarian economies, such as Ethiopia. However, it is extremely susceptible to the effects of climate change and variability, which greatly affect farmers’ economic well-being. Ensuring the long-term viability of agriculture hinges on farmers’ ability to adapt their production systems to address both environmental and economic obstacles and changes.
Existing studies have focused on individual adaptation practices, but there is a need to consider the interplay between different strategies for a more comprehensive understanding. This study aimed to estimate the impacts of climate change adaptation practices on smallholder farmers’ vulnerability to food insecurity in the Bench Maji zone in southwest Ethiopia. A multinomial endogenous treatment effects approach is used to find out how different and individual adoption practices affect farmers’ susceptibility to food insecurity.
The results of our analysis are not just theoretical but have practical implications for farmers and policymakers. We found that adopting climate change adaptation strategies, particularly combinations of strategies, can significantly reduce vulnerability to food insecurity. The most effective strategy, however, is a combination of crop management practices and soil and water management measures. This suggests that by using improved seed varieties, proper fertilizer application, pest and disease management techniques, and soil and water conservation measures, farmers can significantly increase crop productivity and reduce their vulnerability to food insecurity.
Our findings highlight the importance of livelihood portfolio diversification strategies in reducing vulnerability to food insecurity. When combined with crop management practices or soil and water conservation measures, these strategies have a significant impact on reducing vulnerability. By diversifying their livelihood activities, individuals can better withstand shocks and stresses that may impact their primary source of income. The results show that, in almost all cases, adopting a single or joint adaptation strategy significantly reduces the probability of vulnerability to food insecurity. Therefore, it is essential to encourage farmers to practice the existing climate change adaptation strategies on their farms to reduce susceptibility to food insecurity during uncertain climate change events. Strengthening the existing adaptation strategies by advising farmers to adopt a combination of adaptation measures, as the study found that joint adoption can further reduce the probability of vulnerability to food insecurity, is crucial. Offering guidance and training to farmers on how to effectively combine different adaptation practices, such as soil and water conservation, agronomic practices, and livelihood diversification, can help them maximize the benefits of adopting a mix of adaptation strategies. Additionally, creating an enabling environment to support adaptation is necessary, which includes promoting research and development, disseminating information and knowledge on climate change adaptation to farmers through extension services and other channels, and fostering collaborations between farmers, researchers, and extension service providers to facilitate the adoption of these strategies. Addressing the social, political, and institutional factors that may be contributing to food insecurity and working with policymakers to develop and implement supportive policies, programs, and institutional arrangements can further facilitate the adoption of climate change adaptation measures by farmers.
The findings of this study are drawn from cross-sectional and household-level data. However, incorporating panel and farm plot-level data analysis could provide more robust evidence on the impact of adaptation on households’ vulnerability to food insecurity. This would enable better understanding of the short- and long-term effects of adaptation strategies. Thus, future research should explore the influence of different adaptation strategies on smallholder farmers’ welfare across varying time frames.
Despite the primary data used and the relevant empirical models chosen and applied to estimate the results, we realize and acknowledge the limitations of this study. The most important limitation lies in the fact that measuring vulnerability to food insecurity solely based on the amount of money required to achieve the daily minimum dietary requirement does not consider the non-income factors that influence food security, such as availability, utilization, and stability of the food supply, as well as social, cultural, and environmental factors [42].

Author Contributions

A.B. conceived the idea and study design, collected data, conducted data analysis, and drafted the manuscript. M.K., A.M. and M.Y. provided statistical support and reviewed, revised, and contributed to the final manuscript. S.F. and T.A. funding acquisition, review and editing. All authors have read and agreed to the published version of the manuscript.

Funding

This research was supported by Mizan Tepi University, which funded research as part of a A.B. Ph.D. study, through the Ministry of Education. The publication of this article was fully supported by the International Institute of Tropical Agriculture (IITA).

Institutional Review Board Statement

Not applicable.

Informed Consent Statement

Not applicable.

Data Availability Statement

The raw data supporting the conclusions of this article will be made available by the authors on request.

Acknowledgments

The authors would like to express sincere gratitude to all officials, sample respondents, and experts who participated in providing relevant information and data collection. A.B. acknowledges the research support from Mizan Tepi University, which funded this research as part of a Ph.D. study, through the Ministry of Education.

Conflicts of Interest

The authors declare that they have no conflicts of interest.

Appendix A

Table A1. Mixed Multinomial Logit Model: Determinants of Multiple Adaptation Strategies.
VariableCoef.Std.ErCoef.Std.Err.Coef.Std.Err.Coef.Std.ErCoef.Std.Er
A1S1L1A0S1L1A0S0L1A0S1L0A1S0L1
gender0.7070.748−0.2110.792−0.5240.705−1.0800.708−1.204 *0.658
lnagehh−0.1301.1542.218 *1.2010.3971.0970.4561.111−0.5221.020
educhh1.074 **0.4870.839 *0.4760.946 **0.4570.6760.4610.786 *0.426
lnlivestock3.927 ***0.507−0.3120.3250.651 *0.3430.3010.322−0.480 *0.283
exte0.6370.6061.0250.6600.7740.604−0.1690.5920.0350.550
mseg−1.073 *0.6160.1420.6310.7080.583−0.0580.5940.3450.542
good__soil−1.693 **0.8731.0700.953−0.3950.829−1.1440.7750.3120.815
off_farm0.9340.595−0.2810.6580.6640.5871.386 **0.5840.0310.558
credit−0.3030.590−0.5010.620−0.3680.576−0.051 ***0.5720.1540.536
moderate_soil−0.9450.884−0.6171.010−1.2780.877−2.5450.882−0.6250.844
slope_flat−1.164 *0.6200.3510.6260.6520.589−0.1810.6050.5000.555
erosion0.3460.6301.201 *0.6570.7320.6101.371 **0.6070.7190.574
clmt_shock0.5900.4550.6510.4761.045 **0.4411.158 ***0.4421.399 ***0.423
adq−0.1680.165−0.1510.174−0.1830.162−0.507 ***0.168−0.1040.151
lndis_mkt−0.1890.297−0.0950.3090.1950.2950.1080.2930.1390.271
clm_inf−0.3900.613−0.8180.656−0.4430.595−0.7880.595−1.114 *0.580
lnclmt_perc1.227 **0.626−0.4660.602−0.0240.5681.116 *0.6480.2450.572
_cons−3.0114.432−9.908 **4.798−3.6724.2490.0644.2351.2793.913
VariableA1S1L0A1S0L0
gender−0.1510.6160.2980.646
lnagehh−0.0700.9190.6470.957
educhh0.824 **0.390−0.2660.427
lnlivestock0.5670.2731.142 ***0.298
exte0.4890.4990.4420.516
mseg0.4380.489−0.2730.512
good__soil−0.0980.723−0.8650.754
off_farm0.6530.4950.2950.511
credit0.1100.4810.5170.498
moderate_soil−1.1270.749−0.8330.765
slope_flat1.514 ***0.5010.7220.515
erosion2.040 ***0.5260.2310.547
clmt_shock0.670 **0.3850.977 **0.396
adq−0.2200.137−0.331 **0.141
lndis_mkt−0.1490.2410.0940.254
clm_inf−0.4280.497−0.3860.509
lnclmt_perc0.924 *0.5081.495 *0.580
_cons−0.4783.532−2.2283.700
Note: ***, **, * Significant at 1%, 5%, and 10% probability level, respectively. Source: Model results.

References

  1. IPCC. Summary for Policymakers. In Climate Change 2021: The Physical Science Basis. Contribution of Working Group I to the Sixth Assessment Report of the Intergovernmental Panel on Climate Change; Masson-Delmotte, V., Zhai, P., Pirani, A., Connors, S.L., Péan, C., Berger, S., Caud, N., Chen, Y., Goldfarb, L., Gomis, M.I., et al., Eds.; IPCC: Geneva, Switzerland, 2021. [Google Scholar]
  2. Zhai, F.; Zhuang, J. Agricultural Impact of Climate Change: A General Equilibrium Analysis with Special Reference to Southeast Asia; Asian Development Bank Institute: Santiago, Chile, 2009; p. 23. [Google Scholar]
  3. FAO. Climate Smart Agriculture: Policies, Practices and Financing for Food Security, Adaptation and Mitigation; Food and Agriculture Organization of the United Nations: Rome, Italy, 2010. [Google Scholar]
  4. Aragie, E.A. Climate Change, Growth and Poverty in Ethiopia; Texas Univ At Austin: Austin, TX, USA, 2013. [Google Scholar]
  5. Dercon, S.; Christiaensen, L. Consumption risk, technology adoption and poverty traps: Evidence from Ethiopia. J. Dev. Econ. 2011, 96, 159–173. [Google Scholar] [CrossRef]
  6. Capaldo, J.; Karfakis, P.; Knowles, M.; Smulders, M. A Model of Vulnerability to Food Insecurity. 2010. Available online: https://ageconsearch.umn.edu/record/289020 (accessed on 23 May 2024).
  7. WFP. Ethiopia Annual Country Report and Country Strategic Plan 2020–2025; World Food Programme: Addis Ababa, Ethiopia, 2023. [Google Scholar]
  8. FAO; ECA. Africa Regional Overview of Food Security and Nutrition: Addressing the Threat from Climate Variability and Extremes for Food Security and Nutrition; Food and Agriculture Organization of the United Nations and United Nations Economic Commission for Africa: Addis Ababa, Ethiopia, 2018; Available online: https://hdl.handle.net/10855/43032 (accessed on 14 March 2022).
  9. Deressa, T.T.; Hassan, R.M.; Ringler, C. Perception of and adaptation to climate change by farmers in the Nile basin of Ethiopia. J. Agric. Sci. 2011, 149, 23–31. [Google Scholar] [CrossRef]
  10. CSA (The Federal Democratic Republic of Ethiopia) Central Statistical Agency. Agricultural Sample Survey 2020/21 (2013 E.C.) Volume I Report on Area and Production of Major Crops (Private Peasant Holdings, Meher Season). CSA, 2021. Available online: https://www.statsethiopia.gov.et/agri-sample-survey-report-2020-21/ (accessed on 27 May 2024).
  11. Asmare, F.; Teklewold, H.; Mekonnen, A. The effect of climate change adaptation strategy on farm households welfare in the Nile basin of Ethiopia. Int. J. Clim. Chang. Strateg. Manag. 2019, 11, 518–535. [Google Scholar] [CrossRef]
  12. Sileshi, M.; Kadigi, R.; Mutabazi, K.; Sieber, S. Impact of soil and water conservation practices on household vulnerability to food insecurity in eastern Ethiopia: Endogenous switching regression and propensity score matching approach. Food Secur. 2019, 11, 797–815. [Google Scholar] [CrossRef]
  13. Kassa, Y. Impact of Integrated Soil and Water Conservation Program on Crop Production and Income in West Harerghe Zone, Ethiopia. Int. J. Environ. Monit. Anal. 2013, 1, 111. [Google Scholar] [CrossRef]
  14. Deressa, T.T.; Hassan, R.M.; Ringler, C.; Alemu, T.; Yesuf, M. Determinants of farmers’ choice of adaptation methods to climate change in the Nile Basin of Ethiopia. Glob. Environ. Chang. 2009, 19, 248–255. [Google Scholar] [CrossRef]
  15. Nhemachena, C.; Hassan, R. Micro-Level Analysis of Farmers Adaption to Climate Change in Southern Africa; Intl Food Policy Res Inst: Washington, DC, USA, 2007; Available online: https://books.google.com.et/books?id=YSIiKvsfgZwC (accessed on 19 July 2023).
  16. Yu, B.; Nin-Pratt, A.; Funes, J.; Gemessa, S.A. Gemessa Cereal production and technology adoption in Ethiopia; ESSP II Working Paper 31; International Food Policy Research Institute (IFPRI): Addis Ababa, Ethiopia, 2011. [Google Scholar]
  17. Di Falco, S.; Veronesi, M. How Can African Agriculture Adapt to Climate Change? A Counterfactual Analysis from Ethiopia. Land Econ. 2013, 89, 743. [Google Scholar] [CrossRef]
  18. Berhe, M.; Hoag, D.; Tesfay, G.; Tadesse, T.; Oniki, S.; Kagatsume, M.; Keske, C.M.H. The effects of adaptation to climate change on income of households in rural Ethiopia. Pastoralism 2017, 7, 12. [Google Scholar] [CrossRef]
  19. Smit, B.; Wandel, J. Adaptation, adaptive capacity and vulnerability. Glob. Environ. Chang. 2006, 16, 282–292. [Google Scholar] [CrossRef]
  20. CSA. Population and Housing Census of Ethiopia; CSA: Addis Ababa, Ethiopia, 2007. Available online: www.csa.gov.et (accessed on 16 November 2021).
  21. Tabit, A. Country STAT Ethiopia—First Panorama Report I; Food and Agriculture Organization of the United Nations (FAO): Addis Ababa, Ethiopia, 2011; p. 17. Available online: https://www.ipcinfo.org/fileadmin/user_upload/countrystat_fenix/congo/docs/ETH-PANORAMA%20REPORT%20I.pdf (accessed on 21 January 2022).
  22. Bench Maji Zone Agricultural Development Department. Annual Report of Agricultural Production of Bench Maji Zone; Bench Maji Zone Agricultural Development Department: Mizan Aman, Malaysia, 2017. [Google Scholar]
  23. Bench Maji Zone Farm and Natural Resource Department. Bench Maji Zone Annual Report of Farm and Natural Resource Department; Bench Maji Zone Farm and Natural Resource Department: Mizan Aman, Malaysia, 2018. [Google Scholar]
  24. Kothari, C.R. Research Methodology—61 Methods and Techniques, 2nd ed.; New Age International (P) Limited: New Delhi, India, 2004. [Google Scholar]
  25. Anderson, D.R.; Williams, T.A.; Cochran, J.J. Statistics for Business & Economics, 10th ed.; Cengage Learning: Boston, MA, USA, 2007. [Google Scholar]
  26. Phiri, I.P. Modelling Farmers’ Choice of Adaptation Strategies towards Climatic and Weather Variability: Empirical Evidence from Chikhwawa District, Southern Malawi. 2011. Available online: https://ageconsearch.umn.edu/record/134489/?ln=en&v=pdf (accessed on 23 May 2024).
  27. Addisu, S.; Fissha, G.; Gediff, B.; Asmelash, Y. Perception and adaptation models of climate change by the rural people of lake Tana Sub-Basin, Ethiopia. Environ. Syst. Res. 2016, 5, 7. [Google Scholar] [CrossRef]
  28. Asrat, P.; Simane, B. Farmers’ perception of climate change and adaptation strategies in the Dabus watershed, North-West Ethiopia. Ecol. Process. 2018, 7, 7. [Google Scholar] [CrossRef]
  29. Waibel, H.; Pahlisch, T.H.; Völker, M.; Waibel, H.; Pahlisch, T.H.; Völker, M. Farmers’ perceptions of and adaptations to climate change in Southeast Asia: The case study from Thailand and Vietnam. In Climate Smart Agriculture; Springer International Publishing: Berlin/Heidelberg, Germany, 2018; pp. 137–160. [Google Scholar]
  30. Deb, P.; Trivedi, P.K. Maximum Simulated Likelihood Estimation of a Negative Binomial Regression Model with Multinomial Endogenous Treatment. Stata J. 2006, 6, 246–255. [Google Scholar] [CrossRef]
  31. Khonje, M.G.; Manda, J.; Mkandawire, P.; Tufa, A.H.; Alene, A.D. Adoption and welfare impacts of multiple agricultural technologies: Evidence from eastern Zambia. Agric. Econ. 2018, 49, 599–609. [Google Scholar] [CrossRef]
  32. Issahaku, G.; Abdul-Rahaman, A.; Amikuzuno, J. Climate change adaptation strategies, farm performance and poverty reduction among smallholder farming households in Ghana. Clim. Dev. 2021, 13, 736–747. [Google Scholar] [CrossRef]
  33. Kassie, M.; Teklewold, H.; Marenya, P.; Jaleta, M.; Erenstein, O. Production Risks and Food Security under Alternative Technology Choices in Malawi: Application of a Multinomial Endogenous Switching Regression. J. Agric. Econ. 2015, 66, 640–659. [Google Scholar] [CrossRef]
  34. Ng’ombe, J.N.; Kalinda, T.H.; Tembo, G. Does adoption of conservation farming practices result in increased crop revenue? Evidence from Zambia. Agrekon 2017, 56, 205–221. [Google Scholar] [CrossRef]
  35. Subbarao, K.; Christiaensen, L.J. Toward an Understanding of Household Vulnerability in Rural Kenya; Policy Research Working Papers; The World Bank: Washington, DC, USA, 2004; Available online: http://elibrary.worldbank.org/doi/book/10.1596/1813-9450-3326 (accessed on 23 May 2024).
  36. Günther, I.; Harttgen, K. Estimating Households Vulnerability to Idiosyncratic and Covariate Shocks: A Novel Method Applied in Madagascar. World Dev. 2009, 37, 1222–1234. [Google Scholar] [CrossRef]
  37. MOFED. Federal Democratic Republic of Ethiopia (FDRE) Sustainable Development and Poverty Reduction Program; MOFED: Addis Ababa, Ethiopia, 2002.
  38. Pritchett, L.; Suryahadi, A.; Sumarto, S. Quantifying Vulnerability to Poverty: A Proposed Measure, Applied to Indonesia. World Bank, East Asia and Pacific Region, Environment and Social Development Sector Unit. Policy Research Working Papers. 2000. Available online: https://books.google.com.et/books?id=VAj7-jJ6uyIC (accessed on 1 June 2023).
  39. Sileshi, M.; Kadigi, R.; Mutabazi, K.; Sieber, S. Analysis of households’ vulnerability to food insecurity and its influencing factors in East Hararghe, Ethiopia. J. Econ. Struct. 2019, 8, 41. [Google Scholar] [CrossRef]
  40. Mango, N.; Makate, C.; Mapemba, L.; Sopo, M. The role of crop diversification in improving household food security in central Malawi. Agric. Food Secur. 2018, 7, 7. [Google Scholar] [CrossRef]
  41. Herrera, J.P.; Rabezara, J.Y.; Ravelomanantsoa, N.A.F.; Metz, M.; France, C.; Owens, A.; Pender, M.; Nunn, C.L.; Kramer, R.A. Food insecurity related to agricultural practices and household characteristics in rural communities of northeast Madagascar. Food Secur. 2021, 13, 1393–1405. [Google Scholar] [CrossRef] [PubMed]
  42. Napoli, M.; De Muro, P.; Mazziotta, M. Towards a Food Insecurity Multidimensional Index (FIMI), Romatre Universita Degli Studi, 2011. Available online: http://www.fao.org/fileadmin/templates/ERP/uni/FIMI.pdf (accessed on 16 June 2023).
Figure 1. Map of the study areas.
Sustainability 16 05766 g001
Table 1. Characteristics of sample households: categorical variables.
VariablesDescriptionAdoptersNonadoptersChi-Square Test (χ2)
Number%Number%
Gender Male27377.6718.40.32
Female7922.43181.6
Level of EducationNo formal Education12736.12257.97.54 **
Primary17449.41436.8
Secondary5114.525.3
Off-farm ActivityYes15744.61334.21.51
No19555.42565.8
Access to CreditYes17449.41847.40.06
No17850.62052.6
Extension Contact>=620959.41744.73.02 *
<614340.62155.3
Membership >213939.51539.50.001
<221360.52360.5
Climate Information Yes116331744.72.12
No236672155.3
Good soilYes16847.71642.10.44
No18452.32257.9
Moderately fertile soilYes11532.71847.43.29 *
No23767.32052.6
Flat plot slopeYes17048.31539.51.07
No18251.72360.5
Moderately plot SlopeYes10329.31642.12.67
No24970.72257.9
Severity of soil erosionHigh180511026.38.46 **
Low17248.92873.7
Perceived climate shockLow12134.42565.814.53 ***
Medium16744.41026.3
High6418.237.9
Source: Own survey (2022). ***, **, and * indicate statistical significance at less than 1%, 5%, and 10%, respectively.
Table 2. Characteristics of sample households: continuous variables.
VariablesMeanAdoptersNonadopterst-Value
Age42.5 (0.56)42.641.8−0.39
Family Size4.7 (0.11)4.74.6−0.43
Livestock3.5 (0.16)3.71.9−6.56 ***
Farm Size1.4 (0.04)1.41.3−1.22
Distance to market31.5 (1.14)31.531.40.04
Climate perception1.01 (0.02)1.020.862.72 ***
Source: Own survey (2022). *** indicates statistical significance at less than 1%. The numbers in parentheses are standard errors.
Table 3. Conditional and unconditional probabilities of adopting climate change practices (%).
Crop Management Practice (A)Soil and Water Conservation Measures (S)Livelihood Portfolio Diversification (L)
p Y j = 1 665341
p Y j = 1 Y A = 1 1005642
p Y j = 1 Y S = 1 7010047
p Y j = 1 Y L = 1 6552100
p Y j = 1 Y A = 1 , Y S = 1 10010040.0
p Y j = 1 Y A = 1 , Y L = 1 10055100
p Y j = 1 Y S = 1 , Y L = 1 70100100
Note: Y j = 1 is a binary variable representing the adoption status concerning choice j ( j = 1 Crop management practice (A), soil and water conservation (S), and livelihood portfolio diversification (L)).
Table 4. Categorization of households by their vulnerability level and food security status.
Level of
Vulnerability
Food Security Status χ 2 Adoption Status
Food InsecureFood Secure
No.%No.%Adopters (%)Nonadopters (%)
Vulnerable9265.34934.821.236 ***34.155.3
Not vulnerable10240.914759.165.944.7
Total19449.719650.3100.0100.0
Source: own computation based on survey (2022) *** indicates statistical significance at less than 1%.
Table 5. Multinomial endogenous treatment effect estimates of adoption impacts of climate change adaptation strategies on vulnerability to food insecurity.
Outcome VariableStrategy ChoiceAverage Treatment Effects on the Treated (ATT)
CoefficientStandard Error
Vulnerability to
Food Insecurity
A1S1L1−0.12 ***0.003
A1S0L1−0.16 ***0.004
A0S0L1−0.16 ***0.003
A0S1L0−0.14 ***0.003
A1S0L1−0.15 ***0.002
A1S1L0−0.24 ***0.002
A1S0L0−0.08 ***0.003
Selection terms
λA1S1L10.02 ***0.0007
λA1S0L10.14 ***0.0006
λA0S0L10.01 ***0.0010
λA0S1L00.11 ***0.0008
λA1S0L1−0.09 ***0.0007
λA1S1L00.23 ***0.0007
λA1S0L00.02 ***0.0008
*** denotes significance at 1% significance levels.
Disclaimer/Publisher’s Note: The statements, opinions and data contained in all publications are solely those of the individual author(s) and contributor(s) and not of MDPI and/or the editor(s). MDPI and/or the editor(s) disclaim responsibility for any injury to people or property resulting from any ideas, methods, instructions or products referred to in the content.

