Article

The Evolution of Forest Landscape Connectivity and Ecological Network Construction: A Case Study of Zhejiang’s Ecological Corridors

College of Landscape Architecture, Nanjing Forestry University, Nanjing 210037, China
*
Author to whom correspondence should be addressed.
Sustainability 2024, 16(14), 5868; https://doi.org/10.3390/su16145868
Submission received: 3 June 2024 / Revised: 2 July 2024 / Accepted: 3 July 2024 / Published: 10 July 2024
(This article belongs to the Special Issue Biodiversity Management in Sustainable Landscapes)

Abstract

:
As main components of terrestrial ecosystems, forests play irreplaceable roles in maintaining ecological balance and protecting the basic environment for human survival and development. In this study, the dynamic changes in the forest landscape connectivity in Zhejiang province in 2000, 2010, and 2020 were detected by identifying ecological sources and evaluating connectivity indexes based on morphological spatial analysis (MSPA) and a minimum cumulative resistance (MCR) model. The results are as follows: (1) The forest area of Zhejiang increased by 64.88% from 2000 to 2020, indicating that the overall habitat quality has improved and that ecological risks have decreased, which are attributed to Zhejiang’s adherence to comprehensive environmental management. (2) Regions with low connectivity are distributed mainly in the north, where human activities are intensive. The overall pattern of high connectivity in the middle of the region and low connectivity elsewhere demonstrates the uneven distribution of forest landscape connectivity across the province. (3) The extracted ecological corridors have a mesh-like structure that is dense in the middle and slack in the north. Important corridors have disappeared over time, indicating potential issues in maintaining connectivity for species migration. (4) These results can provide optimization strategies for ecological infrastructure planning in Zhejiang province and offer a theoretical reference for the optimization of the ecological network system.

1. Introduction

Since the reform and opening up, China has experienced an accelerated process of urbanization and industrialization. However, along with remarkable economic development, intensive land development and sustained human activity have dramatically changed the pattern of the urban landscape. For example, the original natural landscape, including forests, grasslands, rivers, and soil, has been transformed into nature reserves, urban forest parks, scenic tourist areas, and man-made landscapes predominantly consisting of cement, asphalt, chemical materials, and metal [1]. The decline in forest landscape connectivity has threatened ecosystem service functions and sustainability [2]. As a result, the landscape’s ecological processes and normal ecological adjustment abilities have been disturbed. A strategy is urgently needed to establish a balance between the demand for urban land in the process of urbanization and biodiversity conservation [3]. In recent years, to preserve ecological biodiversity and balance regional economic growth, numerous scientists worldwide have proposed the use of the ecological connection and regional ecological networks concepts [4]. These notions have beneficial implications for advancing high-quality urban development [5].
Ecological connectivity has become a research hotspot in conservation biology, landscape ecology, and other subjects over the years [6]. Ecological connectivity is defined as the degree or ability of an ecological landscape to promote or hinder the flow of ecological resources among patches. Forest landscape connectivity, as an integral part of ecological connectivity, plays a pivotal role in influencing the provision and functioning of ecosystem services within urban areas. It facilitates seed migration and promotes animal movement and gene flow, in addition to impacting water infiltration and soil erosion.
Recently, urbanization and other human activities that reduce forest landscape connectivity have been reported [7,8]. According to the relevant studies, urban expansion and road construction have reduced forest landscape connectivity [9,10]. For example, the forest area in Laixi city, Shandong province, remained stable during urbanization; however, a significant decline was observed in the forest landscape connectivity index. The effects of different factors on forest landscape are fed back into ecological processes on different scales; for example, urban expansion mainly affects ecological processes at small scales, and road construction has an important effect on ecological processes at large scales. Moreover, forest landscape connectivity is more sensitive to urbanization than forest area, so the degradation of forest landscape connectivity is strongly associated with urbanization [9]. In Zhuhai city, the effect of rapid urbanization on forest landscape connectivity was analyzed, and the study revealed that urbanization reduced the areas of key patches and, consequently, reduced forest landscape connectivity, which then increased when patch areas increased as a result of environmental protection policy [10].
Other studies have concentrated on landscape patterns and conducted a series of connectivity assessment studies by identifying ecological sources. The ecological source is the patch necessary to maintain biodiversity, which means that the ecological function, shape, size, and spatial location of the patch are all factors that need to be evaluated [11]. In the field of ecological source identification, the original multifactor comprehensive evaluation method, or the direct selection of forest parks or nature reserves with a high ecological service value as the ecological source areas, is considered subjective because it neglects the connectivity among landscape patches [12]. To solve this problem, morphological spatial analysis (MSPA) provides a new method for the identification of ecological sources that analyzes the potential ecological effects of all ecological patches from the perspective of morphology and improves the accuracy of the results [13]. Previous studies have indicated that the application of the MSPA technique in conjunction with ecological connection, as a source screening measure, can enhance the accuracy and reasoning in ecological source selection [14]. This approach is suitable for some highly urbanized regions that experience extreme fragmentation [15]. As strip areas that connect ecological sources, ecological corridors guarantee transmissions of ecological flow and processes. They are mainly constructed using the least-cost path (LCP) model, minimum cumulative resistance (MCR) model, gravity model, and circuit theory [16]. Among them, the MCR model is the most widely applied method for ecological corridor identification; it is applied to quantify the resistance of ecological flow conversion from source to destination.
Ecological spatial change is a long-term process with multiscale and nonlinear characteristics. There are also multifactor impacts on the process [17]. It has been demonstrated that ecological networks can be effectively constructed and optimized through an investigation of the spatial–temporal land-use changes and ecological landscape connectivity [18]. In recent years, the areas of forest lands have decreased because of the intensification of human activities, such as construction land expansion, especially in areas of rapid urbanization. Although landscape connectivity is a key factor in maintaining landscape ecological functions, there are few studies on measuring forest landscape connectivity in regions from the perspectives of spatial distribution, natural resource transfer, and time-related changes. For instance, Xu et al. put forward a framework for ecological network construction in Suzhou combined with land-use simulation using superimposed ecological sources, corridors, and nodes screened from 2002, 2012, and 2022 [19]. Huo et al. constructed and optimized the ecological network in the Zhengzhou metropolitan area by applying the MSPA model and network structure evaluation [20]. Relevant studies of ecological networks in their present stage mostly focus on the construction of sources and corridors within small-scale regions, whereas this study chose Zhejiang province as the research area. It aims to analyze the temporal and spatial changes in ecological connectivity and optimization strategies from a more comprehensive and macroscopic perspective, including extracting forest patches as source points, dynamic evaluation of overall and regional connectivity, and, finally, constructing an ecological resistance surface and optimizing the ecological network.
Zhejiang province plays a central role in the ecological preservation of the Yangtze River Delta region in China, especially Lishui city in the southwest of Zhejiang, which functions as the ecological security barrier in eastern China with its large areas of forests and hills. With the rapid development of society, the larger scale of urban agglomeration inevitably boosts the pressure placed on the forest ecological security. According to a previous study on Zhejiang’s ecological security pattern, the overall landscape pattern of Zhejiang presents the characteristics of diverse landscape types and a concentrated distribution of ecological patches, which mainly include forests, accounting for 83.4%, followed by cropland, grassland, and water areas [21]. Among them, there are many areas around current cultivated lands and construction lands, which have common characteristics, such as more frequent interference by human activities, greater amount of fragmented land, and blocked ecological processes, which reduce ecological connectivity. Therefore, it is urgent to find spatial solutions to the dilemma between exploitation of construction lands and protection of forest lands. The present study took Zhejiang province as the research area. It comprehensively analyzed dynamic changes in the forest landscape connectivity over a period of time combined with a connectivity evaluation from a spatial–temporal perspective. This study has the following three main objectives: (1) To identify important forest patches as ecological sources and evaluate their changes over time on the basis of land-use data and quantitative analysis of MSPA; (2) To construct an ecological resistance surface using the MCR model, further obtaining the spatial distribution map of landscape connectivity for each period; and (3) To screen essential ecological corridors and construct an ecological network on the basis of the minimum cumulative resistance surface. The study provides an integrated framework for the analysis of spatial and temporal evolutions and characteristics of landscape connectivity. Not only can it supply a theoretical basis for optimizing the ecological network of Zhejiang province, but it also offers methods and ideas for future territorial spatial planning and ecological restoration.

2. Materials and Methods

2.1. Study Area

Zhejiang province (118°01’ E–12.3°10’ E, 27°02’ N–31°11’ N) is located in the south of the Yangtze River Delta on the southeast coast of China, serving as the railway and waterway transportation core and as an industrial and trade base in the Yangtze River Delta region (Figure 1). The total land area occupies approximately 105,600 square kilometers, with 74.6% being mountains, 5.1% being water, and 20.3% being flat land. Forest land covers 59.43% of the land area in Zhejiang. According to statistics, the gross domestic product (GDP) of the province was CNY 8.26 trillion and the per capital GDP was CNY 125,000 in 2023. The permanent resident population of Zhejiang was approximately 66.27 million in 2023, and the urbanization rate was 74.3%. During the study periods, Zhejiang’s industrial-added value increased from CNY 0.3 trillion to CNY 2.26 trillion. With the development of traditional competitive industries, equipment manufacturing, high-tech industries, and strategic emerging industries, the demand for land to use has also increased over the years. The constant expansion of construction land has led to a series of ecological problems, including the intensification of soil erosion, declining ecological quality, and reductions in forest areas, as well as environmental pollution and resource consumption caused by human activities, which further aggravate ecological and environmental problems.

2.2. Data Sources

The data used in this study were collected from multisource databases on nature, ecology, and society, provided by the website below (Table 1). Land-use data from 2000, 2010, and 2020 were derived from Landsat-TM/ETM and Landsat 8 OLI remote sensing images (resolution: 30 m; cloud cover: less than 10%). The environmental data included a digital elevation model (DEM) and slope, and the socioeconomic data involve national highways and GDP. Reprocessing of these data was performed using ArcGIS 10.8. Using basic data, such as the ecological resistance factors, obtained by analysis with the 3D Analyst tool, the ecological resistance surface and forest landscape connectivity were studied. The World Geodetic System (WGS) 1984 World Mercator projection coordinate system with a spatial resolution of 30 m × 30 m was used to uniformly process all geographic elements in this study. Using the DEM, the slope was calculated with ArcGIS.

2.3. Methodology

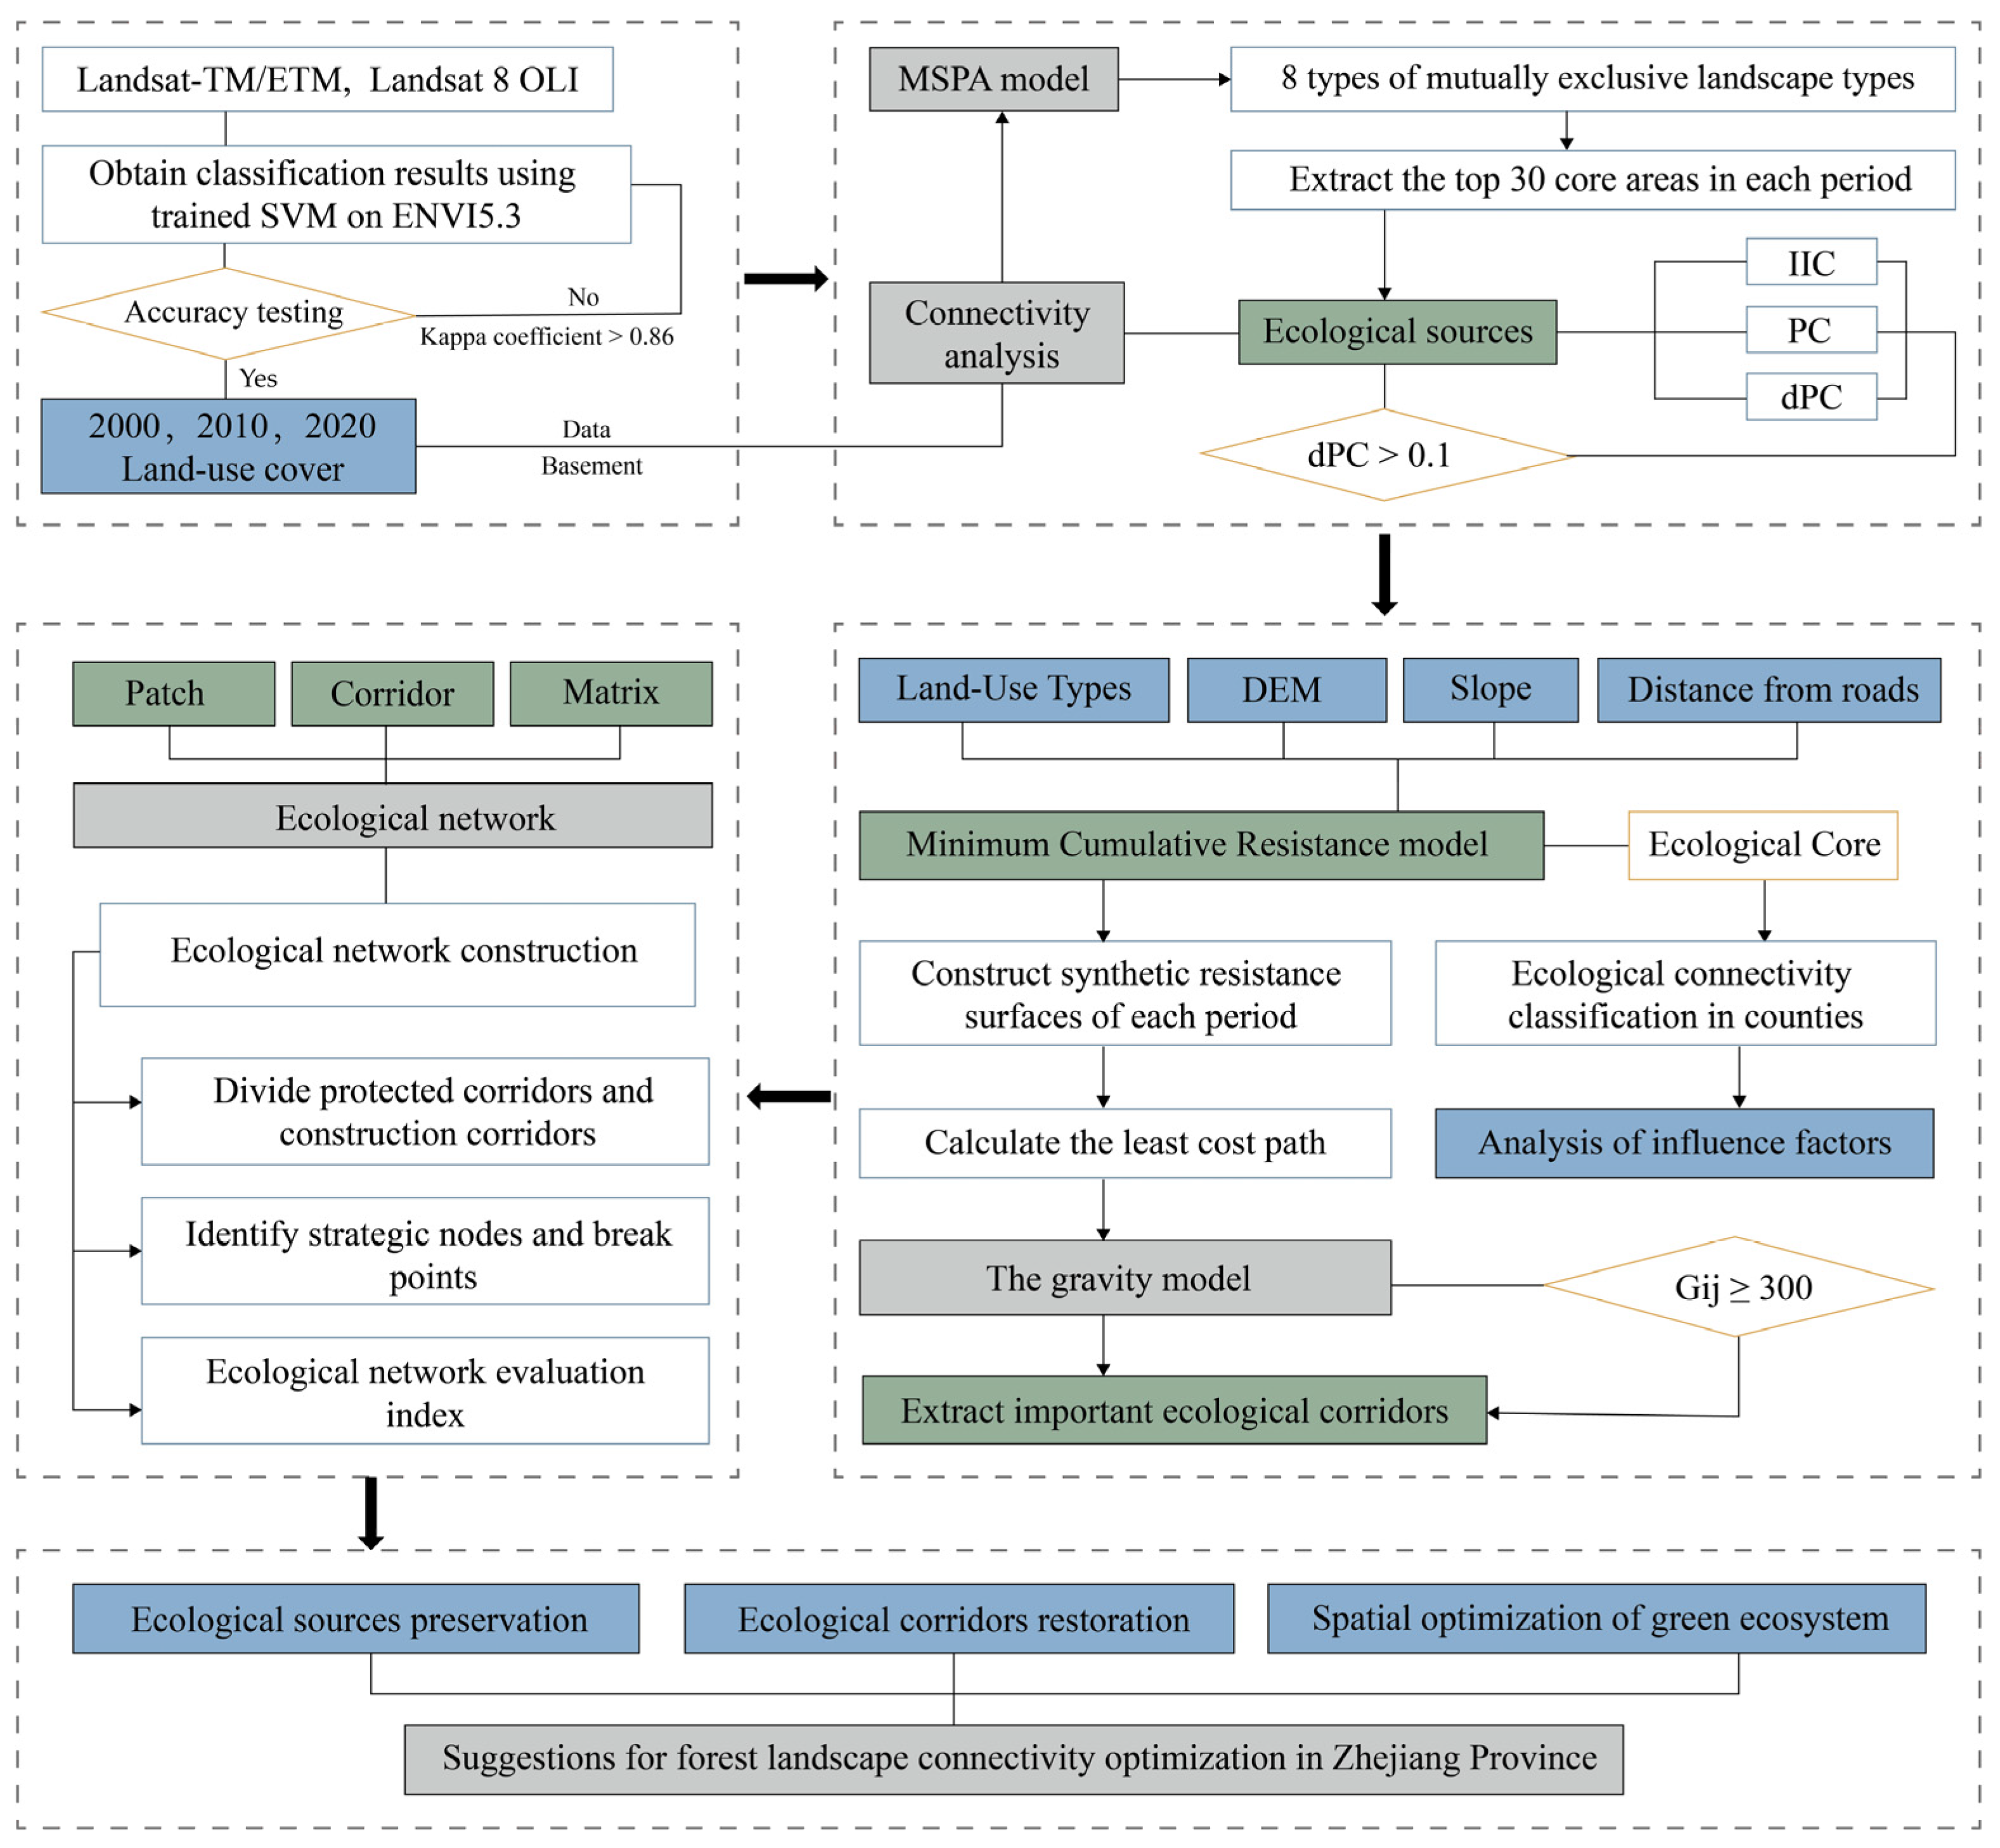
In this study, multiple methods were used to determine and summarize the mechanism behind the spatial and temporal changes in forest landscape connectivity over three periods from 2000 to 2020 (2000, 2010, and 2020). First, the land-use data during different periods were extracted from Landsat-TM/ETM and Landsat 8 OLI images with a resolution of 30 m. According to the classification standard of the land-use status and previous studies, land-use data were classified into 8 types [22]. Secondly, potential ecological sources were evaluated and extracted through an MSPA, and the results were used in the connectivity analysis. Finally, the MCR model and gravity model were used to calculate the ecological corridor. The framework is shown in Figure 2.

2.3.1. Extraction of Landscape Types in Different Periods

The preprocessing of extracted remote sensing images was carried out using radiometric correction, geometric correction, and tailoring. To increase the accuracy of the data’s interpretation, the study adopted a support vector machine (SVM), which is a composite method of supervised classification. In preparation for the SVM classification, several preprocessing steps, such as radiometric and geometric corrections, data normalization, and handling missing values, were designed to enhance the accuracy and reliability of our classification process. In doing so, the study area’s land was divided into the following 8 types: cropland, forest, grassland, impervious land, shrub, water, wetland, and barren. Spatial distribution maps of the landscape types in Zhejiang province for 2000, 2010, and 2020 were extracted. The kappa coefficient was used to assess the accuracy via an accuracy test that was conducted by collecting 2000 ground truth points. The kappa coefficient for the 2000, 2010, and 2020 datasets was more than 0.86, which meets the precision requirement for the study.

2.3.2. Ecological Source Identification and Index of Connectivity

The MSPA is an image processing method that relies on erosion, expansion, and opening and closing to identify and segment the overall spatial pattern. It effectively determines the landscape type and structure. The ecological characteristics are shown in Table 2. Therefore, using land-use images of Zhejiang province, the MSPA model was used to analyze the forest landscape pattern, using forest land as the research foreground and other land-use types as the research background. The data were analyzed with Guidos Toolbox, which is software that contains a wide variety of generic raster image processing routines. The core, islet, perforation, edge, loop, bridge, and branch were obtained.
Compared to previous methods for constructing ecological networks, the MSPA can more comprehensively analyze the characteristics of connectivity [23]. However, in actual planning, the influences of the scale of the green space, nature, and other inherent attributes should still be considered, as the ideal simulation of digital information may not be applicable to all practical situations.
Table 2. Types of landscape structures and the ecological characteristics of the MSPA.
Structure TypeEcological Characteristics
CoreLarger habitat patches of ecological land, such as forests and wetlands. They provide larger habitats for species, including large natural patches, wildlife habitats, and protected forest areas [24].
IsletSmall, isolated, and fragmented patches that are not connected or have low connectivity, including small urban green spaces on construction land [25].
PerforationEdges of internal patches, which are transition areas between core and nongreen landscape patches [24].
EdgeExternal boundaries of core areas, between a core area and nongreen landscape areas [26].
LoopNarrow areas connecting the core areas, which are shortcuts used by species to migrate [25].
BridgeStrips of ecological land that connect core areas, which allow for the promotion of species migration, energy flows, and network formations within the region [27].
BranchPatches with only one side connected to a perforation, edge, loop, or bridge [28]. They have low connectivity with surrounding natural patches.
The ecological connectivity index can quantitatively characterize the complexity of the material migration and energy transfer of a certain landscape type among ecological sources. Maintaining high connectivity is of great significance to the stability of the ecosystem and the protection of biodiversity [29]. Referring to the relevant literature, common landscape connectivity indexes include the integral index of connectivity (IIC), probable connectivity index (PC), and patch importance index (dPC) [30]. These indexes can fully reflect landscape connectivity. In this study, IIC and dPC were selected to identify important ecological sources in the core area [31,32]. The formulae are as follows:
I I C = i = 1 n j = 1 n a i a j 1 + n l i j A L 2
P C = i = 1 n j = 1 n a i · a j · P i j A L 2
d P C = P C P C r e m o v e P C × 100 %
where n is the total number of patches in the area; a i and a j refer to the areas of patch i and patch j, respectively; P i j is the maximum product of the probabilities of all paths between patches i and j; AL is the total area of the landscape in the studied area; and PC, ranging from 0 to 1, represents the possible connectivity index of a patch in the study area’s landscape. The greater the value of PC, the higher the degree of patch connection. dPC represents the importance of a patch, and PCremove represents the possible connectivity index after eliminating the patch [33].
In this study, 30 sources for the largest core patch area were selected for the connectivity analysis, and the thresholds for the patch connectivity distances were set to 1000 m, 2000 m, 3000 m, 4000 m, and 5000 m. To ensure comparability with the IIC results, the probability was set to 0.5, and it was concluded that if the distance threshold was set too high, some large patches would be divided and small patches would disappear. As the threshold changes, so do the values of IIC and dPC. Within a certain range, the order of patch importance, as reflected by the values of IIC and dPC, was consistent. Finally, the distance threshold was set to 5000 m, and the patches with a dPC value of >0.1 were selected as important ecological sources.

2.3.3. Construction of Ecological Resistance Surface

The MCR calculates the target resistance value between the source and the target based on the ecological resistance surface, and it continuously simulates the construction of the shortest path, which is the theoretical best path. The formula is as follows [34]:
MCR = f m i n j = n i = m D i j × R i
where f m i n represents the function of the MCR, D i j presents the spatial distance of energy or matter from j to i, and R i represents the resistance value of the landscape surface [35,36].
In this study, according to the outcomes of the MSPA and forest landscape connectivity analysis, 73 ecological sources were screened. Resistance factors, such as elevation, slope, land-use type, and distance from other roads (national highways and expressways) were selected to construct a comprehensive resistance surface using the comprehensive weighted index sum method [37]. As a type of habitat isolation zone, national highways and expressways may hinder the migration and diffusion of organisms and have a significant impact on ecological resistance. The expert scoring method was employed on the basis of relevant research results to ascertain the resistance score and weight of each factor. Subsequently, a comprehensive resistance system was established, comprising five distinct resistance scores. A higher score indicates greater resistance in the diffusion process of biological species (Table 3). With a grid cell size of 30 m × 30 m, the integrated resistance surface was obtained using the grid calculator as the cost data in the MCR model.
The extracted ecological sources and ecological integrated resistance surface were imported into the cost distance module of ArcGIS 10.8 to calculate the minimum cumulative resistance value of all source areas to each grid in the study area. Then, the spatial distribution maps of landscape connectivity for each period were obtained by calculating the minimum cumulative resistance value of each county with the tabular partition statistics module.

2.3.4. Screening of Important Corridors

The minimum cumulative resistance among ecological sources was calculated on the basis of the integrated resistance surface. The MCR was utilized to generate potential ecological corridors. Repeated corridors were subsequently screened out to obtain the optimal layout of the ecological network. Finally, the gravity model was used to quantitatively evaluate the interaction intensity among the ecological source areas. The importance of potential corridors to regional ecological security was determined by the force magnitude [38]. The formula is as follows:
F = G i j = N i × N j D i j 2 = L m a x 2 × ln ( S i × S j ) L i j 2 × P i × P j
where G i j represents the ecological gravity between patch i and patch j; N i and N j represent the weight values of patches i and j; P i and P j represent the resistance values of patches i and j; L i j represents the cumulative resistance value between patches i and j; and L m a x represents the maximum resistance value of the potential corridor. Ten important ecological source areas were selected, and the corridors in the source areas F ≥ 300 were classified as important corridors, whereas the rest were classified as general corridors on the basis of the gravity value.

2.3.5. Selection of Ecological Nodes

The ecological nodes in ecological networks serve as pivotal and transformative hubs for organisms. A favorable habitat for species undertaking long-distance migrations can be offered. They can be classified into the following two main categories: strategic points and break points [39]. The ecological break areas were found at the junction of the traffic routes and the ecological corridors. The hydrological analysis in ArcGIS was applied to identify strategic areas. The ridgeline with the highest cost path on the resistance surface was extracted. Both strategic points and break points can be used as steppingstones.

2.3.6. Ecological Network Analysis

In terms of the ecological network evaluation, the network closure index α, network connectivity index β, and network connectivity rate index γ are commonly used quantitative evaluation indexes that can be used to describe the complexity and connectivity of the network in the study area, specifically described as follows [40]:
α = l v + 1 2 v 5
β = l v
γ = l l m a x x = l 3 ( v 2 )
where l is the number of corridors, and v is the number of nodes.

3. Results

3.1. Kappa Coefficient Evaluation

As a measure of the classification accuracy, the kappa coefficient is used in consistency tests and can also be used to measure the classification accuracy. In comparison to the overall accuracy, precision, recall, and F1 score, the kappa coefficient calculates the accuracy of a model’s prediction by comparing the positive and negative cases predicted by the model with the positive and negative cases actually classified. The result of a kappa calculation is usually between 0 and 1, which can be divided into the following five groups that represent different levels of consistency: 0.0~0.20 (slight), 0.21~0.40 (fair), 0.41~0.60 (moderate), 0.61~0.80 (high), and 0.81~1 (almost perfect). After supervised classification and accuracy testing using the support vector machine method (SVM) on ENVI 5.3, three confusion matrices were constructed. As is shown in Figure 3, A1 to A8 represent cropland, forests, grassland, impervious land, shrubs, water, wetlands, and barren land, respectively. The detailed accuracy matrix for each dataset is distributed diagonally along the confusion matrix, from which it can be observed that the average classification accuracies of various data from 2000 and 2010 were both 0.90, whereas the data for 2020 reached 0.96. It can be seen that the Kappa coefficient for the 2000, 2010, and 2020 datasets was more than 0.86, and the classification results meet the needs of the study.

3.2. Landscape Pattern Analysis

The landscape areas during the studied years were calculated using ArcGIS. The dynamic changes in landscape area in Zhejiang between 2000 and 2020 are displayed in Table 4, which shows that from 2000 to 2020 the ecological environment recovered more than it deteriorated. The proportion of forest land area was the highest, increasing to 64.88% from 2000 to 2020, while the proportions of cropland and water decreased. The overall landscape ecology improved, which is attributed to Zhejiang’s adherence to comprehensive ecological and environmental management. For instance, The People’s Government of Zhejiang Province implemented the “Measures for Supervision and Administration of Environmental Pollution” in 2006. Thus, the prevention, control, supervision, and management of environmental pollution were enhanced. In June 2003, the Zhejiang government launched the “Demonstration and Regulation in Thousands of Villages” project throughout the province. The project focused on improving the environment related to rural production, life, and ecology. It marked large-scale actions related to village renovation and construction, which were conducted to improve the rural ecological environment and enhance the quality of life of farmers. The project effectively practiced the concept of “clear waters and green mountains are as good as mountains of gold and silver”. It also contributed to sustainable income growth for farmers. Over 90% of villages in Zhejiang meet the standards of scenic beauty in the new era. Figure 4 also shows that there were obvious changes in the spatial evolution of impervious land.

3.3. Ecological Source Identification Based on MSPA

In Table 5, the core areas in 2000, 2010, and 2020 were all types with the largest area proportions. The loop, bridge, and branch areas in the ring road area decreased by 0.11%, 0.09%, and 0.05%, respectively, in 2000 and 2020. This indicates that although the fragmentation index for the forest landscape increased, the stability declined, and the ecological loss increased.
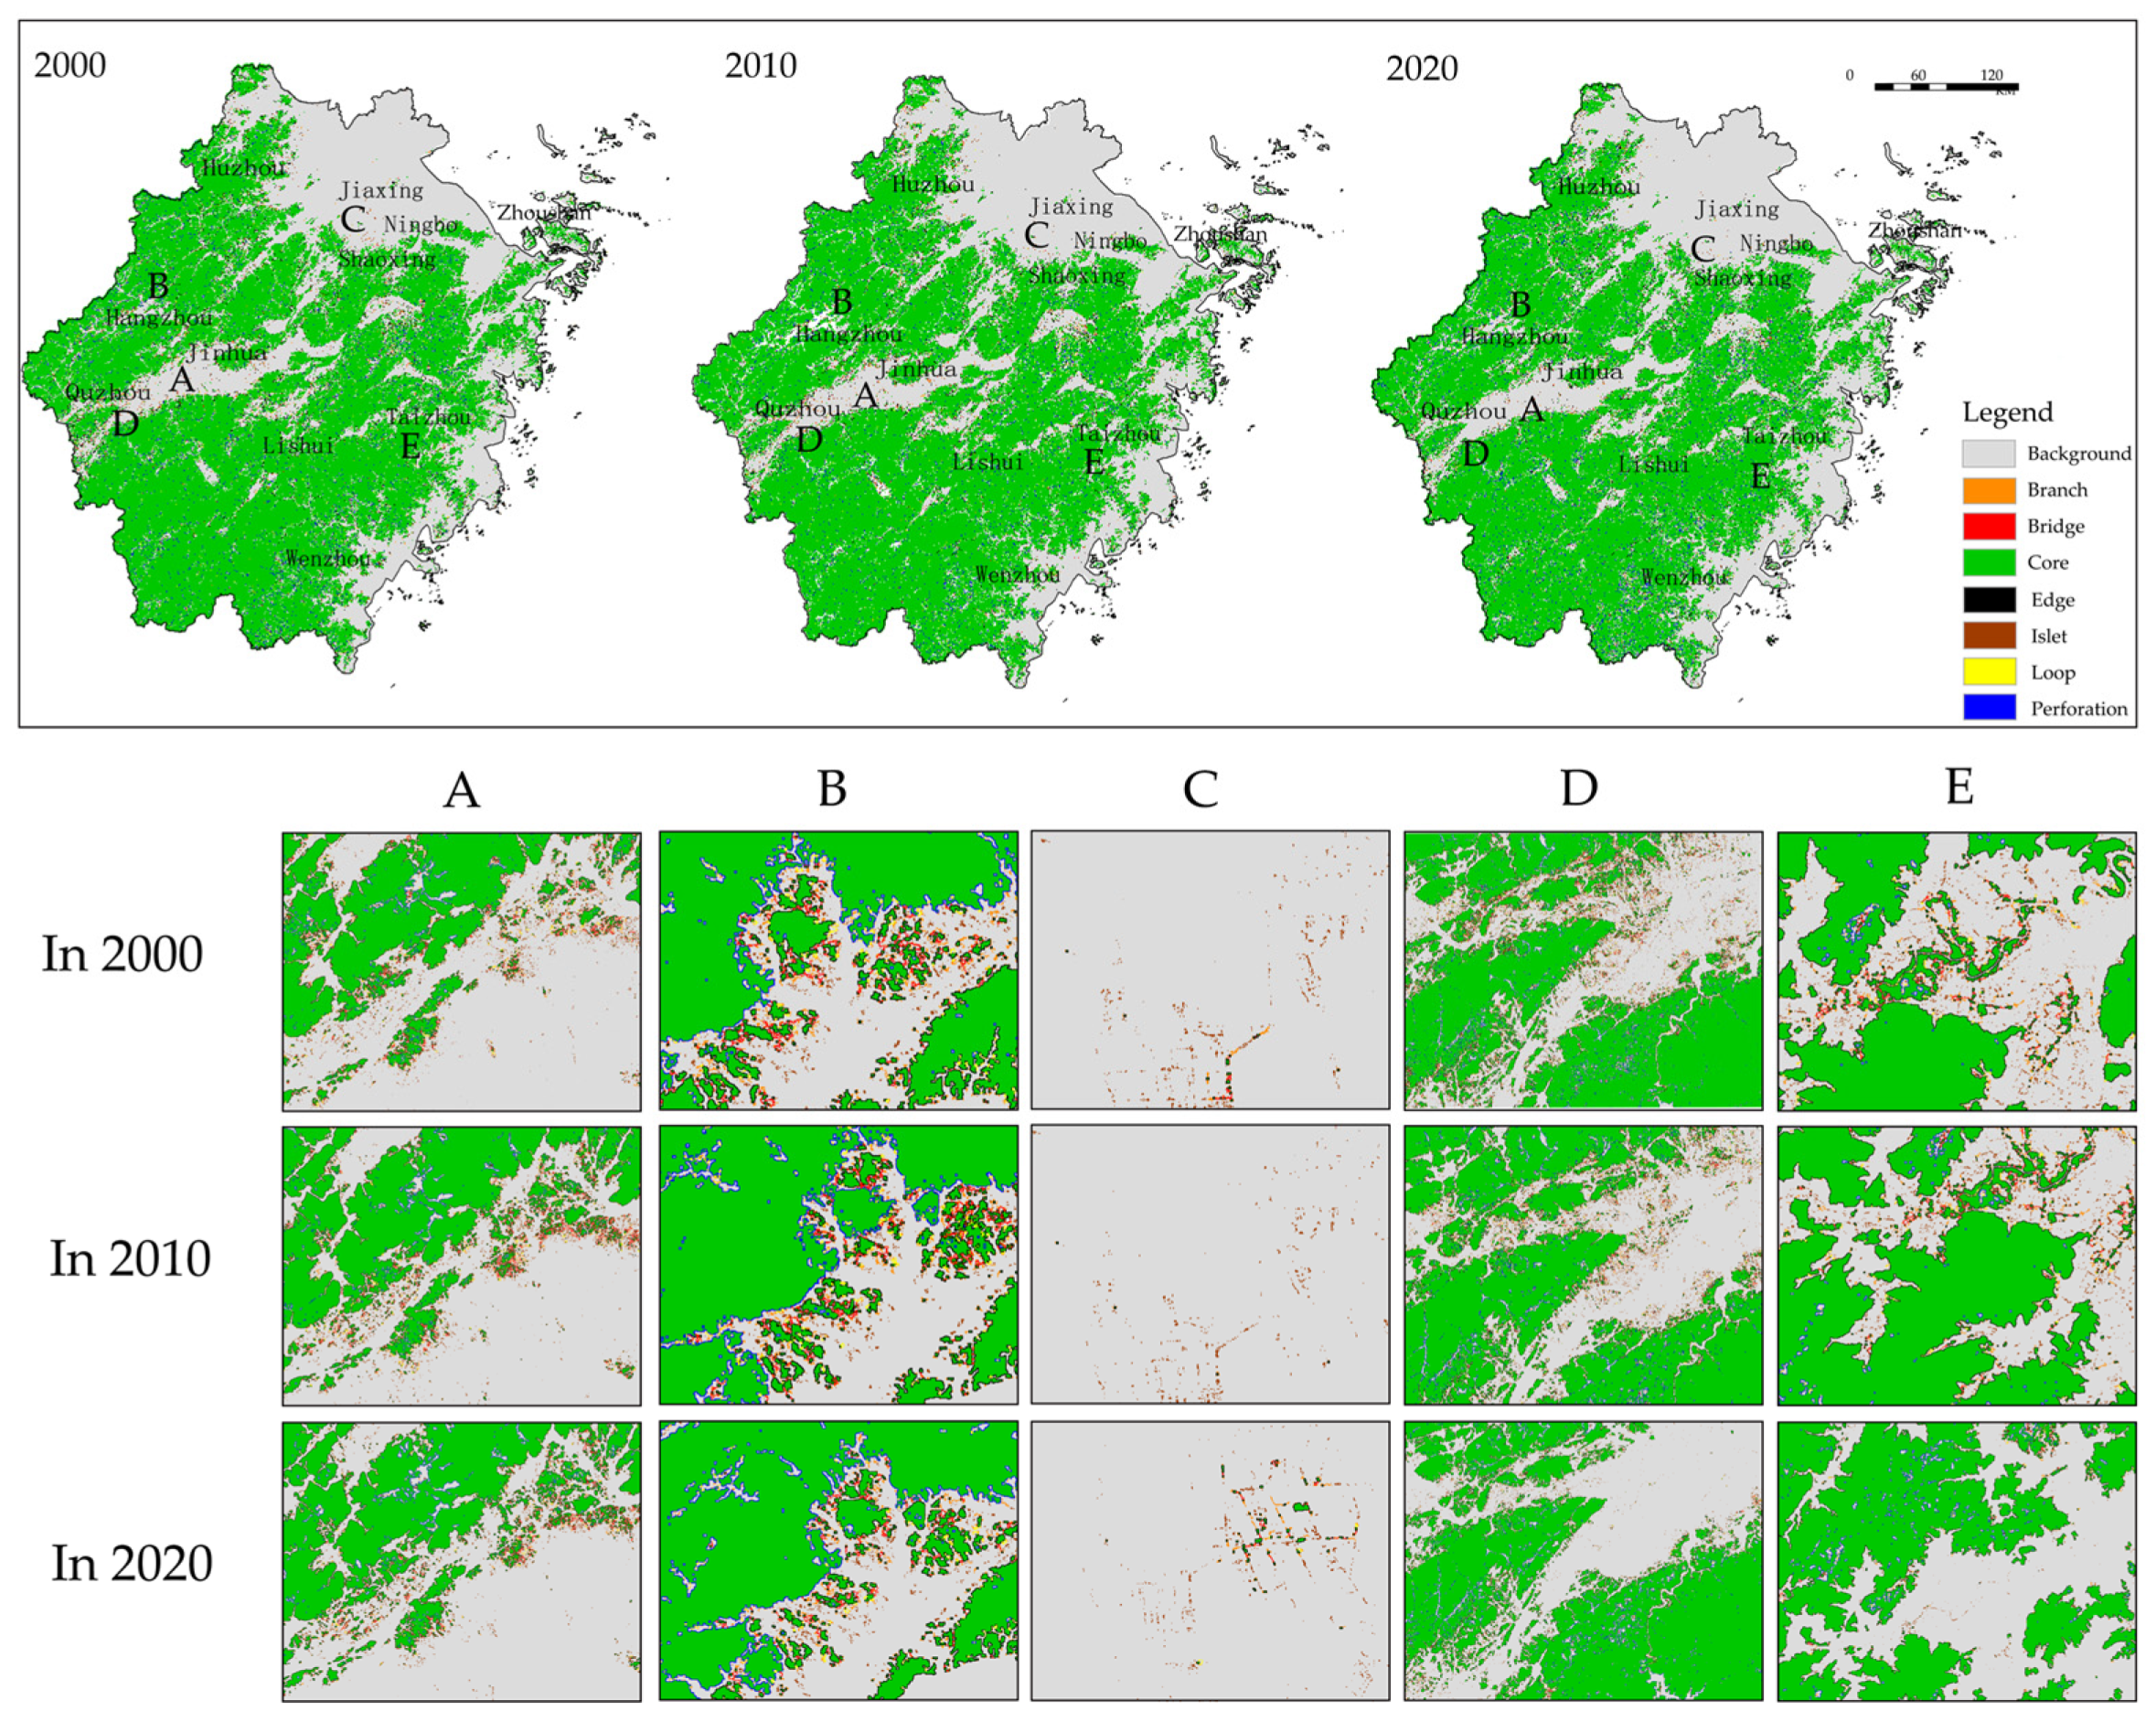
As Figure 5 shows, from 2000 to 2020, the ecological environment deteriorated more than it recovered. With the steady progress of ecological restoration, the core areas of the landscape pattern were concentrated in the southwest and mountainous regions. The landscape patches were in the northeast–southwest direction because of the topography of Zhejiang. The demarcation of ecological preservation boundaries of nature reserves and the building of protective green spaces at all levels have gradually increased the proportion of core areas. However, with the construction and expansion of cities, the core areas of urban fringes were segmented, and the degree of landscape fragmentation intensified.
To better understand the changes in landscape patterns, the morphological and spatial characteristics under the scenario from 2000 to 2020 in Zhejiang province were analyzed. Because of the introduction and implementation of relevant ecological protection policies, the core areas of forest parks and large wetland areas continued to grow over the two decades. Taking Region A (Qujiang District, Quzhou city) as an example, the core area increased in general, and the number of edges, bridges, and branches among the patches also increased, indicating that the ecological protection and restoration measures, such as waterproofing and pollution control, achieved remarkable results. The core area of B (Qiandao Lake) first increased and then decreased, with the largest area observed in 2010; Qiandao Lake was also rated as a National 5A-level tourist attraction in 2010. However, as Figure 5 shows, as cities expanded outward, some core patches in D (Quzhou city) and E (Taizhou city) were continuously divided and reduced in size from 2000 to 2020. During this period, the renovations and expansion of the Taizhou Luqiao Airport project in E (Taizhou city) started in 2019, and the airport’s area continued to increase. The core area was largely reduced. At the same time, with the expansion of urban construction land, the core area of the riverside area in B (Hangzhou city) moved slowly to the urban edge area, and the overall ecological network space showed a growth trend.
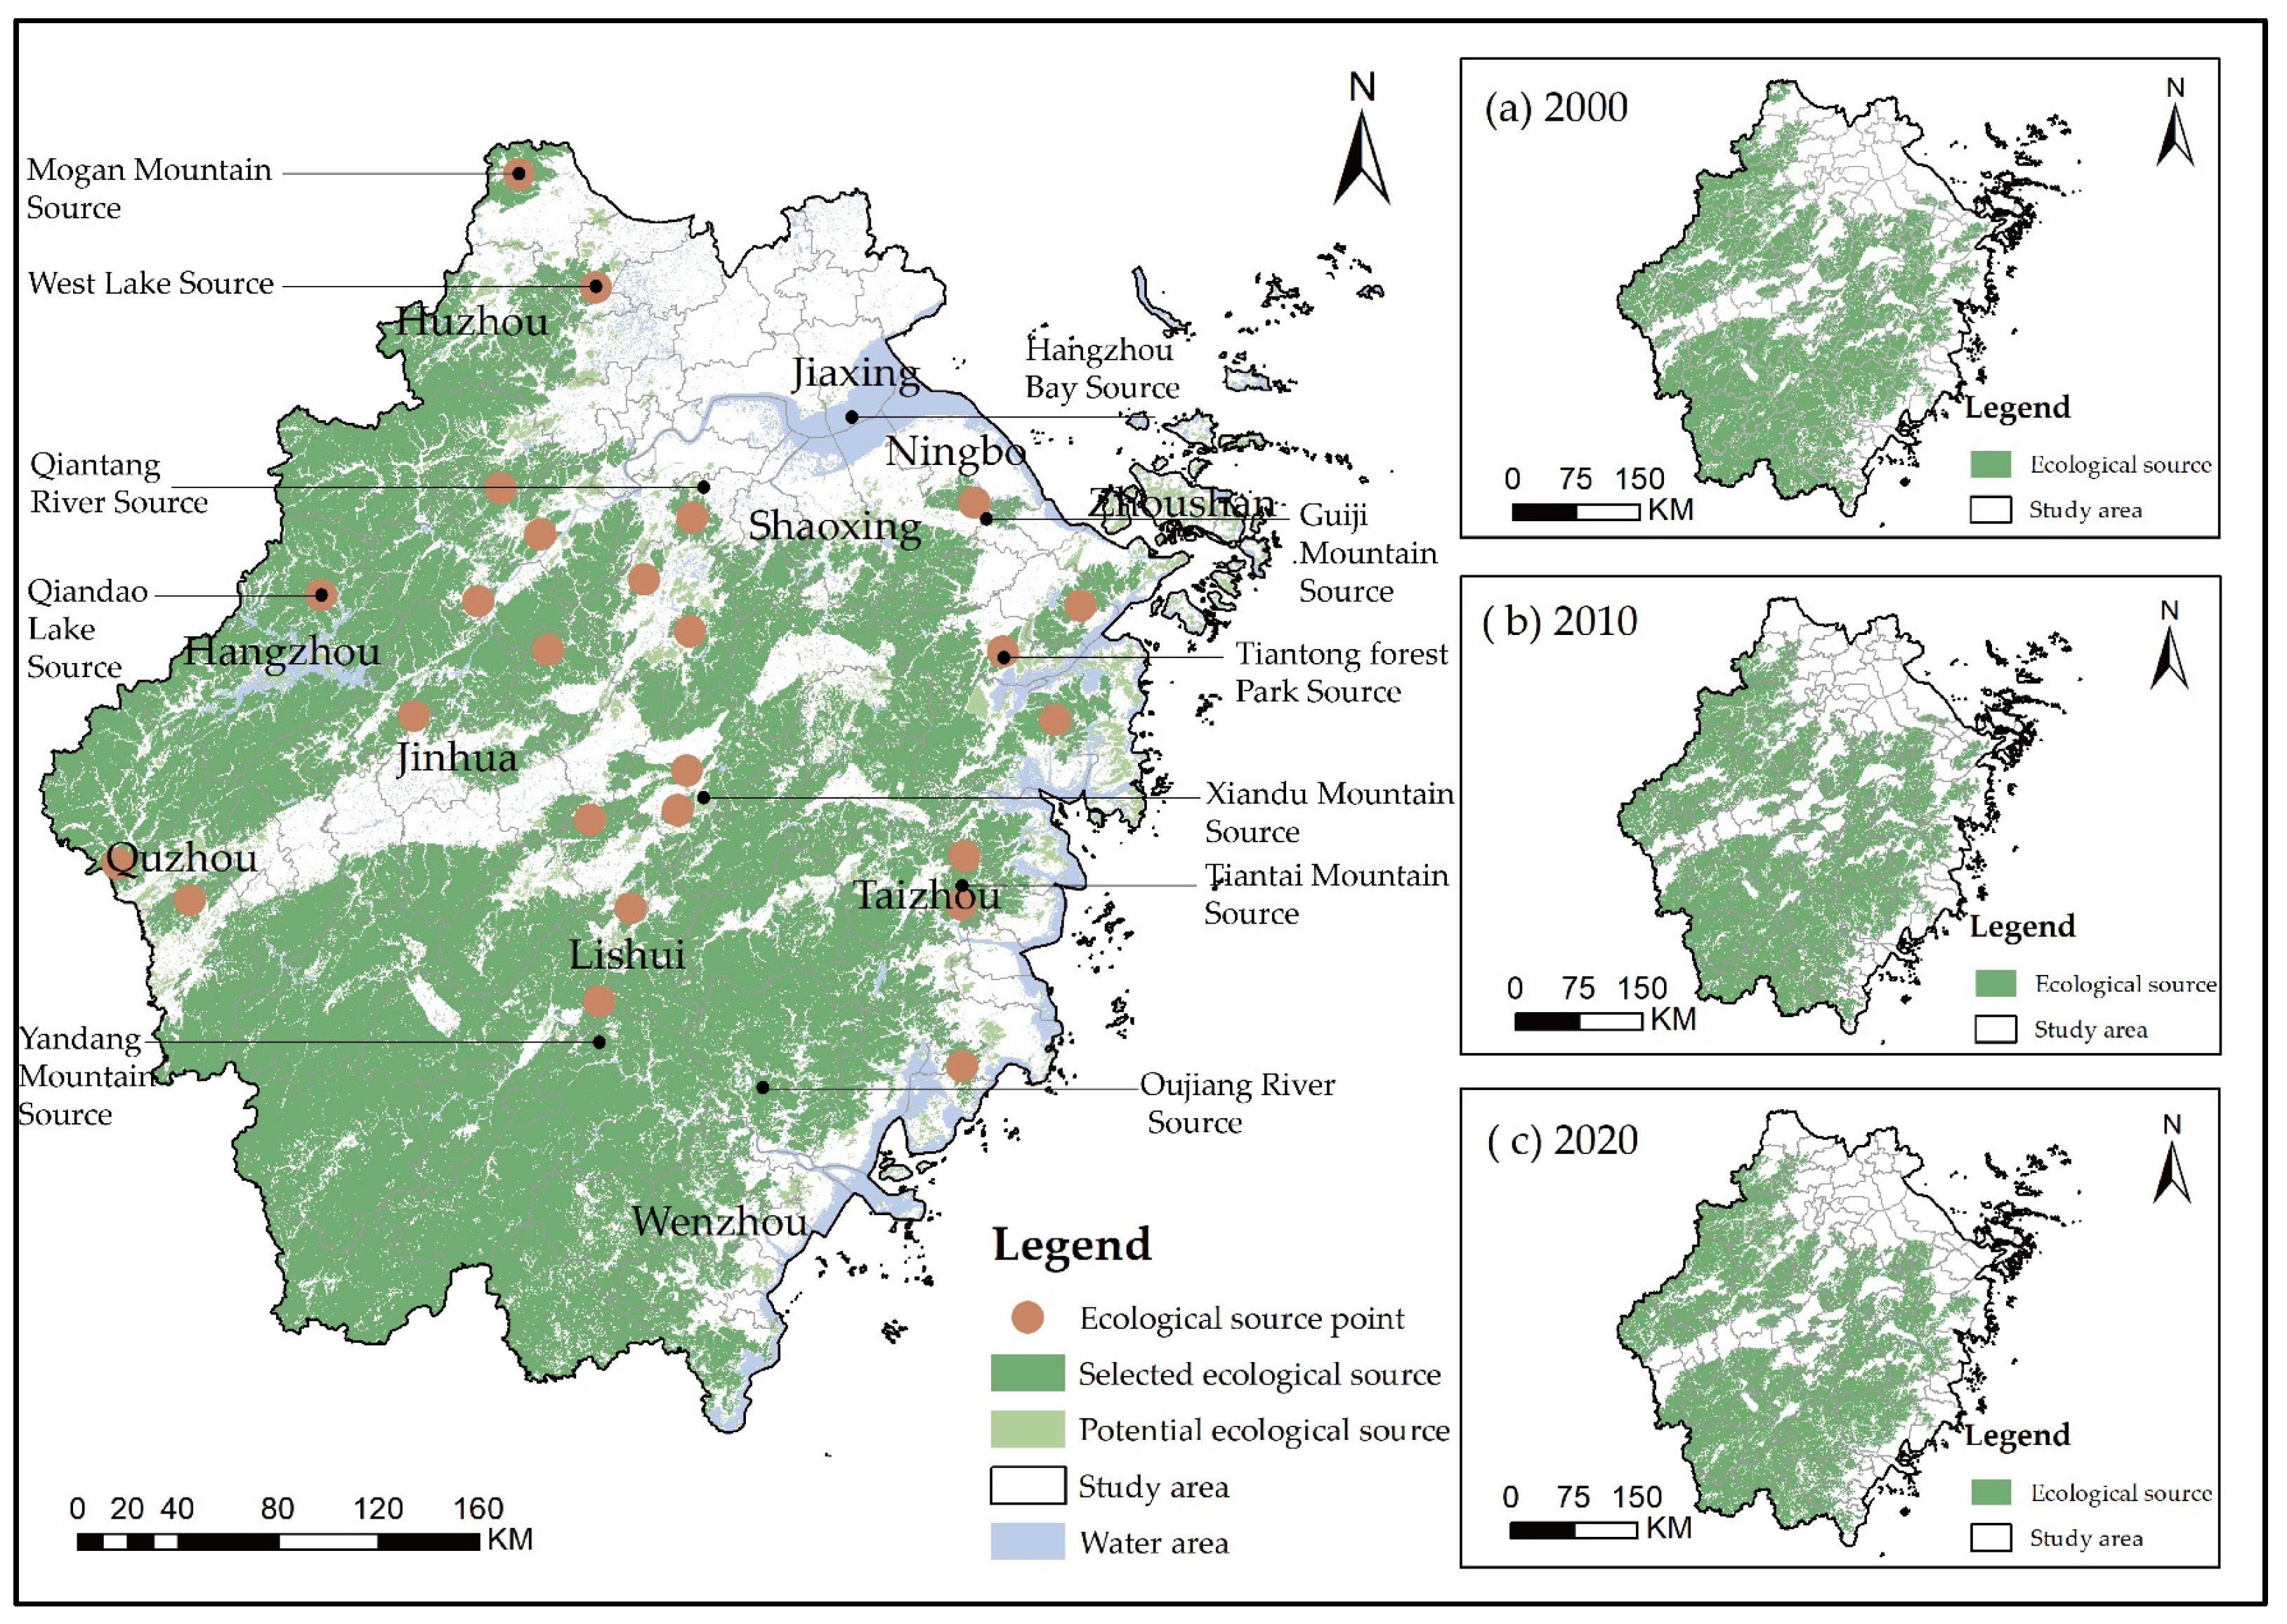
On the basis of the MSPA, core patches exceeding 3 km2 were extracted to calculate the dPC index. The patches with a dPC higher than 0.1 were selected as ecological sources, which were identified for each period, as shown in Figure 6. It can be seen that the majority of ecological sources were located in the south and west of the study area, basically concentrated near mountains and water. The largest ecological source was located near Lishui city, accounting for 48.8% of the research area in 2000, which increased to 49.1% in 2010 and then decreased to 49%. Thirty ecological sources, which had a total area of 102,187 km2 in 2000, were identified; nineteen ecological sources, which had a total area of 102,338 km2 in 2010, were identified; and twenty-four ecological sources, which had a total area of 96,618 km2 in 2020, were identified. Comparing the number of ecological sources constructed from 2000 to 2020, the areas of the ecological sources first increased and then decreased, while their number exhibited the opposite trend. It is indicated by the data that fragmentation and merging of the ecological sources occurred simultaneously. Although several small ecological sources decreased in size and disappeared, they increased in number because of the landscape fragmentation caused by urban construction.

3.4. Dynamics of Overall Connectivity from 2000 to 2020

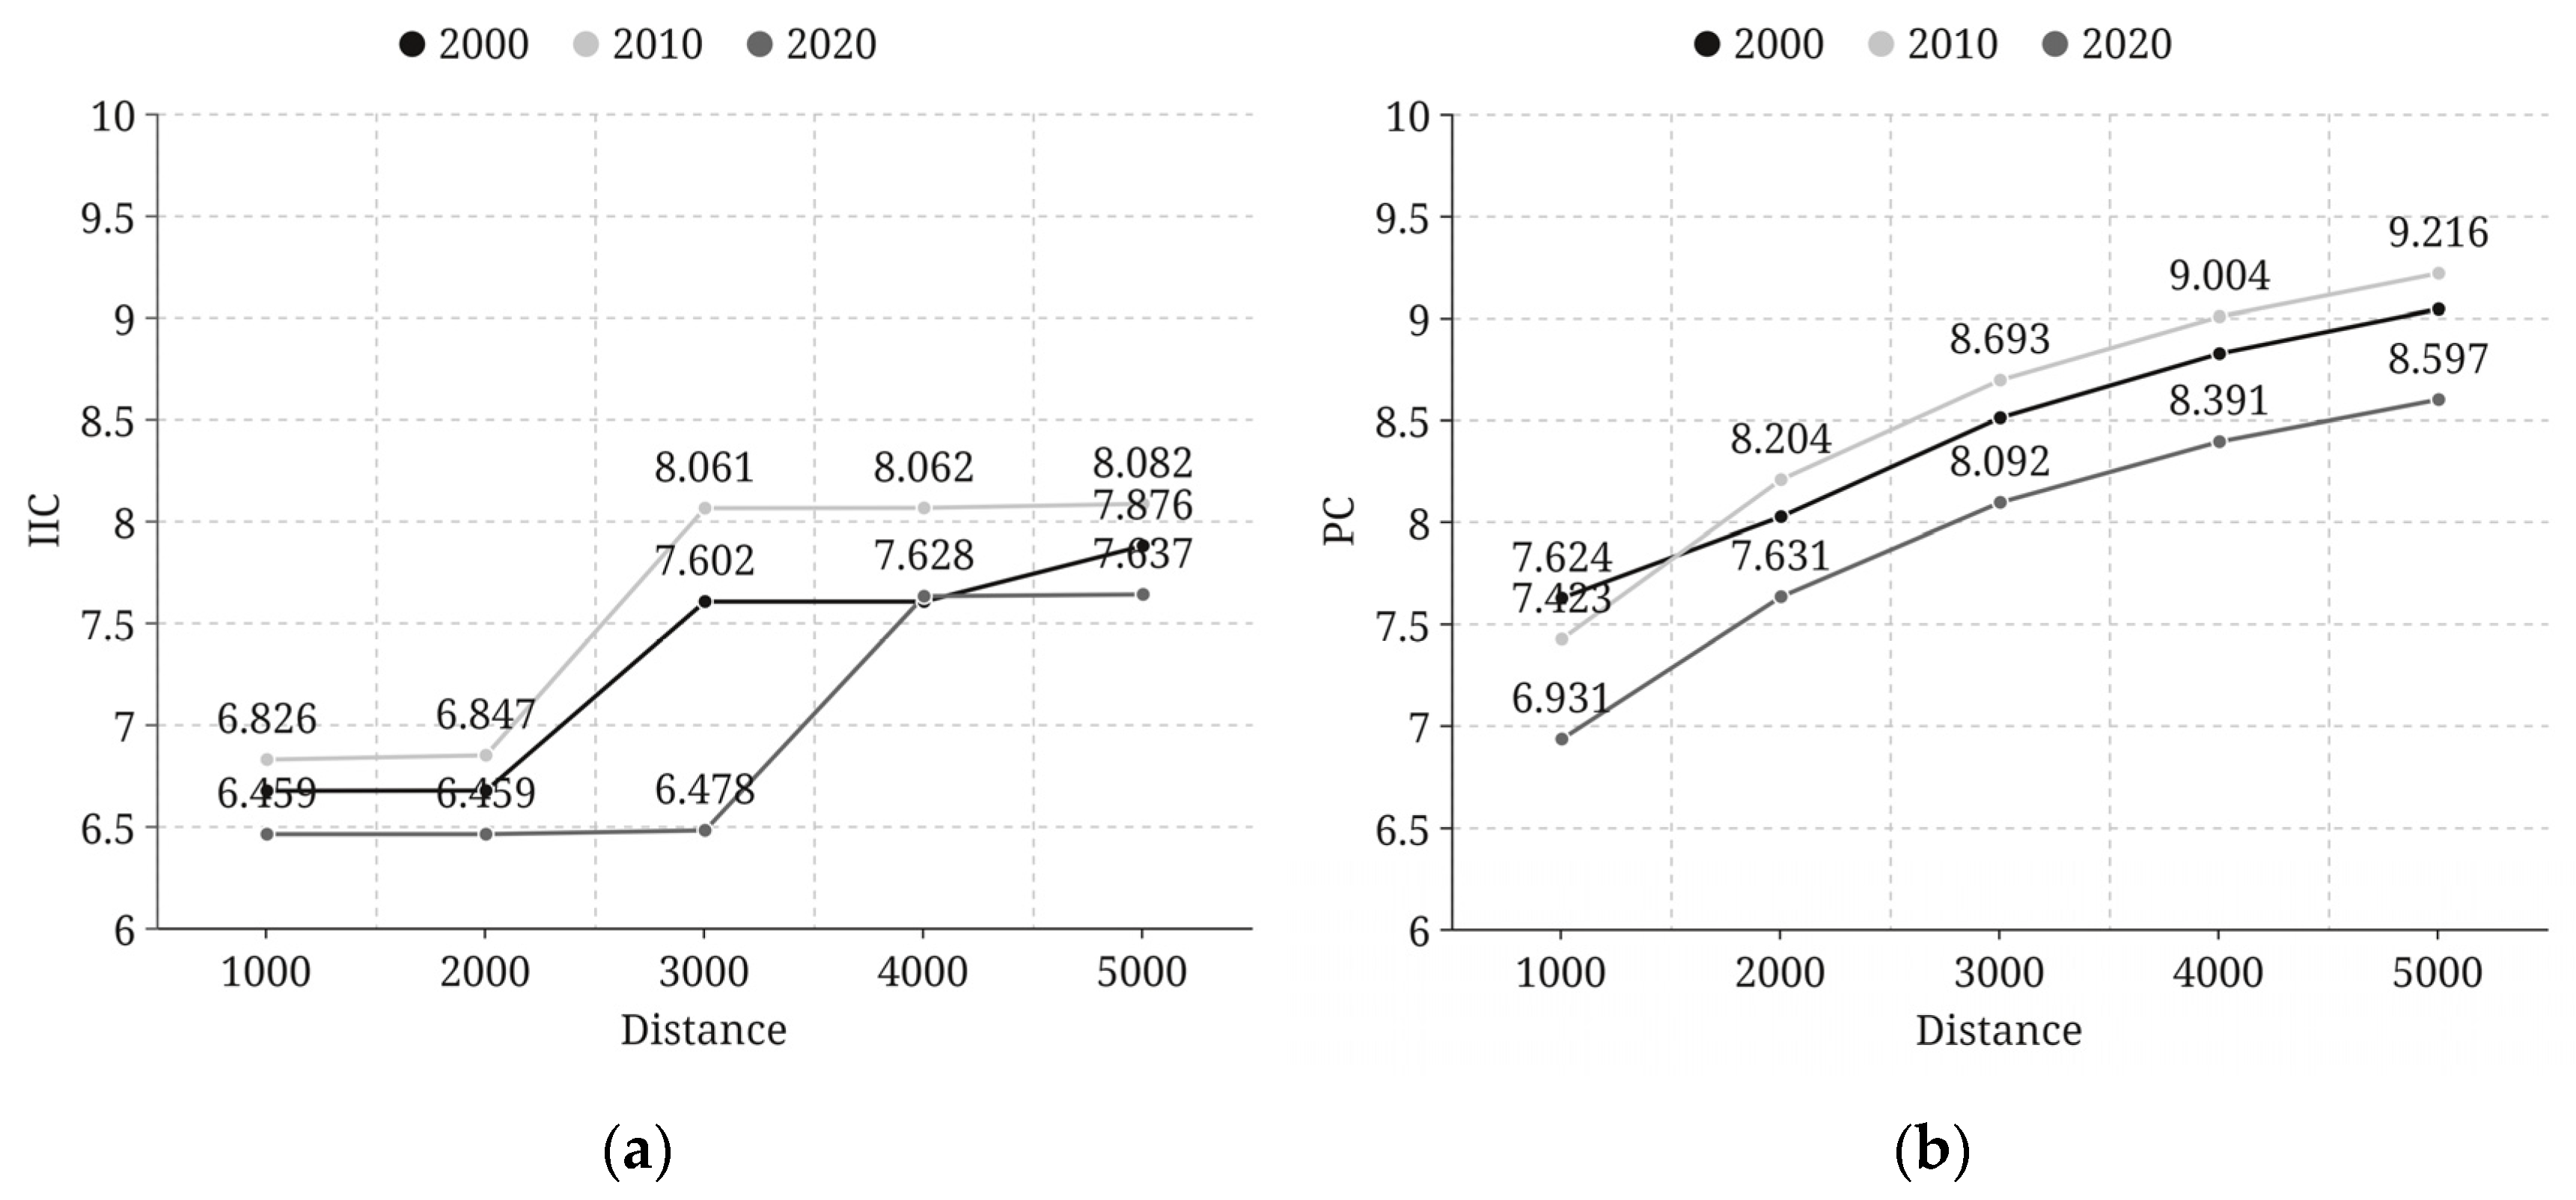
The PC and IIC values were applied to quantitatively assess the overall forest landscape connectivity in the study area. Figure 7 shows several values for IIC and PC at the selected threshold distances of 1000 m, 2000 m, 3000 m, 4000 m, and 5000 m, from which it can be observed that both the values of IIC and PC present general upward trends from 2000 to 2020. This indicates that the IIC values changed over time, with the minimum value observed at a threshold distance of 1000 m in 2020. The highest value of PC was 9.041 in 2000 at a threshold of 5000 m. For the study period, it was observed that the IIC values experienced dramatic growth within the distance of 4000 m in 2020, increasing from 6.428 to 7.628. Generally, the higher the threshold distance, the higher the overall forest landscape connectivity. According to the statistical results, the ecological source areas in 2000, 2010, and 2020 were 102,187 km2, 102,338 km2, and 96,618 km2, respectively. Combining the ecological source areas with the connectivity indicators, it can be inferred that landscape connectivity is closely related to the source area, which means that the larger the source areas, the higher the overall forest landscape connectivity [41,42].

3.5. Temporal and Spatial Changes in Regional Forest Landscape Connectivity

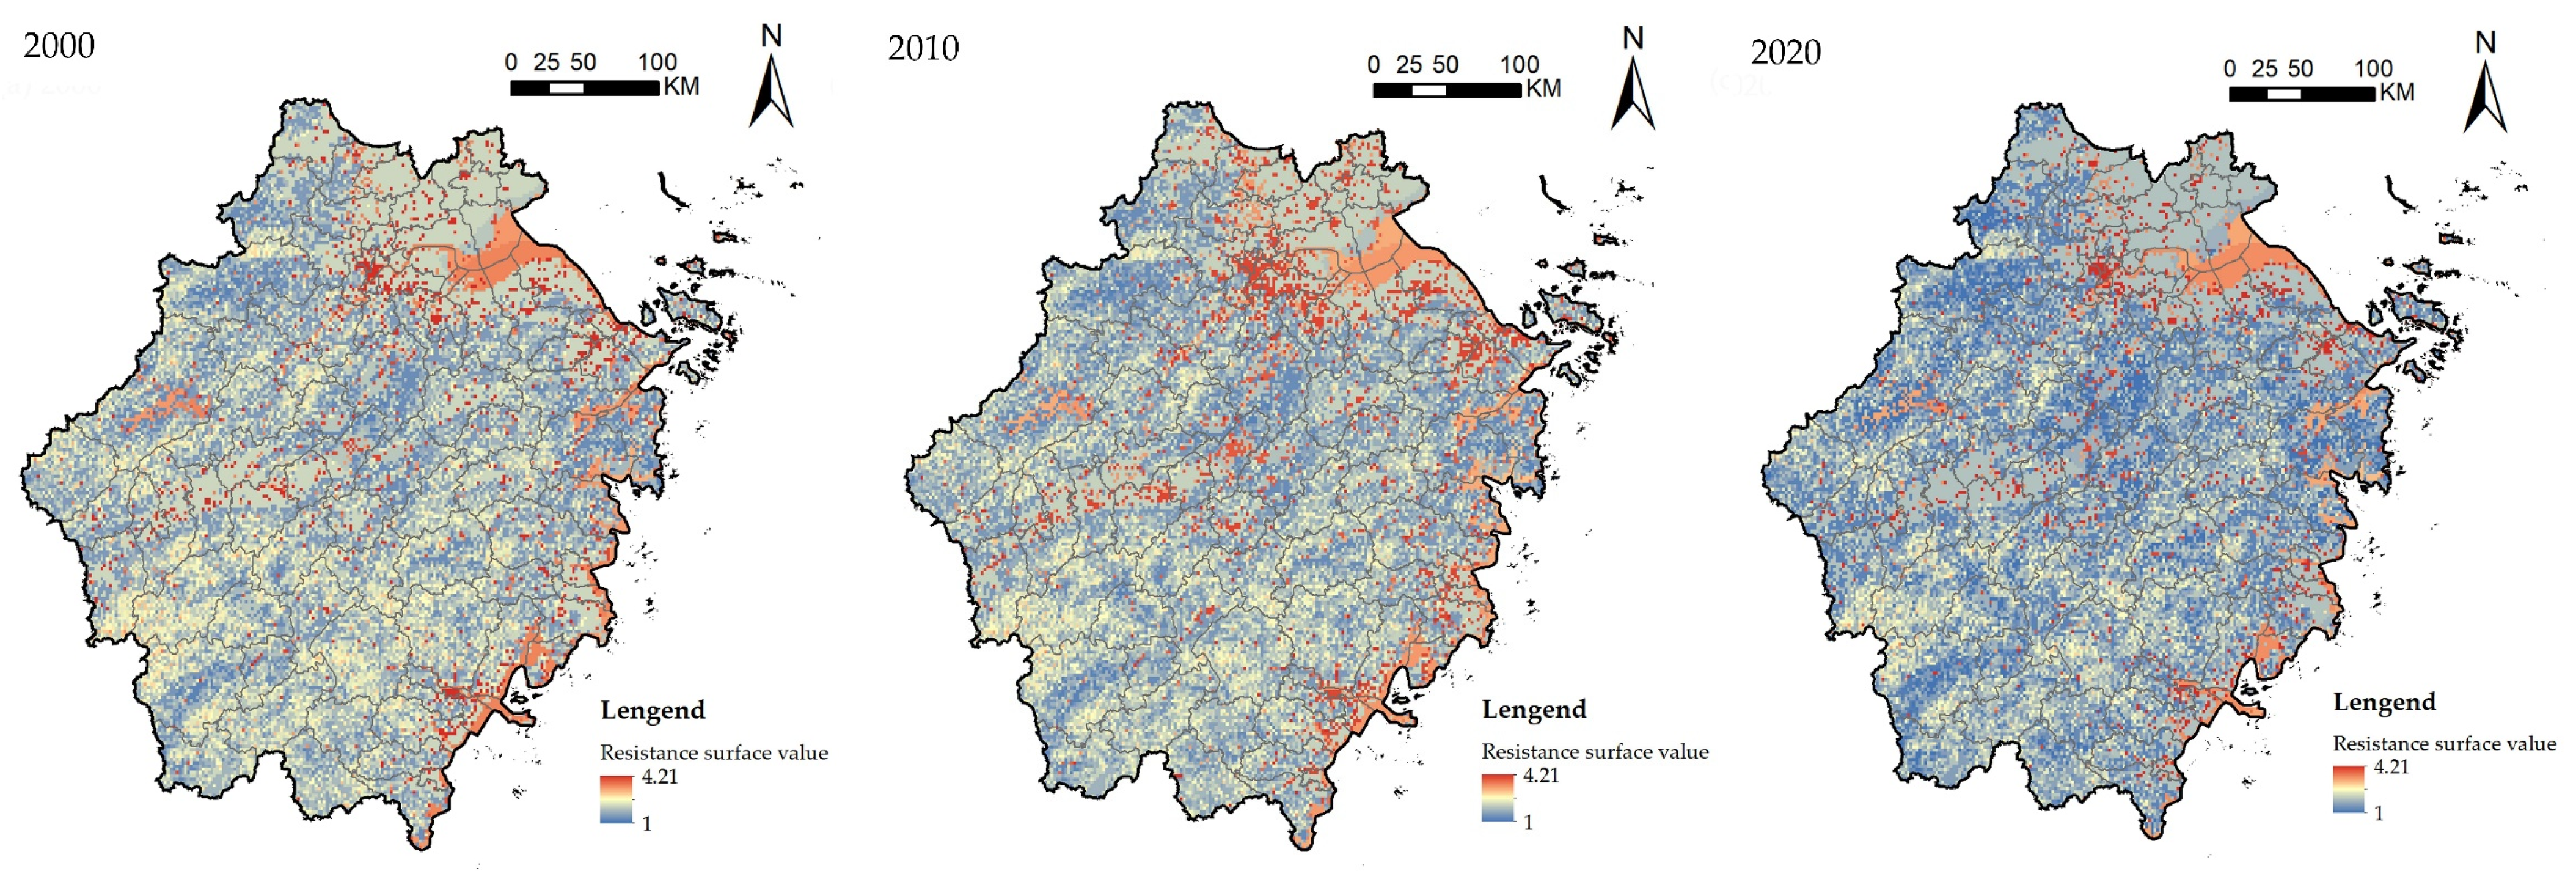
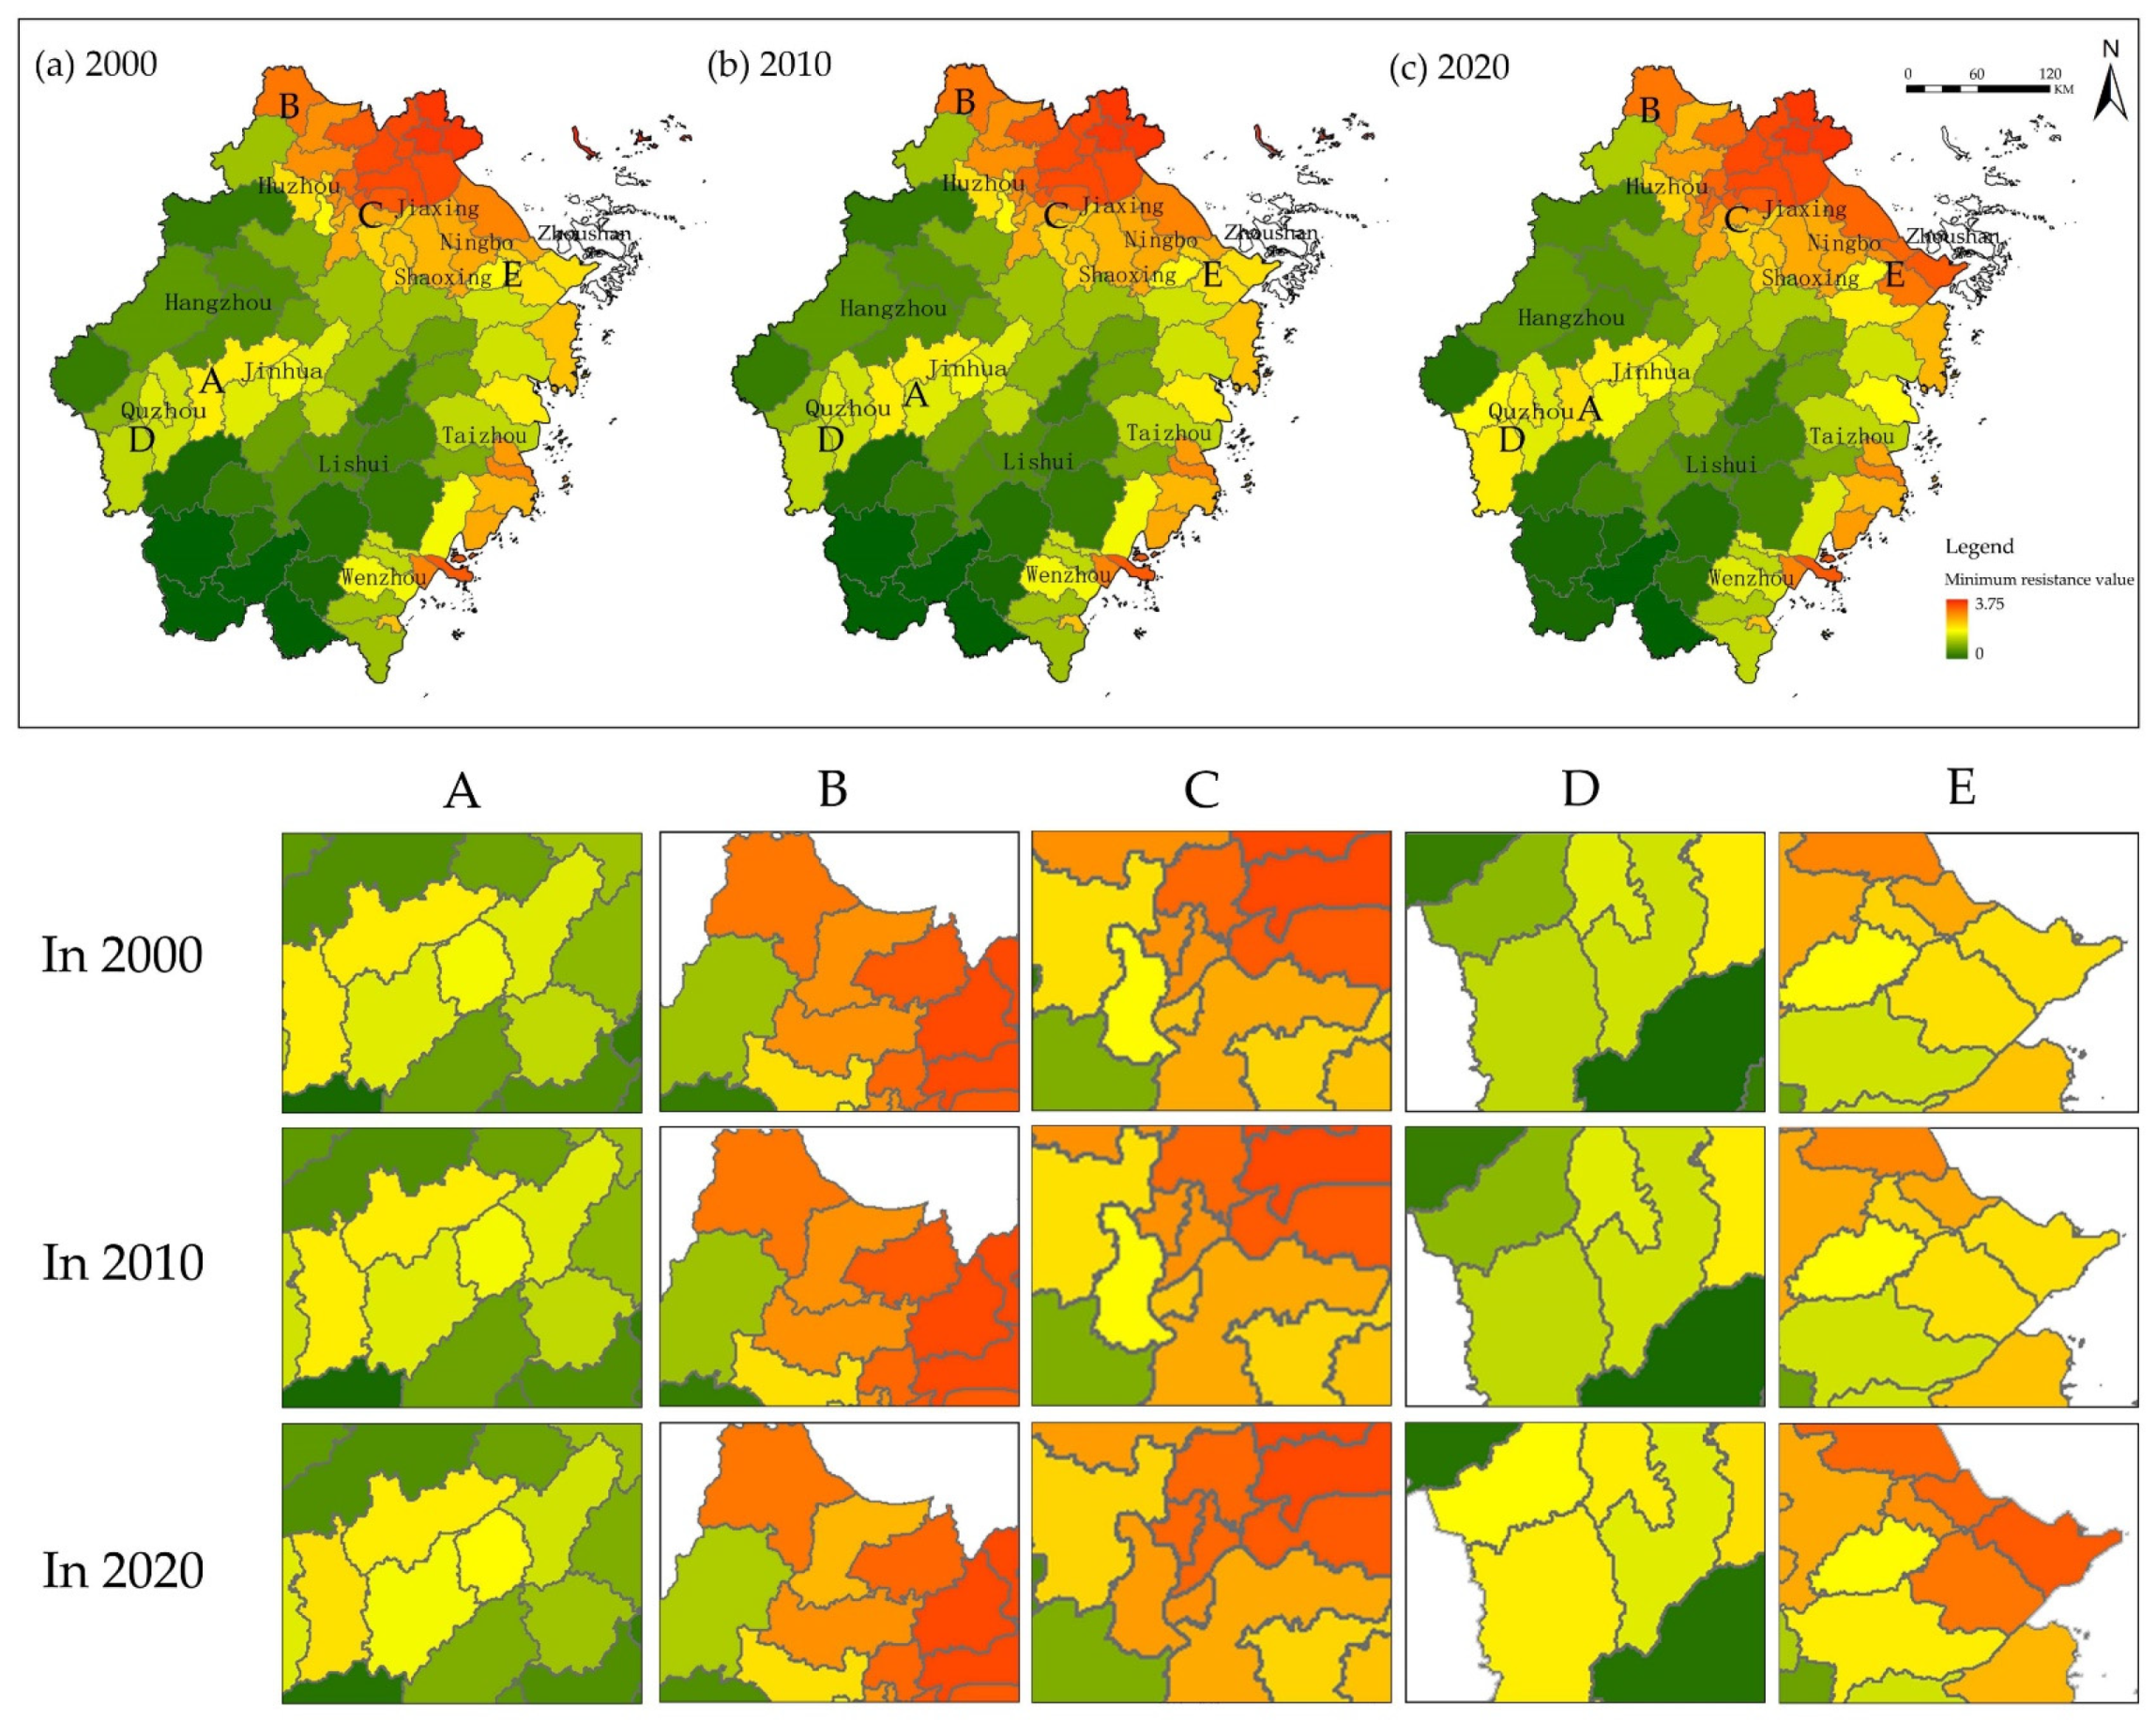
As shown in Figure 8, the resistance value reached its peak in the Hangzhou Bay area in 2010, which is located in the northeast of Zhejiang, whereas in 2020, the overall resistance values in the Hangzhou Bay area and the southwest of Zhejiang decreased. According to Figure 9, the characteristics of the forest landscape connectivity in Zhejiang show that the eastern and northern regions were weaker, whereas the rest were generally stronger from 2000 to 2020. Furthermore, the forest landscape connectivity of most regions showed an obvious downward trend during the study period, especially in 2020.
Regions with low connectivity are distributed mainly in northern areas with intensive human activities. This suggests that urbanization may be fragmenting the ecological land, affecting connectivity. According to Figure 9, taking Area C (Jiaxing city) as an example, the MCR values of the city’s two counties, Jiashan and Pinghu, located in the northeast of the city, were 1.66 and 1.58, respectively, in 2000, and these values kept increasing in later years. During this period, the accelerated urbanization process led to ecological land fragmentation in the county [43]. On the other hand, some central hilly areas of Zhejiang, such as Area D (Quzhou city), had high connectivity. It can be seen in Figure 3 that the area was mainly covered by forest, with complex terrain and weak interference by human activities. However, the MCR value of Area A (Jinhua city) rose over time, especially in the southwest of the city, rising from 0.067 to 0.073, which means the diffusion of ecological flow was seriously hindered. This may be related to Longyou’s tourism development policy and the substantial construction of infrastructure. In summary, the forest landscape connectivity in the central hilly area was higher than that in the surrounding areas, indicating an uneven distribution of forest landscape connectivity throughout the province. The forest landscape connectivity in the northern built-up areas of six districts, three counties, and two cities was generally weak, whereas the forest connectivity in the eastern coastal areas rapidly declined during the study period.

3.6. Ecological Corridor Extraction

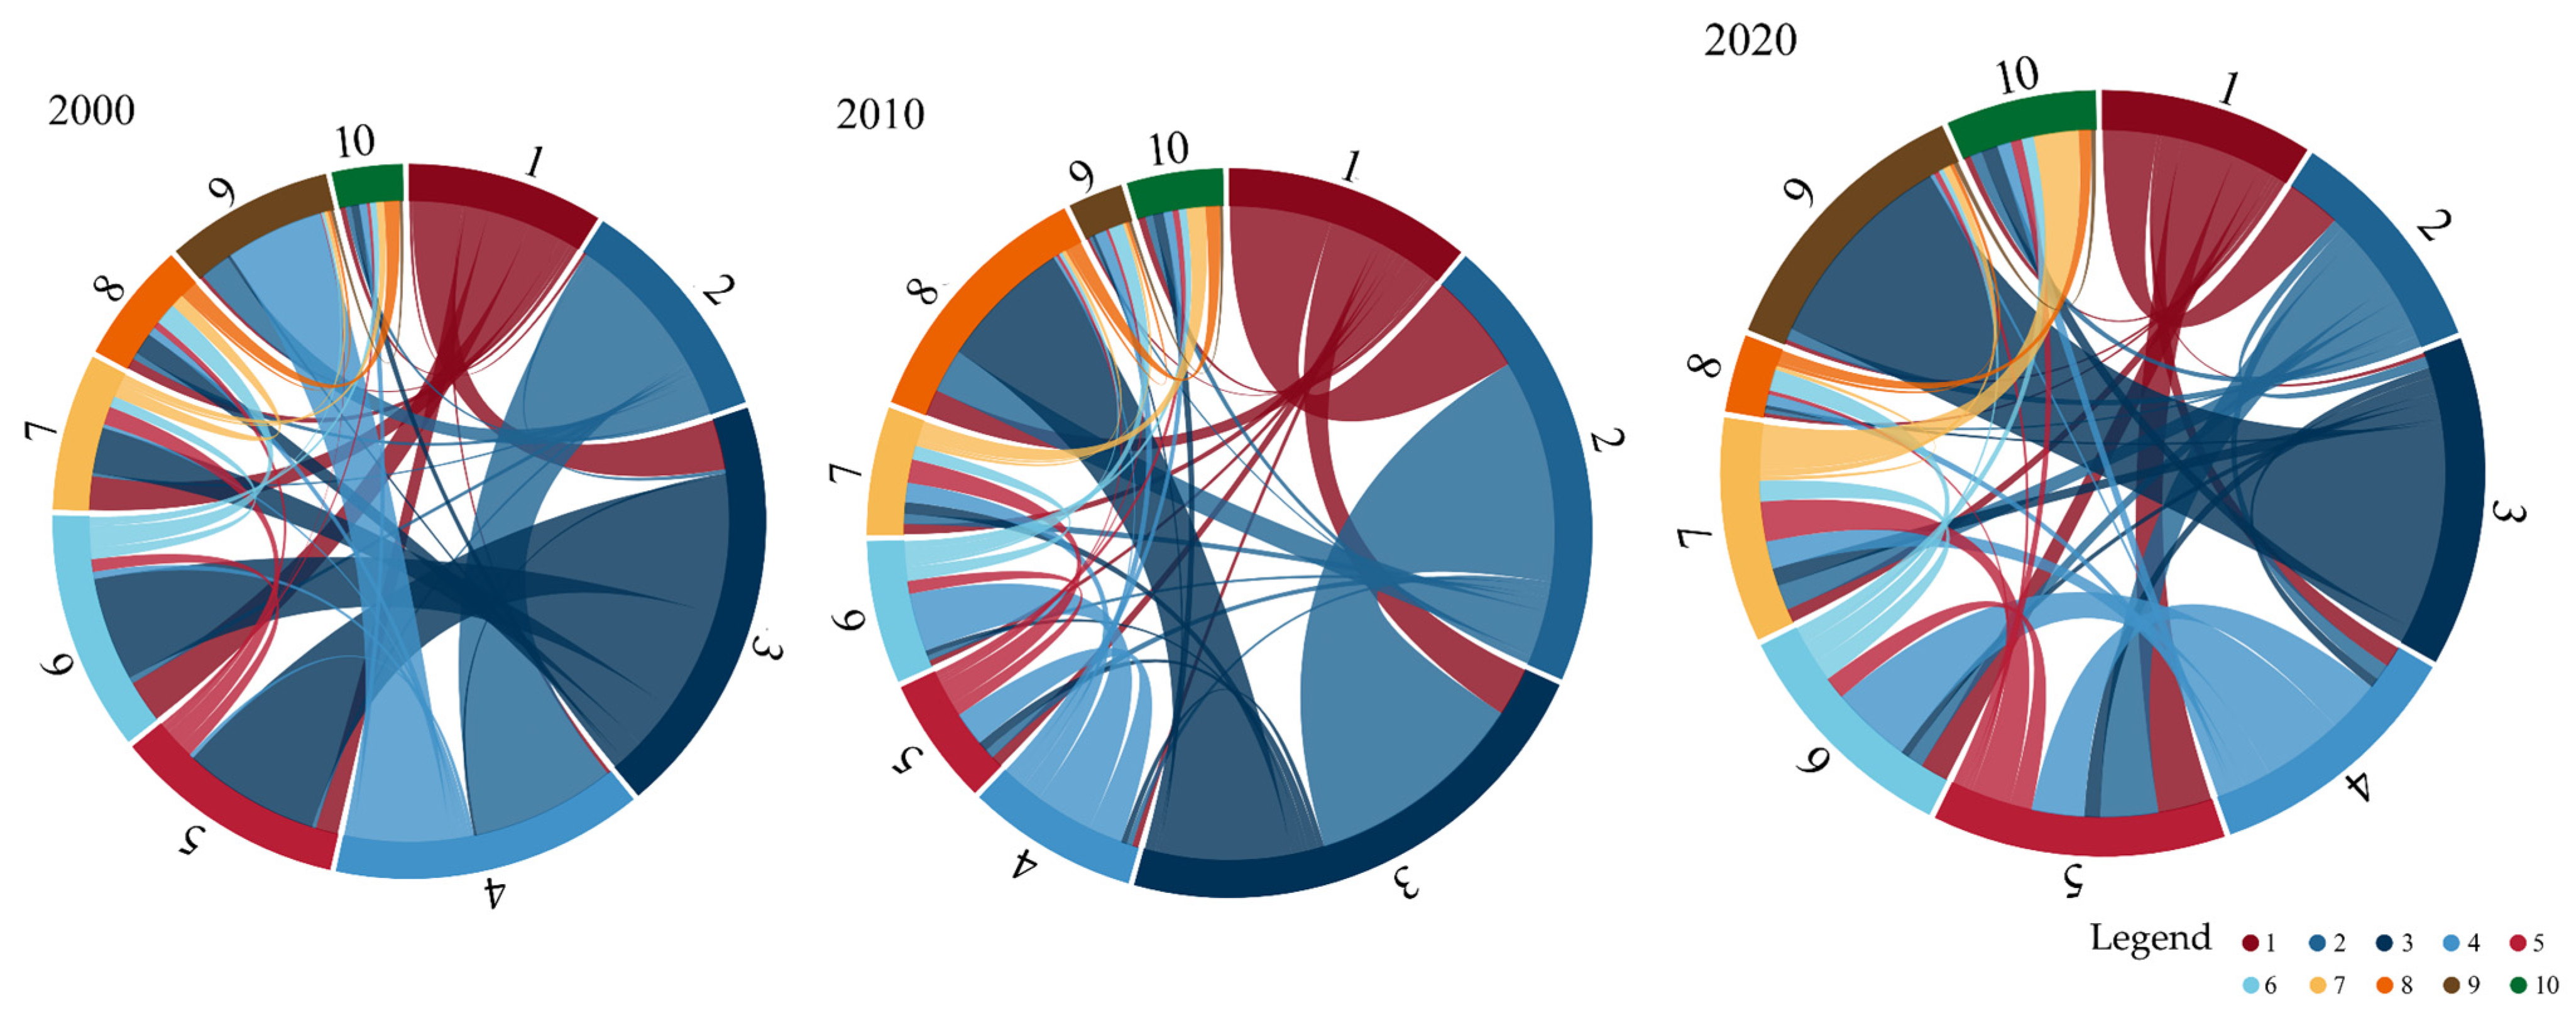
In the preliminary analysis of the ecological network construction in Zhejiang, general and important ecological corridors were extracted using the patch importance index and MCR model. Among 135 ecological corridors, 88 important ecological corridors were extracted with the gravity model and further analyzed. According to the statistics, the numbers of important corridors in 2000, 2010, and 2020 were 27, 31, and 30, respectively. In terms of the spatial distribution, important corridors were mainly located in the West Lake and Qiantang River areas north of Zhejiang in 2000 and 2010. They became more evenly distributed in 2020, revealing a mesh-like structure overall that was dense in the middle and slack in the north. It can also be determined from Figure 10 that in 2000 and 2010, the ecological corridors were mainly linked along the east–west direction, which extended along the Qiandao River, Xiandu Mountain, and Tiantong forest park sources, while the number of north–south corridors was small. This may be attributable to the developed economic zones in the north of Zhejiang, such as Jiaxing city and Ningbo city.
It was also worth noting that in 2010, an important corridor connecting the Ningbo source area to the Zhoushan source area was established, but this corridor disappeared in 2020. The bridge for species migration and energy flow between the southern patches and northern coastal patches was weakened. The disappearance of important corridors over time indicates potential challenges in maintaining species migration connectivity. Additionally, the ecological corridor connecting Quzhou and Lishui underwent continuous growth throughout the study period, accounting for 5.6% of the total corridor length in 2020.
From Figure 10 and Figure 11, the interaction matrix can be used to quantitatively measure the intensity of interpatch connections and then to infer the importance of interpatch corridors to regional ecosystems [44]. For example, among the 27 important corridors in 2000, the interaction between patches 2 and 4 was the strongest, with an ecological gravity up to 7750.337 (Table 6), indicating that the landscape resistance of the ecological corridors between patches was small and the degree of connectivity was high. The interaction between patches 5 and 9 was weak, indicating a low level of connectivity that hinders the migration and diffusion of biological species. Therefore, future planning should focus on optimizing and improving this corridor to enhance its connectivity and habitat suitability.

3.7. Ecological Node Identification

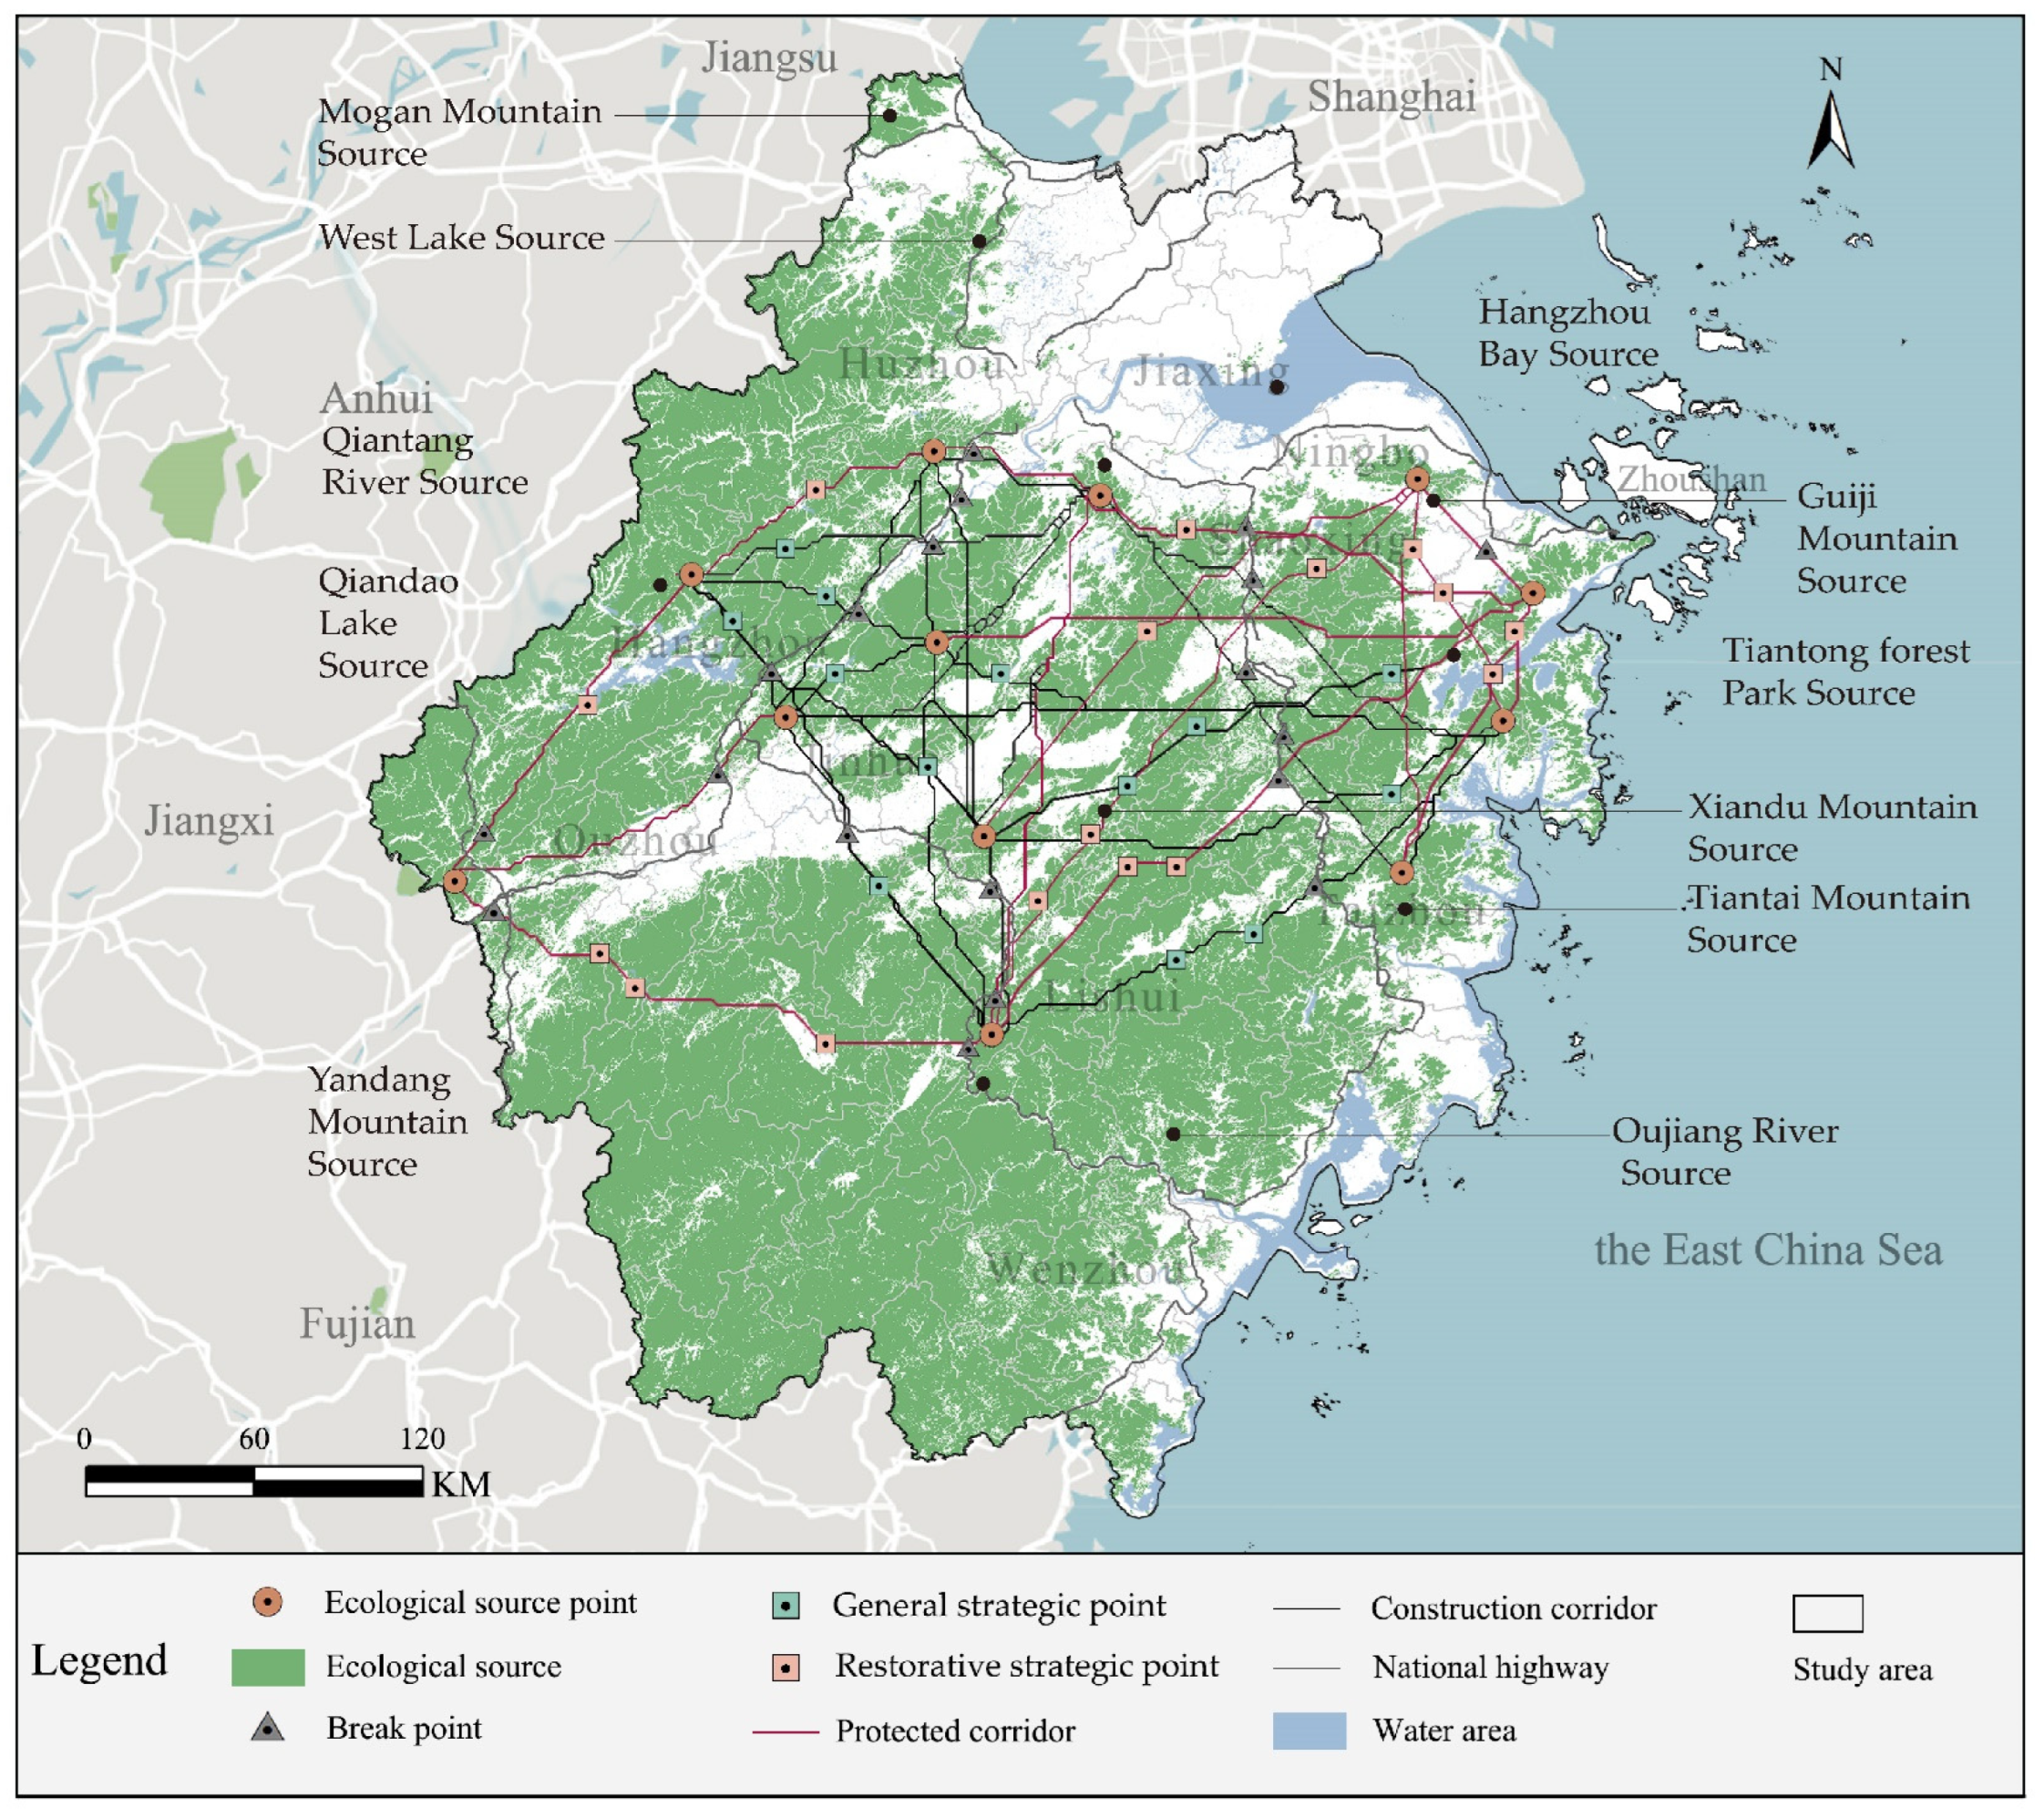
The structures of the ecological corridors changed over time on account of urban spatial expansion and land-use pattern evolution. After comparing and analyzing ecological corridors for the 3 periods, 41 important ecological corridors were chosen for ecological network construction (Figure 12). They demonstrated a network pattern of being slack in the north and dense in the middle. These corridors were further divided into protected corridors and construction corridors [45]. There were 25 stable corridors from 2000 to 2020, which are called construction corridors and can serve as the cornerstone of the ecological network. However, 16 important corridors disappeared over time, called protected corridors, and these were mainly distributed in areas with flat terrain and developed cities, like Jiaxing and Ningbo. These corridors played essential roles in ecological restoration and landscape circulation and flow in the study area [46].
According to the selected corridors, 51 ecological nodes were identified, among which 31 were strategic nodes and 20 were breakpoints [45,46]. Strategic nodes function as steppingstones for network connection and species migration. They are primarily found in regions of ecological significance, such as Tiantong Forest Park, Qiandao Lake, and West Lake. They connect the three water sources of Qujiang River, Fuchun River, and Lanjiang River, which supply water for Qiandao Lake during the dry season. However, the changing structures of the ecological corridors because of urban expansion and land-use evolution pose a challenge to the stability of these nodes. The strategic nodes located along the construction corridors were general strategic points. The potential strategic points were concentrated mainly in the eastern regions of Zhejiang in Hangzhou Bay District, where Ningbo city and other developed port cities are located.

3.8. Ecological Network Construction

On the basis of the current layout of the natural mountains, forests, and ecological elements in the research area, an ecological network pattern of Zhejiang province, with two barriers, three cores, multiple corridors, and multiple points was constructed (Figure 13). The two barriers refer to the coastal ecological barrier formed along the coastline of eastern Zhejiang and the mountain ecological barrier formed by several mountain ranges in western and southern Zhejiang, which mainly function as landscape and ecological protection. The three cores refer to Qiantang River, Qiandao Lake, and Oujiang River, which spread out, linking ecological sources, and constitute three ecological zones, called the Qiantang River Ecological Zone, the Ring around Qiandao Lake Ecological Zone, and the Oujiang River Ecological Zone. In addition, multiple corridors refer to the linear connection of 41 selected ecological corridors.
Considering the interaction and distance factors between ecological sources, it is suggested to strengthen the construction of biological corridors, such as for patches 5–9, 8–9, and 3–4, making full use of corridors as linear environments and bonded effective connections between the regions from inside to outside. Multiple points were the sum of general strategic points and restorative strategic points. They functioned as important sites for determining the persistence of biodiversity. According to the network ecological evaluation, the constructed values of the α, β, and γ indexes in the study were 0.21, 1.38, and 0.45, respectively. These values were optimized to 0.03, 0.12, and 0.05, respectively, in comparison to the ecological network’s evaluation outcomes in 2020.

4. Discussion

4.1. Advantages and Comparison of Forest Landscape Connectivity Evaluation

Evaluating the evolution of the forest landscape connectivity from a spatiotemporal perspective plays an important role in alleviating excessive human disturbance, expanding the ecological source area, and enhancing the overall habitat quality in Zhejiang [47]. Forest landscape connectivity improvement is of great significance for maintaining biodiversity. By evaluating forest landscape connectivity, key biological habitats can be identified, providing a basis for biodiversity conservation. This study suggests that forest landscape resources in Zhejiang are distributed unevenly, as they are primarily concentrated in the southwest nature reserves. These reserves serve as core foundations for maintaining ecosystem stability. Considering both the patch area and the landscape area between patches, a comprehensive analysis of forest landscape changes was conducted. It is proposed to regard the eastern coastline and central and western mountain ranges as ecological barriers. The Qiantang River, Qiandao Lake, and Oujiang River can be regarded as ecological cores. An optimized ecological network with multiple corridors and points can be constructed. The network structure enhances the connectivity and ecological service capacity of the north and south regions by integrating existing core ecological resources, such as Tiantong Forest Park and Qiantang River. As a result, a more comprehensive ecological network is formed. Furthermore, suggestions for preservation and restoration have been proposed based on the zoning to achieve the overall stability of the ecological environment in Zhejiang [48]. On the premise of conforming to natural laws, work focused on ecological restoration and supplemented by appropriate interventions was actively carried out, which is more in line with the concept of ecological civilization construction. According to the Department of Forestry of Zhejiang Province, the expected ecological areas for protection and construction will be approximately 3000 km and 1000 square kilometers in 2025 [49]. It is anticipated that this concerted effort will lead to a transformative shift within the ecosystem, ensuring its long-term sustainability.
Urban expansion poses a significant threat, which has been a trend globally. According to the literature, most countries in the world have experienced urbanization with the rapid development of their economies and societies [50]. From the perspective of landscape ecology, urbanization is a process by which landscape processes are affected and altered. In this case, to enhance ecosystem functions through urbanization, an ecological network that enhances ecosystem functions by promoting forest landscape connectivity can be established, such as in South Korea’s Demilitarized Zone [51]. In the Scandinavian Mountains Green Belt, the reduction in forest connectivity and changes in ecological corridors caused by the expansion of land for urban construction were analyzed through model assignment [52]. The findings of this study on forest landscape connectivity in Zhejiang province can offer theoretical guidance for optimizing the ecological network system and planning ecological infrastructure in similar regions.
Moreover, a comparative analysis of the ecological connectivity in different regions was conducted, specifically focusing on the Guiyang, Zhuzhou, and Zhejiang provinces. By examining the ecological network connectivity, distinct variations among these three areas can be identified and their respective impacts on ecosystem service functions assessed. As a typical karst mountain city, Guiyang has poor ecological network connectivity, fewer corridors, and a more fragmented distribution. Because of the complex topography, high degree of fragmentation of ecological space, and poor connectivity of the ecological network, the construction and protection of ecological corridors should be strengthened in karst mountain cities [53]. Zhuzhou city, as a typical plains city, has good ecological network connectivity and a large number of corridors, with most of them distributed in the shape of networks. However, it is still necessary to pay attention to the integrity of the ecological network and to avoid the fragmentation of ecological space. Because of the special topographies of coastal cities, the construction of an ecological network needs to consider both land and sea in the overall planning to develop an integrated ecological network system [10]. In comparison with such a city type, the topography of Zhejiang province is characterized by a diverse landscape, encompassing both mountainous regions and expansive plains. The ecological network connectivity is generally good, and the number of corridors is large, with most being distributed in a grid pattern. This may be related to the awareness of ecological protection and policy support in Zhejiang province, which has formed a complete ecological network system conducive to the maintenance of biodiversity and ecosystem functions. In conclusion, the connectivity of different types of urban ecological networks can be investigated further in future studies, exploring the variations and influencing factors. Moreover, targeted optimization strategies can be proposed to provide a scientific basis for the development of urban ecological civilization.

4.2. Preservation and Restoration of Ecological Sources and Corridors

Considering forest landscape connectivity, key source areas that act as ecological anchors have been identified and prioritized for conservation efforts. This is crucial for maintaining the overall forest landscape connectivity in Zhejiang province. However, the rapidly evolving socioeconomic context and the uncertainties posed by climate change necessitate a dynamic and adaptive approach to conservation.
To enhance the resilience of ecological networks, several strategies can be implemented. Firstly, climate change adaptation is essential, as shifts in species distributions and habitat suitability could disrupt existing connectivity patterns. Assisted migration and habitat restoration can enhance species resilience, and incorporating climate projections into conservation planning helps anticipate future changes and inform adaptive management strategies [54]. Secondly, land-use policies and regulations should also prioritize connectivity conservation and prevent habitat fragmentation. Balancing economic development with ecological conservation is crucial for long-term sustainability. Sustainable development strategies should prioritize ecosystem services and biodiversity conservation while also promoting community well-being and economic prosperity through green economy initiatives and ecotourism development. Thirdly, community engagement and collaboration are vital for conservation success. Community-based initiatives, public education programs, and stakeholder collaboration platforms enhance community awareness and ownership of conservation goals, leading to more effective and sustainable outcomes. By implementing these strategies, Zhejiang province can develop a dynamic and adaptive approach to forest landscape connectivity conservation, ensuring the long-term health and resilience of its ecosystems.
Protecting forest landscape sources and corridors is crucial for maintaining the overall forest landscape connectivity. Firstly, ecological nodes covered with large areas of forests, such as the Siming Mountain Range in Shaoxing city, the Yandang Mountain Scenic Spot in Wenzhou city, and the southwestern hills of Lishui city, bear important structural functions and should be given special management and protection. Secondly, the Qiantang River, Qiandao Lake, Oujiang River, and other lakes with high ecological values and considerable stability, as well as the eastern coastal wetlands with a number of nature reserves, should be continuously protected from water pollution by implementing aquacultural restrictions, conservation areas, and other protective measures Thirdly, some nodes, such as Mogan Mountain, Guiji Mountain, and other small nodes, are located near towns and are susceptible to urban expansion. Under these conditions, the ecological and urban spatial boundaries are supposed to be strictly defined to strengthen the protection of node integrity and corridor connectivity [55]. Within a certain range, activities that destroy the integrity of nodes and reduce ecological connectivity, such as mine development, forest logging, and reclamation areas, should be firmly restricted. Finally, other general nodes should be protected in accordance with the relevant ecological requirements [56].
From the perspective of the ecological network patterns, there exists a significant interaction force between the eastern coastal plains of Zhejiang and the central ecological network, whereas the northern ecological network exhibited a lower level of complexity. The implementation of new ecological nodes is recommended to enhance the linkages among regional ecological networks and to optimize the overall ecological network. For example, core patches of more than 50 hectares were selected as potential nodes, including Jinyun county in the northeast of Lishui city, Tiantai county in the northwest of Taizhou city, and Xinchang county in the southeast of Shaoxing city, to increase the connection between the east coast of Zhejiang province and the central network. A node was selected in Quzhou city to increase the connection between the western network and the central network. Although the above four nodes are located in ecological networks with weak connections and sparse ecological corridors, their quality is high. Core patch sizes can be expanded by afforestation, and new ecological nodes can be formed with the construction of ecological parks. In addition, for the purposes of maintaining the integrity of an ecological network and enhancing the forest landscape connectivity, it is necessary to preserve and dredge key areas of the ecological corridor [57]. Combing ecological corridors and the ecological network according to the temporal–spatial distributions, the suggestions are as follows: (1) In the whole Qiandao Lake region, Qiandao Lake is the most important ecological source, providing vital migration corridors for creatures and habitats for birds. Because of the booming tourism industry and the large scale of impervious land around Qiandao Lake, it has a higher ecological resistance value compared to surrounding regions. In the demarcation of the boundaries of land for construction, spaces reserved for transit via ecological corridors should be included, and firm restrictions should be imposed on construction activities. (2) As the largest river in Zhejiang province, the shoreline of the Qiantang River should be systematically restored. From 2000 to 2020, the ecological resistance value and overall connectivity decreased continuously. Most strategic points and breakpoints of the Qiantang River are distributed in the gaps between towns along the river. Limiting construction activities in these areas should be accompanied by restrictions on activities that enhance ecological resistance, such as reclamation and aquaculture, to ensure the maintenance of connectivity between the central and eastern ecological networks.

4.3. Limitations and Future Directions of the Study

This study formed a set of analytical frameworks of “source recognition–connectivity change–node recognition–network construction” for assessing ecological spatial connectivity [58]. It was applied to investigate ecological spatial connectivity in Zhejiang province. The research results can better characterize the potential connections of the provincial ecological space, identify key ecological points, and provide a basis for the maintenance of ecological security patterns in Zhejiang [59]. However, the MSPA method used in this study is greatly affected by the accuracy of the data, and there are some limitations. In the present study, resistance width was used to characterize potential ecological corridors; however, if a single specific species needs to be protected, the physical width of its migration corridor needs to be further studied [60]. In a follow-up study, the research scope can be narrowed and the precision improved [61]. In addition, it should be noted that although the MCR constructs the least-cost path, this is based on idealized situations. The actual movement of species may change because of the influence of a community’s form or interactions with other species. To further reveal the forest landscape connectivity in Zhejiang province, the research scope should be expanded. The theory of forest landscapes should be enriched to provide the theoretical basis for biodiversity protection and ecological restoration [62].

5. Conclusions

Our study provides a comprehensive method for the analysis of forest landscape connectivity in Zhejiang province. On the basis of an MSPA and connectivity analysis, in combination with environmental data on Zhejiang province, we compared the quantity and characteristics of the forest landscape connectivity in Zhejiang. Data from 2000, 2010, and 2020 were chosen to analyze the landscape patterns. The forest landscape connectivity, from the individual level to the whole, was also discussed. This study’s findings are largely consistent with the future territorial planning for Zhejiang. It helps provide valuable guidance to enhance the current environmental situation and to expedite comprehensive and collaborative development in the Yangtze River Delta. Enhancing forest landscape connectivity is a key strategy for restoring and maintaining environmental conditions, as well as an essential approach for safeguarding the integrity of ecological and biological diversities.
On the basis of the research results, the following conclusions were obtained:
(1)
As a mountainous province with multiple topographies, Zhejiang has the largest area of forests. From 2000 to 2020, the proportion of forest land area first decreased and then increased, and the proportion of impervious land peaked in 2010, falling to 3.49%. Overall, except for cropland, water, and impervious land, the areas of the types of land remained the same or increased, which indicates that Zhejiang’s adherence to comprehensive ecological and environmental management has been fruitful. With impervious land and cropland mostly converted to forest, the ecological land fragmentation in each administrative region of Zhejiang province presented a dynamic change.
(2)
Seventy-three ecological sources were selected, the majority of which are distributed in the south and west of the study area, concentrated near mountains and rivers. The landscape fragmentation increased as cities grew, dividing the core areas of peripheral urban regions. It is necessary to strengthen the connection between nodes in the ecological source area and the surrounding small core patches by returning farmlands to forests and grasslands, as well as by constructing ecological parks in areas where node patches can be expanded. At the same time, the stability of regional ecological nodes and the connectivity of ecological networks can be improved.
(3)
We detected an uneven distribution of forest landscape connectivity throughout the province. High resistance values were primarily spread in areas of accumulated land for urban construction, whereas in the southwest of Zhejiang province, forests and water areas are the primary habitats for low resistance values. The follow-up ecological construction needs to focus on the ecological security of high-value areas to increase habitat suitability and landscape connectivity, further developing the ideal ecological network.
(4)
Forty-one ecological corridors and fifty-one ecological nodes compose the ecological network, including two barriers, three cores, multiple corridors, and multiple points. Through the optimization of the ecological network, the ecological flow of each corridor in Zhejiang can be improved. Developing and protecting ecological corridors organically connects the ecological source patches. It is recommended to promote the protection and restoration of water bodies and forest lands and then to identify key areas for integrated river basin management and land and forest quality improvements to increase the ecological quality. Furthermore, strengthening the ecological protection of nature reserves, such as Tiantong Forest Park and Qiandao Lake National Forest Park, can create strong forest protection and restoration barriers and improve the function of ecological sources.
On the basis of the above analysis, it is possible to effectively protect and restore the ecological system, species habitats, and significant landscapes of city groups by establishing a multifaceted urban ecological network system in Zhejiang province that transcends administrative divisions. This endeavor holds profound implications for guiding the direction of urban ecosystem protection and restoration.

Author Contributions

Conceptualization, B.W.; methodology, Y.B.; software, Y.B.; validation, B.W.; formal analysis, J.Z.; investigation, X.L.; resources, X.L.; data curation, H.S.; writing—original draft preparation, H.S.; writing—review and editing, B.W.; supervision, B.W. All authors have read and agreed to the published version of the manuscript.

Funding

This research was funded by The National Natural Science Foundation of China (grant number: 72003090); the General Project of Philosophy and Social Science Research in Universities of Jiangsu Province (grant number: 2023SJYB0149); and the Jiangsu Students’ Innovation and Entrepreneurship Training Program (grant number: 202310298047Z).

Institutional Review Board Statement

Not applicable.

Informed Consent Statement

Not applicable.

Data Availability Statement

The data presented in this study are available upon request from the corresponding authors.

Conflicts of Interest

The authors declare no conflicts of interest.

References

  1. Chen, X.; Kang, B.; Li, M.; Du, Z.; Zhang, L.; Li, H. Identification of priority areas for territorial ecological conservation and restoration based on ecological networks: A case study of Tianjin City, China. Ecol. Indic. 2023, 146, 109809. [Google Scholar] [CrossRef]
  2. Diniz, M.F.; Dallmeier, F.; Gregory, T.; Martinez, V.; Saldivar-Bellassai, S.; Benitez-Stanley, M.A.; Sánchez-Cuervo, A.M. Balancing multi-species connectivity and socio-economic factors to connect protected areas in the Paraguayan Atlantic Forest. Landsc. Urban Plan. 2022, 222, 104400. [Google Scholar] [CrossRef]
  3. Hughes, A.C. Mapping priorities for conservation in Southeast Asia. Biol. Conserv. 2017, 209, 395–405. [Google Scholar] [CrossRef]
  4. Liu, Y.; Liu, S.; Wang, F.; Liu, H.; Li, M.; Sun, Y.; Wang, Q.; Yu, L. Identification of key priority areas under different ecological restoration scenarios on the Qinghai-Tibet Plateau. J. Environ. Manag. 2022, 323, 116174. [Google Scholar] [CrossRef]
  5. Sahraoui, Y.; De Godoy Leski, C.; Benot, M.-L.; Revers, F.; Salles, D.; van Halder, I.; Barneix, M.; Carassou, L. Integrating ecological networks modelling in a participatory approach for assessing impacts of planning scenarios on landscape connectivity. Landsc. Urban Plan. 2021, 209, 104039. [Google Scholar] [CrossRef]
  6. Shen, Z.; Wu, W.; Chen, S.; Tian, S.; Wang, J.; Li, L. A static and dynamic coupling approach for maintaining ecological networks connectivity in rapid urbanization contexts. J. Clean. Prod. 2022, 369, 133375. [Google Scholar] [CrossRef]
  7. Baranyi, G.; Saura, S.; Podani, J.; Jordán, F. Contribution of habitat patches to network connectivity: Redundancy and uniqueness of topological indices. Ecol. Indic. 2011, 11, 1301–1310. [Google Scholar] [CrossRef]
  8. Pirnat, J.; Hladnik, D. Connectivity as a tool in the prioritization and protection of sub-urban forest patches in landscape conservation planning. Landsc. Urban Plan. 2016, 153, 129–139. [Google Scholar] [CrossRef]
  9. Meng, L.; Yan, L.; Lu, Q.; Bi, X. The Impact of Urbanization Development on Forest Landscape Connectivity: A Case Study of the Eastern Shandong Peninsula. J. Fujian For. Univ. 2012, 32, 289–295. [Google Scholar] [CrossRef]
  10. Cui, N.; Feng, C.C.; Wang, D.; Li, J.; Guo, L. The Effects of Rapid Urbanization on Forest Landscape Connectivity in Zhuhai City, China. Sustainability 2018, 10, 3381. [Google Scholar] [CrossRef]
  11. Shi, F.; Liu, S.; Sun, Y.; An, Y.; Zhao, S.; Liu, Y.; Li, M. Ecological network construction of the heterogeneous agro-pastoral areas in the upper Yellow River basin. Agric. Ecosyst. Environ. 2020, 302, 107069. [Google Scholar] [CrossRef]
  12. Feng, X.; Huang, H.; Wang, Y.; Tian, Y.; Li, L. Identification of Ecological Sources Using Ecosystem Service Value and Vegetation Productivity Indicators: A Case Study of the Three-River Headwaters Region, Qinghai–Tibetan Plateau, China. Remote Sens. 2024, 16, 1258. [Google Scholar] [CrossRef]
  13. Shuai, N.; Hu, Y.; Gao, M.; Guo, Z.; Bai, Y. Construction and optimization of ecological networks in karst regions based on multi-scale nesting: A case study in Guangxi Hechi, China. Ecol. Inform. 2023, 74, 101963. [Google Scholar] [CrossRef]
  14. Liu, X.; Zhang, Z.; Li, M.; Fu, Y.; Hui, Y. Ecological source identification based on the PSR model framework and structural features: A case study in Tianjin, China. Arab. J. Geosci. 2022, 15, 853. [Google Scholar] [CrossRef]
  15. Wang, S.; Wu, M.; Hu, M.; Fan, C.; Wang, T.; Xia, B. Promoting landscape connectivity of highly urbanized area: An ecological network approach. Ecol. Indic. 2021, 125, 107487. [Google Scholar] [CrossRef]
  16. Xie, J.; Xie, B.; Zhou, K.; Li, J.; Xiao, J.; Liu, C. Impacts of landscape pattern on ecological network evolution in Changsha-Zhuzhou-Xiangtan Urban Agglomeration, China. Ecol. Indic. 2022, 145, 109716. [Google Scholar] [CrossRef]
  17. Yu, Q.; Yue, D.; Wang, Y.; Kai, S.; Fang, M.; Ma, H.; Zhang, Q.; Huang, Y. Optimization of ecological node layout and stability analysis of ecological network in desert oasis: A typical case study of ecological fragile zone located at Deng Kou County (Inner Mongolia). Ecol. Indic. 2018, 84, 304–318. [Google Scholar] [CrossRef]
  18. Zhang, Z.; Meerow, S.; Newell, J.P.; Lindquist, M. Enhancing landscape connectivity through multifunctional green infrastructure corridor modeling and design. Urban For. Urban Green. 2019, 38, 305–317. [Google Scholar] [CrossRef]
  19. Xu, X.; Wang, S.; Rong, W. Construction of ecological network in Suzhou based on the PLUS and MSPA models. Ecol. Indic. 2023, 154, 110740. [Google Scholar] [CrossRef]
  20. Huo, J.; Shi, Z.; Zhu, W.; Li, T.; Xue, H.; Chen, X.; Yan, Y.; Ma, R. Construction and Optimization of an Ecological Network in Zhengzhou Metropolitan Area, China. Int. J. Environ. Res. Public Health 2022, 19, 8066. [Google Scholar] [CrossRef]
  21. Feng, B.-O.; Yue, W.-Z.; Xia, H.-X. Ecological protection red line assessment from the perspective of ecological security pattern: A case study of Zhejiang Province. J. Appl. Ecol. 2022, 33, 2466–2474. [Google Scholar] [CrossRef]
  22. Pan, L.; Gan, W.; Chen, J.; Ren, K. An Integrated Model for Constructing Urban Ecological Networks and Identifying the Ecological Protection Priority: A Case Study of Wujiang District, Suzhou. Sustainability 2023, 15, 4487. [Google Scholar] [CrossRef]
  23. Wang, S.; Song, Q.; Zhao, J.; Lu, Z.; Zhang, H. Identification of Key Areas and Early-Warning Points for Ecological Protection and Restoration in the Yellow River Source Area Based on Ecological Security Pattern. Land 2023, 12, 1643. [Google Scholar] [CrossRef]
  24. Fan, J.; Wang, Q.; Ji, M.; Sun, Y.; Feng, Y.; Yang, F.; Zhang, Z. Ecological network construction and gradient zoning optimization strategy in urban-rural fringe: A case study of Licheng District, Jinan City, China. Ecol. Indic. 2023, 150, 110251. [Google Scholar] [CrossRef]
  25. Wei, Q.; Halike, A.; Yao, K.; Chen, L.; Balati, M. Construction and optimization of ecological security pattern in Ebinur Lake Basin based on MSPA-MCR models. Ecol. Indic. 2022, 138, 108857. [Google Scholar] [CrossRef]
  26. Ye, H.; Yang, Z.; Xu, X. Ecological Corridors Analysis Based on MSPA and MCR Model—A Case Study of the Tomur World Natural Heritage Region. Sustainability 2020, 12, 959. [Google Scholar] [CrossRef]
  27. Duan, J.; Cao, Y.; Liu, B.; Liang, Y.; Tu, J.; Wang, J.; Li, Y. Construction of an Ecological Security Pattern in Yangtze River Delta Based on Circuit Theory. Sustainability 2023, 15, 12374. [Google Scholar] [CrossRef]
  28. Modica, G.; Praticò, S.; Laudari, L.; Ledda, A.; Di Fazio, S.; De Montis, A. Implementation of multispecies ecological networks at the regional scale: Analysis and multi-temporal assessment. J. Environ. Manag. 2021, 289, 112494. [Google Scholar] [CrossRef]
  29. Ahmad, M.; Jiang, P.; Majeed, A.; Umar, M.; Khan, Z.; Muhammad, S. The dynamic impact of natural resources, technological innovations and economic growth on ecological footprint: An advanced panel data estimation. Resour. Policy 2020, 69, 101817. [Google Scholar] [CrossRef]
  30. Guan, J.; Hu, J.; Li, B. How to restore ecological impacts from wind energy? An assessment of Zhongying Wind Farm through MSPA-MCR model and circuit theory. Ecol. Indic. 2024, 163, 112149. [Google Scholar] [CrossRef]
  31. Butler, E.P.; Bliss Ketchum, L.L.; de Rivera, C.E.; Dissanayake, S.T.M.; Hardy, C.L.; Horn, D.A.; Huffine, B.; Temple, A.M.; Vermeulen, M.E.; Wallace, H. Habitat, geophysical, and eco-social connectivity: Benefits of resilient socio–ecological landscapes. Landsc. Ecol. 2021, 37, 1–29. [Google Scholar] [CrossRef]
  32. Parcerisas, L.; Marull, J.; Pino, J.; Tello, E.; Coll, F.; Basnou, C. Land use changes, landscape ecology and their socioeconomic driving forces in the Spanish Mediterranean coast (El Maresme County, 1850–2005). Environ. Sci. Policy 2012, 23, 120–132. [Google Scholar] [CrossRef]
  33. Hu, C.; Wang, Z.; Wang, Y.; Sun, D.; Zhang, J. Combining MSPA-MCR Model to Evaluate the Ecological Network in Wuhan, China. Land 2022, 11, 213. [Google Scholar] [CrossRef]
  34. Kim, D.; Shin, W.; Choi, H.; Kim, J.; Song, Y. Estimation of Ecological Connectivity in a City Based on Land Cover and Urban Habitat Maps. Sustainability 2020, 12, 9529. [Google Scholar] [CrossRef]
  35. Hargrove, W.W.; Hoffman, F.M.; Efroymson, R.A. A practical map-analysis tool for detecting potential dispersal corridors. Landsc. Ecol. 2005, 20, 361–373. [Google Scholar] [CrossRef]
  36. Heintzman, L.J.; McIntyre, N.E. Assessment of playa wetland network connectivity for amphibians of the south-central Great Plains (USA) using graph-theoretical, least-cost path, and landscape resistance modelling. Landsc. Ecol. 2021, 36, 1117–1135. [Google Scholar] [CrossRef]
  37. Indrayani, P.; Mitani, Y.; Djamaluddin, I.; Ikemi, H. A Gis Based Evaluation of Land Use Changes and Ecological Connectivity Index. Geoplanning: J. Geomat. Plan. 2017, 4, 9–18. [Google Scholar] [CrossRef]
  38. Javier, V.; Derya, G.; Peter, V.; Víctor, R.; Ana, H.; Javier, G.; Uğur, Ö.A.; Kerim, Ç. Planning Restoration of Connectivity and Design of Corridors for Biodiversity Conservation. Forests 2022, 13, 2132. [Google Scholar] [CrossRef]
  39. Jesús, S.-R.; María, F.-T.J. Assessing the effectiveness of protected areas against habitat fragmentation and loss: A long-term multi-scalar analysis in a mediterranean region. J. Nat. Conserv. 2021, 64, 126072. [Google Scholar] [CrossRef]
  40. Xie, J.; Xie, B.; Zhou, K.; Li, J.; Xiao, J.; Liu, C.; Zhang, X. Factors impacting ecological network in Changsha-Zhuzhou-Xiangtan urban agglomeration, China—Based on the perspective of functional performance. Ecol. Indic. 2023, 154, 110771. [Google Scholar] [CrossRef]
  41. Zhang, J.; Pannell, J.L.; Case, B.S.; Hinchliffe, G.; Stanley, M.C.; Buckley, H.L. Interactions between landscape structure and bird mobility traits affect the connectivity of agroecosystem networks. Ecol. Indic. 2021, 129, 107962. [Google Scholar] [CrossRef]
  42. Ospina-Alvarez, A.; Juan, S.d.; Davis, K.J.; González, C.; Fernández, M.; Navarrete, S.A. Integration of biophysical connectivity in the spatial optimization of coastal ecosystem services. Sci. Total Environ. 2020, 733, 139367. [Google Scholar] [CrossRef] [PubMed]
  43. Pătru-Stupariu, I.; Stupariu, M.-S.; Tudor, C.A.; Grădinaru, S.R.; Gavrilidis, A.; Kienast, F.; Hersperger, A.M. Landscape fragmentation in Romania’s Southern Carpathians: Testing a European assessment with local data. Landsc. Urban Plan. 2015, 143, 1–8. [Google Scholar] [CrossRef]
  44. Saura, S.; Estreguil, C.; Mouton, C.; Rodríguez-Freire, M. Network analysis to assess landscape connectivity trends: Application to European forests (1990–2000). Ecol. Indic. 2010, 11, 407–416. [Google Scholar] [CrossRef]
  45. Walters, S. Modeling scale-dependent landscape pattern, dispersal, and connectivity from the perspective of the organism. Landsc. Ecol. 2007, 22, 867–881. [Google Scholar] [CrossRef]
  46. Xiao, Z.; Zhang, W.; Hao, L. Retraction Note: The evolution of spatial and temporal patterns of Zhengzhou ecological network based on MSPA. Arab. J. Geosci. 2022, 15, 747. [Google Scholar] [CrossRef]
  47. Huang, X.; Wang, H.; Shan, L.; Xiao, F. Constructing and optimizing urban ecological network in the context of rapid urbanization for improving landscape connectivity. Ecol. Indic. 2021, 132, 108319. [Google Scholar] [CrossRef]
  48. Luo, Y.; Wu, J.; Wang, X.; Zhao, Y.; Feng, Z. Understanding ecological groups under landscape fragmentation based on network theory. Landsc. Urban Plan. 2021, 210, 104066. [Google Scholar] [CrossRef]
  49. Wang, Y.; Qu, Z.; Zhong, Q.; Zhang, Q.; Zhang, L.; Zhang, R.; Yi, Y.; Zhang, G.; Li, X.; Liu, J. Delimitation of ecological corridors in a highly urbanizing region based on circuit theory and MSPA. Ecol. Indic. 2022, 142, 109258. [Google Scholar] [CrossRef]
  50. Clergeau, P.; Burel, F. The role of spatio-temporal patch connectivity at the landscape level: An example in a bird distribution. Landsc. Urban Plan. 1997, 38, 37–43. [Google Scholar] [CrossRef]
  51. Lim, C.H. Establishing an Ecological Network to Enhance Forest Connectivity in South Korea’s Demilitarized Zone. Land 2024, 13, 106. [Google Scholar] [CrossRef]
  52. Svensson, J.; Bubnicki, J.W.; Jonsson, B.G.; Andersson, J.; Mikusiński, G. Conservation significance of intact forest landscapes in the Scandinavian Mountains Green Belt. Landsc. Ecol. 2020, 35, 2113–2131. [Google Scholar] [CrossRef]
  53. Yixin, L.; Jing, L.; Hui, C.; Zhijie, W. Landscape connectivity evaluation and spatiotemporal characteristics of Guiyang City from 2008 to 2017 based on MSPA and MCR models. J. Ecol. 2022, 41, 1240–1248. [Google Scholar] [CrossRef]
  54. Zhang, C.; Liao, H.; Qu, J.; Li, R.; Teng, M. Empirical research on the social and economic effects of climate change review. J. Beijing Inst. Technol. (Soc. Sci. Ed.) 2023, 25, 15–25. [Google Scholar] [CrossRef]
  55. Anguelovski, I.; Connolly, J.J.T.; Cole, H.; Garcia-Lamarca, M.; Triguero-Mas, M.; Baro, F.; Martin, N.; Conesa, D.; Shokry, G.; Del Pulgar, C.P.; et al. Green gentrification in European and North American cities. Nat. Commun. 2022, 13, 3816. [Google Scholar] [CrossRef]
  56. Liu, C.; Minor, E.S.; Garfinkel, M.B.; Mu, B.; Tian, G. Anthropogenic and Climatic Factors Differentially Affect Waterbody Area and Connectivity in an Urbanizing Landscape: A Case Study in Zhengzhou, China. Land 2021, 10, 1070. [Google Scholar] [CrossRef]
  57. Garcia-Lozano, C.; Varga, D.; Pintó, J.; Roig-Munar, F.X. Landscape Connectivity and Suitable Habitat Analysis for Wolves (Canis lupus L.) in the Eastern Pyrenees. Sustainability 2020, 12, 5762. [Google Scholar] [CrossRef]
  58. Guo, S.; Deng, X.; Ran, J.; Ding, X. Spatial and Temporal Patterns of Ecological Connectivity in the Ethnic Areas, Sichuan Province, China. Int. J. Environ. Res. Public Health 2022, 19, 12941. [Google Scholar] [CrossRef]
  59. Wang, S.; Wu, M.; Hu, M.; Xia, B. Integrating ecosystem services and landscape connectivity into the optimization of ecological security pattern: A case study of the Pearl River Delta, China. Environ. Sci. Pollut. Res. 2022, 29, 76051–76065. [Google Scholar] [CrossRef]
  60. Wolch, J.R.; Byrne, J.; Newell, J.P. Urban green space, public health, and environmental justice: The challenge of making cities ‘just green enough’. Landsc. Urban Plan. 2014, 125, 234–244. [Google Scholar] [CrossRef]
  61. Wu, L.; Rowe, P.G. Green space progress or paradox: Identifying green space associated gentrification in Beijing. Landsc. Urban Plan. 2022, 219, 104321. [Google Scholar] [CrossRef]
  62. Wu, Z.; Qian, Y. An integration method to predict the impact of urban land use change on green space connectivity under different development scenarios using a case study of Nanjing, China. Environ. Sci. Pollut. Res. 2022, 29, 85243–85256. [Google Scholar] [CrossRef] [PubMed]
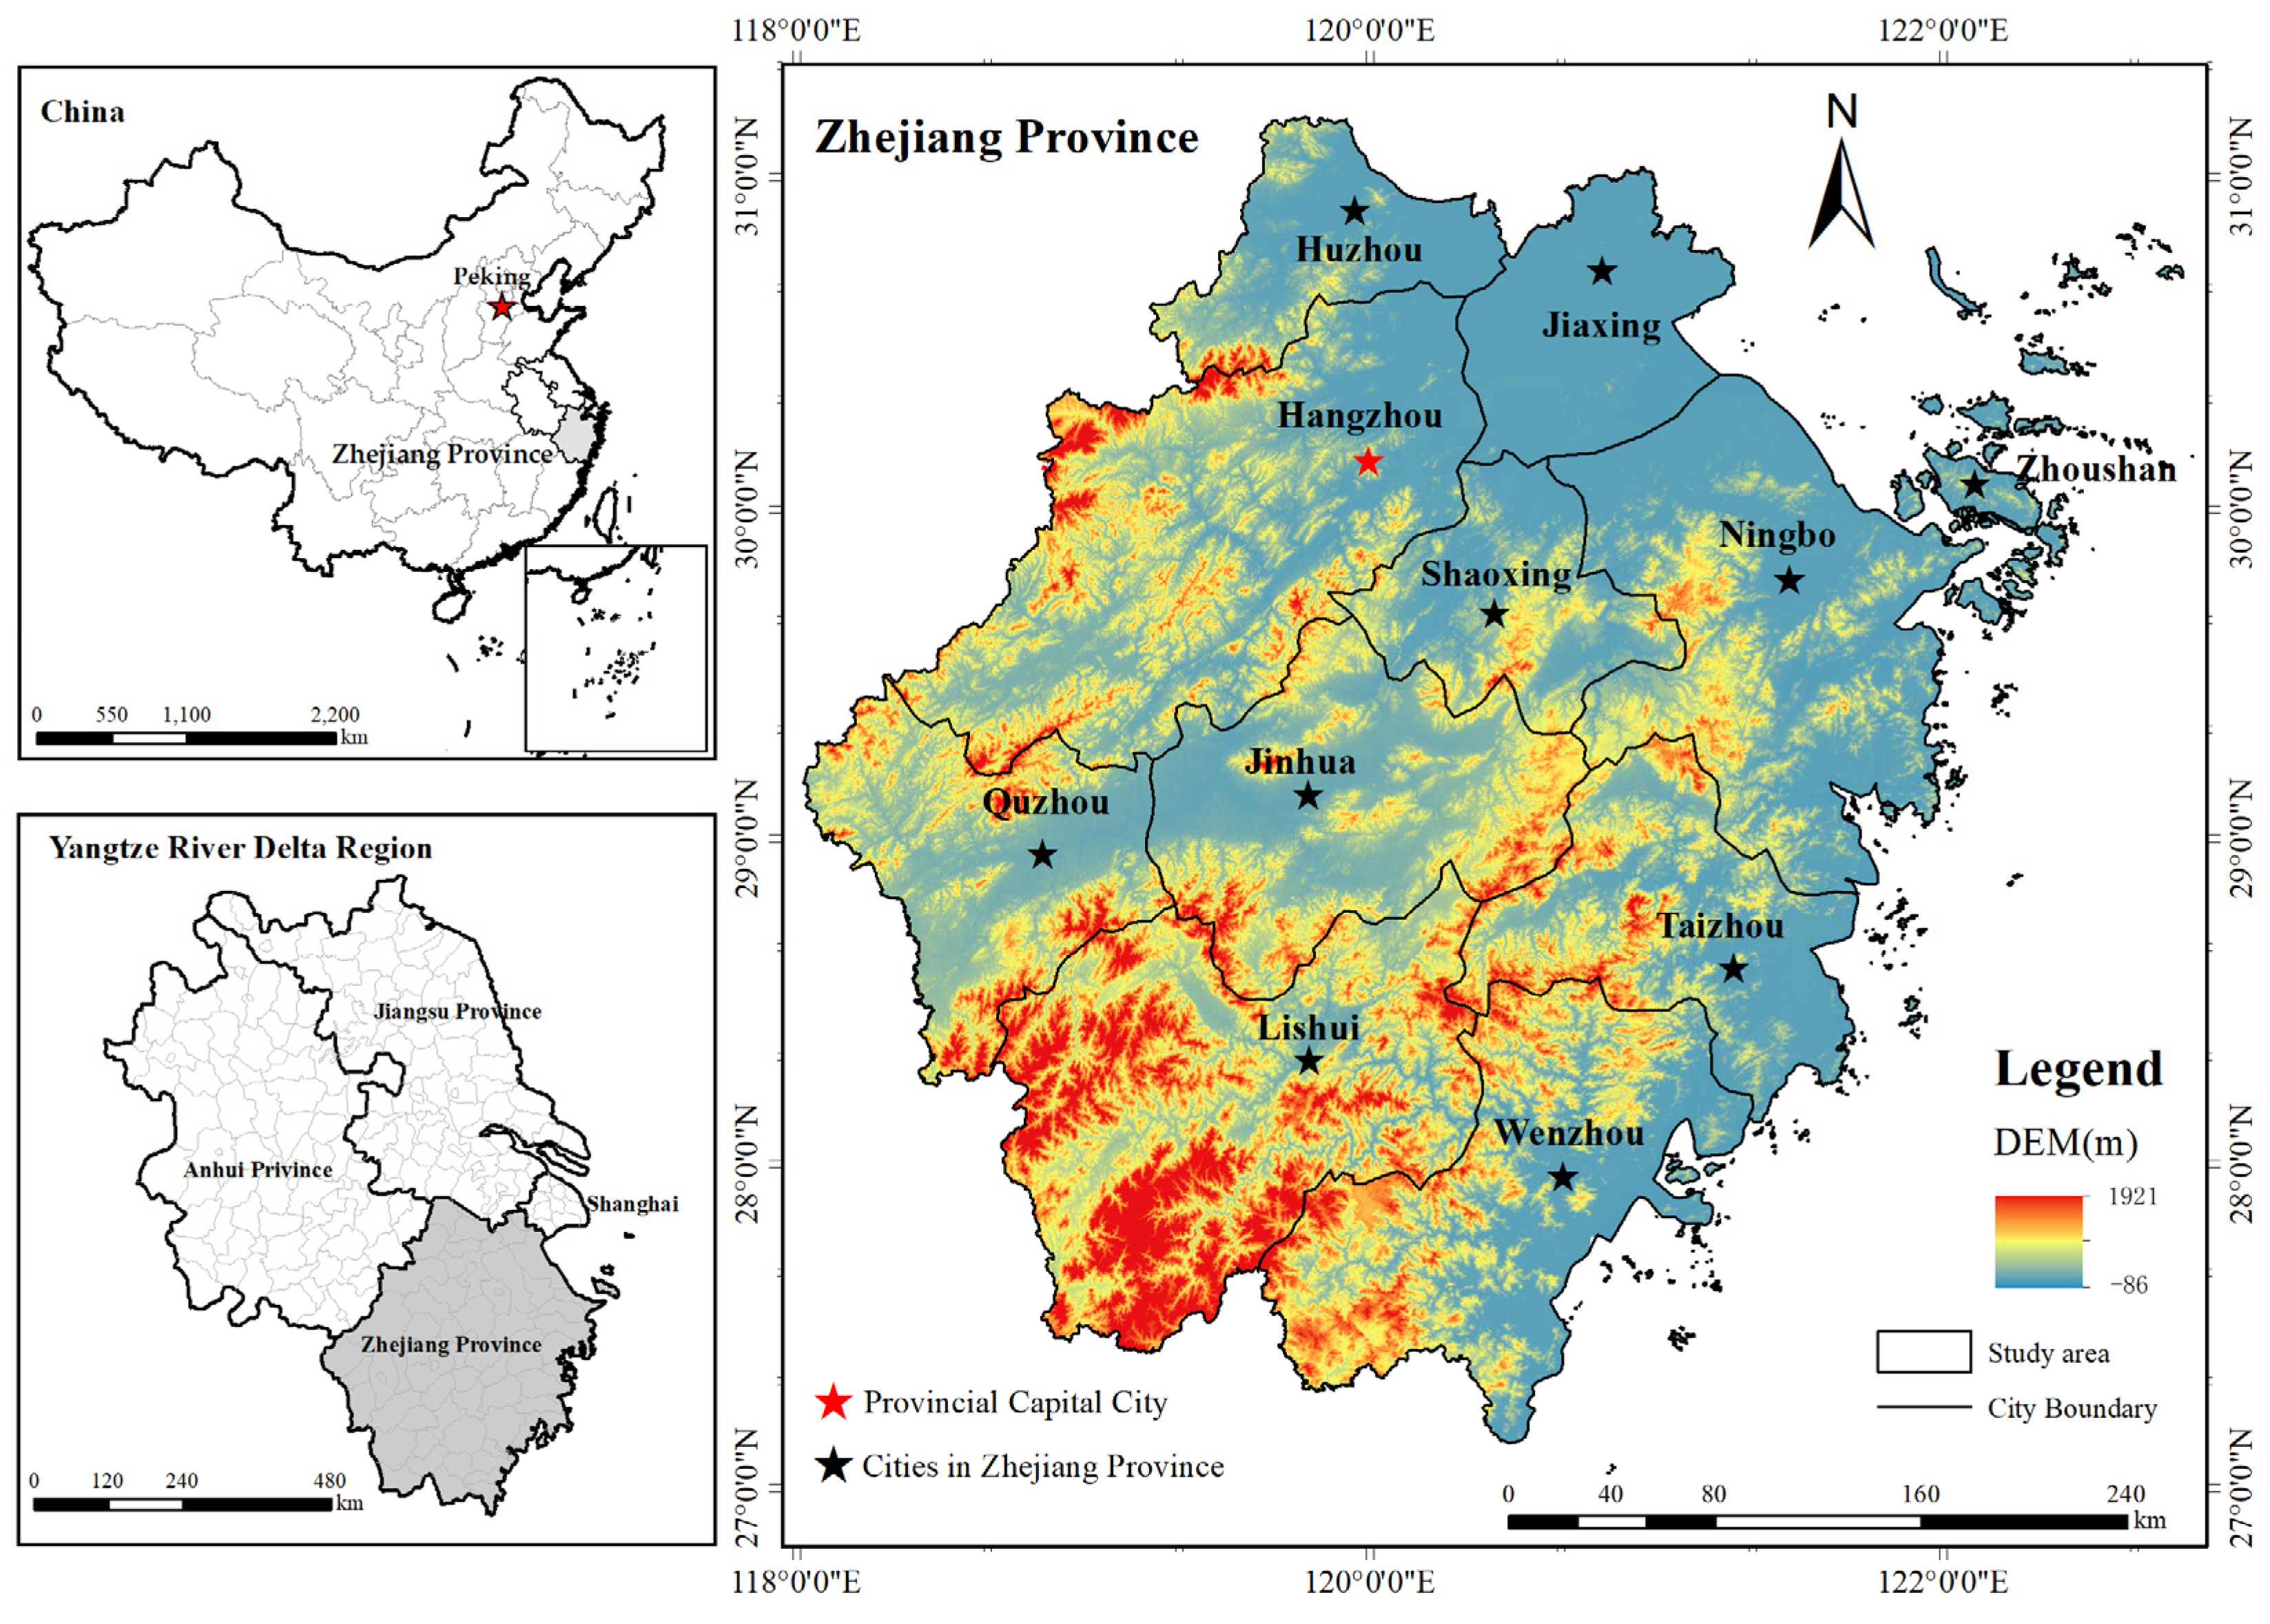
Figure 1. Geographical location of Zhejiang.
Sustainability 16 05868 g001
Figure 2. Framework of the study.
Sustainability 16 05868 g002
Figure 3. Detailed accuracy matrix for 8 land-use types from 2000 to 2020 (A1 to A8 represent cropland, forests, grassland, impervious land, shrubs, water, wetlands, and barren land, respectively. Each grid in the table represents the probability that the real label is classified as the predicted label).
Sustainability 16 05868 g003
Figure 4. Spatial distribution of landscape types in Zhejiang province for 2000, 2010, and 2020.
Sustainability 16 05868 g004
Figure 5. Landscape pattern analyses based on the MSPA in Zhejiang province for 2000, 2010, and 2020.
Sustainability 16 05868 g005
Figure 6. Distributions of the ecological sources in (a) 2000, (b) 2010, and (c) 2020.
Sustainability 16 05868 g006
Figure 7. (a) Values of IIC at different threshold distances, from 2000 to 2020; (b) values of PC at different threshold distances, from 2000 to 2020.
Sustainability 16 05868 g007
Figure 8. Resistance surface value in 2000, 2010, and 2020.
Sustainability 16 05868 g008
Figure 9. Regional forest landscape connectivity in (a) 2000, (b) 2010, and (c) 2020.
Sustainability 16 05868 g009
Figure 10. Interaction chord diagram of 10 important ecological sources in 2000, 2010, and 2020.
Sustainability 16 05868 g010
Figure 11. Extraction of the ecological corridors in (a) 2000, (b) 2010, and (c) 2020.
Sustainability 16 05868 g011
Figure 12. Ecological network construction in Zhejiang.
Sustainability 16 05868 g012
Figure 13. Ecological network pattern in Zhejiang.
Sustainability 16 05868 g013
Table 1. Details of the data.
DataSubdataTypeSpatial ResolutionYearsSources
Land-use dataLand-useLandsat-TM/ETM and Landsat 8 OLI 30 m2000, 2010, 2020http://www.gscloud.cn/search
(accessed on 4 August 2023)
Environmental dataDEM, elevationGDEMV330 m-https://www.gscloud.cn/
(accessed on 16 August 2023)
Socioeconomic dataGDP---https://tjj.zj.gov.cn/ (accessed on 12 April 2024)
Table 3. Classification, valuation, and weight of landscape factors.
Resistance
Value
Factor Grading
Land-Use TypeDEM Elevation
(m)
Slope
(°)
Distance from
National Road (s)/m
1Forest≤310≤20>150,000
2Grassland, cropland(310, 710](20, 35](100,000, 150,000]
3Barren, shrubs(710, 1120](35, 50](60,000, 100,000]
4Water and wetlands(1120, 1520](50, 65](30,000, 60,000]
5Impervious land>1520>65≤30,000
Weight0.460.180.250.11
Table 4. Areas of various landscape types in Zhejiang province from 2000 to 2020.
Landscape Type2000201020202000–2020
Area (km2)Proportion (%)Area (km2)Proportion (%)Area (km2)Proportion (%)Area (km2)
Barren0.210.00%1.060.00%0.210.00%0.00
Cropland26,322.6724.95%23,235.1922.02%26,205.9424.84%−116.73
Forest68,303.3064.74%68,218.5664.66%68,447.3164.88%144.01
Grassland16.140.02%28.880.03%16.250.02%0.11
Impervious3698.273.51%6501.486.16%3686.373.49%−11.91
Shrub5.960.01%3.300.00%6.010.01%0.04
Water7153.456.78%7511.547.12%7137.926.77%−15.53
Table 5. Classification of landscape types in Zhejiang from 2000 to 2020.
Landscape Type200020102020
AreaProportionAreaProportionAreaProportion
Core64,175.8960.83%62,926.4659.65%59,896.9656.77%
Islet259.710.25%237.400.23%19.560.19%
Perforation1.780.00%1658.721.57%2046.471.94%
Edge1777.631.68%2061.501.95%230.562.19%
Loop454.740.43%413.470.39%337.160.32%
Bridge257.510.24%221.380.21%16.240.15%
Branch602.420.57%553.400.52%545.800.52%
Table 6. Interaction matrix of 10 important ecological sources based on the gravity model for 2000.
Important IntensityEcological Sources
12345678910
Ecological sources1-170.9782706.404292.3751204.6522298.1381821.560585.029207.904297.709
2--223.8407750.337204.940331.983178.325353.3281638.396284.648
3---163.4567400.5985601.5832460.3811191.042183.250448.127
4----238.496382.682195.696443.1545304.279415.391
5-----680.336971.402368.38755.851168.024
6------600.0531170.574165.806339.947
7-------721.001184.805410.574
8--------160.447835.629
9---------181.074
10----------
Disclaimer/Publisher’s Note: The statements, opinions and data contained in all publications are solely those of the individual author(s) and contributor(s) and not of MDPI and/or the editor(s). MDPI and/or the editor(s) disclaim responsibility for any injury to people or property resulting from any ideas, methods, instructions or products referred to in the content.