Article

Reduction of Methane Emissions from Natural Gas Integral Compressor Engines through Fuel Injection Control

by
Titilope Ibukun Banji
1,*,
Gregg Arney
2,3,
Mark Patterson
2,4 and
Daniel B. Olsen
1
1
Department of Mechanical Engineering, Colorado State University, Fort Collins, CO 80523, USA
2
Pipeline Research Council International, Chantilly, VA 20151, USA
3
Southern California Gas Company, Los Angeles, CA 90013, USA
4
Cooper Machinery Services, Houston, TX 77041, USA
*
Author to whom correspondence should be addressed.
Sustainability 2024, 16(14), 5943; https://doi.org/10.3390/su16145943
Submission received: 12 June 2024 / Revised: 9 July 2024 / Accepted: 10 July 2024 / Published: 12 July 2024

Abstract

:
Methane emissions from over 7000 large-bore natural gas engines used for gas compression in the United States result from combustion inefficiency and the escape of unburned methane through the crevices. Methane is a strong greenhouse gas with a warming potential 28 times that of carbon dioxide. The Inflation Reduction Act passed by the Biden administration in 2022 imposes a methane “waste” fee that accumulates yearly to invest in clean energy and climate action starting in 2024. This study aims to reduce the amount of methane emissions from large bore engines through fuel injection techniques, thereby advancing sustainable energy development. The strategies explored investigate fuel injection pressure and timing optimization, crankcase methane emissions quantification and mitigation, and ring-pack methane quantification. While varying injection pressures and injection timing on the engine, the performance and methane emission characteristics were measured. Also, a model of the engine was created for computational fluid dynamics (CFD) simulations using CONVERGE Studio v 3.0. Experimental results showed that methane emissions are minimized with late-cycle fuel injection at 500 psi and 100 degrees BTDC. Computational results showed that the ring pack contributes up to 34% of methane emissions in the large bore engine model.

1. Introduction

Methane emissions have 28 times the warming potential of carbon dioxide [1], leading to increased greenhouse gas emission effects. Methane emissions generally decrease the overall efficiency of the natural gas system in producing and delivering natural gas to consumers. Reciprocating compressors that produce methane emissions make up about 33% of the natural gas transmission and storage industry in the United States. There are over 1700 compression stations housing over 7000 compressor engines used to compress natural gas along the interstate and intrastate pipelines [2]. Most of the engines for natural gas compression are large-bore engines, which are either two-stroke or four-stroke and rich-burn or lean-burn. Two-stroke lean-burn large-bore engines in the natural gas industry are fueled with natural gas (which is approximately 90% methane across various compositions) and are known to emit methane in significant amounts. Methane emissions stem from partial oxidation products when the fuel—natural gas—is burned, constituting combustion inefficiency in the engine [3]. The methane emissions from these engines result from various mechanisms, such as bulk quenching, short-circuiting, and incomplete combustion in the crevice volume. Much of the emissions from short-circuiting have been addressed by the introduction of direct injectors in spark ignition two-stroke engines, but the processes in the main cylinder and crevice volumes of these engines are still being studied and have not been understood in detail.
To address combustion efficiency, however, more studies have considered the in-cylinder combustion action and how to improve it. Studies have shown how high-pressure fuel injection increases the momentum of the fuel jet injected, leading to improved mixing and combustion. Kim et al. [4] conducted a computational study on high-pressure fuel injection using Fluent and Star CD using low-pressure (4 bar) and high-pressure (34 bar) fuel jets. They observed that the maximum turbulent kinetic energy (TKE) of the high-pressure jet was 22 m2/s2 compared to that of the low-pressure jet at 12.5 m2/s2, implying better mixing and promising more complete combustion. A previous experimental study by Hoffman et al. [5] using fuel injected at 5, 20, and 40 MPa in a gasoline direct injection single-cylinder engine had shown reduced particulate matter and hydrocarbon emissions with fuel injection at high pressures. The optimization of injection pressures has given promise for improved mixing, but some other parameters for fuel injection can be optimized, such as injection timing. To this end, the present study approaches methane emission reduction in large-bore natural gas engines by exploring late-cycle high-pressure fuel injection, as shown in Figure 1.
Fuel injection has a major impact on the emissions characteristics of any engine with direct fuel injection. For large bore engines subject to significant methane emissions, high-pressure fuel injection can reduce the amount of hydrocarbon emissions, but it can be further improved by injection timing optimization. Optimizing the fuel injection timing can reduce the amount of methane trapped in crevices such as the ring pack, which can flow into the combustion chamber during expansion or exit through the crankcase vent as blowby through the ring pack. Combustion crevice volume mechanisms are known to contribute to hydrocarbon emissions, both methane and non-methane hydrocarbon emissions [6,7,8]. The contribution of the ring pack to hydrocarbon (HC) emissions was estimated by Salazar and Ghandhi [9] using experimentally measured blowby data and a simplified geometric model of the ring pack for a small utility model. In that study, it was concluded that at high loads, most HC emissions observed in the engine came from the ring pack crevices, but the authors acknowledge that the simplified model could not fully explain the observed ring pack emissions and had to augment it with the real-time observed HC emissions. Using modern computational studies to investigate the crevice volumes will provide insight into the contribution of the ring pack to methane and general hydrocarbon emissions [10].
Investigations that involve fuel injection strategy optimization have yielded positive emissions results in different spark-ignited engines from different studies. A study on a gasoline direct injection (GDI) engine resulted in a 31.81% decrease in HC when double injection was used compared to single injection [11]. Also, for injection of gasoline and n-butanol in a single-cylinder four-stroke SI engine, a reduction in HC emissions was recorded with fuel injection at 64 crank angle degrees before the inlet valves opened [12]. Not many studies on large-bore lean-burn two-stroke engines have explored the area of fuel injection optimization in terms of timing. In the present study, late-cycle high-pressure fuel injection would result in more air and less fuel (natural gas, which is predominantly methane) being forced into the crevice volumes during compression, leading to reduced methane emissions.
This study investigates the impact of two major fuel injection parameters—injection pressure and injection timing—on methane emissions. The objectives of this study include improving combustion efficiency through better mixing, reducing the amount of methane trapped in the ring pack, and limiting the escape of methane emissions through the crankcase.

2. Materials and Methods

The test engine used in this study is the Cooper-Bessemer GMV-4TF engine, which is a typical large-bore engine used for natural gas compression in the United States [13]. Both experimental tests and computational fluid dynamics (CFD) analyses were carried out for this study, using the GMV-4TF engine. The engine is a 4-cylinder, lean-burn, direct-injected, two-stroke slow-speed (300 rpm) engine with a 14-inch (35.6 cm) bore and 14.75-inch (37.5 cm) stroke rated at 440 bhp (330 kW). The engine is shown in Figure 2. For this study, high-pressure fuel injection and precombustion chamber ignition were employed, enabling an ultra-lean operation to achieve low NOx emissions (~0.5 g/bhp-h).

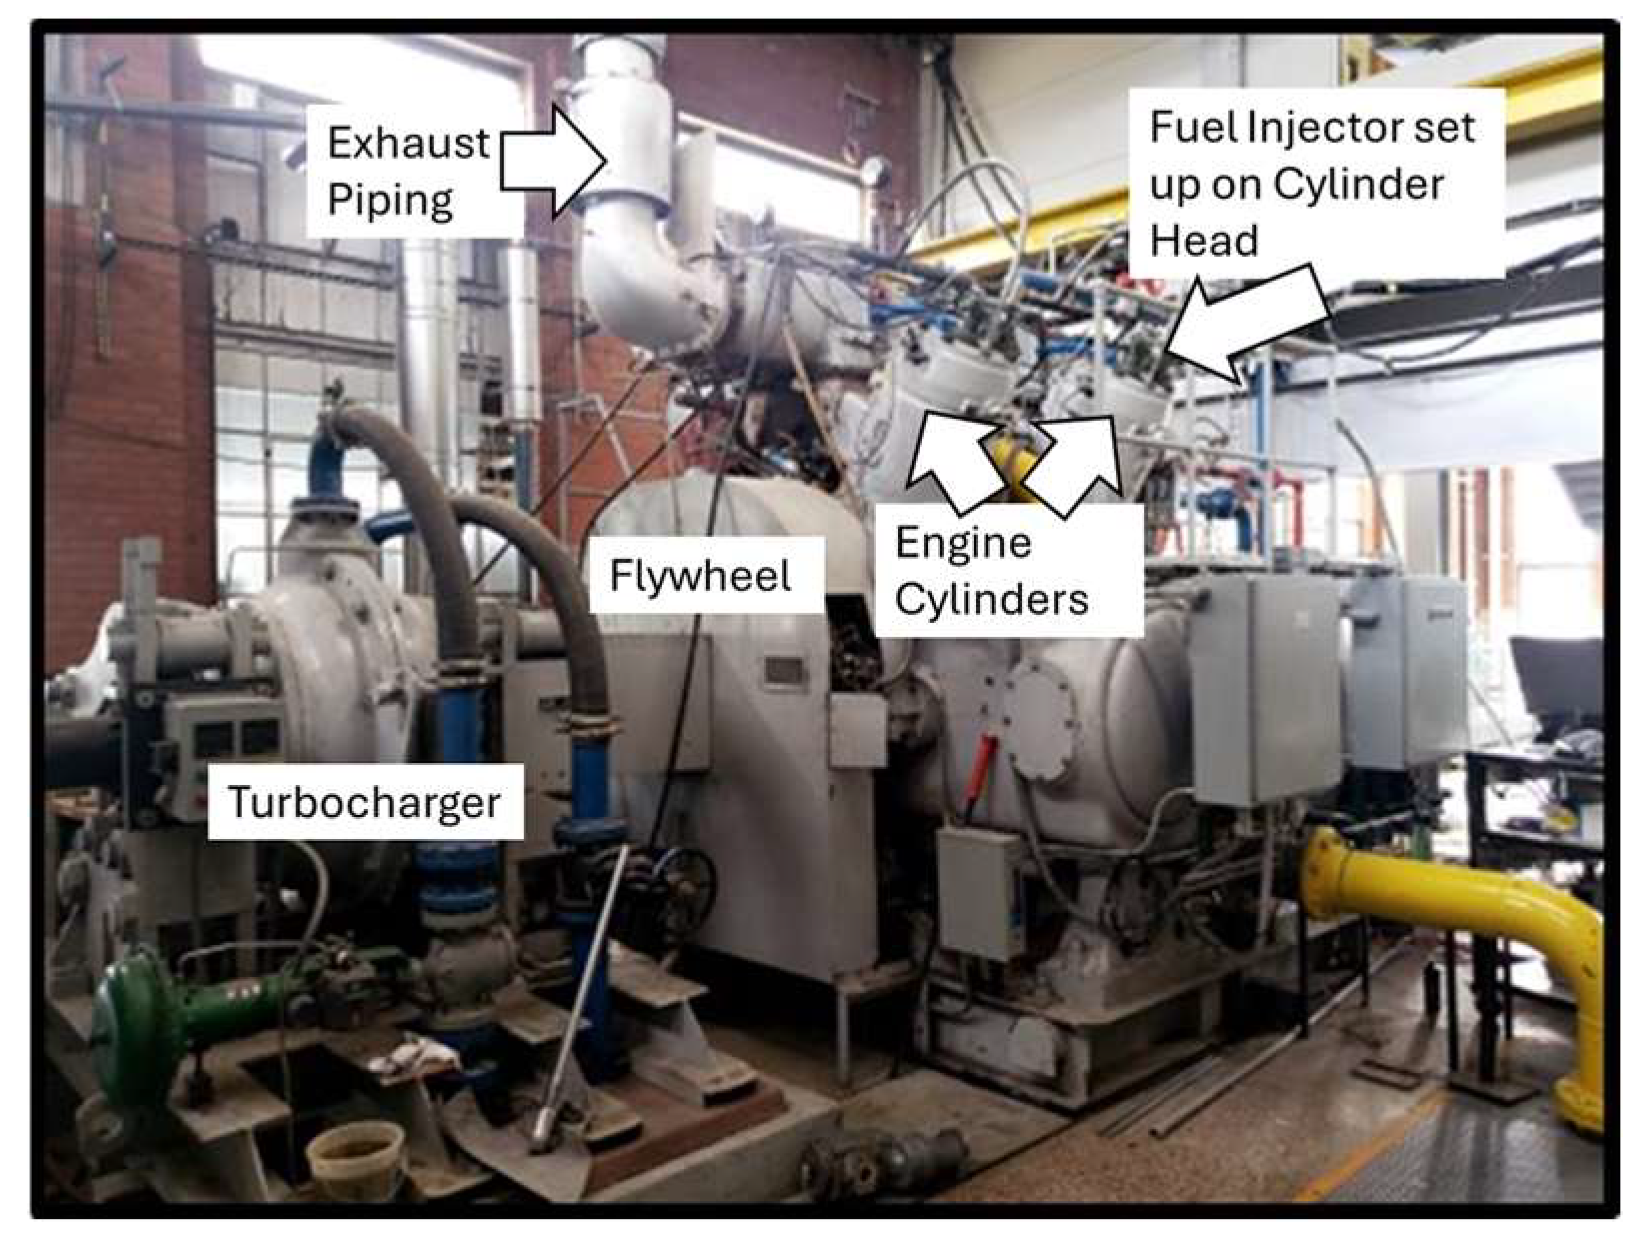
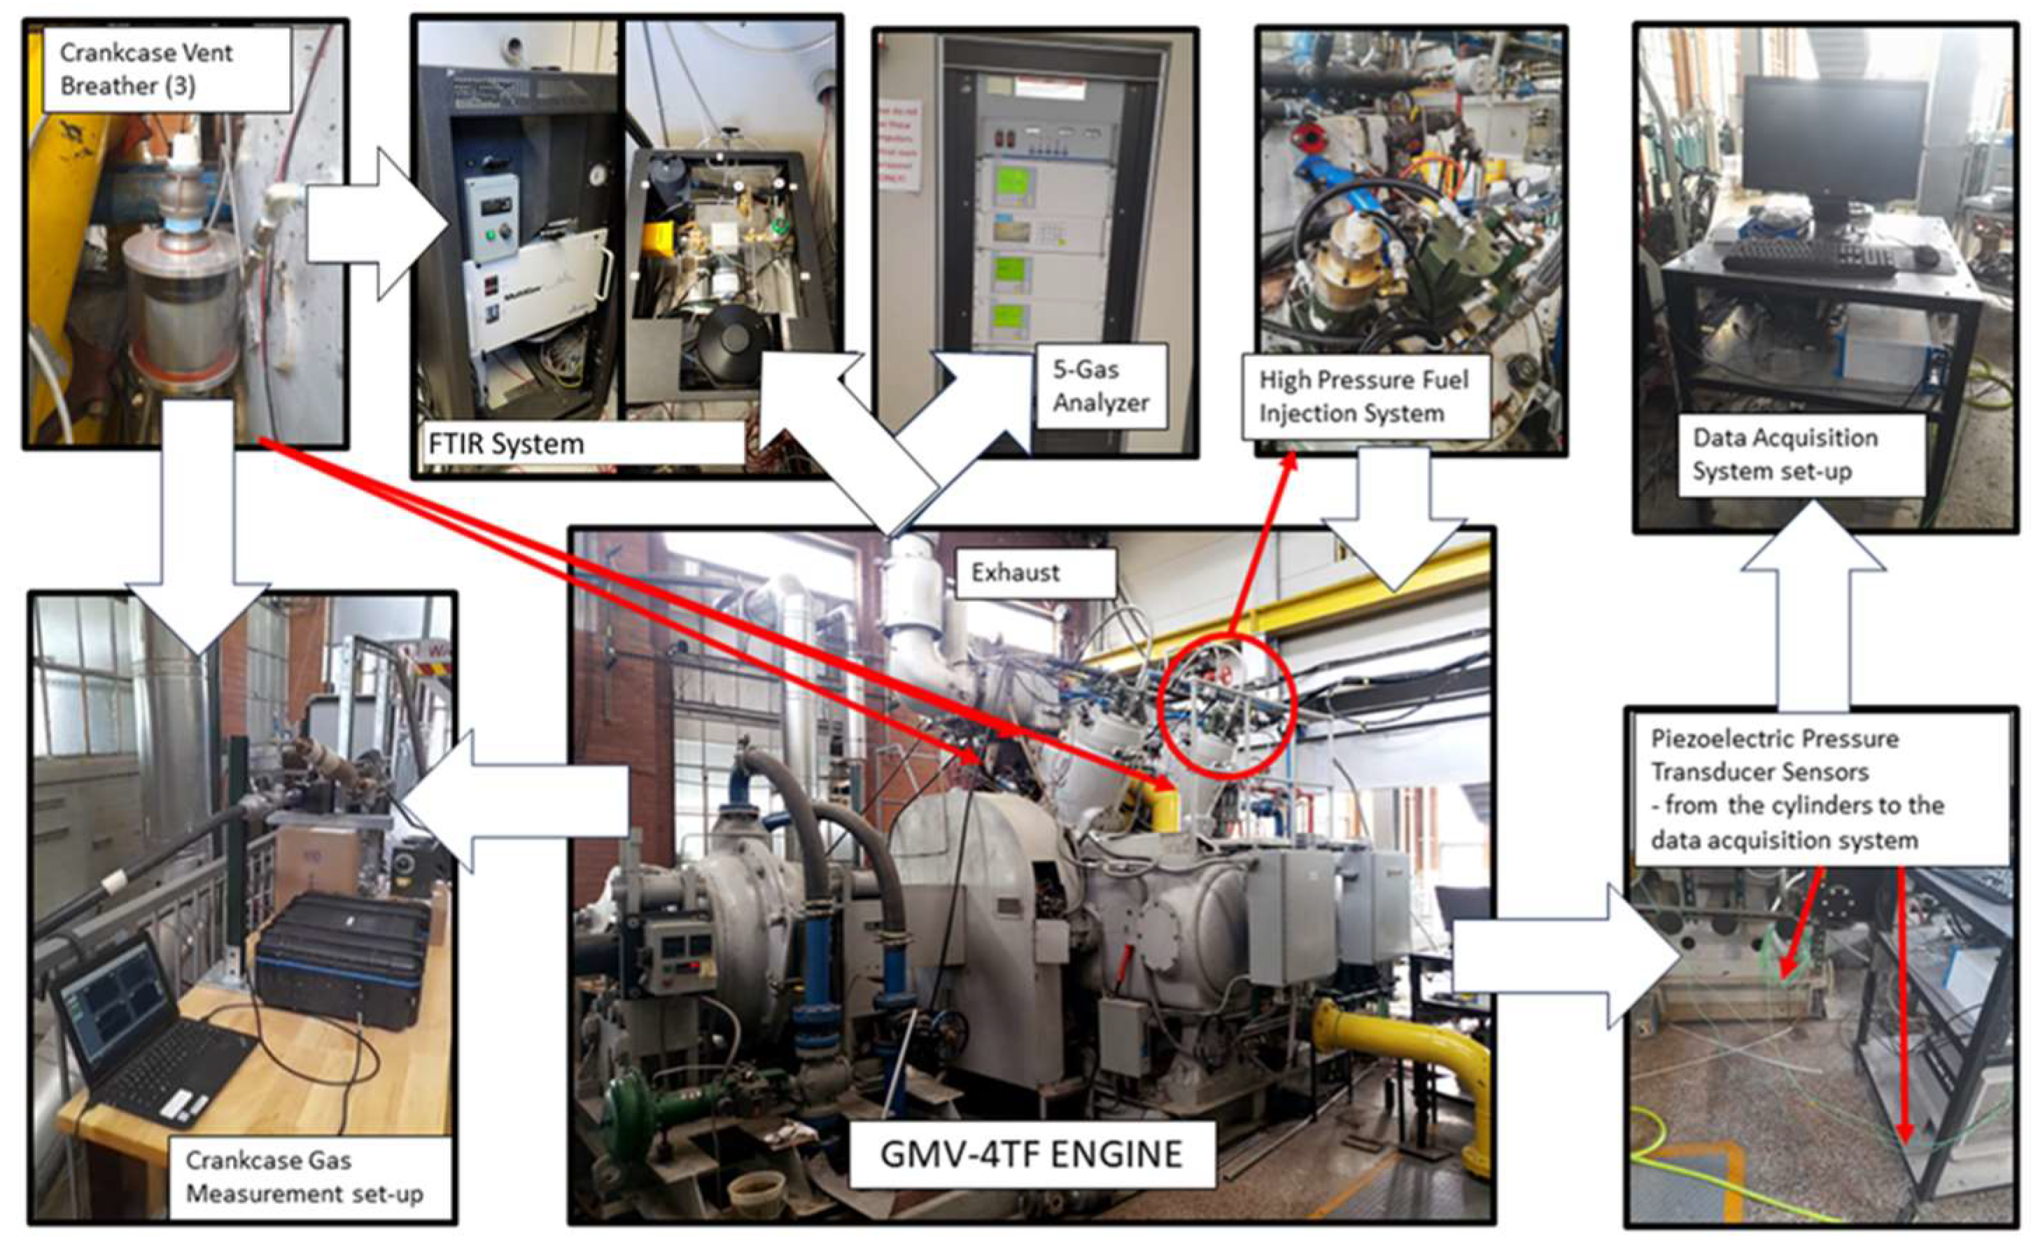
2.1. Experimental Study

For the experimental tests and analyses, the engine is equipped with a water-brake dynamometer and piezoelectric combustion pressure sensors. Sensors are calibrated using a dead weight tester and calibrated using the DAQ channel and charge amplifier used during testing. The DAQ hardware is 16-bit resolution at a range of 0–10 V, the pressure sensor is Kistler 6125 (by Kistler Group, sourced online at Kistler.com) and the charge amp is also Kistler. The pressure sensor has a measuring range of 0–300 bar (4351 psi) and thermal shock error in terms of peak pressure as ≤±1.5% and ≤±1% in terms of IMEP. The sensors were instrumental in collecting high-speed combustion data and were analyzed in real time to determine the peak pressures (PP), indicated mean effective pressure (IMEP), location of peak pressures (LoPP), and their respective coefficients of variation (COVs) in each of the four cylinders. The peak pressures and IMEP values were all monitored on the screen in the control room, as the engine is highly instrumented and equipped with advanced combustion analysis and emissions measurement equipment. As each cycle is completed, the peak pressure is located and the amplitude measured in real-time. The IMEP is calculated for each cycle as the cycle is completed via trapezoidal numeric integration method. This is all done inside of a LabVIEW application developed at Colorado State University (CSU) for the purposes of combustion analysis [13]. Also, an automated turbocharger simulator was used to control the boost and exhaust pressures to 110 kPa and 101 kPa, respectively, to create sea-level atmospheric conditions, as the testing was done in Fort Collins, CO, USA, at an elevation of 5000 ft (1525 m). All engine operating parameters, including temperature, pressure, and humidity of fluids and combustion air, are closed-loop controlled via the test cell control system. Figure 3 shows an overview of the setup for the experimental test. To evaluate the species composition and amounts in the engine exhaust, a Fourier transform infrared (FTIR) spectrometer and a 5-gas analyzer were utilized. The crankcase vent was also set up with sensors to record the amount of mass flow rate, pressure, and temperature. The FTIR and 5-gas analyzers were also used to evaluate the gas composition in the crankcase vent.
The engine was run at rated speed and load, and the NOx level was fixed at 0.4 ± 0.1 g/bhp-hr using a NOx sensor-based feedback control system [14], with an outlier (0.705 g/bhp-hr NOx) occurring with fuel injected at 500 psi injection pressure and −140 degrees start of admission (SOA). Combustion balancing was done with a cylinder-to-cylinder average peak pressure tolerance of ± 5% and a cylinder-to-cylinder location peak pressure tolerance of ± 1 degree. The configuration of the engine for this study included the use of high-pressure fuel injection valves and original equipment manufacturer (OEM) pre-combustion chambers (PCCs). The combustion and performance results from the cylinder marked as Cylinder #2 were specifically monitored and evaluated for CFD validation. The test plan included variations in injection pressure and injection timing. A Woodward fuel injection controller governed engine speed at each injection pressure by varying injection duration at a fixed start of fuel admission (SOA). The injection duration varied by changing the end of fuel admission (EOA). Table 1 shows the engine test matrix. Fuel injection pressures were varied from 150 psi to 650 psi (the maximum attainable pressure for the engine natural gas supply system). Injection pressure was controlled via a closed loop pressure controller integrated into the high-pressure compressor system. The maximum pressure of 650 psig was determined by the maximum pressure the gas compressor system could sustain for prolonged operation to ensure consistent test conditions. The start of fuel admission was evaluated for early, nominal, and late fuel injection at various pressures.

2.2. Computational Study

The CFD model used for the computational part of this study was set up in CONVERGE Studio v 3.0 after the computer-aided diagram (CAD) was completed and imported from SolidWorks into Converge Studio [15]. Converge is a commercially available CFD software that has the advantage of its automatic mesh resolution (AMR) and is useful for understanding the complex fluid dynamics of internal combustion engines. In this study, the CFD model was simulated under different conditions, giving insight into the behavior of events in the combustion chamber of the engine. A very important contribution of the CFD simulations to this study was the crevice volume model, which gave relevant results on the action of the ring pack in terms of methane emissions in the exhaust and crankcase of the GMV-4TF engine.

2.2.1. Baseline Case

For the baseline CFD case, the geometric model developed in Converge Studio is shown in Figure 4, with the geometric boundaries shown in Figure 5. The front view shows the cylinder, head, intake, and exhaust ports, PCC, exhaust manifold, intake manifold, and fuel injection valve. The intake and exhaust ports are shown in Figure 6, and Figure 7 shows the cross-section of the geometric model when the piston is at the top dead center (TDC) and bottom dead center (BDC). The model was set up to include the crevice volume, detailing the ring pack, which consists of four compression rings. Figure 8 shows the crevice model given by Converge, which was applied to the engine CFD model [16]. According to Namazian [17], discharge coefficients (CD) for crevice gas motion usually fall around the value of 0.86. Some other studies recommended and used an estimation of the discharge coefficient using the expression CD = 0.85–0.25 (PD/PU)2 [18,19]. In this present study, the model did not match the experimental data pressure trace when a default discharge coefficient (0.86) was used and yielded a blowby rate that was ~70% of the experimental blowby rate. On reducing the discharge coefficient to 0.15, the pressure trace improved, but the blowby rate was ~77% of the experimentally recorded blowby rate. After several simulations, the discharge coefficient was tuned to be 0.25 based on the pressure trace and blowby results from experimental data. The rings in the ring pack together form a crevice volume in the spaces between each of them and the cylinder wall, between each ring and the piston, and between the piston and cylinder wall. The dimensions of the first ring are different from those of the other three identical rings, as shown in Table 2. The geometric details and configuration of the CFD model are shown in Table 2. The dimensions for the crevice volume model are also included in the table.
The CFD model consisted of a full two-stroke cycle, including scavenging and combustion processes. The baseline case was set up to depict fuel injection at a pressure of 500 psi and injection timing of 120 degrees BTDC, which is the nominal point from previous engine operations, which showed that fuel consumption, formaldehyde, and NOx are minimized at an SOA value of −120 degrees [13]. The combustion pressure in the main cylinder was tuned based on the LoPP from previous experimental data [13] by varying ignition timing. In each of the Cartesian x, y, and z axes, a stable grid size of 8 mm was determined after a lower grid size of 4 mm did not suit the complexity of the model. The Courant–Friedwichs–Lewy limits for the engine model two-stroke cycle were determined and applied. The initial, minimum, and maximum time steps specific to this engine model were 5 × 10⁻⁷, 1 × 10⁻⁸, and 2 × 10⁻⁵ s, respectively, which were sufficiently small to avoid extrapolation errors.
The solver employed successive over-relaxation (SOR) methods to solve equations related to momentum, pressure, density, energy, species, TKE, dissipation rate, elliptic relaxation function, velocity scale ratio, radiation, and wall distribution [20]. Berkeley’s GRI 3.0 chemical mechanism was applied to this model with 5 elements, 53 species, and 325 reactions [21,22,23].

2.2.2. Late Cycle High-Pressure Fuel Injection Cases

The subsequent CFD cases that were run after the baseline were targeted at evaluating the effects of late-cycle high-pressure fuel injection on methane in the ring pack and blowby. The injection pressures and injection timing configurations were in line with those from the experimental study detailed in the preceding sections of this study but focused on 500 psi and 650 psi fuel injection. For each pressure, the start of admission was evaluated at 120, 100, 80, and 60 degrees BTDC. The injection duration was calculated assuming it was inversely proportional to injection pressure for 650 psi fuel injection, based on a given duration of 20 degrees for the 500 psi case. The level of mixing in the main cylinder was quantified in terms of S D , a measure of heterogeneity that reports the standard deviation of the equivalence ratio of all spatial points in the main combustion cylinder. The parameter is described below and falls between 0 and 1.
S D = i n a v e i 2 n 1
where S D is the equivalence ratio standard deviation, i = individual spatial point, n = number of spatial points, a v e = average equivalence ratio and i = equivalence ratio at each spatial point in the engine cylinder (main combustion chamber).

3. Results and Discussion

3.1. Experimental Study

The results from the experiments conducted on the GMV-4TF engine show the performance and emission characteristics of the engine. Table 3 shows the summary of all the average peak pressures and locations of peak pressures for all the data points. The location of peak pressures for all the data points was at 18 ± 1 degrees ATDC except for an outlier—fuel injection at 150 psi and 95 degrees BTDC—which had its location of peak pressure at 15.2 degrees ATDC. At this point peak, pressure location was difficult to control due to poor combustion performance. For fuel injected at 500 psi and 120 degrees BTDC (a nominal point), the cylinder pressure trace is shown for 1000 cycles in Figure 9, and the mean cycle is also shown. The mean cycle is not an actual measured combustion cycle, so the closest cycle to the mean cycle, in terms of LoPP, is referenced. The LoPP of the closest cycle to the mean cycle is at 17.1 degrees, and the peak pressure is 535.3 psi, which is within a typical range for the engine.
The initial pre-combustion chamber sweep done on the engine yielded an optimal (minimum) COV of peak pressure of 5.33% at the operating pre-chamber supply pressure of 17.8 ± 2.0 psi. This range of PCC pressure was used at all data points while testing. Figure 10 shows the COV of peak pressure vs. start of admission (SOA) values. The injection timing gets later in the cycle, going from left to right. All the points are well below the acceptable maximum value of 10% and indicate acceptable engine stability during the experiments. Figure 11 shows the COV of the indicated mean effective pressure (IMEP), and all points are below the maximum acceptable COV of IMEP (3%). The outliers are extreme points for very early injection of fuel at 500 psi and 140 degrees BTDC and very late injection of fuel at 150 psi and 95 degrees BTDC.
The injection duration varied inversely with increasing pressures, as shown in Figure 12. The injection duration for 150 psi appears to be too long, and that of 650 psi appears to be too short. The extremely long duration of the 150 psi cases and the extremely short duration of the 650 psi cases are a result of closed-loop engine speed feedback control of injection duration. Poor combustion performance at 150 psi results in a longer duration than expected based on the inverse ratio of injection pressures compared to a baseline of 500 psi.
The brake-specific fuel consumption (BSFC) under the different imposed fuel injection conditions is shown in Figure 13. For fuel injected at 150 psi, the BSFC values reduce slightly with imposed late injection timings and then sharply decline at a start of admission (SOA) value of 95 degrees BTDC. In general, BSFC is substantially higher for 150 psi than the other pressures, supporting the assertion above that combustion performance is poor at 150 psi. The BSFC values for the test conditions at 300 and 650 psi have a slightly decreasing trend for late fuel injection at all the SOA values that occur later in the cycle. The 500 psi BSFC values are seen to first decrease and then level with late-cycle fuel injection. Brake thermal efficiency (BTE), shown in Figure 14, follows an inverse trend compared to BSFC. The general trends of fuel consumption and brake thermal efficiency with late-cycle fuel injection are both results of effective fuel conversion when fuel is injected after exhaust ports close, as there is more time for fuel and air mixing. Additionally, as injection pressure increases the overall performance is improved (lower BSFC and larger BTE) due to the increase in fuel jet momentum and subsequent improved mixing. However, the overall performance at 650 psi is not as good as the 300 and 500 psi cases, which is an exception. This behavior can likely be attributed to the extremely short injection duration for the 650 psi cases. At injection durations below 10 ms, the time required to open and close the fuel valve occupies a significant portion of the duration. This condition results in increased variability in fuel delivery (injected mass per event), thereby increasing combustion instability.
Figure 15 shows methane emissions vs. injection SOA for four different injection pressures. The general trends are similar to those for BSFC, except for the 150 psi cases, which are closer in magnitude to the other cases. In general, methane emissions are minimized at the earliest injection timing, where fuel is delivered after the exhaust ports close.
Figure 16 presents the optimal points for all the injection pressures where the minimum exhaust methane emissions are recorded. The optimal methane emissions occur at −115 degrees for 150 and 300 psi fuel injection, while it occurs at −100 degrees for 500 psi and 650 psi. The lowest methane emissions are recorded at a fuel injection pressure of 500 psi and SOA at −100 degrees.
Figure 17 displays the amount of crankcase vent methane concentration measured in ppm at some test points. When fuel is injected at 500 psi, the methane concentration in the crankcase reduces steadily at later SOA values. The test points for 150, 300, and 650 psi also show a decrease in crankcase methane concentration when fuel is injected later in the cycle. Note that this contrasts with the exhaust methane emissions behavior, which displayed a minimum near exhaust port closure.
Figure 18 shows the brake-specific crankcase methane, and rather than a steady decrease for 500 psi, there is an initial decrease in the crankcase methane before a slight increase at −80 degrees and a slight decrease at −60 degrees. The minimum brake-specific crankcase methane concentration is at −60 degrees for 500 psi fuel injection. The brake-specific crankcase methane emissions are small relative to the exhaust because the crankcase mass flow is small relative to the exhaust. However, the concentration (ppm) of crankcase methane emissions is higher than the exhaust methane concentration.

3.2. Computational Study

The baseline CFD simulation was conducted using Converge Studio, with the crevice volume model included for an injection pressure of 500 psi and an SOA value of −120 degrees (the nominal point used in the experimental study). Figure 19 shows the cylinder pressure trace, which was validated with experimental data based on the location of peak pressure. The trapped air is dependent on how much pressure drop is assumed between the intake air pressure sensor and the intake system boundary, and between the exhaust system boundary and the exhaust manifold pressure sensor. Ignition timing was varied to match peak pressure location and amplitude. Other key parameters, such as fuel delivered per cycle, manifold pressures and temperatures, and speed, came from experimental data [24]. The peak pressure for the CFD baseline was 477.84 psi, and the location of the peak pressure was 17.9 degrees. The CFD baseline trace is within the data band but has a peak pressure below the average experimental pressure trace. It was decided to use this baseline case and not spend additional time tuning since the main objective of the study was to look at the relative effects of different fuel injection pressures and timing values.
The equivalence ratio standard deviation values range from 0 to 1, with the value of 0 indicating perfect mixing and 1 indicating the worst level of mixing. The level of in-cylinder mixing at the ignition point (−1.5 degrees) for each CFD case is shown in Figure 20 for 500 and 650 psi. The 650 psi cases show better mixing than the 500 psi cases for all SOA values and confirm the effect of high-pressure fuel injection on improved mixing. However, for both 500 and 650 psi fuel injection, mixing becomes poorer as the SOA values move later into the cycle. The poor mixing can be attributed to the shorter time between injection and spark for late-cycle fuel injection.
Figure 21 shows the amount of methane flowing to the exhaust from the main combustion chamber (MCC) for each simulation. This value in each case was calculated by multiplying the value of methane residue in the MCC at the end of a combustion cycle with scavenging efficiency. The results from the 500 psi cases show that the exhaust methane emissions from the MCC decline as SOA moves later in the cycle until an increase occurs at −60 degrees. The 650 psi cases show a similar trend of first decreasing until an increase is encountered at −60 degrees. For an SOA value of −120 degrees, the 650 psi case gives lower methane emissions from the MCC than the 500 psi case, but for SOA values of −100, −80, and −60 degrees, the 500 psi case performs better than the 650 psi case by giving lower methane emissions from the MCC.
The ring pack with four (4) compression rings on the piston of the GMV-4TF engine model in Converge forms crevice volumes in the engine, as shown earlier in Figure 8. Figure 22 shows the motion of the rings in comparison with the methane in the ring pack during a full cycle for the baseline case. Ring 1 is the top ring, which shows no significant motion until 62 crank angle degrees, where it is displaced by 7.62 × 10⁻⁵ m. The sign convention is such that a displacement of zero indicates the ring is seated towards the bottom of the piston, and a positive displacement indicates a movement towards the top of the piston. For ring 2, there is an oscillation up to a maximum displacement of 7.62 × 10⁻⁵ m from −61 to −13 crank angle degrees with the ring moving in its slot within the ring pack.
Ring 3 also oscillates to a maximum displacement of 7.62 × 10⁻⁵ m from −70 to 39 crank angle degrees. Finally, ring 4 oscillates to a maximum displacement of 7.62 × 10⁻⁵ m from −70 to 67 crank angle degrees. In the range of oscillations, the amount of methane in the ring pack increases rapidly. The ring movements and the increased methane in the ring pack are both attributed to the pressure difference between the main combustion chamber (MCC) and the ring pack. The region of peak pressure in the MCC corresponds to the region where the highest volumes of methane are pushed into the ring pack.
The amount of methane left in the ring pack at the end of a combustion cycle (at 110 degrees) is presented in Figure 23. For the cases of fuel injection at 500 psi, the amount of methane residue in the ring pack initially decreases at an SOA value of −100 degrees, but it peaks at −80 degrees SOA and finally goes to its lowest value at −60 degrees SOA. The 650-psi fuel injection first increases at −100 degrees SOA but follows a decreasing trend for the last three cases. Overall, the minimum methane residual in the ring pack, for both 500 and 650 psi fuel injection, occurs at −60 degrees, which is late into the cycle.
Figure 24 displays the amount of methane flowing through the ring pack (blowby) into the crankcase for all the CFD cases. The 500 psi fuel injection cases show an initial reduction in methane blowby at −100 degrees SOA but increase at −80 degrees SOA before reducing to the minimum value at −60 degrees SOA. For fuel injected at 650 psi, there is a slight increase at an SOA value of −100 degrees before a steady decrease in methane blowby through the ring pack. The minimum methane blowby through the ring pack occurs at −60 degrees for both 500 psi and 650 psi.
Figure 25 shows a flowchart describing the methane portion of the injected fuel through the main combustion chamber for the baseline case. It shows that 92.3% (by mass) of the methane introduced into the engine combustion system undergoes complete combustion. The remaining 7.7% is emitted through the MCC (4.9% by mass), ring pack (2.6% by mass), and crankcase vent (0.2% by mass).
The contribution of the MCC, ring pack, and crankcase vent (blowby) to the methane emissions from the engine for the baseline case is shown in Figure 26. The percentages are obtained using the brake-specific values of the different component sources of methane emissions. The ring pack methane residual due to the pressure difference between the main combustion chamber and the ring pack (trapped between the rings and the piston wall) leads to the outflow of methane to the exhaust during expansion and contributes to methane emissions. The results show that the ring pack contributes 33.7% of the methane emissions from the engine, which is quite significant.

3.3. Comparison between Experimental and Computational Data

The CFD results predicted that 0.2% of the injected methane in the GMV engine is emitted as blowby across the ring pack to the crankcase vent. The fuel flow into the GMV engine at the nominal point (injection pressure: 500 psi, SOA: −120 degrees) during the experimental study was 199.8 lb/hr at 439.9 bhp. With 88.5% of the natural gas being methane from the gas chromatography (GC) data, the injected methane was 182.3 g/bhp-hr. As shown in Figure 16 and Figure 17 earlier, the methane concentration and brake-specific value of methane gas in the crankcase vent were 2383 ppm and 0.02 g/bhp-hr, respectively, making only 0.01% of the injected methane. Figure 27 presents the total methane emissions indicated in the experimental and computational studies for 500 and 650 psi fuel injection at SOA values ranging from −120 to −60 degrees.
The experimental data shows the sum of methane emissions from the exhaust and the crankcase vent gas, while the computational data shows the sum of methane emissions from the MCC, the ring pack, and the blowby. For 500 psi fuel injection, the optimal point for total methane emissions occurs at −100 and −80 degrees SOA for the experimental and computational studies, respectively. At the nominal point (injection pressure: 500 psi, SOA: −120 degrees), CFD predicts that 7.7% of the injected methane escapes complete combustion, while experimental results show only 0.03% of the injected methane escaping as emissions. The higher predicted percentage of unburned methane in the CFD simulations for the blowby as opposed to the lower percentage of unburned methane in the crankcase vent recorded in the experiments is attributed to oxidation reactions that occur in the crevice volume, especially when the pressure is increasing and reacting gases and hot combustion products flow into the crevice volume, which is not accounted for in the CFD.

4. Conclusions

The exploration of fuel injection parameters—injection pressure and timing—conducted in this study showed that fuel injection timing and injection pressure have a strong impact on methane emissions in the exhaust and crankcase of large bore engines. The experimental data showed the effects of low-pressure fuel injection and the advantages of high-pressure fuel injection, as well as late-cycle fuel injection. The advantages of high-pressure fuel injection have already been established in previous work, as presented in the introduction, and were also observed during this study. The computational results were all based on the baseline case set up for CFD simulations. All the results in this study are relevant to understanding the mechanisms of methane emissions in large bore engines and are critical to mitigating these emissions. The key findings from the study include:
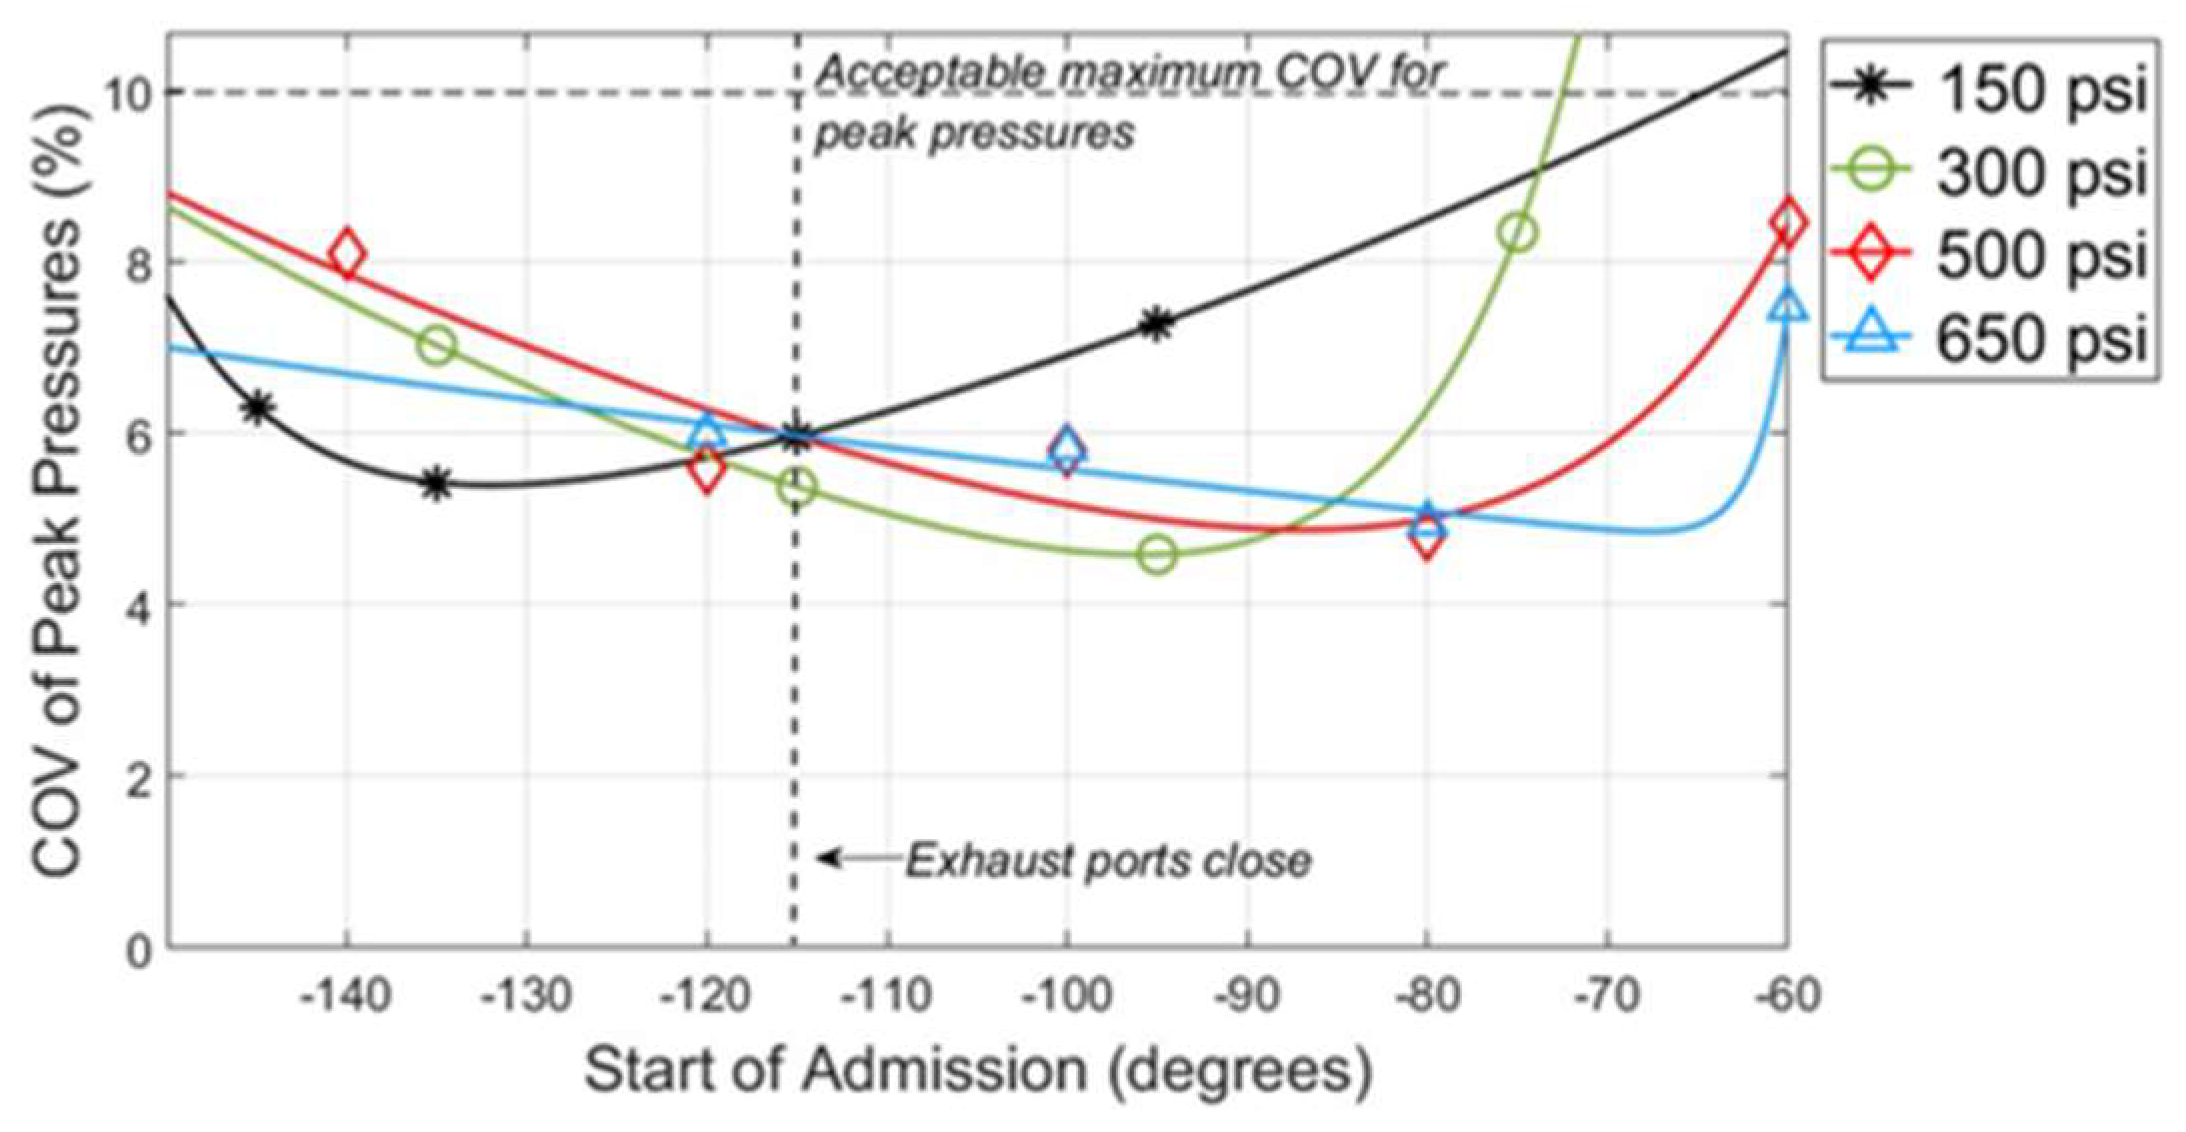
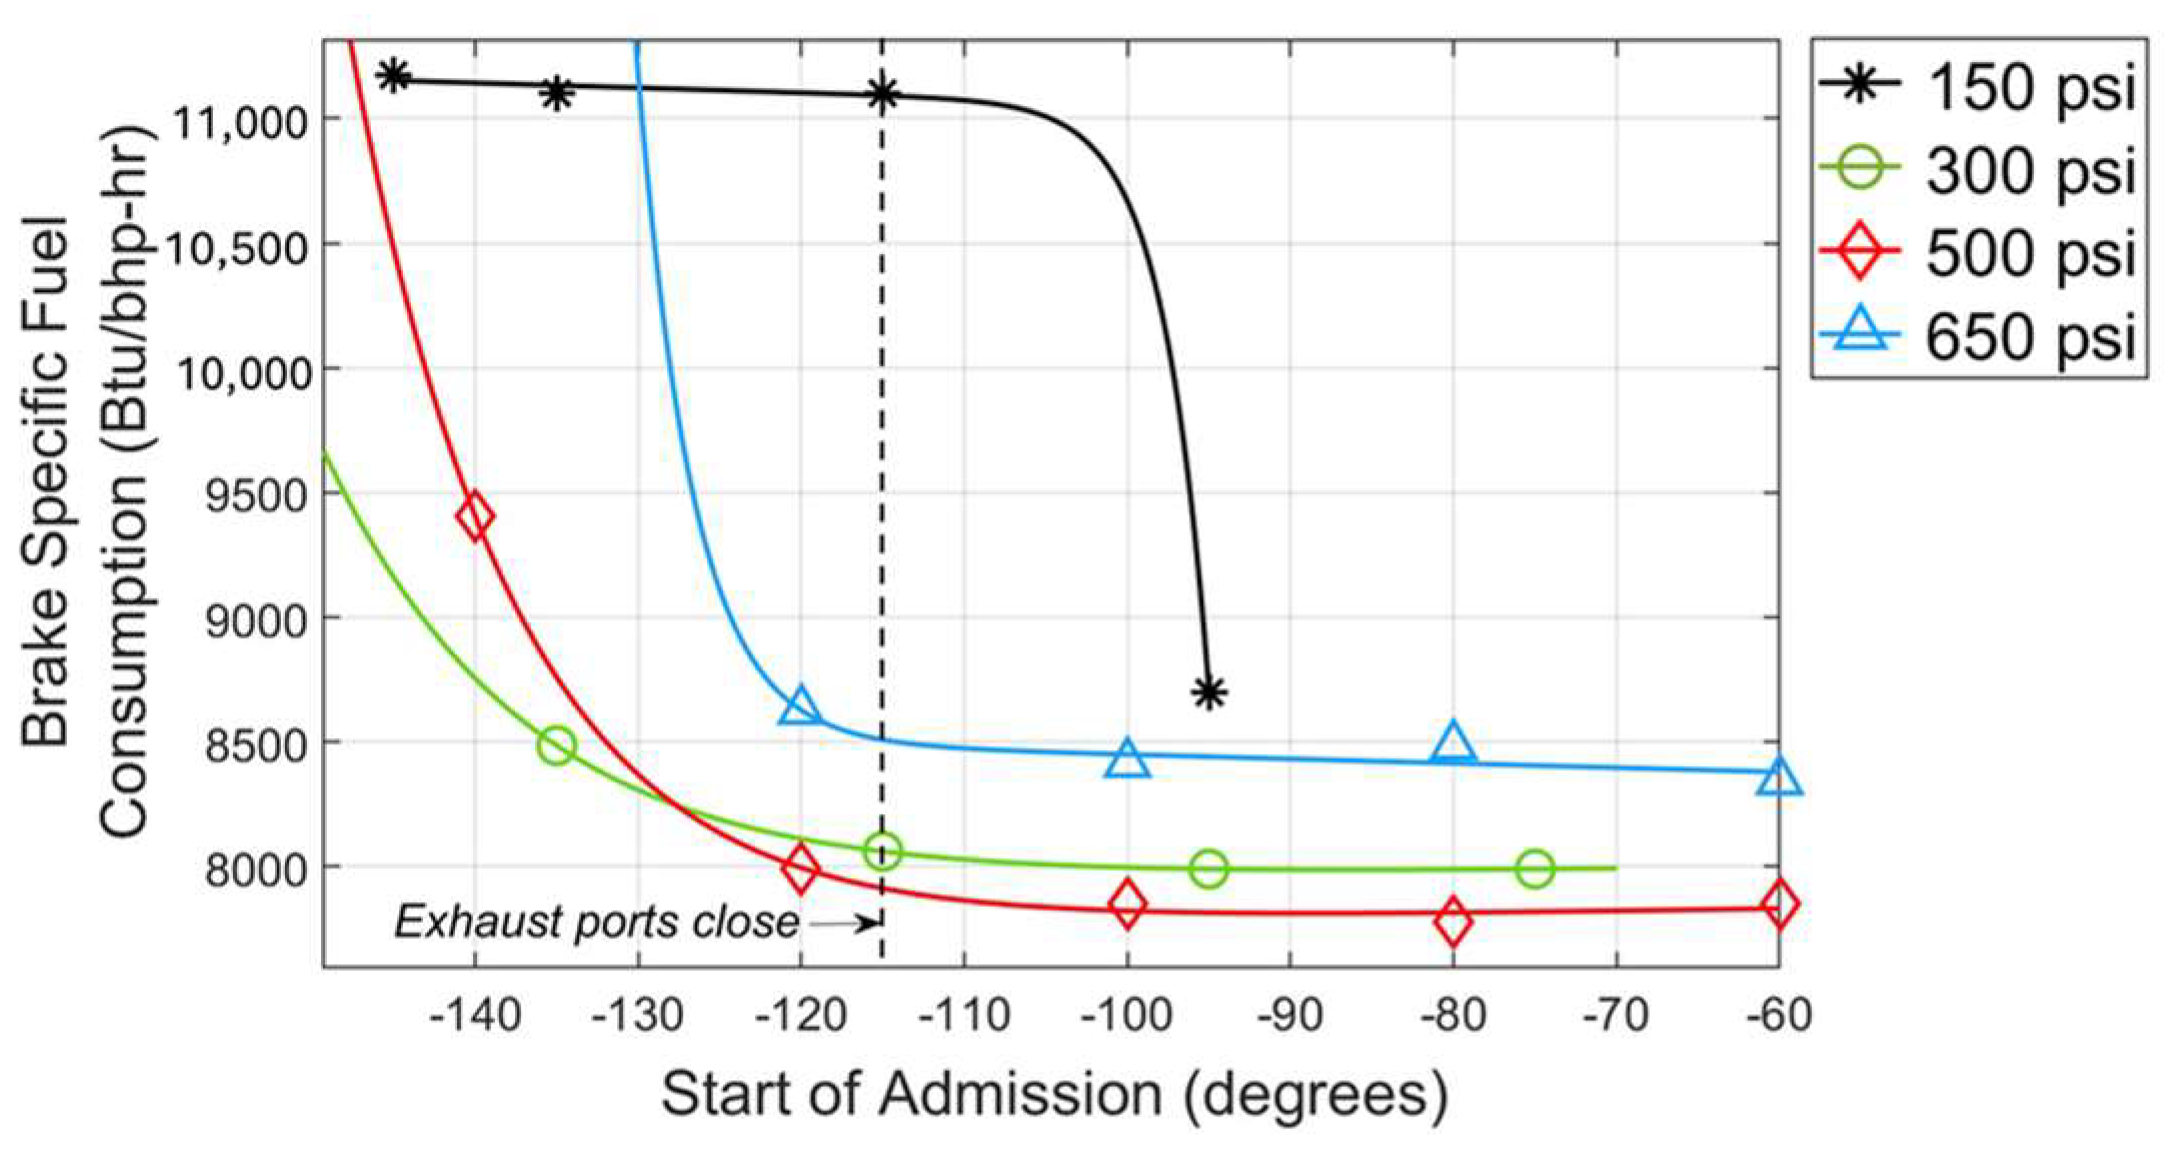
  • There is an optimal point for exhaust methane emissions based on injection timing for every injection pressure, and it occurs late in the cycle. The lowest methane emissions are encountered with fuel injection at a pressure of 500 psi and an SOA value of −100 degrees, which constitutes a 22.4% decrease from the nominal point (500 psi, −120 degrees SOA) methane emissions. There are no performance penalties or emission penalties for this methane emission reduction at the optimal point, as the COVs are minimized and fuel consumption is reduced. There are also no emissions penalties due to the NOx control loop employed, which keeps NOx constant. There are also reduced CO, THC, VOCs, and formaldehyde emissions at the optimal points for 500 and 650 psi, but it is not necessarily so for the cases at 150 and 300 psi, where these emissions tend to increase with late-cycle fuel injection.
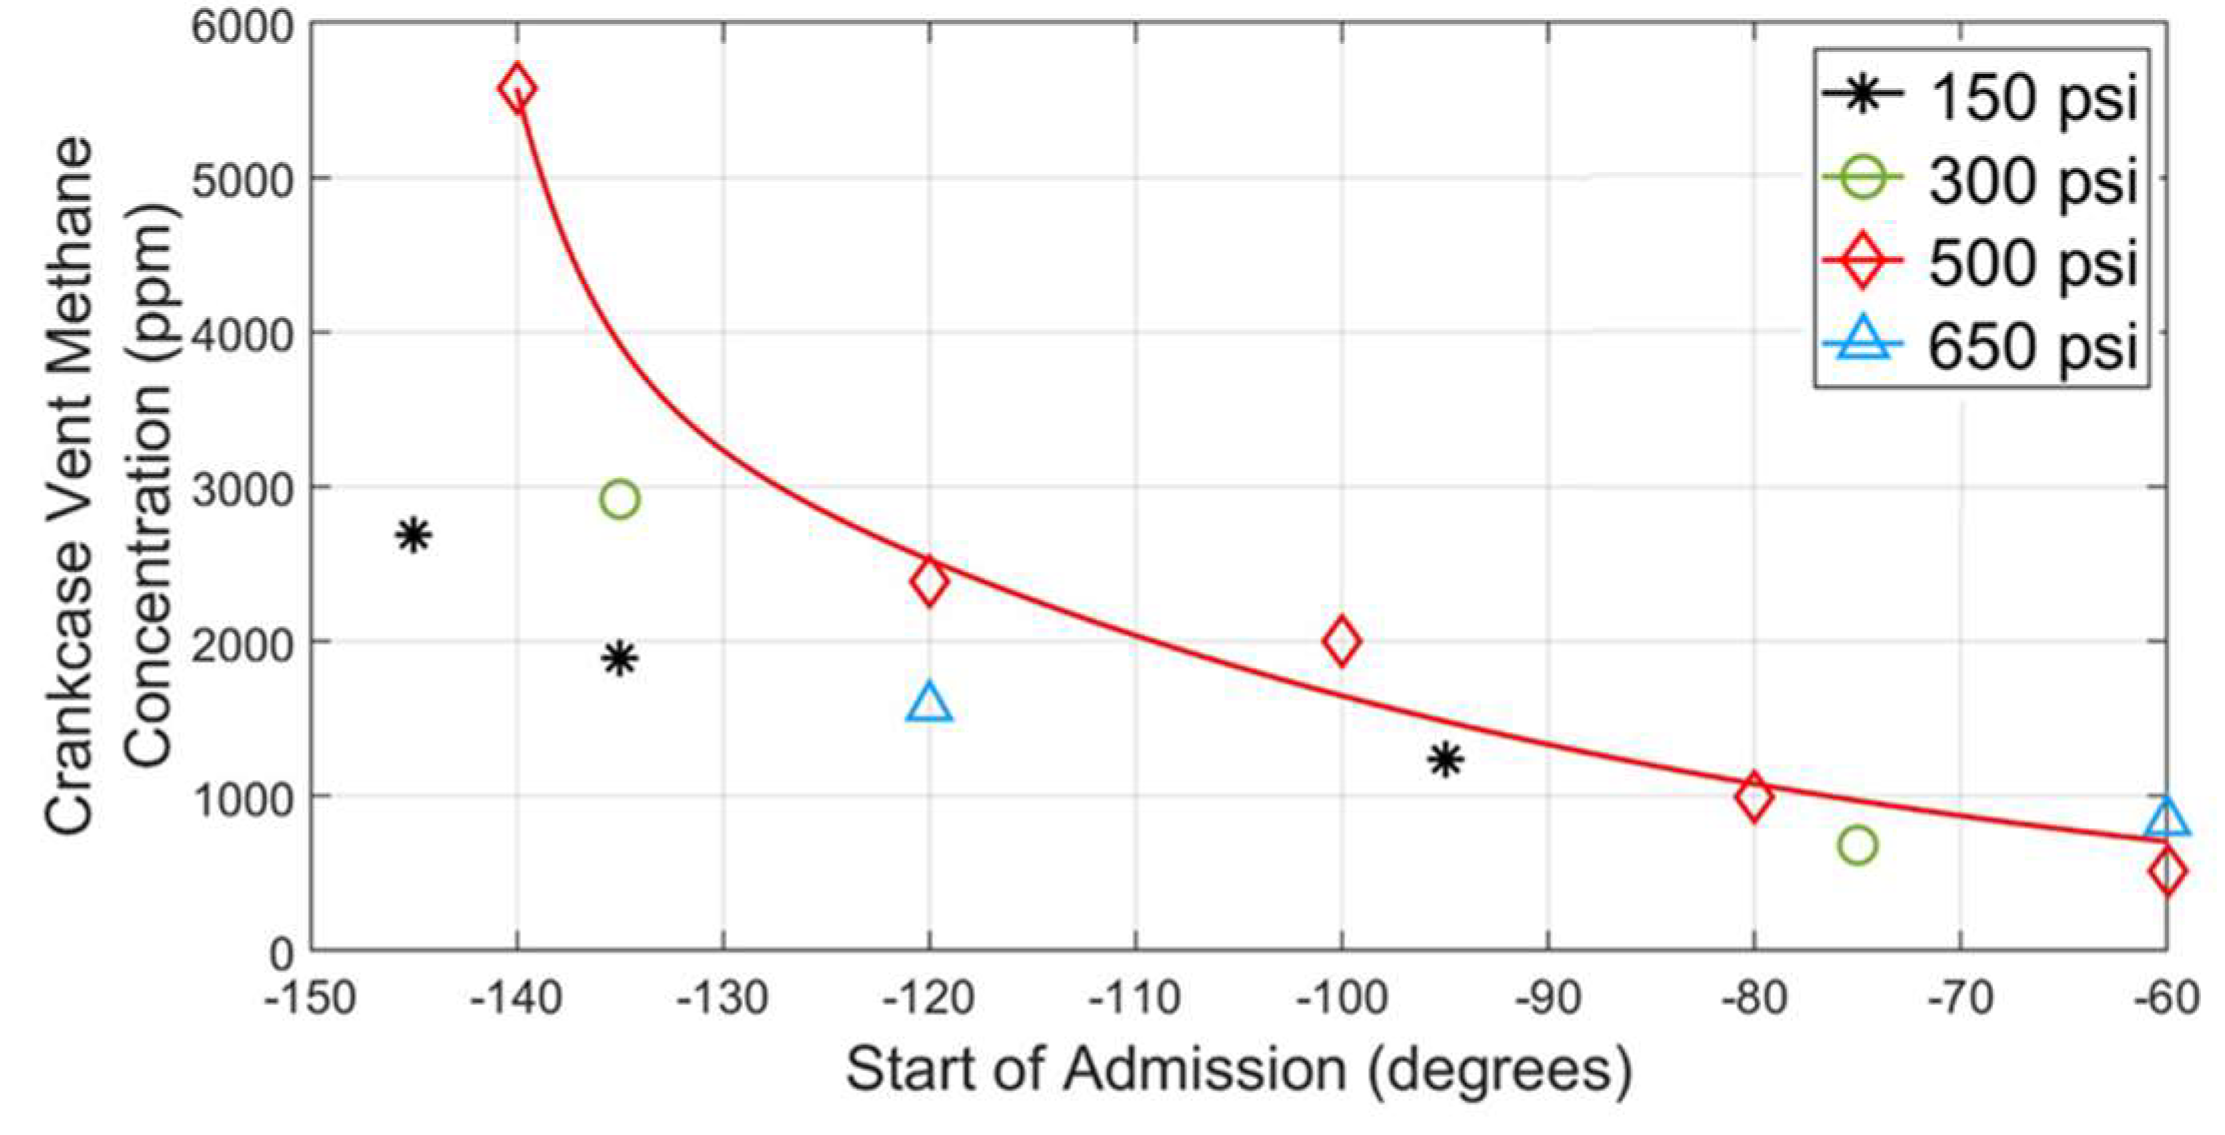
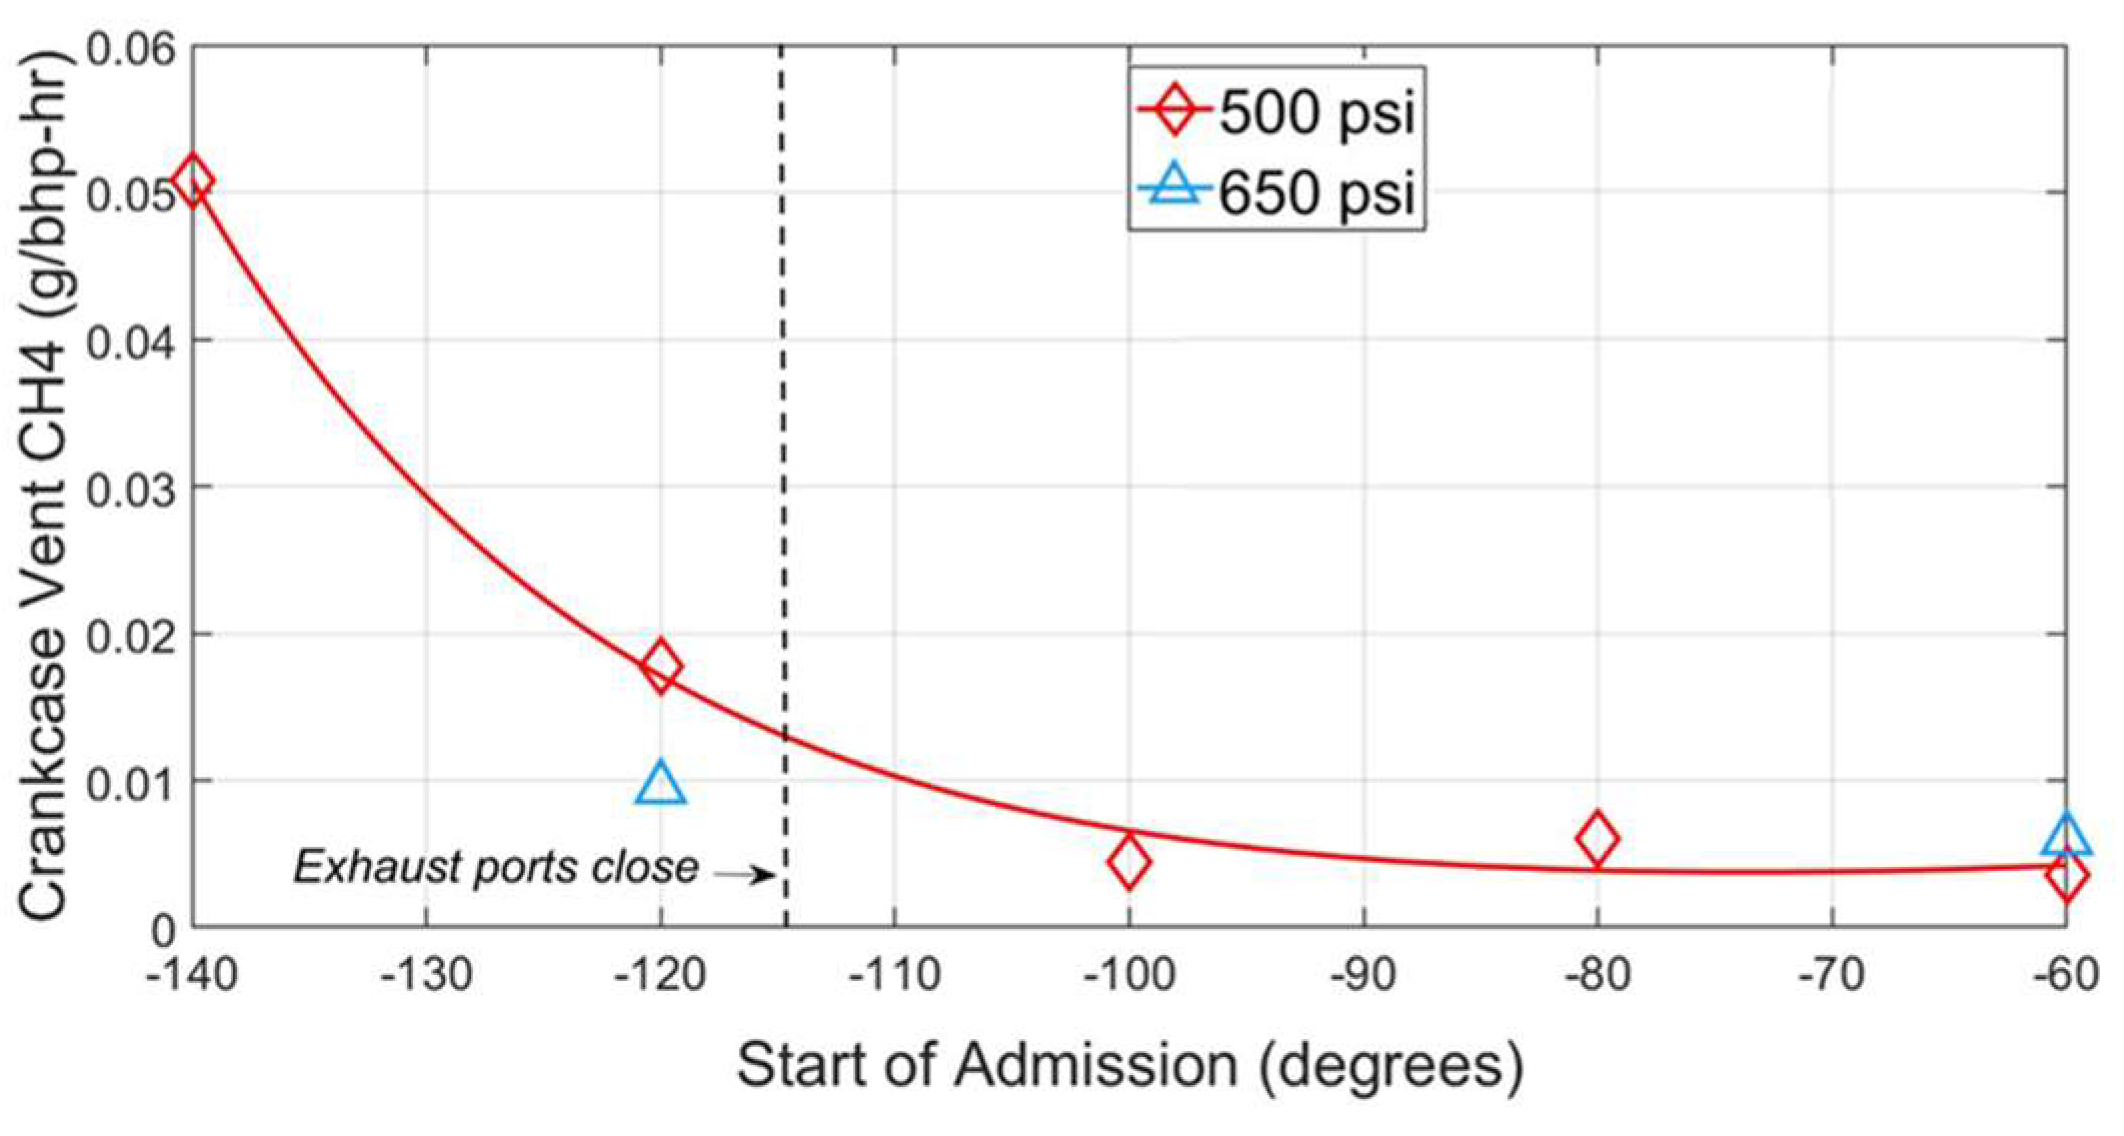
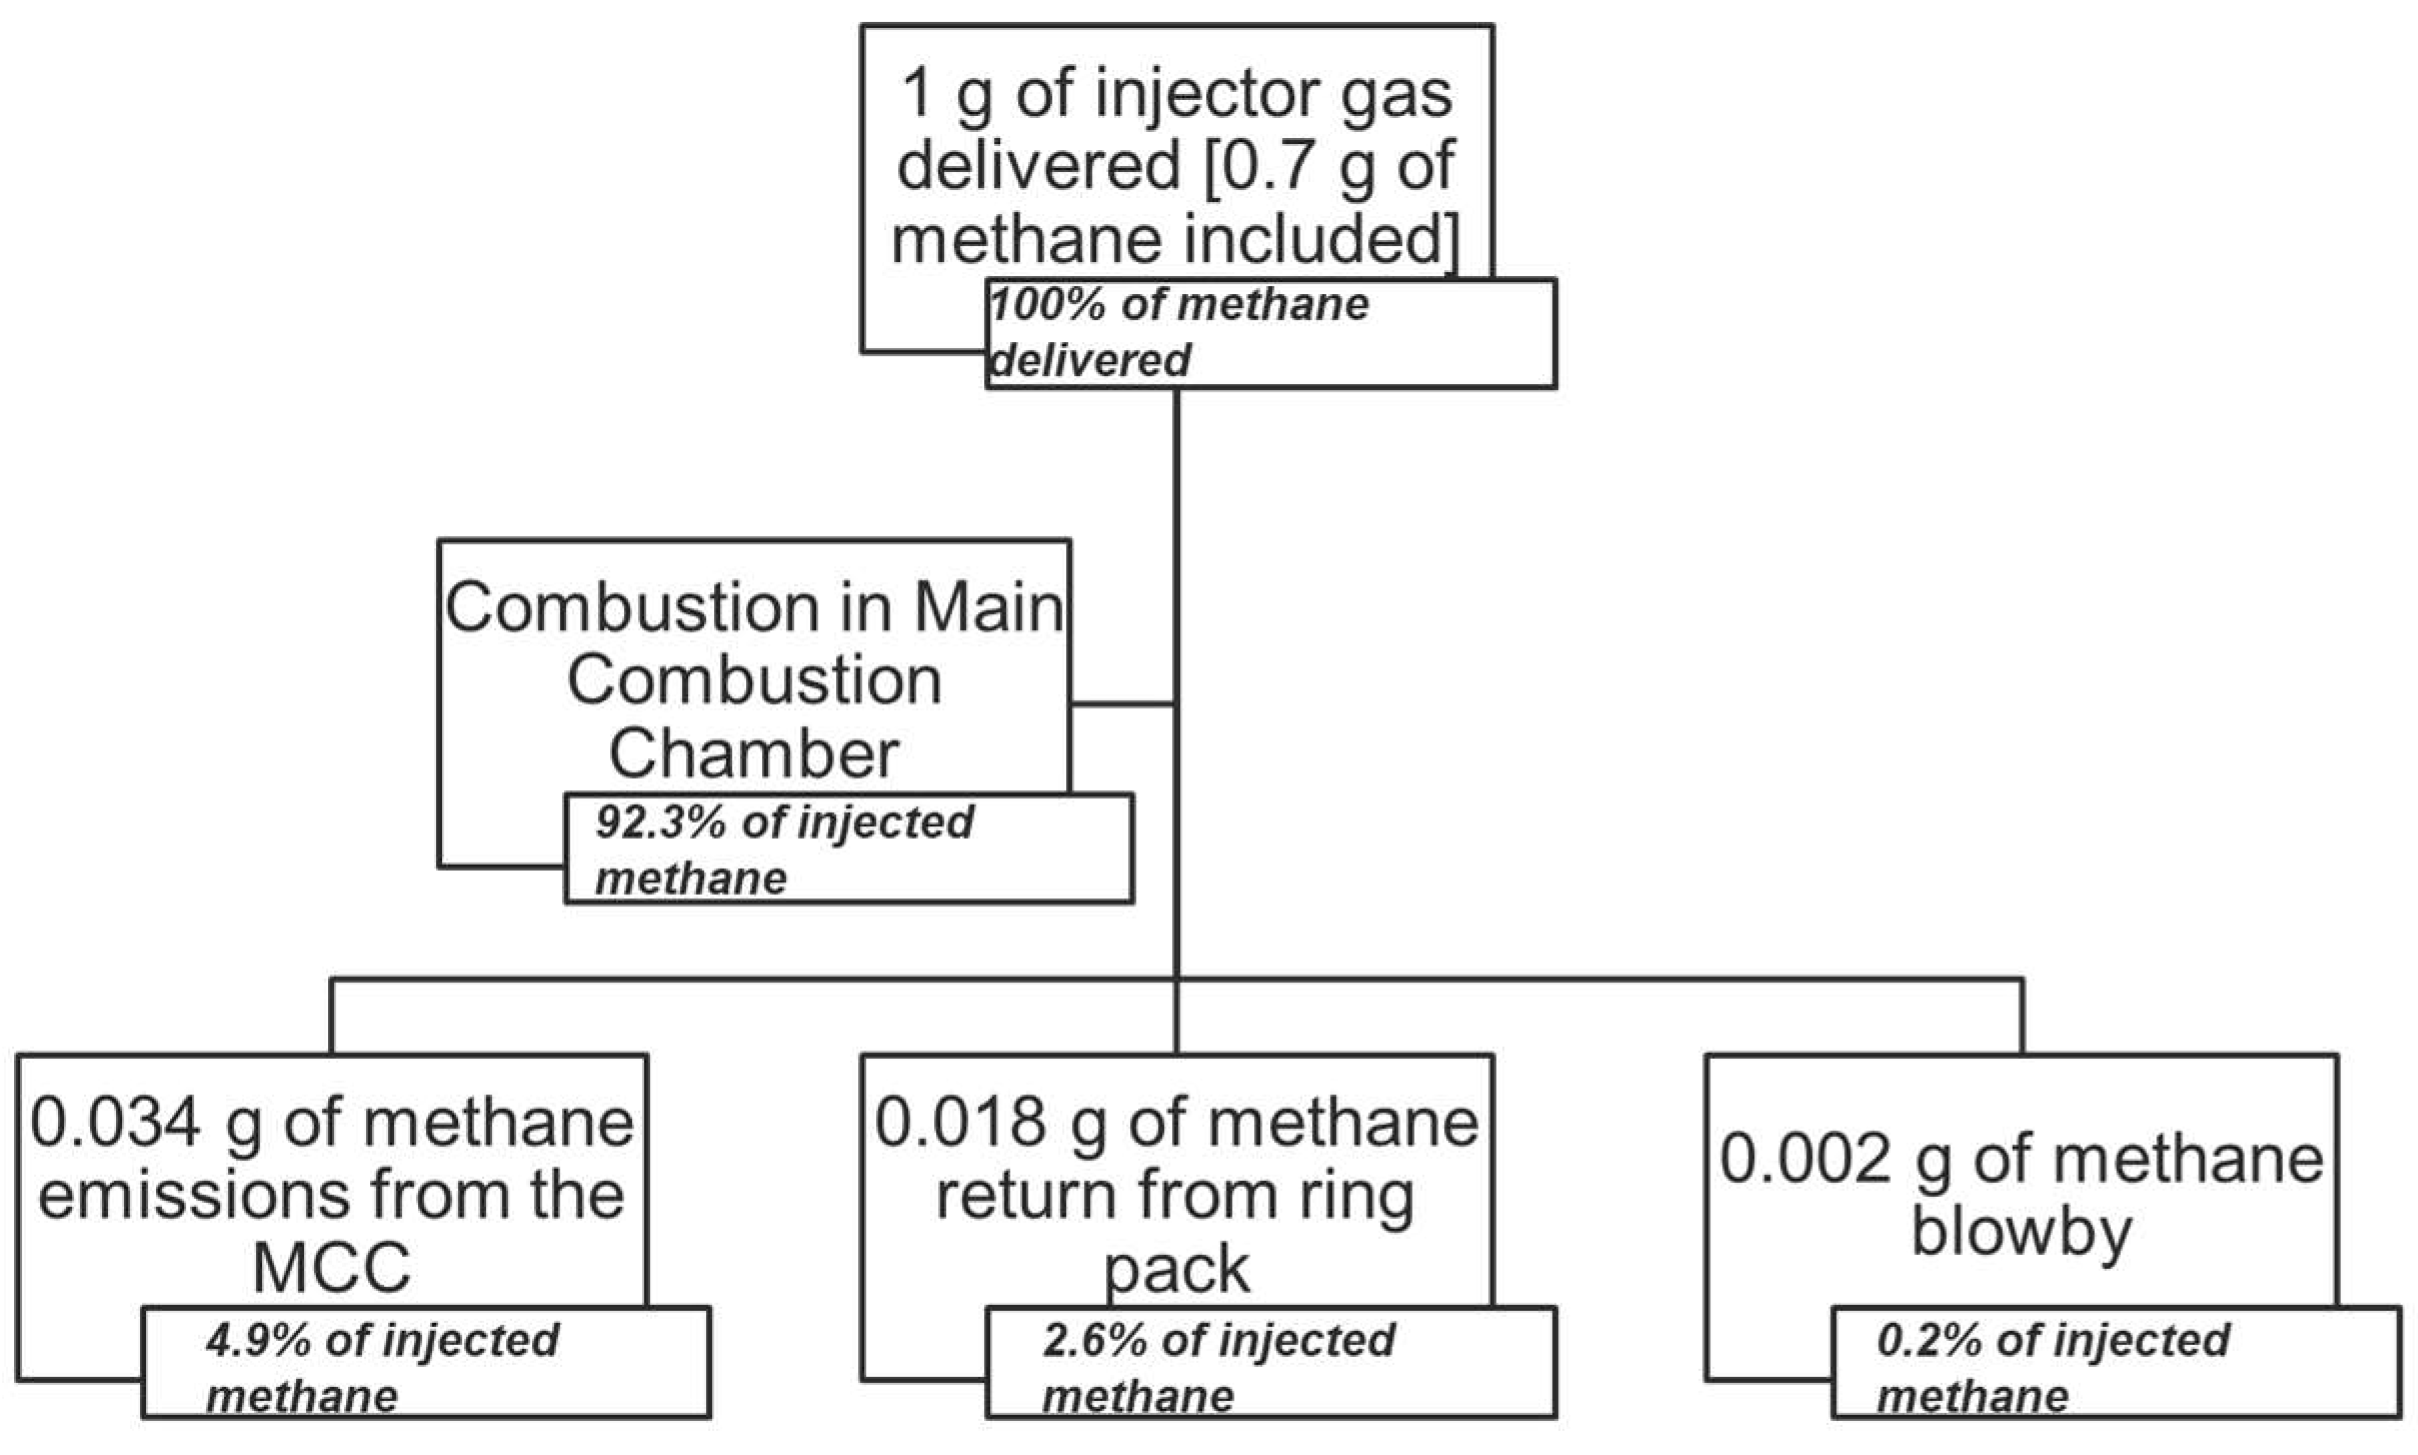
  • Late-cycle fuel injection reduces crankcase methane emissions as less unburned fuel can flow to the crankcase when fuel is injected after exhaust ports close. Crankcase methane emissions are influenced by fuel injection timing, as shown both by experimental data and results from computational simulations. The measured crankcase vent methane in the experimental study has a constant decline at 500 psi as the SOA values move later in the cycle. The amount of methane blowby through the ring pack also declines with late-cycle fuel injection, as shown through the simulation results.
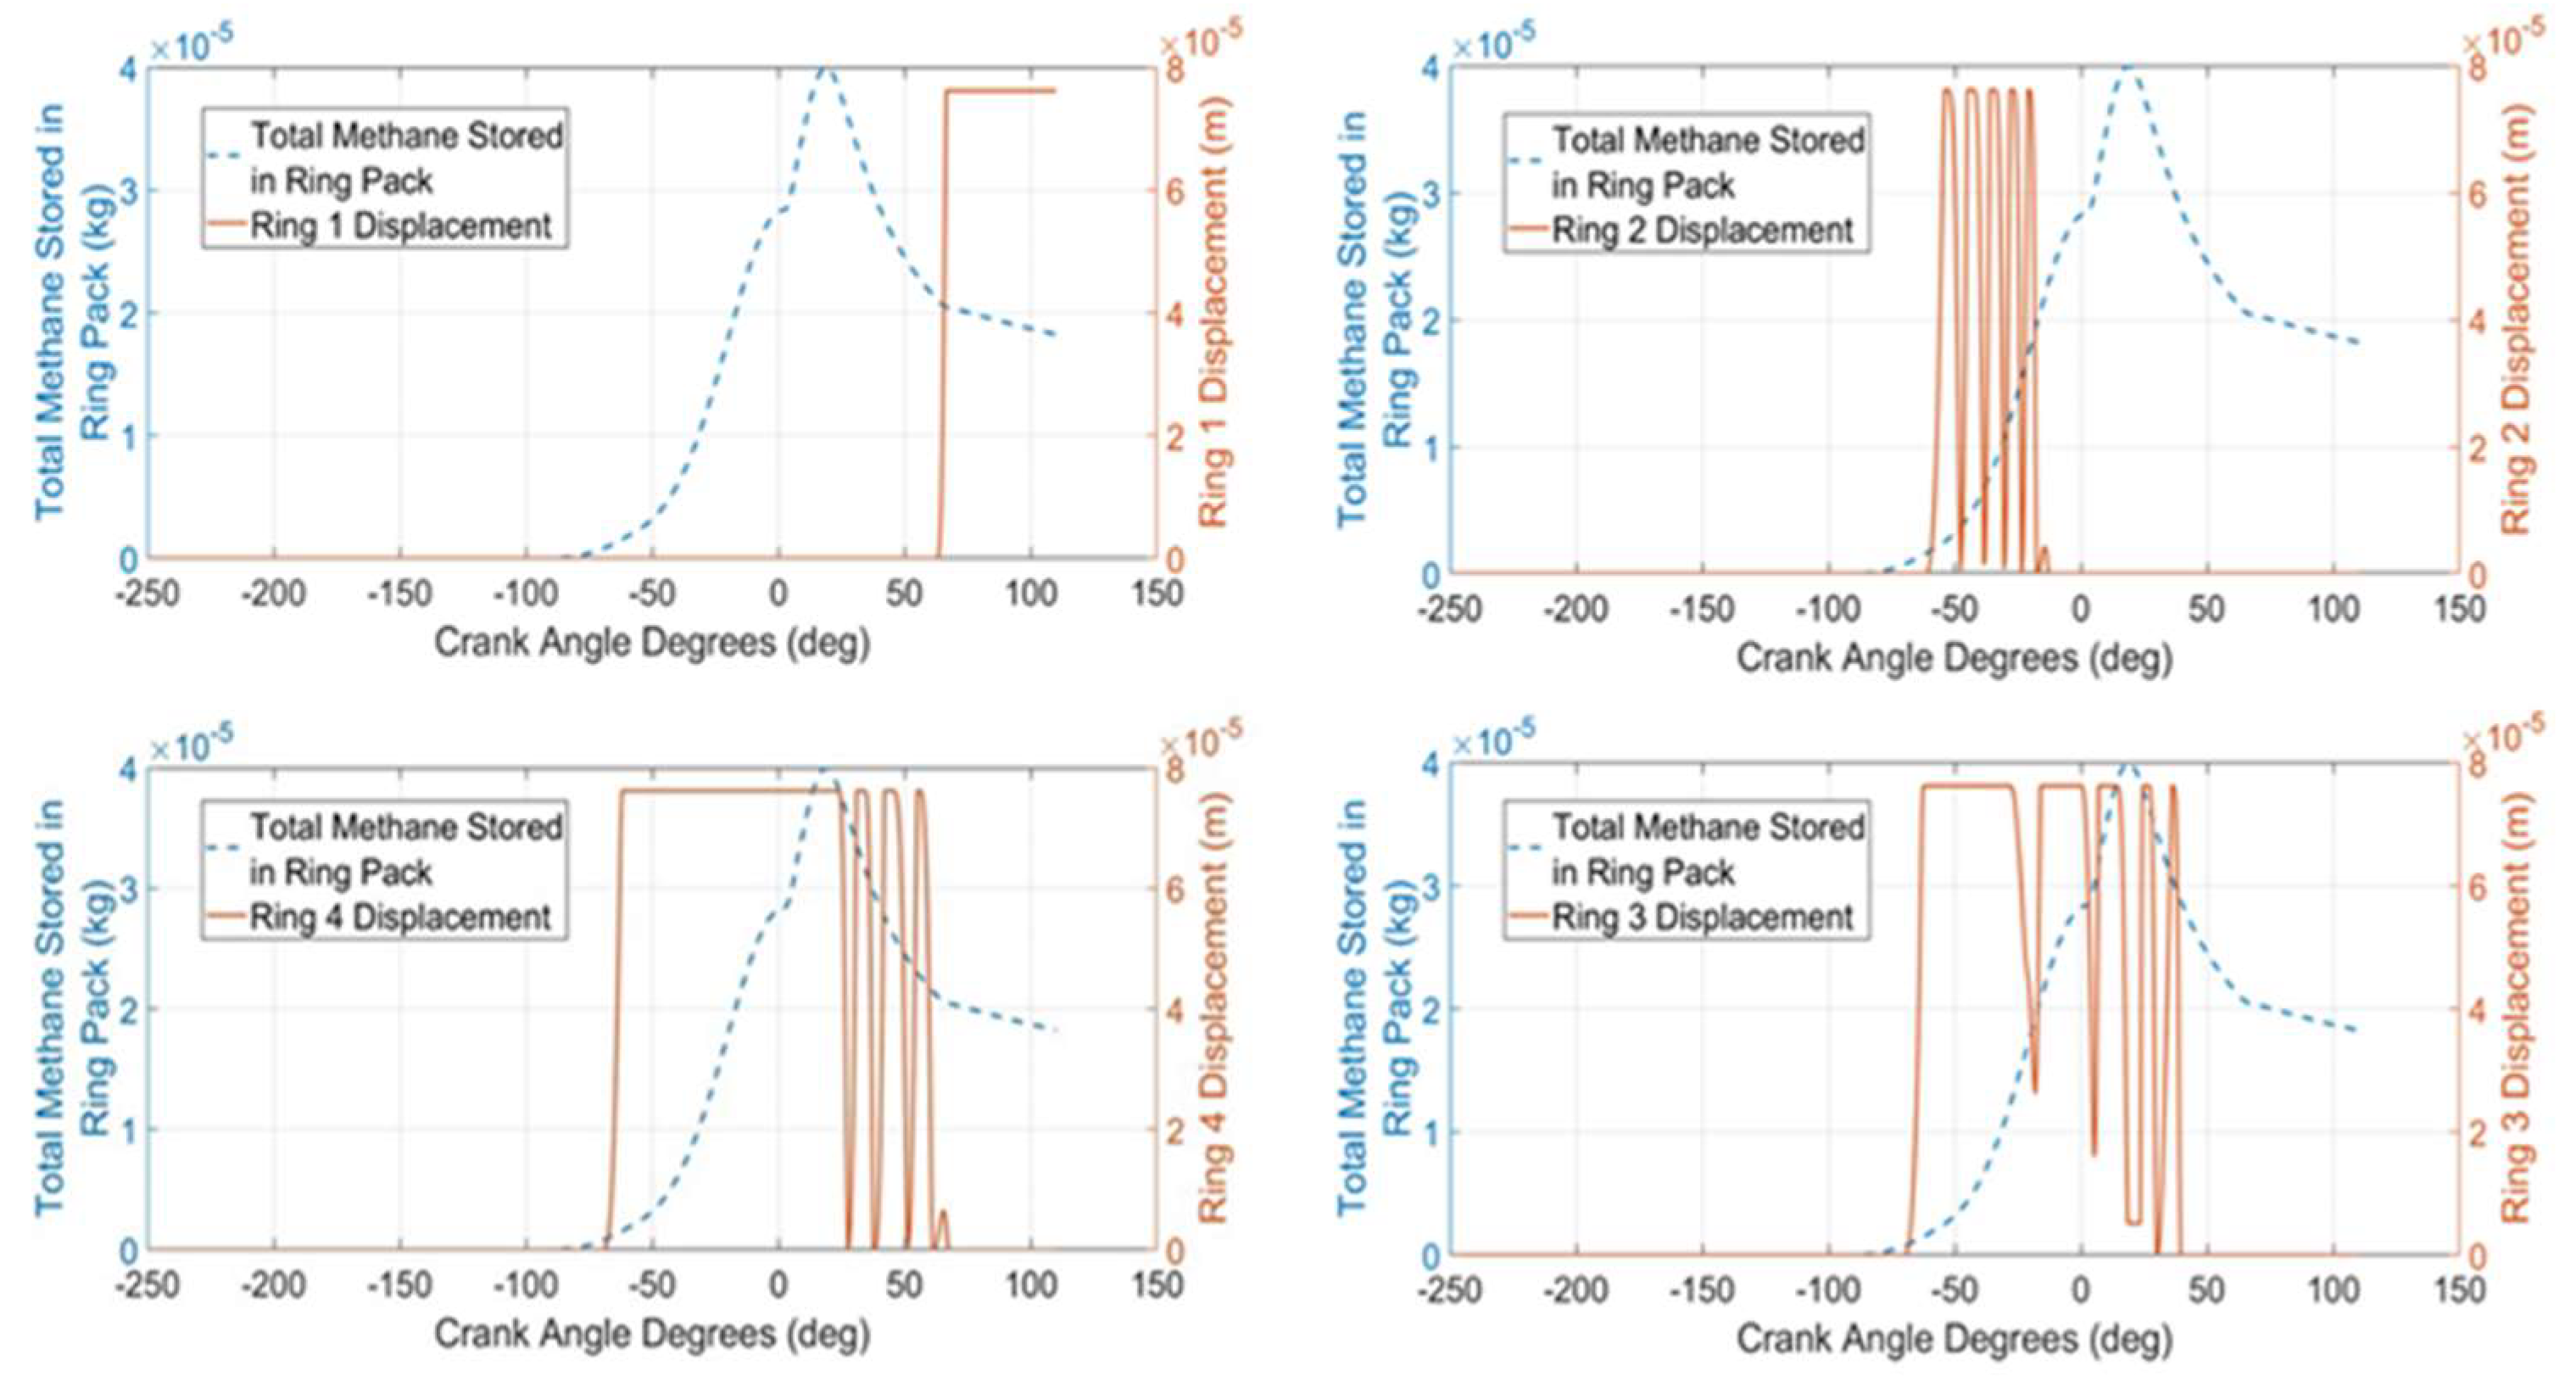
  • The ring pack contributes a significant portion to methane emissions in large-bore, natural-gas-fueled two-stroke engines. Approximately one-third of the methane emissions from large bore engines come from methane residuals in the crevice volumes in the compression ring pack of the engine.
The limitations of this study include the application of the effect of one cycle to the thousands of cycles run in the GMV-4TF engine and the complex fluid flow modeled with assumptions on the injected gas properties in the CFD model. Future studies should evaluate the limits of existing fuel injection systems for high pressures and investigate better ways of achieving high-pressure fuel injection with sufficient injection durations. More investigation can also be done to validate the CFD model to match up completely with experimental data. To further explore the benefits of late-cycle high-pressure fuel injection, the concept should be implemented in the field.

Author Contributions

Conceptualization, D.B.O.; methodology, D.B.O.; software, T.I.B.; validation, T.I.B. and D.B.O.; investigation, T.I.B. and D.B.O.; resources, D.B.O.; data curation, T.I.B.; writing—original draft preparation, T.I.B.; writing—review and editing, D.B.O.; visualization, M.P.; supervision, D.B.O.; project administration, G.A.; funding acquisition, D.B.O. All authors have read and agreed to the published version of the manuscript.

Funding

This work was funded by the Compressor and Pump Station Technical Committee of the Pipeline Research Council International under contract project code CPS17-08 and contract code PR179-21205.

Institutional Review Board Statement

Not applicable.

Data Availability Statement

The original contributions presented in the study are included in the article, further inquiries can be directed to the corresponding author.

Acknowledgments

The test crew and team members included Kirk Evans, Mark James, Nelson Xie, Colin Slunecka, Greg Vieira, and Rachel Lorenzen. Convergent Science provided CONVERGE licenses and technical support for this work.

Conflicts of Interest

Gregg Arney was employed by the Southern California Gas Company. Mark Patterson was employed by the Cooper Machinery Services. The remaining authors declare that the research was conducted in the absence of any commercial or financial relationships that could be construed as a potential conflict of interest.

References

  1. European Commission. Energy, Climate Change, Environment—Methane Emissions. Available online: https://energy.ec.europa.eu/topics/carbon-management-and-fossil-fuels/methane-emissions_en (accessed on 16 May 2024).
  2. Energy Information Agency. Natural Gas Compressor Stations on the Interstate Pipeline Network: Developments Since 1996. 2007. Available online: https://www.eia.gov/naturalgas/articles/compressor96index.php / (accessed on 16 May 2024).
  3. Li, M.; Wu, H.; Zhang, T.; Shen, B.; Zhang, Q.; Li, Z. A comprehensive review of pilot ignited high pressure direct injection natural gas engines: Factors affecting combustion, emissions and performance. Renew. Sustain. Energy Rev. 2020, 119, 109653. [Google Scholar] [CrossRef]
  4. Kim, D.; Shin, J.; Son, Y.; Park, S. Characteristics of in-cylinder flow and mixture formation in a high-pressure spray-guided gasoline direct-injection optically accessible engine using PIV measurements and CFD. Energy Convers. Manag. 2021, 248, 114819. [Google Scholar] [CrossRef]
  5. Hoffmann, G.; Befrui, B.; Berndorfer, A.; Piock, W.F. Fuel System Pressure Increase for Enhanced Performance of GDi Multi-Hole Injection Systems. SAE Int. J. Engines 2014, 7, 519–527. [Google Scholar] [CrossRef]
  6. Alkidas, A.C. Combustion-chamber crevices: The major source of engine-out hydrocarbon emissions under fully warmed conditions. Prog. Energy Combust. Sci. 1999, 25, 253–273. [Google Scholar] [CrossRef]
  7. Kim, C.; Bae, C.; Choi, S. Gas Flows Through the Inter-Ring Crevice and Their Influence on UHC Emissions. J. Fuels Lubr. 1999, 108, 1181–1191. [Google Scholar]
  8. Thompson, N.D.; Wallace, J.S. Effect of Engine Operating Variables and Piston and Ring Parameters on Crevice Hydrocarbon Emissions. J. Engines 1994, 103, 718–736. [Google Scholar]
  9. Salazar, V.M.; Ghandhi, J.B. Initial Estimation of the Piston Ring Pack Contribution to Hydrocarbon Emissions from a Small Engine. J. Engines 2007, 116, 1280–1291. [Google Scholar]
  10. Baratta, M.; Misul, D.; Viglione, L.; Xu, J. Combustion chamber design for a high-performance natural gas engine: CFD modeling and experimental investigation. Energy Convers. Manag. 2019, 192, 221–231. [Google Scholar] [CrossRef]
  11. Duan, X.; Li, Y.; Liu, Y.; Liu, J.; Wang, S.; Guo, G. Quantitative investigation the influences of the injection timing under single and double injection strategies on performance, combustion and emissions characteristics of a GDI SI engine fueled with gasoline/ethanol blend. Fuel 2020, 260, 116363. [Google Scholar] [CrossRef]
  12. Venugopal, T.; Ramesh, A. Experimental studies on the effect of injection timing in a SI engine using dual injection of n-butanol and gasoline in the intake port. Fuel 2014, 115, 295–305. [Google Scholar] [CrossRef]
  13. Willson, B.; Hutcherson, G.; Hawley, S.; Willett, K. Relative Performance of High-Pressure Fuel Gas Delivery. In Proceedings of the GMRC Gas Machinery Conference, Austin, TX, USA, 6–8 October 1997. [Google Scholar]
  14. Ladd, J.; Neuner, B.; Olsen, D.B. Variable Fuel Composition Air Fuel Ratio Control of Lean Burn Engines. 2016. Available online: https://www.prci.org/Research/CompressorPumpStation/CPSProjects/CPS-14J/3427/37611.aspx?source=generalSearch (accessed on 28 May 2024).
  15. Richards, K.J.; Senecal, P.K.; Pomraning, E. CONVERGE Studio; Convergent Science: Madison, WI, USA, 2024. [Google Scholar]
  16. Richards, K.J.; Senecal, P.K.; Pomraning, E. CONVERGE 3.1 Manual; Convergent Science: Madison, WI, USA, 2023. [Google Scholar]
  17. Namazian, M. Studies of Combustion and Crevice Gas Motion in a Flow-Visualization Spark-Ignition Engine. Ph.D. Thesis, Massachussets Institute of Technology, Cambridge, MA, USA, 1981. [Google Scholar]
  18. Rakopoulos, C.D.; Kosmadakis, G.M.; Dimaratos, A.M.; Pariotis, E.G. Investigating the effect of crevice flow on internal combustion engines using a new simple crevice model implemented in a CFD code. Appl. Energy 2011, 88, 111–126. [Google Scholar] [CrossRef]
  19. Kurbet, S.N.; Kumar, R.K. Finite element modelling of piston-ring dynamics and blow-by estimation in a four-cylinder diesel engine. Proc. Inst. Mech. Eng. Part D J. Automob. Eng. 2007, 221, 1405–1414. [Google Scholar] [CrossRef]
  20. Richards, K.J.; Senecal, P.K.; Pomraning, E. CONVERGE 3.0 Manual; Convergent Science: Madison, WI, USA, 2022. [Google Scholar]
  21. Smith, G.P.; Golden, D.M.; Frenklach, M.; Moriarty, N.W.; Eiteneer, B.; Goldenberg, M.; Bowman, C.T.; Hanson, R.K.; Song, S.; Gardiner, W.C., Jr.; et al. Berkeley GRI 3.0 Mechanism. Available online: http://combustion.berkeley.edu/gri-mech/version30/text30.html (accessed on 3 June 2024).
  22. Barlow, R.S.; Karpetis, A.N.; Frank, J.H.; Chen, J.-Y. Scalar Profiles and NO Formation in Laminar Opposed-Flow Partially Premixed Methane/Air Flames. Flame 2001, 127, 2102–2118. [Google Scholar] [CrossRef]
  23. Namazian, M.; Heywood, J.B. Flow in the Piston-Cylinder-Ring Crevices of a Spark-Ignition Engine: Effect on Hydrocarbon Emissions, Efficiency and Power. SAE Trans. 1982, 91, 261–288. [Google Scholar]
  24. Beurlot, K.; Vieira, G.; Ritchie, T.; Nowlin, J.; Olsen, D.; Jacobs, T. Evaluation of New Ignition Concepts on Large Bore NG Engines for Methane Emissions. 2022. Available online: https://www.prci.org/Research/CompressorPumpStation/CPSProjects/CPS-17-08/202556/248518.aspx (accessed on 28 May 2024).
Figure 1. Late-cycle high-pressure fuel injection (HPFI) in a two-stroke large-bore engine. Source: Authors (2023), created with Microsoft PowerPoint Version 2406 and SolidWorks 2023.
Sustainability 16 05943 g001
Figure 2. The Cooper-Bessemer GMV-4TF Engine with 4 cylinders at the Powerhouse Energy Campus, Colorado State University. Source: Authors (2024).
Sustainability 16 05943 g002
Figure 3. Experimental setup overview. Source: Authors (2024).
Sustainability 16 05943 g003
Figure 4. Geometric model of the GMV-4TF two-stroke lean-burn engine in Converge Studio v3.0. Source: Authors (2024).
Sustainability 16 05943 g004
Figure 5. Boundaries in the geometric model for CFD simulations in Converge Studio v 3.0. Source: Authors (2024).
Sustainability 16 05943 g005
Figure 6. Top view of the intake ports (in pairs) and exhaust ports (identical) in Converge Studio v 3.0. Source: Authors (2024).
Sustainability 16 05943 g006
Figure 7. Cross-section of engine model in Converge Studio v 3.0. (a) when the piston is at BDC; (b) when the piston is at TDC. Source: Authors (2024).
Sustainability 16 05943 g007
Figure 8. Crevice volume model rings and passages illustration adapted from Converge Studio v.3.1. Source: Converge Studio v3.1 Manual [16].
Sustainability 16 05943 g008
Figure 9. Cylinder pressure trace at nominal point (500 psi injection pressure, −120 degrees start of admission). Source: Authors (2024), created with MATLAB R2023b.
Sustainability 16 05943 g009
Figure 10. COV of peak pressure vs. start of admission at different injection pressures at 300 rpm, 440 bhp (330 bkW). Source: Authors (2024), created with MATLAB R2023b.
Sustainability 16 05943 g010
Figure 11. COV of indicated mean effective pressure vs. start of admission at different injection pressures at 300 rpm, 440 bhp (330 bkW). Source: Authors (2024), created with MATLAB R2023b.
Sustainability 16 05943 g011
Figure 12. Injection duration vs. start of admission at different injection pressures at 300 rpm, 440 bhp (330 bkW). Source: Authors (2024), created with MATLAB R2023b.
Sustainability 16 05943 g012
Figure 13. Brake-specific fuel consumption vs. start of admission at different injection pressures at 300 rpm, 440 bhp (330 bkW). Source: Authors (2024), created with MATLAB R2023b.
Sustainability 16 05943 g013
Figure 14. Brake thermal efficiency vs. start of admission at different injection pressures at 300 rpm, 440 bhp (330 bkW). Source: Authors (2024), created with MATLAB R2023b.
Sustainability 16 05943 g014
Figure 15. Brake-specific methane emissions vs. start of admission at different injection pressures at 300 rpm, 440 bhp (330 bkW). Source: Authors (2024), created with MATLAB R2023b.
Sustainability 16 05943 g015
Figure 16. Optimum methane emissions and corresponding start of admission at different injection pressures at 300 rpm, 440 bhp (330 bkW). Source: Authors (2024), created with MATLAB R2023b.
Sustainability 16 05943 g016
Figure 17. Crankcase vent methane concentration vs. start of admission at different injection pressures at 300 rpm, 440 bhp (330 bkW). Source: Authors (2024), created with MATLAB R2023b.
Sustainability 16 05943 g017
Figure 18. Brake-specific crankcase vent methane gas vs. start of admission at different injection pressures at 300 rpm, 440 bhp (330 bkW). Source: Authors (2024), created with MATLAB R2023b.
Sustainability 16 05943 g018
Figure 19. Cylinder pressure trace—experimental data and CFD baseline. Source: Authors (2024), created with MATLAB R2023b.
Sustainability 16 05943 g019
Figure 20. Mixing level measured by the equivalence ratio standard deviation vs. start of admission at different injection pressures in Converge CFD model at ~300 rpm, 440 bhp (330 bkW). Source: Authors (2024), created with MATLAB R2023b.
Sustainability 16 05943 g020
Figure 21. Exhaust methane emissions from the main combustion chamber vs. start of admission at different injection pressures in Converge CFD model at ~300 rpm, 440 bhp (330 bkW). Source: Authors (2024), created with MATLAB R2023b.
Sustainability 16 05943 g021
Figure 22. Piston compression rings movements relative to total methane stored in the ring pack as the piston moves from −250 CAD to 110 CAD at an injection pressure of 500 psi and SOA of −120 degrees in Converge CFD model at ~300 rpm, 440 bhp (330 bkW). Source: Authors (2024), created with MATLAB R2023b.
Sustainability 16 05943 g022
Figure 23. Ring pack methane residual at the end of a cycle (110 CAD) vs. start of admission at different injection pressures in Converge CFD model at ~300 rpm, 440 bhp (330 bkW). Source: Authors (2024), created with MATLAB R2023b.
Sustainability 16 05943 g023
Figure 24. Methane blowby through the ring pack vs. start of admission at different injection pressures in Converge CFD model at ~300 rpm, 440 bhp (330 bkW). Source: Authors (2024), created with MATLAB R2023b.
Sustainability 16 05943 g024
Figure 25. Methane emissions relative to mass of methane delivered to the main combustion chamber at an injection pressure of 500 psi and SOA of −120 degrees in Converge CFD model at ~300 rpm, 440 bhp (330 bkW) for one cylinder. Source: Authors (2024), created with Microsoft PowerPoint Version 2406.
Sustainability 16 05943 g025
Figure 26. Contribution of the MCC, ring pack, and crankcase vent to methane emissions at an injection pressure of 500 psi and SOA of −120 degrees in Converge CFD model at ~300 rpm, 440 bhp (330 bkW) for one cylinder. Source: Authors (2024), created with Microsoft PowerPoint Version 2406.
Sustainability 16 05943 g026
Figure 27. Total methane emissions at an injection pressure of 500 psi and SOA of −120 degrees in Converge CFD model at ~300 rpm, 440 bhp (330 bkW) for one cylinder. (a) experimental data; (b) computational data. Source: Authors (2024), created with MATLAB R2023b.
Sustainability 16 05943 g027
Table 1. Engine experimental test matrix.
DayFuel Injection Pressure (psi)Start of Admission (degrees)Objective
1500 (PCC Flow Sweep)−120Minimizing COV of peak pressures
500Sweep from −140 to −60Investigating fuel injection timing effects
2650 (maximum)Sweep from −120 to −60
300Sweep from −135 to −75
3150Sweep from −145 to −95
Table 2. Geometric dimensions and model configuration including crevice model configuration.
ParameterDimension/Configuration
Bore—in (mm)14.00 (355.6)
Stroke—in (mm)14.75 (374.7)
Connecting rod length—in (mm)35.1 (892)
Crank speed (rpm)299.8
PCC volume (in3)3.46
PCC nozzle diameter—in (m)0.32 (0.008)
Number of intake ports8
Intake bores height—in (m)2.83 (0.072)
Intake bores set 1 width—in (m)2.80 (0.071)
Intake bores set 2 width—in (m)2.60 (0.066)
Intake bores set 3 width—in (m)2.48 (0.063)
Intake bores set 4 width—in (m)2.20 (0.056)
Number of exhaust ports5
Exhaust ports height—in (m)4.29 (0.109)
Exhaust ports width—in (m)2.20 (0.056)
Fuel injection modeHigh-pressure fuel injection
Prechamber designOEM PCC
Chemical mechanismBerkeley
Baseline injection pressure (psi)500
Baseline injection timing (deg ATDC)−120 to −100
Ignition timing (deg ATDC)−1.5
Turbulent Prandtl number0.9
Turbulent Schmidt number0.78
Start time (deg ATDC)−250
End time (deg ATDC)−110
Maximum convection CFL limit1
Maximum diffusion CFL limit20
Maximum Mach CFL limit500
Droplet motion time-step control multiple1.5
Sector angle (deg)360
Orifice discharge coefficient0.86
Top ring height (m)0.0196
Top ring width (m)0.00022
Crankcase pressure (Pa)84116
Crevice region temperature (K)480
Rings 2, 3, and 4 width (m)0.0117
Rings 2, 3, and 4 thickness (m)0.00635
Rings 2, 3, and 4 mass (kg)3.403
Rings 2, 3, and 4 gap (m)0.00643
Rings 2, 3, and 4 initial position (m)0
Bore—in (mm)14.00 (355.6)
Table 3. Summary of engine average COVs of peak pressures, average peak pressures, and average location of peak pressures for data points.
Injection Pressure (psi)Start of Admission (degrees)Engine Average COV PPAverage Peak Pressures (psi)Average Location of Peak Pressures (degrees)
150−1456.3153918.0
−1355.4355617.8
−1155.9755818.2
−957.2858315.2
300−1357.0352718.6
−1155.3853518.0
−954.5955317.0
−758.3556518.6
500−1408.1052418.9
−1205.5953917.8
−1005.8052218.6
−804.8357417.3
−608.4655718.6
650−1206.0053818.0
−1005.8352618.5
−804.9657317.5
−607.4756718.2
Disclaimer/Publisher’s Note: The statements, opinions and data contained in all publications are solely those of the individual author(s) and contributor(s) and not of MDPI and/or the editor(s). MDPI and/or the editor(s) disclaim responsibility for any injury to people or property resulting from any ideas, methods, instructions or products referred to in the content.

