Economic Attractiveness of the Flexible Combined Biofuel Technology in the District Heating System
Abstract
:1. Introduction
2. Methodology and Data
2.1. Model Description
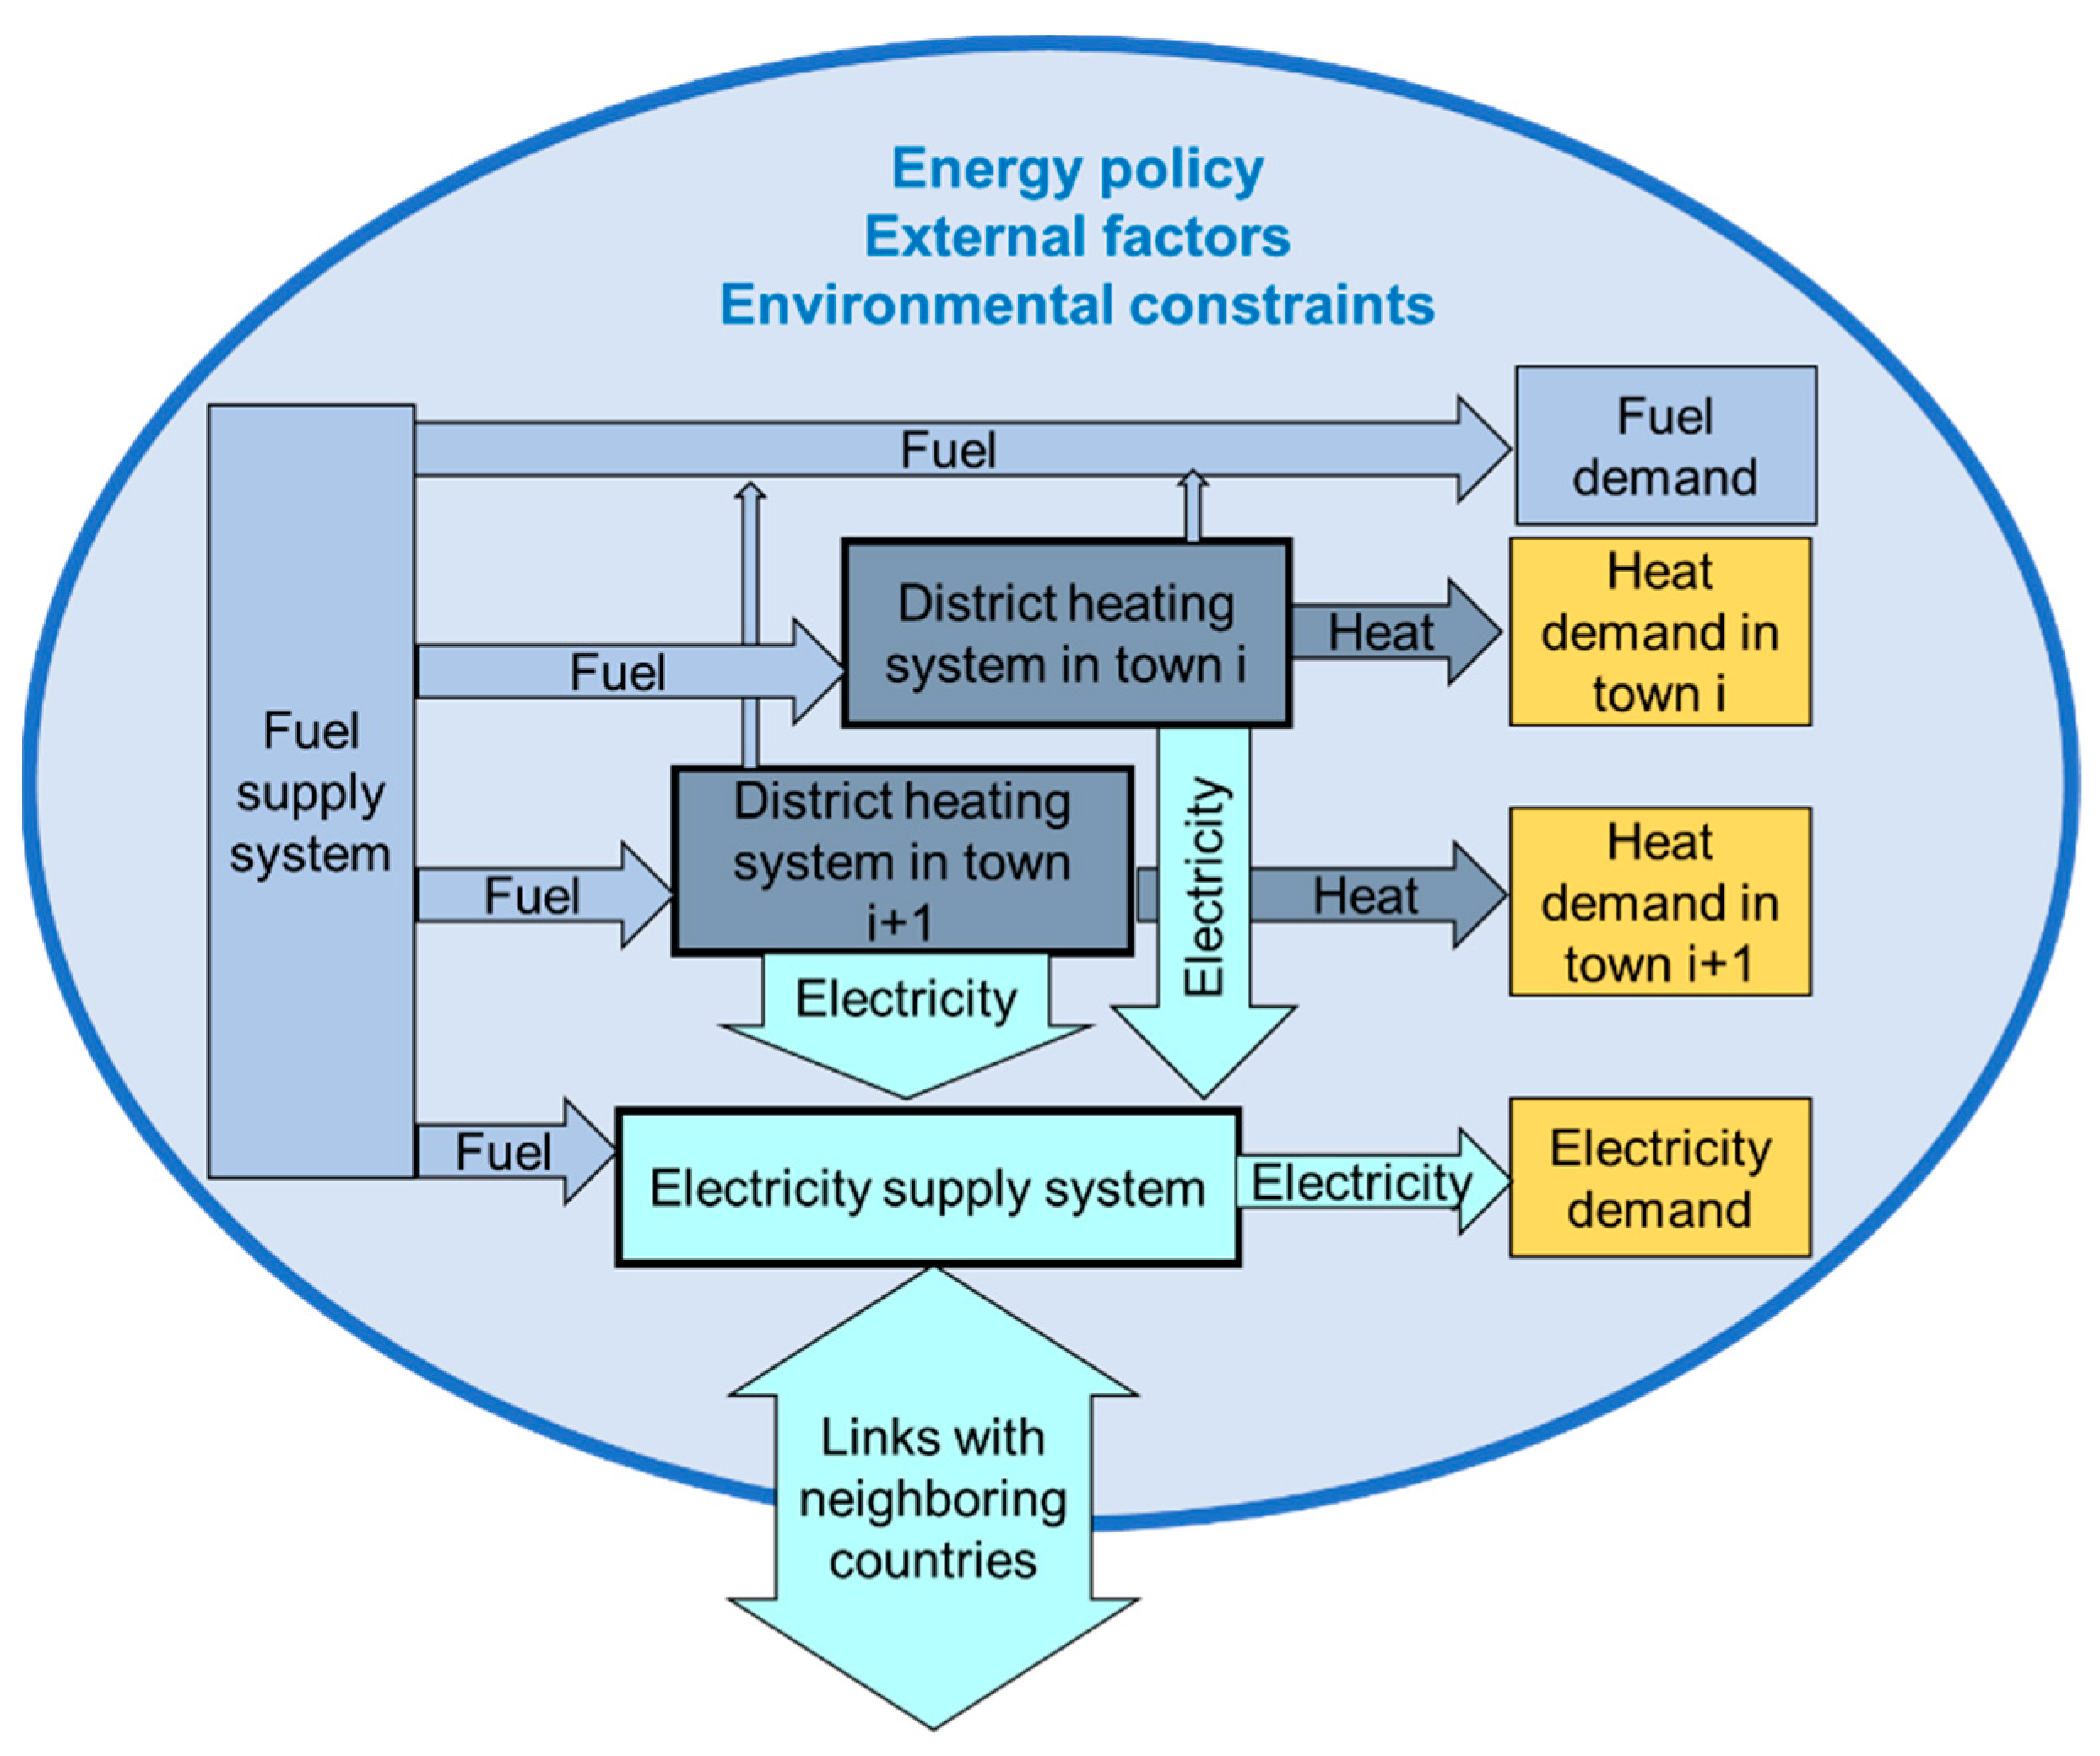
- The development and operation of the Kaunas district heating system is analyzed during a comparatively long time span (up to 2050) using a suite of mathematical models.
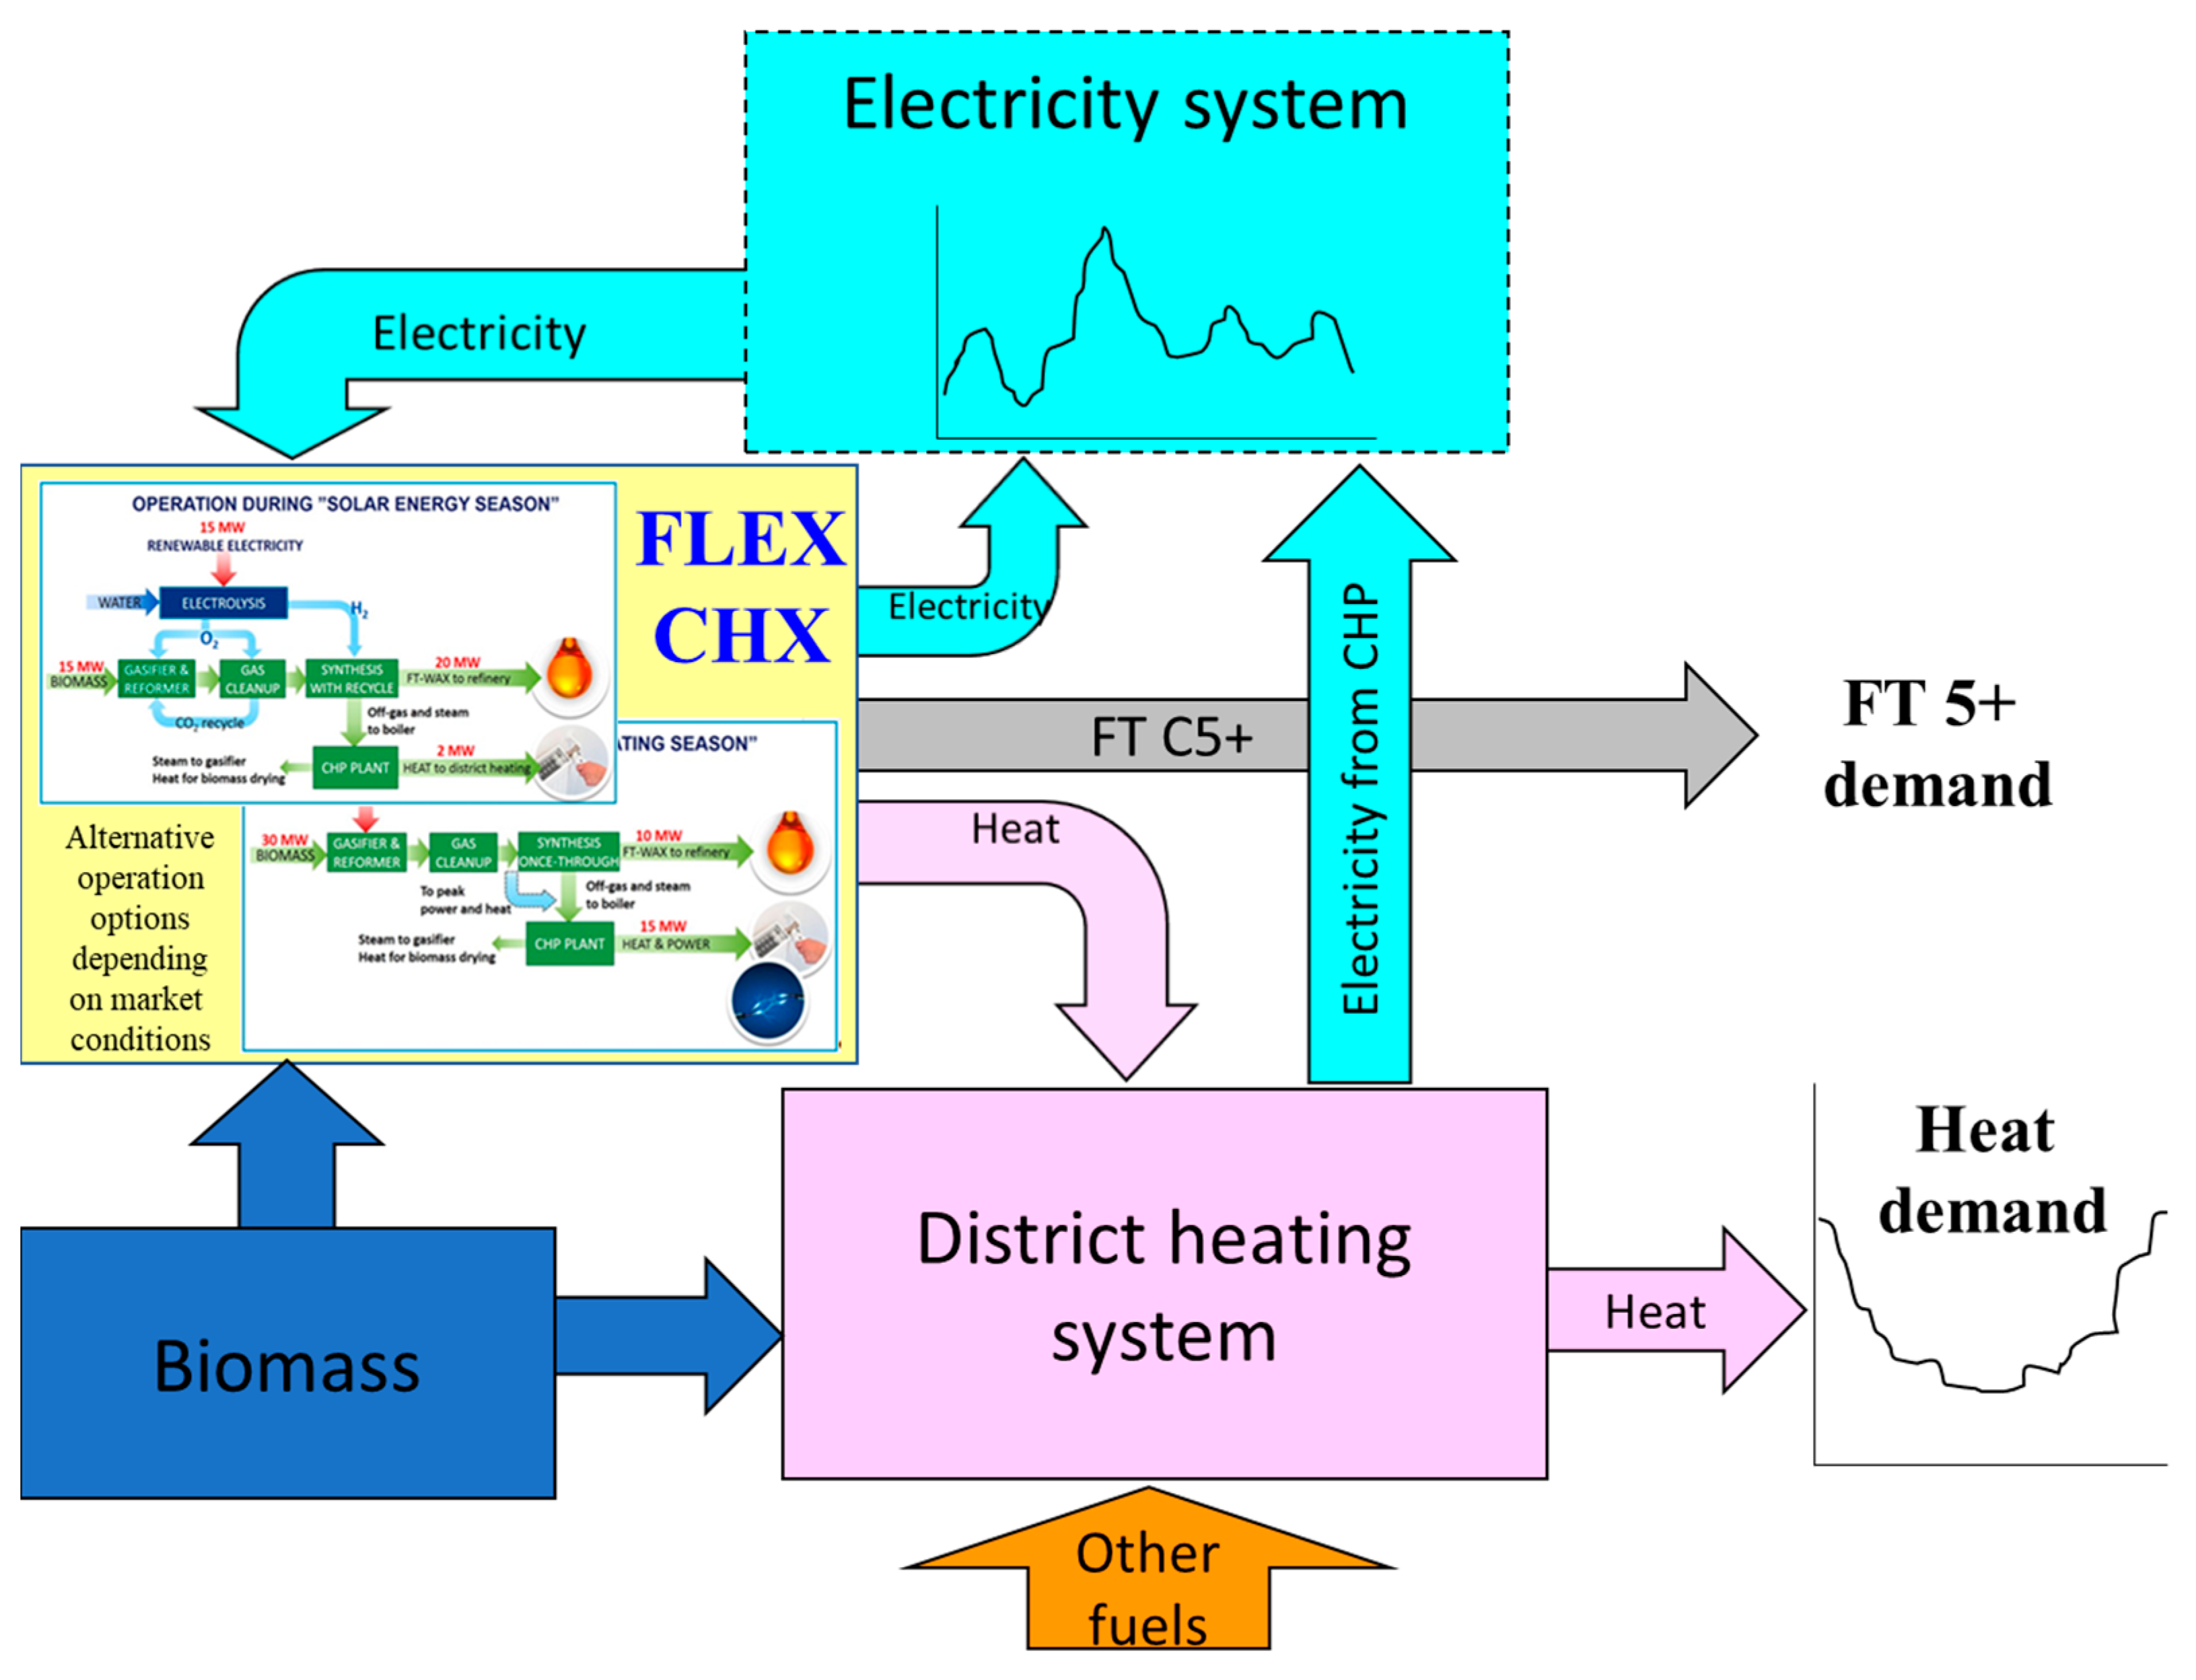
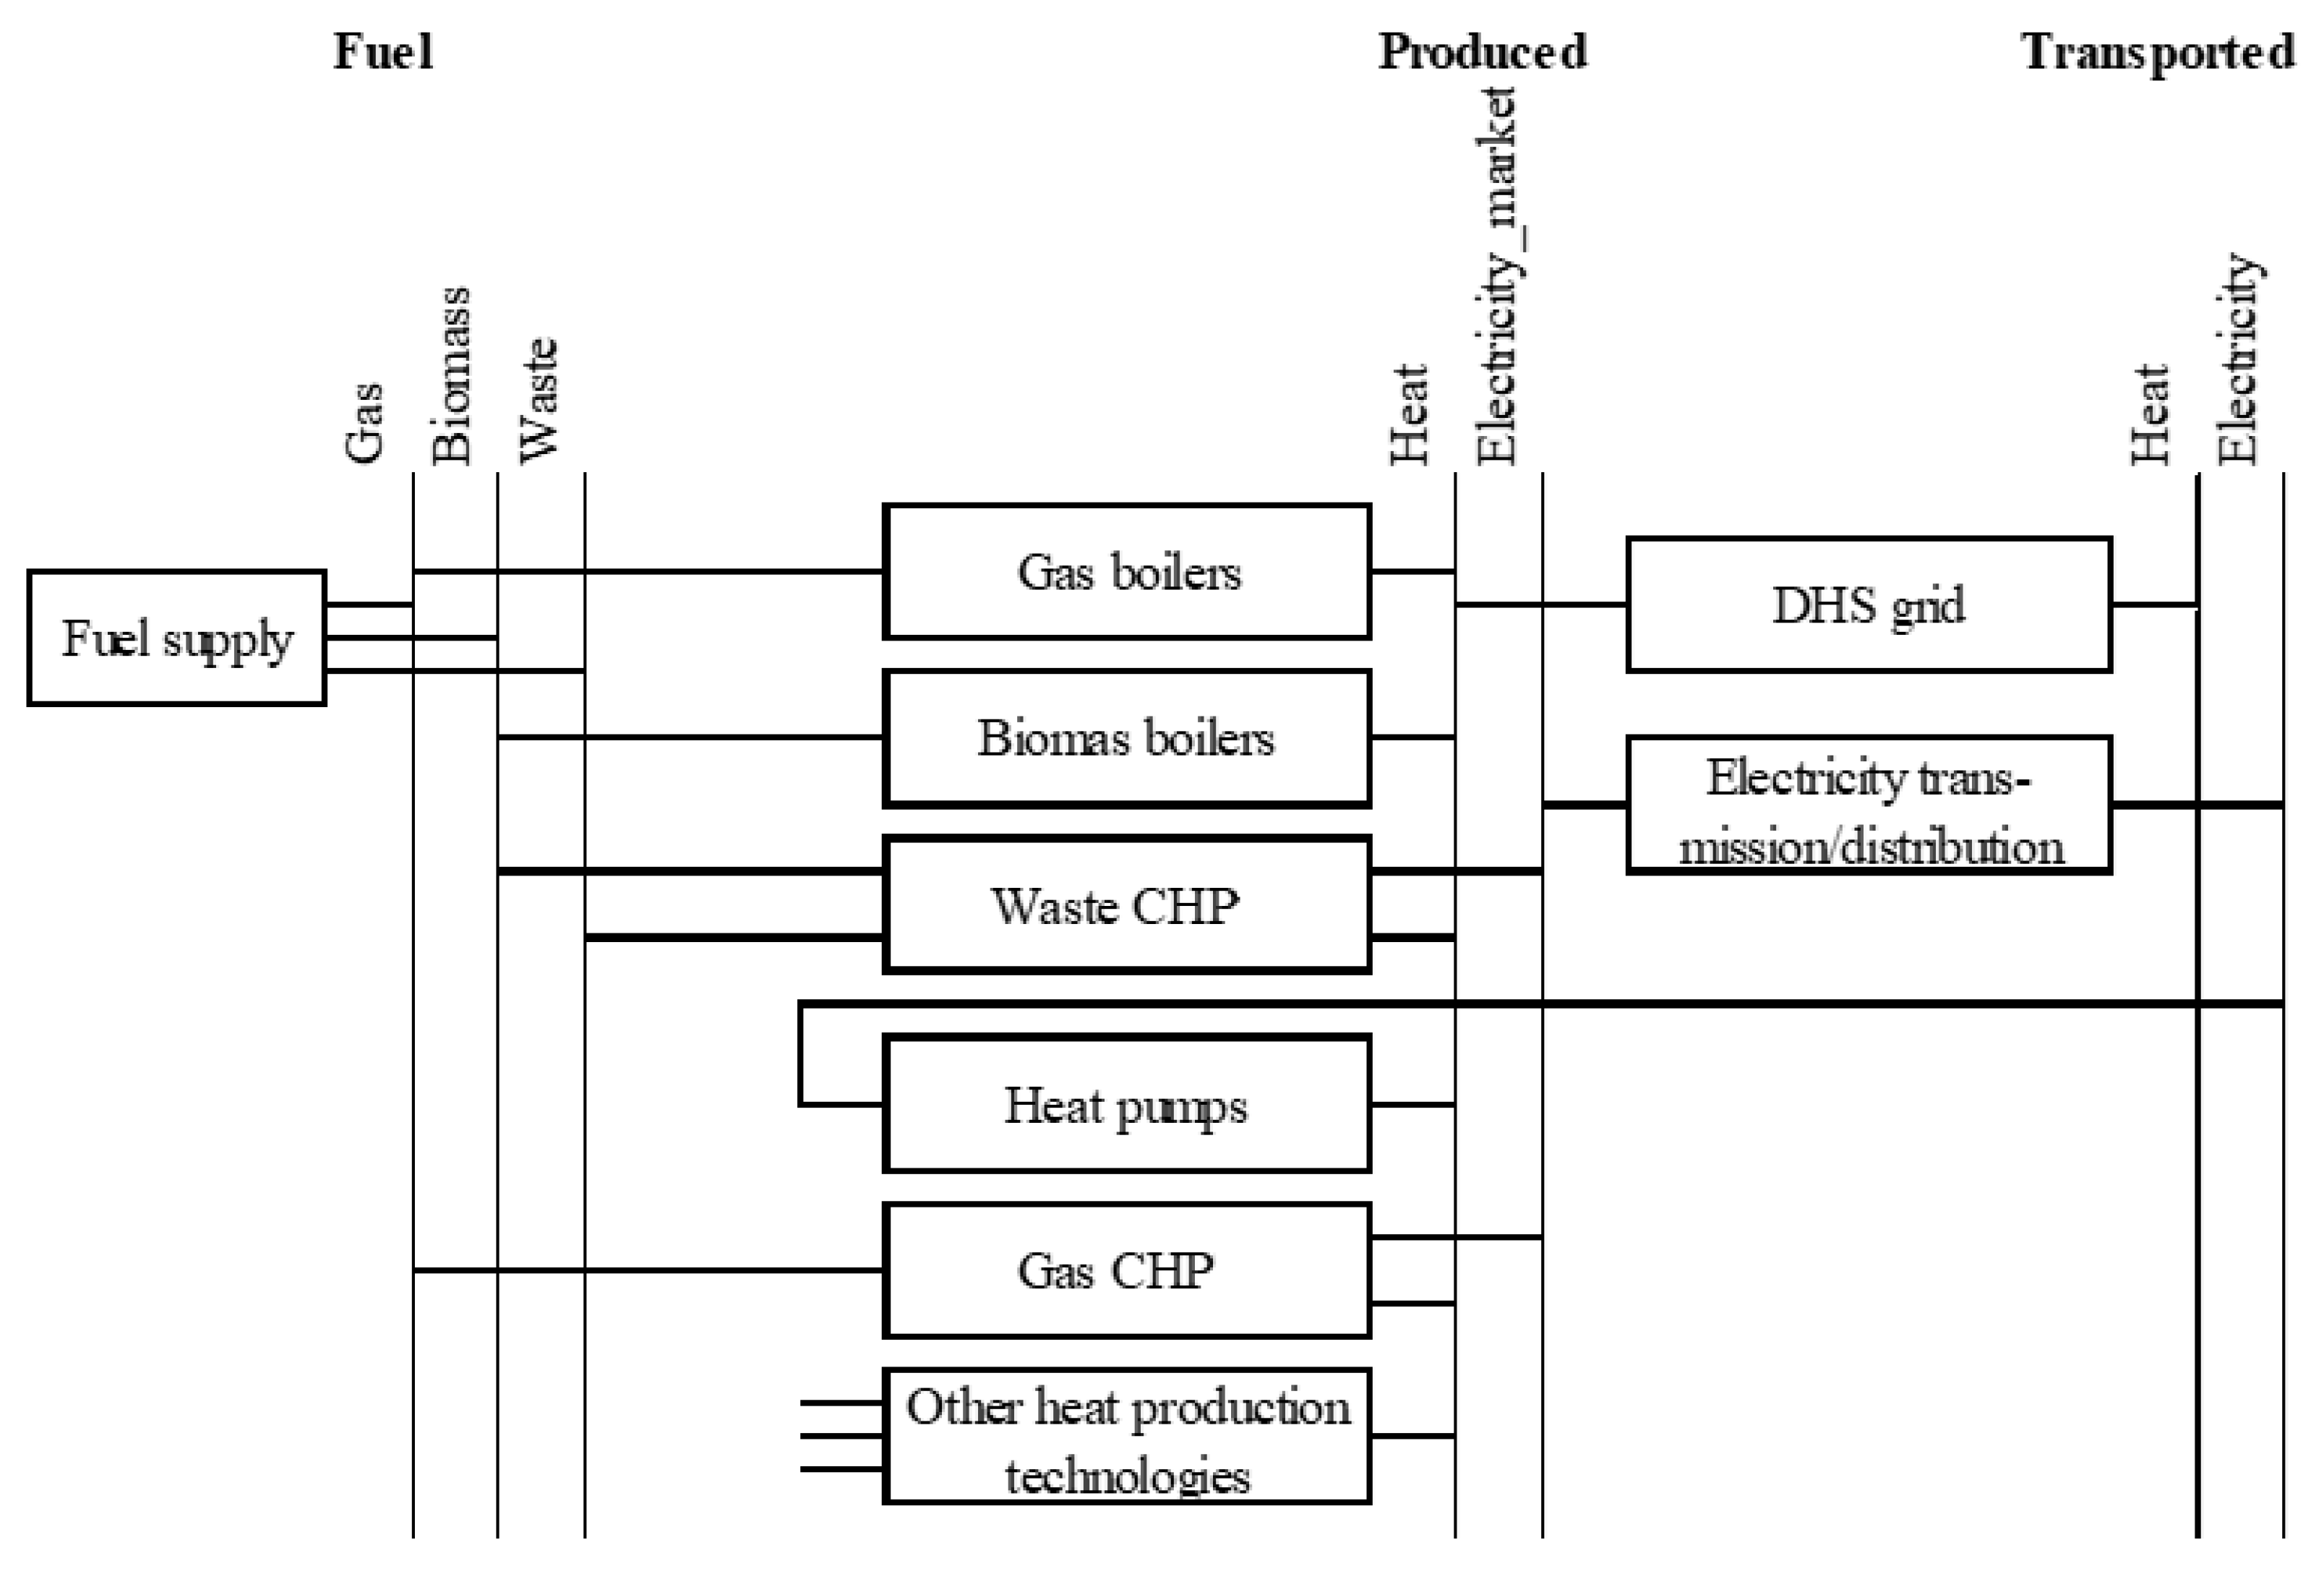
- The FLEXCHX technological unit is analyzed as a candidate heat supplier among a set of other existing and potentially possible heat supply options.
- The FLEXCHX technological unit is linked to selected points of the Kaunas district heating system, taking into account the following local conditions:
- FT off-gas is supplied to an existing gas water heating boiler and steam to the existing heat exchanger converting steam to district heat (case when a FLEXCHX unit is used to contribute to meeting heat demand of residential consumers);
- FT off-gas is supplied to a combined heat and power (CHP) biomass steam boiler; the steam is optionally supplied directly to an industrial steam consumer or a CHP steam turbine for further electricity and heat production (case for meeting industrial heat demand).
- Seasonal and daily heat demand variations of residential and industrial consumers are taken into account when specifying demand for the entire system. Projected heat demand during the study period (2020–2050) decreased by 16%.
- On one hand, the impact of price volatility and the amount of electricity generation from RES is reflected in the variation of electricity price that is used by the FLEXCHX unit as an input. On the other hand, electricity generated from FLEXCHX by-products is supplied to the grid and is sold at the market price.
- Demand for FT C5+ liquids in the market is reflected by its market price, which is an exogenous variable in the analysis.
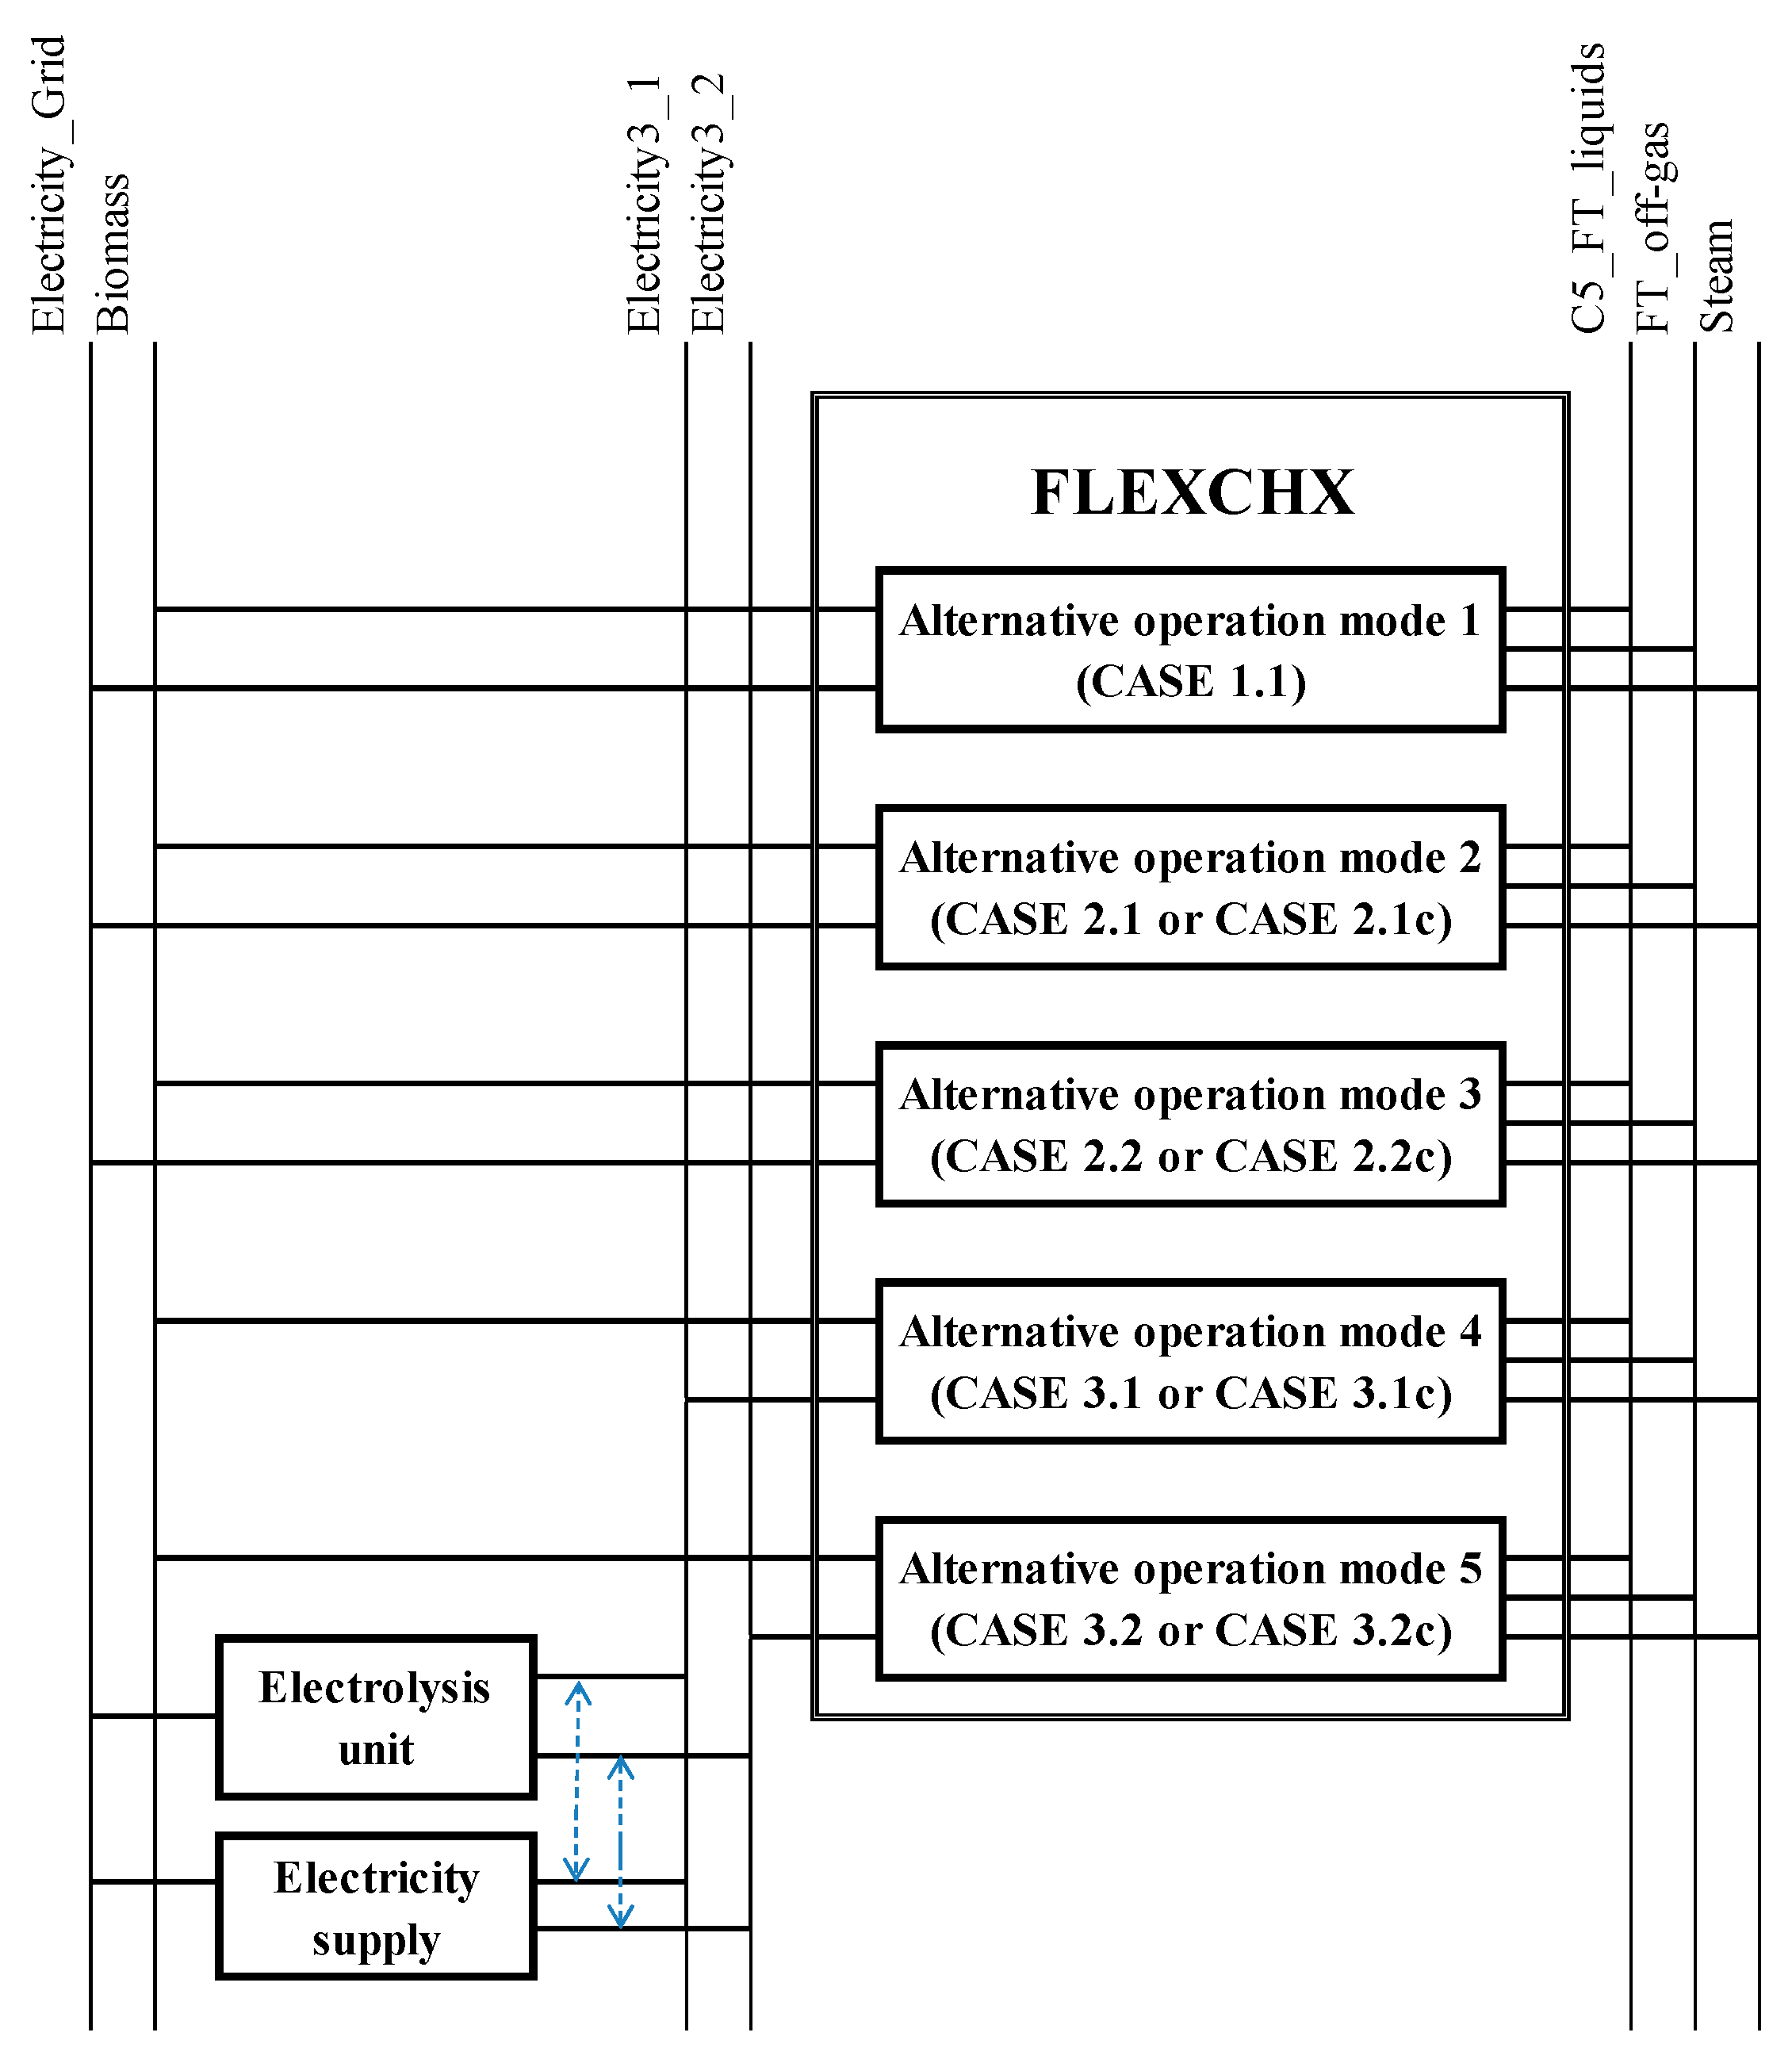
- Changes in FLEXCHX input and output parameters are assumed as changing linearly when shifting from one operation mode to another. The operation modes analyzed are as follows:
- Biomass only (Case 1);
- Biomass with O2/steam gasification and recycling of FT tail gas (Case 2 with variable and Case 2c with constant biomass input);
- Biomass gasification boosted by electrolysis (Case 3 and Case 3c with variable and constant biomass input, respectively);
- The optimal capacity and operation mode of the FLEXCHX unit with variable and constant biomass input is selected for different possible location points in the district heating system.
- Operation modes of the FLEXCHX unit can change depending on the season and time within a day (depending on demand and electricity price variation in the system affecting the unit’s dispatch).
- energy and product flows (quantities); this category also includes the volume of reserve services required;
- capacity additions/expansion for technology;
- storage capacity.
- energy or product flow balances at all nodes of the oriented network;
- constraints on variables over a year or individual time periods within a year;
- dynamic constraints linking energy flows or installed capacity in years t and t − 1;
- accounting equations (fuel consumption, energy production, emissions, etc.).
2.2. Representation of FLEXCHX Technology in the Model for Analysis of District Heating System Operation and Development
2.3. Link with the Electricity System
3. Scenarios Analyzed
- at what product (FT C5+) price the implementation of FLEXCHX technology in the Kaunas DH system is cost-effective;
- the impact of the product price on the installed capacity of FLEXCHX technology.
4. Results and Discussion
4.1. Expected Future Electricity Price Variations in the Electricity System
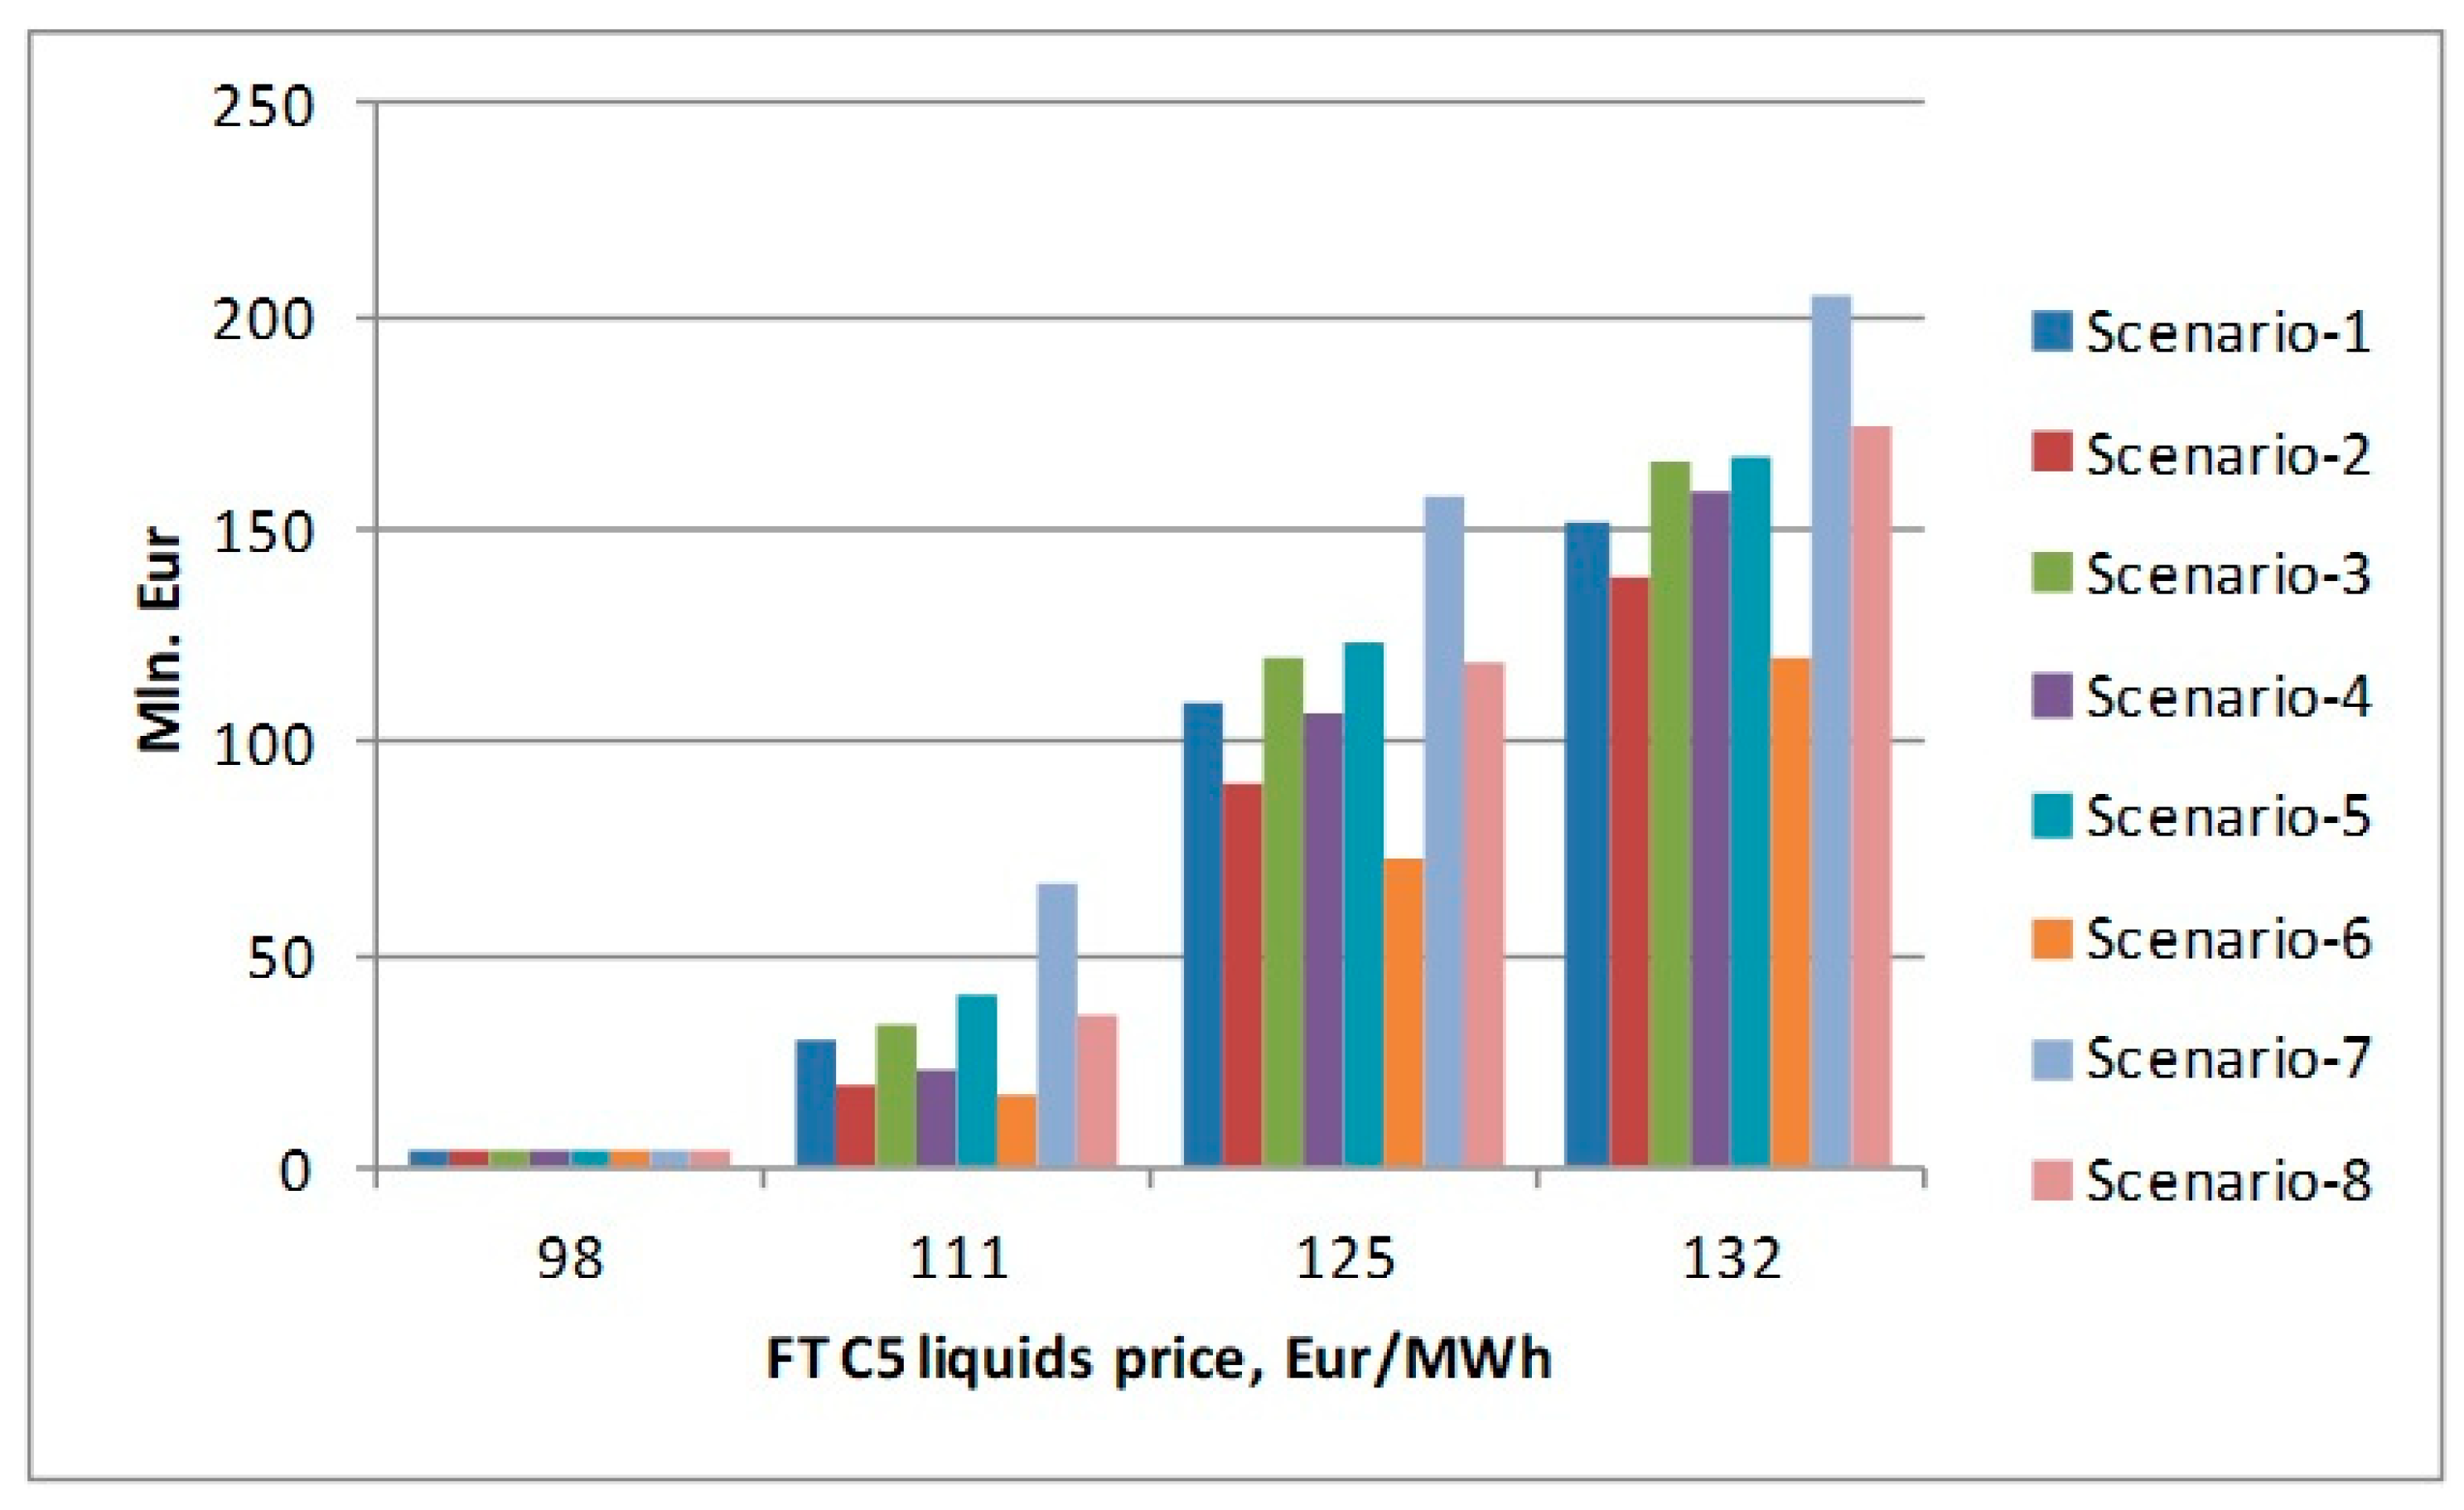
4.2. Cost of System Operation and Development
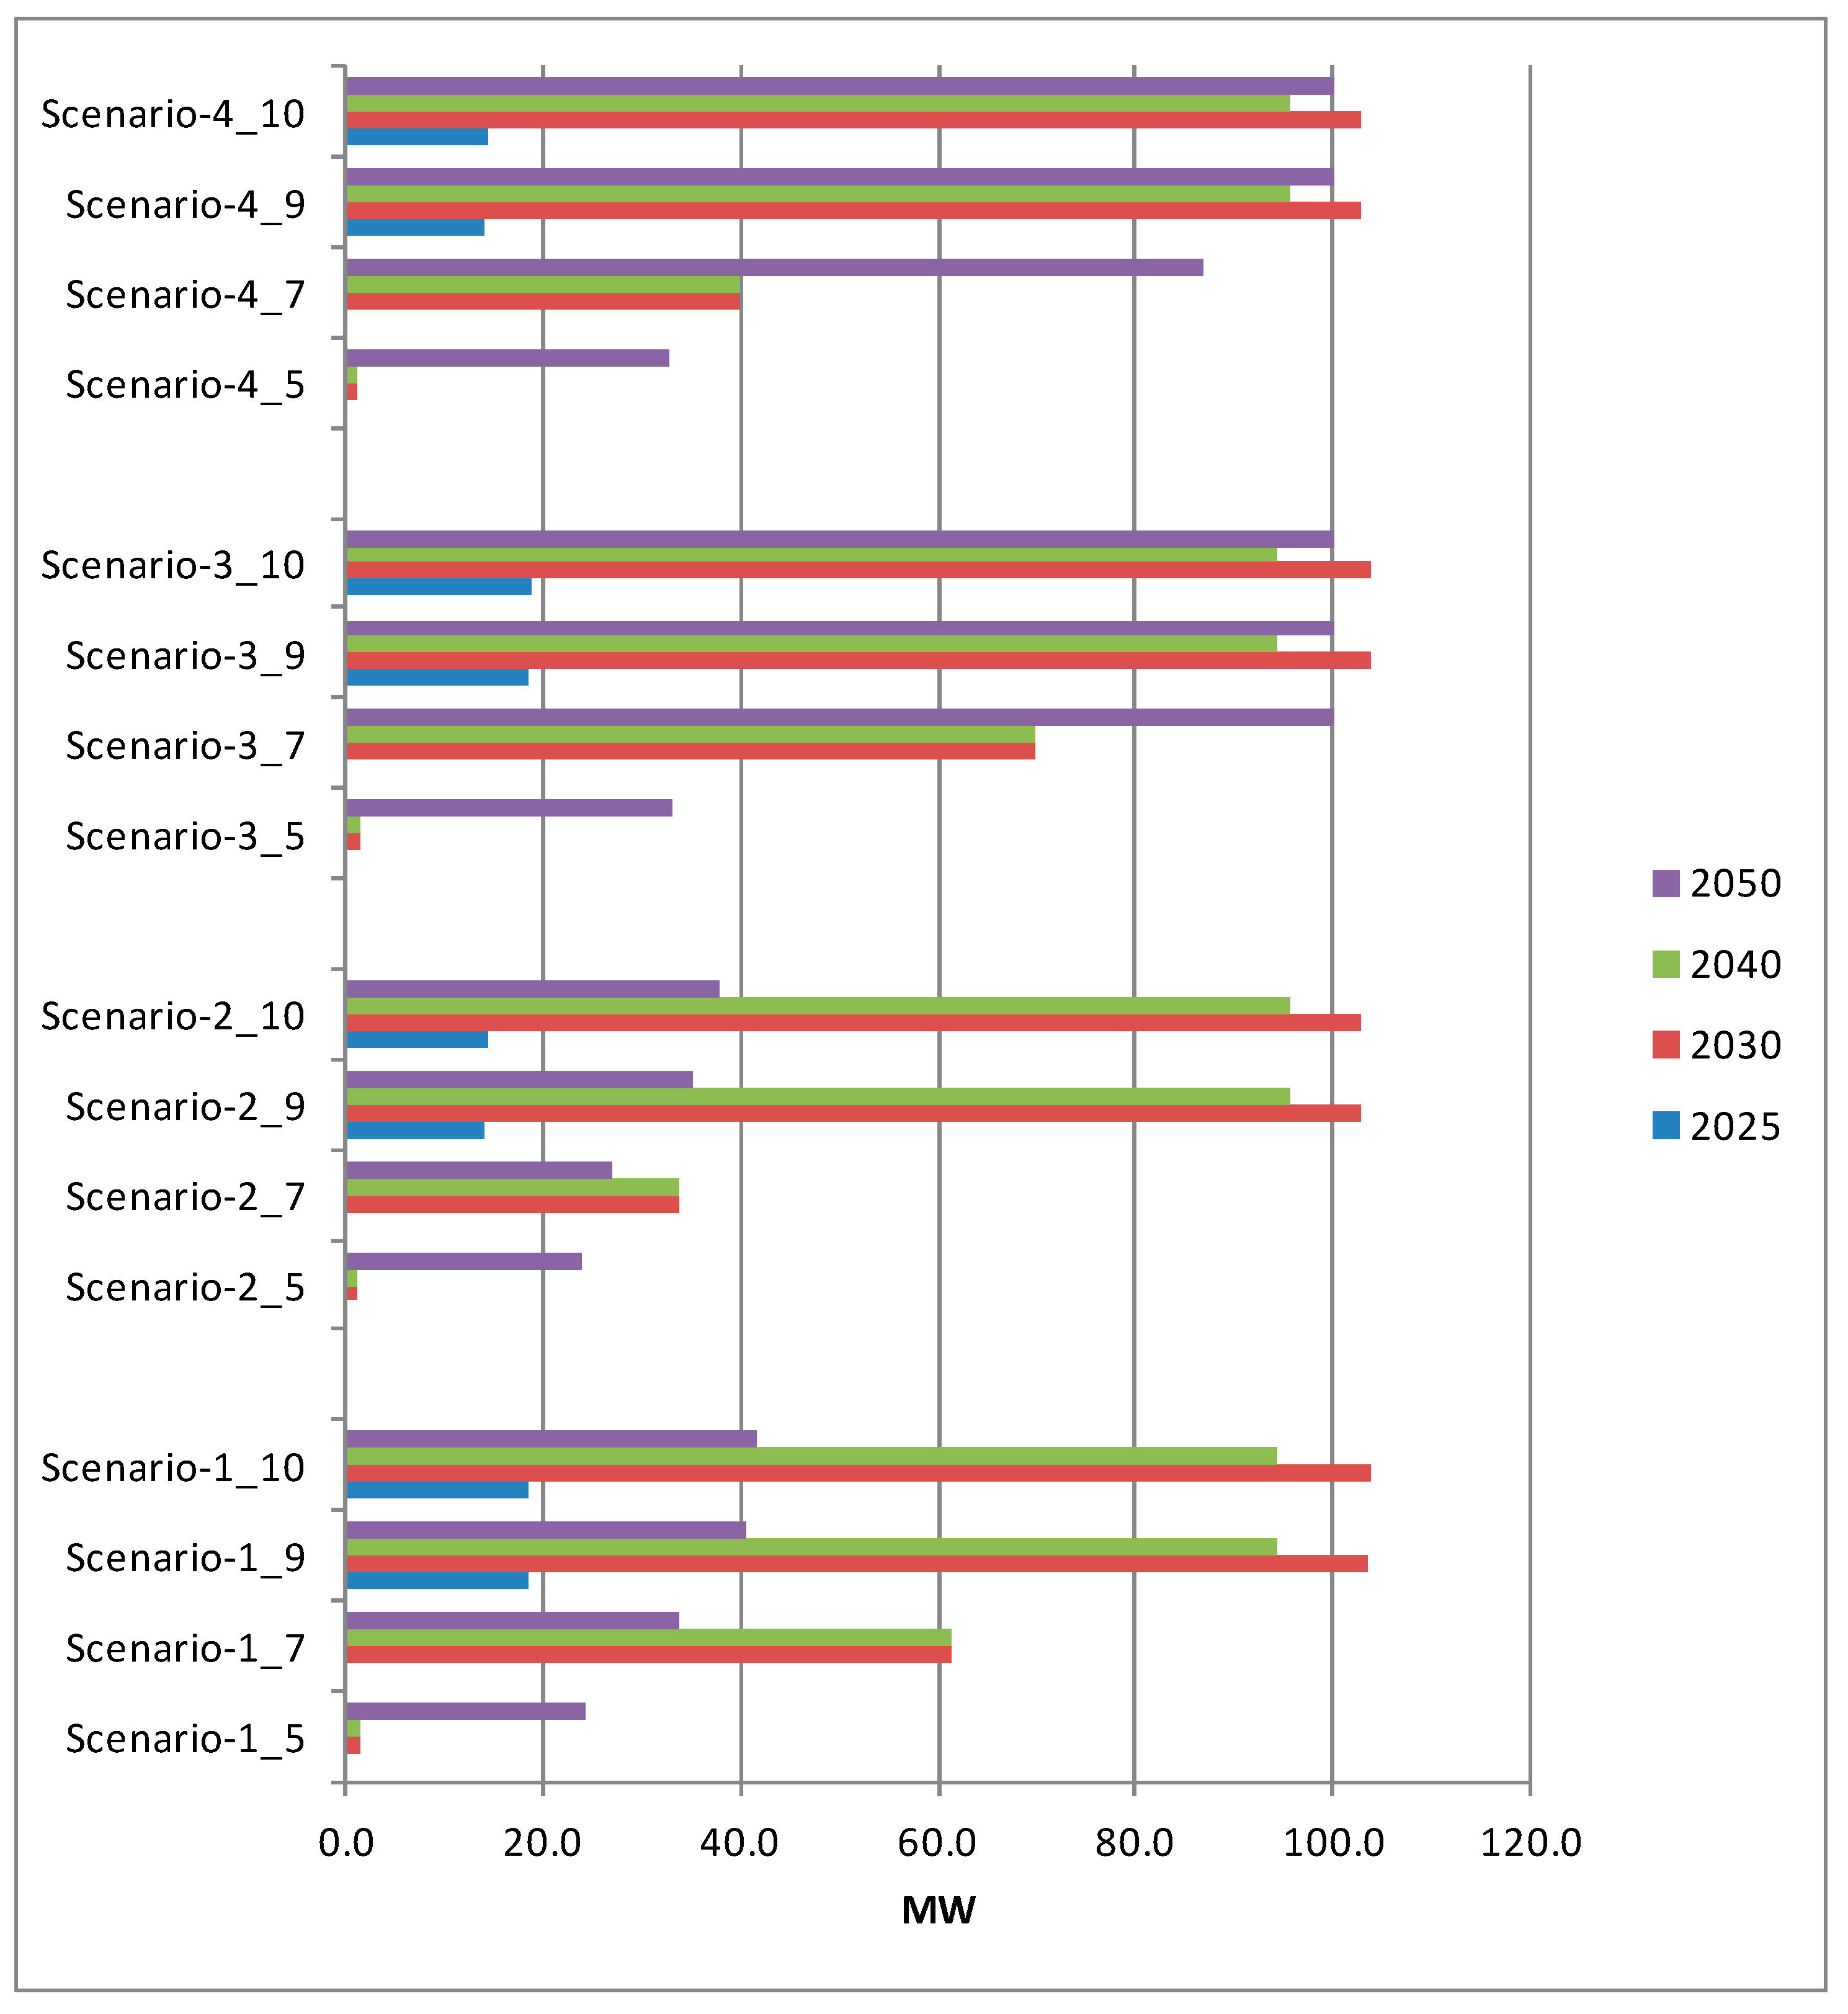
4.3. Installed Capacity of FLEXCHX Technology
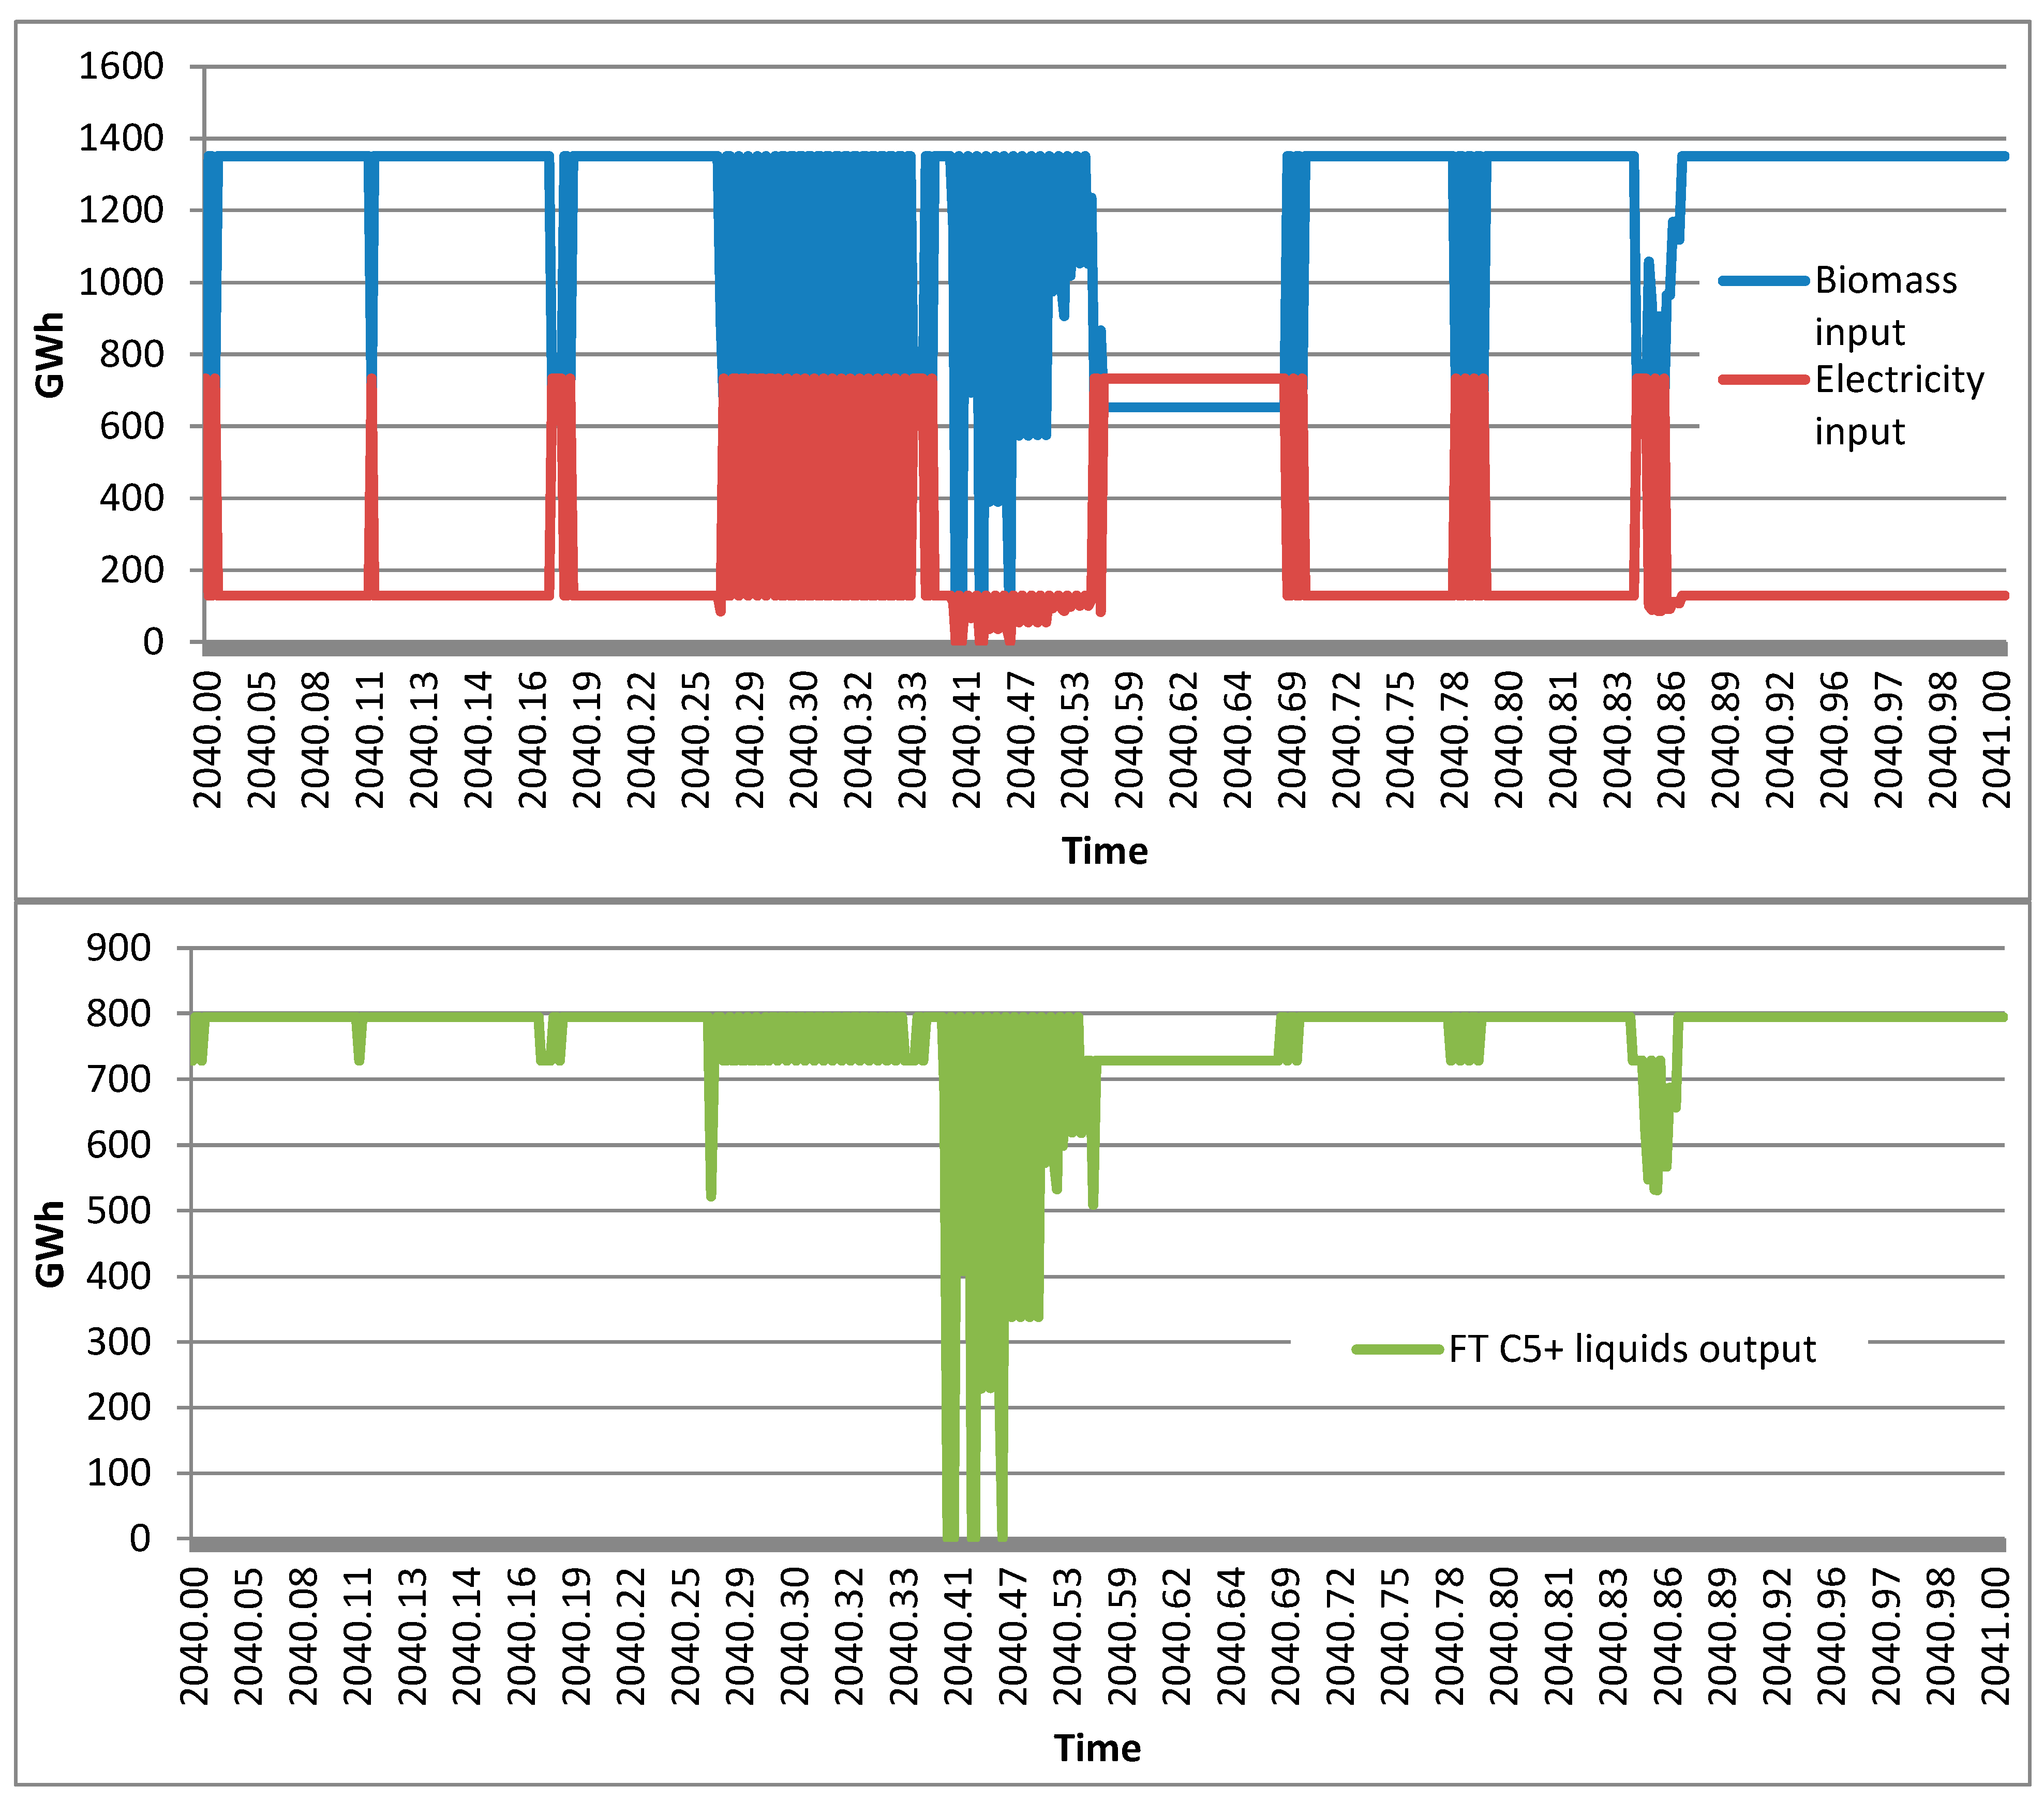
4.4. Operational Regimes of the FLEXCHX Technology
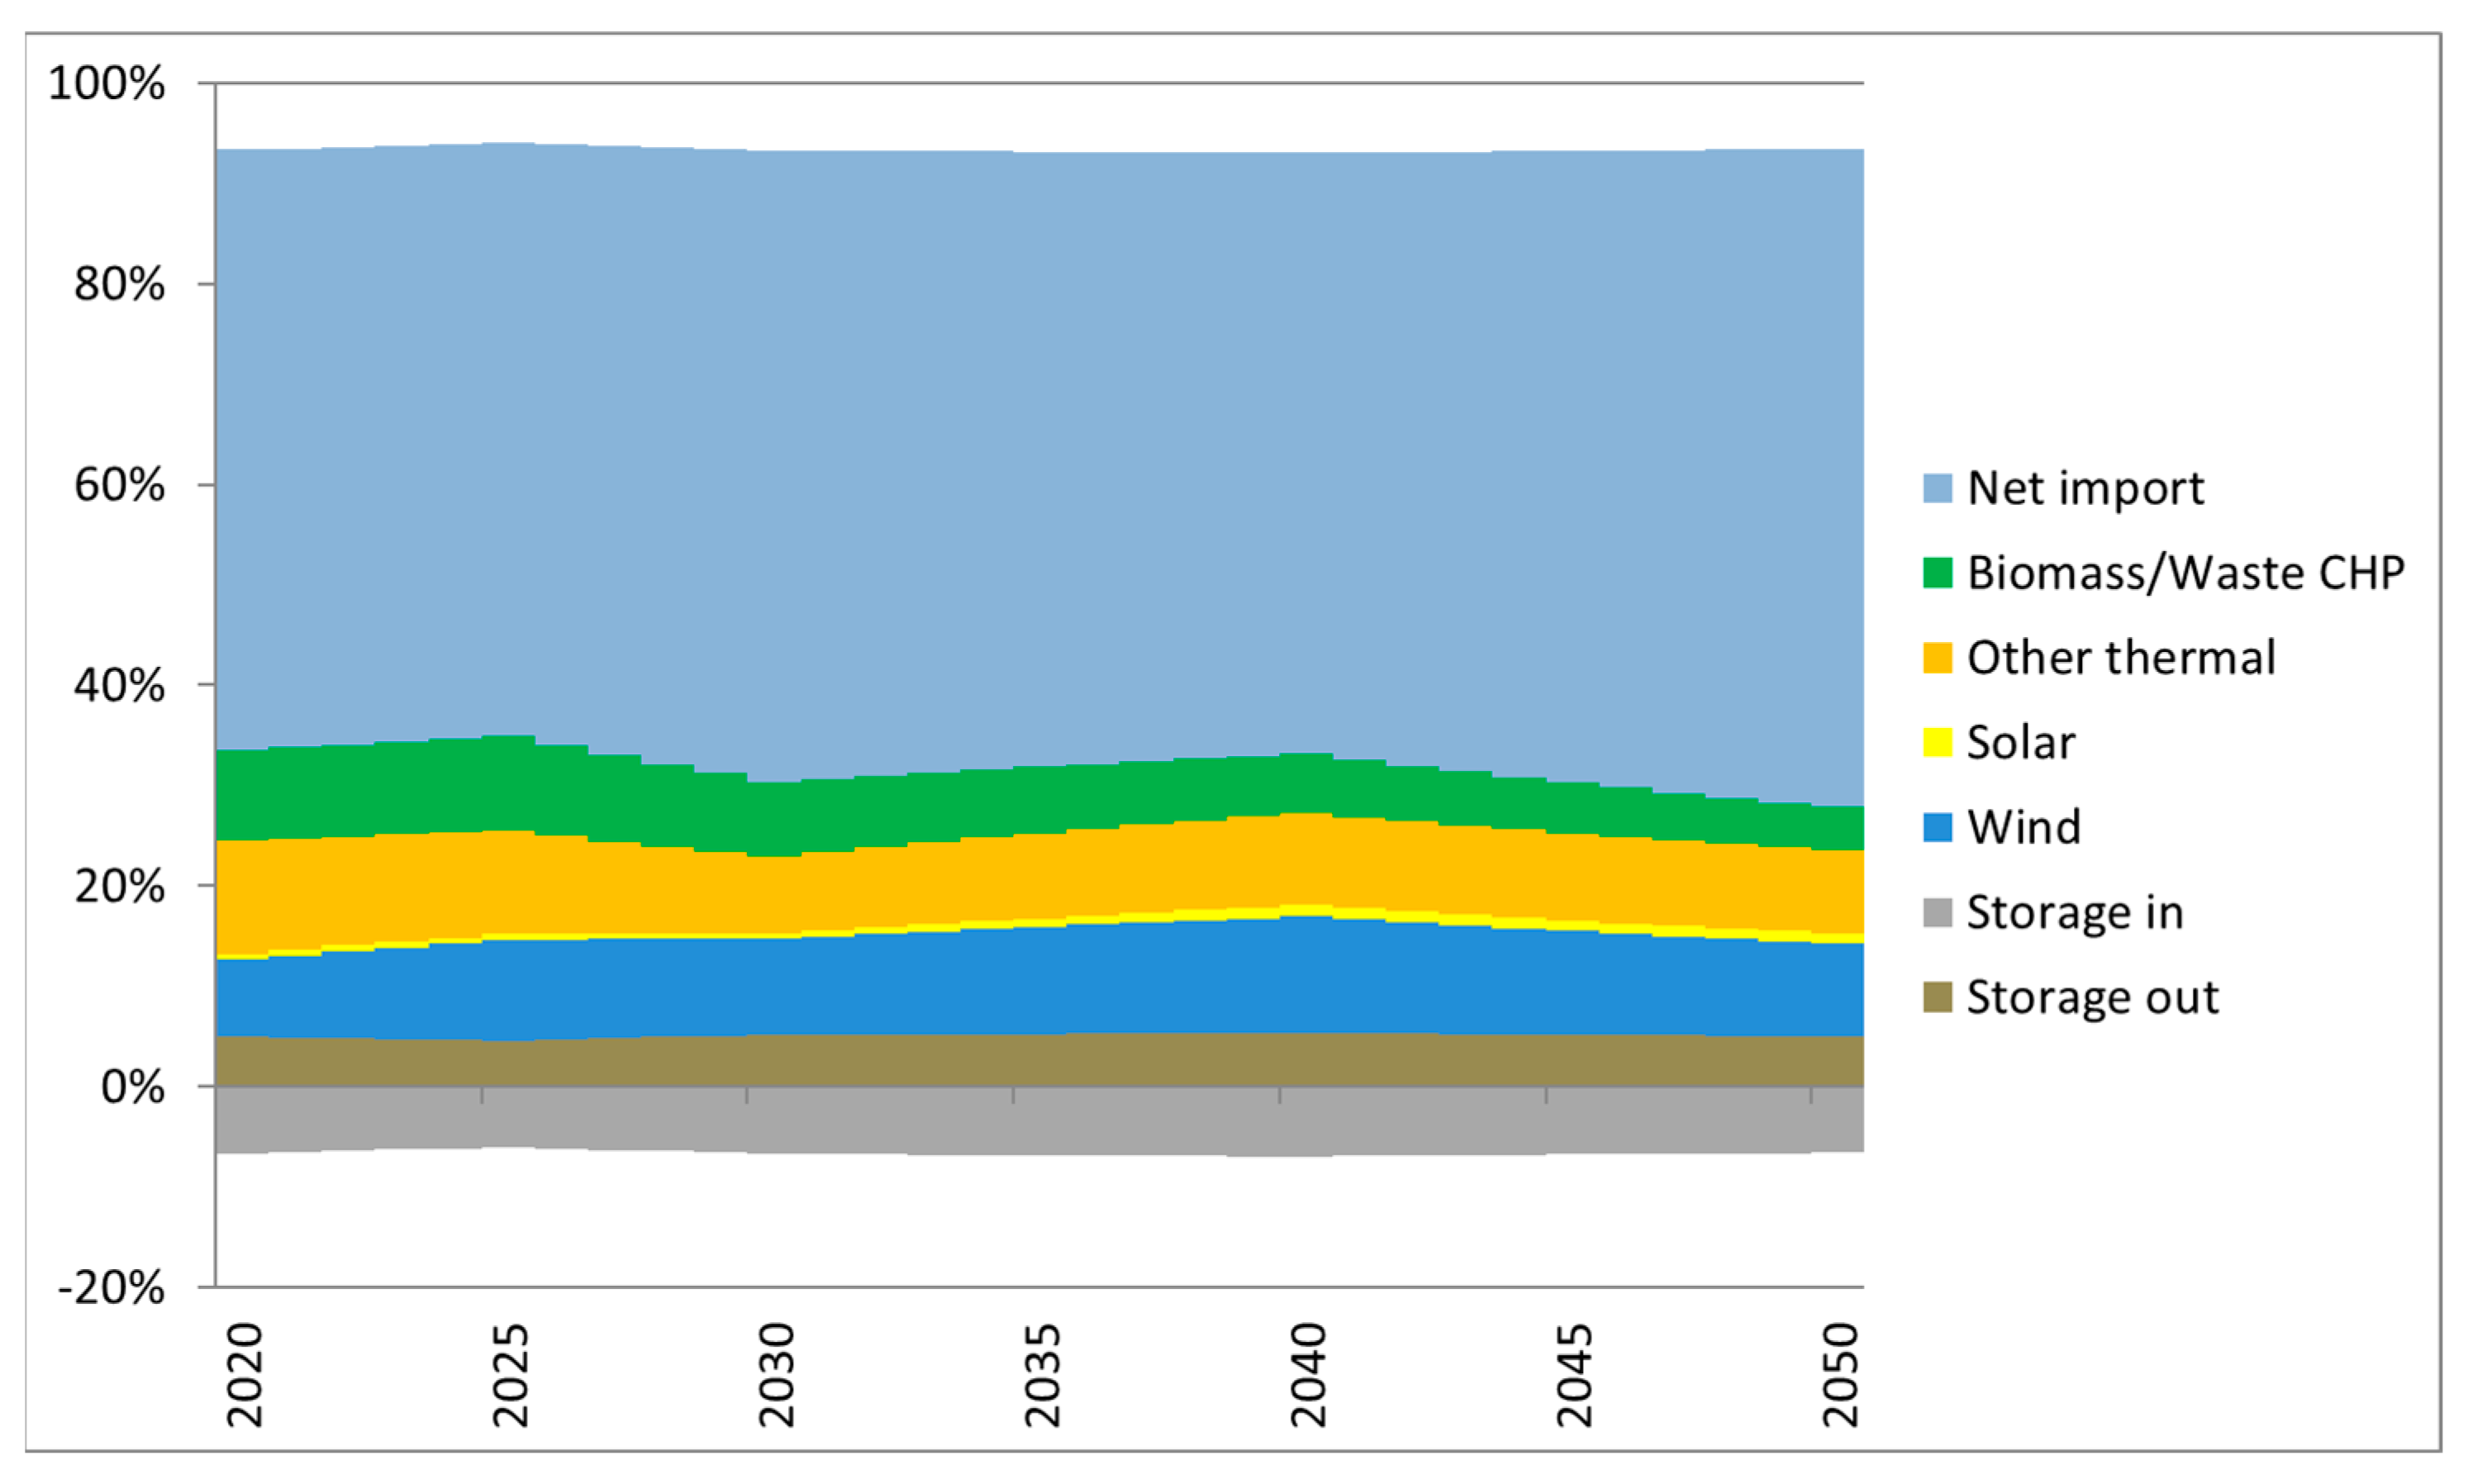
4.5. Heat Production in Kaunas District Heating System and FLEXCHX Contribution
5. Conclusions
- FLEXCHX technology can be successfully integrated into existing district heating systems in Northern Europe and compete successfully with other district heat sources including biomass heat-only boilers and CHPs, as well as municipal waste incineration CHPs. Based on our results from the Kaunas DH system example, the installed capacity of FLEXCHX may be limited by the base load heat demand during off-peak season and is sensitive to the available market and the price of FT C5+ liquids: only at prices above 100 EUR/MWh, FLEXCHX is economically viable.
- FLEXCHX technology, if incorporated into the DH system, could increase the overall efficiency of biomass utilization compared to conventional biomass boiler or CHP systems and create opportunities to participate in three energy markets: heat, electricity, and newly forming second-generation biofuel markets.
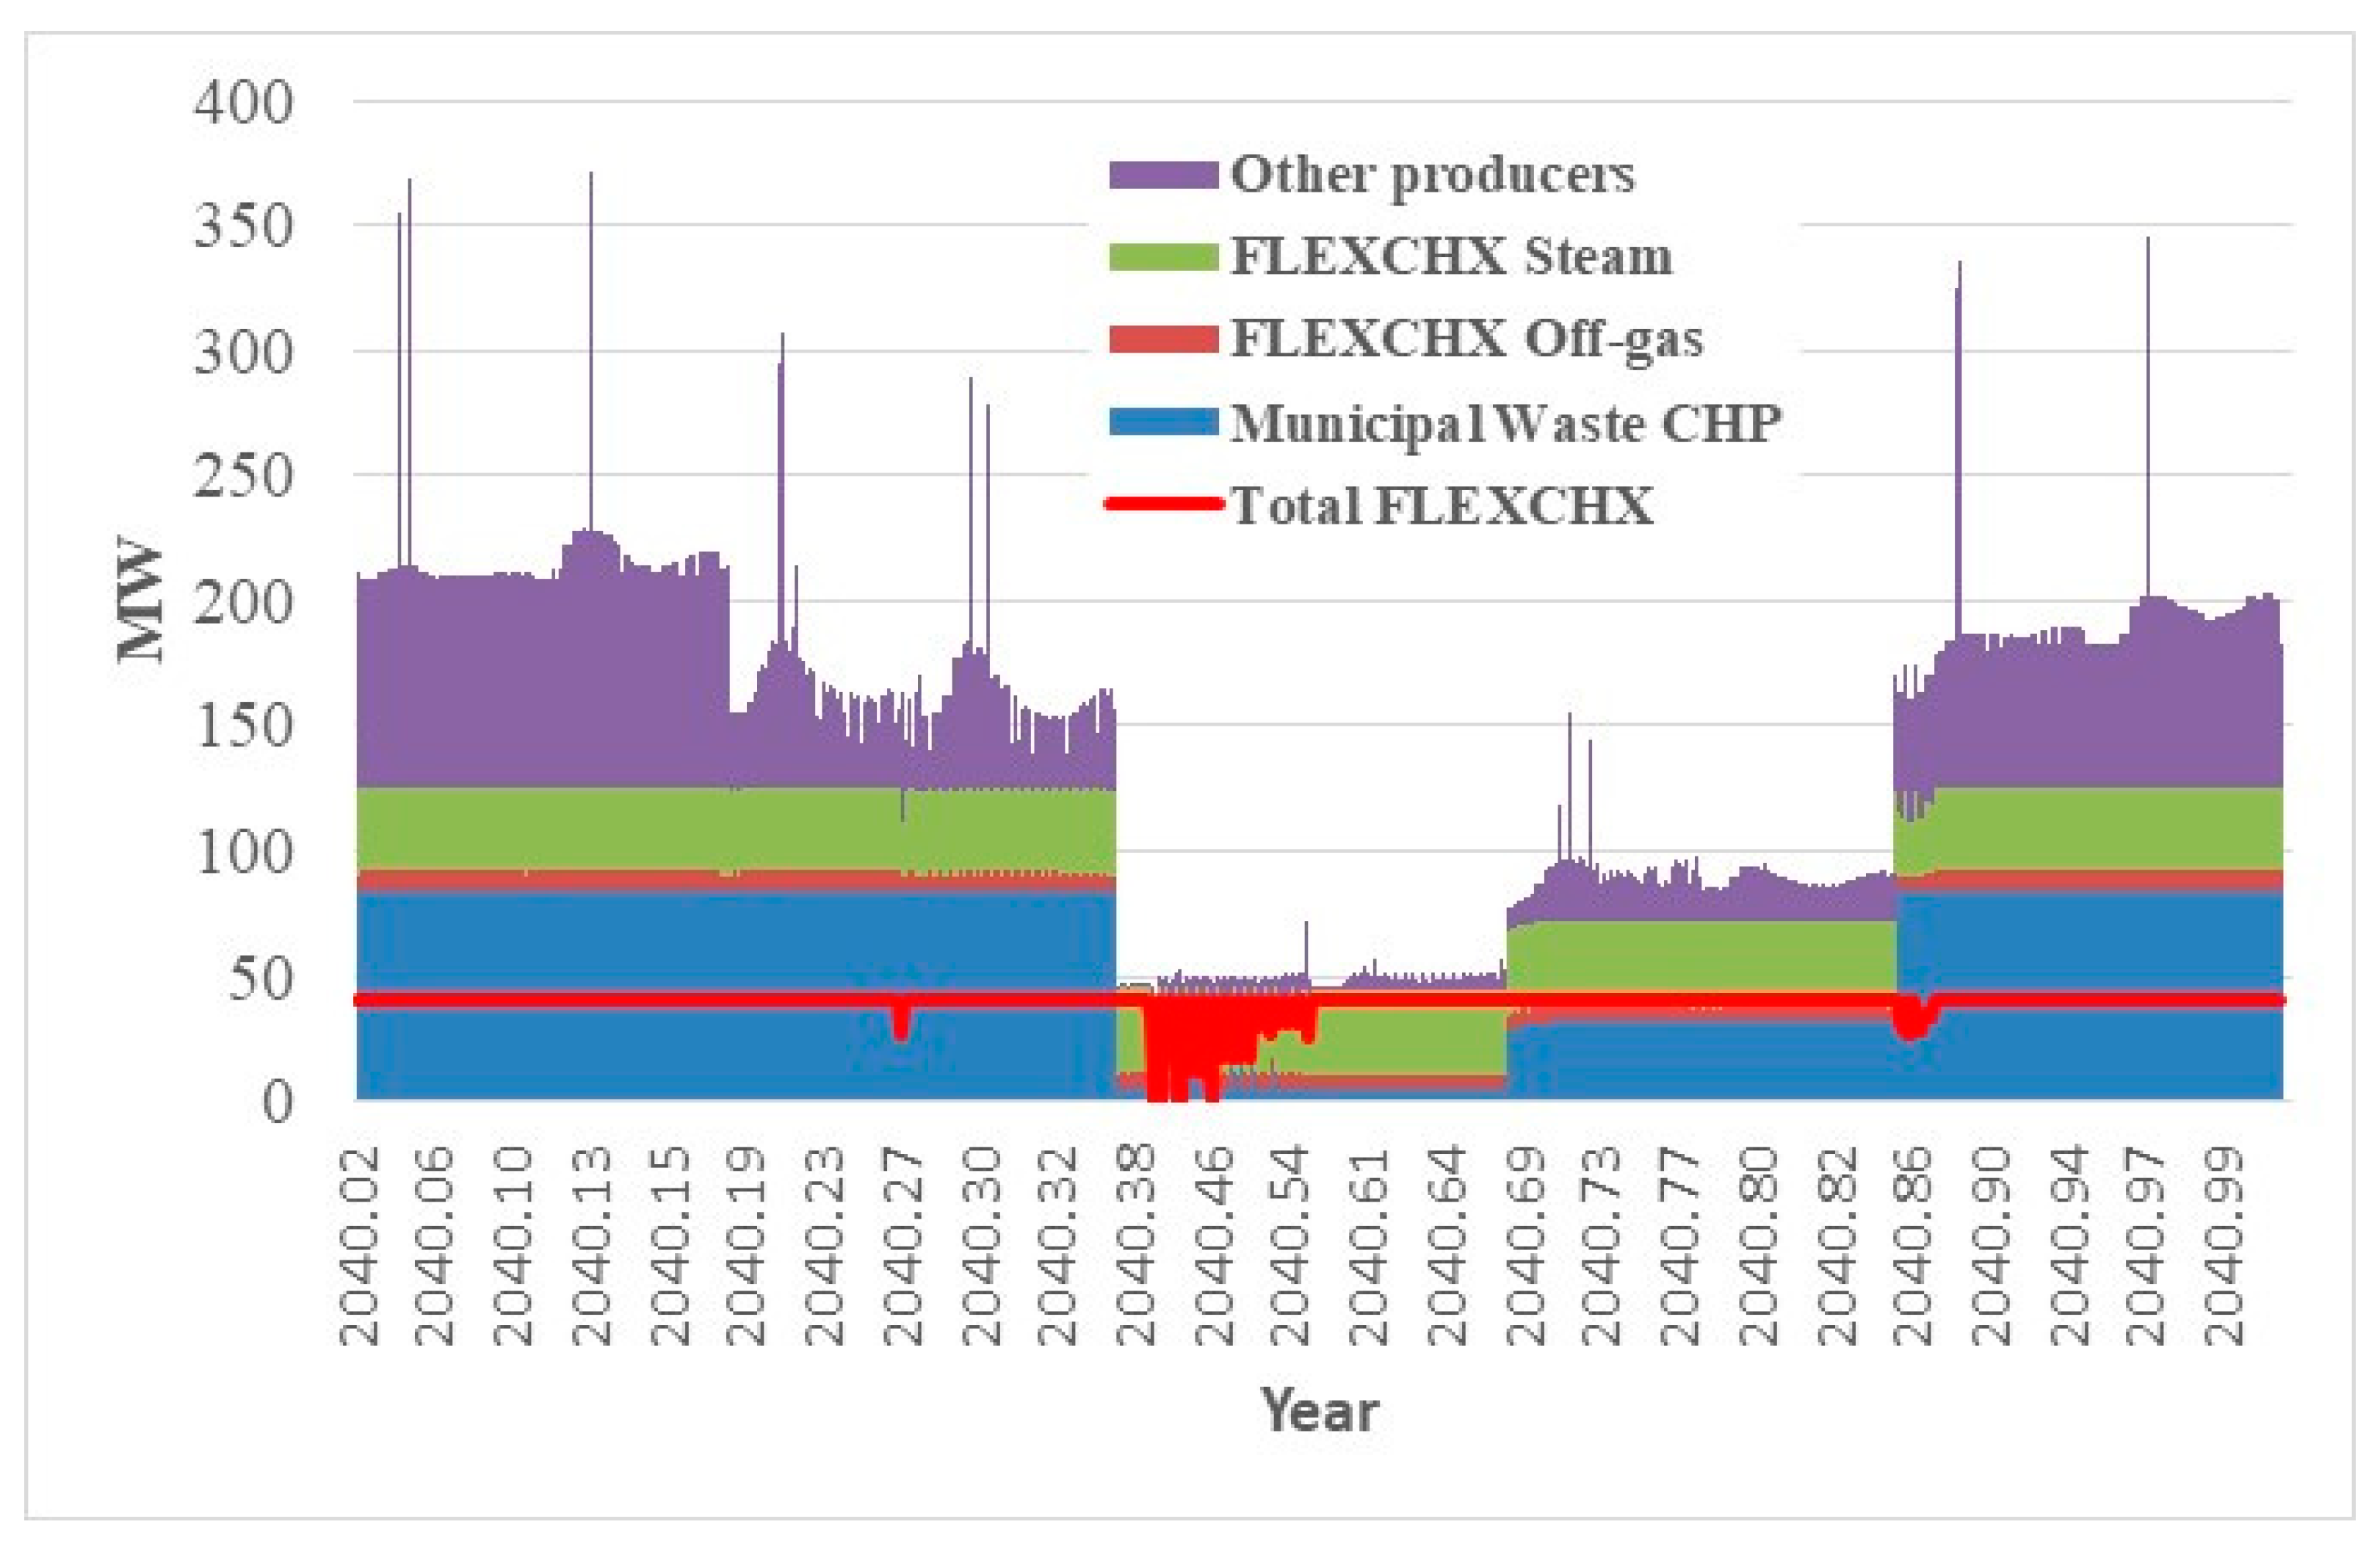
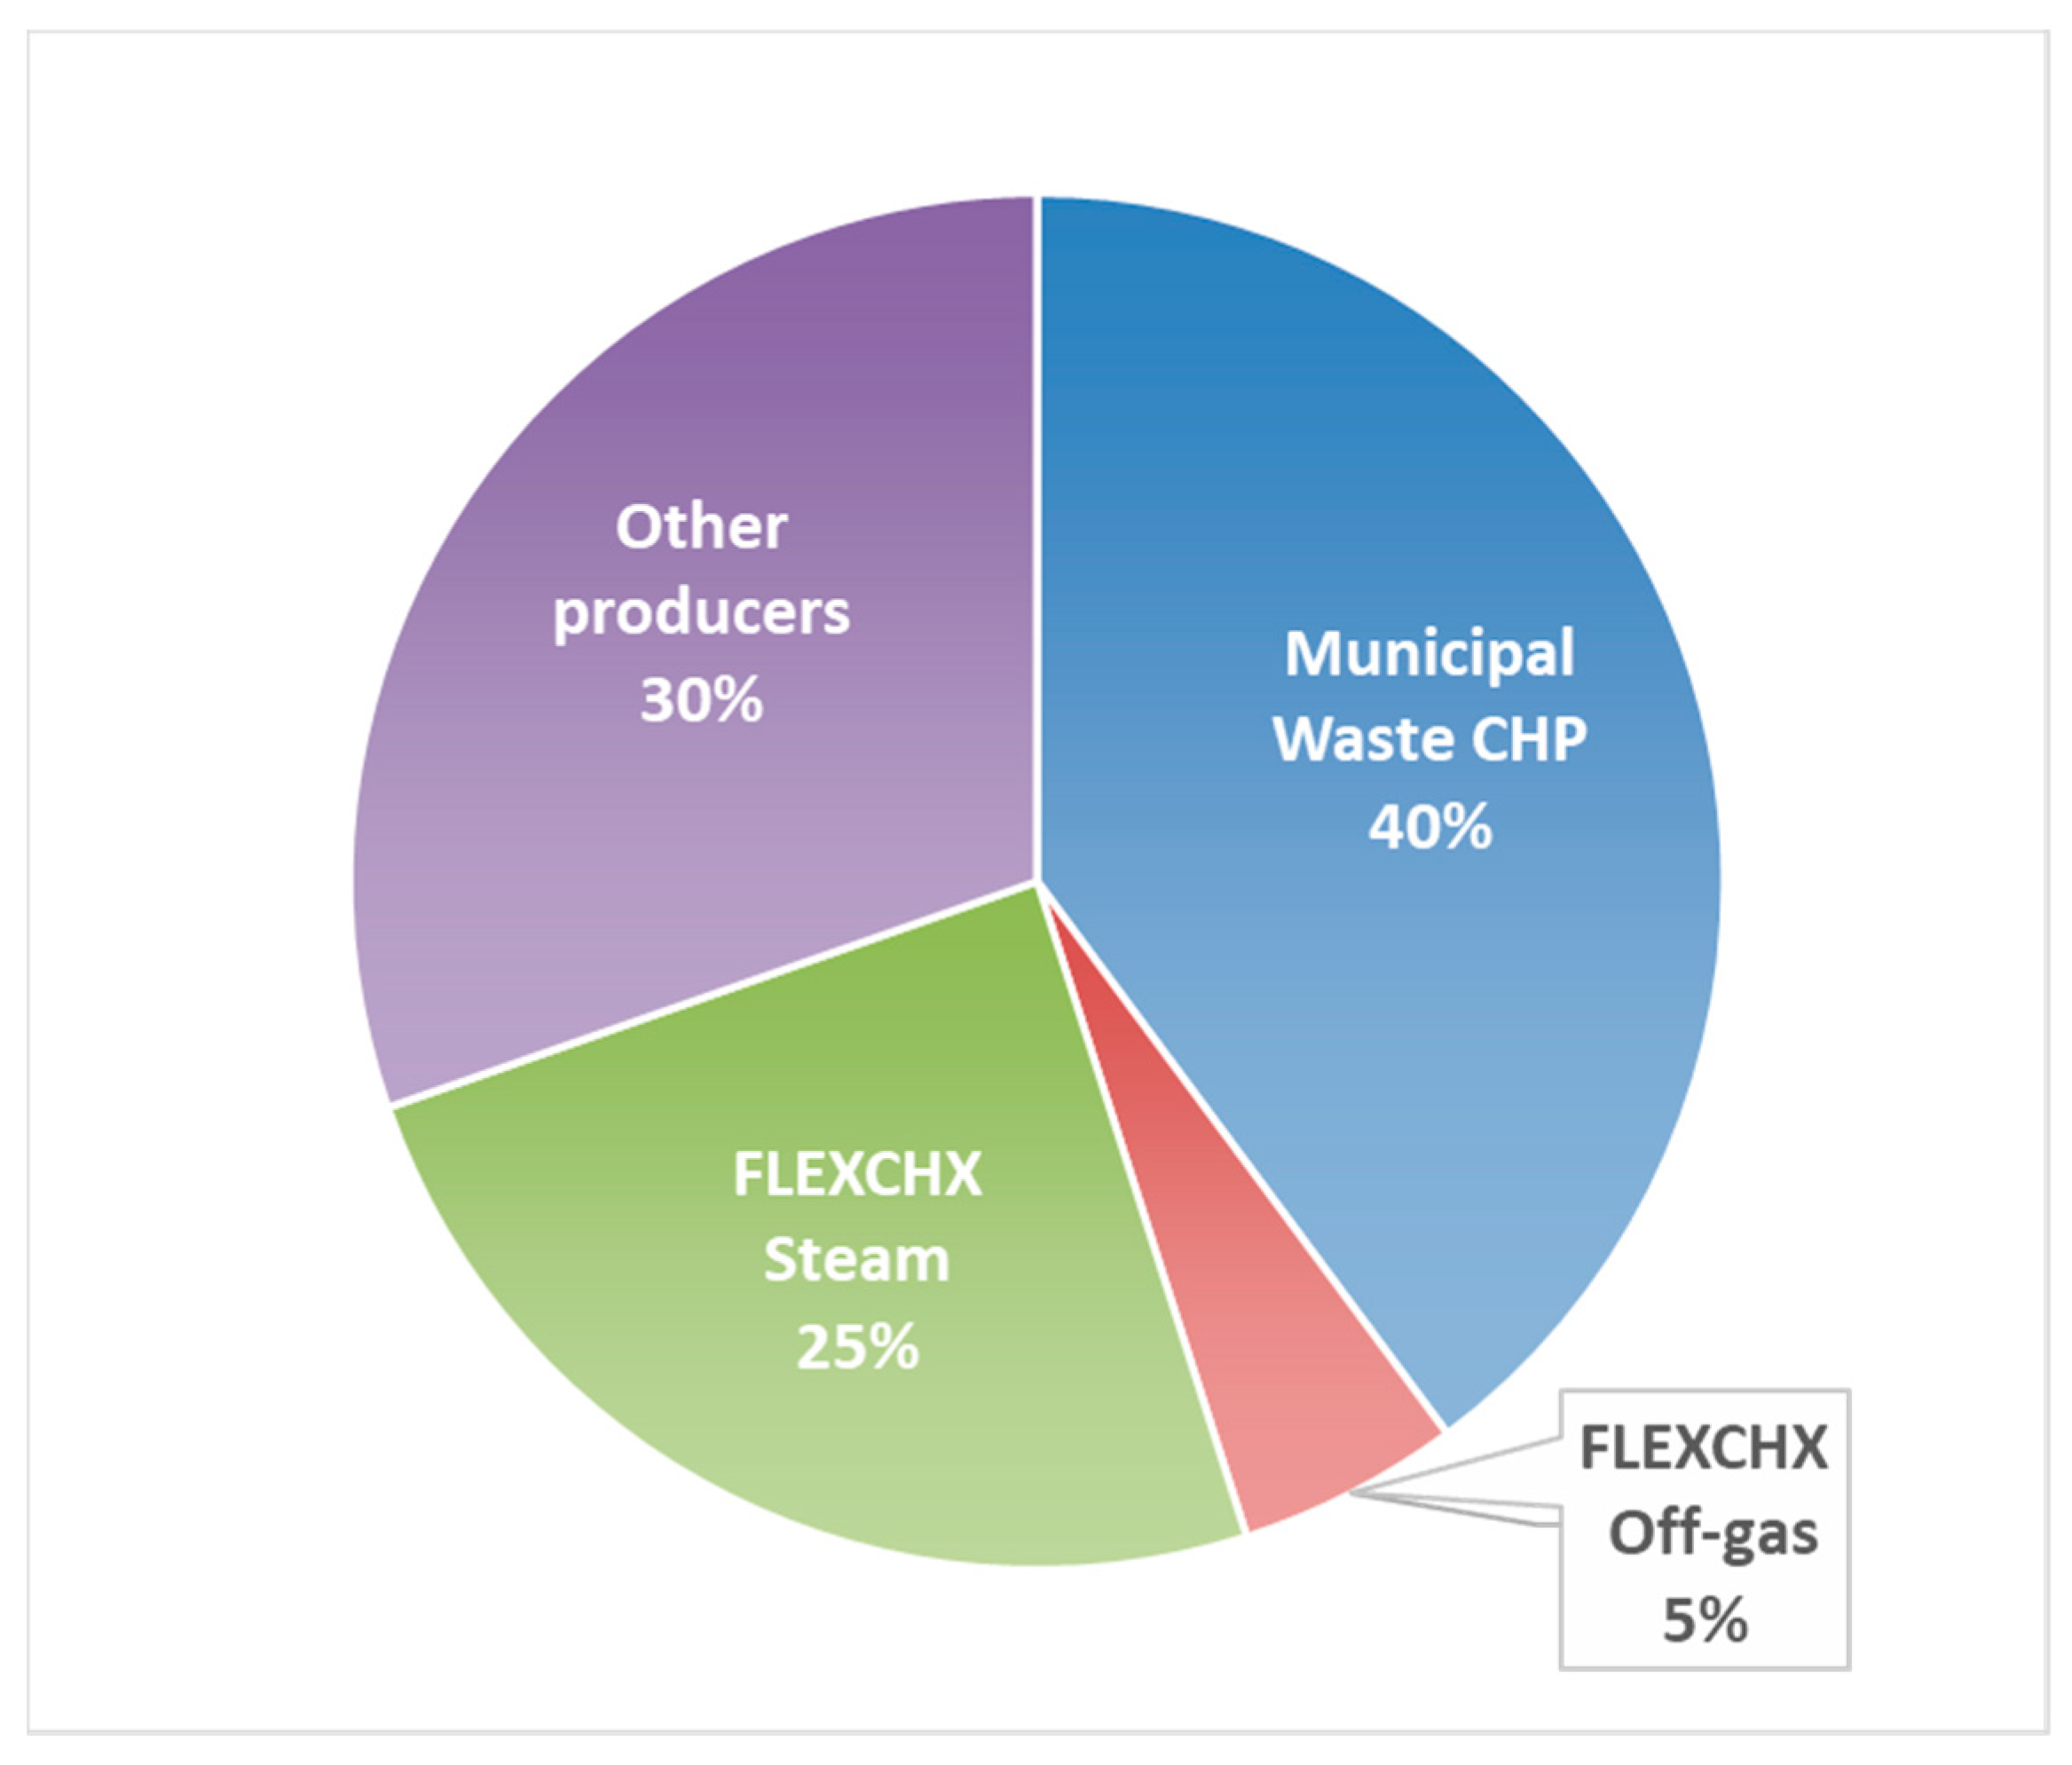
- In the Kaunas DH system example, the maximum installed capacity of FLEXCHX technology is estimated to be around 100 MW if high FT C5+ liquid prices prevail (ranging from 111.5 EUR/MWh to 132.2 EUR/MWh). In this case, by-products from the FLEXCHX technology could provide about 25% of the total heat supplied to the Kaunas DH system.
- Comparing the residential and industrial heat demand, the largest cost savings in the Kaunas case study are observed in the case of scenario 7 (FLEXCHX technology is designed for constant output of the main product when the by-products of the technology are used by the industrial consumer). In this case, up to EUR 200 mil. could be saved during the study period (compared to regular biomass use case).
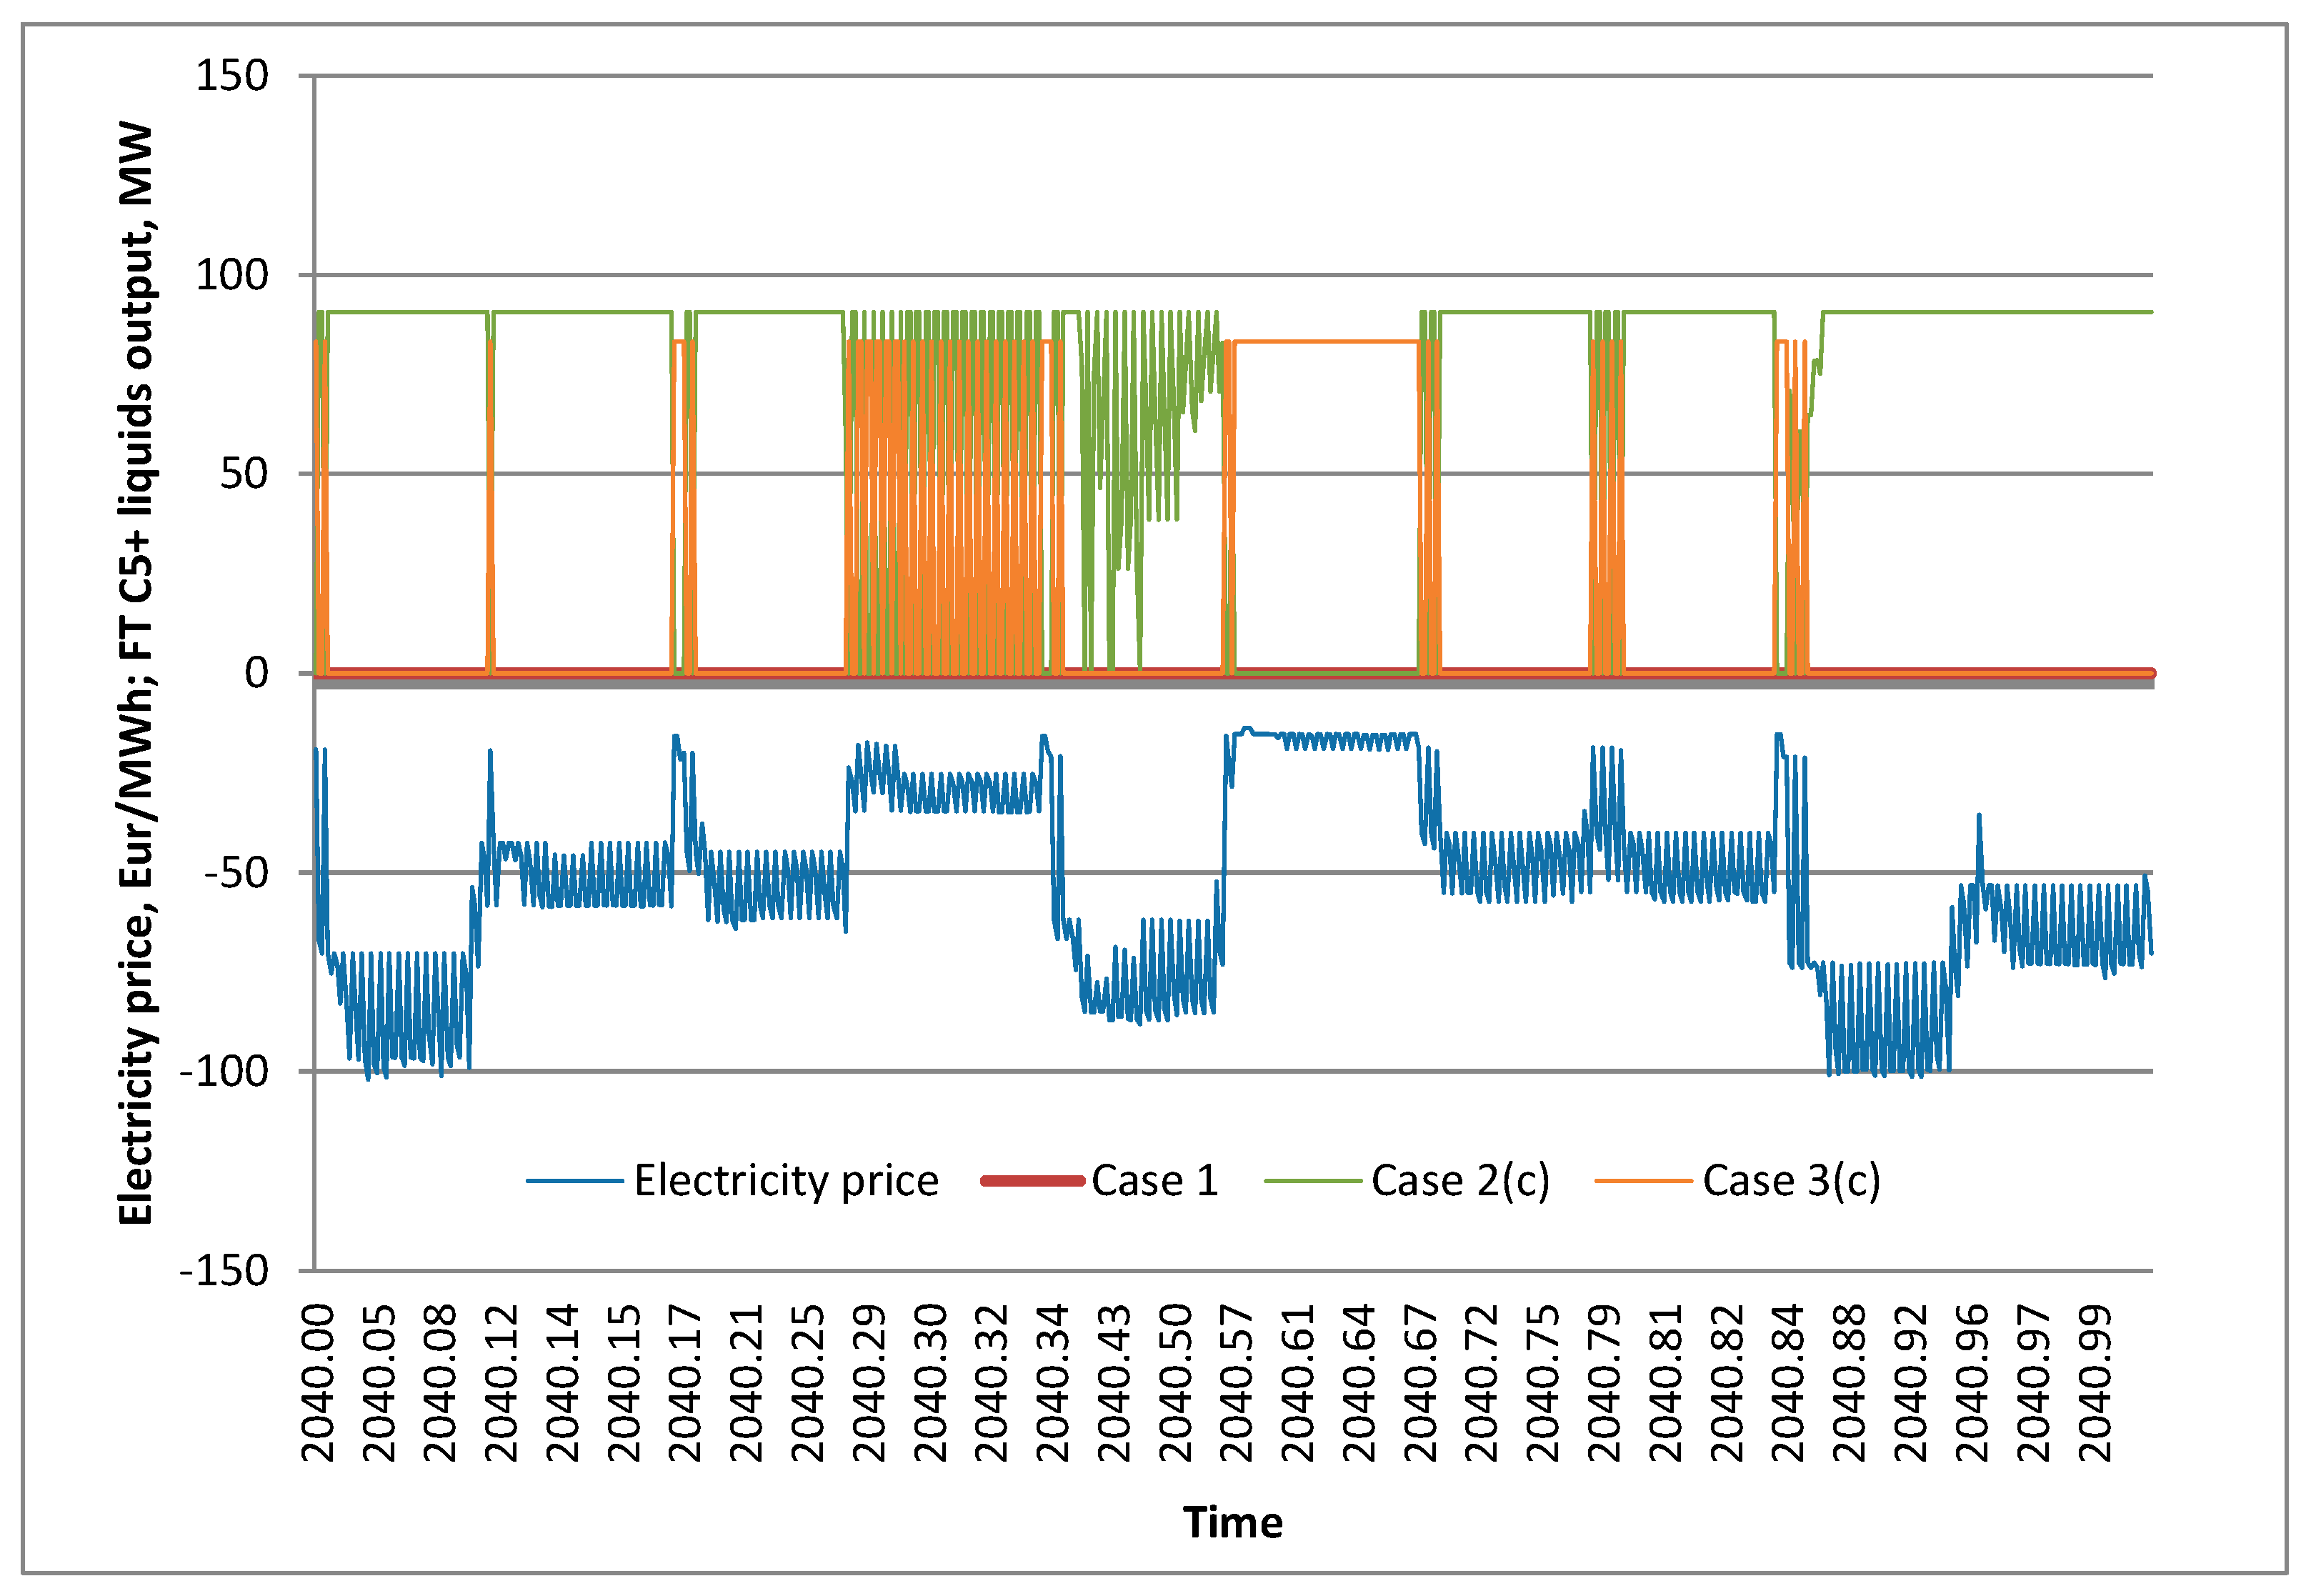
- The main operational mode of the FLEXCHX technology is operating according to Case 2 mode (biomass with O2/steam gasification and recycling of FT tail gas); however, in periods when the electricity market price stays low, Case 3 (biomass gasification boosted by electrolysis) becomes more attractive.
- The use of biomass gasification supported by hydrogen (Case 3) was marginal in the Lithuanian Kaunas DH system case due to the lack of prolonged periods of low electricity market price. However, in the situation when the share of intermittent renewable generation would rise faster than projected in this work, an additional benefit of surplus electricity could be utilized for increasing the efficiency of the FLEXCHX process. Based on the conditions of the Kaunas DH system and Lithuanian power market forecasts, it is not expedient to implement FLEXCHX technology, which is focused on the constant mode of biomass use. Although the maximum amount of FT C5+ is obtained for the biomass used in this mode of operation, it remains uneconomical because the high volatility of electricity market prices results in low utilization of the electrolysis unit, thus increasing the overall production costs.
Author Contributions
Funding
Data Availability Statement
Conflicts of Interest
Abbreviations
| EU | European Union |
| RED III | Revised Renewable Energy directive (EU/2023/2413) entered into force 20 November 2023 |
| REPowerEU | Package of European Commission proposals to end reliance on fossil fuels before 2030 in response to the 2022 Russian invasion of Ukraine |
| ReFuelEU Aviation | EU regulation aiming to increase the use of sustainable aviation fuels |
| ReFuelEU Maritime | EU regulation aiming to increase the share of renewable and low-carbon fuels in the fuel mix of international shipping |
| FT | Fischer–Tropsch |
| FLEXCHX | the flexible Fischer–Tropsch |
| DH | District heating |
| CHP | Combined heat and power plant |
| GHG | greenhouse gas |
| NECP | National Energy and Climate Plan |
| RES | Renewable energy source |
| UN | United nations |
| FT C5+ | Mixture of liquid and solid-like hydrocarbons obtained by FT process |
| MESSAGE | Model for Energy Supply System Alternatives and their General Environmental Impacts |
| MWh | Megawatt hour |
| O&M | Operation and maintenance cost (fixed and/or variable) |
| CO2 | Carbon dioxide |
| CO2 eqv | Carbon dioxide equivalent (used for measuring GHG emissions) |
Appendix A
| Technology Type | Technology Group | Plant Factor | Operation Time | Lifetime | Investment Cost | Fixed Cost | Construction Time | Efficiency | Variable Costs | ||
|---|---|---|---|---|---|---|---|---|---|---|---|
| [years] | [EUR/kW] | [EUR/kW] | [years] | Electricity in Condensing Mode | Electricity in CHP Mode | Heat | [EUR/kWyr] | ||||
| CHP units | Kaunas CHP plant, PT-60 | 1 | 0.9 | 12 30 | 1400 | 81.30 | 3 | 0.258 | 0.211 | 0.685 | 7.209 |
| Kaunas CHP plant, PT-100 | 0.310 | 0.284 | 0.525 | ||||||||
| Petrasiunai PP | 1 | 0.7 | 8 | 1734 | 261.10 | 2 | 0.219 | 0.219 | 0.581 | 26.499 | |
| Biomass CHP | 1 | 0.9 | 20 | 3240 | 278.52 | 3 | 0.172 | 0.167 | 0.832 | 81.470 | |
| Municipal waste CHP | 1 | 0.9 | 30 | 6250 | 269.68 259.56 | 3 | 0.239 | 0.232 | 0.754 | 206.780 | |
| Gas boilers | Petrasiunai PP gas boilers | 1 | 0.6 | 8 | 0.001 | 0.001 | 1 | 0.92 | 0.00876 | ||
| Silkas plant gas boiler | 1 | 0.9 | 20 | 10 | 6.1 | 1 | 0.91 | 11.598 | |||
| Gas boilers | 1 | 0.9 | 20 | 27.8 | 5.8 | 1 | 0.93 1 | 10.705 | |||
| Gas boilers in Petrasiunai PP and Kaunas CHP plant | 0.845 | 0.9 | 10 | 9.9 | 6.1 | 1 | 0.9 | 11.116 2 | |||
| New Pergale plant gas boilers | 1 | 0.9 | 20 | 29.5 | 5.7 | 1 | 0.92 | 8.195 | |||
| A.Juozapaviciaus pr. 23a plant boilers | 1 | 0.9 | 20 | 34.8 | 0.348 | 1 | 0.9 | 0.00876 | |||
| Biomass boilers | 1 | 0.9 | 15 | 289.6 | 15.06 | 1 | 1.03 3 | 21.725 4 | |||
| Solar collectors | 1 | 1 | 30 | 581.4 | 0 | 1 | 1 | 4.993 | |||
| Heat pumps | Absorption heat pump | 1 | 0.94 | 25 | 1148 | 32.96 | 5 | 2.095 | 0 | ||
| Conventional heat pump | 1 | 0.94 | 25 | 1367 | 31.62 | 5 | 4.68 | 0 | |||
| Economizers | Condensing economizer | 1 | 0.9 | 20 | 10.7 | 0.05 | 1 | 1.08 | 0.00876 | ||
| Economizers in the Inkaras plant | 1 | 0.9 | 15 | 32.4 | 0.33 | 1 | 1.25 | 0.00876 | |||
| Economizers in Silkas plant | 1 | 0.9 | 15 | 32.8 | 0.33 | 1 | 1.23 | 0.00616 | |||
| Economizers in Pergale plant | 1 | 0.9 | 20 | 10.5 | 0.05 | 1 | 1.1 | 0.00876 | |||
| Economizers in Petrasiunai plant | 1 | 0.9 | 20 | 106.2 | 1.06 | 1 | 1.2 | 0.00964 | |||
| Costs | Case 3c with Electrolyzer Costs Included | Case 3c with Electrolyzer Cost Excluded | Cost CATEGORY Assumed | |||
|---|---|---|---|---|---|---|
| Cost | Fixed O&M Cost | Variable O&M Cost | Fixed O&M Cost | Variable O&M Cost | ||
| Investment cost, EUR | 114,938,586 | 88,656,886 | ||||
| Direct production costs | ||||||
| Operating labor [OL] | 1,064,826 | 10,64,826 | 0 | 1,064,826 | 0 | Fix. cost |
| Operating supervision | 159,724 | 159,724 | 0 | 159,724 | 0 | Fix. cost |
| Maintenance labor | 1,034,447 | 1,034,447 | 0 | 797,912 | 0 | Fix. cost |
| Maintenance material | 1,034,447 | 1,034,447 | 0 | 797,912 | 0 | Fix. cost |
| Operating supplies | 310,334 | 310,334 | 0 | 239,374 | 0 | Fix. cost |
| Laboratory charges | 212,965 | 212,965 | 0 | 212,965 | 0 | Fix. cost |
| Raw materials and utilities | 35,248,149 | 0 | 763,766 | 0 | 763,766 | Var. cost |
| Revenue from by-products | −6,154,612 | 0 | 0 | 0 | 0 | N/A |
| Indirect production costs | ||||||
| Insurances and taxes | 2,068,895 | 2,068,895 | 0 | 1,595,824 | 0 | Fix. cost |
| Plant overhead costs | 1,355,398 | 1,355,398.3 | 0 | 1,213,477 | 0 | Fix. cost |
| General expenses | ||||||
| Administrative costs | 338,850 | 338,849.6 | 0 | 303,369 | 0 | Fix. cost |
| Annuity | 10,569,021 | 0.0 | 0 | 0 | 0 | N/A |
| Interim result | ||||||
| Distribution and selling costs | 3,149,496 | 0 | 3,149,496 | 0 | 2,908,749 | Var. cost |
| Research and development costs | 2,099,664 | 2,099,664 | 0 | 1,939,166.4 | 0 | Fix. cost |
| Total | 9,679,551 | 3,913,263 | 8,324,549 | 3,672,516 | ||
| Output capacity, MW | 51.8 | 51.8 | ||||
| Product output, MWh | 419,805 | 419,805 | ||||
| FLEXCHX (Cost used in Kaunas DH system model) | ||||||
| Investment cost | EUR/kW | 2218.0 | 1710.9 | |||
| Fixed O&M cost | EUR/kW | 186.8 | 160.6 | |||
| Variable O&M cost | EUR/MWh | 9.3 | 8.7 | |||
| EUR/kW/y | 81.7 | 76.6 | ||||
| Investment cost with electrolyzer | EUR | 114,938,586 | ||||
| Investment cost w/o electrolyzer | EUR | 88,656,886 | ||||
| The investment cost for the electrolyzer | EUR | 26,281,700.0 | ||||
| Electricity input to the electrolyzer | MW | 47.3 | ||||
| Operation time within a year | Hours | 8100.0 | ||||
| ELECTROLYZER (Cost used in Kaunas DH system model) | ||||||
| Investment cost | EUR/kW | 555.6 | ||||
| Fixed O&M cost | EUR/kW | 28.65 | ||||
| Variable cost | EUR/MWh | 0.63 | ||||
| EUR/kWyr | 5.50 | |||||
References
- NOAA National Centers for Environmental Information. Monthly Global Climate Report for 2023; NOAA: Washington, DC, USA, 2024. [Google Scholar]
- European Environment Agency. Global Average Air Temperature Anomalies. Available online: https://www.eea.europa.eu/data-and-maps/daviz/global-average-air-temperature-anomalies-6#tab-dashboard-01 (accessed on 8 August 2024).
- Cook, J.; Nuccitelli, D.; Green, S.A.; Richardson, M.; Winkler, B.; Painting, R.; Way, R.; Jacobs, P.; Skuce, A. Quantifying the consensus on anthropogenic global warming in the scientific literature. Environ. Res. Lett. 2013, 2, 2–7. [Google Scholar] [CrossRef]
- Naomi, O. The Scientific Consensus on Climate Change. Science 2004, 306, 1686. [Google Scholar]
- IPCC. Summary for Policymakers. In Climate Change 2023: Synthesis Report. Contribution of Working Groups I, II and III to the Sixth Assessment Report of the Intergovernmental Panel on Climate Change; IPCC: Geneva, Switzerland, 2023. [Google Scholar]
- UN. Paris Agreement. STATUS. Available online: https://treaties.un.org/pages/ViewDetails.aspx?src=TREATY&mtdsg_no=XXVII-7-d&chapter=27&clang=_en (accessed on 8 August 2024).
- UN. Paris Agreement; UN: Paris, France, 2015. [Google Scholar]
- Latvia and the European Commission. Intended Nationally Determined Contribution of the EU and Its Member States; EU: Ryga, Latvia, 2015. [Google Scholar]
- IPCC. 2006 IPCC Guidelines for National Greenhouse Gas Inventories; UN: Geneva, Switzerland, 2006. [Google Scholar]
- European Commission. Communication from the Commission to the European Parliament, the European Council, the Council, the European Economic and Social Committee and the Committee of the Regions, The European Green Deal, Brussels, 11.12.2019 COM(2019) 640 Final; European Commission: Brussels, Belgium, 2019. [Google Scholar]
- European Commission. Regulation (EU) 2021/1119 of the European Parliament and of the Council of 30 June 2021 Establishing the Framework for Achieving Climate Neutrality and Amending Regulations (EC) No 401/2009 and (EU) 2018/1999 (‘European Climate Law’). 2021. Available online: https://eur-lex.europa.eu/eli/reg/2021/1119/oj (accessed on 8 September 2024).
- European Commission. National Energy and Climate Plans. 2023. Available online: https://commission.europa.eu/energy-climate-change-environment/implementation-eu-countries/energy-and-climate-governance-and-reporting/national-energy-and-climate-plans_en (accessed on 8 September 2024).
- European Commission. Communication from the Commission to the European Parliament, the European Council, the Council, the European Economic and Social Committee and the Committee of the Regions, REPowerEU Plan, COM(2022) 230 Final; European Commission: Brussels, Belgium, 2022. [Google Scholar]
- European Parliament and the Council. Directive (EU) 2023/2413 of the European Parliament and of the Council, Amending Directive (EU) 2018/2001, Regulation (EU) 2018/1999 and Directive 98/70/EC as Regards the Promotion of Energy from Renewable Sources, and Repealing Council Directive (EU) 201; European Commission: Brussels, Belgium, 2023. [Google Scholar]
- European Commission. ReFuelEU Aviation. Available online: https://ec.europa.eu/commission/presscorner/detail/en/ip_23_2389 (accessed on 8 September 2024).
- Council of the European Union. FuelEU Maritime Initiative: Council Adopts New Law to Decarbonise the Maritime Sector. Available online: https://www.consilium.europa.eu/en/press/press-releases/2023/07/25/fueleu-maritime-initiative-council-adopts-new-law-to-decarbonise-the-maritime-sector/ (accessed on 8 September 2024).
- IEA. CO2 Emissions in 2022; IEA: Paris, France, 2023. [Google Scholar]
- Eurostat, Greenhouse Gas Emissions by Source Sector. 2024. Available online: https://ec.europa.eu/eurostat/databrowser/view/env_air_gge__custom_12545162/default/table?lang=en (accessed on 25 July 2024).
- WEForum. The European Union Has Cut Greenhouse Gas Emissions in Every Sector—Except This One; WEForum: Cologny, Switzerland, 2022. [Google Scholar]
- European Commission. A European Strategy for Low-Emission Mobility; European Commission: Brussels, Belgium, 2016. [Google Scholar]
- European Commission. Communication from the Commission to the European Parliament, the Council, the European Economic and Social Committee and the Committee of the Regions, Powering a Climate-Neutral Economy: An EU Strategy for Energy System Integration (COM(2020) 299f); European Commission: Brussels, Belgium, 2023. [Google Scholar]
- UN. Transforming Our World: The 2030 Agenda for Sustainable Development; UN: Addis Ababa, Ethiopia, 2015. [Google Scholar]
- Samavati, M.; Santarelli, M.; Martin, A.; Nemanova, V. Production of Synthetic Fischer–Tropsch Diesel from Renewables: Thermoeconomic and Environmental Analysis. Energy Fuels 2017, 32, 1744–1753. [Google Scholar] [CrossRef]
- Peduzzi, E.; Boissonnet, G.; Haarlemmer, G.; Maréchal, F. Thermo-economic analysis and multi-objective optimisation of lignocellulosic biomass conversion to Fischer–Tropsch fuels. Sustain. Energy Fuels 2018, 2, 1069–1084. [Google Scholar] [CrossRef]
- Stefano, P.; Francesco, P.; Baratieri, M. Energy and exergy analysis of different biomass gasification coupled to Fischer-Tropsch synthesis configurations. Energy 2022, 249, 123642. [Google Scholar]
- Köfinger, M.; Schmidt, R.R.; Basciotti, D.; Terreros, O.; Baldvinsson, I.; Mayrhofer, J.; Moser, S.; Tichler, R.; Pauli, H. Simulation based evaluation of large scale waste heat utilization in urban district heating networks: Optimized integration and operation of a seasonal storage. Energy 2018, 159, 1161–1174. [Google Scholar] [CrossRef]
- Ziemele, J.; Dace, E. An analytical framework for assessing the integration of the waste heat into a district heating system: Case of the city of Riga. Energy 2022, 254, 124285. [Google Scholar] [CrossRef]
- Fang, H.; Xia, J.; Zhu, K.; Su, Y.; Jiang, Y. Industrial waste heat utilization for low temperature district heating. Energy Policy 2013, 62, 236–246. [Google Scholar] [CrossRef]
- Pelda, J.; Stelter, F.; Holler, S. Potential of integrating industrial waste heat and solar thermal energy into district heating networks in Germany. Energy 2020, 203, 117812. [Google Scholar] [CrossRef]
- Böhm, H.; Moser, S.; Puschnigg, S.; Zauner, A. Power-to-hydrogen & district heating: Technology-based and infra-structure-oriented analysis of (future) sector coupling potentials. Int. J. Hydrogen Energy 2021, 46, 31938–31951. [Google Scholar]
- Golmohamadi, H.; Larsen, K.G.; Jensen, P.G.; Hasrat, I.R. Integration of flexibility potentials of district heating systems into electricity markets: A review. Renew. Sustain. Energy Rev. 2022, 159, 112200. [Google Scholar] [CrossRef]
- Egeskog, A.; Hansson, J.; Berndes, G.; Werner, S. Co-generation of biofuels for transportation and heat for district heating systems—An assessment of the national possibilities in the EU. Energy Policy 2009, 37, 5260–5272. [Google Scholar] [CrossRef]
- Ilic, D.D.; Dotzauer, E.; Trygg, L.; Broman, G. Integration of biofuel production into district heating–part I: An evaluation of biofuel production costs using four types of biofuel production plants as case studies. J. Clean. Prod. 2014, 69, 176–187. [Google Scholar] [CrossRef]
- Ljungstedt, H.; Pettersson, K.; Harvey, S. Evaluation of opportunities for heat integration of biomass-based Fischer–Tropsch crude production at Scandinavian kraft pulp and paper mill sites. Energy 2013, 62, 349–361. [Google Scholar] [CrossRef]
- Kurkela, E.; Kurkela, M.; Frilund, C.; Hiltunen, I.; Rollins, B.; Steele, A. Flexible Hybrid Process for Combined Production of Heat, Power and Renewable Feedstock for Refineries. Johns. Matthey Technol. Rev. 2021, 65, 333–345. [Google Scholar] [CrossRef]
- Kurkela, E.; Kurkela, M.; Hiltunen, I. Production of synthesis gas from biomass residues by staged fixed-bed gasifi-cation-results from pilot test campaigns. Chem. Eng. Trans. 2021, 86, 7–12. [Google Scholar]
- Skvorčinskienė, R.; Striūgas, N.; Galinis, A.; Lekavičius, V.; Kurkela, E.; Kurkela, M.; Lukoševičius, R.; Radinas, M.; Šermukšnienė, A. Renewable transport fuel production combined with cogeneration plant operation and waste heat re-covery in district heating system. Renew. Energy 2022, 189, 952–969. [Google Scholar] [CrossRef]
- Shimomura, M.; Keeley, A.R.; Matsumoto, K.; Tanaka, K.; Managi, S. Beyond the merit order effect: Impact of the rapid expansion of renewable energy on electricity market price. Renew. Sustain. Energy Rev. 2024, 189, 114037. [Google Scholar] [CrossRef]
- Pažėraitė, A.; Lekavičius, V.; Gatautis, R. District heating system as the infrastructure for competition among producers in the heat market. Renew. Sustain. Energy Rev. 2022, 169, 112888. [Google Scholar] [CrossRef]
- Gardumi, F.; Keppo, I.; Howells, M.; Pye, S.; Avgerinopoulos, G.; Lekavičius, V.; Galinis, A.; Martišauskas, L.; Fahl, U.; Korkmaz, P.; et al. Carrying out a multi-model integrated assessment of European energy transition pathways: Challenges and benefits. Energy 2022, 258, 124329. [Google Scholar] [CrossRef]
- Hast, A.; Syri, S.; Lekavičius, V.; Galinis, A. District heating in cities as a part of low-carbon energy system. Energy 2018, 152, 627–639. [Google Scholar] [CrossRef]
- IAEA. Modelling Nuclear Energy Systems with MESSAGE: A User’s Guide; IAEA: Vienna, Austria, 2007. [Google Scholar]
- Aspen Technology. Aspen Plus User Guide Version 10.2; Aspen Technology: Cambridge, MA, USA, 2000. [Google Scholar]
- Rodríguez, R.A.; Becker, S.; Andresen, G.B.; Heide, D.; Greiner, M. Transmission needs across a fully renewable European power system. Renew. Energy 2014, 63, 467–476. [Google Scholar] [CrossRef]
- Bahar, H.; Sauvage, J. Cross-Border Trade in Electricity and the Development of Renewables-Based Electric Power: Lessons from Europe. ECD Trade Environ. Work. Pap. 2013. [Google Scholar] [CrossRef]
- Casula, L.; D’AMico, G.; Masala, G.; Petroni, F. Performance estimation of a wind farm with a dependence structure between electricity price and wind speed. World Econ. 2020, 43, 2803–2822. [Google Scholar] [CrossRef]
- Acaroğlu, H.; Márquez, F.P.G. Comprehensive Review on Electricity Market Price and Load Forecasting Based on Wind Energy. Energies 2021, 14, 7473. [Google Scholar] [CrossRef]
- Kolb, S.; Dillig, M.; Plankenbühler, T.; Karl, J. The impact of renewables on electricity prices in Germany—An update for the years 2014–2018. Renew. Sustain. Energy Rev. 2020, 134, 110307. [Google Scholar] [CrossRef]
- Prol, J.L.; Steininger, K.W.; Zilberman, D. The cannibalization effect of wind and solar in the California wholesale electricity market. Energy Econ. 2020, 85, 104552. [Google Scholar] [CrossRef]
- Dong, S.; Li, H.; Wallin, F.; Avelin, A.; Zhang, Q.; Yu, Z. Volatility of electricity price in Denmark and Sweden. Energy Procedia 2019, 158, 4331–4337. [Google Scholar] [CrossRef]
- Zhang, T.; Tang, M. Solar surge and cost shifts: Heterogenous effects of redistribution in the electricity bills in Japan. Energy Econ. 2024, 137, 107806. [Google Scholar] [CrossRef]
- Johnson, E.P.; Oliver, M.E. Renewable Generation Capacity and Wholesale Electricity Price Variance. Energy J. 2019, 40, 143–168. [Google Scholar] [CrossRef]
- Schöniger, F.; Morawetz, U.B. What comes down must go up: Why fluctuating renewable energy does not necessarily increase electricity spot price variance in Europe. Energy Econ. 2022, 111, 106069. [Google Scholar] [CrossRef]
- Zang, G.; Sun, P.; Elgowainy, A.A.; Bafana, A.; Wang, M. Performance and cost analysis of liquid fuel production from H2 and CO2 based on the Fischer-Tropsch process. J. CO2 Util. 2021, 46, 101459. [Google Scholar] [CrossRef]
- Martinelli, M.; Gnanamani, M.K.; LeViness, S.; Jacobs, G.; Shafer, W.D. An overview of Fischer-Tropsch Synthesis: XtL processes, catalysts and reactors. Appl. Catal. A Gen. 2020, 608, 117740. [Google Scholar] [CrossRef]
- Jovan, D.J.; Dolanc, G. Can Green Hydrogen Production Be Economically Viable under Current Market Conditions. Energies 2020, 13, 6599. [Google Scholar] [CrossRef]
- Sneum, D.M.; González, M.G.; Gea-Bermúdez, J. Increased heat-electricity sector coupling by constraining biomass use? Energy 2021, 222, 119986. [Google Scholar] [CrossRef]
- Habermeyer, F.; Kurkela, E.; Maier, S.; Dietrich, R. Techno-Economic Analysis of a Flexible Process Concept for the Production of Transport Fuels and Heat from Biomass and Renewable Electricity. Front. Energy Res. 2021, 9, 723774. [Google Scholar] [CrossRef]




| 2020–2024 | 2025–2029 | 2030–2039 | 2040–2049 | 2050–2060 | |
|---|---|---|---|---|---|
| Gas | 27.5 | 33.5 | 39.4 | 51.3 | 63.0 |
| Heating oil | 41.2 | 50.0 | 58.9 | 76.6 | 96.8 |
| Diesel | 35.8 | 43.5 | 51.2 | 66.6 | 96.0 |
| Woodchips | 12.0 | 16.7 | 21.4 | 30.8 | 40.0 |
| Municipal waste | −9.7 | −11.1 | −12.4 | −15.2 | −17.9 |
| Global | |||
|---|---|---|---|
| FT CO conv. | 0.8 | 0.8 | 0.8 |
| FT Temp. [°C] | 230 | 230 | 230 |
| FT pressure [bar] | 20 | 20 | 20 |
| Off-gas to steam eff. [%] | 90 | 90 | 90 |
| Steam to power eff. [%] | 35 | 35 | 35 |
| Case | Case 1 | Case 2 | Case 2c 1 |
| FT CO conv. | 0.8 | 0.8 | 0.8 |
| Biomass in [MW] | 46 | 46 | 46 |
| T Gasifier [°C] | 830 | 830 | 830 |
| S/O gasifier | 1.77 | 2.5 | 2.5 |
| S/O reformer | 0.85 | 1 | 1 |
| O2/(air + O2) | 0.424 | 1 | 1 |
| T reformer [°C] | 850 | 850 | 850 |
| CO2 removal | 0.6 | 0.8 | 0.8 |
| recycle rate | 0 | 0.85 | 0.85 |
| Case | Case 3 | Case 3c 1 | |
| H2/CO | 1.8 | 1.8 | |
| Biomass in [MW] | 23 | 46 | |
| T Gasifier [°C] | 830 | 830 | |
| (S + CO2)/O gasifier | 2.4 | 2.4 | |
| S/O reformer | 1 | 1 | |
| O2/(air + O2) | 1 | 1 | |
| T reformer [°C] | 850 | 850 | |
| CO2 removal | 0.6 | 0.6 | |
| recycle rate | 0.85 | 0.85 | |
| CO2/(CO2 + S) gasifier | 0.94 | 0.94 | |
| PEM efficiency [% LHV] | 0.725 | 0.725 |
| Biomass Alone | |||
|---|---|---|---|
| Case | Case 1 | Case 2 | Case 2c |
| Fuel Efficiency | 47.6 | 58.8 | 58.8 |
| Process Efficiency | 81.1 | 80.8 | 80.8 |
| Carbon Efficiency | 30.1 | 37.3 | 37.3 |
| Boosted by electrolysis | |||
| Case | Case 3 | Case 3c | |
| Fuel Efficiency | 60.0 | 60.0 | |
| Process Efficiency | 81.9 | 81.9 | |
| Carbon Efficiency | 71.3 | 71.3 |
| Case | Input | Output | Alternative Operation Mode in the DH Model | |||||
|---|---|---|---|---|---|---|---|---|
| Biomass | Electricity | FT C5+ Liquids | FT Off-Gas | Steam | ||||
| MW (Share) | MW (Share) | MW (Share) | MW (Share) | MW (Share) | ||||
| Variable biomass input | Case 1 | 46.1 (0.920) | 4.0 (0.080) | 22.0 (0.438) | 10.4 (0.208) | 9.0 (0.180) | 1 | |
| Case 2 | 46.1 (0.912) | 4.4 (0.088) | 27.1 (0.537) | 2.2 (0.044) | 12.3 (0.244) | 2 | ||
| Case 3 | 23.1 (0.477) | 25.3 (0.523) | 25.9 (0.536) | 1.6 (0.033) | 13.0 (0.270) | 4 | ||
| Constant biomass input | Case 2c | 46.1 (0.912) | 4.4 (0.088) | 27.1 (0.537) | 2.2 (0.044) | 12.3 (0.244) | 2 | |
| Case 3c | 46.1 (0.477) | 50.6 (0.523) | 51.8 (0.536) | 3.2 (0.033) | 26.1 (0.270) | 4 | ||
| Parameter | Variable Biomass Input | Constant Biomass Input | ||||
|---|---|---|---|---|---|---|
| Case 1 | Case 2 | Case 3 | Case 2c | Case 3c | ||
| FLEXCHX | ||||||
| Investment cost, EUR/kW | 3508 | 2871 | 3006 | 3270 | 1711 | |
| Fixed O&M cost, EUR/kW | 220 | 180 | 188.1 | 268.2 | 160.6 | |
| Variable O&M cost, EUR/kWyr | 61.64 | 53.44 | 49.02 | 74.41 | 76.63 | |
| Variable O&M cost, EUR/MWh | 7.04 | 6.1 | 5.6 | 8.49 | 8.75 | |
| ELECTROLYZER | ||||||
| Investment cost *, EUR/kW | 555.7 | 555.6 | ||||
| Fixed O&M cost *, EUR/kW | 28.65 | 28.65 | ||||
| Variable O&M cost *, EUR/kWyr | 5.51 | 5.51 | ||||
| Variable O&M cost *, EUR/MWh | 0.63 | 0.63 | ||||
| Alternative operation mode in the DH system model | With variable input | 1 | 2 | 4 | ||
| With constant input | 2 | 4 | ||||
| Scenario Nr. | Linked To | Electricity Prices | Biomass Input | |||
|---|---|---|---|---|---|---|
| Public Heat Supplier | Industrial Heat Supplier | Moderate Variation | Big Variation | Varying | Stable | |
| 1 | + | + | + | |||
| 2 | + | + | + | |||
| 3 | + | + | + | |||
| 4 | + | + | + | |||
| 5 | + | + | + | |||
| 6 | + | + | + | |||
| 7 | + | + | + | |||
| 8 | + | + | + | |||
| Identifier on the Right Side of Scenario Coding * | 1 | 2 | 3 | 4 | 5 | 6 | 7 | 8 | 9 | 10 |
|---|---|---|---|---|---|---|---|---|---|---|
| Product cost | 70.0 | 77.0 | 83.9 | 90.8 | 97.7 | 104.6 | 111.5 | 118.4 | 125.3 | 132.2 |
| Product | 2030 | 2040 | 2050 | Operation Mode |
|---|---|---|---|---|
| Biomass input | - | - | - | Case 1 |
| Electricity input | - | - | - | |
| FT C5+ liquid output | - | - | - | |
| FT off-gas output | - | - | - | |
| Steam output | - | - | - | |
| Biomass input | 1215.84 | 1027.09 | 380.00 | Case 2 |
| Electricity input | 116.68 | 98.57 | 36.47 | |
| FT C5+ liquid output | 715.06 | 604.05 | 223.48 | |
| FT off-gas output | 58.07 | 49.05 | 18.15 | |
| Steam output | 325.38 | 274.86 | 101.69 | |
| Biomass input | 15.72 | 107.40 | 55.55 | Case 3 |
| Electricity input | 17.63 | 120.50 | 62.33 | |
| FT C5+ liquid output | 17.55 | 119.90 | 62.02 | |
| FT off-gas output | 1.07 | 7.32 | 3.79 | |
| Steam output | 9.21 | 62.95 | 32.56 | |
| Biomass input | 1232.43 | 1134.49 | 435.55 | Total |
| Electricity input | 134.41 | 219.07 | 98.80 | |
| FT C5+ liquid output | 733.06 | 723.95 | 285.50 | |
| FT off-gas output | 59.21 | 56.37 | 21.94 | |
| Steam output | 334.84 | 337.82 | 134.26 |
| Product | 2030 | 2040 | 2050 | Operation Mode |
|---|---|---|---|---|
| Biomass input | - | - | - | Case 1 |
| Electricity input | - | - | - | |
| FT C5+ liquid output | - | - | - | |
| FT off-gas output | - | - | - | |
| Steam output | - | - | - | |
| Biomass input | 1670.31 | 1310.66 | 1478.60 | Case 2 |
| Electricity input | 160.29 | 125.78 | 141.90 | |
| FT C5+ liquid output | 982.34 | 770.83 | 869.59 | |
| FT off-gas output | 79.77 | 62.60 | 70.62 | |
| Steam output | 447.00 | 350.75 | 395.70 | |
| Biomass input | 5.67 | 107.84 | 98.96 | Case 3 |
| Electricity input | 6.36 | 121.00 | 111.04 | |
| FT C5+ liquid output | 6.33 | 120.40 | 110.48 | |
| FT off-gas output | 0.39 | 7.35 | 6.75 | |
| Steam output | 3.32 | 63.21 | 58.01 | |
| Biomass input | 1677.23 | 1418.51 | 1577.56 | Total |
| Electricity input | 166.78 | 246.78 | 252.94 | |
| FT C5+ liquid output | 989.32 | 891.22 | 980.08 | |
| FT off-gas output | 80.26 | 69.95 | 77.36 | |
| Steam output | 450.68 | 413.97 | 453.71 |
Disclaimer/Publisher’s Note: The statements, opinions and data contained in all publications are solely those of the individual author(s) and contributor(s) and not of MDPI and/or the editor(s). MDPI and/or the editor(s) disclaim responsibility for any injury to people or property resulting from any ideas, methods, instructions or products referred to in the content. |
© 2024 by the authors. Licensee MDPI, Basel, Switzerland. This article is an open access article distributed under the terms and conditions of the Creative Commons Attribution (CC BY) license (https://creativecommons.org/licenses/by/4.0/).
Share and Cite
Galinis, A.; Kurkela, E.; Kurkela, M.; Habermeyer, F.; Lekavičius, V.; Striūgas, N.; Skvorčinskienė, R.; Neniškis, E.; Tarvydas, D. Economic Attractiveness of the Flexible Combined Biofuel Technology in the District Heating System. Sustainability 2024, 16, 8406. https://doi.org/10.3390/su16198406
Galinis A, Kurkela E, Kurkela M, Habermeyer F, Lekavičius V, Striūgas N, Skvorčinskienė R, Neniškis E, Tarvydas D. Economic Attractiveness of the Flexible Combined Biofuel Technology in the District Heating System. Sustainability. 2024; 16(19):8406. https://doi.org/10.3390/su16198406
Chicago/Turabian StyleGalinis, Arvydas, Esa Kurkela, Minna Kurkela, Felix Habermeyer, Vidas Lekavičius, Nerijus Striūgas, Raminta Skvorčinskienė, Eimantas Neniškis, and Dalius Tarvydas. 2024. "Economic Attractiveness of the Flexible Combined Biofuel Technology in the District Heating System" Sustainability 16, no. 19: 8406. https://doi.org/10.3390/su16198406
APA StyleGalinis, A., Kurkela, E., Kurkela, M., Habermeyer, F., Lekavičius, V., Striūgas, N., Skvorčinskienė, R., Neniškis, E., & Tarvydas, D. (2024). Economic Attractiveness of the Flexible Combined Biofuel Technology in the District Heating System. Sustainability, 16(19), 8406. https://doi.org/10.3390/su16198406


