
The European Union and Material Deprivation: Measuring the Evolution of Inequalities over the 2000s


Abstract
1. Introduction
Theoretical Framework of the European Experience in Temporal Material Deprivation Analysis
2. Materials and Methods
2.1. Selection of Data and Application Area
2.2. Synthesis of the Indicator Adjusted Mazziotta and Pareto Index (AMPI)
2.3. Influence Analysis
3. Results
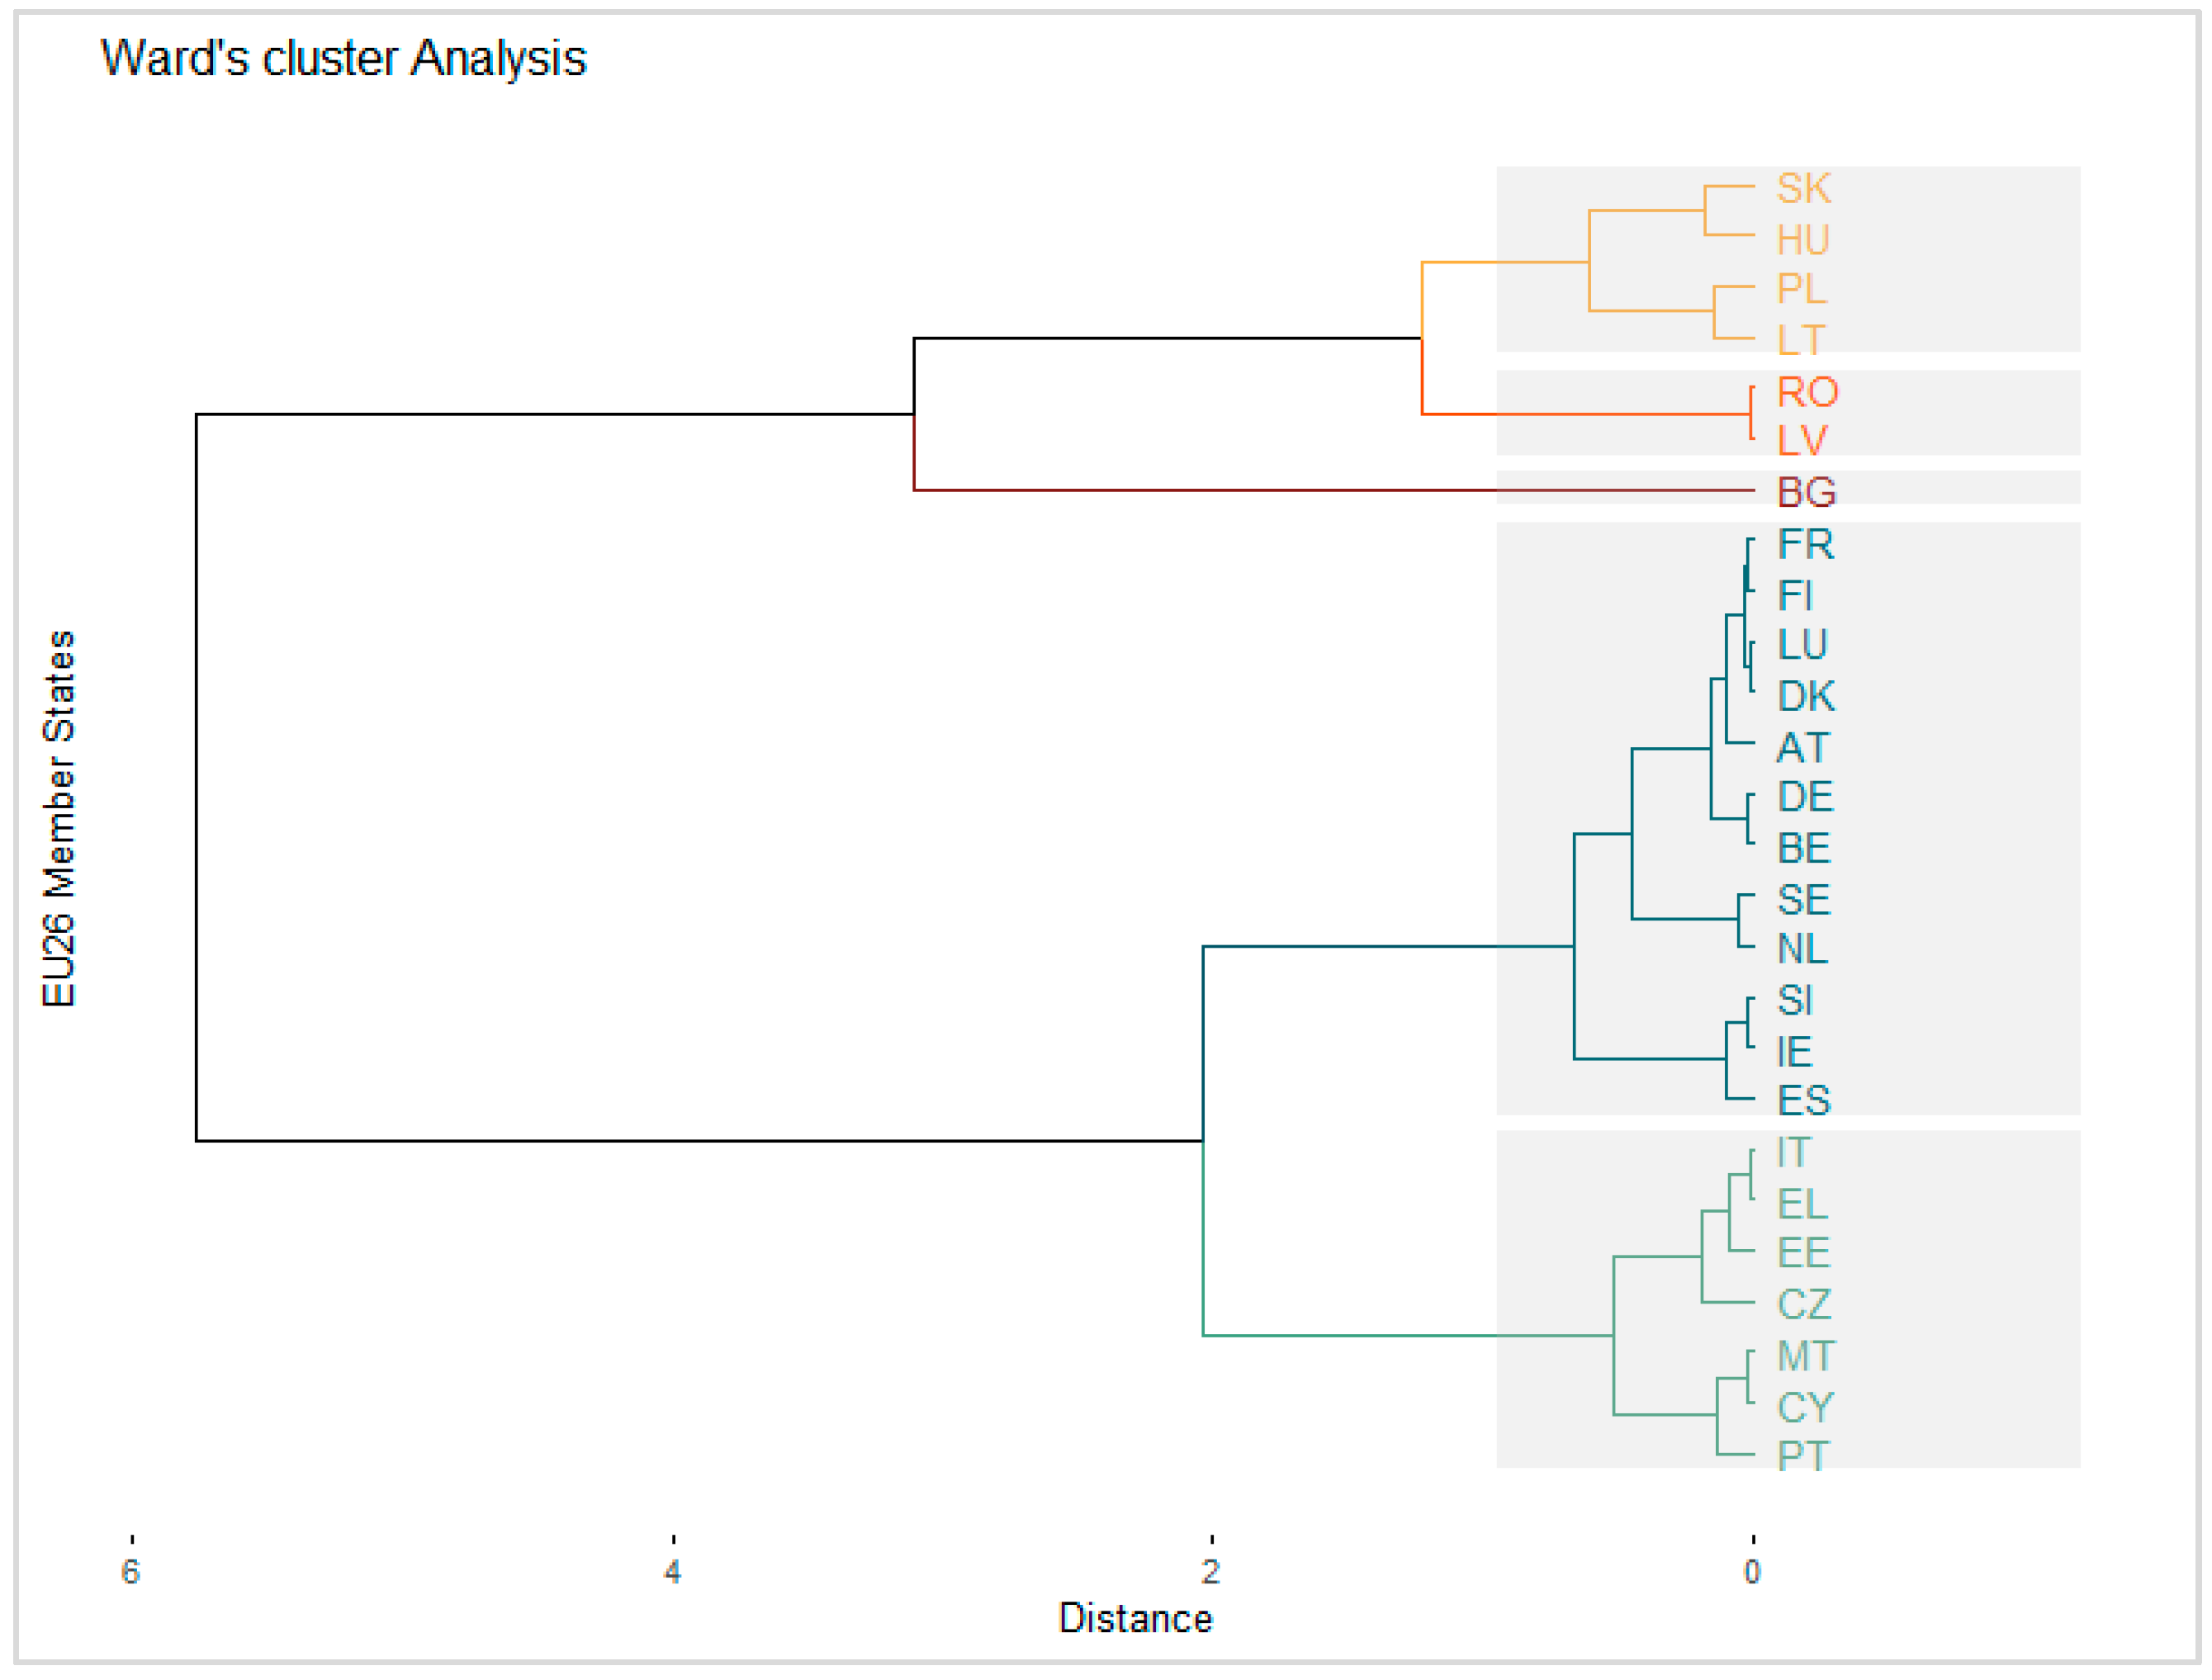
Cluster Analysis
4. Discussion
5. Conclusions
Author Contributions
Funding
Institutional Review Board Statement
Informed Consent Statement
Data Availability Statement
Conflicts of Interest
References
- Moscovici, P. Making Economic and Social Convergence Our Political Priority, Closing Remarks, Reinventing Convergence: Towards Economic Resilient Structures; European Commission: Brussels, Belgium, 2017. [Google Scholar]
- European Commission. EUROPE 2020: A Strategy for Smart, Sustainable and Inclusive Growth; Publications Office of the European Union: Luxembourg, 2010. [Google Scholar]
- Townsend, P. Poverty in the United Kingdom: A Survey of Household Resources and Standards of Living; University of California Press: Oakland, CA, USA, 1979. [Google Scholar]
- Mack, J.; Lansley, S. Poor Britain; G. Allen & Unwin: London, UK, 1985. [Google Scholar]
- Sen, A. Development as Freedom, 1st ed.; 6th Print; Knopf: New York, NY, USA, 2001. [Google Scholar]
- Guio, A.-C. What Can Be Learned from Deprivation Indicators in Europe? Office for Official Publications of the European Communities: Luxembourg, 2009. [Google Scholar]
- Fabrizi, E.; Mussida, C.; Parisi, M.L. Comparing material and social deprivation indicators: Identification of deprived populations. Soc. Indic. Res. 2023, 165, 999–1020. [Google Scholar] [CrossRef]
- Whelan, C.T.; Maitre, B. Material Deprivation, Economic Stress, and Reference Groups in Europe: An Analysis of EU-SILC 2009. Eur. Sociol. Rev. 2013, 29, 1162–1174. [Google Scholar] [CrossRef]
- Alkire, S.; Foster, J. Counting and multidimensional poverty measurement. J. Public Econ. 2011, 95, 476–487. [Google Scholar] [CrossRef]
- Ciacci, A.; Traversa, S. A non-compensatory time analysis of material deprivation in the EU. Rev. Estud. Andal. 2021, 42, 118–137. [Google Scholar] [CrossRef]
- Wirth, H.; Pforr, K. The European Union statistics on income and living conditions after 15 years. Eur. Sociol. Rev. 2022, 38, 832–848. [Google Scholar] [CrossRef]
- Landi, S.; Ivaldi, E.; Testi, A. Measuring Change Over Time in Socio-economic Deprivation and Health in an Urban Context: The Case Study of Genoa. Soc. Indic. Res. 2018, 139, 745–785. [Google Scholar] [CrossRef]
- Sedefoğlu, G.; Dudek, H. Material and Social Deprivation in the European Union: Country-level analysis. Econ. Sociol. 2024, 17, 23–35. [Google Scholar] [CrossRef]
- Norman, P. Identifying change over time in small area socio-economic deprivation. Appl. Spat. Anal. Policy 2010, 3, 107–138. [Google Scholar] [CrossRef]
- Bossert, W.; Ceriani, L.; Chakravarty, S.R.; D’Ambrosio, C. Intertemporal Material Deprivation. Poverty and Social Exclusion: New Methods of Analysis; Routledge: London, UK, 2013; p. 128. [Google Scholar]
- Bossert, W.; D’Ambrosio, C. Intertemporal Material Deprivation: A Proposal and an Application to EU Countries. In Deprivation, Inequality and Polarization; Dasgupta, I., Mitra, M., Eds.; Springer: Singapore, 2019; pp. 15–35. [Google Scholar] [CrossRef]
- Calandrino, M. Low-Income and Deprivation in British Families: An Exploratory Analysis of the ‘Consistent Poverty’ Approach to Poverty Measurement Using Data for Great Britain Drawn from the Families and Children Study: A Study Carried Out on Behalf of the Department for Work and Pensions; Department for Work and Pensions: London, UK, 2003.
- Fura, B.; Wojnar, J.; Kasprzyk, B. Ranking and classification of EU countries regarding their levels of implementation of the Europe 2020 strategy. J. Clean. Prod. 2017, 165, 968–979. [Google Scholar] [CrossRef]
- Lafuente, J.Á.; Marco, A.; Monfort, M.; Ordóñez, J. Social Exclusion and Convergence in the EU: An Assessment of the Europe 2020 Strategy. Sustainability 2020, 12, 1843. [Google Scholar] [CrossRef]
- Lloyd, C.D.; Norman, P.D.; McLennan, D. Deprivation in England, 1971–2020. Appl. Spat. Anal. Policy 2023, 16, 461–484. [Google Scholar] [CrossRef] [PubMed]
- Dudek, H.; Szczesny, W. Multidimensional material deprivation in Poland: A focus on changes in 2015–2017. Qual. Quant. 2021, 55, 741–763. [Google Scholar] [CrossRef]
- Burlina, C.; Rodríguez-Pose, A. Inequality, poverty, deprivation and the uneven spread of COVID-19 in Europe. Reg. Stud. 2024, 58, 263–284. [Google Scholar] [CrossRef]
- Meurisse, M.; Lajot, A.; Devleesschauwer, B.; Van Cauteren, D.; Van Oyen, H.; Van den Borre, L.; Brondeel, R. The association between area deprivation and COVID-19 incidence: A municipality-level spatio-temporal study in Belgium, 2020–2021. Arch. Public Health 2022, 80, 109. [Google Scholar] [CrossRef] [PubMed]
- Borualogo, I.S.; Kusdiyati, S.; Wahyudi, H. Subjective well-being and material deprivation during COVID-19 pandemic: A study in children and adolescents in Indonesia. J. Psikol. 2022, 49, 1–20. [Google Scholar] [CrossRef]
- Hoy, R. Health and Deprivation P Townsend P Phillimore A Beattie Health and Deprivation Published by Croom Helm212pp£19.950-7099-4351-2. Nurs. Stand. 1988, 2, 34. [Google Scholar] [CrossRef] [PubMed]
- Carstairs, V.; Morris, R. Deprivation and health in Scotland. Health Bull. 1990, 48, 162–175. [Google Scholar]
- Buckingham, K.; Freeman, P.R. Sociodemographic and morbidity indicators of need in relation to the use of community health services: Observational study. BMJ 1997, 315, 994–996. [Google Scholar] [CrossRef] [PubMed]
- Doiron, D.; Setton, E.M.; Shairsingh, K.; Brauer, M.; Hystad, P.; Ross, N.A.; Brook, J.R. Healthy built environment: Spatial patterns and relationships of multiple exposures and deprivation in Toronto, Montreal and Vancouver. Environ. Int. 2020, 143, 106003. [Google Scholar] [CrossRef]
- Evans, G.W.; Kantrowitz, E. Socioeconomic status and health: The potential role of environmental risk exposure. Annu. Rev. Public Health 2002, 23, 303–331. [Google Scholar] [CrossRef]
- Fusco, A.; Guio, A.C.; Marlier, E. Building a material deprivation index in a multinational context: Lessons from the EU experience. In Poverty and Social Exclusion around the Mediterranean Sea; Springer: Boston, MA, USA, 2013; pp. 43–71. [Google Scholar]
- Čermáková, K.; Hromada, E.; Bednar, O.; Pavelka, T. Real Estate Market At A Crossroad—Era Of Affordable Housing Is Gone. Int. J. Econ. Sci. 2023, 12, 38–61. [Google Scholar] [CrossRef]
- Łuczak, A.; Kalinowski, S. A multidimensional comparative analysis of poverty statuses in European Union countries. Int. J. Econ. Sci. 2022, 11, 146–160. [Google Scholar] [CrossRef]
- De Muro, P.; Mazziotta, M.; Pareto, A. Composite indices of development and poverty: An application to MDGs. Soc. Indic. Res. 2011, 104, 1–18. [Google Scholar] [CrossRef]
- Mazziotta, M.; Pareto, A. A non-compensatory approach for the measurement of the quality of life. In Quality of Life in Italy; Springer: Cham, Switzerland, 2012; pp. 27–40. [Google Scholar]
- Mazziotta, M.; Pareto, A. On a generalized non-compensatory composite index for measuring socio-economic phenomena. Soc. Indic. Res. 2016, 127, 983–1003. [Google Scholar] [CrossRef]
- Mazziotta, M.; Pareto, A. Gli indici Sintetici; Giappichelli: Tourin, Italy, 2020. [Google Scholar]
- Müller-Frączek, I. Periodical measurement of multidimensional phenomena. Acta Oeconomica 2023, 73, 305–325. [Google Scholar] [CrossRef]
- Agius, S. Constructing a Multidimensional Well-Being Index for Malta. Master’s Thesis, University of Malta, Msida, Malta, 2023. [Google Scholar]
- Penco, L.; Ivaldi, E.; Bruzzi, C.; Musso, E. Knowledge-based urban environments and entrepreneurship: Inside EU cities. Cities 2020, 96, 102443. [Google Scholar] [CrossRef]
- Tarantola, S.; Jesinghaus, J.; Puolamaa, M. Global sensitivity analysis: A quality assurance tool in environmental policy modelling. Sensit. Anal. 2000, 385–397. [Google Scholar]
- Mazziotta, M.; Pareto, A. Measuring well-being over time: The adjusted Mazziotta–Pareto index versus other non-compensatory indices. Soc. Indic. Res. 2018, 136, 967–976. [Google Scholar] [CrossRef]
- Freudenberg, M. Composite Indicators of Country Performance: A Critical Assessment; OECD Publishing: Paris, France, 2003. [Google Scholar]
- Martínez, J.; Pfeffer, K.; Baud, I.S.A. Factors shaping cartographic representations of inequalities. Maps as products and processes. Habitat Int. 2016, 51, 90–102. [Google Scholar] [CrossRef]
- OECD. Handbook on Constructing Composite Indicators: Methodology and User Guide; OECD Publishing: Paris, France, 2008. [Google Scholar] [CrossRef]
- Saisana, M.; Tarantola, S.; Saltelli, A. Uncertainty and sensitivity techniques as tools for the analysis and validation of composite indicators. J. R. Stat. Soc. A 2005, 168, 307–323. [Google Scholar] [CrossRef]
- Ward, J.H. Hierarchical grouping to optimize an objective function. J. Am. Stat. Assoc. 1963, 58, 236–244. [Google Scholar] [CrossRef]
- Murtagh, F.; Legendre, P. Ward’s Hierarchical Agglomerative Clustering Method: Which Algorithms Implement Ward’s Criterion? J. Classif. 2014, 31, 274–295. [Google Scholar] [CrossRef]
- Matković, T.; Šućur, Z.; Zrinščak, S. Inequality, Poverty, and Material Deprivation in New and Old Members of European Union. Croat. Med. J. 2007, 48, 636. [Google Scholar] [PubMed]
- World Bank Group. Bulgaria: Systematic Country Diagnostic; World Bank: Washington, DC, USA, 2021; Available online: https://documents1.worldbank.org/curated/en/727791642521506054/pdf/Bulgaria-Systematic-Country-Diagnostic.pdf (accessed on 5 July 2024).
- World Bank Group. Lessons from Poland, Insights for Poland: A Sustainable and Inclusive Transition to High Income Status; © World Bank: Washington, DC, USA, 2017; Available online: http://hdl.handle.net/10986/28960 (accessed on 5 July 2024).


| MD Dimension | AMPI+ Range | EU-SILC Cod. |
|---|---|---|
| Enforced lack of durable goods | Inability to afford a telephone | Ilc_mddu01 |
| Inability to own a color TV | Ilc_mddu02 | |
| Inability to afford a washing machine | Ilc_mddu04 | |
| Inability to afford one’s own car | Ilc_mddu05 | |
| Economic stress | Inability to heat adequately one’s own home | Ilc_mdes01 |
| Inability to take one week’s holiday a year | Ilc_mdes02 | |
| Inability to afford a protein meal, or vegetarian alternative, every two days | Ilc_mdes03 | |
| Inability to cope with unforeseen expenses | Ilc_mdes04 | |
| Inability to meet overdue payments | Ilc_mdes05 | |
| Inability to make ends meet | Ilc_mdes09 |
| EU26 MS | 2005 | 2008 | 2013 | 2018 | 2022 | |||||
|---|---|---|---|---|---|---|---|---|---|---|
| AMPI+ | Rank | AMPI+ | Rank | AMPI+ | Rank | AMPI+ | Rank | AMPI+ | Rank | |
| Austria | 89 | 24 | 91 | 18 | 90 | 23 | 76 | 24 | 89 | 19 |
| Belgium | 92 | 19 | 91 | 19 | 93 | 19 | 92 | 15 | 91 | 15 |
| Bulgaria | 144 | 1 | 125 | 1 | 126 | 1 | 167 | 2 | 104 | 3 |
| Cyprus | 102 | 10 | 104 | 6 | 111 | 6 | 133 | 4 | 96 | 4 |
| Czech Republic | 97 | 14 | 93 | 15 | 97 | 16 | 79 | 21 | 86 | 25 |
| Denmark | 91 | 21 | 89 | 23 | 92 | 20 | 81 | 19 | 88 | 20 |
| Estonia | 101 | 11 | 93 | 16 | 97 | 15 | 92 | 16 | 90 | 17 |
| Finland | 91 | 22 | 89 | 24 | 91 | 22 | 81 | 18 | 88 | 21 |
| France | 91 | 23 | 90 | 21 | 90 | 24 | 86 | 17 | 92 | 13 |
| Germany | 91 | 20 | 90 | 20 | 91 | 21 | 76 | 22 | 91 | 14 |
| Greece | 99 | 13 | 101 | 10 | 113 | 5 | 169 | 1 | 112 | 1 |
| Hungary | 107 | 7 | 105 | 5 | 116 | 3 | 119 | 7 | 95 | 5 |
| Italy | 99 | 12 | 102 | 9 | 105 | 8 | 105 | 10 | 92 | 12 |
| Latvia | 121 | 2 | 105 | 4 | 116 | 4 | 123 | 5 | 94 | 7 |
| Lithuania | 113 | 5 | 98 | 11 | 102 | 11 | 120 | 6 | 93 | 10 |
| Luxembourg | 92 | 18 | 90 | 22 | 93 | 18 | 70 | 26 | 87 | 24 |
| Malta | 103 | 9 | 98 | 12 | 103 | 9 | 81 | 20 | 90 | 18 |
| Netherland | 88 | 25 | 86 | 26 | 89 | 25 | 72 | 25 | 86 | 26 |
| Poland | 115 | 4 | 103 | 7 | 99 | 14 | 95 | 13 | 90 | 16 |
| Portugal | 104 | 8 | 107 | 3 | 105 | 7 | 107 | 8 | 93 | 9 |
| Republic of Ireland | 94 | 17 | 91 | 17 | 100 | 12 | 94 | 12 | 92 | 11 |
| Romania | 121 | 3 | 125 | 2 | 124 | 2 | 152 | 3 | 105 | 2 |
| Slovakia | 109 | 6 | 102 | 8 | 103 | 10 | 107 | 9 | 94 | 8 |
| Slovenia | 94 | 16 | 94 | 14 | 107 | 17 | 93 | 14 | 88 | 22 |
| Spain | 95 | 15 | 94 | 13 | 122 | 13 | 100 | 11 | 95 | 6 |
| Sweden | 87 | 26 | 87 | 25 | 73 | 26 | 74 | 23 | 87 | 23 |
| Cluster | AMPI+ Range | EU26 MS |
|---|---|---|
| 1. High level of material deprivation | >213 | BG |
| 2. | >187: ≤213 | LV; RO |
| 3. | >140: ≤187 | HU; LT; PL; SK |
| 4. | >104: ≤140 | CY; CZ; IT; EE; EL; MT; PT |
| 5. Lower level of material deprivation | ≤104 | AT; BE; DE; DK; ES; FI; FR; IE; LV; NL; SE; SI |
Disclaimer/Publisher’s Note: The statements, opinions and data contained in all publications are solely those of the individual author(s) and contributor(s) and not of MDPI and/or the editor(s). MDPI and/or the editor(s) disclaim responsibility for any injury to people or property resulting from any ideas, methods, instructions or products referred to in the content. |
© 2024 by the authors. Licensee MDPI, Basel, Switzerland. This article is an open access article distributed under the terms and conditions of the Creative Commons Attribution (CC BY) license (https://creativecommons.org/licenses/by/4.0/).
Share and Cite
Traversa, S.; Ivaldi, E.; Forciniti, A. The European Union and Material Deprivation: Measuring the Evolution of Inequalities over the 2000s. Sustainability 2024, 16, 6148. https://doi.org/10.3390/su16146148
Traversa S, Ivaldi E, Forciniti A. The European Union and Material Deprivation: Measuring the Evolution of Inequalities over the 2000s. Sustainability. 2024; 16(14):6148. https://doi.org/10.3390/su16146148
Chicago/Turabian StyleTraversa, Susanna, Enrico Ivaldi, and Alessia Forciniti. 2024. "The European Union and Material Deprivation: Measuring the Evolution of Inequalities over the 2000s" Sustainability 16, no. 14: 6148. https://doi.org/10.3390/su16146148
APA StyleTraversa, S., Ivaldi, E., & Forciniti, A. (2024). The European Union and Material Deprivation: Measuring the Evolution of Inequalities over the 2000s. Sustainability, 16(14), 6148. https://doi.org/10.3390/su16146148