Article

Waste Tyre Textile Fibre Composite Material: Acoustic Performance and Life Cycle Assessment

by
Robert Ružickij
1,*,
Francesco Romagnoli
2 and
Raimondas Grubliauskas
1
1
Department of Environmental Protection and Water Engineering, Vilnius Gediminas Technical University, Saulėtekio al. 11, LT-10223 Vilnius, Lithuania
2
Institute of Energy Systems and Environment, Riga Technical University, Āzenes iela 12-K1, LV-1048 Riga, Latvia
*
Author to whom correspondence should be addressed.
Sustainability 2024, 16(15), 6281; https://doi.org/10.3390/su16156281
Submission received: 2 June 2024 / Revised: 16 July 2024 / Accepted: 19 July 2024 / Published: 23 July 2024
(This article belongs to the Special Issue Waste Management for Sustainability: Emerging Issues and Technologies)

Abstract

:
The development of new sound absorbing materials and the transition to net zero emissions production have become inseparable. This paper investigates a new type of composite sound absorbing material made of waste tyre textile fibre (WTTF) and different binders: polyurethane resin (PU), polyvinyl acetate (PVA), and starch (POS). Non-acoustic and acoustic parameters were studied, and life cycle assessment was performed for the considered composite sound absorbing materials. The airflow resistivity was determined according to the ISO 9053-1 standard, while the sound absorption coefficient was determined according to the ISO 10534-2 standard, and the LCA was performed based on the ISO 14040 and ISO 14044 standards. Composite sound absorbing materials subjected to sound absorption coefficient tests showed results in the range of 0.04 to 0.99 and peaking in the frequency range of 800 to 2000 Hz, while airflow resistivity varied between 17.4 and 83.6 kPa⋅s/m2. The combination that gave the highest sound absorption coefficient was experimentally found to be PU composite material. Life cycle assessment results revealed that the lowest potential impact on the environment is obtained when composite materials are produced using starch as a binder and its total potential impact on the environment varied between 0.27 and 0.55 Pt, while the highest potential impact was observed by PU composites (0.33 ÷ 0.64 Pt). The results obtained experimentally and by LCA modelling revealed great attractiveness and promising development of composites using WTTF and different binders’ potential for sound absorbing applications.

1. Introduction

Nowadays, the rapid urbanisation and development of modern societies leads to serious problems induced by noise pollution [1]. Controlling the noise these days has become highly prioritised. For the most part, people spend their lives in buildings, living, working, or spending their free time, so their comfort must be ensured. There is still the problem that the premises do not fit the purpose that they are set for, and therefore, people experience discomfort. The quality of sound in the room can be addressed as part of this problem [2]. With increasing reverberation time in the room, the sound transmission index (STI) decreases, leading to increased difficulty in communication, annoyance, and fatigue [3]. The most common solution for a reduction in reverberation time in the room is the use of sound absorbing materials. Elementary examples could be suspended ceilings, acoustic baffles, mineral wools, etc. [4]. Such solutions can improve the quality of the sound in the room, thus improving people’s well-being.
Yet, a large portion of sound absorbing materials consists of mineral wools and sound absorbing panels. However, moving toward sustainable development and the aim of the EU to become a climate-neutral organisation by 2050, by implementing the principles of a circular economy [5], scientists are looking for new types of sound absorbing materials. Recent trends in such materials have emerged, including interest in natural or recycled, secondary-use sound absorbing materials, especially. The use of these materials shows their potential and successful use for improving indoor sound quality, as their acoustic properties are characterised by properties similar to conventional materials [6,7,8,9]. Recycled materials are known for their high porosity, low density, and optimum airflow resistivity, which are key factors for good sound absorption [10,11].
The use of recycled waste materials in acoustics has become inevitable. In general, the importance and potential of waste reuse are seen in the implementation of the objectives of the circular economy [12,13,14]. Recently, much attention has been paid to materials for sound absorption applications that are produced from textiles (from fabrics), plastic, rubber granule (from end-of-life tyres) waste, paper sludge, waste tyre textile fibre (from end-of-life tyres), etc. The sound absorption coefficient of these materials at low frequencies (160–500 Hz) varies in the range of 0.10 to 0.65, while in the mid-frequency (630–2000 Hz) range, it lies between 0.39 and 0.99 [15,16,17,18,19]. Such results show the potential of recycled materials, especially in lower frequency bands, ensuring that transmission of human speech would be improved.
The object of this research is waste tyre textile fibre (WTTF) composite panels. WTTF was derived from the end-of-life tyre recycling process. A textile cord in tyre production is used for reinforcement of tyre structure to withstand high loads. To date, rubber has already been extensively used for the production of new materials, such as vibration damping mats, silent asphalt, children’s playground surfaces, production of sound insulating materials, etc. [20,21,22]. Metals extracted during recycling could be remelted and used again. However, waste tyre textile fibre is a material that is currently considered waste, due to no current secondary use. Around 320,000 tonnes of waste tyre textile fibre are generated in Europe every year, which is a cause for concern [23]. Tests were carried out for use in new generation asphalt production as a binder, as well as in concrete production and soil reinforcement [24,25,26]. Although efforts have been made, there is a potential of WTTF to be used as a sound absorbing material, due to its similarities to mineral wools. The first stage of research was carried out by the authors of [27], in which they found that there are prospects for this material. In the first stages, without any binding agent, the WTTF samples showed a sound absorption coefficient (SAC) in the range of 0.18 to 0.67 in the low-frequency range.
When developing new composite sound absorbing materials, one of the main parameters is the material and binder ratio [28,29]. Such a condition must be ensured; therefore, the acoustic parameters of the material depend on ratio. Supposing that the composite material would be too rigid and air would not be able to pass through, energy cannot be transformed and lost due to friction effects. On the other hand, when the material and binder ratio is not sufficient, the composite material can easily break down [30]. In this study, three types of binder were considered—polyurethane resin (PU), polyvinyl acetate (PVA), and starch (POS). Polyurethane is derived from polyols that are made using different natural oils, such as soybean, cotton seed, castor, etc. [31]. Polyurethane resin is known for its good elasticity, durability, and robustness, as well as its resistance to moisture [32]. Polyvinyl acetate is characterised by its good binding properties, high tensile strength, and flexibility, and also being biodegradable and non-toxic [33]. Lastly, starch is a natural product which is found in many starchy plants such as potatoes, corn, wheat, etc. Starch mixed with water and heated up to 70 °C is then dissolved and forms a gel-like mass that can be used as a binder. Starch can be characterised as robust and have high compressive strength but low elasticity. Starch compared to PU and PVA is a natural, renewable, and non-toxic binder found in nature [34]. However, there is a risk that starting to grow vegetables intended for starch production may displace vegetables intended for food, as a result of which food deprivation may increase. Knowing that these binders have different physical and mechanical parameters, it is crucial to test their performance in acoustic material to find the optimum binder and its quantity.
Nowadays, when developing new products or services, the importance of life cycle assessment (LCA) has become a key point. It is a tool that provides information on the potential impact of a product on the environment during different stages of its life. Many sound absorbing materials cannot be considered environmentally friendly due to the fact that the production of such materials requires a large amount of energy [35]. Therefore, an alternative new type of sound absorbing composite panel could be a better option with regard to potential environmental impact. Until now, a few LCA research studies have been conducted on sound absorbing materials produced from recycled materials [36,37]. One of the few studies, conducted by [38], analysed the LCA of sound absorbing material derived from recycled material—chicken feathers. In the comparison of the results, they found that for this new type of sound absorbing material, Global Warming Potential (GWP) was 1.7 kgCO2 eq, and compared, for example, to the conventional material—mineral wool (27.33 kgCO2 eq [39])—its GWP was 16 times lower. These results present a perspective for the research and use of a new type of sound absorbing material. Despite the lack of research based on LCA, it is essential to investigate the potential environmental impact of newly developed materials, which will contribute to the expansion of knowledge about new materials, their potential impact on the environment, and the fight against climate change.
The composite acoustic samples considered were made from waste tyre textile fibre and three different binders—polyurethane resin (PU), polyvinyl acetate (PVA), and starch (POS). In total, 108 samples with different density and composition proportions of textile and binder were subjected to sound absorption applications. The aim of this study is to evaluate the acoustic performance and potential environmental impact of sound absorbing material made of waste tyre textile fibre composite with different binders.

2. Materials and Methods

In this section, the method of composite sound absorbing sample preparation will be described, as well as methods of acoustic and non-acoustic parameters, and life cycle assessment.

2.1. Method of Sample Preparation

Samples for determination of acoustic and non-acoustic parameters were prepared using waste textile fibre (WTTF) (Figure 1), which was obtained during the end-of-life tyre recycling process in the tyre recycling company in Lithuania, Gargždai town. During the recycling process, three main components were separated.
After the raw material was received from the recycling company, waste tyre textile fibre was first dried, to eliminate all the moisture accumulated during the storage time. The WTTF was dried at a temperature of 60 °C for 3 days. Depending on the level of purification of WTTF during recycling, it may have rubber residues. Rubber granules can make up from 10 to 70 wt% in WTTF. Using sieves, rubber and WTTF are being separated. Even after removing a large part of the rubber remains, rubber dust can be found, which makes up 10% of the total mass, and the particle size varies from 0.1 to 0.2 mm. The bulk density of WTTF is 40.1 ± 2.3 kg/m3.
In the second stage, composite sound absorbing samples were produced. For the preparation of the samples, waste tyre textile fibre and the binder are mixed together. For this study, three different binders were analysed: polyurethane resin with hardener (PU), polyvinyl acetate (PVA), and starch (POS). The mix proportions are presented in the Table 1. The samples were 29,9 mm in diameter and 40 mm thick; densities of prepared samples were 75, 100, 125, and 150 kg/m3. The binder content in the sample was 10, 30, and 50% of the total mass. The binder content was chosen according to the primary experiments. It was found that when binder content was less than 10 wt%, the particles did not bind and the sample disintegrated, while when binder content was over 50 wt%, the sample was too rigid. The chosen binders’ content showed apparent differences in sound absorption; therefore, conclusions could be drawn.
According to the established mix proportions and densities, samples were prepared (Figure 2). The required amount of WTTF was taken and put into the mixing container. After adding the binder, everything was thoroughly mixed for 2 min using the mixing tools.
The selected time period ensured that all binder was evenly distributed in the sample matrix. Subsequently, the mixed mass was transferred to a mould lined with parchment paper, which ensured that the sample would not adhere to the walls. The inner diameter of the mould was 29.9 mm. The samples were left to dry in a dryer at 40 °C temperature, for 24 to 48 h, depending on the density of the sample.
When the drying process was complete, samples were taken out from the mould and ready to be tested for acoustic and non-acoustic parameters. For each type of sample, 3 specimens were prepared; in total, 108 specimens were subjected to testing. This is the lowest number that can be used for the determination of uncertainty.
In order to analyse the microstructure of the material, JEOL JSM-7600F (Tokyo, Japan) scanning electron microscope was used. The microscope resolution was 1.5 nm, with available magnification from 25 to 1,000,000 times; the voltage for the determination of microstructure was 4.0 kV and the specimens’ surfaces were covered with gold.

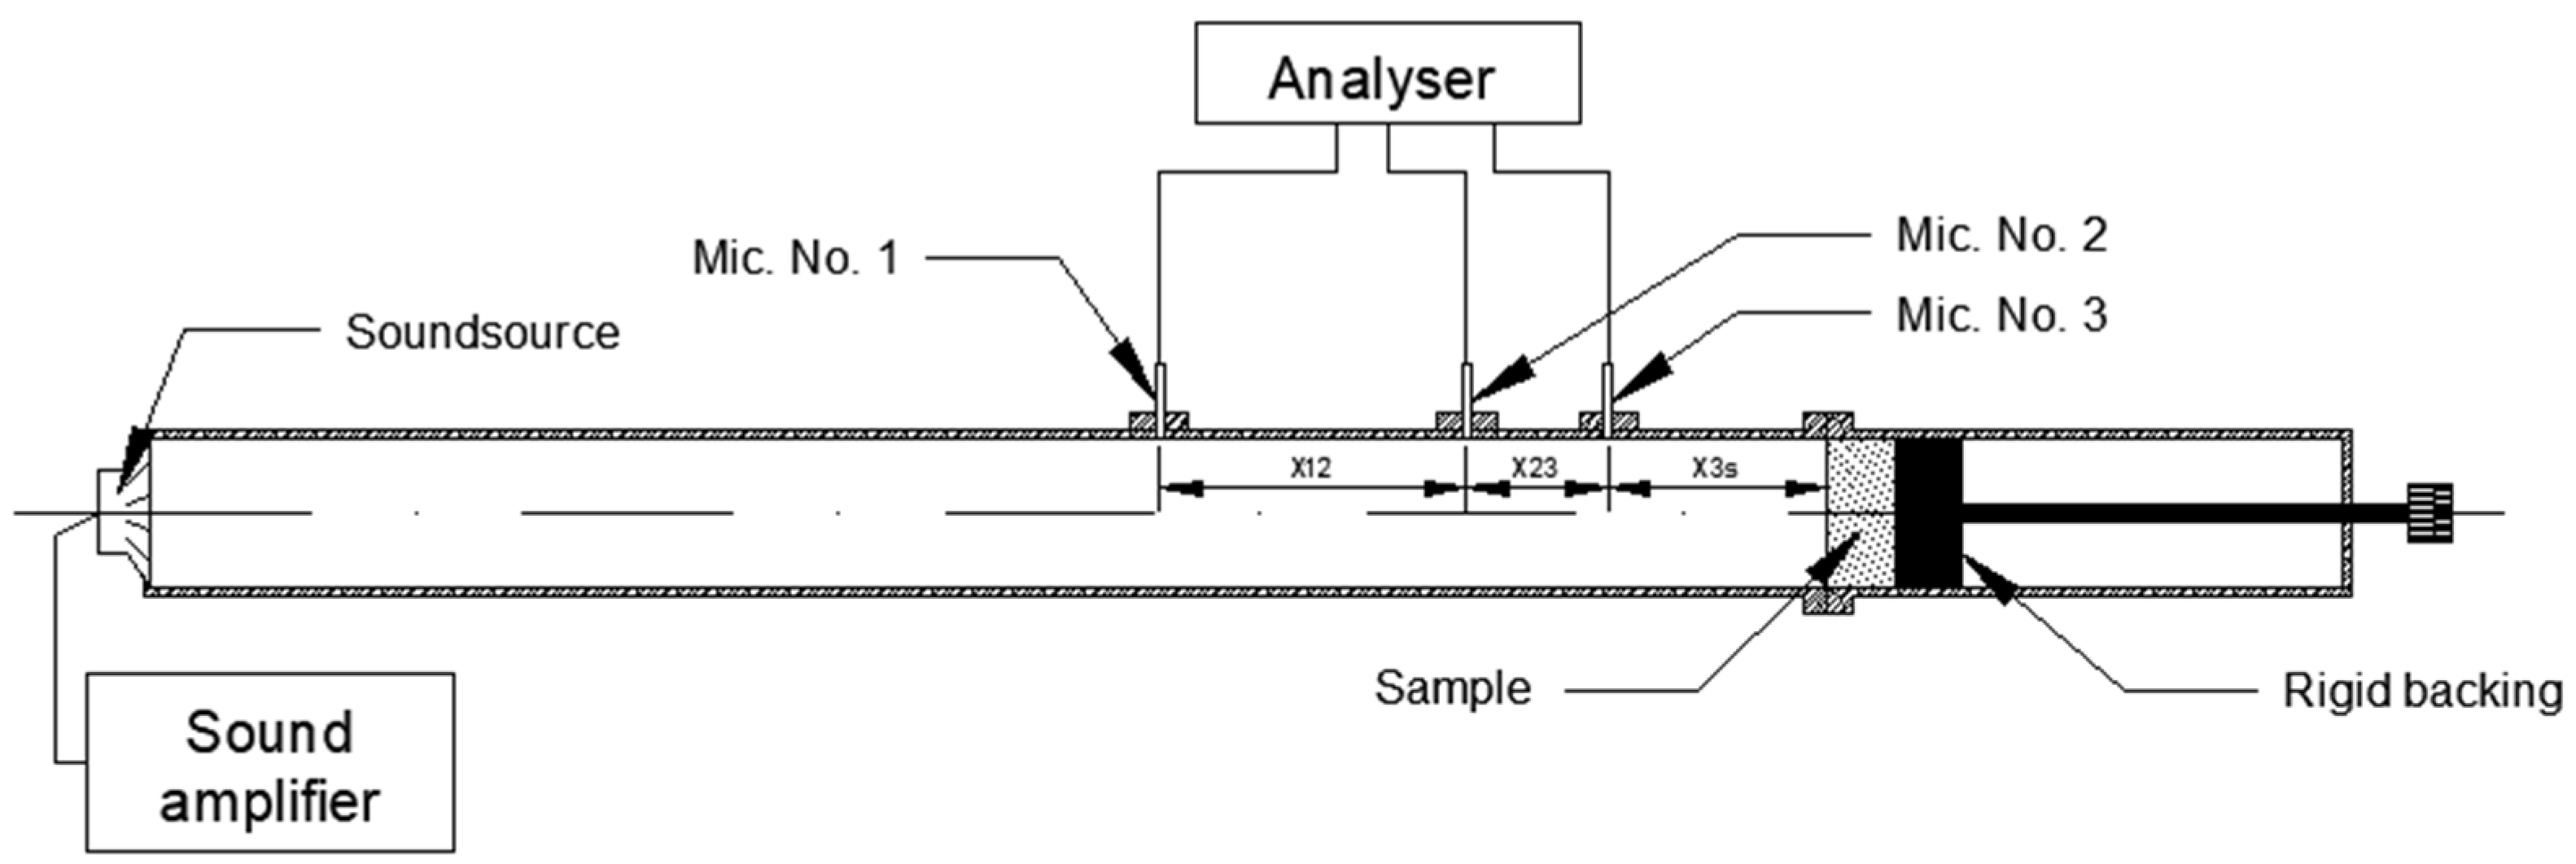
2.2. Method of the Determination of Normal Incidence Sound Absorption Coefficient

The method of determination of the sound absorption coefficient in impedance tubes is based on the standard method, described in the ISO 10534-2 standard, the two-microphone technique [40]. The impedance tube used for this study was 30 mm in diameter, and all samples were rigidly backed, to prevent transmission. In Figure 3 is presented the principal scheme of the impedance tube. No. 1, No. 2, and No. 3 represent the microphones used for the determination of sound pressure. With microphones No. 1 and No. 3, the low-frequency sound absorption coefficient was determined (160–1000 Hz), and with microphones No. 2 and No. 3, the high-frequency sound absorption coefficient was determined (1000–5000 Hz). The distance between microphones No. 1 and No. 2 was x12 = 100 mm, the distance between microphones No. 2 and No. 3 was x23 = 20 mm, the distance from microphone No. 3 to the sample was x3S = 60 mm. Such distances between microphones are due to wavelength characteristics, meaning that lower-frequency sound waves have long wavelength, and therefore, the distance between the microphones should be long enough to register the data, while high frequency sound waves have short wavelength, and the distance between microphones should be shorter. The results of the sound absorption coefficient are presented in the 1/3 octave band, and the number of averages was set to 50. Measurements were carried out using the ‘AcoustiTube’ impedance tube manufactured by AED (Dresden, Germany). The equipment complies with first-class accuracy equipment. Measurement data were processed using the software ‘AcoustiStudio’ (version 2.2.1) designed for the impedance tube used in this study.
As for the method, in the first step, the transfer function is determined. The transfer functions H13 and H23 (Equation (1)) [40] are obtained as the ratio of pressures recorded by microphones No. 1 and No. 2 (frequency range 160–1000 Hz), and microphones No. 2 and No. 3 (1000–5000 Hz):
H 13 = p 3 ( f ) p 1 ( f ) , H 23 = p 3 ( f ) p 2 ( f )
H I 160 1000 H z = p 3 I p 1 I = e j k 0 x 12 + x 23 ,   H I ( 1000 5000 H z ) = p 3 I p 2 I = e j k 0 x 23
H R 160 1000 H z = p 3 R p 1 R = e j k 0 x 12 + x 23 , H R ( 1000 5000 H z ) = p 3 R p 2 R = e j k 0 x 23
Then, the sound reflection coefficient is determined from Equations (2) and (3) [40]:
R 160 1000 H z = H 13 H I 160 1000 H z H R 160 1000 H z H 13 e 2 j k 0 X 12 + X 23 + X 3 s , R ( 1000 5000 H z ) = H 23 H I ( 1000 5000 H z ) H R ( 1000 5000 H z ) H 23 e 2 j k 0 ( X 23 + X 3 s )
where: p1, p2, p3—pressure recorded by the microphones, Pa; HI—incident wave transfer function; HR—reflected wave transfer function; x12—distance between microphones No. 1 and No. 2, mm; x23—distance between microphones No. 2 and No. 3, mm; x3S—distance between microphone No. 3 and the sample, mm; R—sound reflection coefficient; j—complex number; k0—wave number.
When the sound reflection coefficient is determined, by Equation (5) [40], the sound absorption coefficient can be determined:
α = 1 R 2
where: R—sound reflection coefficient.
The sound absorption coefficient is dimensionless and ranges from 0 to 1, where 1 represents perfect sound absorption (100% of energy absorbed) and 0 represents reflection, meaning that there is no sound wave absorption.

2.3. Method of Determination of Airflow Resistivity

The airflow resistivity of the materials is determined according to the ISO 9053-1 standard [41]. The measurement implies a direct method, the difference in pressure before and after the sample. The equipment consists of the tube, air compressor, data display device, manometer, and air velocity meter (Figure 4). The tube is designed so that the air flow in the tube is close to laminar air flow.
The sample is placed in a sample holder and then the holder is placed into the tube. The sample holder has more than 50% of the open cavity area and the diameter of the cavities is greater than 3 mm. The measurement unit was sealed with clamps and grease, to prevent air leakage [41].
In this study, a differential manometer was used, which directly provided the pressure difference. Using an air flow velocity meter, the velocity in the tube was determined. According to Equation (6) [41], the air resistance of the material was calculated:
R = p q · v
where: q—air flow rate passing through the sample, m3/s.
Subsequently, the specific air resistance RS was calculated. Specific air resistance is the product of air resistance and cross-sectional area of the measured sample (Equation (7)) [41]:
R s = R · A
where: A—cross-sectional area of the sample, m2.
Finally, the static airflow resistivity was calculated (Equation (8)) [41]:
σ = R S d
where: d—thickness of the sample, m.

2.4. Life Cycle Assessment Methodology

The life cycle assessment (LCA) methodology is based on ISO 14040 and ISO 14044 standards [42,43]. The four main steps are the base of the LCA: goal and scope of work definition, creation of functional unit and system boundaries; life cycle inventory; impact assessment; interpretation of the results [42].
  • Goal and Scope
According to the ISO 14040 and ISO 14044 standards, a life cycle assessment of the newly developed composite sound absorbing panels was performed [42,43]. Waste tyre textile fibre from tyres and three different binders—polyurethane resin with hardener (PU), polyvinyl acetate (PVA), and starch (POS)—were used for the production of composite panels. The main goal of LCA is to evaluate and compare composite panels and the influence of binders used in their production on environmental components.
Due to the lack of information regarding the installation of panels indoors, their maintenance and end-of-life stages, due to the novelty of the product and being in the prototyping stage, the LCA assessment method from gate-to-gate was proposed.
The purpose of such composite sound absorbing panels is to improve sound quality indoors, i.e., reduction in reverberation time (RT60) directly related to speech transmission index (STI) (as RT60 increases, STI decreases or vice versa). Also, reducing the sound pressure level in the room is another goal.
  • Functional Unit
The functional unit (FU) is one of the main parameters in life cycle assessment [42]. It provides a link to normalise other product data. Without a functional unit, a reasonable comparison of different products is not possible. The quantitative definition of a product’s functional unit should, whenever possible, be based on the product’s technical parameters (e.g., density, thickness, mechanical properties, thermal properties, acoustic properties, etc.) [38].
When performing LCA, a problem arises with acoustic materials, since no standard functional unit has yet been introduced to evaluate such materials, and so far, few studies have been conducted with such materials. To perform LCA, it is important to carry out the assessment by including the acoustic parameters of these materials, in the case of this study, the sound absorption coefficient, expressed through the noise reduction coefficient (NRC).
Based on the previously mentioned aspects, in order to include the technical parameters of the material, a combined functional unit will be applied, which will cover the surface area of the composite sound absorbing material (1 m2) and the sound absorption coefficient of the material expressed through the NRC will be evaluated [38]. In the first part of the FU, the acoustic properties of the material will be defined. In Equation (9) [38], S is the area of the composite sound absorbing panel (m2); A is the sound absorption in the Sabin metric expression (this unit will be equal to 1 in the case of this study, since only 1 m2 of sound absorbing panels is evaluated); and NRC is the level of noise reduction:
S = A N R C
The NRC value is calculated using the sound absorption coefficients of the material at 250, 500, 1000, and 2000 Hz, with their arithmetic mean as follows:
N R C = f 250 H z + f 500 H z + f 1000 H z + f 2000 H z 4
where: f250 Hz, f500 Hz, f1000 Hz, f2000 Hz—sound absorption coefficient at these frequencies.
For uniform performance, the mass of each composite panel is calculated using Equation (11) [38], where M is the mass (kg), ρ is the density (kg/m3), d is the thickness (m), and S is the surface area (m2) [38]:
M = ρ · S · d
Therefore, the final FU equation that will estimate both parameters will be Equation (12) [38]:
M = ρ · d · 1 N R C
where: ρ—density of the tested composite sound absorbing panel, kg/m3; d—plate thickness, m; NRC—noise reduction coefficient.
The value M (for 1 m2 of the panel) will represent the equivalent mass of the material, which will indicate how much material is needed to achieve a certain noise reduction value. This is done because the actual technical parameters of the material are not represented solely through the area of the material. The results of the FU are presented in the Section 3.
  • System Boundaries and Life Cycle Inventory
The system boundaries are the boundaries that define the limits of the LCA assessment [42]. This means that whatever processes take place outside the system, they are not evaluated due to possible uncertainties. The boundaries of the LCA framework are presented in Figure 5.
The boundaries of this research include the following processes: recycling of end-of-life tyres; transportation of waste tyre textile fibre to the place of production of composite panels; drying of waste tyre textile fibre; production of composite sound absorbing panels; drying of composite sound absorbing panels. Energy sources (electricity), water resources, and used binders and rubber waste are also evaluated.
Processes that are not evaluated include the following: collection and storage of end-of-life tyres in large-scale waste collection sites—it is unknown where these tyres end up in these sites; transportation of end-of-life tyres to a recycling plant—unknown locations and distances from which end-of-life tyres travel, and composite sound absorbing panels, whose further use, recycling, or disposal is unknown.
Life cycle inventory (LCI) involves the collection of data and the corresponding calculations to quantify the input and output results of the systems studied that have a direct relationship with the functional unit (FU).
Life cycle inventory (LCI) general data on materials, energy sources, etc., come from the Ecoinvent 3 v3.3 database. The inventory is presented in the results section.
  • Selected Impact Assessment Method
In this study, the SimaPro 9.5.0.1 numerical modeling program and the results evaluation method ReCiPe 2016 v1.1 with endpoint indicators were applied, during which the process infrastructure and long-term effects were not evaluated [44].
Evaluation and comparison of the newly developed composite sound absorbing panels was carried out according to endpoint indicators, which include damage to human health, damage to ecosystems, and damage to resources. These are the three main evaluation indicators that make up the overall potential impact of the product on environmental components. A brief explanation of each indicator’s characterisation factor is provided [44]:
  • Damage to human health, expressed as the number of years of life lost and years of life with disability. These values are combined as Disability-Adjusted Life Years (DALYs), an index used by the World Bank and the World Health Organisation. The unit of measurement is years.
  • Damage to ecosystems, expressed as the loss of species in a certain area over a certain period of time. The unit of measurement is years.
  • Resource damage, expressed as excess future resource production costs over an indefinite period, subject to a 3% discount rate. The unit of measurement is 2013 USD. It should be kept in mind that the lack of fossil resources does not have constant mid-to-endpoint indicators, but factors that are individual for each material.
Based on the described methodology, life cycle assessment of the composite sound absorbing panels was carried out.

3. Results and Discussion

In this section, the main results and findings will be discussed—acoustic and non-acoustic parameters and potential environmental impact of the sound absorbing panels.

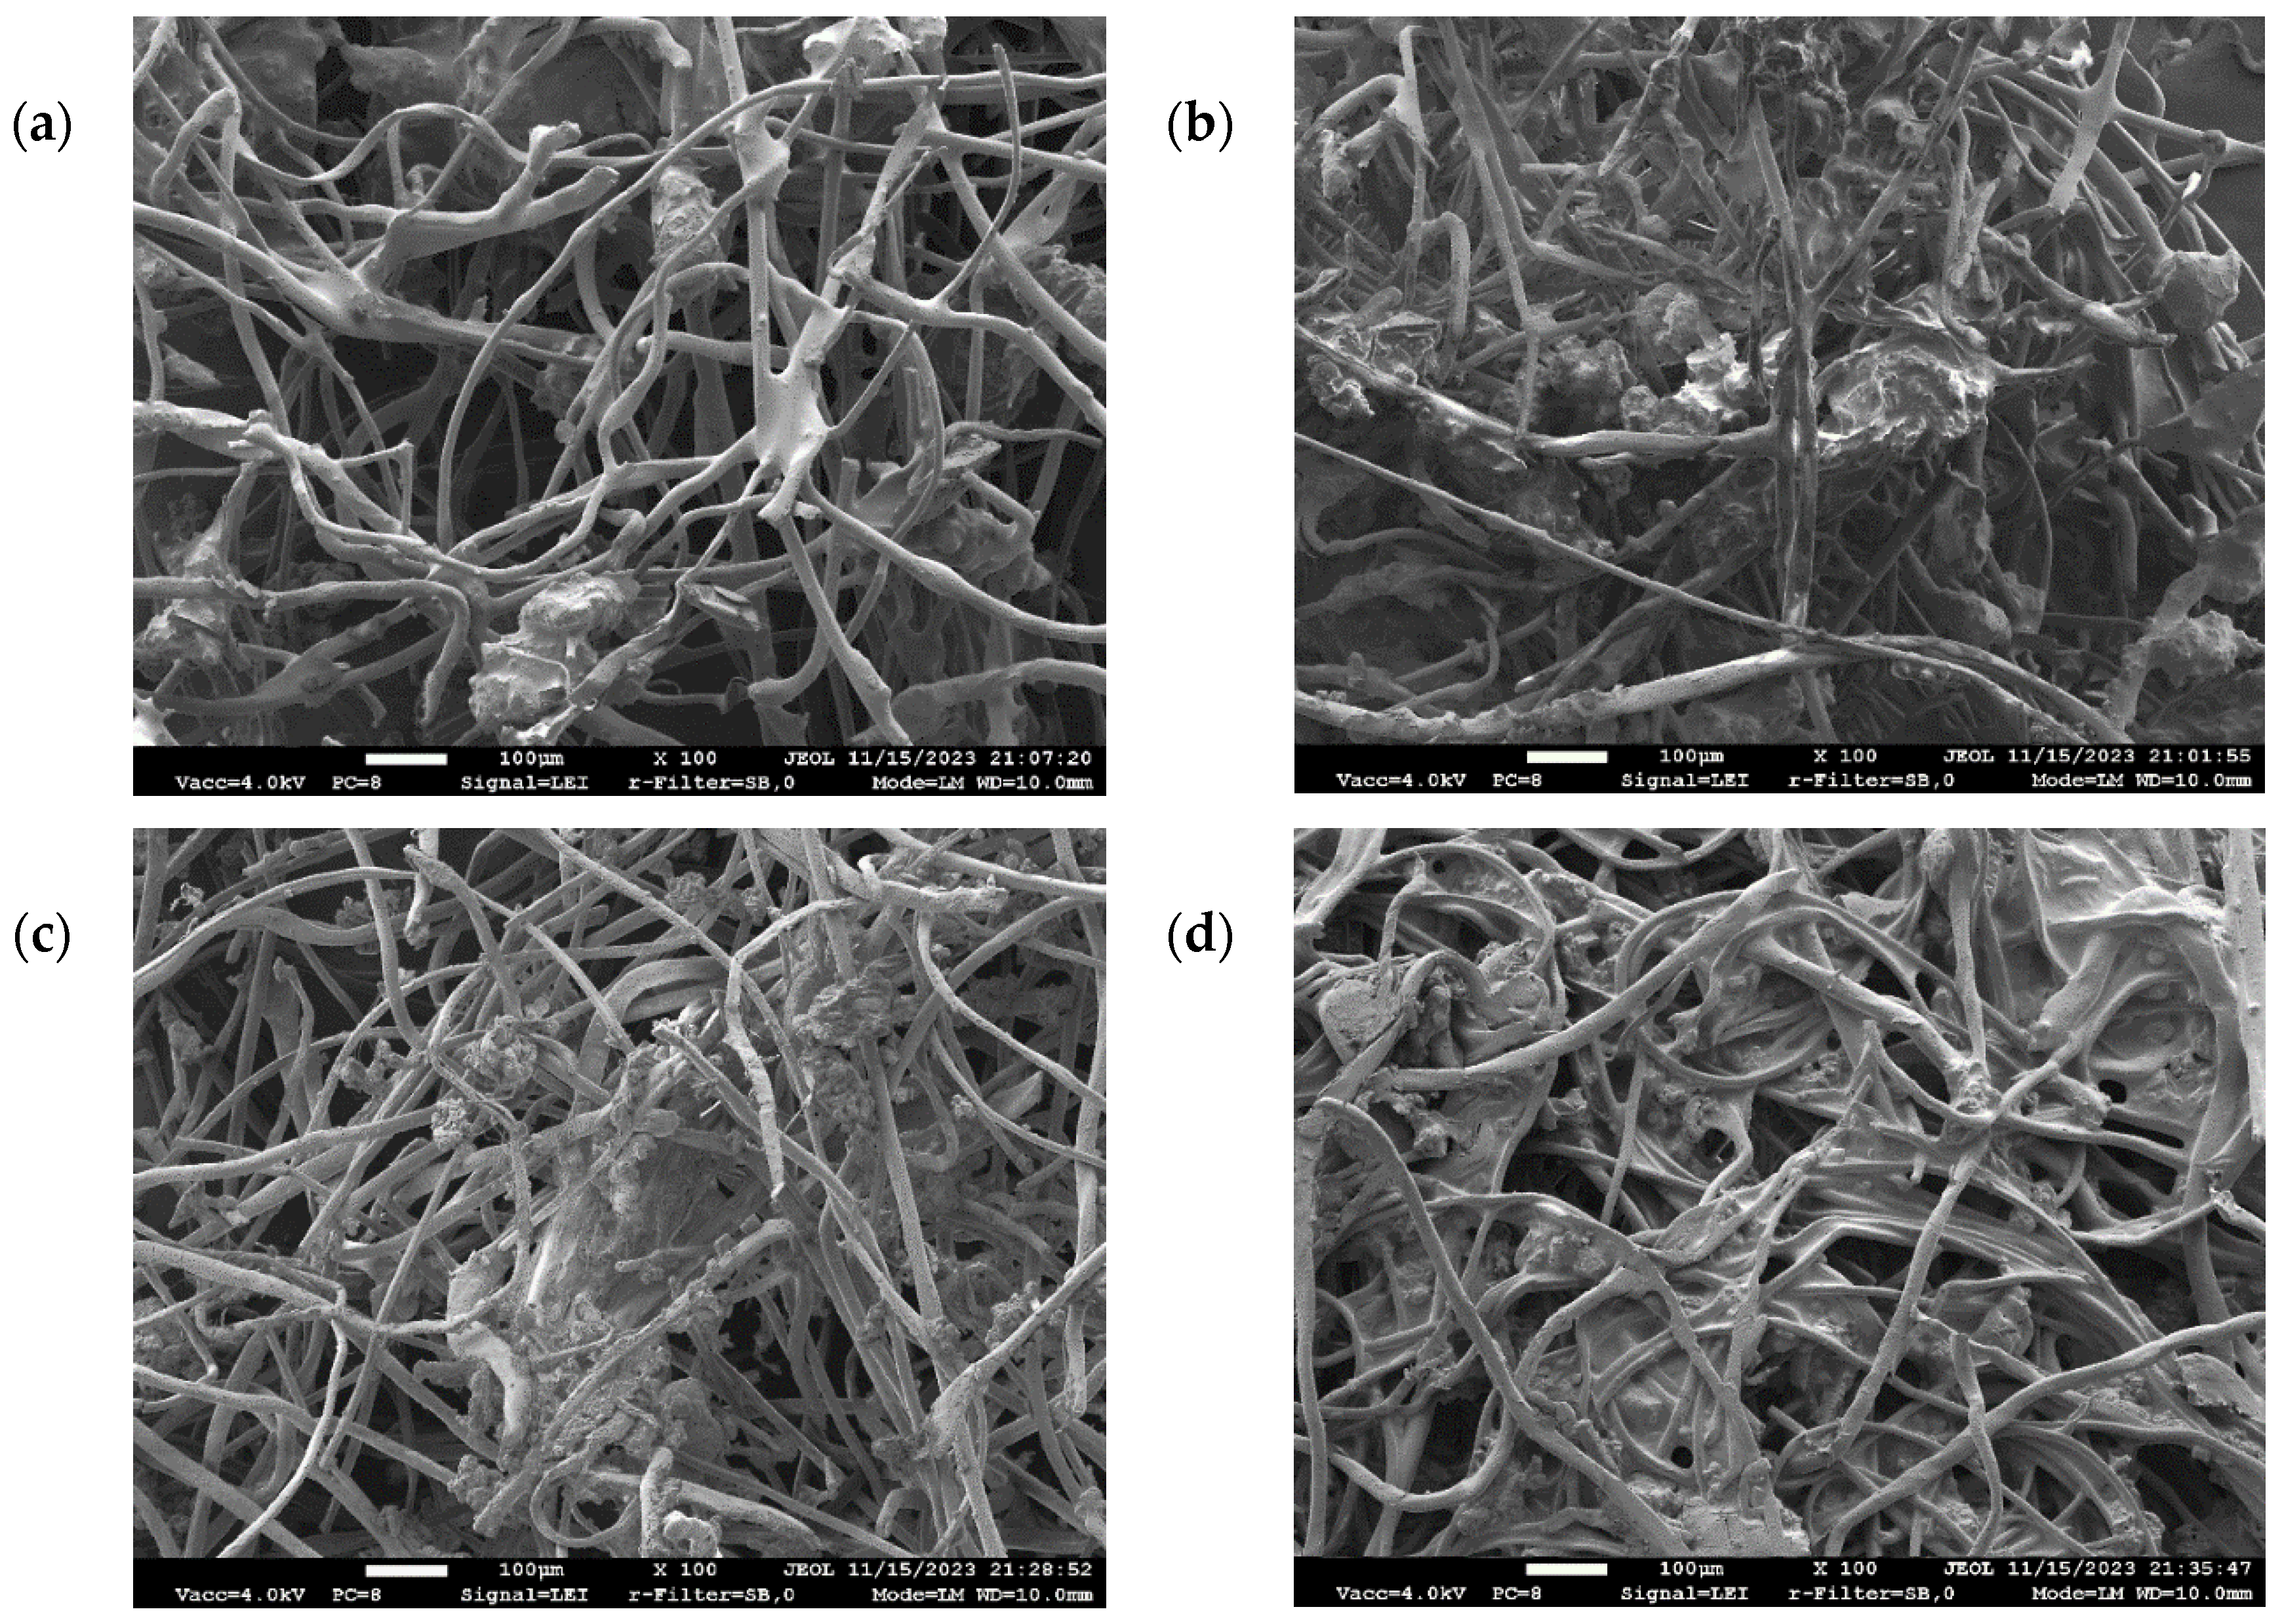
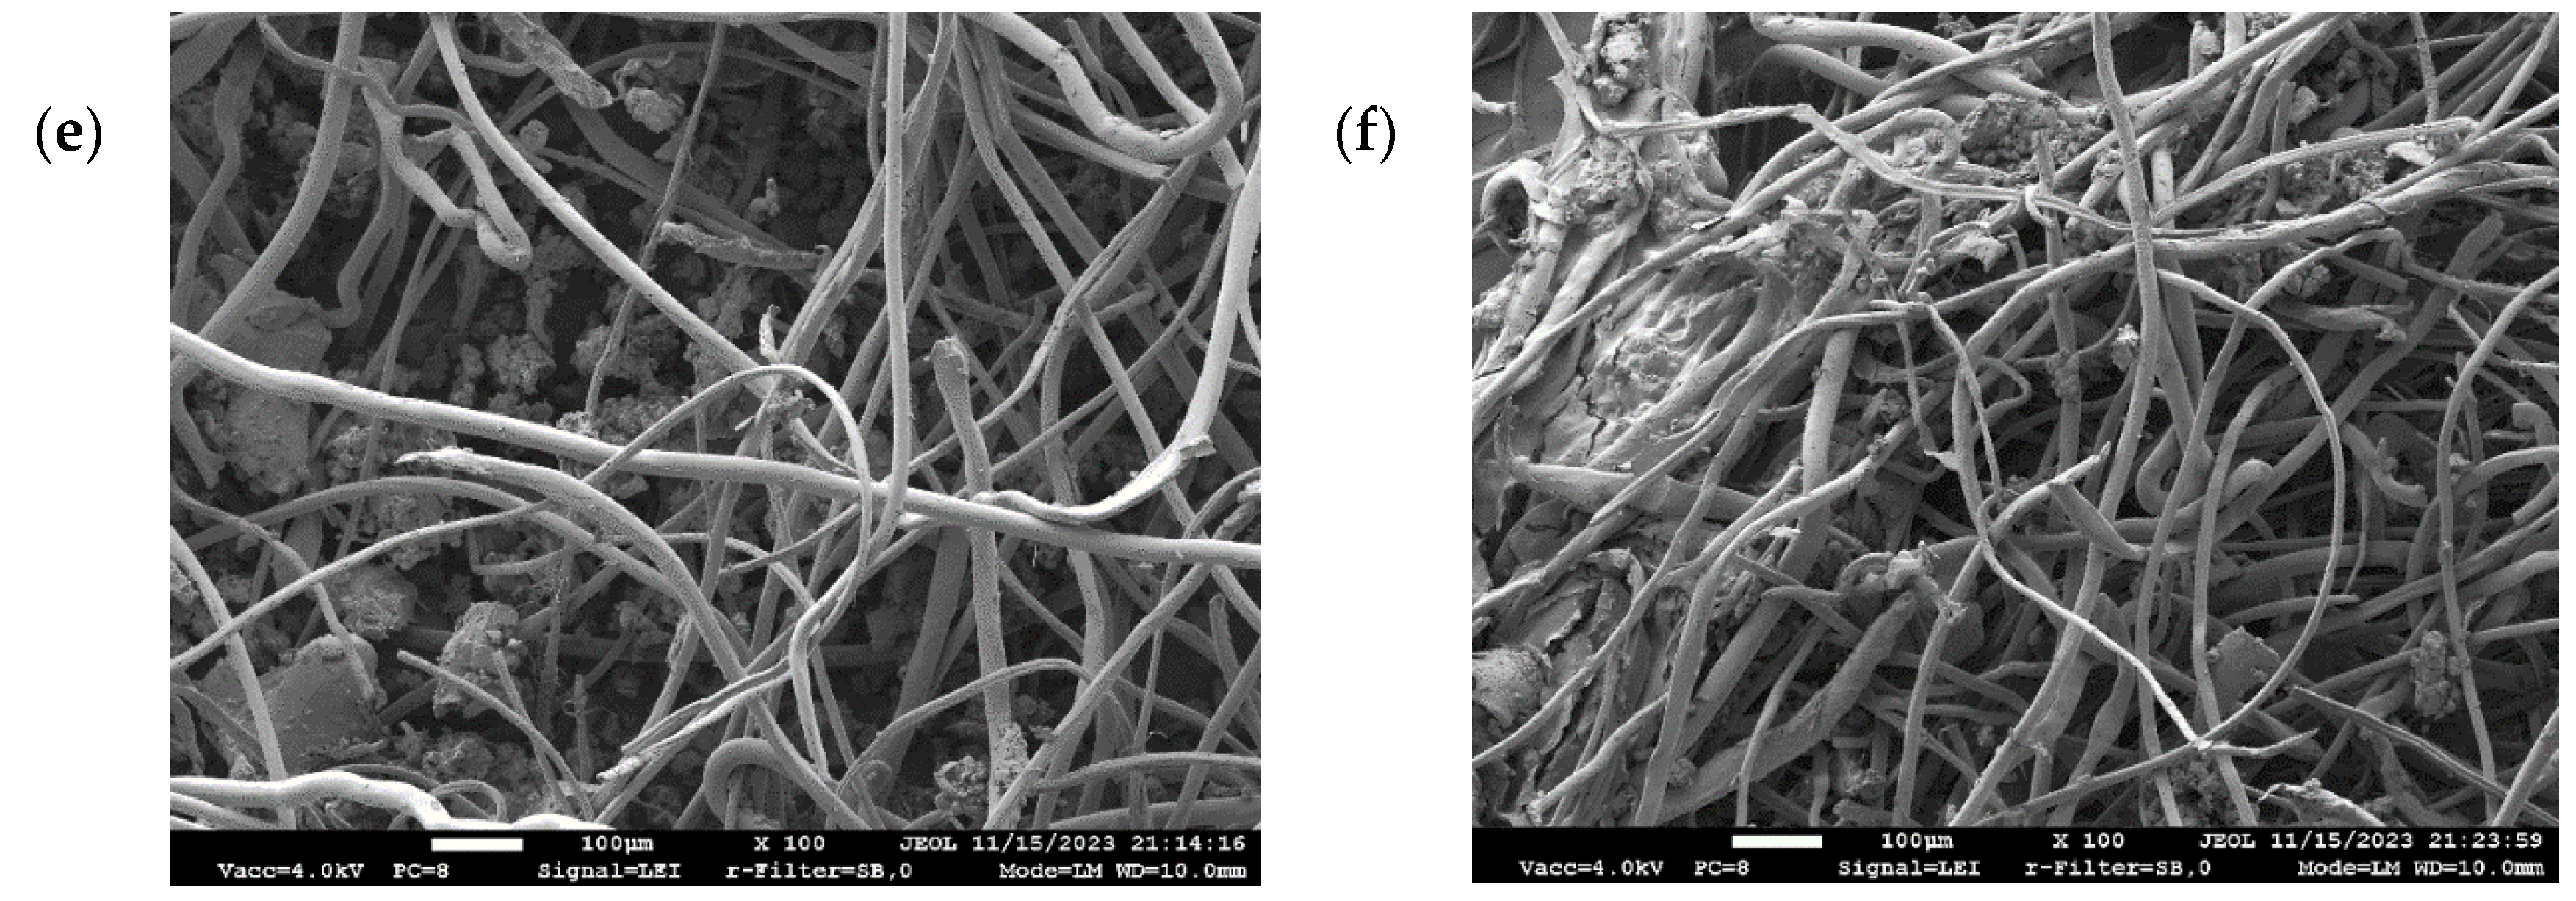
3.1. Airflow Resistivity and SEM Results of Composite Sound Absorbing Panels

Static airflow resistivity of all composite sound absorbing panels is presented in Figure 6. It is known that the airflow resistivity of the material depends on the density, thickness, and amount of binder used for sample preparation. The airflow resistivity has a direct dependence on the acoustic parameters of the material.
According to the results presented, we can see that as the samples’ density increased, airflow resistivity increased as well. Such a phenomenon can be justified as the density increases. It is more difficult for air to enter the composite material; therefore, airflow resistivity increases. Resistance occurs due to the fact that when the density of the sample increases, the fibre content in the sample also increases, which means that a lower porosity is created [45].
Moreover, another phenomenon was observed when different binders are used, that is, airflow resistivity increases, i.e., PU → PVA → POS. This could be explained by the fact that different binders create different porosity/cavities in the sample [46]. According to Figure 7, we can see the difference. In Figure 7a, we can see that fibres are attached to each other in strong bonds, and fibres are covered by the PU binder. Such a condition creates a high amount of open porosity/cavities. If we look to Figure 7c,e, we can see that the PVA and POS binders fill more open cavities, creating a film-like structure, meaning that it will be harder for air to get inside the material.
Comparing Figure 7b,d,f, we can see that increased binder content increases surface coverage, thus increasing airflow resistivity. When 50 wt% binder is found in the composite, it not only fills the pores of the rubber agglomerates, but it also covers the surface of the rubber agglomerates, and it also partially covers the fibres and the spaces between them. The contact area between the fibre and the binding material increases significantly. POS samples (Figure 7f) can be observed. Biopolymers are less deposited on rubber conglomerates because of the specific properties of biopolymers (pH, viscosity, etc.).
According to Figure 7, we can determine the following measurements: WTTF fibre diameter—15 ÷ 30 μm, fibre length—800 ÷ 2000 μm. The diameter of the fibre is an important parameter of fibrous materials. It is known that when there are more finer fibres in the same volume unit than larger-diameter fibres, greater friction between the air particles and the surface of the material is created, so the energy of the sound wave is lost more efficiently [47,48].

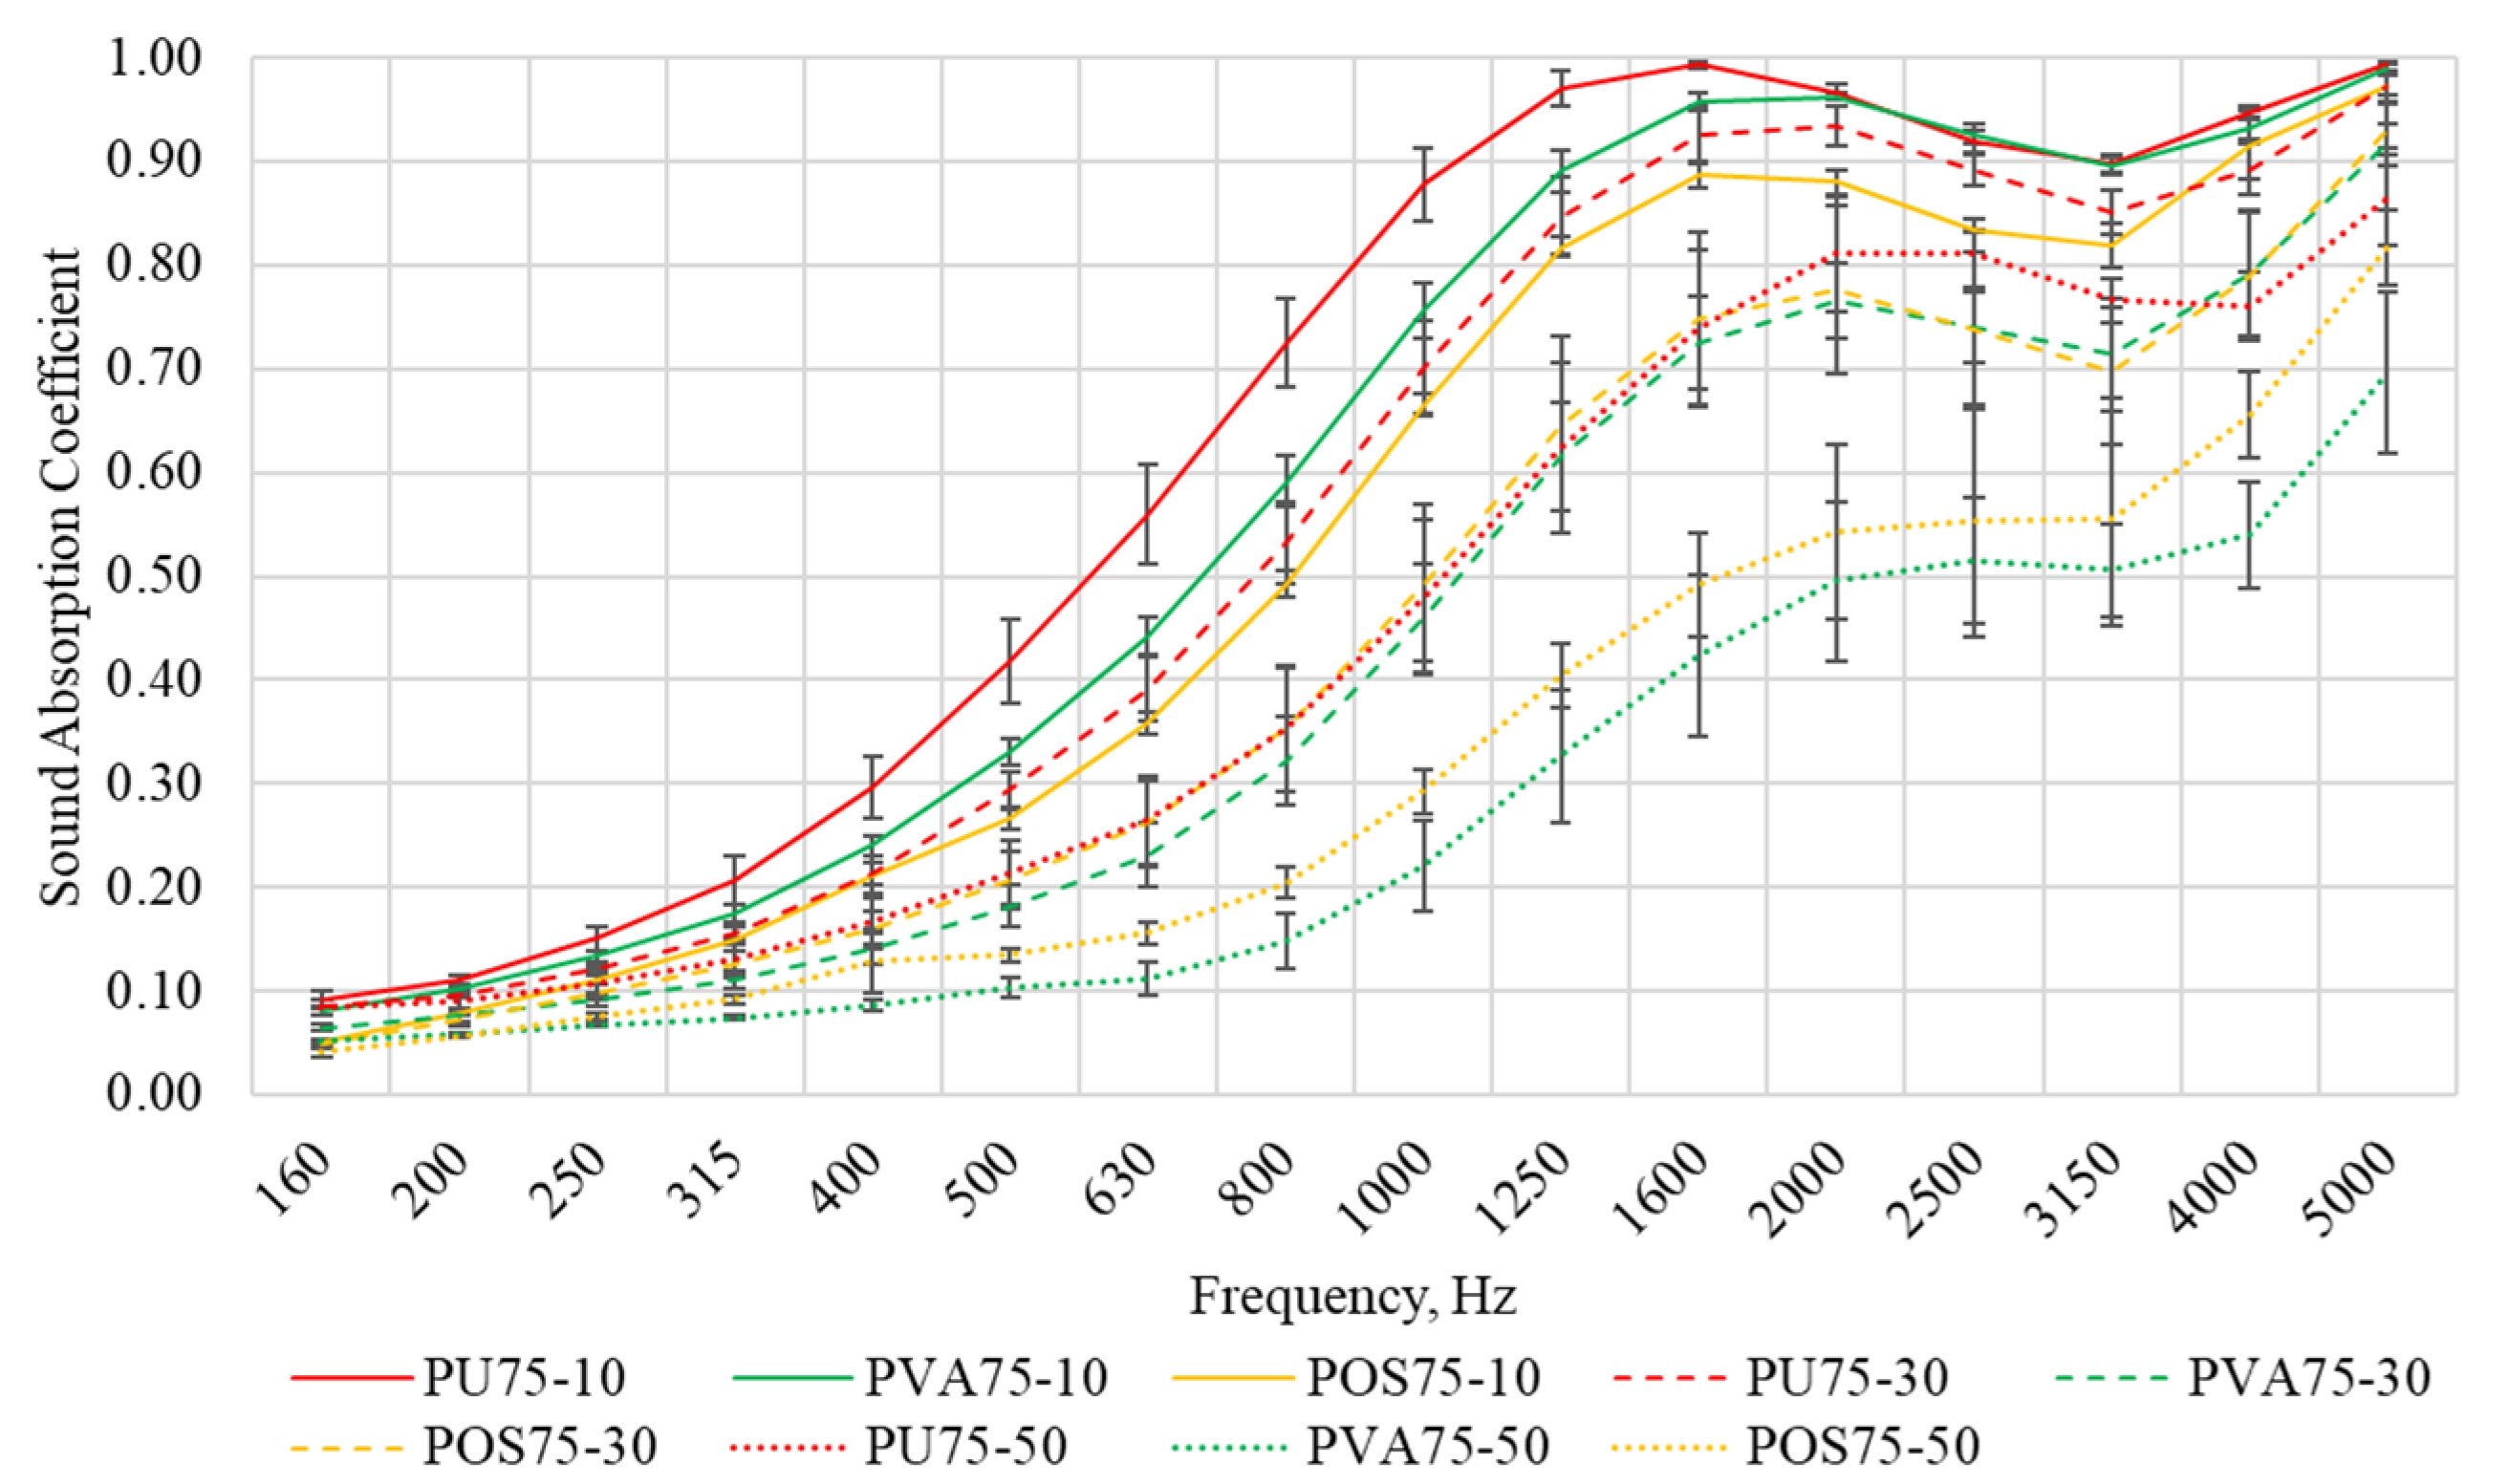
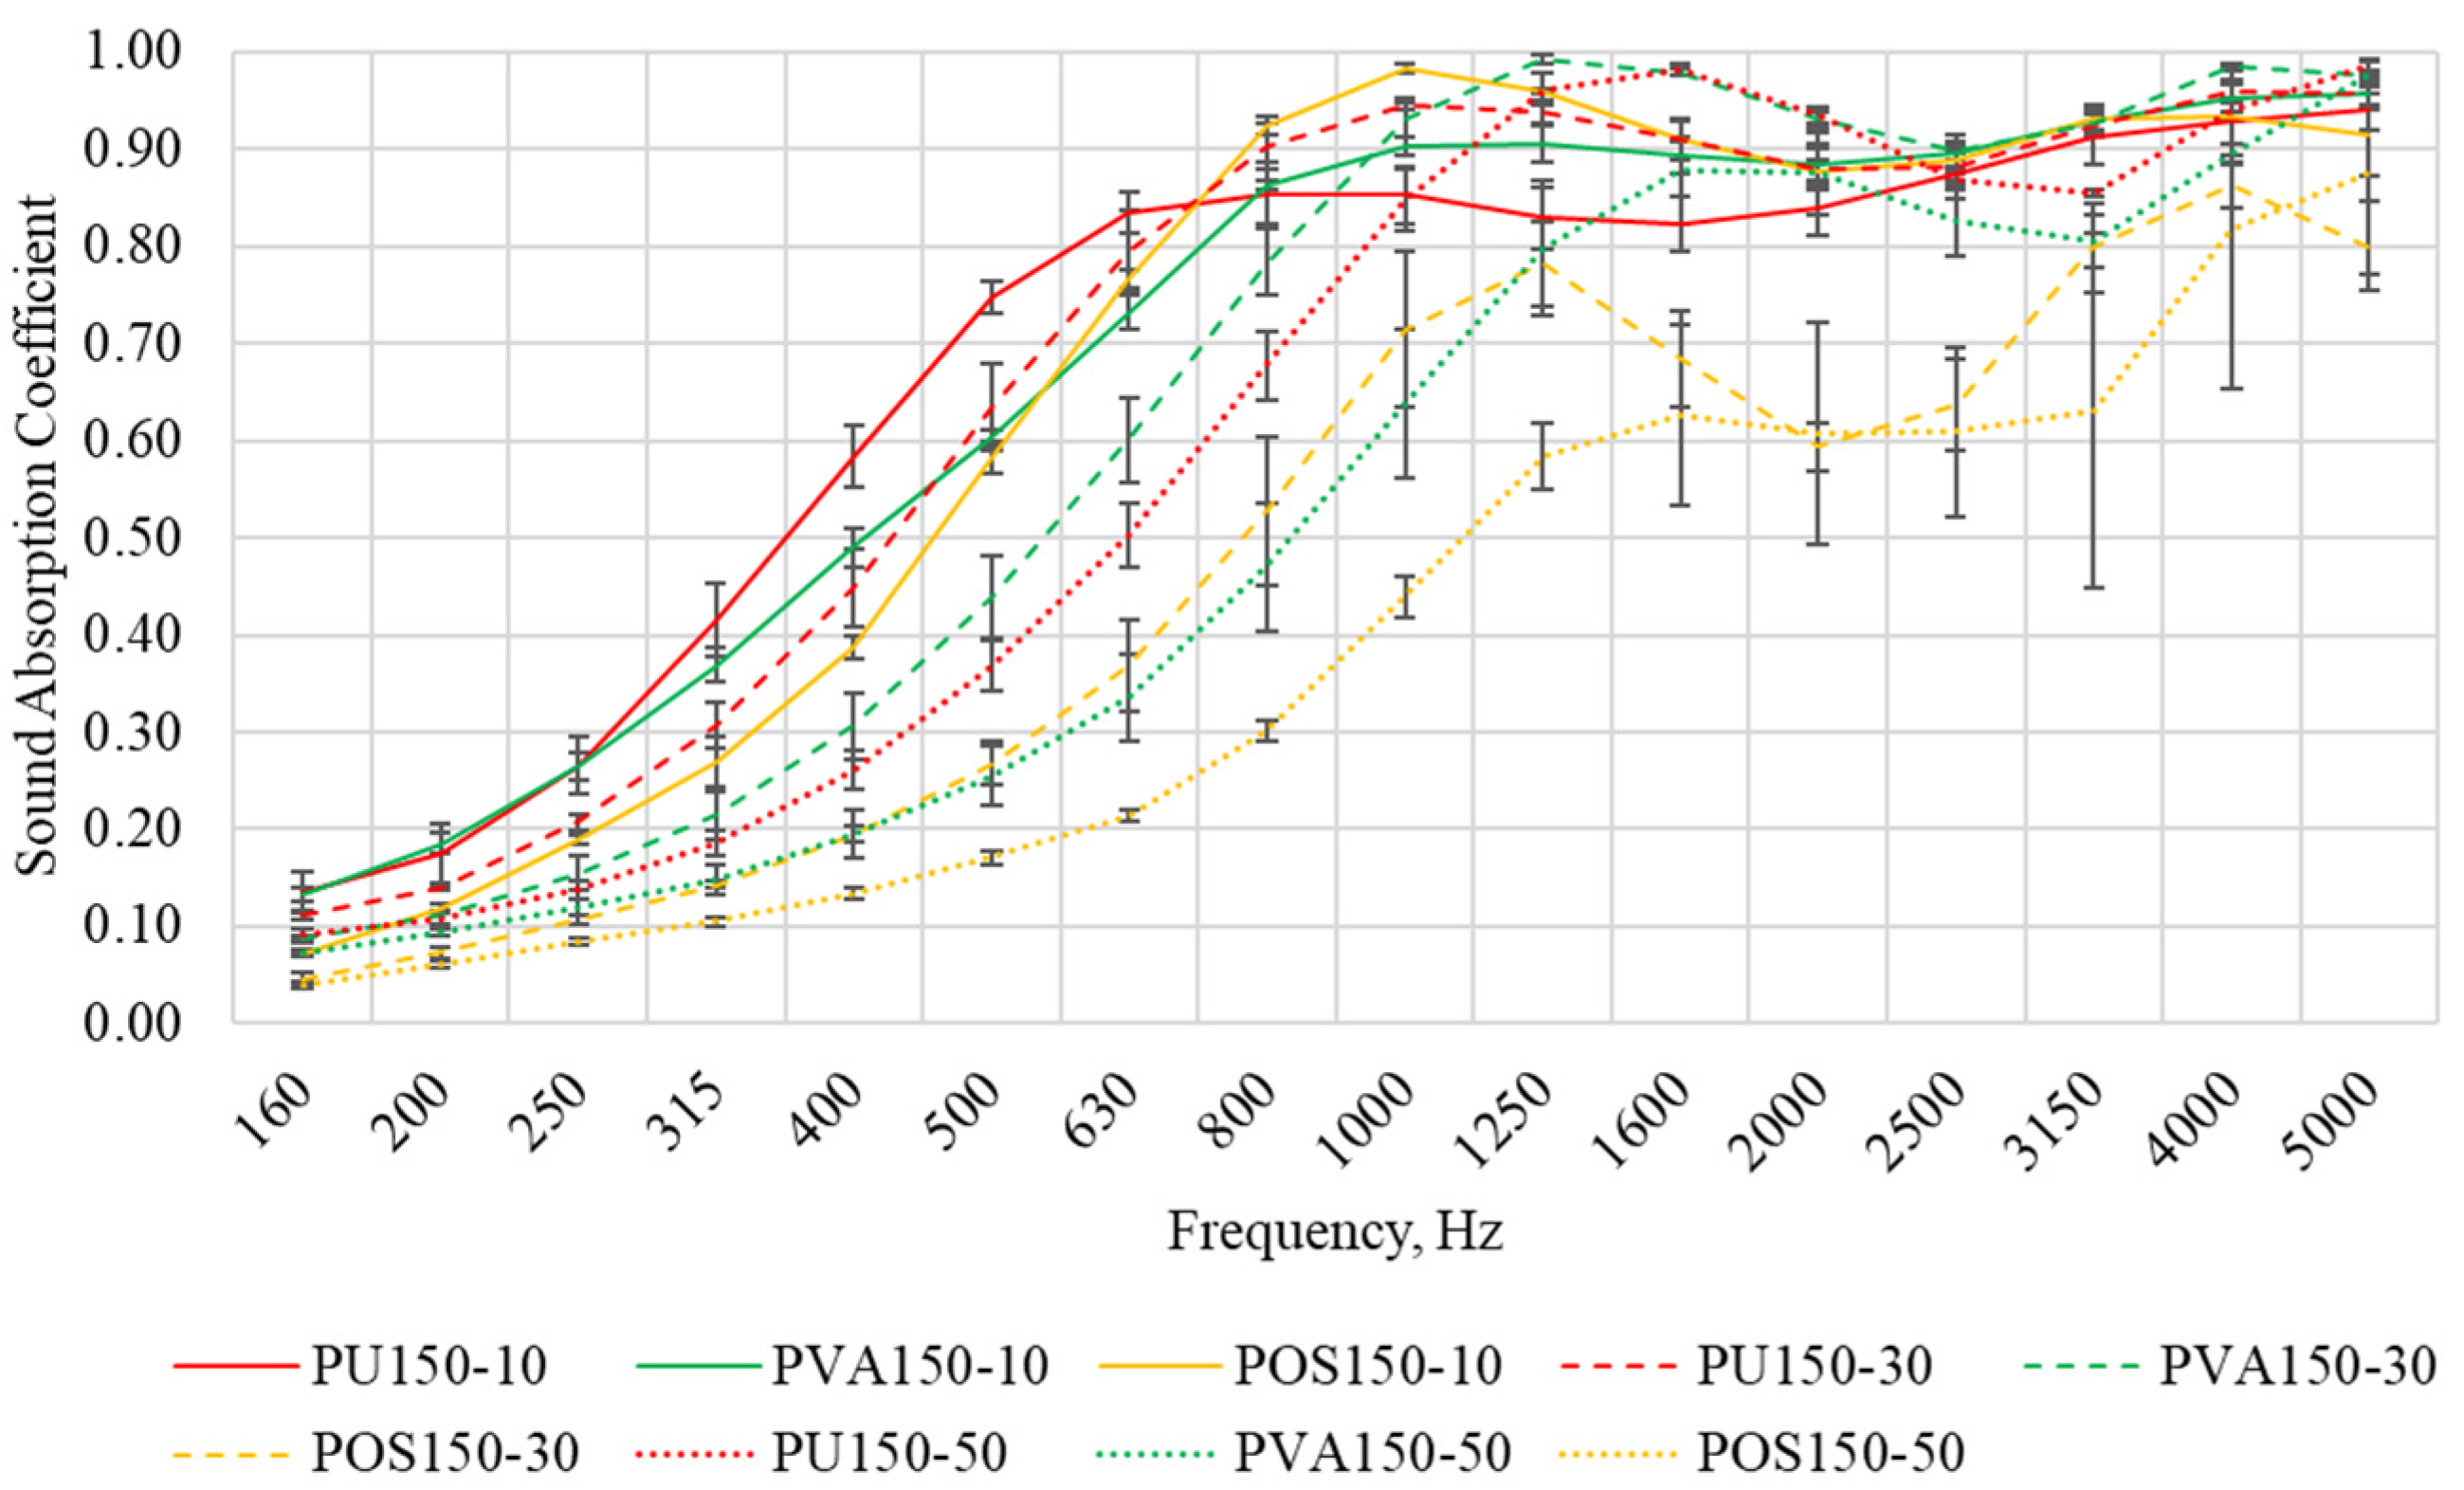
3.2. Characterisation of Acoustic Parameters of Composite Sound Absorbing Panels

The sound absorption capacity of the material depends on many factors, such as density, airflow resistivity, which is directly influenced by porosity, fibre and binder ratio, technological processes of sample preparation, type of raw material, compactibility, etc. [49,50,51,52]. Those parameters play an important role in the propagation of sound waves in the material, which predetermines sound energy losses.
In Figure 8 are presented sound absorption results of samples that are made using PU, PVA, and POS binders (binder content 10, 30, and 50 wt%) and the density of the samples was 75 kg/m3. According to the measurements results, it can be seen that the highest sound absorption results in the whole spectrum are observable by samples that contain 10 wt% of the binder. When the binder content increased to 30 wt% and then to 50 wt%, the sound absorption of the material decreased. That can be explained by the fact that the binder does not fill up all open cavities (when binder content is 10 wt%), leaving paths for sound wave to propagate in the sample, meaning that increased binder content in the sample creates a larger contact area, thus reducing porosity (referring to Figure 7a,b). That also can be explained by airflow resistivity results, where it is visible that an increasing amount of binder increases airflow resistivity, as well. The first peak of sound absorption is obtained when the thickness of the sample is at least 1/4 to 1/8 of sound wave wavelength [53].
It was noticed that the highest results depend on the binder type; therefore, composites using polyurethane (PU) were better than PVA and POS. This statement could be justified by the fact that the PU binder coats the fibre particles by binding them together but leaves open cavities, while PVA and POS coat the fibre and rubber particles, creating a film-like appearance, which leads to closed pores and reduced sound absorption (referring to Figure 7b,d,f).
In the low-frequency range (160–500 Hz), the sound absorption coefficient varied between 0.04 and 0.42. Such low results are seen due to low density. It is known that to increase sound absorption in the low-frequency range, the density should be increased. This is because more fibres could be found in the sample, meaning that a higher fibre density increases friction between the sound waves and thus increases the transformation of energy into thermal energy in the sample [45]. In the mid-frequency range (630–2000 Hz), the sound absorption coefficient varied between 0.11 and 0.99. The lower SAC limit is due to POS composites, which are ineffective for sound absorption due to clogged pores/cavities; however, looking into other samples, it can be seen that the SAC was from 0.23. The peak of the vast majority of samples was reached in the mid-frequency range. In the high-frequency range (2500–5000 Hz), sound absorption ranged from 0.52 to 0.99. In the high frequencies, sound wavelength is very short (0.07 to 0.13 m long); therefore, high absorption is visible. High-frequency waves transfer a low amount of energy; consequently, such density and porosity are sufficient to effectively absorb the sound wave.
In Figure 9 are presented sound absorption results of samples made using PU, PVA, and POS binders (binder content 10, 30, and 50 wt%), and the density of the samples was 100 kg/m3. It can be observed that with an increase in density, the sound absorption coefficient increased in the whole spectrum, and the peak shifted to the lower frequency. As discussed regarding previous results, we can see that the highest sound absorption results are visible when the sample has 10% by weight of binder in the composition. Although it was discussed previously that the difference can be observed when using different binders, in this case, some have very similar results. For instance, the sound absorption of the PVA100-30 and POS100-30 samples does not differ much; only at high frequencies do we see a difference in sound absorption. A similar situation is observed with the samples PU100-50 and PVA100-50 (especially low frequencies). Such a tendency presumably can be explained by the fact that in both cases, the binder covered the same part of the fibres, thus creating closed porosity.
According to the results, the highest sound absorption in low frequencies is observed by sample PU100-10. SAC varied between 0.09 and 0.53, while, for example, the PVA100-10 results ranged from 0.09 to 0.44, and the lowest SAC results were of the POS100-10 sample. The highest result in the low frequencies reached only 0.35. The emphasis is on low frequencies more than others because they are more difficult to mitigate due to the large amount of energy it transfers. Since the purpose of such panels is mainly for buildings and STI, knowing that human speech is predominantly in the range of approx. 400 Hz [54], this is the reason why lower frequencies are important. Connecting these results to the airflow resistivity results, we can see that as the density increased, the airflow resistivity increased, meaning that the tested materials were prone to higher sound absorption.
In Figure 10 are presented sound absorption results of samples that are made using PU, PVA, and POS binders (binder content 10, 30, and 50 wt%) and the density of the samples was 125 kg/m3. Comparing the results obtained with the previous results, it can be seen that sound absorption increased in the lower-frequency range. Such a phenomenon can be explained by the fact that the density of the material increased and the sound absorption increased at lower frequencies, due to the increased airflow resistivity. Also, it is worth mentioning that, in all cases, SAC increased in whole spectrum due to the increased amount of fibres in the sample. As we can see, the lowest sound absorption is visible in samples with 50 wt% of binder, and the lowest of all was starch composites (POS125-50).
However, the peak sound absorption of the samples was different; PU125-10, PVA125-10, POS125-10, and POS125-30 were at 1250 Hz, PU125-30, PVA125-30, PU125-50—1600 Hz, and lastly, PVA125-50 and POS125-50—2000 Hz. The clear peak shift tendency is not clearly visible. This may be explained by the fact that the compression ratio of the sample was insufficient to move peak absorption to lower frequencies [55]. The highest overall sound absorption coefficient at lower frequencies was between 0.11 and 0.56. In the mid and high frequencies, sound absorption varied from 0.20 to 0.99. As in all previously reviewed samples, almost perfect sound absorption was reached.
In Figure 11 are presented sound absorption results of samples made using PU, PVA, and POS binders (binder content 10, 30, and 50 wt%) and the density of the samples was 150 kg/m3. According to the results obtained, 150 kg/m3 samples showed the highest sound absorption in the low-frequency range. Such results are observed because of the highest airflow resistivity obtained from the samples. At lower frequencies, the PU150-10 sample obtained SAC from 0.13 to 0.75, which was the highest result. In the mid-frequency range, the highest values of sound absorption were observed in the sample POS150-10, and they do not match the tendency observed previously, since the PVA samples had higher values. The sound absorption of the mentioned sample varied between 0.77 and 0.98. At high frequencies, we can see that the vast majority of samples had similar sound absorption; however, only POS150-30 and POS150-50 results were the lowest.
It can be observed that the peak shifted to much lower frequencies. The peaks of the samples were as follows: PU150-10—800 Hz; POS150-10 and PU150-30—1000 Hz; PVA150-10, PVA150-30, and POS150-30—1250 Hz; and PU150-50, PVA150-50, and POS150-50—1600 Hz. If the density of the material were to be increased further, we would see that the sound absorption peak value would decrease; however, the overall value in lower frequencies would increase.
Summarising all the results, we can see that the highest sound absorption was obtained by the composite samples, which were made using polyurethane resin with hardener (PU), and when the binder concentration was the lowest, that is, 10 wt%. As discussed, this is due to the binder not filling the cavities between the fibres and the rubber dust residues, meaning that porosity would remain. The lowest results from all measurements are mainly observed by the samples with 50% weight of binder, and in particular, the lowest results were found when starch (POS) was used.
The authors of [11], in their research, performed sound absorption measurements of natural fibre composite materials. At twice lower (20 mm) thickness, they obtained, in the low-frequency range at 500 Hz, a sound absorption coefficient of 0.39 (approx.), while in our case, it varied at that frequency between 0.42 and 0.75. Although, if they were to increase thickness, fibre diameter plays a big role, since the Kapok fibre diameter is 8–10 μm [56], while the WTTF is 15–30 μm. The peak sound absorption was obtained at 1600 Hz, whereas in our case, the peak was at lower frequencies. In the other part of their research, they tested different percentages of fibre-to-binding material ratio. At 50 wt% of fibre, the sound absorption coefficient in low frequencies at 500 Hz reached approx. 0.1; in the case of this study, it varied from 0.21 to 0.37 (PU composites). Such results indicate that there is potential for WTTF composites that can be used for sound absorption applications.
The other authors of [10] estimated the sound absorption capacity of recycled textile fibres (from fabrics). In their research, they used recycled denim and resin to prepare samples. By comparing these researchers’ results, when binder content was 10% by weight, at 500 Hz, the SAC was estimated to be 0.09, while in our case, it was more than 0.42. When increased to 30 wt% binder content, in our study, SAC was 3 to 6 times higher compared to them. Although the fibre used in the following researcher’s work was similar, the sound absorption capacity obtained was quite different. That probably depends on the sample preparation method.

3.3. Interpretation of the Results of the Life Cycle Assessment

  • Determination of the Functional Unit
As mentioned before, the FU of this study was defined. For the study, it was determined that when the density of the composite material is 75 and 150 kg/m3 (according to the sound absorption results), the NRC will be 0.68; with a density of 100 kg/m3, NRC = 0.65; and at a density of 125 kg/m3, NRC = 0.66. The calculated values of the functional unit are presented in Table 2.
  • Results of the Life Cycle Inventory
According to the system boundaries, an inventory was prepared which included five stages of production of the composite sound absorbing panels. Table 3 presents an inventory of input and output processes for 75, 100, 125, and 150 kg/m3 composite sound absorbing panels.
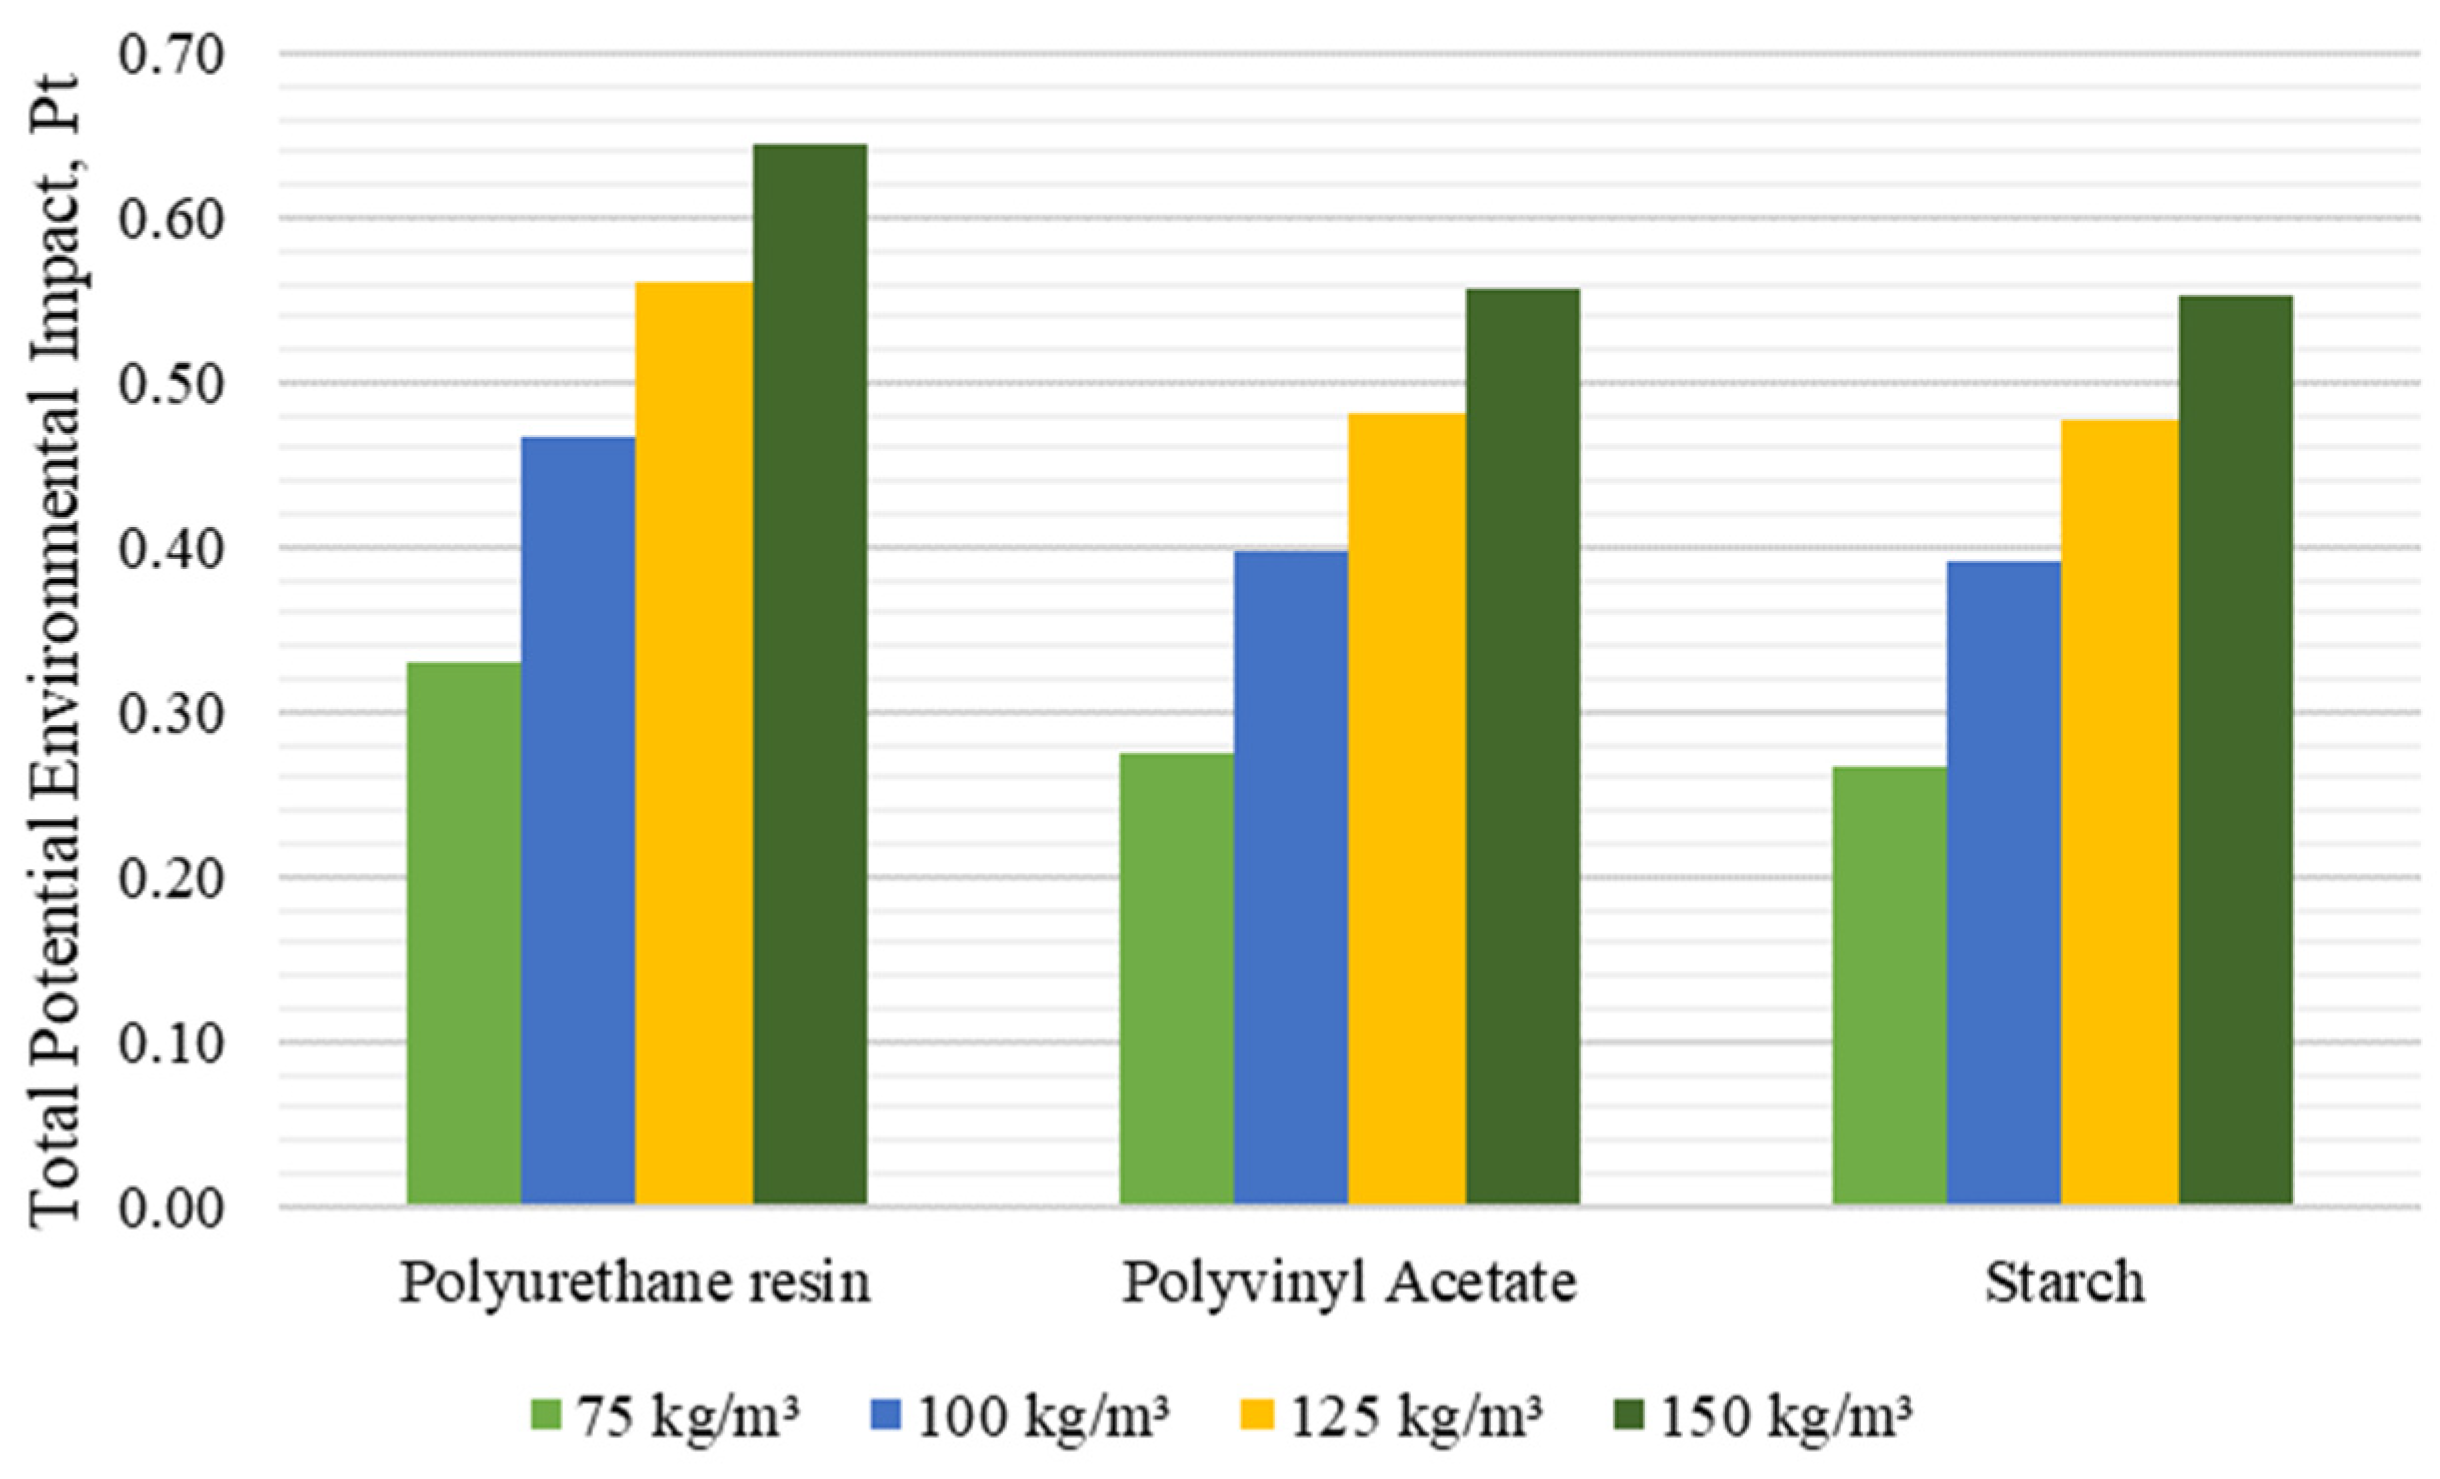
  • Life Cycle Impact Assessment and Results Interpretation
Based on the methodology described above, a life cycle assessment of composite sound absorbing panels made using three different binders, polyurethane resin with hardener (PU), polyvinyl acetate (PVA), and starch (POS), was carried out. The results are presented in the expression of points, Pt. This result means that, for example, the production of n kg of composite sound absorbing panels has a total weighted score of y Pt. This means that the potential impact of producing n kg of composite sound absorbing panel is equivalent to the potential impact of y people in the world on average per year.
According to the results presented (Figure 12), it is possible to observe a tendency that the use of polyurethane resin with hardener (PU) causes the greatest potential impact, compared to polyvinyl acetate (PVA) and starch (POS). Using PU as the binder of the composite material, the potential environmental impact ranges from 0.33 Pt to 0.64 Pt, while the PVA samples range from 0.27 Pt to 0.56 Pt, and the potential impact of starch as the binder ranges from 0.27 Pt to 0.55 Pt. It can be seen that as the density of all samples increases, the potential impact on the environment also increases as the consumption of raw materials increases. In summary, starch has the lowest effect as a binder, although the effect can be seen to be slightly higher when using PVA, so it can be said that they are equivalent. Polyurethane resins have the greatest potential impact on the environment.
The increase in total potential environmental impact can be explained by a few reasons (referring to the LCI). One of them is the increase in the use of raw material, which should be recycled and cleaned in advance. Another is the amount of energy used for the production of the panel, which increases with used raw material; more binder was required for the panel production, which increases total potential environmental impact. It should be taken into account that the production of binders also creates potential environmental impact; however, it depends on the materials, processes, etc.
Figure 13 shows the damage for the three endpoint categories during each manufacturing process. Examining the obtained results, we can see that during the production process, the greatest potential impact on the environment is during the drying and the rubber particle separation stage, when the number of points varies from 0.10 to 0.23 Pt.
Such values could be explained by the fact that during fibre cleaning, tyre rubber waste is formed, which has the greatest potential impact. Of the three endpoint indicators, the greatest potential impact is on human health. The high values of potential impact in this manufacturing process are due to zinc (II), which is used to increase the strength and stability of the tyre rubber [57]. When zinc (II) enters the environment, it threatens to contaminate water resources, which are directly related to humans and human health [58].
A second process that contributes to human health is carbon dioxide, which comes from fossil fuels. The release of this carbon dioxide is caused by the tyre rubber, which is trapped/embodied in this product [59]. The damage caused by climate warming to humans occurs in two ways—the increase in diseases and insufficient nutrition [60].
The second process that contributes to the potential environmental impact is the production of composite panels, where a PU binder is used (weighted score varies from 0.11 to 0.18 Pt). The values obtained by modelling can be explained by the fact that polyurethane resin is used in the production process, which is made from polyols. During the production of polyols, carbon dioxide is released into the environment, as well as methane gas, which contributes to climate change. During this production process, the formation of small solid particles—sulphur dioxide and PM2.5—contributes to climate change. The presence of sulphur dioxide in PU resin is explained by the fact that it is used as a flame retardant [61], but from another point of view, these pollutants are also caused by the energy sources used in the production of this product [62].
When PVA and POS binders are used, the second largest potential environmental impact is the drying of the composite panels, and the number of points varies from 0.09 to 0.18 Pt (in the case of polyurethane, the third largest potential impact). The potential impact on the environment can be linked to the electricity used in the drying process. According to the model, it can be seen that a large part of energy is imported to Lithuania and fossil fuels are used for its production: natural gas, hard coal, oil, lignite. Most of the energy, according to the database, enters Lithuania from third countries, where polluting fuels are used to obtain energy. According to the endpoint indicator, the biggest potential impact is on human health, which comes from carbon dioxide.
The third largest potential environmental impact of the production of panels using PVA and POS binders is the production of composite panels. In the case of the production of PVA composite panels, the biggest potential impact comes from polyvinyl acetate, where carbon dioxide, methane, and dinitrogen monoxide gases are released. This gas is released during the production of the material, but methane, for example, is used in the production of polyvinyl acetate to improve the properties of the material. As with the processes mentioned above, the greatest potential impact is on human health, so the formation of fine particulate matter can be classified into this category. In this potential impact category, sulphur dioxide and PM2.5 solid particles enter the environment. In the case of the production of POS panels, the effect is due to the formation of solid particles. Ammonia, nitrogen oxides, PM2.5 solid particles, and sulphur dioxide are released into the ambient air. For the most part, they are related to the production of starch and the processes used in the production [63].
The manufacturing process is the transport of raw materials (number of points from 0.02 to 0.03 Pt). The potential impact in this process is relatively low, because the EURO5 standard vehicle is used for transportation, so the pollution is relatively low and the material transportation distances are not long. The greatest potential impact is on human health. The largest potential impact in this process is carbon dioxide, which is the result of burning fossil fuels.
The last manufacturing process is the recycling of old tyres (number of points from 0.01 to 0.02 Pt). The potential impact in this process is due to the electricity used in recycling. As previously described, most of the electricity comes from third countries where fossil fuels are used; therefore, the potential impact is caused by the release of carbon dioxide.
In summary, it can be seen that, at all stages of production, the greatest potential impact is on human health, manifested to a large extent due to air pollution, which leads to global warming. In the context of global warming, new diseases appear that affect humans in one way or another, and also, due to the warming climate, warm regions turn into hot ones, and therefore, they become no longer suitable for growing plant crops that are necessary for human nutrition.
  • Scenario of Use of Renewable Energy Sources
Figure 14 presents the result of the life cycle scenario where the electricity consumed during the production stages would be changed to fully renewable energy. This scenario has been chosen because, according to the results presented above, it can be seen that there is a large effect on global warming caused by greenhouse gases.
According to the database data, a large part of the energy was imported from Sweden, Latvia, Belarus, and Russia, which in total represents about 80% of the total amount of electricity in the market. Knowing that electricity is produced in third countries using fossil fuels [64], which contributes to climate change [65], it was decided to completely abandon any imports from all countries and theoretically replace all produced electricity with green energy, which is extracted from RES and only domestically. According to the changed model, 64.6% of the energy was extracted from hydroelectric power (hydroaccumulation and river dams), about 10.6% from wind power plants, and about 24.8% from biofuels (biogas and wood chips).
According to the results of the theoretical model, it can be seen that the total potential impact on the environment decreased on average from 10.0 to 12.1%, when switching to fully renewable energy. Although this is only a prototype-level life cycle model, it can be understood that in the mass production of composite sound absorbing panels, such a reduction in emissions to the ambient air would be significant.
  • Modelling of Global Warming Potential
In the last stage, the Global Warming Potential produced by the composite sound absorbing panels was evaluated. By modelling, it was determined that during the production of different panels with an area of 1 m2 and a mass ranging from 4.40 to 8.82 kg/m2, a total of 6.41 to 16.41 kg of CO2 equivalent would enter the ambient air (Figure 15).
For comparison, a material often found in the construction field, rock wool, which is used both for wall and roof insulation and to improve indoor sound quality, has a GWP of 27.33 kg CO2 eq per 1 m2 of product. When comparing the two products, it can be seen that the production of composite sound absorbing panels from tyre textile fibres would have emitted 0.6 to 4.3 times less CO2 equivalent gas into the ambient air.
In similar research conducted by [38], the authors evaluated sound absorbing material made of chicken feathers with the addition of keratinaceous fibre bonded using a carding machine. The main finding was that the greatest potential impact on the environment was caused by energy consumption, similar to this study. The Global Warming Potential of the material analysed by the researchers was 1.7 kgCO2 eq, while in our study, it varied between 6.41 and 16.41 kgCO2 eq, which is higher due to the use of more processes and materials. Compared to mineral wool, which has a GWP of 27.33 kgCO2 eq [39], our proposed material seems promising, due to lower potential impact, and it comes from recycled tyres, which means that the raw material would be reused.
The LCA performed on the newly developing sound absorbing material showed its potential for sound absorption applications. However, the LCA was performed under laboratory-scale conditions, i.e., the quantities were calculated only for the production of one panel, meaning that it is in the prototyping stage; therefore, such results can indicate reference to the pilot-scale scenario.

4. Conclusions

Reuse of waste tyre textile fibre is a new interesting way to extend the useful life of such material. By reusing waste, waste management problems can be solved; thus, circular economy principles would be implemented. The proposed composite material could be used as a new type of sound absorbing material for indoor use as an acoustic baffle. Placing the developing panels on the ceiling would successfully absorb sound, thus reducing reverberation time, and, if necessary, communication systems could be visually covered.
In total, 108 samples were tested in this study for acoustic and non-acoustic parameters. The main research findings revealed that with increasing density, sound absorption increased at lower frequencies (PU75-10 varied between 0.09 and 0.42 → PU150-10 SAC varied between 0.14 and 0.75). The highest sound absorption was found in the samples containing 10 wt% binder. The lowest results were obtained by the POS composites, and the sound absorption coefficient at 500 Hz was from 0.13 to 0.58 (from lowest density to highest). The peak shift was visible when density increased. The peak shift was from 2000 Hz to 800 Hz.
A life cycle assessment was performed to evaluate the potential impact of the compounds on the three endpoint categories listed by the ReCiPe method. The LCA results revealed that as the density of the composite material increased, the potential environmental impact also increased. The highest potential impact was observed by the samples that were made using PU and PVA binders, while the lowest was the POS binder. The total potential environmental impact of the used materials varied as follows: PU composites—between 0.33 and 0.64 Pt, PVA composite—between 0.27 and 0.56 Pt, and POS composites—between 0.27 and 0.55 Pt. The main potential impact was caused mainly by the manufacturing process of the composite sound absorbing panels, when drying and separation of the rubber was performed. The highest damage was caused to human health out of three damage categories. If the energy source was made totally renewable, the potential impact would decrease from 10.0 to 12.1%. The Global Warming Potential of the proposed composite sound absorbing materials varied between 6.41 and 16.41 kgCO2 eq.
Although more knowledge was gained regarding the sound absorbing materials tested, limitations cannot be excluded. The main limitations in this study include the fact that mainly macro parameters were investigated; however, micro parameters of the material would reveal more data concerning the material (e.g., porosity, tortuosity). Furthermore, mechanical parameters would provide more information on resistance to mechanical factors. Moreover, from the LCA perspective, currently, the main limitations in this stage are that there is a lack of information on tyre collection, transportation to the recycling factory, maintenance of composite sound absorbing materials, and end-of-life stages. This information would improve the LCA analysis of the composite material and expand knowledge of it. Future work will focus on newly developed panel optimisation from an acoustic perspective, i.e., increasing sound absorption capability in the low-frequency range, as well as taking into account the limitations that were mentioned previously.

Author Contributions

Conceptualization, R.R., F.R. and R.G.; methodology, R.R. and F.R.; software, R.R. and F.R.; validation, R.R., F.R. and R.G.; formal analysis, R.R.; investigation, R.R.; resources, F.R. and R.G.; data curation, R.R.; writing—original draft preparation, R.R.; writing—review and editing, F.R. and R.G.; visualization, R.R.; supervision, R.G. and F.R.; project administration, R.G.; funding acquisition, R.G. All authors have read and agreed to the published version of the manuscript.

Funding

This research received no external funding.

Institutional Review Board Statement

Not applicable.

Informed Consent Statement

Not applicable.

Data Availability Statement

The raw data supporting the conclusions of this article will be made available by the authors on request.

Acknowledgments

We would like to thank RTU Institute of Energy Systems and Environment for providing the SimaPro modelling program for implementation of this study and VILNIUS TECH Laboratory of Composite Materials Chief Research Fellow Olga Kizinievič for fruitful suggestions and recommendations on the newly developed composite material.

Conflicts of Interest

The authors declare no conflicts of interest.

References

  1. Tong, H.; Kang, J. Relationship between Urban Development Patterns and Noise Complaints in England. Environ. Plan. B Urban. Anal. City Sci. 2020, 48, 1632–1649. [Google Scholar] [CrossRef]
  2. Şentop Dümen, A.; Tamer Bayazıt, N. Enforcement of Acoustic Performance Assessment in Residential Buildings and Occupant Satisfaction. Build. Res. Inf. 2020, 48, 866–885. [Google Scholar] [CrossRef]
  3. Valentina, L.L.; Arifianto, D.; Azmi, F.U.; Fajar, B.; Nadiroh, A. The Effect of Reverberation Time on Sound Masking Method to Improve Speech Privacy in Open-Plan Offices. J. Phys. Conf. Ser. 2021, 1896, 012005. [Google Scholar] [CrossRef]
  4. Ulrich, T.; Arenas, J.P. Sound Absorption of Sustainable Polymer Nanofibrous Thin Membranes Bonded to a Bulk Porous Material. Sustainability 2020, 12, 2361. [Google Scholar] [CrossRef]
  5. Jesic, J.; Okanovic, A.; Panic, A.A. Net Zero 2050 as an EU Priroty: Modeling a System for Efficient Investments in Eco Innovation for Climate Change Mitigation. Energy Sustain. Soc. 2021, 11, 50. [Google Scholar] [CrossRef]
  6. Sakthivel, S.; Senthil Kumar, S.; Melese, B.; Mekonnen, S.; Solomon, E.; Edae, A.; Abedom, F.; Gedilu, M. Development of Nonwoven Composites from Recycled Cotton/Polyester Apparel Waste Materials for Sound Absorbing and Insulating Properties. Appl. Acoust. 2021, 180, 108126. [Google Scholar] [CrossRef]
  7. Svoboda, J.; Dvorský, T.; Václavík, V.; Charvát, J.; Máčalová, K.; Heviánková, S.; Janurová, E. Sound-Absorbing and Thermal-Insulating Properties of Cement Composite Based on Recycled Rubber from Waste Tires. Appl. Sci. 2021, 11, 2725. [Google Scholar] [CrossRef]
  8. Atiénzar-Navarro, R.; del Rey, R.; Alba, J.; Sánchez-Morcillo, V.J.; Picó, R. Sound Absorption Properties of Perforated Recycled Polyurethane Foams Reinforced with Woven Fabric. Polymers 2020, 12, 401. [Google Scholar] [CrossRef]
  9. Maderuelo-Sanz, R.; Acedo-Fuentes, P.; García-Cobos, F.J.; Sánchez-Delgado, F.J.; Mota-López, M.I.; Meneses-Rodríguez, J.M. The Recycling of Surgical Face Masks as Sound Porous Absorbers: Preliminary Evaluation. Sci. Total Environ. 2021, 786, 147461. [Google Scholar] [CrossRef]
  10. Hassani, P.; Soltani, P.; Ghane, M.; Zarrebini, M. Porous Resin-Bonded Recycled Denim Composite as an Efficient Sound-Absorbing Material. Appl. Acoust. 2021, 173, 107710. [Google Scholar] [CrossRef]
  11. Lyu, L.; Zhang, D.; Tian, Y.; Zhou, X. Sound-Absorption Performance and Fractal Dimension Feature of Kapok Fibre/Polycaprolactone Composites. Coatings 2021, 11, 1000. [Google Scholar] [CrossRef]
  12. Shanmugam, V.; Das, O.; Neisiany, R.E.; Babu, K.; Singh, S.; Hedenqvist, M.S.; Berto, F.; Ramakrishna, S. Polymer Recycling in Additive Manufacturing: An Opportunity for the Circular Economy. Mater. Circ. Econ. 2020, 2, 11. [Google Scholar] [CrossRef]
  13. Lederer, J.; Gassner, A.; Kleemann, F.; Fellner, J. Potentials for a Circular Economy of Mineral Construction Materials and Demolition Waste in Urban Areas: A Case Study from Vienna. Resour. Conserv. Recycl. 2020, 161, 104942. [Google Scholar] [CrossRef]
  14. Meys, R.; Frick, F.; Westhues, S.; Sternberg, A.; Klankermayer, J.; Bardow, A. Towards a Circular Economy for Plastic Packaging Wastes—The Environmental Potential of Chemical Recycling. Resour. Conserv. Recycl. 2020, 162, 105010. [Google Scholar] [CrossRef]
  15. Jayanti, A.; Widyarko. Fast Fashion Synthetic Fabric Waste as an Alternative Noise Absorbent Material. AIP Conf. Proc. 2021, 2376, 080008. [Google Scholar] [CrossRef]
  16. Caniato, M.; Cozzarini, L.; Schmid, C.; Gasparella, A. A Sustainable Acoustic Customization of Open Porous Materials Using Recycled Plastics. Sci. Rep. 2022, 12, 10955. [Google Scholar] [CrossRef] [PubMed]
  17. Vilniškis, T.; Januševičius, T. Sound Insulation Properties of Sound-Reduction Louvers with Innovative Devulcanized Rubber. Arch. Acoust. 2024, 10. [Google Scholar] [CrossRef]
  18. Astrauskas, T.; Januševičius, T.; Grubliauskas, R. Acoustic Panels Made of Paper Sludge and Clay Composites. Sustainability 2021, 13, 637. [Google Scholar] [CrossRef]
  19. Ružickij, R.; Vasarevičius, S.; Januševičius, T.; Grubliauskas, R. The Reuse Method of Waste Tyre Textile Fibers for Sound Absorption Applications. In Proceedings of the 2022 International Conference and Utility Exhibition on Energy, Environment and Climate Change (ICUE), Pattaya, Thailand, 26–28 October 2022. [Google Scholar] [CrossRef]
  20. Sugimoto, N.; Sugimoto, N. Fatigue Analysis and Rapid Design Process of Anti-Vibration Rubber Parts for Automobiles. SAE Tech. Pap. Ser. 2024, 1, 2255. [Google Scholar] [CrossRef]
  21. Apaza Apaza, F.R.; Vázquez, V.F.; Paje, S.E.; Saiz, L.; Gulisano, F.; Gallego, J. The Potential Effect of Crumb Rubber on the Maximum Sound Absorption Performance of Asphalt Mixtures. Constr. Build. Mater. 2023, 389, 131789. [Google Scholar] [CrossRef]
  22. Tarafdar, A.; Oh, M.J.; Nguyen-Phuong, Q.; Kwon, J.H. Profiling and Potential Cancer Risk Assessment on Children Exposed to PAHs in Playground Dust/Soil: A Comparative Study on Poured Rubber Surfaced and Classical Soil Playgrounds in Seoul. Environ. Geochem. Health 2020, 42, 1691–1704. [Google Scholar] [CrossRef] [PubMed]
  23. Landi, D.; Marconi, M.; Meo, I.; Germani, M. Reuse Scenarios of Tires Textile Fibers: An Environmental Evaluation. Procedia Manuf. 2018, 21, 329–336. [Google Scholar] [CrossRef]
  24. Valdes-Vidal, G.; Calabi-Floody, A.; Mignolet-Garrido, C.; Bravo-Espinoza, C. Enhancing Fatigue Resistance in Asphalt Mixtures with a Novel Additive Derived from Recycled Polymeric Fibers from End-of-Life Tyres (ELTs). Polymers 2024, 16, 385. [Google Scholar] [CrossRef] [PubMed]
  25. Khosh, B.; Atapour, H. Assessment of Mechanical Behavior of Sprayed Concrete Reinforced with Waste Tire Textile Fibers. Sci. Rep. 2024, 14, 8873. [Google Scholar] [CrossRef] [PubMed]
  26. Fareghian, M.; Afrazi, M.; Fakhimi, A. Soil Reinforcement by Waste Tire Textile Fibers: Small-Scale Experimental Tests. J. Mater. Civil. Eng. 2022, 35, 04022402. [Google Scholar] [CrossRef]
  27. Ruzickij, R.; Grubliauskas, R. Sound Absorption: Dependence of Rubber Particles Impurities in Tyre Textile Fibre. Environ. Clim. Technol. 2022, 26, 331–340. [Google Scholar] [CrossRef]
  28. Ong, T.K.; Choo, H.L.; Lee, S.M.; Kong, K.Y. Oil Palm Wastes as Sustainable Sound Absorbing Particleboard. IOP Conf. Ser. Mater. Sci. Eng. 2020, 815, 012010. [Google Scholar] [CrossRef]
  29. Bhingare, N.H.; Prakash, S. Effect of Polyurethane Resin Addition on Acoustic Performance of Natural Coconut Coir Fiber. J. Nat. Fibers 2022, 19, 2902–2913. [Google Scholar] [CrossRef]
  30. Tie, T.S.; Mo, K.H.; Putra, A.; Loo, S.C.; Alengaram, U.J.; Ling, T.C. Sound Absorption Performance of Modified Concrete: A Review. J. Build. Eng. 2020, 30, 101219. [Google Scholar] [CrossRef]
  31. Tran, M.H.; Lee, E.Y. Production of Polyols and Polyurethane from Biomass: A Review. Environ. Chem. Lett. 2023, 21, 2199–2223. [Google Scholar] [CrossRef]
  32. Yong, Q.; Liao, B.; Huang, J.; Guo, Y.; Liang, C.; Pang, H. Preparation and Characterization of a Novel Low Gloss Waterborne Polyurethane Resin. Surf. Coat. Technol. 2018, 341, 78–85. [Google Scholar] [CrossRef]
  33. Tigabe, S.; Atalie, D.; Gideon, R.k. Physical Properties Characterization of Polyvinyl Acetate Composite Reinforced with Jute Fibers Filled with Rice Husk and Sawdust. J. Nat. Fibers 2022, 19, 5928–5939. [Google Scholar] [CrossRef]
  34. Diyana, Z.N.; Jumaidin, R.; Selamat, M.Z.; Ghazali, I.; Julmohammad, N.; Huda, N.; Ilyas, R.A. Physical Properties of Thermoplastic Starch Derived from Natural Resources and Its Blends: A Review. Polymers 2021, 13, 1396. [Google Scholar] [CrossRef] [PubMed]
  35. Hassan, T.; Jamshaid, H.; Mishra, R.; Khan, M.Q.; Petru, M.; Novak, J.; Choteborsky, R.; Hromasova, M. Acoustic, Mechanical and Thermal Properties of Green Composites Reinforced with Natural Fibers Waste. Polymers 2020, 12, 654. [Google Scholar] [CrossRef] [PubMed]
  36. Ricciardi, P.; Belloni, E.; Cotana, F. Innovative Panels with Recycled Materials: Thermal and Acoustic Performance and Life Cycle Assessment. Appl. Energy 2014, 134, 150–162. [Google Scholar] [CrossRef]
  37. Secchi, S.; Asdrubali, F.; Cellai, G.; Nannipieri, E.; Rotili, A.; Vannucchi, I. Experimental and Environmental Analysis of New Sound-Absorbing and Insulating Elements in Recycled Cardboard. J. Build. Eng. 2016, 5, 1–12. [Google Scholar] [CrossRef]
  38. Casadesús, M.; Álvarez, M.D.; Garrido, N.; Molins, G.; Macanás, J.; Colom, X.; Cañavate, J.; Carrillo, F. Environmental Impact Assessment of Sound Absorbing Nonwovens Based on Chicken Feathers Waste. Resour. Conserv. Recycl. 2019, 149, 489–499. [Google Scholar] [CrossRef]
  39. Nagy, B.; Marosvolgyi, M.; Szalay, Z. Global Warming Potential of Building Constructions Based on Heat and Moisture Transport Analysis. Therm. Sci. 2021, 26, 3285–3296. [Google Scholar] [CrossRef]
  40. ISO 10534-2:2023; Acoustics—Determination of Acoustic Properties in Impedance Tubes—Part 2: Two-Microphone Technique for Normal Sound Absorption Coefficient and Normal Surface Impedance. International Standard. ISO: Geneva, Switzerland, 1998; pp. 1–28.
  41. ISO.9053-1:2018; Acoustics—Determination of Airflow Resistance—Part 1: Static Airflow Method. International Standard. ISO: Geneve, Switzerland, 2018; pp. 1–20.
  42. ISO 14040:2006; Environmental Management—Life Cycle Assessment—Principles and Framework. International Standard. ISO: Geneva, Switzerland, 2022.
  43. ISO 14044:2006; Environmental Management—Life Cycle Assessment—Requirements and Guidelines—Amendment 1. International Standard. ISO: Geneva, Switzerland, 2017.
  44. PRé Sustainability. SimaPro Database Manual Methods Library; PRé Sustainability: Amersfoort, The Netherlands, 2020. [Google Scholar]
  45. Yang, Y.; Chen, Z.; Chen, Y.; Zhang, L.; Lu, H. Effect of Physical and Subsequent Processing Parameters of Glass Fiber Felts on Sound Insulation. J. Text. Inst. 2017, 109, 614–619. [Google Scholar] [CrossRef]
  46. Bozkurt, T.S.; Yılmaz Demirkale, S. Investigation and Development of Sound Absorption of Plasters Prepared with Pumice Aggregate and Natural Hydraulic Lime Binder. Appl. Acoust. 2020, 170, 107521. [Google Scholar] [CrossRef]
  47. Abdi, D.D.; Monazzam, M.; Taban, E.; Putra, A.; Golbabaei, F.; Khadem, M. Sound Absorption Performance of Natural Fiber Composite from Chrome Shave and Coffee Silver Skin. Appl. Acoust. 2021, 182, 108264. [Google Scholar] [CrossRef]
  48. Cao, L.; Fu, Q.; Si, Y.; Ding, B.; Yu, J. Porous Materials for Sound Absorption. Compos. Commun. 2018, 10, 25–35. [Google Scholar] [CrossRef]
  49. Asadi, M.; Ohadi, A.; Keshavarz, R. Effect of Non-Acoustic Properties on the Sound Absorption of Polyurethane Foams. J. Theor. Appl. Vib. Acoustics 2015, 1, 122–132. [Google Scholar] [CrossRef]
  50. Liu, X.; Xiong, X.; Pang, J.; Wu, L.; Zhang, H. Airflow Resistivity Measurement and Sound Absorption Performance Analysis of Sound-Absorb Cotton. Appl. Acoust. 2021, 179, 108060. [Google Scholar] [CrossRef]
  51. Seddeq, H.S. Factors Influencing Acoustic Performance of Sound Absorptive Materials. Aust. J. Basic. Appl. Sci. 2009, 3, 4610–4617. [Google Scholar]
  52. Yang, T.; Hu, L.; Xiong, X.; Petrů, M.; Noman, M.T.; Mishra, R.; Militký, J. Sound Absorption Properties of Natural Fibers: A Review. Sustainability 2020, 12–8477. [CrossRef]
  53. Asdrubali, F.; D’Alessandro, F.; Schiavoni, S. Sound Absorbing Properties of Materials Made of Rubber Crumbs. J. Acoust. Soc. Am. 2008, 123, 3037. [Google Scholar] [CrossRef]
  54. Zhou, R.; Zhao, S.; Luo, M.; Meng, X.; Ma, J.; Liu, J. MFCC Based Real-Time Speech Reproduction and Recognition Using Distributed Acoustic Sensing Technology. Optoelectron. Lett. 2024, 20, 222–227. [Google Scholar] [CrossRef]
  55. Lomte, A.; Sharma, B.; Drouin, M.; Schaffarzick, D. Sound Absorption and Transmission Loss Properties of Open-Celled Aluminum Foams with Stepwise Relative Density Gradients. Appl. Acoust. 2021, 193, 19. [Google Scholar] [CrossRef]
  56. Quek, C.S.; Ngadi, N.; Ahmad Zaini, M.A. The Oil-Absorbing Properties of Kapok Fibre—A Commentary. J. Taibah Univ. Sci. 2020, 14, 507–512. [Google Scholar] [CrossRef]
  57. Nasruddin; Setianto, W.B.; Yohanes, H.; Atmaji, G.; Lanjar; Yanto, D.H.Y.; Wulandari, E.P.; Wiranata, A.; Ibrahim, B. Characterization of Natural Rubber, Styrene Butadiene Rubber, and Nitrile Butadiene Rubber Monomer Blend Composites Loaded with Zinc Stearate to Be Used in the Solid Tire Industry. Appl. Sci. 2023, 13, 1277. [Google Scholar] [CrossRef]
  58. Mostoni, S.; Milana, P.; Di Credico, B.; D’arienzo, M.; Scotti, R. Zinc-Based Curing Activators: New Trends for Reducing Zinc Content in Rubber Vulcanization Process. Catalysts 2019, 9, 664. [Google Scholar] [CrossRef]
  59. Monteiro, H.; Ribeiro, I.; Gonçalves, M.; Iten, M.; Caetano, N.S. Life Cycle Energy and Carbon Analysis of a Road-Safety Barrier Produced Using Recycled Tire Rubber. Energy Rep. 2022, 8, 270–276. [Google Scholar] [CrossRef]
  60. Mora, C.; McKenzie, T.; Gaw, I.M.; Dean, J.M.; von Hammerstein, H.; Knudson, T.A.; Setter, R.O.; Smith, C.Z.; Webster, K.M.; Patz, J.A.; et al. Over Half of Known Human Pathogenic Diseases Can Be Aggravated by Climate Change. Nat. Clim. Chang. 2022, 12, 869–875. [Google Scholar] [CrossRef] [PubMed]
  61. Yuan, Y.; Lin, W.; Xiao, Y.; Yu, B.; Wang, W. Advancements in Flame-Retardant Systems for Rigid Polyurethane Foam. Molecules 2023, 28. [Google Scholar] [CrossRef] [PubMed]
  62. Smith, S.J.; Pitchera, H.; Wigley, T.M.L. Global and Regional Anthropogenic Sulfur Dioxide Emissions. Glob. Planet. Chang. 2001, 29, 99–119. [Google Scholar] [CrossRef]
  63. Lansche, J.; Awiszus, S.; Latif, S.; Müller, J. Potential of Biogas Production from Processing Residues to Reduce Environmental Impacts from Cassava Starch and Crisp Production—A Case Study from Malaysia. Appl. Sci. 2020, 10, 2975. [Google Scholar] [CrossRef]
  64. Pagliaro, M. Renewable Energy in Russia: A Critical Perspective. Energy Sci. Eng. 2021, 9, 950–957. [Google Scholar] [CrossRef]
  65. Johnsson, F.; Kjärstad, J.; Rootzén, J. The Threat to Climate Change Mitigation Posed by the Abundance of Fossil Fuels. Clim. Policy 2019, 19, 258–274. [Google Scholar] [CrossRef]
Figure 1. Waste tyre textile fibre in the end-of-life tyre recycling facility.
Sustainability 16 06281 g001
Figure 2. Sample preparation sequence: (a) the required amount of fibre is taken; (b) binder added and mixed with the fibre; (c) sample mould with parchment lining; (d) mould filled with the mixed mass.
Sustainability 16 06281 g002
Figure 3. Principal scheme of the impedance tube.
Sustainability 16 06281 g003
Figure 4. Airflow resistivity measurement equipment: 1—air flow pipe, 2—directional air flow, 3—sample holder, 4—differential pressure gauge, 5—air flow velocity meter.
Sustainability 16 06281 g004
Figure 5. System boundaries of the considered sound absorbing panel production.
Sustainability 16 06281 g005
Figure 6. Static airflow resistivity of the measured samples.
Sustainability 16 06281 g006
Figure 7. Scanning electron microscopy images: (a)—samples with PU binder 10 wt%; (b)—samples with PU binder 50 wt%; (c)—samples with PVA binder 10 wt%; (d)—samples with PVA binder 50 wt%; (e)—samples with POS binder 10 wt%; (f)—samples with POS binder 50 wt%.
Sustainability 16 06281 g007aSustainability 16 06281 g007b
Figure 8. Sound absorption results of 75 kg/m3 density samples with binder content 10, 30, and 50 wt%.
Sustainability 16 06281 g008
Figure 9. Sound absorption results of 100 kg/m3 density samples with binder content 10, 30, and 50 wt%.
Sustainability 16 06281 g009
Figure 10. Sound absorption results of 125 kg/m3 density samples with binder content 10, 30, and 50 wt%.
Sustainability 16 06281 g010
Figure 11. Sound absorption results of 150 kg/m3 density samples with binder content 10, 30, and 50 wt%.
Sustainability 16 06281 g011
Figure 12. Total potential environmental impact of composite sound absorbing panels.
Sustainability 16 06281 g012
Figure 13. Damage for three endpoint categories of composite sound absorbing materials made with PU, PVA, and POS binders during each manufacturing process: (a) composite panels made of WTTF and PU, when densities were 75 ÷ 150 kg/m3; (b) composite panels made of WTTF and PVA, when densities were 75 ÷ 150 kg/m3; (c) composite panels made of WTTF and POS, when densities were 75 ÷ 150 kg/m3.
Sustainability 16 06281 g013aSustainability 16 06281 g013b
Figure 14. Total potential environmental impact of switching all electricity to renewables.
Sustainability 16 06281 g014
Figure 15. Global Warming Potential of composite sound absorbing panels under development.
Sustainability 16 06281 g015
Table 1. Mix proportions of composite sound absorbing samples (percentage by weight (wt%)).
SampleWTTF, wt%PU, wt%PVA, wt%H2O, wt%POS and H2O Ratio
PU-109010
PU-307030
PU-505050
PVA-109055
PVA-30701515
PVA-50502525
POS-10901:10
POS-30701:10
POS-50501:10
Table 2. Results of the functional unit calculation.
Density, kg/m375100125150
Functional Unit (for 1 m2 panel), kg (eq)4.406.157.588.82
Table 3. Life cycle input and output processes of composite sound absorbing panels.
ProcessEnd-of-life tyre recycling
Input
AmountComments
Materials/ComponentsMeasurement Unit75 kg/m3100 kg/m3125 kg/m3150 kg/m3
End-of-life tyreskg64.7690.71111.77130.20To recycle 1 tonne of end-of-life tyres, 150 kWh of electrical energy (data from the recycling facility)
Electrical energykWh0.670.941.161.35
Output
Recycling residueskg0.650.911.121.301.0% of the total amount
Metalskg9.513.216.319.014.75% of the total amount
Rubberkg50.270.386.6100.978.25% of the total amount
Waste tyre textile fibrekg4.496.297.759.027.0% of the total amount
ProcessWaste tyre textile fibre transportation to the composite sound absorbing panel production facility
Amount of cargo transportation (WTTF)tkm1.452.032.492.90Small-capacity truck (diesel, 3.5 litres, up to 7.5 tons, EURO5 standard; fibre transport distance 320 km, binder 11 km)
Amount of cargo transportation (binders)tkm6.36 × 10−58.32 × 10−59.64 × 10−51.07 × 10⁻⁴
ProcessProduction of composite sound absorbing panels
Input
Waste tyre textile fibre (with packaging)kg4.546.337.799.07The quantity required for the production of one panel
Electrical energykWh1.492.182.592.98Electricity is used for fibre drying (amount determined by electricity consumption metre)
Polyurethane binder with hardener (with packaging)kg0.700.921.061.18The amount of binder required for the production of one panel
Polyvinyl acetate (with packaging)kg0.500.720.860.98The amount of binder required for the production of one panel
Starch (with packaging)kg0.420.640.780.90The amount of binder required for the production of one panel
Tap waterkg0.801.231.521.76For PVA and starch dilution
Electrical energykWh5.768.049.9111.52Electricity is used to dry the composite sound absorbing panel (amount determined by electricity consumption metre)
Parchement paperkg0.100.100.100.10For lining the mould
Electrical energykWh0.040.050.060.08Electricity is used to mix the components (amount determined by electricity consumption metre)
Output
Rubber residueskg0.400.630.770.90Residues of rubber impurities after sieving (disposed)
WTTF transportation bagskg0.050.050.050.05PE bags
Polyurethane resin and hardener packageskg0.300.300.300.30FE packaging
Polyvinyl acetate packagingkg0.100.100.100.10PET packaging
Starch packagingkg0.020.020.020.02Paper bag
Parchement paperkg0.100.100.100.10
Waste tyre textile fibrekg0.090.130.150.182.0% unused balance during production
Composite sound absorbing panelkg4.406.157.588.82Final product (mass corresponds to functional unit)
Disclaimer/Publisher’s Note: The statements, opinions and data contained in all publications are solely those of the individual author(s) and contributor(s) and not of MDPI and/or the editor(s). MDPI and/or the editor(s) disclaim responsibility for any injury to people or property resulting from any ideas, methods, instructions or products referred to in the content.

