Article

Ecotoxicity of Tar from Coffee Grounds and Pine Pellet Gasification Process

by
Małgorzata Hawrot-Paw
1,
Adam Koniuszy
1,
Andrzej Borusiewicz
2,*,
Zbigniew Skibko
3,
Wacław Romaniuk
4,
Grzegorz Zając
5 and
Joanna Szyszlak-Bargłowicz
5
1
Department of Renewable Energy Engineering, West Pomeranian University of Technology in Szczecin, Pawla VI 1, 71-459 Szczecin, Poland
2
Department of Agronomy, Modern Technology and Informatics, International Academy of Applied Sciences in Lomza, 18-402 Lomza, Poland
3
Faculty of Electrical Engineering, Bialystok University of Technology, Wiejska 45, 15-351 Bialystok, Poland
4
Institute of Technology and Life Sciences—National Research Insitute, Hrabska 3, 05-090 Falenty, Poland
5
Department of Power Engineering and Transportation, University of Life Sciences in Lublin, Gleboka 28, 20-612 Lublin, Poland
*
Author to whom correspondence should be addressed.
Sustainability 2024, 16(15), 6291; https://doi.org/10.3390/su16156291
Submission received: 28 June 2024 / Revised: 19 July 2024 / Accepted: 22 July 2024 / Published: 23 July 2024
(This article belongs to the Special Issue Fates, Transports, Interactions and Monitoring of Emerging Pollutants)

Abstract

:
This study determined the toxicity of the condensates produced during the gasification of two waste types. Coffee grounds, pine pellets, and a mixture of both substrates at a ratio of 1:1 were used in the study. Two microbiotests were applied for soil plants and aquatic macrophytes, and quantitative analysis of the soil microbiome for primary taxonomic groups of microorganisms was conducted. Three contamination rates were used in the Phytotoxkit test and the microbiological tests, 100, 1000, and 10,000 mg·kg−1 d.m. of soil, while in the aquatic organism studies, successive two-fold serial dilutions of condensates were used. The presence of liquid waste from the gasification process adversely affected the germination and development of terrestrial plants and the vegetative growth of aquatic plants. The condensate components modified the composition of the soil microbiome, adversely affecting soil fertility. The negative impact increased with increasing levels of contamination and primarily depended on the type of substrate from which the gasification process produced the liquid waste.

1. Introduction

The use of biomass for energy production, especially waste biomass, means lower greenhouse gas emissions compared to fossil fuels [1], less air and water pollution [2], and the conservation of natural resources [3]. Biomass is assumed to be carbon dioxide-neutral because the amount of CO2 produced during biomass energy conversion offsets the amount absorbed by plants during their growth [4]. Biomass encompasses a wide range of feedstocks, including wood [5], algae [6], agricultural waste [7], and waste from various other economic sectors [8,9]. The use of organic waste for energy production helps to reduce the amount of waste [10] and the common landfill problem [11]. Biomass is widely available, comes in various forms, and can be used in different ways depending on the needs.
The conversion of biomass to bioenergy comprises three main methods: physicochemical, biochemical, and thermochemical [12]. Physicochemical processes mainly include the extraction of oil from seeds and the process of transesterification [13], thanks to which, biodiesel can be produced. Biopalives can also be obtained by biochemical processes that use microorganisms for conversion [14]. Each method has its own specific applications and can be chosen depending on the available feedstock, technology, and the energy needed. In thermochemical conversion, energy, fuels, and valuable chemicals can be obtained [15]. This method primarily involves a combustion process, where heat is obtained in excess oxygen for heating or generating electricity, e.g., in steam turbines [16]. Another thermochemical process is pyrolysis. During pyrolysis, biomass is heated without oxygen, and its decomposition leads to solid, liquid, and gaseous products, i.e., biocarbon, bio-oil, and pyrolysis gas [17]. By controlling oxygen access, biomass can be converted into gasification reactions. Gasification is the process by which carbon-containing materials are converted to a combustible gas called syngas. Syngas consists mainly of carbon monoxide (CO), hydrogen (H2), and carbon dioxide (CO2). The gasification occurs under high temperatures and controlled amounts of oxygen or steam. Syngas can be converted into electricity, heat, synthetic liquid fuels in Fischer–Tropsch synthesis, and chemicals [18].
Tar from the gasification process is a mixture of hydrocarbons, including polycyclic aromatic hydrocarbons (PAHs). It is formed as a result of the incomplete thermal decomposition of the feedstock. The amount of tar formed depends on several factors, including the temperature of the process; the gasifying agent, which can be air, oxygen, or steam; and the residence time. The type of raw material significantly affects the amount of tar and, above all, its composition [19]. Various strategies are used to reduce tar formation, primarily changing the design of gasifiers and optimising their operating conditions in terms of temperature, possibly pressure, and residence time. In most gas tanks, a higher temperature of the gasification process and a longer residence time of the charge in the gas chamber result in a lower tar content, but then, the resulting syngas is less caloric. Better material fragmentation also reduces tar [20]. In addition, catalysts such as dolomite can be used. Catalysts containing oxides of alkali metals (CaO or MgO), e.g., dolomite after calcination, are active in the decomposition of tars. The use of dolomite in the biomass gasification process increases the efficiency of the decomposition of tar into gaseous products by about 20% and allows for the decomposition of over 60% of tar [21]. It is also possible to purify the syngas produced using thermal cracking, catalytic cracking, or filtration. Due to the complex composition of tar, developing a one-size-fits-all solution is difficult, and effective tar removal technologies can be costly and energy-intensive [22].
Finding effective solutions for dealing with tar is crucial to adequately operating gasification equipment, obtaining the quality of the syngas, and, above all, ensuring environmental protection. The ecotoxicity of the tar produced by the gasification process is a significant concern due to various harmful organic and inorganic compounds. Tar contains volatile organic compounds (VOCs), which can contribute to air pollution. VOCs react with nitrogen oxides (NOx), leading to ozone formation. Tar can contribute to forming delicate particulate matter (PM2.5) [23]. Improper tar storage can cause it to enter rivers or lakes, which can harm aquatic ecosystems. Many PAHs are carcinogens and mutagens. Improper waste management from the gasification process can also lead to soil contamination. Tar can adversely affect soil microorganisms [24] and plant growth and development. It can also accumulate in this environment and consequently enter the food chain with crops. Given the properties of tar, regulations are needed to indicate the correct storage and disposal of tar and to conduct environmental monitoring of air, water, and soil quality where gasification processes are carried out.
The research presented here aimed to evaluate the ecotoxicological effects of condensates obtained from the gasification process on germination and vegetative growth of terrestrial and aquatic plants and the soil microbiome.

2. Materials and Methods

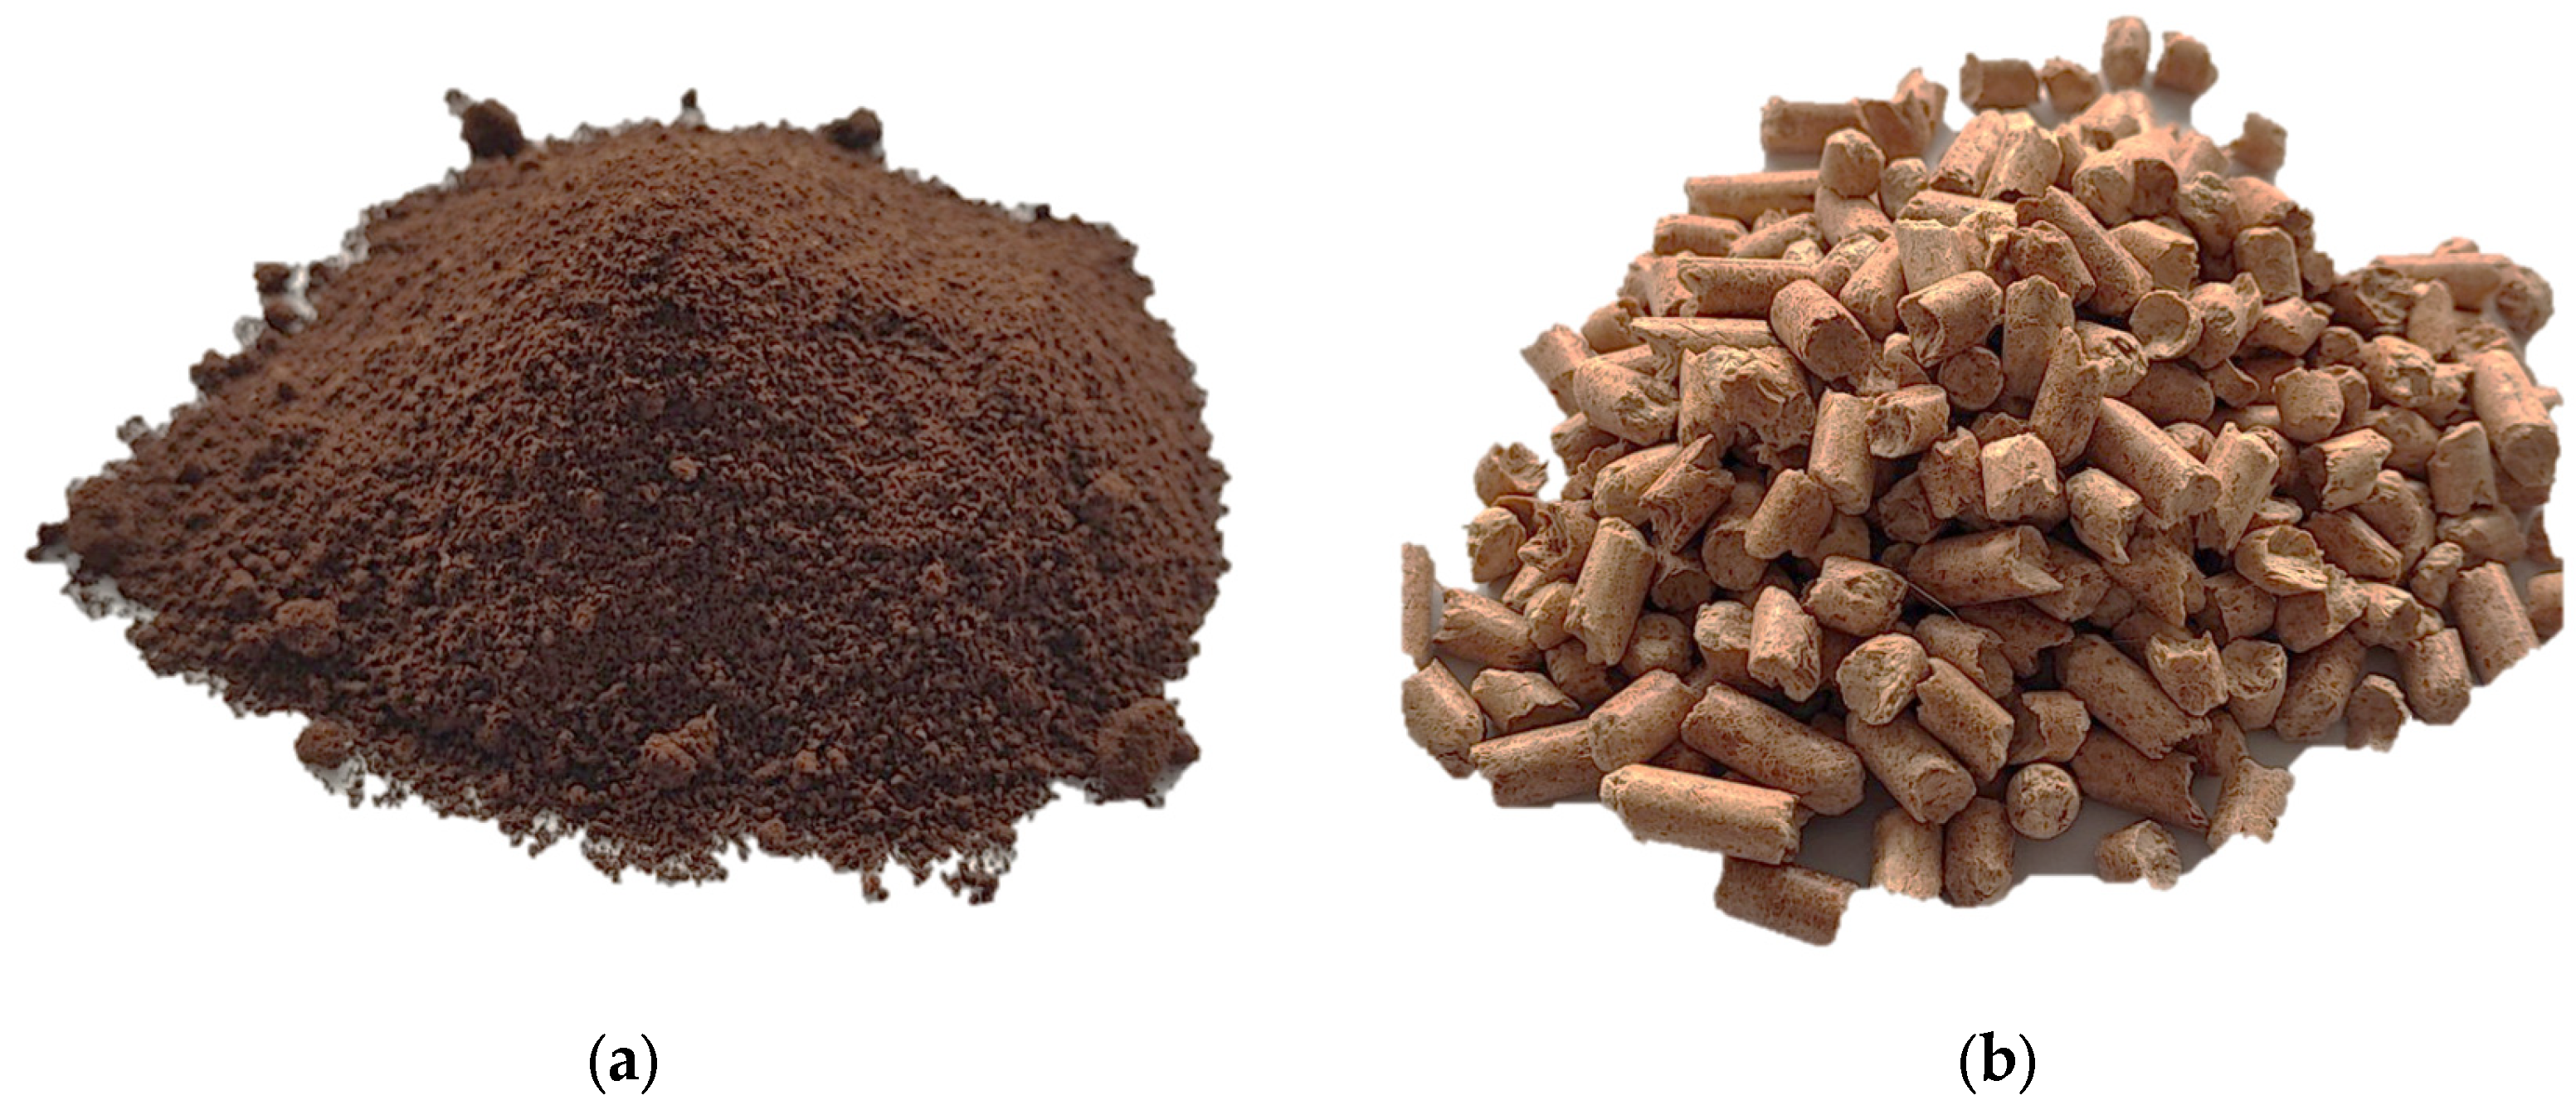
2.1. Organic Waste for Energy Production

The study material consisted of coffee refuse and pine pellets (Figure 1). Coffee grounds (CRs) came from the brewing process of coffee at home in a pressurised Krups coffee machine. The operating parameters of the Krups coffee machine were as follows: pressure—15 bar; water temperature—92 °C; brewing time—about 0.6 min. Arabica 100% coffee without flavouring and from a single supplier from Brazil was used to obtain the test material. After brewing in the espresso machine, the extracted CRs were dried in a laboratory dryer at 35 °C for 24 h to obtain a moisture content of 10.2% by weight.
Pellets (PPs) produced from pine wood sawdust were also used in the study. The pinewood came from Poland in the region of Western Pomerania. This material was prepared by the pressure method using a die with a 6 mm hole diameter, without adding binders, using the A1-310 processing line with a capacity of about 100 kg/h and a power consumption of about 9 kW. The moisture content of the PP by weight was 6.5%.

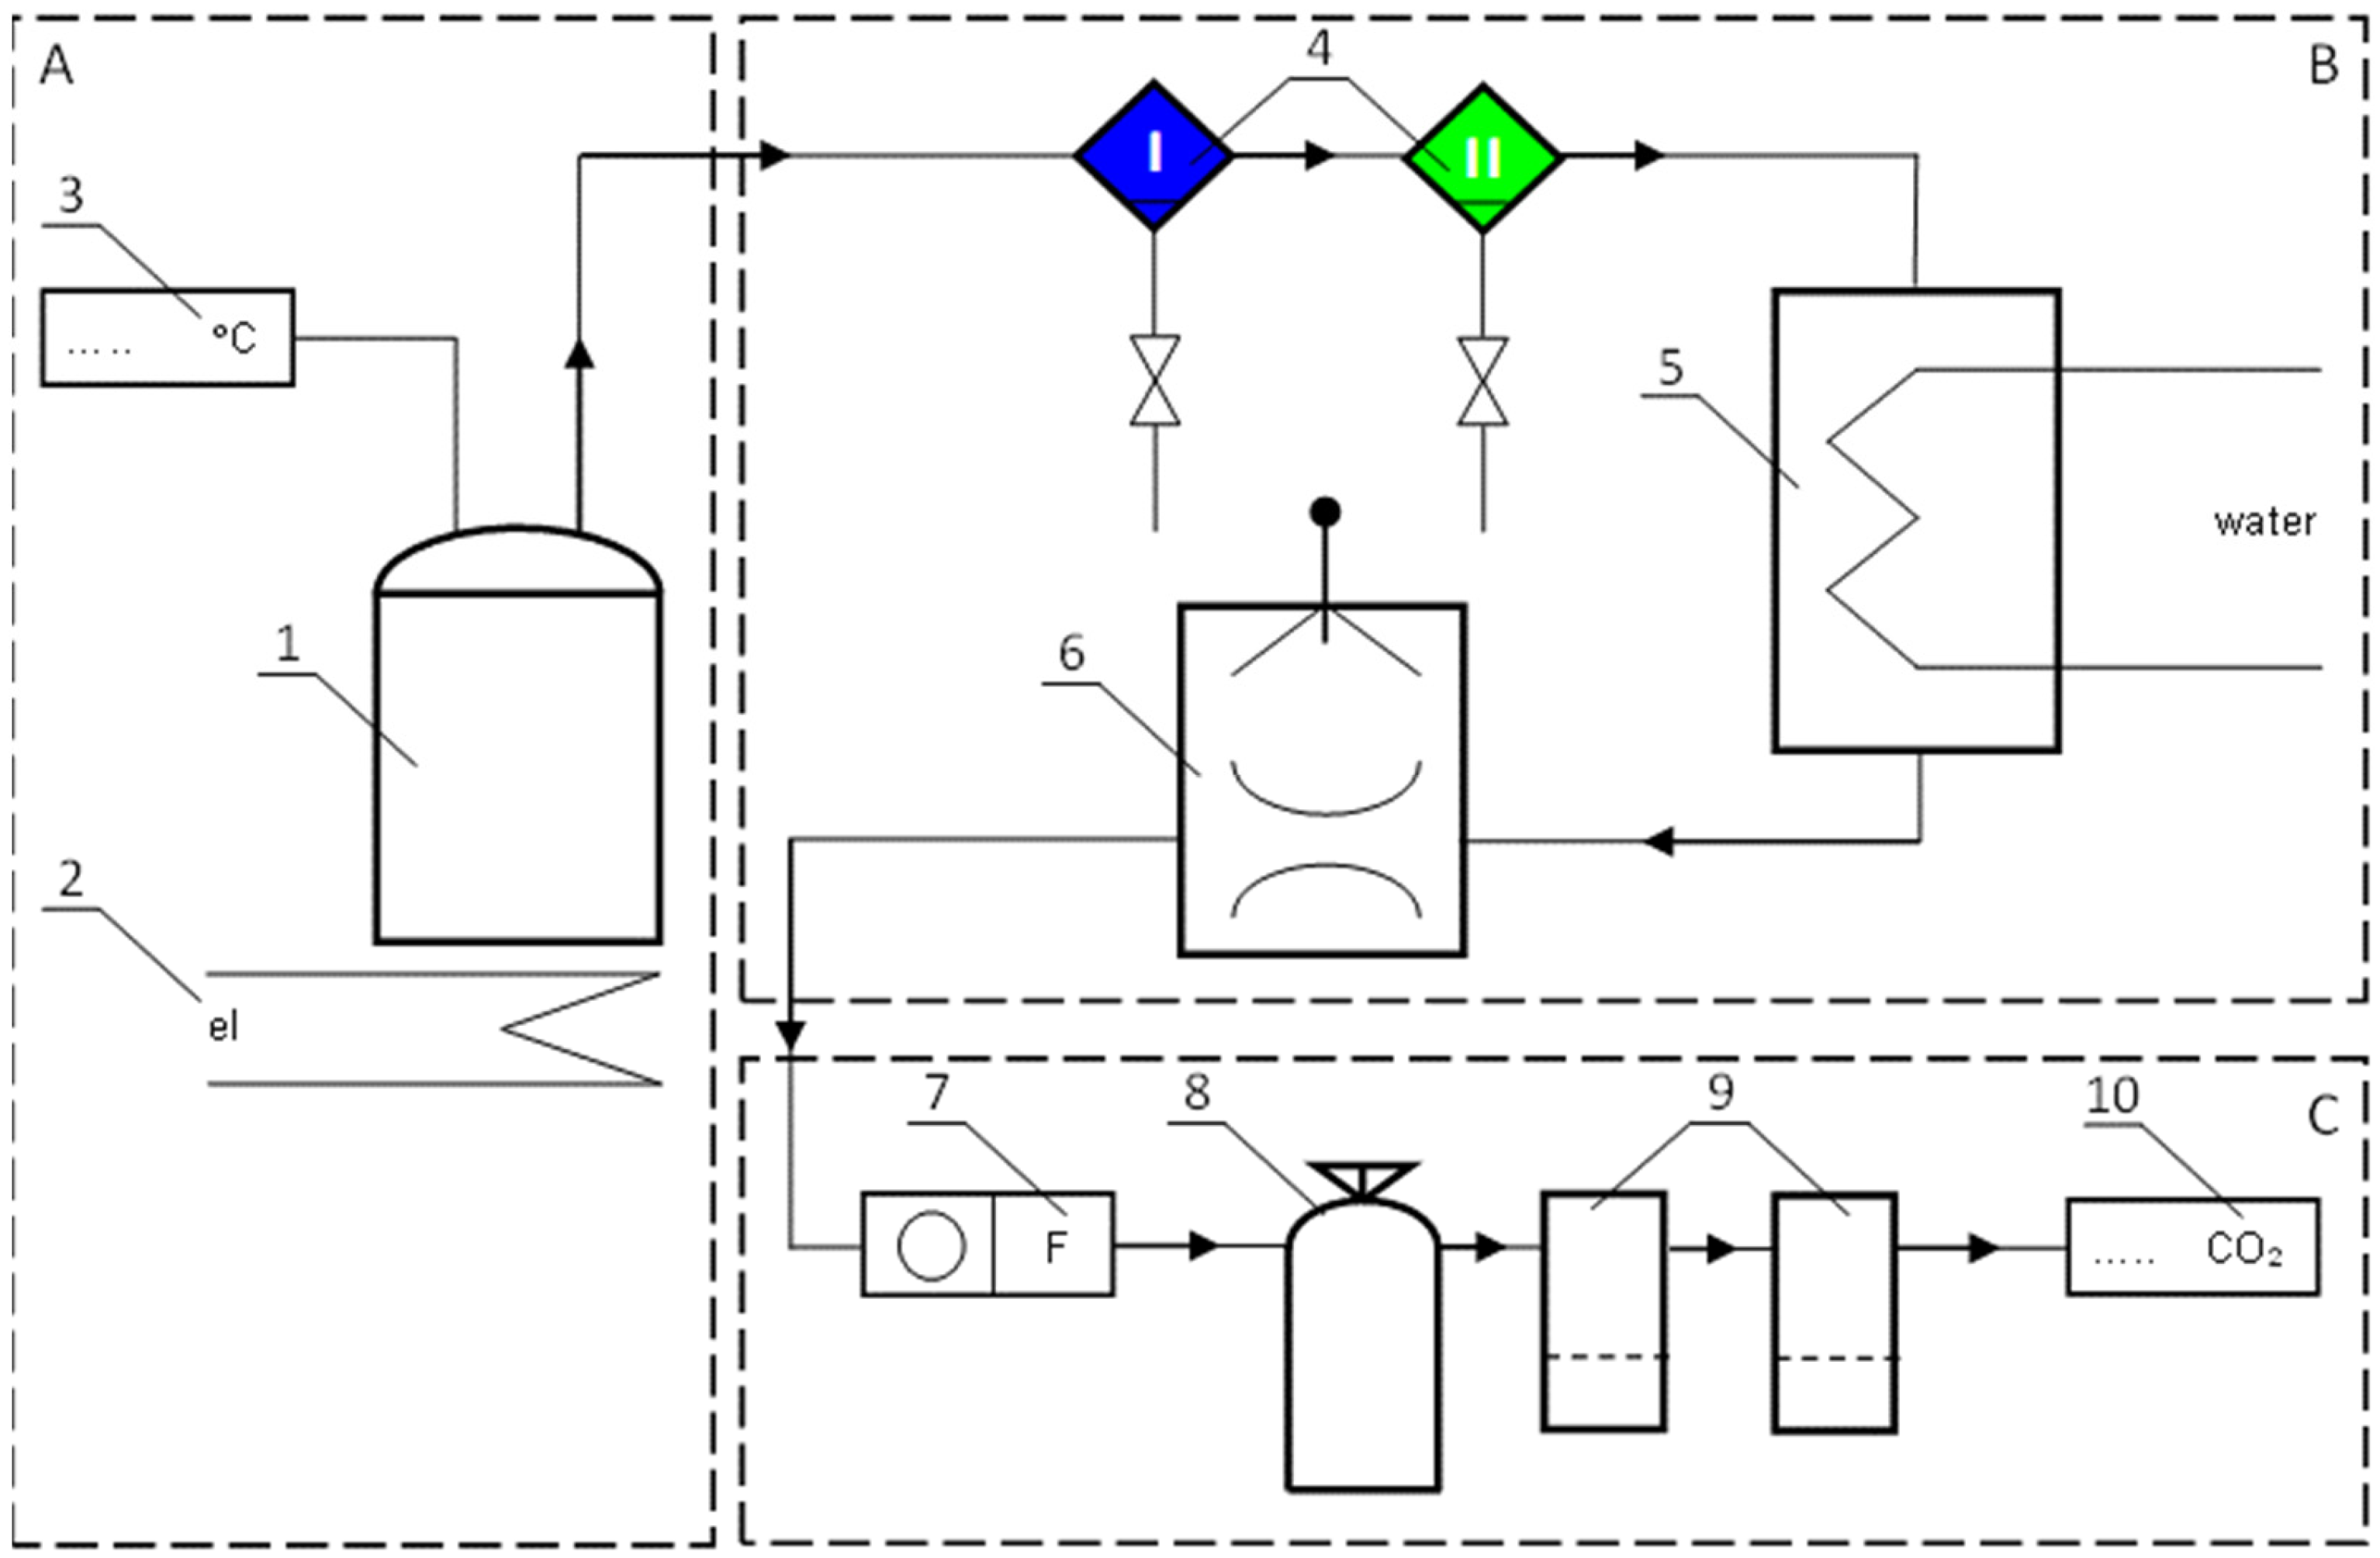
2.2. Experimental Setup

The experiment was conducted in triplicate for the following proportions of raw materials: 100% CR, 50% CR: 50% PP, 100% PP. A 200 g sample of raw material was placed in the chamber of a 3 dm3 diaphragm gasifier reactor (Figure 2). Then, the gas chamber was tightly closed and the process began, and gasification took place. Using a two-stage electric heater with a rated heater power of 4 kW, the gasifier reactor was heated from an external electric heat source. The reactor’s heating time was about 40 min and the operating temperature was about 650 °C, and these values were the same for all iterations. External air access to the reactor chamber was closed. Only the air filling of the reactor chamber was used for gasification. After the gas collector was warmed up, the syngas left the working chamber and flowed through pipes further to the next modules of the cooling and purification system. Some of the hot, volatile products of the gasification process were condensed to the liquid phase (water, pyrolysis oil, tars) in a two-stage water cooler. The remaining part of the products, still in the gaseous phase, was directed to an analyser to determine the chemical composition and (on this basis) to determine the calorific value. The following gases were read in the VarioPlus MRU analyser: CO, CO2, H2, CH4, O2, and N2. The analyser’s measurement error did not exceed 0.5% for all the gases tested [25].
Chemical analyses of the gaseous fuel were carried out using an MRU Vario Plus analyser [26] designed for continuous operation in measuring emissions from all industrial combustion processes by electrochemical and infrared methods according to PN-EN 50379-1:2013-03 [27]. Following the experiment, the mass of waste products generated after the gasification process was determined.
Liquid fractions generated in condensation tanks I and II of the organic substrate gasification system were used to assess the ecotoxicological impact of waste from the gasification process for coffee grounds. The tanks were arranged in series. In the first tank, heavier tar fractions with a higher boiling point accumulated, while in the second tank, lighter fractions with a lower boiling point accumulated. The gas then passed through a scrubber and a double water filter and entered the gas analyser. It was assumed that the possible differences in condensation temperatures could affect the composition of the liquid products and their toxicity.
Microbiotests were carried out for soil and aquatic plants. The species Sinapsis alba was used as a bioindicator of contamination in the soil environment. The tests assessed seed germination (in %) and root growth (in mm) after 3 days of exposure to contaminants introduced into the soil. To determine the level of contamination negatively affecting the parameters tested, individual condensates were introduced into the soil at three substantially different doses: 100, 1000, and 10,000 mg·kg−1 s.m. of soil. The doses of the condensate were determined using an analytical balance (accuracy of the reading 0.1 mg). The measured doses of condensates were distributed evenly in the soil prepared for the tests and mixed. The samples were left for 24 h.
The phytotoxicity test was carried out in special plates. A weighed portion of the contaminated soil, a measured amount of distilled water depending on the moisture content of the soil, was introduced into each plate, and the whole thing was then covered with a tissue paper filter. Control samples (Cs) contained only distilled water. In the plates thus prepared, 10 seeds of similar size were evenly distributed on the surface of the filter paper. The test was performed in triplicate for each experimental facility. The sealed plates were incubated in the dark at 25 ± 1 °C. The test time was 72 h. After the designated incubation time, the number of germinated seeds and root length were determined. Only seeds with a root length > 1 mm were included in the evaluation. The germination index (%GI) was also calculated based on both these parameters using Formula (1) as follows:
% G I = G s   ·   L s G c   ·   L c   · 100 ,
where GS and GC are seed germination for the test sample and control, and LS and LC are root length (cm) for the test sample and control.
Lemna minor species were used in aquatic toxicity tests. The material came from the authors’ own collection. Before testing, plants were disinfected with 0.5% (v/v) sodium hypochlorite solution for 0.5 min, and then washed with sterile distilled water and placed in containers with fresh culture medium. Plants for bioassays were preselected by selecting specimens that were free of discolouration, regular in shape, similar in size, and had an equal number of fronds per colony. The test was carried out according to the OECD 221 procedure [28]. Plants were grown statically in 6-well plates with a total volume of 17 mL each. Two-fold serial dilutions of condensates in Steinberg medium [29] at pH 6.5 were used. A control plate (C) containing only the medium was prepared. Three colonies containing three fronds each were introduced into each well of the plates. The plates were protected with parafilm to limit evaporation and placed in a thermostat at 24 ± 1 °C. Continuous LED illumination was used, with a neutral white colour of 4000 K and an intensity of 40 µmol m−2 s−1. Effects related to the toxicity of the condensate components were assessed by the number of fronds and the fresh weight of the plants. Frond number and colony appearance were analysed after 168 h. The results for growth rate were converted according to the following formula, Formula (2):
μ = l n N F t l n N 0 t   · 100 ,
where µ is the specific growth rate, Ft is the number of fronds after 168 h, F0 is the number of fronds at the beginning of the experiment, and t is the exposure time.
Plants from individual wells were transferred to pre-weighed polystyrene tubes with holes in the bottom and centrifuged at 3000 rpm·min−1 for 10 min. The tubes with the dried plants were reweighed. The average inhibition concerning biomass was determined according to Equation (3) as follows:
% I b = B c B T b c   · 100 ,
where %Ib is the percentage biomass reduction, bc is ln(final biomass) minus ln(initial biomass) for the control, and bT is ln(final biomass) minus ln(initial biomass) in the test sample.
As part of the microbiological analyses, changes in the abundance of bacteria, actinomycetes, and fungi were determined. The abundance was determined based on the inoculation of soil dilutions with the use of media suitable for particular groups of microorganisms—for bacteria after 3 days of incubation on the medium according to Bunt and Rovira [30], for actinomycetes after 7 days on the medium according to Cyganova and Zukova [31], and for fungi after 5 days on the medium according to Martin [32]. The results are presented as cfu (colony-forming units) per 1 g d.m. of soil. Based on the abundance of individual groups of microorganisms, the soil fertility index (SR) was determined according to Myśków [33], which expresses the ratio of bacterial and radicle cells to fungal cells.

3. Discussion of Results

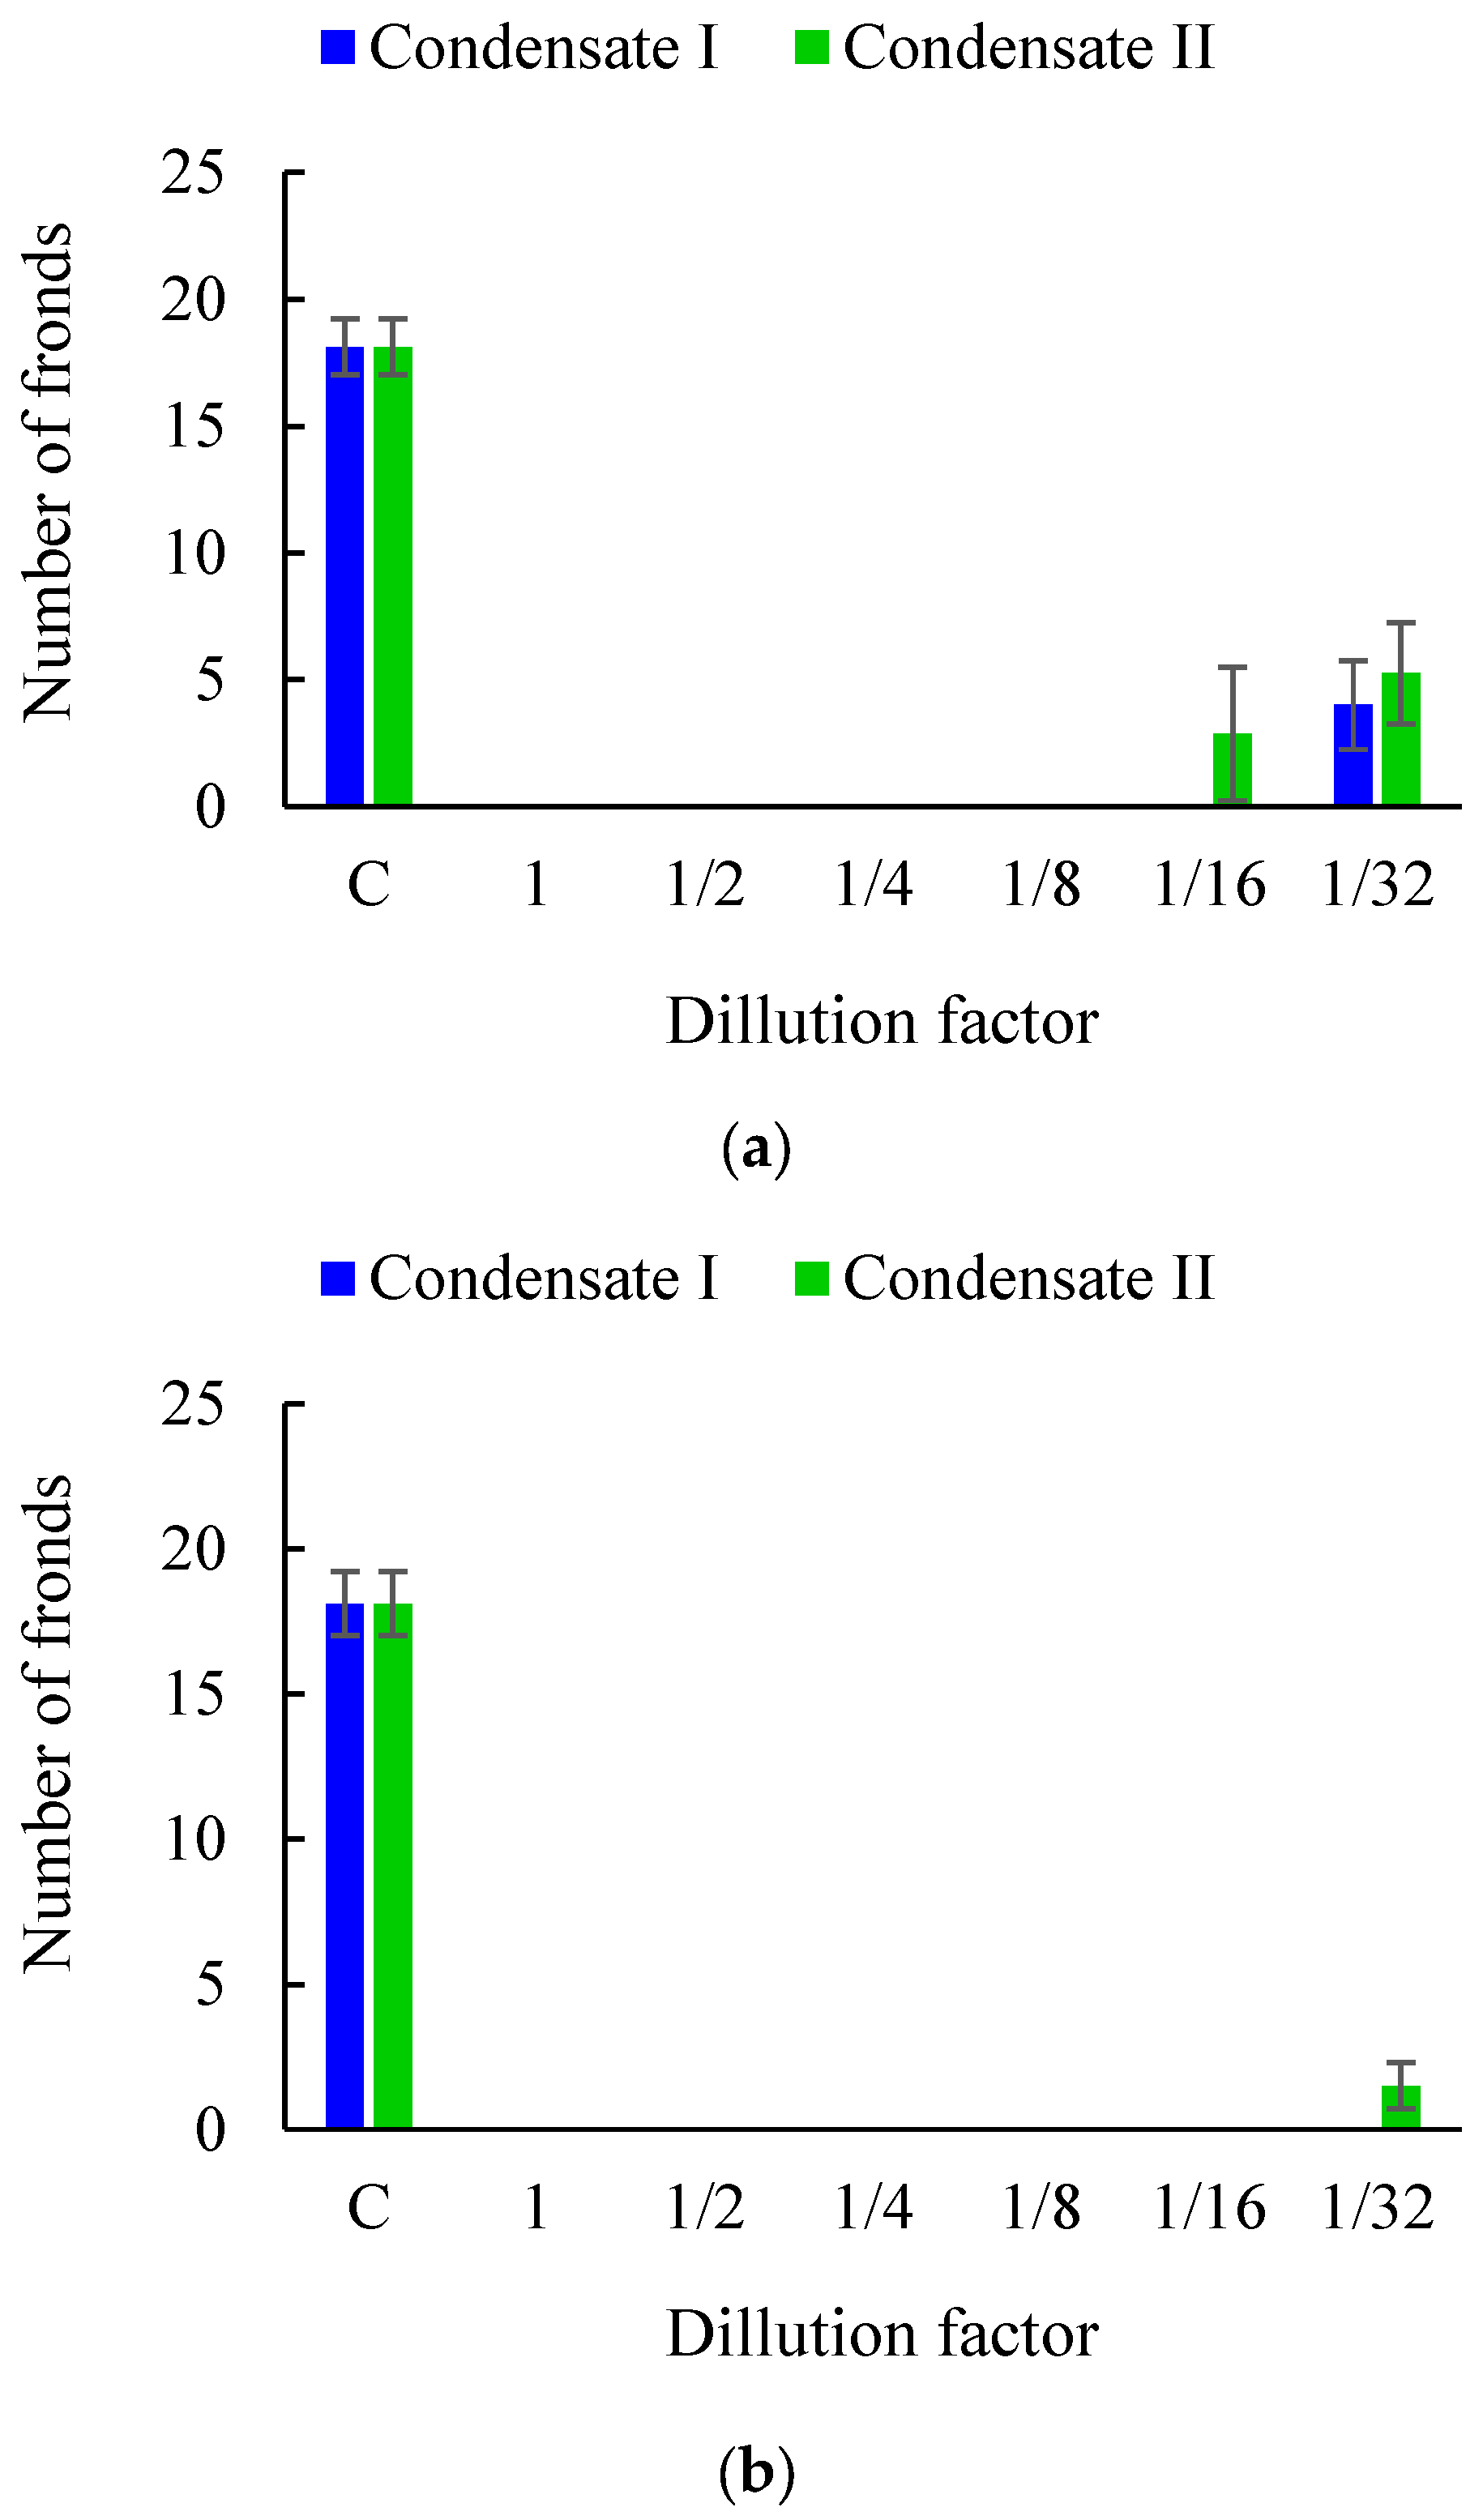
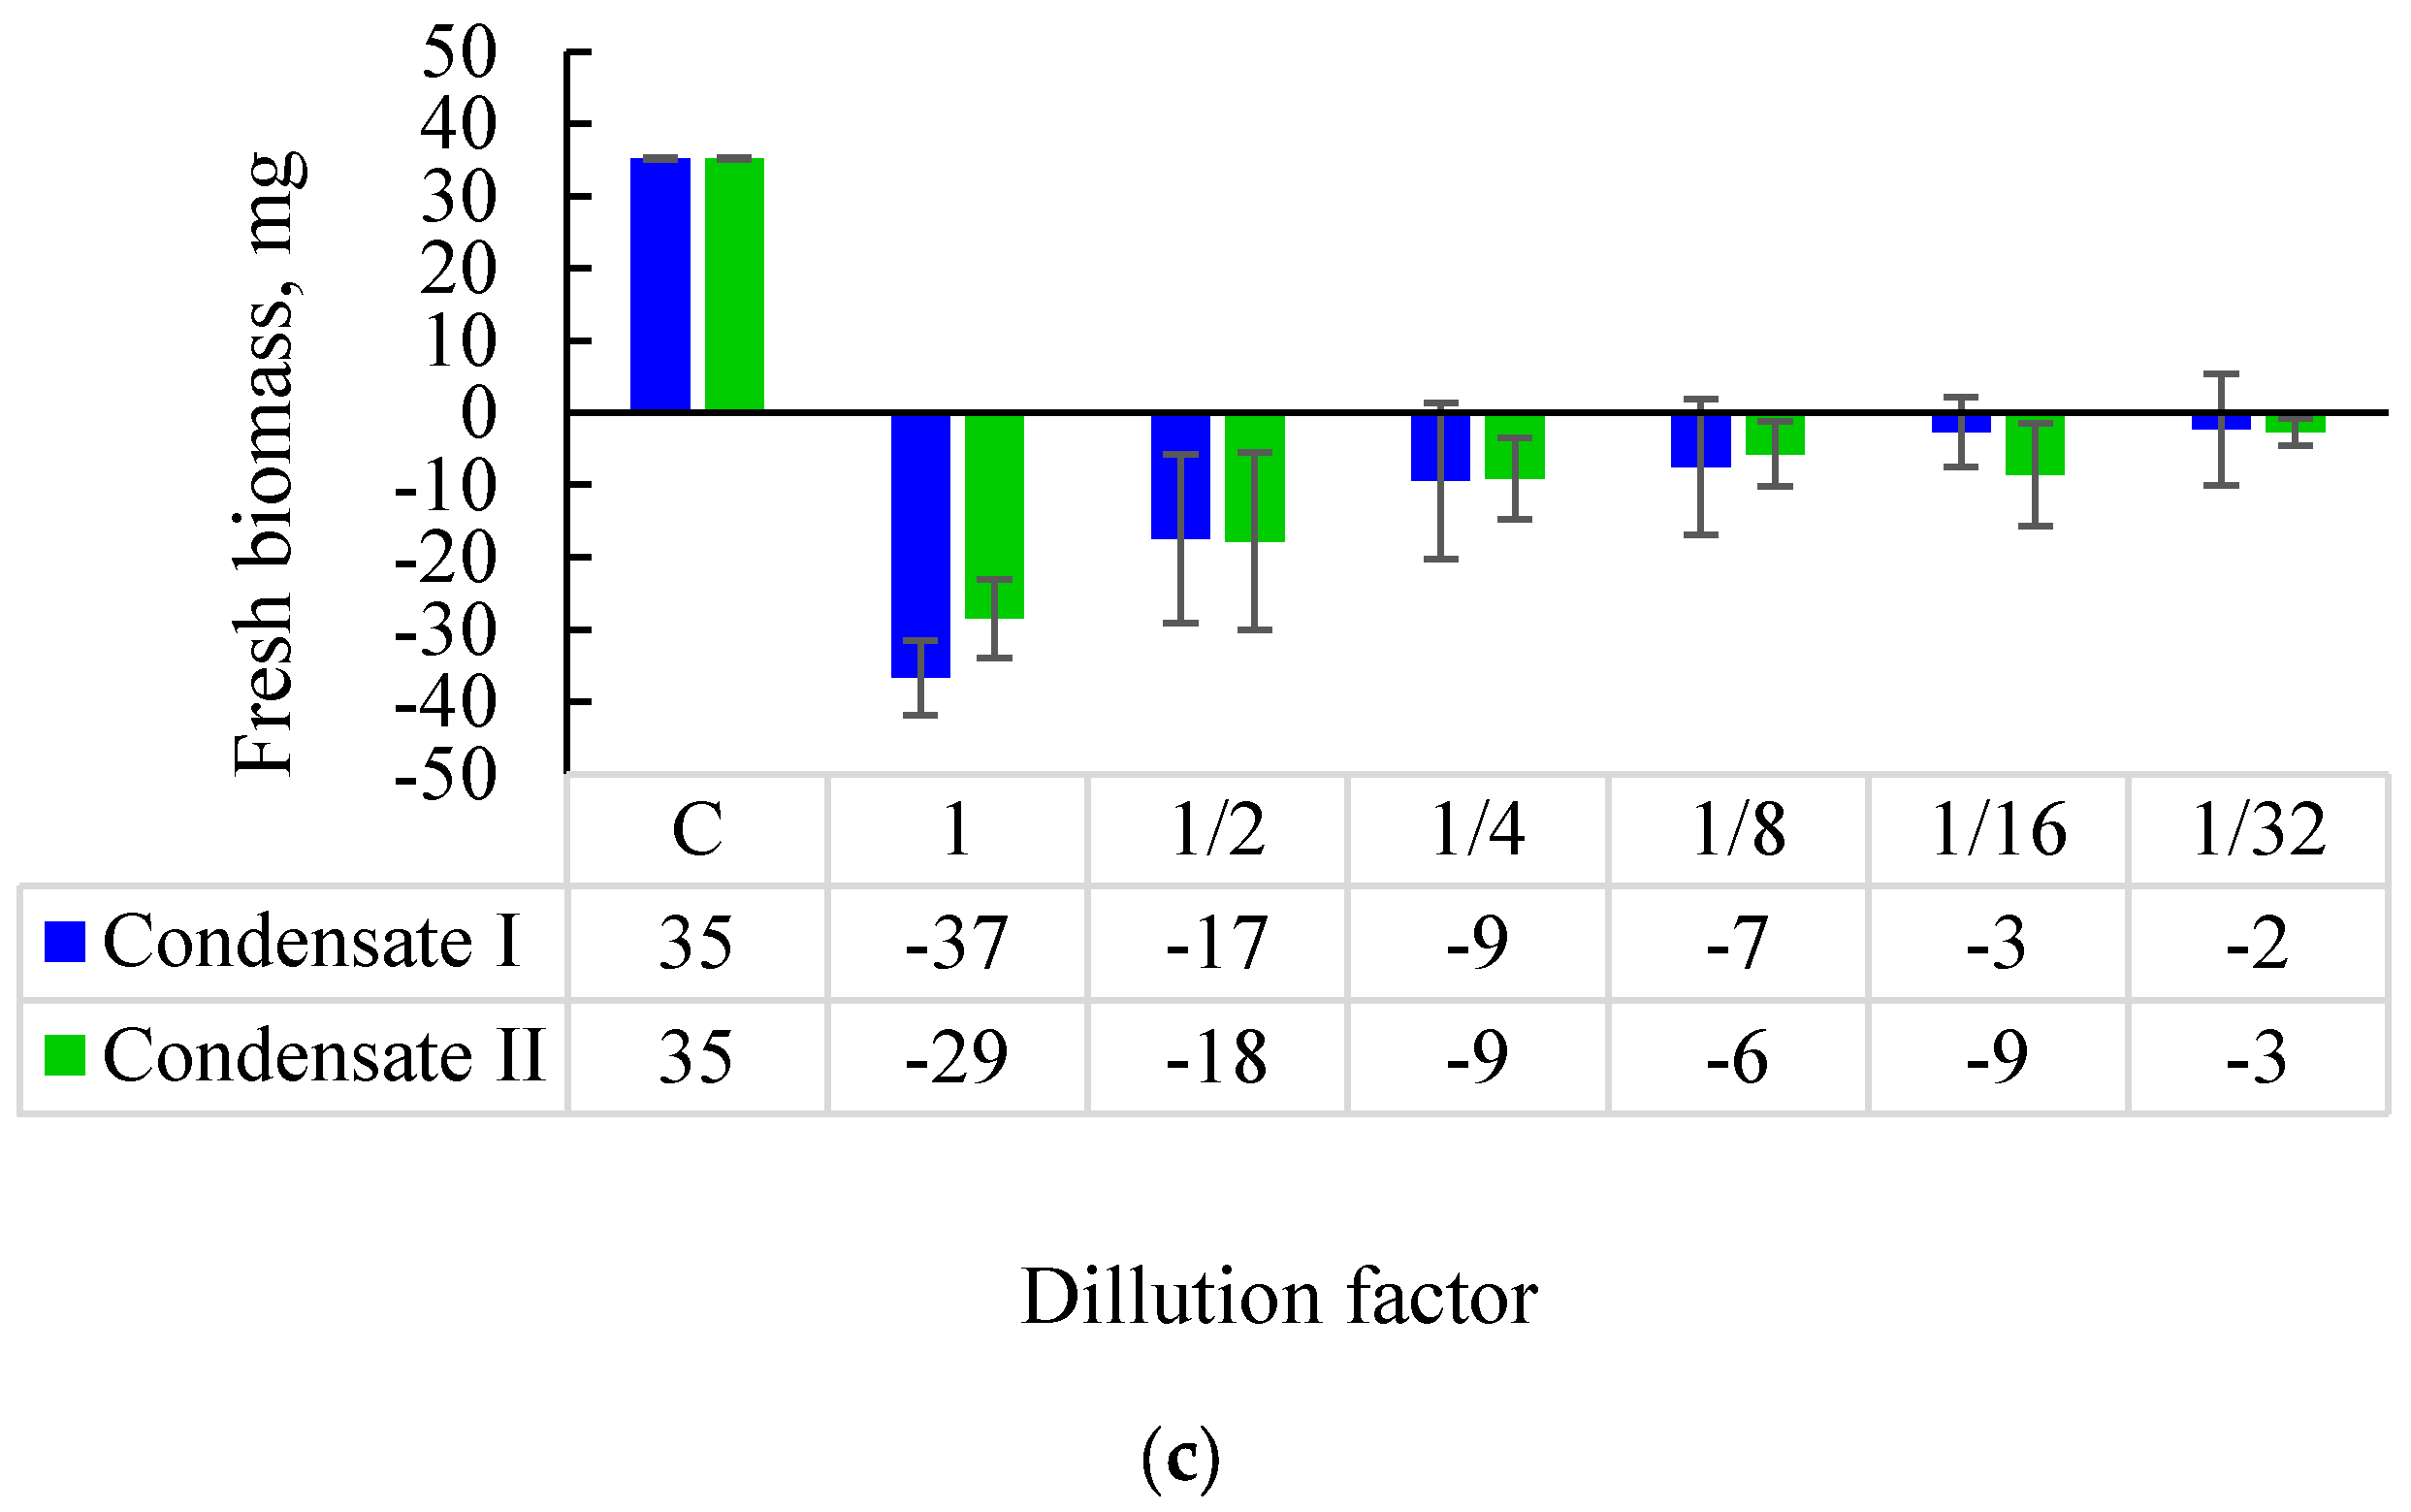
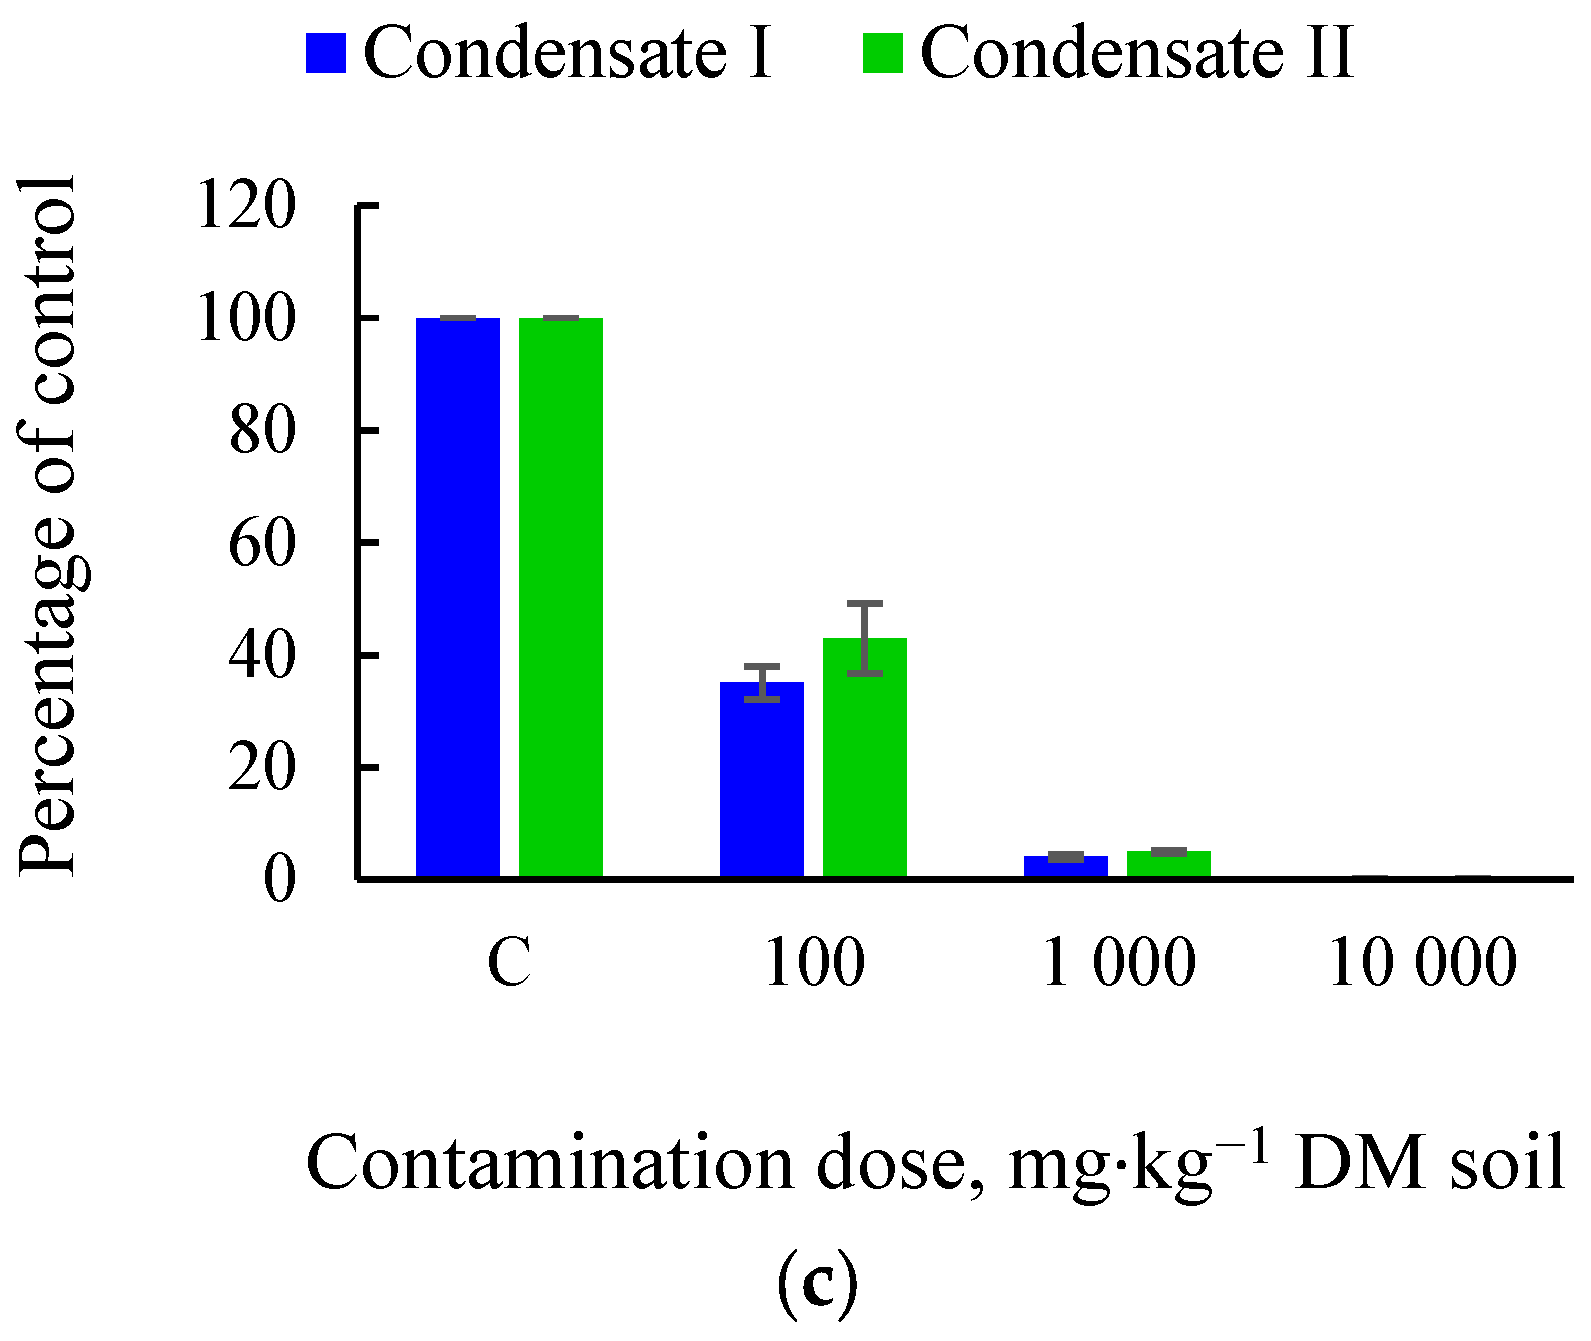
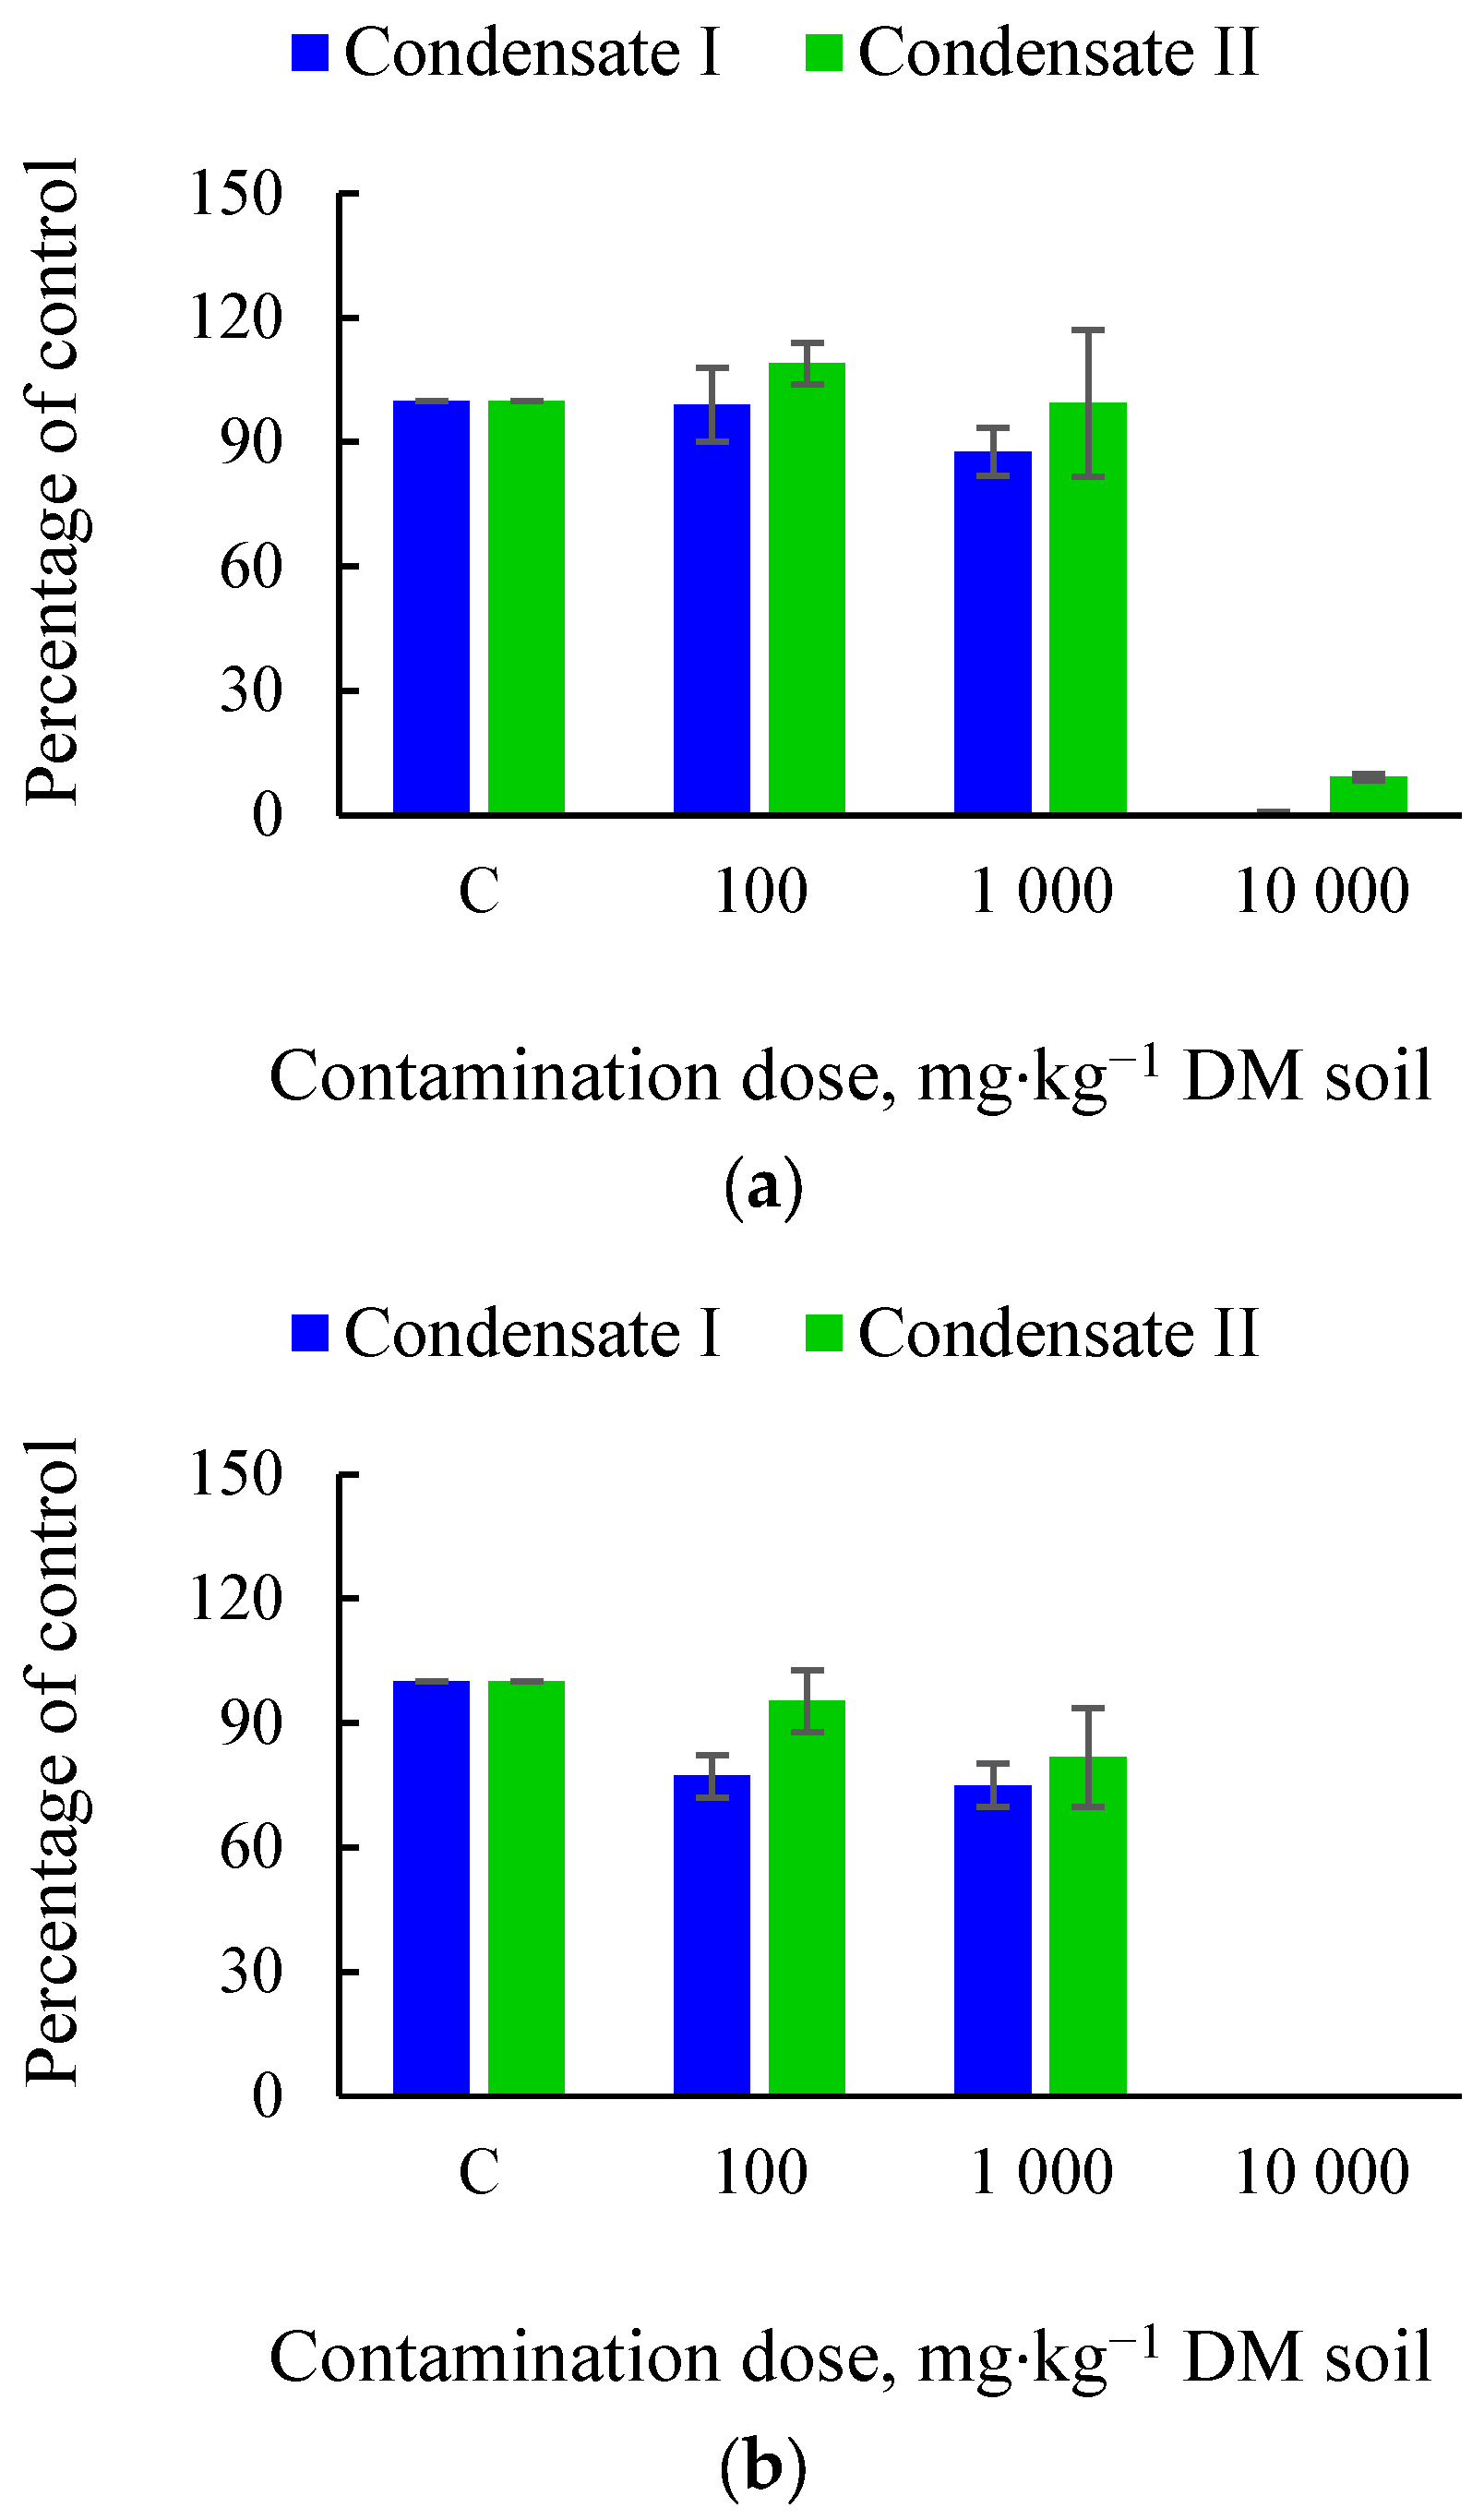
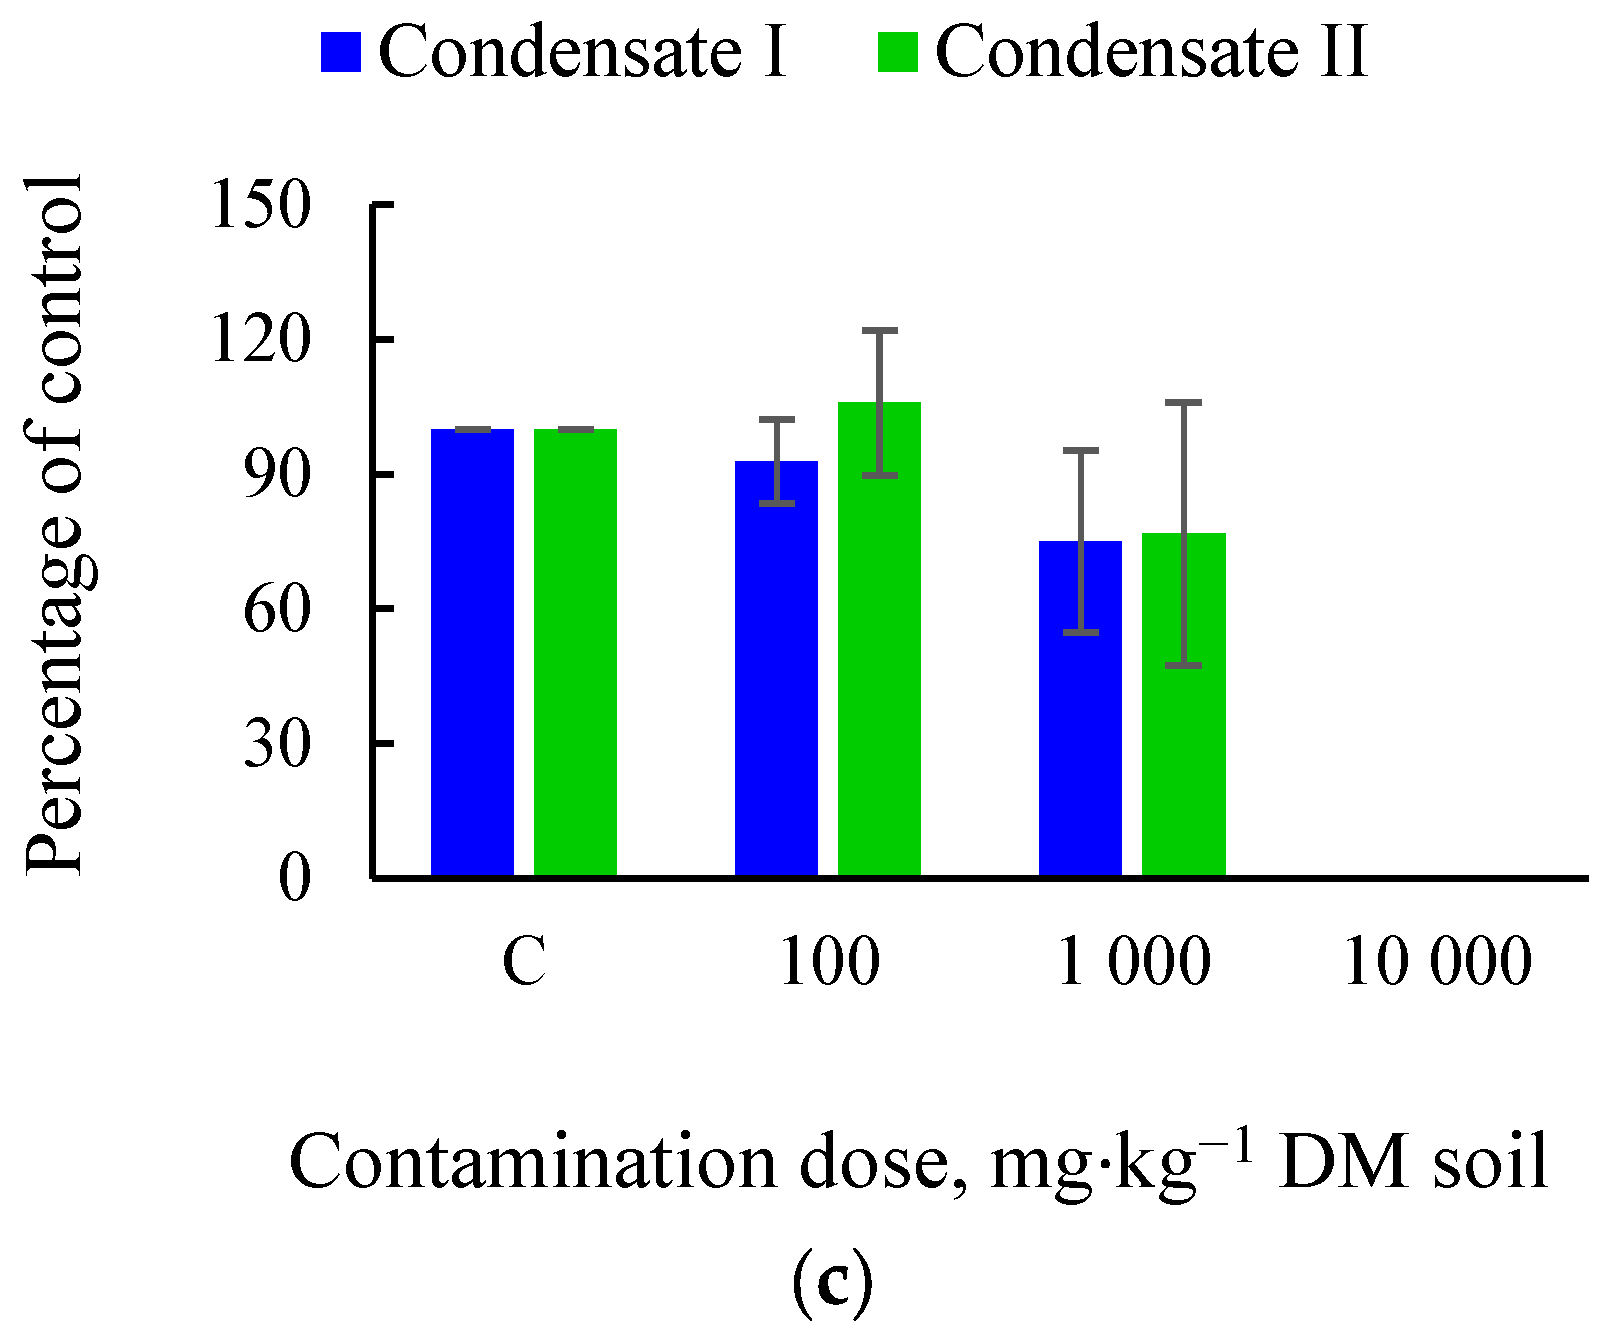
3.1. Effects of Soil Tar Contamination on Germination and Growth of Terrestrial Plants and Aquatic Organisms

The effect of soil contamination by condensate components on seed germination and root length of Sinapsis alba is shown in Figure 3. In the present study, seed germination correlated with the type of contamination and the dose at which tar was introduced into the soil. Seed germination is the first and most susceptible phase of plant growth to stress factors; therefore, bioassays analysing this parameter are successfully used to assess phytotoxicity levels [34,35,36]. In the presence of a dose of 100 mg·kg−1 DM soil, the determined values were 52–78% of the control values in tar-free soil for condensate from tank I and 58–84% for condensate from tank II. In soil contaminated with a dose of 1000 mg·kg−1 DM soil, the values were even lower, ranging from 23 to 50% for condensate I and 26 to 61% for condensate II. The negative impact on germination was higher when the condensate was derived from the gasification of a CF:PP mixture and under the influence of tar from the gasification of pine pellets (PPs). At the highest contamination dose (10,000 mg·kg−1 DM soil), germination inhibition was 100 per cent, except at the CF site for condensate II, where germination levels decreased by 98 per cent relative to the control site. Similar results were reported in an earlier study [25], which analysed the effect of pine pellet gasification tar on the seed germination of Sinapsis alba, Lepidium sativum, and Sorghum saccharatum. In this study, the ability of seeds to germinate in soil contaminated with liquid waste from the gasification process varied and was highly dependent on the plant species. The mechanism of the toxicity of tar components to plants is complex. Hydrocarbons can change the physical and chemical properties of soil, such as porosity, water retention, or pH [37,38]. In this way, unfavourable conditions for seed germination are created related to water uptake and gas exchange [39]. The availability of nutrients necessary for proper plant growth also changes [40].
The average root length in the control object was 38 mm. When individual condensates were introduced into the soil, this size decreased. The magnitude of the decrease was correlated with the dose of contamination. The greater the level of contamination, the greater the degree of reduction in root length. The type of substrate from which the condensate was derived was also necessary to study. In our study, the phytotoxicity for Sinapsis alba was as follows: PP tar > CR:PP tar > CR tar. The phytotoxic effects of liquid waste from the gasification process of, among others, cup plant (Silphium perfoliatum L.) pellets have been confirmed in earlier studies [41]. The adverse effects of tar on plants may be related to the composition of aromatic hydrocarbons. PAHs are particularly phytotoxic, as confirmed by studies by other authors [42]. They are persistent environmental pollutants and can have significant effects on soil and plant health [43]. PAHs can be absorbed by plant roots and moved to shoots, where they can interfere with e-cell processes [44]. Hydrocarbons can reduce oxidative stress in plants by producing reactive oxygen species (ROS), which can damage cellular components such as lipids, proteins, and nucleic acids [45]. In addition, they can form a hydrophobic layer around the roots [46], hindering the absorption of water and nutrients. In contaminated soil, limited root growth is also observed, associated with the high accumulation of pollutants in this part of the plant [47]. The response of plants to the presence of PAHs may not always be clear-cut because it depends on environmental conditions, including temperature and soil pH, and the physiological state of the plant, among other factors [48]. According to Gawryluk and Krzyszczak [49], young plants are more sensitive to harmful substances than older plants. The metabolic rate of young plants is higher compared to mature plants [50], so they are more susceptible to the absorption of pollutants and their accumulation in tissues. Resistance to oxidative stress caused by the presence of tar components in the soil may be lower due to still underdeveloped or immature defence mechanisms, e.g., lower levels of oxidants, which help mitigate the effects of ROS [51].
The contaminants, irrespective of the type of feedstock used in the gasification process and the contamination dose, had a negative impact on Lemna minor growth and development. Lemna minor is a plant often used in toxicity tests due to its high sensitivity to contaminants and its relatively simple cultivation and rapid growth [52]. Various parameters can be analysed in bioassays, including the growth rate, number of leaves, and chlorophyll content, thanks to which, the assessment of the level of toxicity can be comprehensive [53,54].
In our studies, symptoms of chlorosis were noted in all samples tested. Impurities could damage chloroplasts and reduce chlorophyll content, and this disturbed photosynthesis [55]. Chlorosis could also be the result of impaired absorption of nutrients, especially nitrogen, magnesium, and iron, important for chlorophyll production [56]. In samples with higher contamination concentrations, tissue damage was additionally noted. A significant increase in colony number and fronds was recorded only in the control sample (Figure 4). Slight changes were also noted in the presence of condensates from tank I and II for the CR site. The negative effect of tar components on the vegetative growth of Lemna minor was also noted in plant biomass measurements (Figure 5). Biomass reduction (%IB) in the presence of undiluted condensate samples ranged from 29 to 37%. The higher the dilution factor, the lower the level of growth inhibition, regardless of the type of contamination. Contaminant components can bind to the soil matrix, so their biological impact may be lower than that in the aquatic environment. The adverse effects of such contaminants entering the environment are also pointed out by Chidikofan et al. [57], who compared the effect of tar release from the gasification process of cotton stalks and rice husks to water and soil. Environmental impacts were analysed using the Life Cycle Assessment (LCA) method. The authors concluded that the environmental impact is more favourable for the conversion of rice and further confirmed that tar discharged into water has a higher environmental impact than that which enters the soil.
The results indicate that the negative effect of the tar components also persisted in the repeatedly diluted condensate, especially in the PP object. Biotests using Lemna minor are important for the assessment of pollutants in aquatic ecosystems. However, it is important to note that the conditions during laboratory testing may differ from natural conditions, e.g., with regard to water temperature or light level. In the environment, the sensitivity and response of Lemna minor to pollutants can vary depending on the availability of nutrients and competition from other aquatic organisms [58].

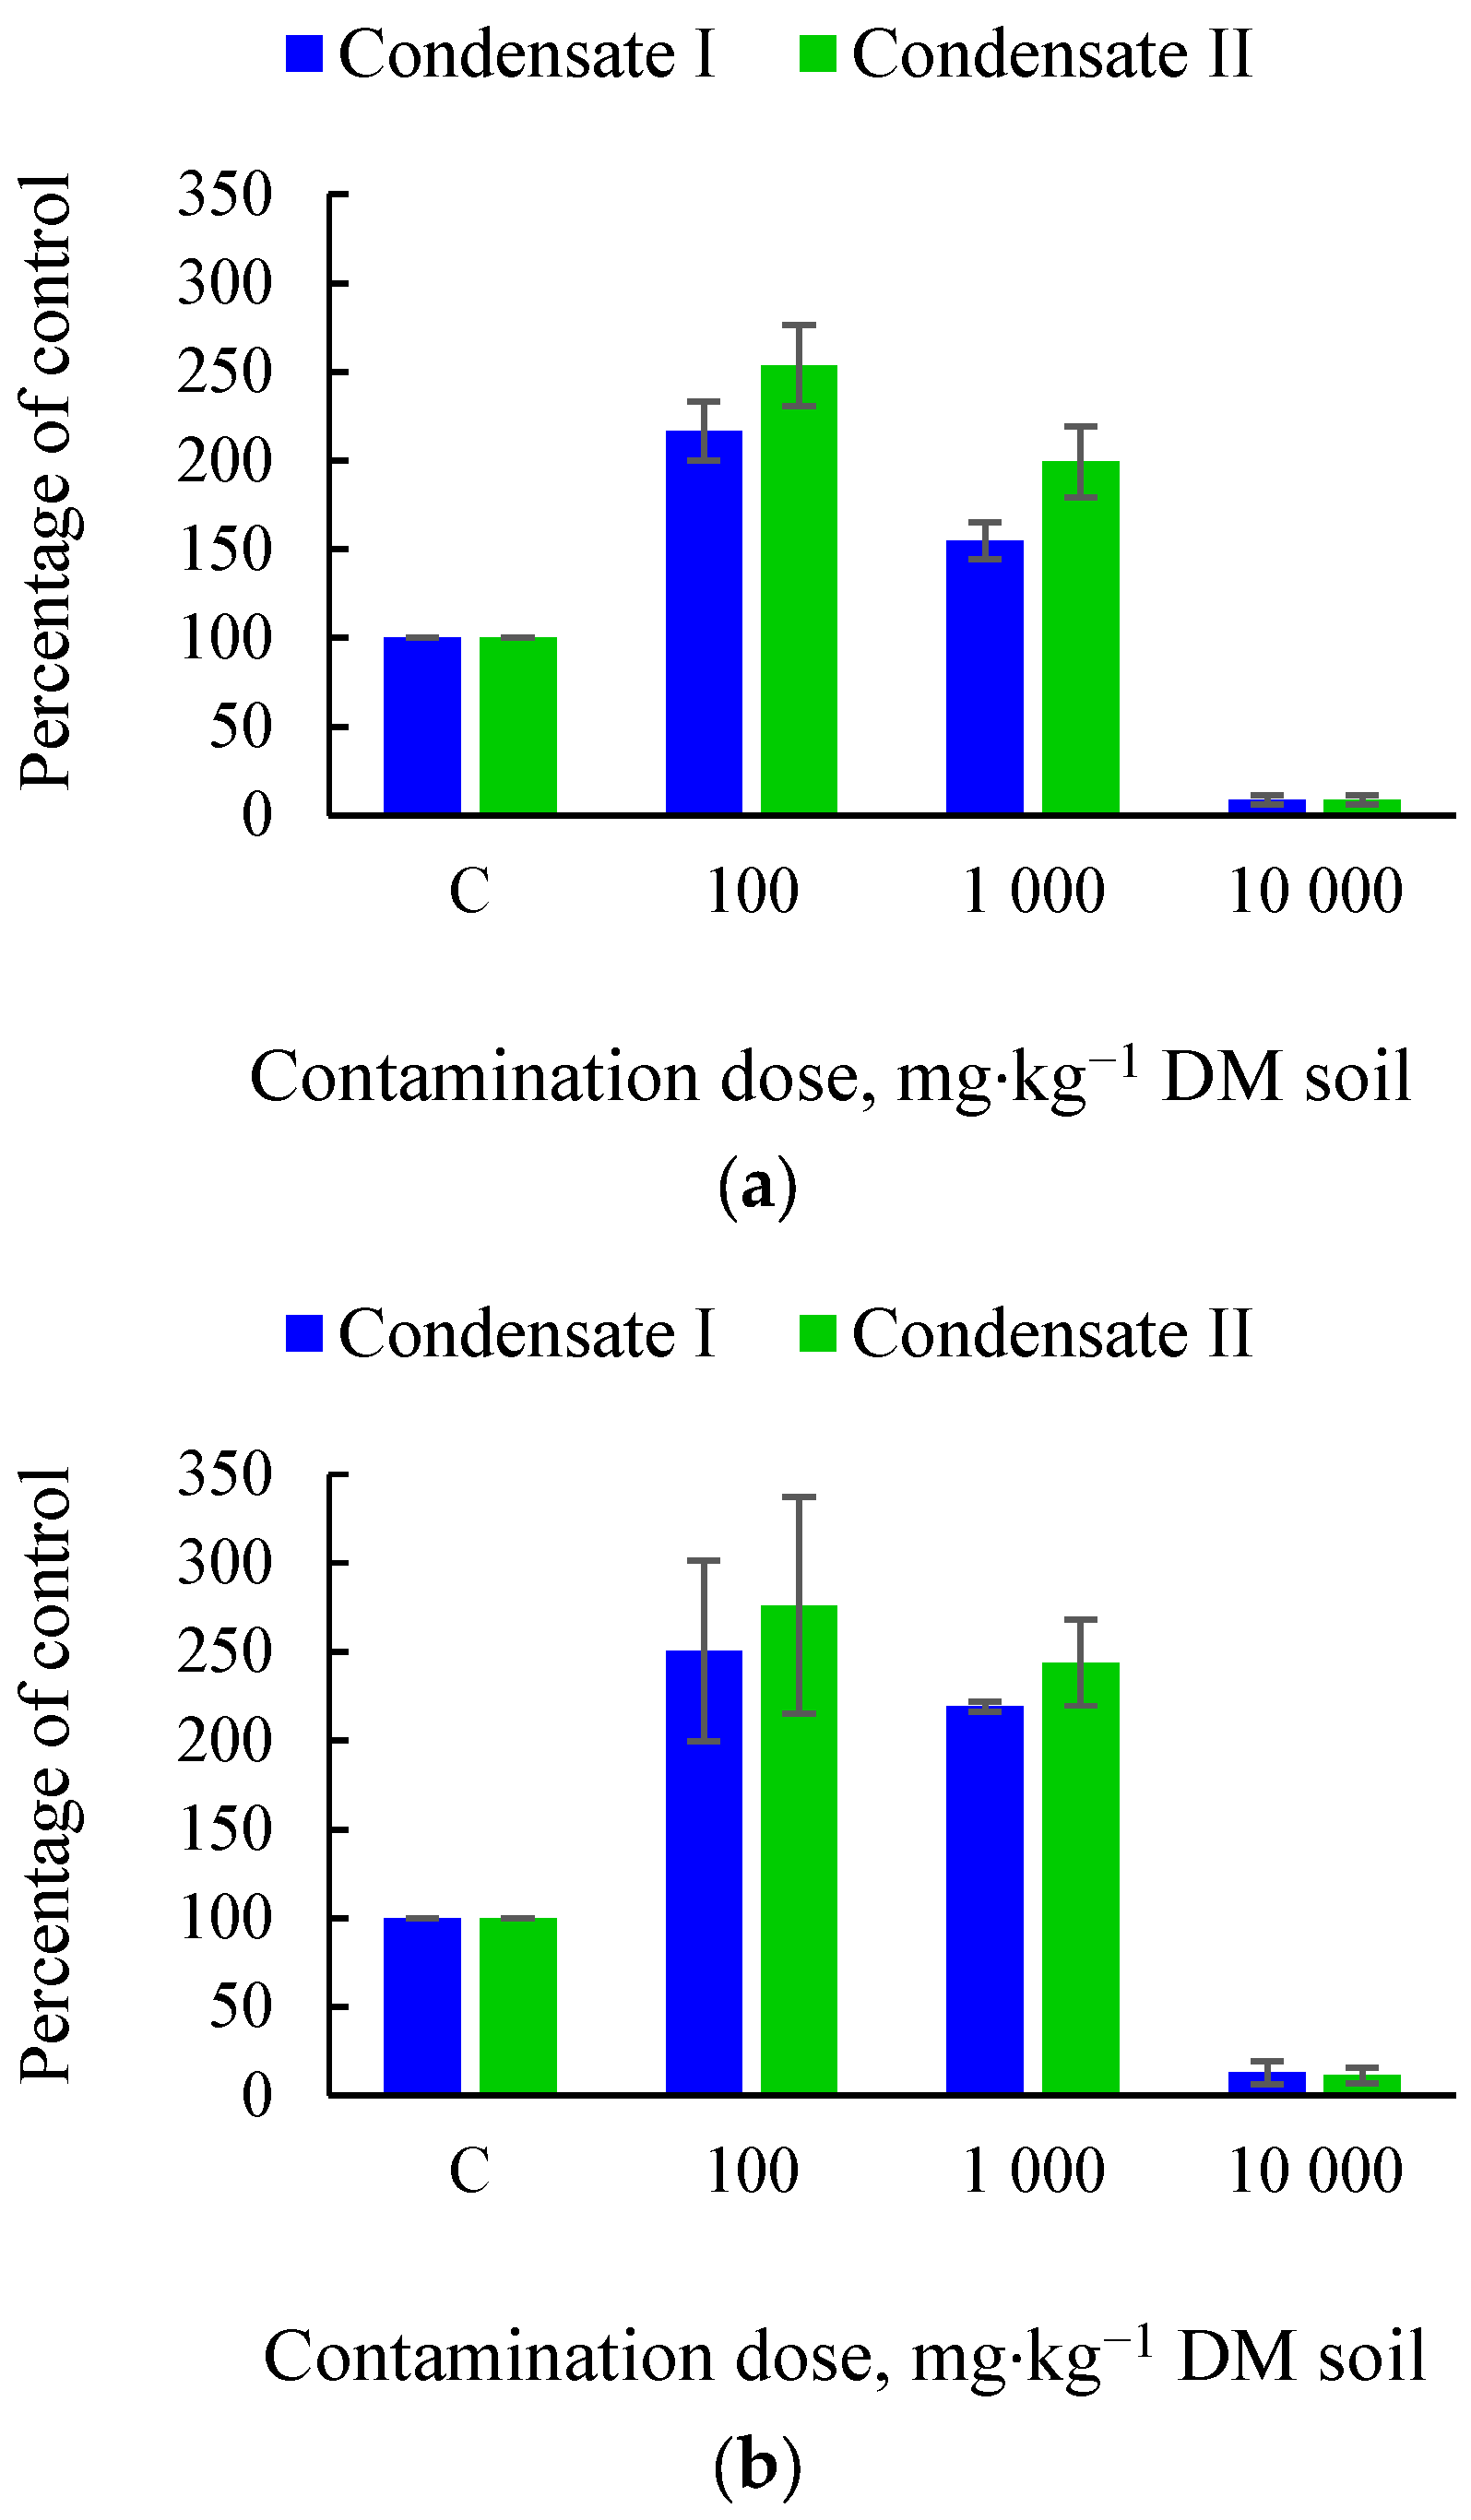
3.2. Impact of Tar on the Soil Microbiome and Soil Fertility

Changes in the soil microbiome’s qualitative and quantitative composition can disrupt the entire environment’s proper functioning [59] because microorganisms are responsible for the decomposition of organic matter in the soil and determine primary biogeochemical cycles [60,61]. Changes in the amount of primary taxonomic groups of soil microorganisms under the influence of condensate components are shown in Figure 6 for bacteria, Figure 7 for actinomycetes, and Figure 8 for fungi. Microorganisms are a sensitive indicator of soil health [62] and can be successfully used in biotests to assess the ecotoxicological impact of pollutants.
In the study presented here, bacteria were the most sensitive group of microorganisms. The numbers of these microorganisms decreased with increasing contamination dose and the type of substrate from which the tar was obtained. For the lowest dose of condensate introduced into the soil (100 mg·kg−1 DM soil), the reduction ranged from 1 to 3% in the CR treatment, from 41 to 46% for the CR:PP treatment, and from 57 to 65% for the PP treatment. The level of decrease for the dose of 1000 mg·kg−1 DM soil was much higher, and the determined abundance represented only 4 to 6% of the values determined in the control, uncontaminated soil. In the presence of tar at a dose of 10,000 mg·kg−1 DM soil, no bacterial growth was recorded (CR and PP object), or the determined amount was only 1% of the control values (C), regardless of whether condensate I or condensate II was introduced into the soil.
The number of actinomycetes in the tar-contaminated soil, relative to the control soil, was lower or higher, depending on the type of substrate from which the tar was obtained. A definite negative effect was observed in all sites after soil contamination with tar at a dose of 10 000 mg·kg−1 DM soil. Only in the presence of condensate from the gasification of coffee grounds was the amount of actinomycetes not reduced completely. In the soil where condensate from tank I was introduced, 1% of these microorganisms remained, and in the presence of condensate II, 9% remained compared to uncontaminated soil.
In the study, fungi were the least sensitive to tar in the soil. In tar-contaminated soil at a dose of 100 mg·kg−1 DM soil, fungal numbers were 117 and 154% higher for CR condensate, 150 and 176% higher for CR:PP condensate, and 184 and 175% higher for PP condensate from Reservoir I and II, respectively, compared to the control soil. A similar relationship was observed for 1000 mg·kg−1 DM soil. A significant decrease in amount was observed when the highest contamination dose was introduced into the soil, and the values obtained were between 9 and 13% of the control values for tars from tank I and 8 and 11% for tars from tank II.
A test conducted on the toxicity of tar to soil microorganisms indicates a significant negative impact. In our earlier study [24] using tar from wood chip gasification, the bacterial amount in contaminated soil was higher than in uncontaminated soil, and the effect on actinomycetes was dose-dependent, as for fungi. The differences noted may be due to the variable composition of the condensate, which depends on the substrate used for gasification and the type of gasifier. Temperature may also have been a variable parameter that significantly affects tar composition. The microbiological analysis was a short-term test showing the effect of the condensate immediately after its application to the soil. In order to assess whether the observed adverse changes in the microbiome will persist in the environment, it would be advisable to carry out long-term tests in the future.
In addition to physical and chemical parameters, the activity of microorganisms is essential for soil fertility, i.e., it determines the availability of many nutrients for plants [63,64]. The presence of condensate components in the soil caused changes in the quantitative composition of the tested taxonomic groups of microorganisms and, therefore, a change in the ratio of bacteria and actinomycetes to fungi, i.e., the value of the SR coefficient (Table 1). This coefficient measures soil fertility, and the values obtained in the present study indicate adverse changes caused by condensates in the soil. Higher coefficient values are found in soils with more favourable microbial properties [65]. As indicated by the results obtained, lower values indicate more robust fungal growth. In general, tar can reduce the number of beneficial microorganisms that support plant growth. Only species tolerant to the presence of tar components, including PAHs, can remain in the contaminated soil, which, however, leads to adverse changes in the structure of the microbial community. A reduction in the population of microorganisms and their activity causes disruption of the nutrient cycle and decomposition in organic matter [66]. Hydrocarbons can also inhibit the action of soil enzymes [67]. Any disturbance in the qualitative and quantitative composition of the soil microbiome, especially one that persists over a long period, is detrimental to the soil environment. Mitigating these effects and restoring soil health requires the implementation of remediation treatments.
Condensate components negatively affected all environmental parameters analysed; however, Ouedraogo et al. [68] analysed LCAs of two methods of municipal waste disposal, gasification and landfilling without energy recovery, and found that it was landfilling that contributed more to ecotoxicity.

4. Conclusions

Tar is a complex mixture of organic compounds that is formed as a by-product during the gasification process. Its composition varies depending on the raw material and gasification conditions. Tar contains aromatic hydrocarbons, including PAHs, and compounds containing nitrogen, sulphur, and oxygen. Tar formation is detrimental to the operation of gasification equipment, causes problems with the quality of syngas, and also poses an environmental challenge. Plants exposed to tar show slow growth and symptoms of chlorosis. Pollution also causes disturbances in the soil microbiome, limiting nutrient cycling and the decomposition of organic matter. Tar, and especially the PAHs it contains, is very persistent in the environment. Such pollutants need to be monitored in order to assess the impact on ecosystems and, where necessary, ensure that appropriate remediation measures are taken to ensure environmental protection. Tar toxicity analysis requires a multidisciplinary approach. The study demonstrated the toxic effects of tar from the gasification process on soil microorganisms, aquatic microorganisms, and terrestrial plant growth. The type of contamination and its dose significantly affected the numbers of the various groups of soil microorganisms. Bacteria were the most sensitive to tar in the soil, while fungi were the least sensitive group. A 10,000 mg·kg−1 DM soil dose for all microorganisms was particularly toxic. The fertility of tar-contaminated soil was significantly reduced at the lowest tar dose of 100 mg·kg−1 DM soil. Tar reduced the number of germinating seeds and caused a reduction in plant root length from the lowest dose, regardless of the type of condensate, including the substrate for the gasification process and the tank from which the leachate was collected. The ecotoxicity of the tar for aquatic macrophytes was higher than for terrestrial plants. Tar from pine pellet gasification mostly had a more toxic effect than tar from coffee grounds.
Advances in thermochemical technologies, including gasification, should enhance the environmental benefits of biomass, including organic waste. The optimisation of process conditions and the proper management of the waste generated during gasification is critical. It is essential if the process is to be a future means of sustainable energy and chemical production.

Author Contributions

Conceptualisation, M.H.-P. and A.K.; methodology, M.H.-P. and A.K.; validation, M.H.-P., A.K., A.B., Z.S., W.R., G.Z. and J.S.-B.; formal analysis, M.H.-P. and A.K.; writing—original draft preparation, M.H.-P. and A.K.; writing—review and editing, M.H.-P. and A.K.; visualisation, M.H.-P.; supervision, M.H.-P., A.K., A.B., Z.S., W.R., G.Z. and J.S.-B. All authors have read and agreed to the published version of the manuscript.

Funding

This research received no external funding.

Institutional Review Board Statement

Not applicable.

Informed Consent Statement

Not applicable.

Data Availability Statement

Data are contained within the article.

Conflicts of Interest

The authors declare no conflicts of interest.

References

  1. Islam, A.K.M.S.; Ahiduzzaman, M. Biomass Energy: Sustainable Solution for Greenhouse Gas Emission. The 4th International Meeting of Advances in Thermofluids (IMAT 2011). AIP Conf. Proc. 2012, 1440, 23–32. [Google Scholar] [CrossRef]
  2. Abbasi, T.; Abbasi, S.A. Biomass energy and the environmental impacts associated with its production and utilization. Renew. Sustain. Energy Rev. 2010, 14, 919–937. [Google Scholar] [CrossRef]
  3. Demirbas, M.F.; Balat, M.; Balat, H. Potential contribution of biomass to the sustainable energy development. Energy Convers. Manag. 2009, 50, 1746–1760. [Google Scholar] [CrossRef]
  4. Harrison, S.P.; Bartlein, P.J.; Brovkin, V.; Houweling, S.; Kloster, S.; Prentice, I.C. The biomass burning contribution to climate-carbon-cycle feedback. Earth Syst. Dyn. 2018, 9, 663–677. [Google Scholar] [CrossRef]
  5. Álvarez, C.; Reyes-Sosa, F.M.; Díez, B. Enzymatic hydrolysis of biomass from wood. Microb. Biotechnol. 2016, 9, 149–156. [Google Scholar] [CrossRef] [PubMed]
  6. Tazikeh, S.; Zendehboudi, S.; Ghafoori, S.; Lohi, A.; Mahinpey, N. Algal bioenergy production and utilization: Technologies, challenges, and prospects. J. Environ. Chem. Eng. 2022, 10, 107863. [Google Scholar] [CrossRef]
  7. Sarangi, P.K.; Subudhi, S.; Bhatia, L.; Saha, K.; Mudgil, D.; Shadangi, K.P.; Srivastava, R.K.; Pattnaik, B.; Arya, R.K. Utilization of agricultural waste biomass and recycling toward circular bioeconomy. Environ. Sci. Pollut. Res. 2023, 30, 8526–8539. [Google Scholar] [CrossRef]
  8. Greinert, A.; Mrówczyńska, M.; Szefner, W. The use of waste biomass from the wood industry and municipal sources for energy production. Sustainability 2019, 11, 3083. [Google Scholar] [CrossRef]
  9. Alizadeh, P.; Tabil, L.G.; Mupondwa, E.; Li, X.; Cree, D. Technoeconomic Feasibility of Bioenergy Production from Wood Sawdust. Energies 2023, 16, 1914. [Google Scholar] [CrossRef]
  10. Omer, A.M. Organic waste treatment for power production and energy supply. J. Cell Anim. Biol. 2007, 1, 034–047. Available online: http://www.academicjournals.org/JCAB (accessed on 23 January 2018).
  11. Ju, X.; Zhang, F.; Bao, X.; Römheld, V.; Roelcke, M. Utilization and management of organic wastes in Chinese agriculture: Past, present and perspectives. Sci. China Ser. C Life Sci. 2005, 48, 965–979. [Google Scholar] [CrossRef]
  12. Yılmaz, S.; Selim, H. A review on the methods for biomass to energy conversion systems design. Renew. Sustain. Energy Rev. 2013, 25, 420–430. [Google Scholar] [CrossRef]
  13. Adams, P.; Bridgwater, T.; Lea-Langton, A.; Ross, A.; Watson, I. Chapter 8—Biomass Conversion Technologies. In Greenhouse Gas Balances of Bioenergy Systems; Thornley, P., Adams, P., Eds.; Academic Press: New York, NY, USA, 2018; pp. 107–139. [Google Scholar]
  14. Osman, A.I.; Mehta, N.; Elgarahy, A.M.; Al-Hinai, A.; Al-Muhtaseb, A.; Rooney, D.W. Conversion of biomass to biofuels and life cycle assessment: A review. Environ. Chem. Lett. 2021, 19, 4075–4118. [Google Scholar] [CrossRef]
  15. Pang, S. Advances in thermochemical conversion of woody biomass to energy, fuels and chemicals. Biotechnol. Adv. 2019, 37, 589–597. [Google Scholar] [CrossRef] [PubMed]
  16. Prasad, S.B. Biomass-Fired Steam Power Cogeneration System: A Theoretical Study. Energy Convers. Manag. 1995, 1, 65–77. [Google Scholar] [CrossRef]
  17. Babu, B.V. Biomass pyrolysis: A state-of-the-art review. Biofuels Bioprod. Biorefin. 2008, 2, 393–414. [Google Scholar] [CrossRef]
  18. Gruber, H.; Groß, P.; Rauch, R.; Reichhold, A.; Zweiler, R.; Aichernig, C.; Müller, S.; Ataimisch, N.; Hofbauer, H. Fischer-Tropsch products from biomass-derived syngas and renewable hydrogen. Biomass Convers. Biorefin. 2021, 11, 2281–2292. [Google Scholar] [CrossRef]
  19. Han, J.; Kim, H. The reduction and control technology of tar during biomass gasification/pyrolysis: An overview. Renew. Sustain. Energy Rev. 2008, 12, 397–416. [Google Scholar] [CrossRef]
  20. Wang, Y.; Yoshikawa, K.; Namioka, T.; Hashimoto, Y. Performance optimization of two-staged gasification system for woody biomass. Fuel Process. Technol. 2007, 88, 243–250. [Google Scholar] [CrossRef]
  21. Devi, L.; Ptasinski, K.J.; Janssen, F.J.J.G.; van Paasen, S.V.B.; Bergman, P.C.A.; Kiel, J.H.A. Catalytic decomposition of biomass tars: Use of dolomite and untreated olivine. Renew. Energy 2005, 30, 565–587. [Google Scholar] [CrossRef]
  22. Simell, P.; Hannula, I.; Tuomi, S.; Nieminen, M.; Kurkela, E.; Hiltunen, I.; Kaisalo, N.; Kihlman, J. Clean syngas from biomass-process development and concept assessment. Biomass Convers. Biorefin. 2014, 4, 357–370. [Google Scholar] [CrossRef]
  23. Menya, E.; Olwa, J.; Hagström, P.; Okure, M. Assessment of pollution levels resulting from biomass gasification. J. Environ. Chem. Eng. 2014, 2, 1228–1235. [Google Scholar] [CrossRef]
  24. Hawrot-Paw, M.; Koniuszy, A.; Mikiciuk, M.; Izwikow, M.; Stawicki, T.; Sędłak, P. Analysis of ecotoxic influence of waste from the biomass gasification process. Environ. Sci. Pollut. Res. Int. 2017, 24, 15022–15030. [Google Scholar] [CrossRef] [PubMed]
  25. Hawrot-Paw, M.; Zmuda, A.; Koniuszy, A. Thermochemical biomass conversion processes and their impact on the environment. Przem. Chem. 2019, 98, 1126–1129. [Google Scholar]
  26. Operating Instruction. Available online: http://www.mru-instruments.pl/produkty/analizatory-przemyslowe/varioplus-iv (accessed on 23 January 2018). (In Polish).
  27. PN-EN 50379-1:2013-03; Requirements for Portable Electrical Instruments for Measuring Exhaust Gas Parameters of Heating Devices. Part 1. Basic Requirements and Test Methods/Requirements for Portable Electrical Instruments for Measuring Exhaust Gas Parameters of Heating Devices. Th. 1. Basic Requirements and Test Methods. Available online: https://sklep.pkn.pl/catalogsearch/advanced (accessed on 21 September 2020). (In Polish).
  28. OECD. Test No. 221: Lemna sp. Growth Inhibition Test; OECD: Paris, France, 2006. [Google Scholar]
  29. Steinberg, R.A. Mineral requirements of Lemna minor. Plant Physiol. 1946, 21, 42–48. [Google Scholar] [CrossRef] [PubMed]
  30. Bunt, J.S.; Rovira, A.D. Microbiological studies of some subantarctic soils. J. Soil Sci. 1955, 6, 119–128. [Google Scholar] [CrossRef]
  31. Cyganov, V.A.; Žukov, R.A. Morfologobiohimičiskie osobennosti novovo vida actionomiceta. Mikrobiologiâ 1964, 33, 863–869. [Google Scholar]
  32. Martin, J.P. Use of acid rose bengale and streptomycin in the plate method for estimating soil fungi. Soil Sci. 1950, 6, 215–233. [Google Scholar] [CrossRef]
  33. Myśków, W. Attempts to use indicators of microbial activity to assess soil fertility. Post. Microbiol. 1981, 3–4, 173–192. (In Polish) [Google Scholar]
  34. Siddiqui, S.; Adams, W.A. The fate of diesel hydrocarbons in soils and their effect on the germination of perennial ryegrass. Environ. Toxicol. 2002, 17, 49–62. [Google Scholar] [CrossRef]
  35. Maila, M.P.; Cleote, T.E. Germination of Lepidium sativum as a method to evaluate polycyclic aromatic hydrocarbons (PAHs) removal from contaminated soil. Int. Biodeterior. Biodegrad. 2002, 50, 107–113. [Google Scholar] [CrossRef]
  36. Serrano, A.; Tejada, M.; Gallego, M.; Gonzalez, J.L. Evaluation of soil biological activity after a diesel fuel spill. Sci. Total Environ. 2009, 407, 4056–4061. [Google Scholar] [CrossRef] [PubMed]
  37. Devatha, C.P.; Vishnu Vishal, A.; Purna Chandra Rao, J. Investigation of physical and chemical characteristics on soil due to crude oil contamination and its remediation. Appl. Water Sci. 2019, 9, 89. [Google Scholar] [CrossRef]
  38. Ekanem, A.N.; Osabor, V.N.; Ekpo, B.O. Polycyclic aromatic hydrocarbons (PAHs) contamination of soils and water around automobile repair workshops in Eket metropolis, Akwa Ibom State, Nigeria. SN Appl. Sci. 2019, 1, 447. [Google Scholar] [CrossRef]
  39. Smith, M.J.; Flowers, T.H.; Duncan, H.J.; Alder, J. Effects of polycyclic aromatic hydrocarbons on germination and subsequent growth of grasses and legumes in freshly contaminated soil and soil with aged PAHs residues. Environ. Pollut. 2006, 141, 519–525. [Google Scholar] [CrossRef]
  40. Yang, X.; Hu, Z.; Liu, Y.; Xie, X.; Huang, L.; Zhang, R.; Dong, B. Effect of pyrene-induced changes in root activity on growth of Chinese cabbage (Brassica campestris L.), and the health risks caused by pyrene in Chinese cabbage at different growth stages. Chem. Biol. Technol. Agric. 2022, 9, 7. [Google Scholar] [CrossRef]
  41. Koniuszy, A.; Hawrot-Paw, M.; Podsiadło, C.; Sędłak, P.; Możdżer, E. Gasification of Cup Plant (Silphium perfoliatum L.) Biomass-Energy Recovery and Environmental Impacts. Energies 2020, 13, 4960. [Google Scholar] [CrossRef]
  42. Henner, P.; Schiavon, M.; Druelle, V.; Lichtfouse, E. Phytotoxicity of Ancient Gaswork Soils. Effect of Polycyclic Aromatic Hydrocarbons (PAHs) on Plant Germination. Org. Geochem. 1999, 30, 963–969. [Google Scholar] [CrossRef]
  43. Patel, A.B.; Shaikh, S.; Jain, K.R.; Desai, C.; Madamwar, D. Polycyclic Aromatic Hydrocarbons: Sources, Toxicity, and Remediation Approaches. Front. Microbiol. 2020, 11, 562813. [Google Scholar] [CrossRef]
  44. Liu, S.; Liu, N.; Lu, H.; Zhu, L. Disturbed phospholipid metabolism by three polycyclic aromatic hydrocarbons in Oryza sativa. Environ. Pollut. 2021, 283, 117073. [Google Scholar] [CrossRef]
  45. Shen, Y.; Li, J.; Gu, R.; Yue, L.; Wang, H.; Zhan, X.; Xing, B. Carotenoid and superoxide dismutase are the most effective antioxidants participating in ROS scavenging in phenanthrene accumulated wheat leaf. Chemosphere 2018, 197, 513–525. [Google Scholar] [CrossRef]
  46. Li, N.; Możdżeń, K.; Zhang, Z.; Liu, C.; Zandi, P.; Sardar, M.F.; Zhu, C. Rhizosphere effect on removal and bioavailability of PAHs in contaminated agricultural soil. Biologia 2021, 76, 841–851. [Google Scholar] [CrossRef]
  47. Ailijiang, N.; Zhong, N.; Zhou, X.; Mamat, A.; Chang, J.; Cao, S.; Hua, Z.; Li, N. Levels, sources, and risk assessment of PAHs residues in soil and plants in urban parks of Northwest China. Sci. Rep. 2022, 12, 21448. [Google Scholar] [CrossRef]
  48. Molina, L.; Segura, A. Biochemical and Metabolic Plant Responses toward Polycyclic Aromatic Hydrocarbons and Heavy Metals Present in Atmospheric Pollution. Plants 2021, 10, 2305. [Google Scholar] [CrossRef] [PubMed]
  49. Gawryluk, A.; Krzyszczak, J. Effects of Polycyclic Aromatic Hydrocarbons on Germination and Initial Growth of Selected Lawn Grass Species in Soil Polluted with PAHs. J. Ecol. Eng. 2024, 25, 175–186. [Google Scholar] [CrossRef] [PubMed]
  50. Kanojia, A.; Shrestha, D.K.; Dijkwel, P.P. Primary metabolic processes as drivers of leaf ageing. Cell. Mol. Life Sci. 2021, 78, 6351–6364. [Google Scholar] [CrossRef]
  51. Hasanuzzaman, M.; Bhuyan, M.H.M.B.; Zulfiqar, F.; Raza, A.; Mohsin, S.M.; Mahmud, J.A.; Fujita, M.; Fotopoulos, V. Reactive Oxygen Species and Antioxidant Defense in Plants under Abiotic Stress: Revisiting the Crucial Role of a Universal Defense Regulator. Antioxidants 2020, 9, 681. [Google Scholar] [CrossRef]
  52. Thingujam, D.; Pajerowska-Mukhtar, K.M.; Mukhtar, M.S. Duckweed: Beyond an Efficient Plant Model System. Biomolecules 2024, 14, 628. [Google Scholar] [CrossRef] [PubMed]
  53. Zezulka, S.; Kummerová, M.; Babula, P.; Váňová, L. Lemna minor exposed to fluoranthene: Growth, biochemical, physiological and histochemical changes. Aquat. Toxicol. 2013, 140–141, 37–47. [Google Scholar] [CrossRef]
  54. Park, J.; Yoo, E.-J.; Shin, K.; Depuydt, S.; Li, W.; Appenroth, K.-J.; Lillicrap, A.D.; Xie, L.; Lee, H.; Kim, G.; et al. Interlaboratory Validation of Toxicity Testing Using the Duckweed Lemna minor Root-Regrowth Test. Biology 2022, 11, 37. [Google Scholar] [CrossRef]
  55. Arellano, P.; Tansey, K.; Balzter, H.; Boyd, D.S. Detecting the effects of hydrocarbon pollution in the Amazon forest using hyperspectral satellite images. Environ. Pollut. 2015, 205, 225–239. [Google Scholar] [CrossRef]
  56. Li, J.; Cao, X.; Jia, X.; Liu, L.; Cao, H.; Qin, W.; Li, M. Iron Deficiency Leads to Chlorosis through Impacting Chlorophyll Synthesis and Nitrogen Metabolism in Areca catechu L. Front. Plant Sci. 2021, 12, 710093. [Google Scholar] [CrossRef]
  57. Chidikofan, G.; Benoist, A.; Sawadogo, M.; Volle, G.; Valette, J.; Coulibaly, Y.; Pailhes, J.; Pinta, F. Assessment of environmental impacts of tar releases from a biomass gasifier power plant for decentralized electricity generation. Energy Procedia 2017, 118, 158–163. [Google Scholar] [CrossRef]
  58. Paolacci, S.; Harrison, S.; Jansen, M.A.K. A comparative study of the nutrient responses of the invasive duckweed Lemna minuta, and the native, co-generic species Lemna minor. Aquat. Bot. 2016, 134, 47–53. [Google Scholar] [CrossRef]
  59. Wagg, C.; Bender, S.F.; Widmer, F.; van der Heijden, M.G.A. Soil biodiversity and soil community composition determine ecosystem multifunctionality. Proc. Natl. Acad. Sci. USA 2014, 111, 5266–5270. [Google Scholar] [CrossRef]
  60. Winding, A.; Hund-Rinke, K.; Rutgers, M. The use of microorganisms in ecological soil classification and assessment concepts. Ecotoxicol. Environ. Saf. 2005, 62, 230–248. [Google Scholar] [CrossRef]
  61. Haynes, R.J. Soil organic matter quality and the size and activity of the microbial biomass: Their significance to the quality of agricultural soils. In Soil Mineral-Microbe Organic Interactions: Theories and Applications; Huang, Q., Huang, P.M., Violante, A., Eds.; Springer: Berlin/Heidelberg, Germany, 2014; pp. 201–230. [Google Scholar]
  62. Geisseler, D.; Linquist, B.A.; Lazicki, P.A. Effect of fertilization on soil microorganisms in paddy rice systems—A meta-analysis. Soil Biol. Biochem. 2017, 115, 452–460. [Google Scholar] [CrossRef]
  63. Pacholak, E.; Zydlik, Z.; Rutkowski, K. Effect of cherry nitrogen fertilization on the content of minerals in the leaves and soil. Acta Sci. Pol. Hortorum Cultus 2011, 10, 105–112. [Google Scholar]
  64. Moral, F.J.; Rebollo, F.J. Characterization of soil fertility using the Rasch model. J. Soil Sci. Plant Nutr. 2017, 17, 486–498. [Google Scholar] [CrossRef]
  65. Myśków, W. Methodological remarks on microbiological studies of cultivated soils diversified under the influence of agrotechnical treatments. Post. Microbiol. 1986, 35, 319–331. (In Polish) [Google Scholar]
  66. Hawrot-Paw, M.; Martynus, M.; Koniuszy, A. Microbial Metabolic Activity of Soils Contaminated with Diesel Oil and Biodiesel. Ochr. Srodowiska 2017, 39, 25–30. [Google Scholar]
  67. Alrumman, S.A.; Standing, D.B.; Paton, G.I. Effects of hydrocarbon contamination on soil microbial community and enzyme activity. J. King Saud Univ. Sci. 2015, 27, 31–41. [Google Scholar] [CrossRef]
  68. Ouedraogo, A.S.; Frazier, R.S.; Kumar, A. Comparative Life Cycle Assessment of Gasification and Landfilling for Disposal of Municipal Solid Wastes. Energies 2021, 14, 7032. [Google Scholar] [CrossRef]
Figure 1. Substrates for the gasification process: (a) coffee grounds (CRs); (b) pine pellets (PPs).
Sustainability 16 06291 g001
Figure 2. Scheme of the test stand [25]: A—chamber of reactor system with a fixed bed, B—gas cleaning and cooling system, C—measurement system for gas produced (1—gasification reactor, 2—two-stage electric heater, 3—measure the temperature inside the reactor, 4—condensation tanks with drain valves (I and II), 5—condensate tank cooled by water, 6—scrubber (absorber), 7—gas meter, 8—tank, 9—double water filter, 10—exhaust gas analyser).
Sustainability 16 06291 g002
Figure 3. Effect of tar on Sinapsis alba seed germination and plant root length (a) for condensate from tank I; (b) for condensate from tank II.
Sustainability 16 06291 g003
Figure 4. Growth of Lemna minor in the presence of different tar concentrations, expressed by the number of fronds relative to the control: (a) for CR condensate; (b) for CR:PP condensate; (c) for PP condensate.
Sustainability 16 06291 g004aSustainability 16 06291 g004b
Figure 5. Growth of Lemna minor after 72 h exposure to different tar concentrations, based on fresh biomass relative to control: (a) for CR condensate; (b) for CR:PP condensate; (c) for PP condensate.
Sustainability 16 06291 g005aSustainability 16 06291 g005b
Figure 6. Bacterial counts in tar-contaminated soil as a percentage relative to the control: (a) for CR condensate; (b) for CR:PP condensate; (c) for PP condensate.
Sustainability 16 06291 g006aSustainability 16 06291 g006b
Figure 7. Actinomycetes’ abundance in tar-contaminated soil as a percentage relative to control: (a) for CR condensate; (b) for CR:PP condensate; (c) for PP condensate.
Sustainability 16 06291 g007aSustainability 16 06291 g007b
Figure 8. Fungal abundance in tar-contaminated soil as a percentage relative to control: (a) for CR condensate; (b) for CR:PP condensate; (c) for PP condensate.
Sustainability 16 06291 g008aSustainability 16 06291 g008b
Table 1. Value of coefficient SR (SR = B+A/F).
ObjectsCondensateContamination Dose, mg·kg−1 DM Soil
0100100010,000
CRI452031
II451823
CF:PPI451023
II451023
PPI45611
II45721
Disclaimer/Publisher’s Note: The statements, opinions and data contained in all publications are solely those of the individual author(s) and contributor(s) and not of MDPI and/or the editor(s). MDPI and/or the editor(s) disclaim responsibility for any injury to people or property resulting from any ideas, methods, instructions or products referred to in the content.

