Abstract
Agricultural green development has become essential for sustainable agriculture and the reduction of carbon dioxide emissions. This study evaluates the total index of agricultural green development by applying the entropy method; it then examines the spatial–temporal evolution of agricultural green development and finally uses the panel quantile model to examine the driving factors of agricultural green development in China. The results indicate that the level of agricultural green development is rising with time, and the differences among the regions have not changed, showing an increasing direction from west to east. The results from the panel quantile regression with nonadditive fixed effects show that the driving factors have different impacts on agricultural green development across quantiles. Industrial structure upgrading, rural informatization, and agricultural marketization have more significant effects in provinces with higher agricultural green development; agricultural finance and the per capita GDP have greater impacts in provinces at a moderate level of agricultural green development; and technology development, rural informatization, and the urbanization rate play a more important role in provinces at a lower level of agricultural green development. Thus, each province should devise policies according to its level of agricultural green development, which would be beneficial in improving the policies’ effectiveness.
1. Introduction
As a major agricultural country, China has superior agricultural resources. With the deepening reform of agriculture, the rapid growth of China’s agriculture industry has contributed greatly to the solution of the food shortage issue as well as to the world’s agricultural development [1]. However, agriculture is also a significant contributor to economic sustainability challenges, causing overexploitation of resources, serious environmental pollution, and a large amount of greenhouse gas emissions [2,3]. Agricultural non-point-source pollution has surpassed that of industry, becoming the largest source of non-point-source pollution in China. Approximately 11% of the global greenhouse gas emissions are from agricultural production, while this proportion is much higher in China, accounting for 16–17% of its greenhouse gas emissions [4]. Evidence shows that it is crucial to change the form of agricultural production to ensure environmental friendliness and resource conservation. Agricultural green development, as a new means of saving resources, protecting the environment, and ensuring a green means of development and way of life, plays a crucial role in improving the quality and efficiency of agricultural production [5]. Promoting agricultural green development could offer an essential guarantee for the achievement of the “double carbon” goal and the necessary path to realize the sustainable and modernized development of agriculture [6]. Thus, it is of great theoretical and practical significance to improve agricultural green development.
According to previous studies, the level of agricultural green development has gradually improved with time. However, environmental pollution and natural damage in the process of agricultural production, such as land degradation, soil erosion, and water pollution, as well as high energy inputs and natural resource overexploitation, still exist [7,8,9]. Thus, in this study, we attempt to answer the following questions: What level of agricultural green development has been reached? Are there any significant differences among provinces in the dimensions of time and space? What are the driving factors of agricultural green development in China? Solving these questions would not only be helpful for allowing the government, public sector, and scholars to understand the status and dynamic evolution of agricultural green development but is also important for the formulation and implementation of policies promoting agricultural green development.
Our study makes three contributions. Our first contribution is the choice of evaluation indicators for agricultural green development. We introduce production efficiency into an evaluation indicator system for agricultural green development, differing from the previous literature that mainly uses the four dimensions of environmental preservation, ecological protection, resource conservation, and economic benefits. The goal of agricultural green development is to transform traditional agriculture, with its excessive resource consumption and serious environmental damage, into green agriculture with high production efficiency, high resource utilization efficiency, and good environmental protection [10]. Thus, it is essential to build an evaluation framework for agricultural green development, considering production efficiency. The estimated weights of production efficiency prove the necessity and importance of considering this factor.
Our second contribution is that we provide new information on the dynamic evolution of agricultural green development within the time and space dimensions. We applied nonparametric kernel density estimation analysis to demonstrate the temporal evolution of agricultural green development and drew a national map using the ArcGIS 10.8 software to illustrate the spatial evolution of agricultural green development. The results reveal significant regional differences, which are in line with many studies [11,12,13,14], providing important evidence that enables us to choose the quantile panel model to analyze the driving factors of agricultural green development.
Our third contribution is that we applied the quantile regression for panel data with nonadditive fixed effects (QRPD) model, differing from the previous literature, which used the panel data regression model or panel space measurement model [7]. The advantages of the QRPD model are as follows: Firstly, the QRPD model can explain outliers. The linear regression model is very responsive to outliers and appreciates the mean effect [15]. However, the mean effect resulting from the linear regression model is not robust enough to estimate the coefficients from heterogeneous response models [16]. Secondly, The quantile regression model is suitable for analyzing the different impacts of independent variables on the dependent variables across the conditional distribution [17]. Thus, the QRPD model can investigate the driving factors at different points in the conditional distribution of agricultural green development, allowing us to propose policy suggestions according to the level of agricultural green development.
In this study, an evaluation index system for agricultural green development considering agricultural production efficiency is proposed. Next, the spatial–temporal evolution of agricultural green development is shown to reveal the differences among regions, which also provides evidence for the application of the QRPD model. Finally, the QRPD model is adopted to analyze the driving factors of agricultural green development. The remainder of this paper is organized as follows: Section 2 presents a literature review related to the measurement and driving factors of agricultural green development. The model and data are described in Section 3. Section 4 exhibits the spatial–temporal evolution and comparison among regions. The empirical results and analysis are given in Section 5. Section 6 concludes and proposes policy implications.
2. Literature Review
In recent years, studies on agricultural green development have been gradually developed in China. In other foreign countries, most scholars focus on sustainable agriculture [18,19,20,21]. Research on sustainable agriculture emerged in Europe and America in the first half of the 20th century. The concept of agricultural green development was proposed based on sustainable agriculture. The final aim of agricultural green development is to achieve sustainable agriculture by coordinating the relationships among nature, society, and agricultural production. The current research on agricultural green development mainly includes two categories. The first category involves the measurement of agricultural green development. The second category explores the driving factors of agricultural green development.
2.1. Measurement of Agricultural Green Development
There are two main methods used to measure agricultural green development. The first method seeks to estimate the green total factor productivity to reflect the level of agricultural green development by using stochastic frontier analysis (SFA) [22,23] or data envelopment analysis (DEA) [10]. The above research shows that green total factor productivity has improved with time. The second method aims to construct an evaluation indicator system and then estimate the level of agricultural green development by calculating the weights of the indicators. Generally, according to China’s national conditions, policy documents, data availability, and the previous literature, scholars build an evaluation indicator system for agricultural green development, mainly including four aspects: environmental preservation, ecological protection, resource conservation, and economic benefits [24,25,26,27]. It is an important step to accurately estimate the weights of these indicators in measuring agricultural green development. The methods for the calculation of the indicators’ weights mainly include gray correlation analysis [24], the entropy method [26], the analytic hierarchy process [28], etc. Although scholars adopt different evaluation methods, the research results verify the increasing level of agricultural green development.
2.2. Driving Factors of Agricultural Green Development
There are two branches of study on the driving factors of agricultural green development. The first branch focuses on the impact and mechanism of a particular factor regarding agricultural green development. Against the background of the rapid development of the digital economy, the impact of the digital economy on agricultural green development has received attention [25]. Studies indicate that the digital economy not only improves agricultural green total factor productivity (AGTFP) [29] but is also a key driver of agricultural green development [30,31]. Moreover, agricultural technology has significant positive and nonlinear effects on agricultural green development in local and neighboring provinces based on the spatial panel model [24,32]. Guo et al. [33] and Tang et al. [34] found that environmental regulation can promote farmers’ agricultural green production technology adoption and therefore agricultural green total factor productivity. In addition, green finance positively improves agricultural green development [35,36], and the local GDP positively promotes agricultural green total factor productivity [37]. However, interestingly, some scholars have obtained the opposite results. For example, Ahmed et al. [38] suggest that agricultural insurance improves the agricultural green total factor output in the U.S., while some scholars find that agricultural insurance inhibits agricultural green development [39].
The other branch seeks to comprehensively explore the driving factors of agricultural green development. For example, Chen et al. [40] find that the GDP, industrial structure, urbanization rate, and infrastructure development significantly impact agricultural green development. Zhang and Chen [7] propose that agricultural green development is positively affected by the total agricultural output, industrial structure, and fiscal expenditure for agriculture but is negatively affected by the agricultural structure, environmental regulations, and the level of international trade.
2.3. Literature Summary
The literature on agricultural green development is rich and insightful, but there are also certain limitations. Firstly, the evaluation indicators of agricultural green development are constructed mainly based on the four dimensions of resource conservation, environmental preservation, ecological protection, and economic benefits, neglecting production efficiency. Secondly, most scholars focus on the impact of a particular variable on agricultural green development, such as the digital economy and agricultural technology. However, few scholars comprehensively investigate the driving factors of agricultural green development. Thirdly, most studies apply the panel data model, which is not able to reflect the characteristics of regional differences in agricultural green development. As noted in the Introduction section, our study is the first to use the quantile regression for panel data with nonadditive fixed effects (QRPD) model to analyze the driving factors of agricultural green development and measure the level of agricultural green development in China considering production efficiency.
3. Data and Methodology
3.1. Sample and Data Source
The data were selected from 31 provincial levels, excluding Hong Kong, Macao, and Taiwan, in China, covering the period between 2010 and 2021. The data came from the Wind Database, the China Statistical Yearbook, the China Agricultural Statistical Yearbook, and the China Rural Financial Statistical Yearbook. The interpolation method was used to fill in the missing data. To avoid the negative impacts of data heteroscedasticity on the robustness of the estimated coefficients, the data were processed in logarithmic form, with the exception of proportion data.
3.2. Entropy Method
To evaluate the level of agricultural green development, we applied the entropy method to calculate the weights of the indicators in the evaluation system for agricultural green development. The entropy method can avoid the subjectivity of the analytic hierarchy process (AHP) method and be used to objectively determine each indicator’s weight [27]. In the entropy method, the weights are mainly determined based on the degree of difference between the indicators, effectively avoiding subjective influences. The entropy method includes five steps.
Firstly, we calculate the standardized values of the indicators to eliminate the influence of the dimensions among different indicators.
For positive indicators,
For negative indicators,
where represents the standardized value; is the initial value of the jth indicator of the ith province; m and n represent the numbers of indicators and provinces, respectively; min and max represent the minimum and maximum values of , respectively.
Secondly, the proportion () of each indicator in the evaluation indicator system of agricultural green development is evaluated.
Thirdly, we calculate the entropy value () of the jth indicator:
Fourthly, the weight () of the jth indicator is calculated based on the following equation:
Finally, we measure the total index () of agricultural green development:
3.3. Nonparametric Kernel Density Estimation Analysis
The kernel density estimation method is applied to investigate the evolution of the distribution of agricultural green development in the sample period. The kernel density method studies the distribution characteristics of variables based on the data. Thus, this method overcomes the issue of determining function specifications subjectively in the process of parameter estimation and yields robust estimation results [41]. The specific details of the kernel density estimation method are as follows:
In Formulas (7) and (8), n is the number of observations, h is the optimal bandwidth, indicates the observation value of an independent identical distribution, represents the mean value of observations, and is the Gauss kernel density function.
3.4. Panel Quantile Regression
The quantile regression for panel data with nonadditive fixed effects (QRPD) model is applied to investigate the different driving factors of agricultural green development across the quantiles. This model is built based on the quantile regression model proposed by Koenker et al. [16]. Quantile regression regards the explained variable as a function distribution and estimates the influence of the explanatory variables at the different conditional quantiles of the explained variable based on minimizing the weighted sum of the absolute values of the residuals. It is challenging for the traditional panel quantile model to explain the estimation results at each quantile because the fixed effect term disassembles the random disturbance term into various parts. To address the above issue, Powell [42] proposed the quantile regression for panel data with nonadditive fixed effects (QRPD) model, in which the random disturbance term contains fixed effects to avoid decomposing the random disturbance term into various parts. Following Powell’s approach, the specification of the QRPD model is as follows:
where is agricultural green development, denotes the main driving factors, i denotes different individuals, t indicates the time of sample observation, represents the parameters, and is the error term, which is a function of different error terms, where some are time-varying and some are time-fixed. This model is linear in coefficients and is a strictly growing function of . Generally, for in the th quantile, quantile regression depends on the following conditional restriction:
4. Spatial–Temporal Evolution Analysis of Agricultural Green Development
4.1. Evaluation Indicator System for Agricultural Green Development
Green resources and the environment are the basic characteristics and inherent attributes of agricultural green development. The development of the human economy and society must be aligned with the capacity of the environment and its resources, achieving a coordinated symbiosis among economic development, environmental protection, and resource conservation [43,44,45]. In recent years, the Chinese government has regarded agricultural green development as an important development goal and issued a series of guiding documents, which provide a theoretical basis for a comprehensive understanding of the connotations of agricultural green development. Based on policy, theory, and previous research [27,46,47], we select the five dimensions of resource conservation, environmental preservation, ecological protection, production efficiency, and economic benefits to measure the level of agricultural green development, including five first-level indicators and twelve second-level indicators.
Specifically, resource conservation reflects the use efficiency of land, water, and energy resources. Generally, increasing resource use efficiency can enhance the sustainable development of agriculture. Secondly, environmental preservation refers to the adoption of production methods conducive to environmental protection and sustainable development, reflecting the degree of damage to the environment caused by inputs in agricultural production. As an important pollution source in China, agricultural diffused pollution mainly includes fertilizer, pesticide, and agricultural film pollution. Thirdly, ecological protection is essential to achieving long-term agricultural green development. The ecological environment plays a positive role in the growth of crops, so it is important to protect the ecological environment to ensure the yield of crops. Fourthly, production efficiency is the direct goal of agricultural green development. Higher production efficiency helps to decrease resource consumption and environmental damage. Finally, economic benefits are an important driving force for agricultural green development, reflecting the benefits of agricultural green development over a certain period. The purpose of agricultural green development is to achieve high-quality production and increase farmers’ incomes, meeting the population’s growing needs for a better life. The specific indicators of agricultural green development are shown in Table 1.

Table 1.
Evaluation indicator system for agricultural green development.
We applied the entropy method to calculate the total index of agricultural green development from 2010 to 2021 at the national, regional, and provincial levels. The provincial levels of agricultural green development are shown in Table 2. Figure 1 shows the dynamic trends of the average and median values of agricultural green development at the national level and the average value of agricultural green development at the regional level.
Table 2.
Provincial levels of agricultural green development in China (unit: %).
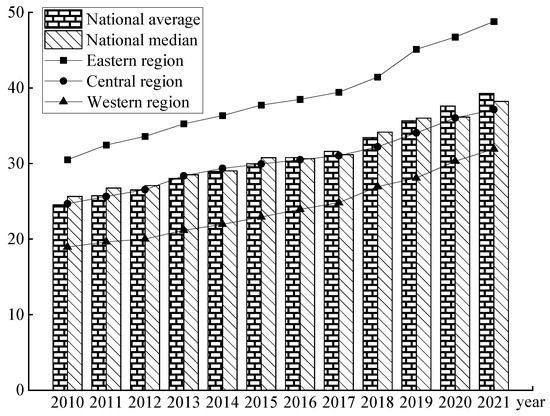
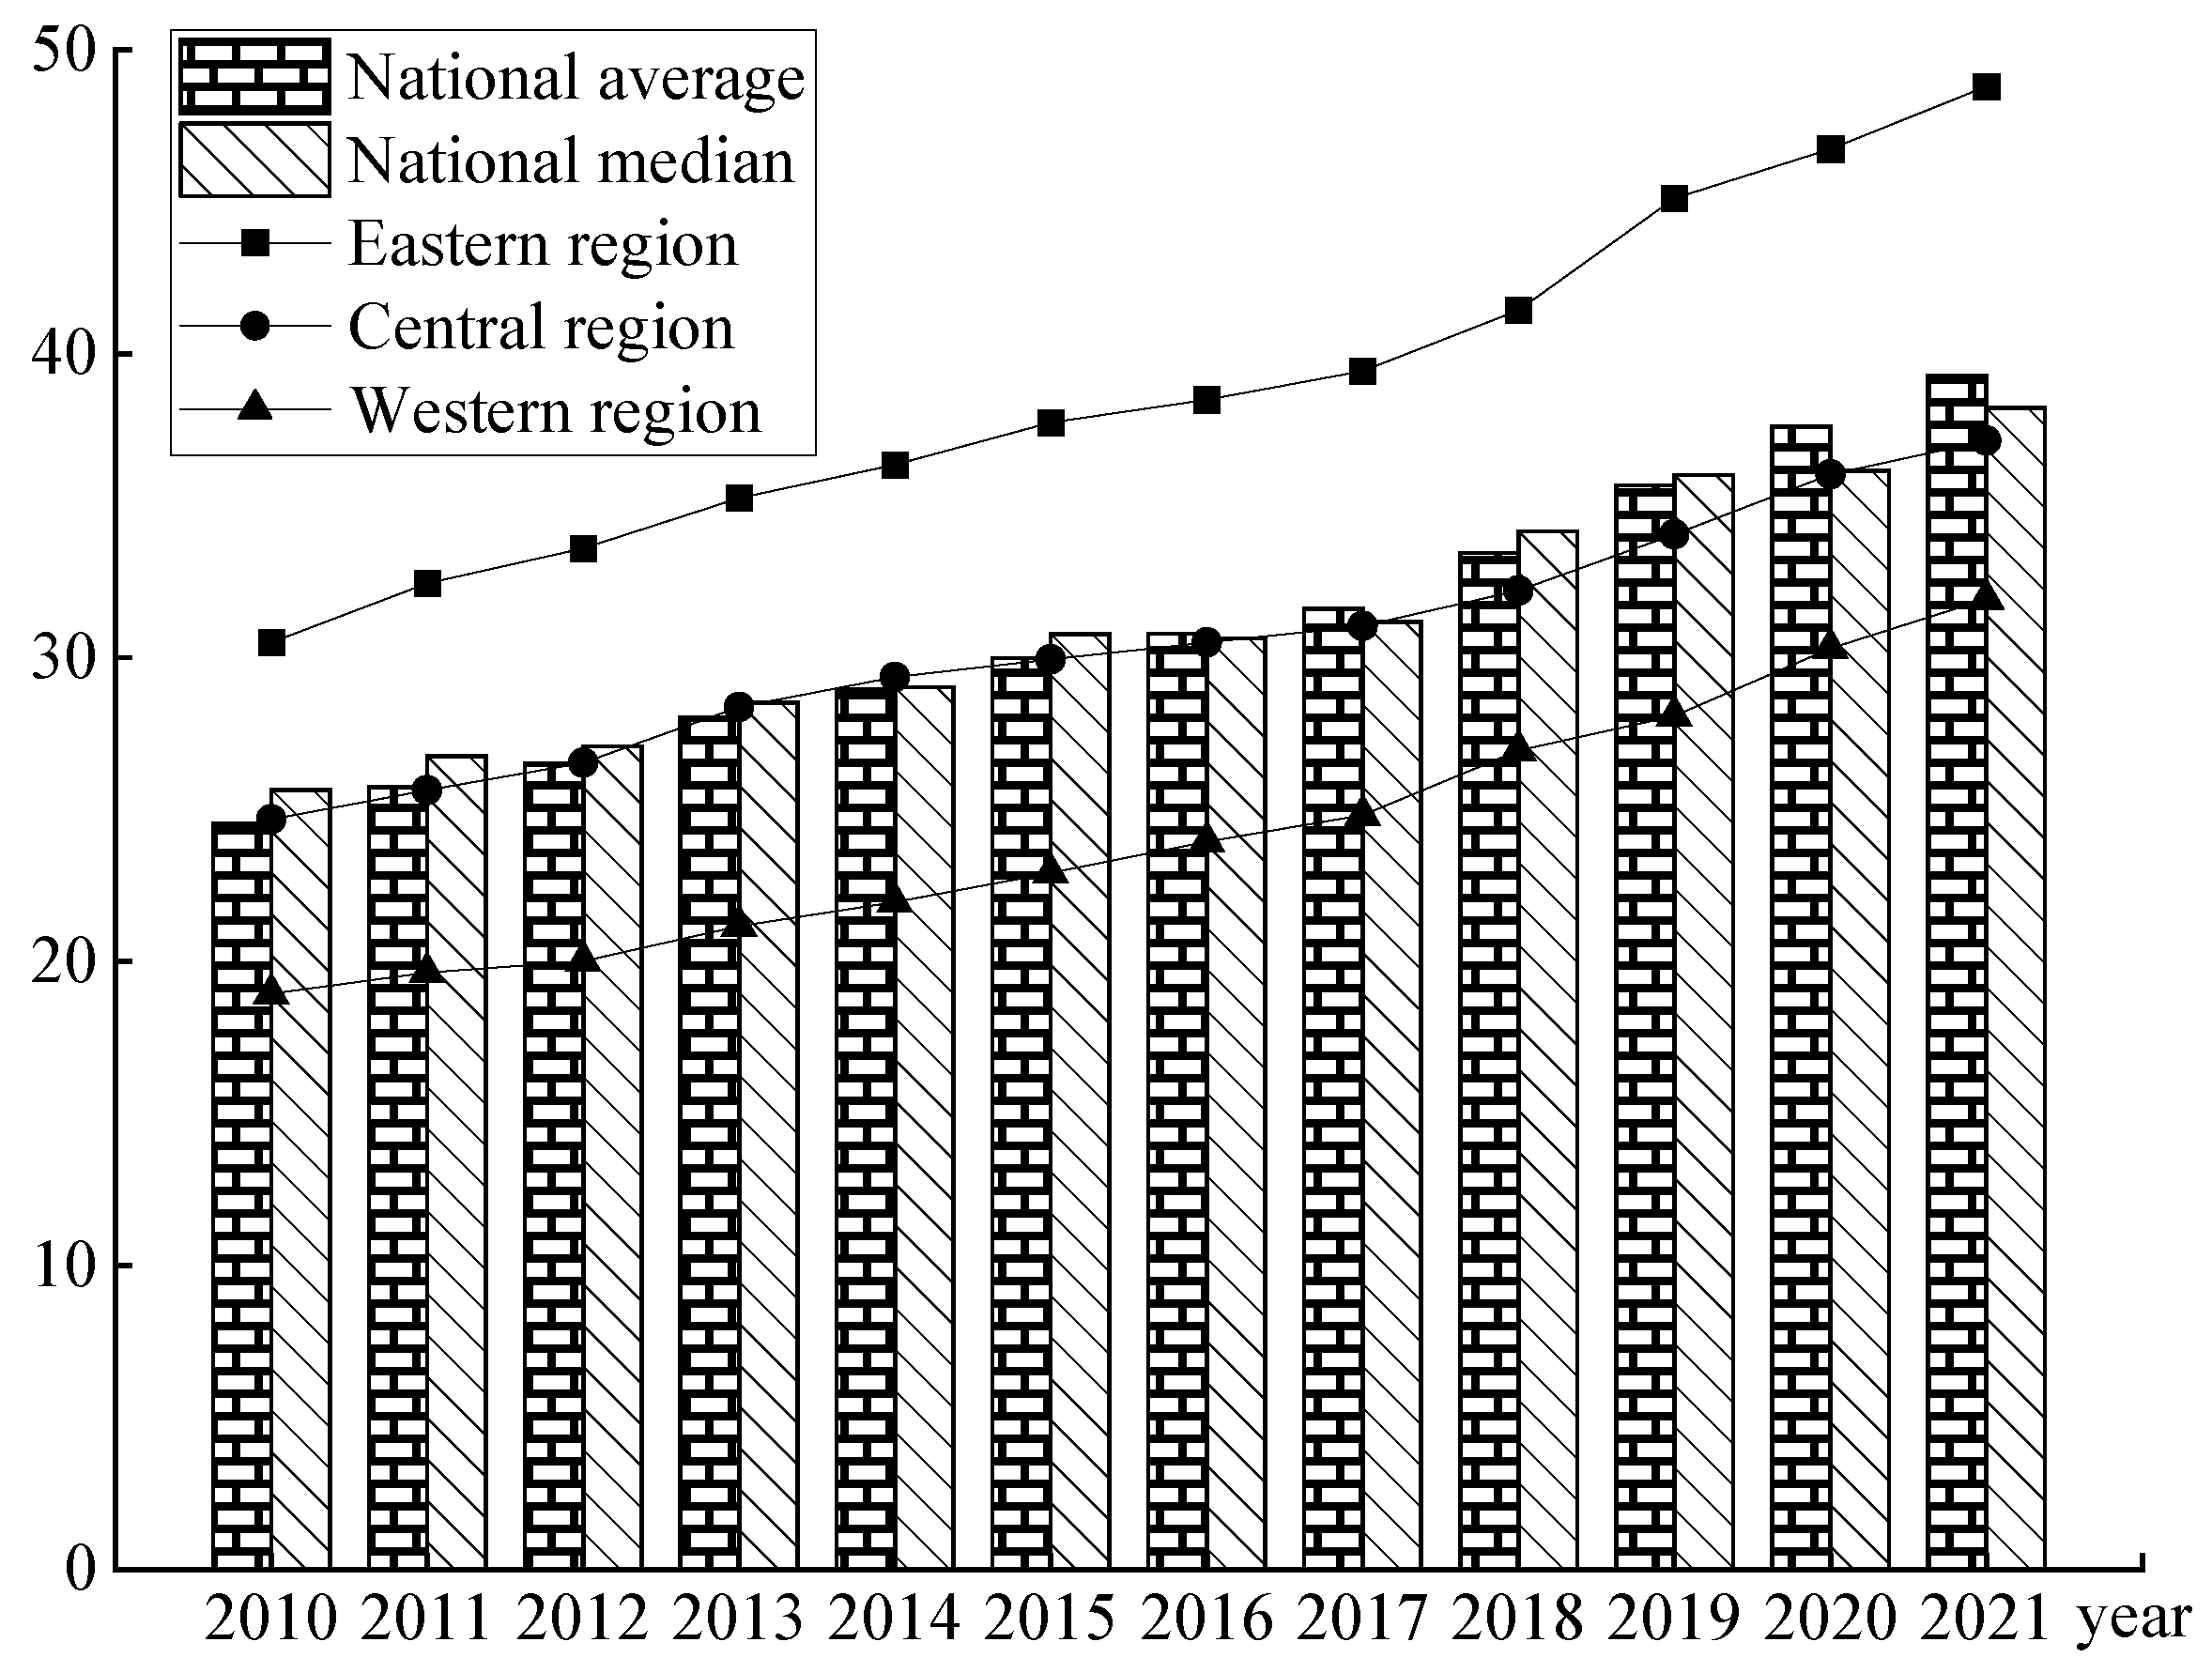
Figure 1.
Dynamic trends of agricultural green development at national and regional levels.
According to the results in Table 1 and Figure 1, the average values of agricultural green development show a gradual increase at the regional and national levels, especially after 2017. This is because the government proposed high-quality development at the 19th National Congress of the Communist Party of China in 2017.
Moreover, from the regional level, the average value of agricultural green development in the Central region has a similar dynamic trend to the national average value. The average value of agricultural green development in the Western region is the lowest, while the average value of agricultural green development in the Eastern region is the highest. This is due to the high growth rate of agricultural green development in the Jiangsu, Fujian, Zhejiang, Guangdong, and Hainan provinces in the Eastern region, where the levels of agricultural green development were higher than 50 in 2021. However, the levels of agricultural green development in other provinces were lower than 50 in 2021, showing a slower growth rate.
Finally, the differences in the average values of green agricultural development among the provinces and regions are increasing with time. This indicates that the quantile regression model may be suitable for the analysis of the driving factors of agricultural green development.
4.2. Temporal Distribution Evolution of Agricultural Green Development
We used kernel density estimation analysis to study the dynamic temporal evolution of agricultural green development. Figure 2 gives the kernel density estimation distribution curves of agricultural green development at the national and regional levels over time.
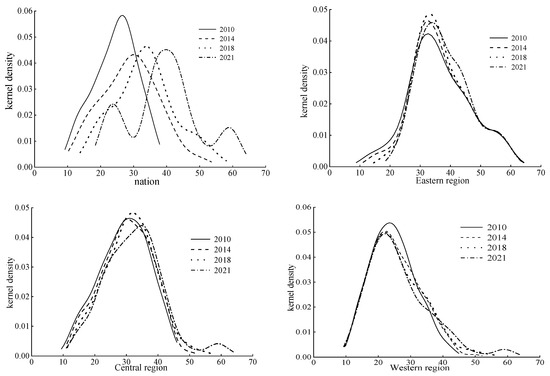
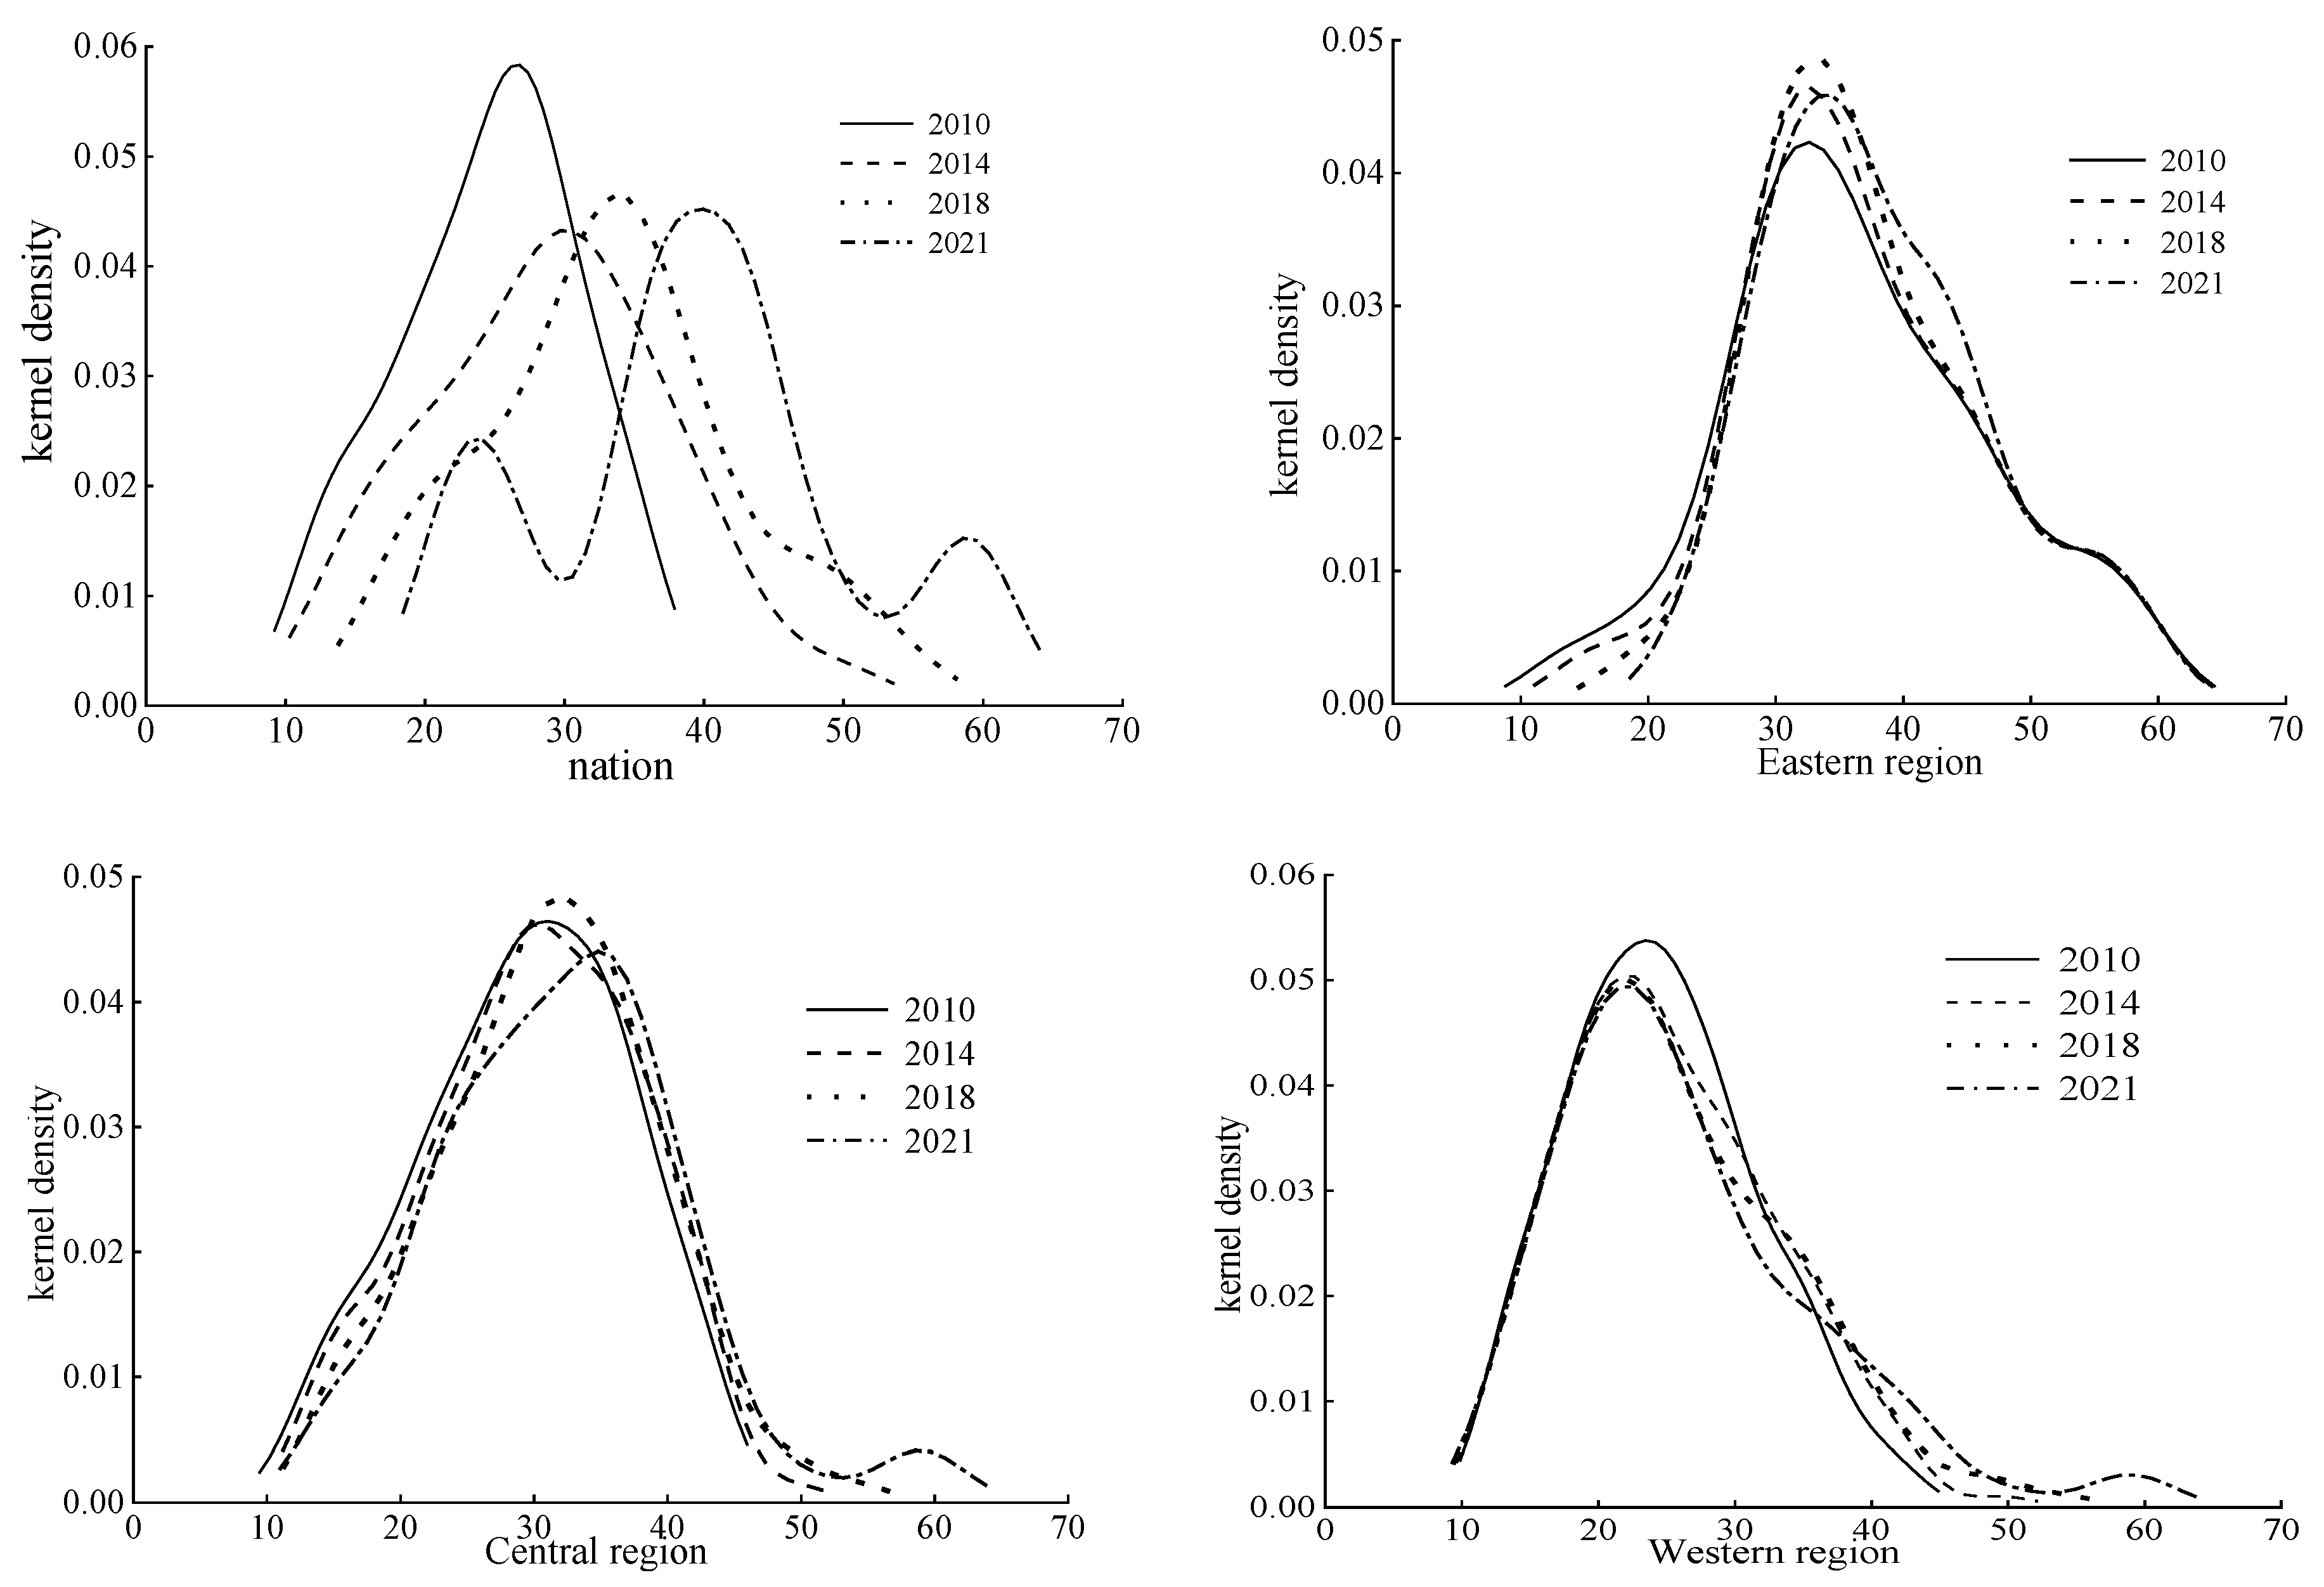
Figure 2.
Kernel density estimation distribution curves of agricultural green development at national and regional levels.
As for the nation, the center and interval of the kernel density curve move to the right, indicating the increasing trend of national agricultural green development. From the peak height and width of the distribution curve, the distribution curve presents the obvious characteristics of low-side peaks and right tailing. Namely, the height of the peak gradually decreases and the width of the peak gradually expands. Moreover, the distribution curve evolves from a single-peak to a multi-peak distribution. This indicates that there is a polarization phenomenon in agricultural green development, and the absolute differences at the provincial level are expanding.
As for the regions, there are significant differences in the evolution of the height and width of the distribution curve. In the Eastern region, the height of the peak gradually increases and the width of the peak gradually decreases, indicating that the level of agricultural green development is increasing and the gap among the provinces is reducing. In contrast, in the Central and Western regions, the level of agricultural green development is decreasing, and the difference among the provinces is rising. This is because the provinces in the Eastern region are more developed than those in the Central and Western regions, having a higher per capita GDP. Thus, these provinces have a much better economic environment and policies to promote agricultural green development, showing the obvious Matthew effect.
4.3. Spatial Distribution Evolution of Agricultural Green Development
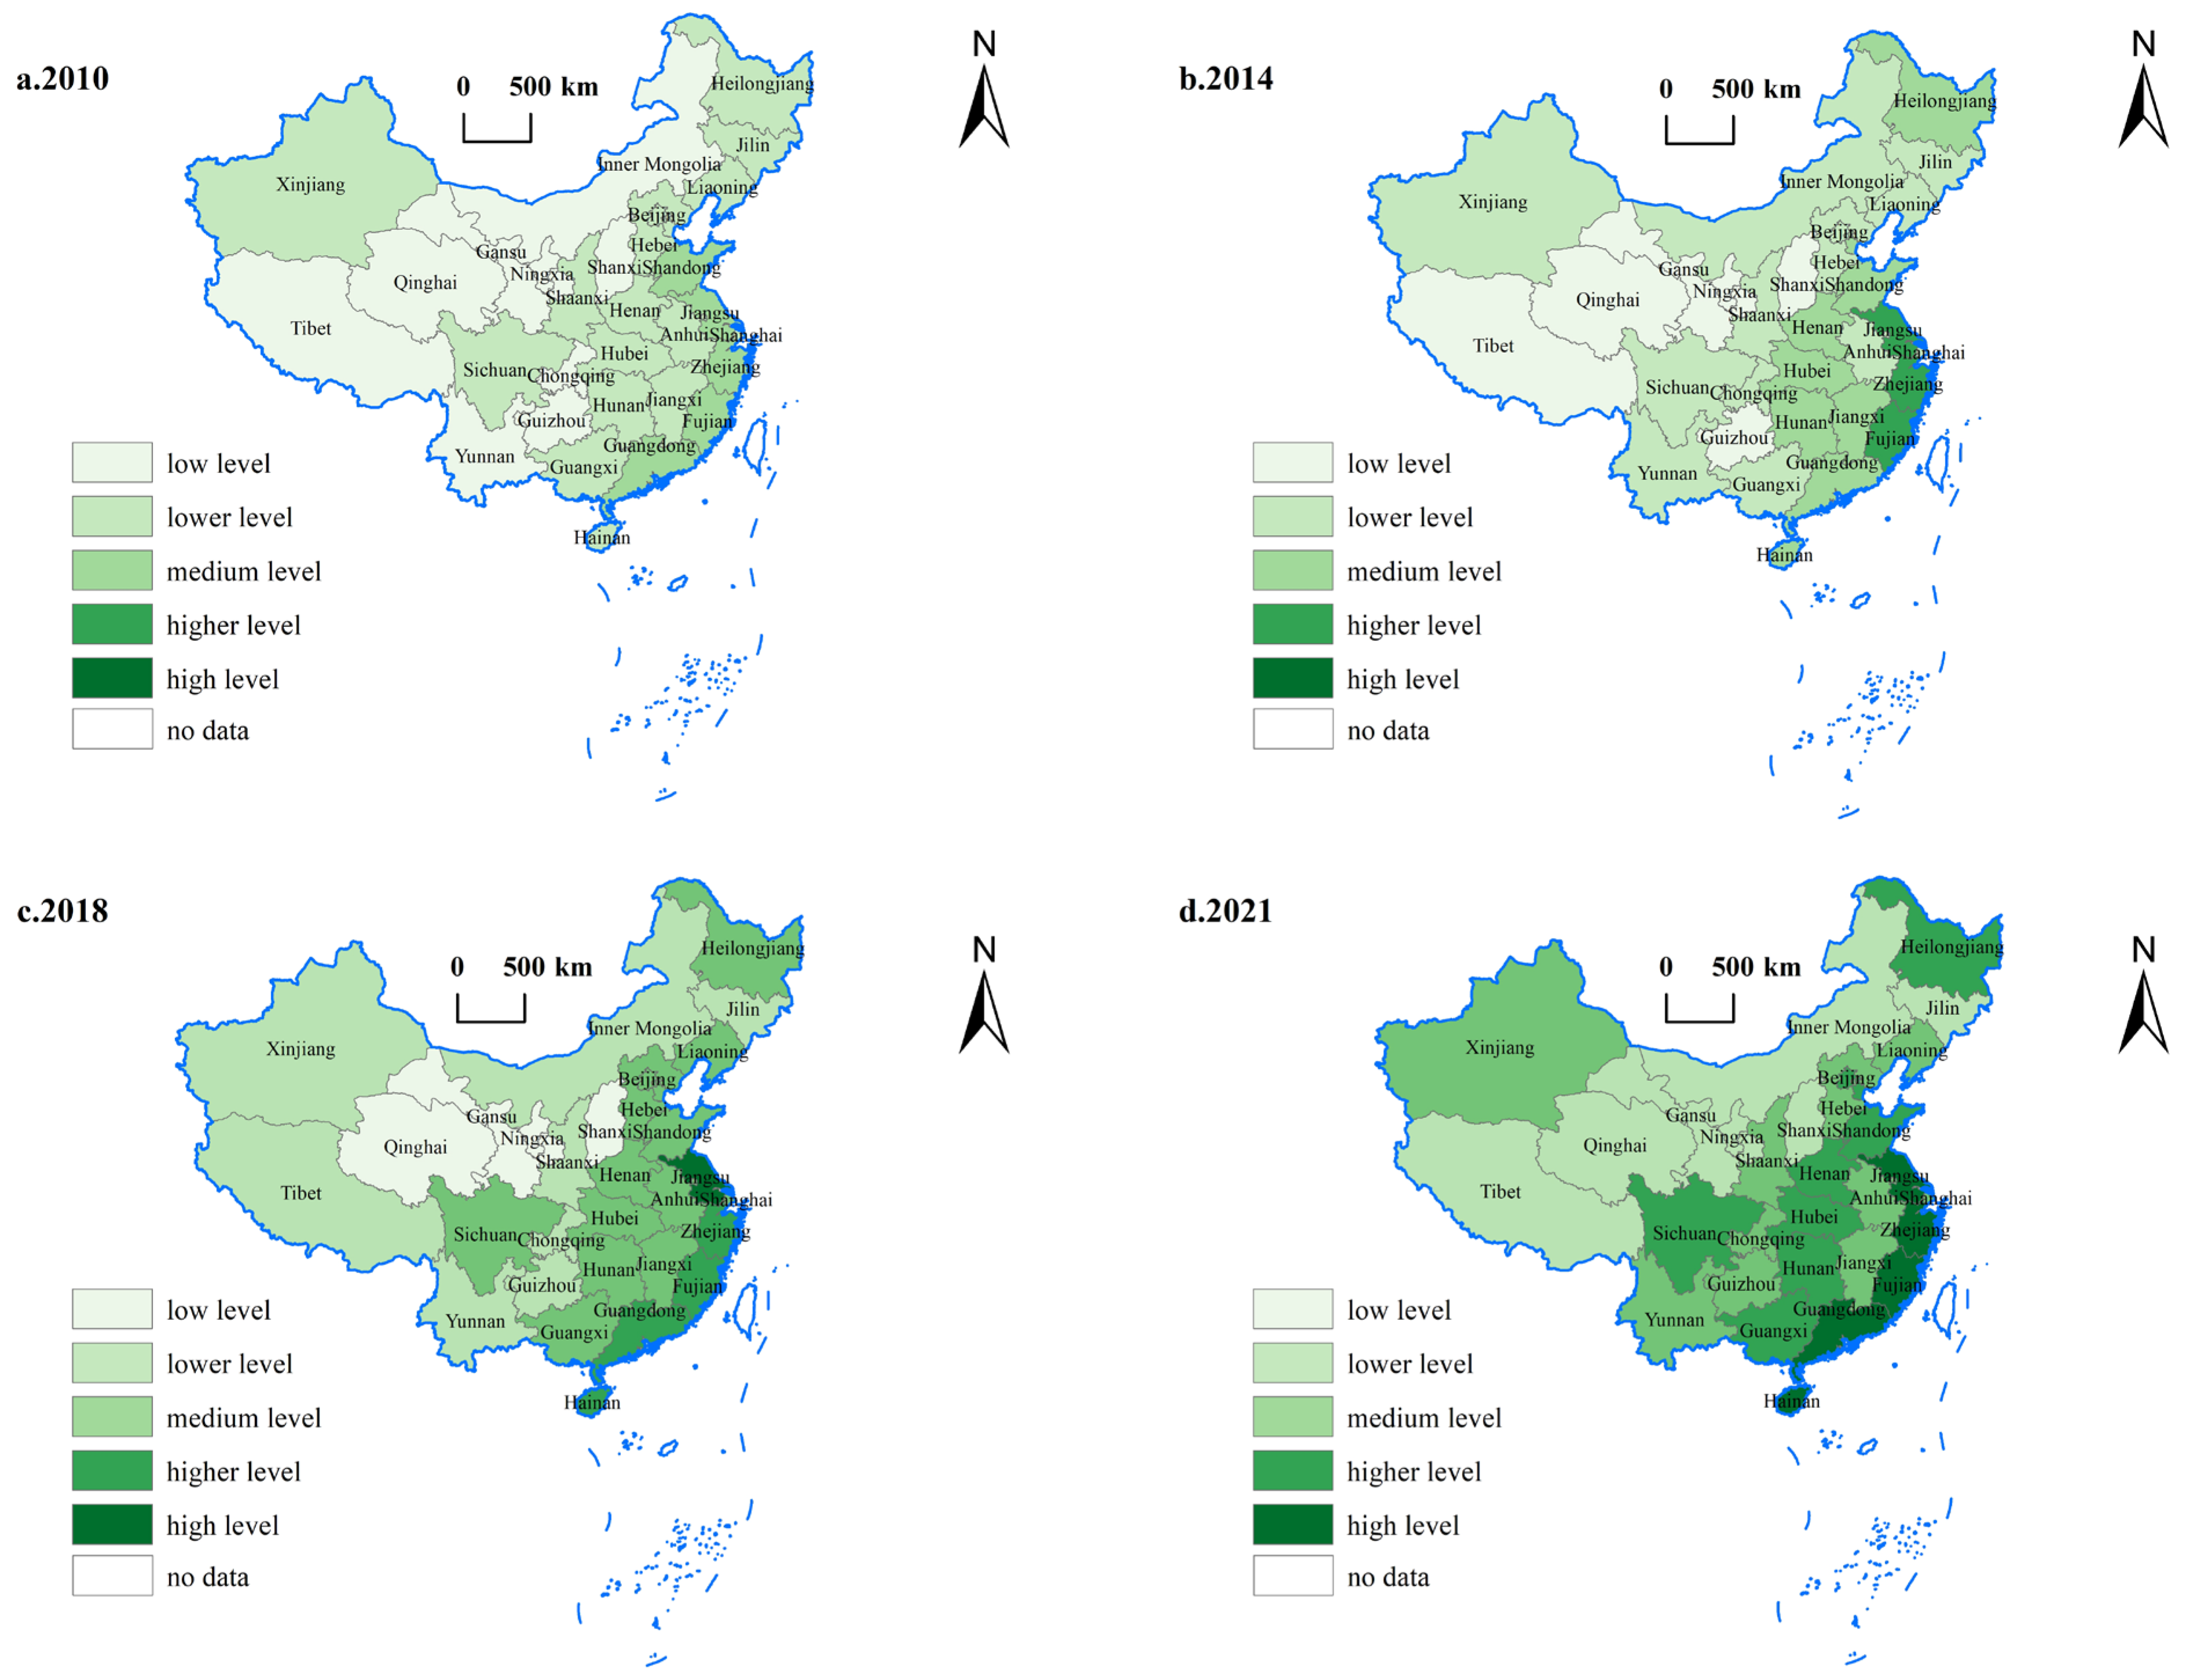
The total index of agricultural green development ranges between 12% and 62%; thus, we divide the provinces into five types with a 10% interval. They are as follows: type I is a low level, where the total index of agricultural green development belongs to (12%, 22%]; type II is a lower level, where the total index of agricultural green development belongs to (22%, 32%]; type III is a medium level, where the total index of agricultural green development belongs to (32%, 42%]; type IV is a higher level, where the total index of agricultural green development belongs to (42%, 52%]; and type V is a high level, where the total index of agricultural green development belongs to (52%, 62%]. To illustrate the dynamic spatial evolution of agricultural green development in China, we show the spatial distribution of China’s agricultural green development in 2010, 2014, 2018, and 2021, respectively, in Figure 3. The maps in Figure 3 were created using the ArcGIS software. The darker the colors, the higher the levels of agricultural green development.

Figure 3.
Spatial distribution of agricultural green development over time for 2010, 2014, 2018, and 2021 in China. Note: This map was drawn based on the standard map with the review number GS (2020) 4619, downloaded from the Standard Map Service website of the National Bureau of Surveying and Mapping Geographic Information in China.
As shown in Figure 3, with time, the total index of agricultural green development in China is significantly increasing. Comparing the different regions, we can see that there are significant spatial discrepancies in agricultural green development among provinces because agricultural resource and economic development levels vary across China. The spatial differences in the regional levels of agricultural green development are mainly displayed in the growing trend from west to east.
Specifically, in the Western region, the provincial levels of agricultural green development are slowly increasing with time, especially in Tibet, Qinghai, Gansu, Ningxia, and Inner Mongolia, which are still at lower levels in 2021. However, the levels of agricultural green development in Sichuan, Chongqing, and Xinjiang rise at a comparatively faster speed. The reason is that Gansu, Qinghai, Ningxia, Tibet, and Inner Mongolia are located in the plateau zone, where the climate is not suitable for agricultural production. Moreover, there are many ethnic minorities in these areas, and the implementation of green agricultural policies is relatively difficult. In contrast, Sichuan, Guangxi, and other provinces in this region have abundant agricultural resources and suitable environments for agricultural production. In particular, Sichuan has made much more significant progress in agricultural green development as a large agricultural province.
In the Central region, the levels of agricultural green development in almost all provinces changed from a lower level in 2010 to a higher level in 2021, with the exception of Shanxi. A possible reason is that Shanxi is a large coal-producing province, which has a negative influence on agricultural green development. The Eastern region is China’s most developed area, where the regional agricultural green development level is the highest. In particular, in the provinces along the eastern seaboard, the levels of agricultural green development changed from a medium level in 2010 to a high level in 2021.
In summary, the four time dimensions of 2010, 2014, 2018, and 2021 show that the level of agricultural green development exhibits an increasing trend. This is mainly due to the sustainable and stable macroeconomic environment and a series of policies implemented to enhance economic green development in China. However, the differences among the regions have not changed, showing a rise from west to east due to the unbalanced development of the economy. The provinces in the Eastern region have the most prosperous economies and the strongest economic power in China, followed by the Central region, and finally the Western region.
5. Driving Factors of Agricultural Green Development
The report of the 19th National Congress of the Communist Party of China was officially released on 18 October 2017. The report pointed out that it is crucial to alleviate the contradiction between individuals seeking a better life and the unbalanced and inadequate development in China. The regional imbalance in agricultural green development in China has also been verified [48]. Due to the differences in the temporal and spatial distribution of green agricultural development, we applied a quantile regression model to investigate the driving factors of agricultural green development in China. Thus, we applied the quantile regression for panel data with nonadditive fixed effects (QRPD) model to investigate the driving factors of agricultural green development, revealing the differences in the driving factors across quantiles.
5.1. Definition of Variables
5.1.1. Dependent Variable
The dependent variable is the level of agricultural green development, which is calculated using the entropy method based on the evaluation indicator system constructed in the previous section.
5.1.2. Independent Variables
The independent variables are displayed in Table 3. These variables were chosen based on literature reviews [7,24,25,29,30,31,32,33,34,35,36,37,38,39,40]. Specifically, first, the variable “mark” refers to the agricultural marketization level. In general, the higher the degree of marketization, the higher the market efficiency and the faster the flow of green talent, technology, and capital; thus, it plays a positive role in promoting green agriculture. Second, the variable “fina” refers to financial support for agriculture. The promotion of agricultural green development is dependent on funding support. The gathering of funds is conducive to the gathering of talent and technology, which in turn enhances agricultural green development. Third, “insu” refers to agricultural insurance. Some scholars posit that agricultural insurance can safeguard agricultural productivity and reduce farmers’ air pollution-related economic losses, which has a positive impact on agricultural green development [38]. However, some research shows that farmers who buy insurance tend to use relatively more chemical inputs than farmers who do not buy insurance. Thus, agricultural insurance may harm agricultural green development [39]. Fourth, “tech” refers to technology development. Technology is an indispensable means to change traditional agricultural production methods; thus, it is an important tool in achieving agricultural green development. Fifth, “info” refers to rural informatization, which helps farmers enter the market and increase their income by eliminating the obstruction of information. It also helps farmers learn about and use green production techniques through the internet. Thus, rural informatization is beneficial for agricultural green development. Sixth, “pgdp” refers to the per capita GDP. The higher the per capita GDP, the higher the demand for green and organic food among the population, which in turn promotes the green development of agriculture. Seventh, “urba” denotes the urbanization rate. The higher the urbanization rate, the smaller the population of farmers, which is conducive to moderate-scale production, thereby reducing the impact on the rural natural environment and promoting agricultural green development. Finally, “stru” refers to industrial structure upgrading. The greater the proportion of the tertiary industry in the secondary industry, the lower its destructive impact on the environment and nature; thus, industrial structure upgrading is conducive to the promotion of agricultural green development [40].
Table 3.
Independent variables and descriptive statistics.
5.2. Analysis of Results of the Quantile Regression Model with Nonadditive Fixed Effects
In the estimation of panel quantile regression with nonadditive fixed effects, five representative qualities of 10%, 30%, 50%, 70%, and 90% were selected. This is beneficial to compare the differences in the driving factors at different levels of agricultural green development. The estimation results are shown in Table 4.
Table 4.
Estimated results of the panel quantile regression model with nonadditive fixed effects.
Table 4 reports the results for the driving factors of agricultural green development. Columns 1 to 5 provide the conditional quantile effect using the estimators introduced here for τ = 0.1, 0.3, 0.5, 0.7, and 0.9. Almost all of the variables considered in the model are statistically significant, indicating the importance of identifying the different driving factors according to the level of agricultural green development.
Looking at the driving factors of agricultural green development, we first notice that there is a negative and significant relationship between agricultural insurance and agricultural green development. In other words, the higher the agricultural insurance level, the lower the agricultural green development. This is possibly because insured farmers are more likely to increase their application of agricultural chemicals, which has been verified by many scholars [48,49]. However, the marginal effect of agricultural insurance is dynamic and shows a trend of increasing first and then decreasing in the different stages of agricultural green development. This means that the government should pay more attention to the negative influence of agricultural insurance, especially when the level of agricultural green development is at a moderate level.
In contrast, all driving factors except agricultural insurance have significant positive links with agricultural green development. The results suggest that financial support for agriculture, agricultural marketization, technology development, rural informatization, the per capita GDP, the urbanization rate, and industrial structure upgrading are important influencing factors for agricultural green development in China. However, each factor has its own influential pattern.
First, the impacts of agricultural marketization and industrial structure upgrading increase with the quantiles changing from 0.1 to 0.9. The magnitude of the coefficients of agricultural marketization (industrial structure upgrading) ranges from 0.581 to 1.51 (0.364 to 5.588), which implies that a 1% increase in agricultural marketization (industrial structure upgrading) increases agricultural green development from 0.58% to 1.51% (0.364% to 5.588%). It is worth noting that the effects are larger at the higher quantiles, indicating that the effects of agricultural marketization and industrial structure upgrading are more critical in magnitude in regions with a higher level of agricultural green development. As a result, on the one hand, the government authorities in these regions should enhance agricultural marketization by gradually decreasing governmental intervention and deepening market-oriented reform. On the other hand, industrial structure upgrading should be improved by continuously promoting the development of the tertiary industry.
Second, agricultural technology has a significant and positive effect on agricultural green development because the development of agricultural technology theoretically optimizes the combination of agricultural production factors to promote agricultural production efficiency [50], further improving agricultural green development. However, technology development has a significantly diminishing effect across all quantiles, showing a more substantial impact for the lower quantiles and a weaker impact for the higher quantiles. This suggests that the government should adopt policies to develop agricultural technology, especially for provinces at the lower level of agricultural green development.
Third, the positive coefficients of agricultural finance and the per capita GDP are sufficient to support the notion that the acceleration of agricultural finance and the per capita GDP promotes agricultural green development. This finding is in line with that of Huang and Bin (2022) [39]. Moreover, the positive impacts show an inverted “U” trend across all quantiles, which is lower at the 10th and 90th but higher at the 50th quantile. This suggests that the impact of agricultural finance support and the per capita GDP is more pronounced at a moderate stage of agricultural green development. The findings here imply that regions can achieve faster agricultural green development by improving their level of agricultural finance and economic development.
Finally, both the urbanization rate and rural informatization have a U-shaped positive impact on agricultural green development across all quantiles. This implies that rural informatization and the urbanization rate have larger effects on the 10th and 90th quantiles but smaller effects on the 50th quantile. Thus, policymakers can improve rural informatization and the urbanization rate to promote agricultural green development, especially in regions with lower or higher levels of agricultural green development. This finding also shows that the government should develop digital village construction and promote the urbanization rate by formulating and implementing policies such as data infrastructure construction, rural land system reform, and urban–rural integration policies.
In summary, industrial structure upgrading, rural informatization, and agricultural marketization have more significant effects in provinces with higher levels of agricultural green development; agricultural finance and the per capita GDP have greater impacts in provinces at a moderate level of agricultural green development; and technology development, rural informatization, and the urbanization rate play a more important role in provinces at a lower level of agricultural green development.
6. Discussion
Agricultural green development has become an important issue in China and even around the world. Earlier related studies mainly focused on agricultural green production efficiency [51], but few studies have paid attention to agricultural green development due to the complexity of building an evaluation indicator system for agricultural green development. As a result, this study establishes an evaluation indicator system for agricultural green development. The results show the increasing trend of agricultural green development in China, while the gaps among different regions become larger with time. This finding is in line with Yu, Liu, Khan, Yu, Zhu, Yue, and Zhao [52]. Moreover, the study of the spatial–temporal evolution of agricultural green development reveals the dynamic evolution process of agricultural green development in the time and space dimensions, providing clear evidence of China’s unbalanced regional development. The report of the 19th National Congress of the Communist Party of China was officially released on 18 October 2017. This report pointed out that it is crucial to alleviate the contradiction between individuals seeking a better life and unbalanced and inadequate development in China. It indicates that unbalanced economic development is a widespread issue in China that must be urgently solved.
Exploring the driving factors of agricultural green development at different quantiles is useful in identifying measures to promote agricultural green development. Our model is different from the methods in the previous literature. Chen et al. applied a spatial association network structure approach to investigate the drivers of agricultural green development [40]. Zhang and Chen used the panel space measurement model [7]. The above study methods focus on the mean effects. However, our model pays attention to the different influences across the quantiles of agricultural green development. The values of agricultural green development at the five qualities of 10%, 30%, 50%, 70%, and 90% are 18.57%, 25.31%, 30.59%, 35.65%, and 43.45%, respectively. If the index of provincial agricultural green development is below 25.31%, the provinces are included in the lower-level region of agricultural green development; if the index of agricultural green development is higher than 35.65%, these provinces belong to the higher-level region of agricultural green development; otherwise, the provinces belong to the moderate-level region.
We find that industrial structure upgrading, rural informatization, and agricultural marketization have more significant effects in the high-level region; agricultural finance and the per capita GDP should be developed to have greater impacts on provinces in the moderate-level region; the urbanization rate, technology development, and rural informatization play a more important role in the lower-level region. Thus, the government should devise policies that align with the provincial levels of agricultural green development, which would be beneficial in improving the policies’ effectiveness.
7. Conclusions and Policy Implications
7.1. Conclusions
This study applies the entropy method to calculate the level of agricultural green development by establishing an evaluation indicator system and then explores the spatial–temporal evolution and driving factors of agricultural green development in China. The conclusions are as follows:
First, this study constructs an evaluation indicator system for agricultural green development, including five dimensions: resource conservation, environmental preservation, ecological protection, production efficiency, and economic benefits. The level of agricultural green development is calculated, which presents a gradual rise at the regional and national levels, especially after 2017, due to the proposal of high-quality economic development. The growth speed and magnitude of agricultural green development in the Eastern region are clearly the highest among the different regions, followed by those in the Central region and Western region.
Second, the spatial–temporal evolution analysis shows that there is a polarization phenomenon in agricultural green development, and the absolute differences at the provincial and regional levels are expanding. Although the level of agricultural green development is rising with time, the differences among the regions have not changed, showing an increasing direction from west to east. The provinces in the Eastern region have the highest level of economic development and the most suitable policies to promote agricultural green development in China, showing an obvious Matthew effect.
Third, the estimated results of the panel quantile regression with nonadditive fixed effects indicate that the driving factors have different impacts on agricultural green development across quantiles. Thus, it is suitable to apply the panel quantile regression model to reveal the different influential patterns of these factors.
Fourth, agricultural finance, the marketization of the agricultural industry, technology development, rural informatization, the per capita GDP, the urbanization rate, and industrial structure upgrading have significant and positive impacts on agricultural green development in China. Specifically, the impacts of agricultural marketization and industrial structure upgrading increase with the quantiles, changing from 0.1 to 0.9. In contrast, technology development has a significantly diminishing effect across all quantiles. Agricultural finance and the per capita GDP show an inverted “U” effect, while the urbanization rate and rural informatization have a U-shaped impact on agricultural green development across all quantiles.
Fifth, it is worth noting that there is a negative and significant relationship between agricultural insurance and agricultural green development. Moreover, the negative effect displays an inverted “U” shape across all quantiles, indicating larger effects at a moderate level of agricultural green development. This is possibly because insured farmers are more likely to increase their application of agricultural chemicals.
Finally, governments at the provincial and national levels should formulate policies to promote agricultural green development by gradually improving agricultural finance, agricultural marketization, technology development, rural informatization, the per capita GDP, the urbanization rate, and industrial structure upgrading. However, the governments also should formulate policies that align with the different provincial levels of agricultural green development, which would be beneficial in improving the policies’ effectiveness.
7.2. Policy Implications
According to the above conclusions, this study proposes the following suggestions:
First, in the high-level region of agricultural green development, the government should promote agricultural green development through industrial structure upgrading, rural informatization, and agricultural marketization. The specific measures are as follows: we should seize the opportunity for scientific and technological revolution to accelerate the development of the digital economy, promoting the digital transformation of the agricultural industry; we should support the development of platform services such as consulting services and modern logistics, as well as promoting the high-level opening up of the service industry to increase the quality and efficiency of productive services; and we should rely on markets and policies to guide more resources toward rural areas, avoiding excessive government intervention.
Second, in the moderate-level region of agricultural green development, improving agricultural finance and the per capita GDP represent suitable measures to enhance agricultural green development. On the one hand, we should form a multi-level, competitive, wide-coverage, and sustainable rural financial service system by promoting the development of microfinance and guiding more financial resources to rural areas; on the other hand, we should continuously promote the sustainable growth of the GDP by deepening economic system reform, stimulating domestic demand, developing green economics, adhering to high-level opening up towards the outside, etc.
Third, in the lower-level region of agricultural green development, the urbanization rate, technology development, and rural informatization play a more important role in promoting agricultural green development. Thus, we should implement policies to guide the growth of investment in agricultural technology and technical personnel. Moreover, we could deepen the reforms, including land, registered residence, administrative, and fiscal system reforms, to establish a public cost-sharing mechanism and reduce the cost of urbanization.
Finally, green agricultural insurance should be rapidly developed. On the one hand, insurance companies should enrich their insurance products and offer more preferential rates to agricultural producers who carry out green, low-carbon, and circular production. This is useful in guiding insured farmers to adopt an advanced mode of production that controls the amounts of pesticides and fertilizers used, promotes the recycling of agricultural waste, and eliminates straw burning and other harmful treatment methods. On the other hand, governments should formulate green agricultural insurance subsidy plans in line with regional environmental protection goals and agriculture industry policies. Constructing a green subsidy mechanism for agricultural insurance could lead to progress in green agricultural technology, promoting the long-term development of agriculture.
Author Contributions
Conceptualization, F.P. and H.D.; methodology, M.C.; software, M.C. and X.W.; formal analysis, W.Q., H.D., L.Z. and W.Q.; data curation, H.D. and W.Q.; writing—original draft preparation, F.P., H.D. and X.W.; writing—review and editing, F.P., H.D., M.C., L.Z., W.Q. and X.W.; supervision, F.P., H.D., L.Z. and W.Q.; funding acquisition, F.P. All authors have read and agreed to the published version of the manuscript.
Funding
This research was supported by the Heilongjiang Provincial Social Science Foundation Project (No. 22JLB144).
Institutional Review Board Statement
Not applicable.
Informed Consent Statement
Not applicable.
Data Availability Statement
The data presented in this study are available on request from the corresponding author.
Conflicts of Interest
The authors declare no conflicts of interest.
References
- Kakwani, N.; Wang, X.; Xue, N.; Zhan, P. Growth and common prosperity in China. China World Econ. 2022, 30, 28–57. [Google Scholar] [CrossRef]
- Xu, B.; Lin, B. Factors affecting CO2 emissions in China’s agriculture sector: Evidence from geographically weighted regression model. Energy Pol. 2017, 104, 404–414. [Google Scholar] [CrossRef]
- Li, Z.; Jin, M.; Cheng, J. Economic growth of green agriculture and its influencing factors in China: Based on emergy theory and spatial econometric model. Environ. Dev. Sustain. 2021, 23, 15494–15512. [Google Scholar] [CrossRef]
- Huang, X.; Xu, X.; Wang, Q.; Zhang, L.; Gao, X.; Chen, L. Assessment of Agricultural Carbon Emissions and Their Spatiotemporal Changes in China, 1997–2016. Int. J. Environ. Res. Public Health 2019, 16, 3105. [Google Scholar] [CrossRef] [PubMed]
- Xu, J.; Zhang, Z.; Zhang, X.; Ishfaq, M.; Zhong, J.; Li, W.; Zhang, F.; Li, X. Green Food Development in China: Experiences and Challenges. Agriculture 2020, 10, 614–623. [Google Scholar] [CrossRef]
- Guo, H.; Li, S. Environmental Regulation, Special Effect and Agricultural Green Development. R D Manag. 2022, 34, 54–67. [Google Scholar]
- Zhang, X.; Chen, H. Green agricultural development based on information communication technology and the panel space measurement model. Sustainability 2021, 13, 1147. [Google Scholar] [CrossRef]
- Cao, Y.; Chai, L.; Yan, X.; Liang, Y. Drivers of the Growing Water, Carbon and Ecological Footprints of the Chinese Diet from 1961 to 2017. Int. J. Environ. Res. Public Health 2020, 17, 1803–1812. [Google Scholar] [CrossRef] [PubMed]
- Qin, Q.; Yan, H.; Liu, J.; Chen, X.; Ye, B. China’s agricultural GHG emission efficiency: Regional disparity and spatial dynamic evolution. Environ. Geochem. Health 2022, 44, 2863–2879. [Google Scholar] [CrossRef] [PubMed]
- Shen, J.; Zhu, Q.; Jiao, X.; Ying, H.; Wang, H.; Wen, X.; Xu, W.; Li, T.; Cong, W.; Liu, X.; et al. Agricultural green development: A model for China and the world. Front. Agr. Sci. Eng. 2020, 7, 5–13. [Google Scholar] [CrossRef]
- Chen, Y.; Liu, B.; Shen, Y.; Wang, X. Spatial analysis of change trend and influencing factors of total factor productivity in China’s regional construction industry. Appl. Econ. 2018, 50, 2824–2843. [Google Scholar] [CrossRef]
- Feng, C.; Huang, J.-B.; Wang, M. Analysis of green total-factor productivity in China’s regional metal industry: A meta-frontier approach. Resour. Policy 2018, 58, 219–229. [Google Scholar] [CrossRef]
- Wang, K.-L.; Pang, S.-Q.; Ding, L.-L.; Miao, Z. Combining the biennial Malmquist–Luenberger index and panel quantile regression to analyze the green total factor productivity of the industrial sector in China. Sci. Total Environ. 2020, 739, 140280–140286. [Google Scholar] [CrossRef] [PubMed]
- Baležentis, T.; Blancard, S.; Shen, Z.; Štreimikiene, D. Analysis of environmental total factor productivity evolution in European agricultural sector. Decis. Sci. 2019, 52, 365–373. [Google Scholar] [CrossRef]
- Belaïd, F.; Elsayed, A.H.; Omri, A. Key drivers of renewable energy deployment in the MENA Region: Empirical evidence using panel quantile regression. Struct. Change Econ. Dyn. 2021, 57, 225–238. [Google Scholar] [CrossRef]
- Koenker, R.; Bassett, G., Jr. Regression quantiles. Econometrical 1978, 46, 33–50. [Google Scholar] [CrossRef]
- Yan, D.; Kong, Y.; Ren, X.; Shi, Y.; Chiang, S. The determinants of urban sustainability in Chinese resource-based cities: A panel quantile regression approach. Sci. Total Environ. 2019, 686, 1210–1219. [Google Scholar] [CrossRef] [PubMed]
- Priya, E.; Sarkar, S.; Maji, P.K.A. Review on Slow-Release Fertilizer: Nutrient Release Mechanism and Agricultural Sustainability. J. Environ. Chem. Eng. 2024, 12, 113211. [Google Scholar] [CrossRef]
- Baraj, B.; Mishra, M.; Sudarsan, D.; da Silva, R.M.; Santos, C.A.G. Climate change and resilience, adaptation, and sustainability of agriculture in India: A bibliometric review. Heliyon 2024, 10, e29586. [Google Scholar] [CrossRef] [PubMed]
- Rakholia, R.; Tailor, J.; Prajapati, M.; Shah, M.; Saini, J.R. Emerging Technology Adoption for Sustainable Agriculture in India–A Pilot Study. J. Agric. Food Res. 2024, 17, 101238. [Google Scholar] [CrossRef]
- Raihan, A.; Hasan, M.A.; Voumik, L.C.; Pattak, D.C.; Akter, S.; Ridwan, M. Sustainability in Vietnam: Examining Economic Growth, Energy, Innovation, Agriculture, and Forests’ Impact on CO2 Emissions. World Dev. Sustain. 2024, 4, 100164. [Google Scholar] [CrossRef]
- Shen, N.; Liao, H.; Deng, R.; Wang, Q. Different types of environmental regulations and the heterogeneous influence on the environmental total factor productivity: Empirical analysis of China’s industry. J. Clean. Prod. 2019, 211, 171–184. [Google Scholar] [CrossRef]
- Li, M.; Wang, J. Spatial-temporal distribution characteristics and driving mechanism of green total factor productivity in China’s logistics industry. Pol. J. Environ. Stud. 2020, 30, 201–213. [Google Scholar] [CrossRef] [PubMed]
- Zhang, F.; Wang, F.; Hao, R.; Wu, L. Agricultural Science and Technology Innovation, Spatial Spillover and Agricultural Green Development—Taking 30 Provinces in China as the Research Object. Appl. Sci. 2022, 12, 845. [Google Scholar] [CrossRef]
- Liu, Y.; Deng, Y.; Peng, B.Y. The Impact of Digital Financial Inclusion on Green and Low-Carbon Agricultural Development. Agriculture 2023, 13, 1748. [Google Scholar] [CrossRef]
- Chen, Z.; Li, X.; Xia, X. Measurement and spatial convergence analysis of China’s agricultural green development index. Environ. Sci. Pollut. Res. 2021, 16, 19694–19709. [Google Scholar] [CrossRef] [PubMed]
- Yan, J.; Tang, Z.; Guan, Y.; Xie, M.; Huang, Y. Analysis of Measurement, Regional Differences, Convergence and Dynamic Evolutionary Trends of the Green Production Level in Chinese Agriculture. Agriculture 2023, 13, 2016. [Google Scholar] [CrossRef]
- Veisi, H.; Liaghati, H.; Alipour, A. Developing an ethics-based approach to indicators of sustainable agriculture using analytic hierarchy process (AHP). Ecol. Indic. 2016, 60, 644–654. [Google Scholar] [CrossRef]
- Benyam, A.; Soma, T.; Fraser, E. Digital agricultural technologies for food loss and waste prevention and reduction: Global trends, adoption opportunities and barriers. J. Clean. Prod. 2021, 323, 129099. [Google Scholar] [CrossRef]
- Shen, Z.; Wang, S.; Boussemart, J.-P. Digital transition and green growth in Chinese agriculture. Technol. Forecast. Soc. Change 2022, 181, 121742. [Google Scholar] [CrossRef]
- Chen, Y.; Sumin Hu, S.; Wu, H. The Digital Economy, Green Technology Innovation, and Agricultural Green Total Factor Productivity. Agriculture 2023, 13, 1961. [Google Scholar] [CrossRef]
- Xiao, S.; He, Z.; Zhang, W.; Qin, X. The agricultural green production following the technological progress: Evidence from China. Int. J. Environ. Res. Public Health 2022, 19, 9876. [Google Scholar] [CrossRef] [PubMed]
- Guo, Z.; Chen, X.; Zhang, Y. Impact of environmental regulation perception on farmers’ agricultural green production technology adoption: A new perspective of social capital. Technol. Soc. 2022, 71, 102085. [Google Scholar] [CrossRef]
- Tang, M.; Cao, A.; Guo, L.; Li, H. Improving agricultural green total factor productivity in China: Do environmental governance and green low-carbon policies matter? Environ. Sci. Pollut. Res. 2023, 30, 52906–52922. [Google Scholar] [CrossRef] [PubMed]
- Li, G.; Jia, X.; Khan, A.A.; Khan, S.U.; Ali, M.A.S.; Luo, J. Does green finance promote agricultural green total factor productivity? Considering green credit, green investment, green securities, and carbon finance in China. Environ. Sci. Pollut. Res. 2023, 30, 36663–36679. [Google Scholar] [CrossRef] [PubMed]
- Du, Y.; Wang, W. The role of green financing, agriculture development, geopolitical risk, and natural resource on environmental pollution in China. Resour. Policy 2023, 82, 103440. [Google Scholar] [CrossRef]
- Huang, T.; Xiong, B. Space Comparison of Agricultural Green Growth in Agricultural Modernization: Scale and Quality. Agriculture 2022, 12, 1067. [Google Scholar] [CrossRef]
- Ahmed, N.; Hamid, Z.; Mahboob, F.; Rehman, K.U.; Ali, M.S.E.; Senkus, P.; Wysokińska-Senkus, A.; Siemiński, P.; Skrzypek, A. Causal Linkage among Agricultural Insurance, Air Pollution, and Agricultural Green Total Factor Productivity in United States: Pairwise Granger Causality Approach. Agriculture 2022, 12, 1320. [Google Scholar] [CrossRef]
- Hou, D.; Wang, X. Inhibition or Promotion?—The Effect of Agricultural Insurance on Agricultural Green Development. Front. Public Health 2022, 10, 910534. [Google Scholar] [CrossRef] [PubMed]
- Chen, Z.; Sarkar, A.; Rahman, A.; Li, X.; Xia, X. Exploring the drivers of green agricultural development (GAD) in China: A spatial association network structure approaches. Land Use Policy 2022, 112, 105827. [Google Scholar] [CrossRef]
- Zhou, B.; Ma, X.; Luo, Y.; Yang, D. Wind power prediction based on LSTM networks and nonparametric kernel density estimation. IEEE Access 2019, 7, 165279–165292. [Google Scholar] [CrossRef]
- Powell, D. Quantile Regression with Nonadditive Fixed Effects. Empir. Econ. 2022, 63, 2675–2691. [Google Scholar] [CrossRef]
- OECD–The Organization for Economic Co-Operation and Development. Towards Green Growth; OECD Publishing: Paris, France, 2011. [Google Scholar]
- Capozza, I.; Samson, R. Towards Green Growth in Emerging Market Economies: Evidence from Environmental Performance Reviews; OECD Green Growth Papers, 2019–01; OECD Publishing: Paris, France, 2019. [Google Scholar]
- Rosenbaum, E. Green Growth—Magic Bullet or Damp Squib? Sustainability 2017, 9, 1092. [Google Scholar] [CrossRef]
- Zhang, H.; Zhang, J.; Song, J. Analysis of the threshold effect of agricultural industrial agglomeration and industrial structure upgrading on sustainable agricultural development in China. J. Clean. Prod. 2022, 341, 130818. [Google Scholar] [CrossRef]
- Volkov, A.; Morkunas, M.; Balezentis, T.; Streimikiene, D. Are agricultural sustainability and resilience complementary notions? Evidence from the North European agriculture. Land Use Policy 2022, 112, 105791. [Google Scholar] [CrossRef]
- Horowitz, J.K.; Lichtenberg, E. Insurance, moral hazard, and chemical use in agriculture. Am. J. Agric. Econ. 1993, 75, 926–935. [Google Scholar] [CrossRef]
- Niu, Z.H.; Feng, Y.; Chen, C. Agricultural insurance and agricultural fertilizer non-point source pollution: Evidence from China’s policy-based agricultural insurance pilot. Sustainability 2022, 14, 2800. [Google Scholar] [CrossRef]
- Zaman, K.; Khan, M.M.; Ahmad, M.; Rustam, R. The relationship between agricultural technology and energy demand in Pakistan. Energy Pol. 2022, 44, 268–279. [Google Scholar] [CrossRef]
- Chen, Y.; Miao, J.; Zhu, Z. Measuring green total factor productivity of China’s agricultural sector: A three-stage SBM-DEA model with non-point source pollution and CO2 emissions. J. Clean. Prod. 2021, 318, 128543. [Google Scholar] [CrossRef]
- Yu, C.; Liu, W.; Khan, S.U.; Yu, C.; Zhu, Z.; Yue, D.; Zhao, M. Regional differential decomposition and convergence of rural green development efficiency: Evidence from China. Environ. Sci. Pollut. Res. 2020, 27, 22364–22379. [Google Scholar] [CrossRef]
Disclaimer/Publisher’s Note: The statements, opinions and data contained in all publications are solely those of the individual author(s) and contributor(s) and not of MDPI and/or the editor(s). MDPI and/or the editor(s) disclaim responsibility for any injury to people or property resulting from any ideas, methods, instructions or products referred to in the content. |
© 2024 by the authors. Licensee MDPI, Basel, Switzerland. This article is an open access article distributed under the terms and conditions of the Creative Commons Attribution (CC BY) license (https://creativecommons.org/licenses/by/4.0/).