Abstract
Unemployment is the most important problem that countries need to solve in their economic development plans. The uncontrolled growth and unpredictability of unemployment are some of the biggest obstacles to economic development. Considering the benefits of technology to human life, the use of artificial intelligence is extremely important for a stable economic policy. This study aims to use machine learning methods to forecast unemployment rates in Turkey on a monthly basis. For this purpose, two different models are created. In the first model, monthly unemployment data obtained from TURKSTAT for the period between 2005 and 2023 are trained with Artificial Neural Networks (ANN) and Support Vector Machine (SVM) algorithms. The second model, which includes additional economic parameters such as inflation, exchange rate, and labor force data, is modeled with the XGBoost algorithm in addition to ANN and SVM models. The forecasting performance of both models is evaluated using various performance metrics such as Mean Absolute Error (MAE), Root Mean Square Error (RMSE), and Mean Absolute Percentage Error (MAPE). The findings of the study show how successful artificial intelligence methods are in forecasting economic developments and that these methods can be used in macroeconomic studies. They also highlight the effects of economic parameters such as exchange rates, inflation, and labor force on unemployment and reveal the potential of these methods to support economic decisions. As a result, this study shows that modeling and forecasting different parameter values during periods of economic uncertainty are possible with artificial intelligence technology.
1. Introduction
The standard definition of unemployment in the literature is ‘a person who has the ability and willingness to work but cannot find a job despite looking for a job at the prevailing wage and working conditions’. In this framework, the concept of unemployment for the individual is based on the realization of three basic criteria at the same time, and it is possible to list these criteria as follows [1]:
- -
- Not having a job;
- -
- Looking for a job;
- -
- Readiness to start work.
There have been many studies in the literature on the issue of unemployment, which has become a common problem in developing and developed economies and a global problem in the world from the past to the present, and research has been carried out on the determination of the factors that affect and are related to unemployment from an economic point of view. In this context, when an analysis is made specifically on the subject, it is seen that the main areas of investigation are the determination of the relations between inflation and unemployment, exchange rate unemployment, and labor force unemployment.
Professional perspectives on the correlation between inflation and unemployment progress through two phases and then transition into a third phase. The initial phase involves acknowledging the existence of a stable Phillips curve, known as a steady state. The subsequent phase involves recognizing that inflation expectations can alter the short-run Phillips curve, while the natural rate of unemployment serves as the anchor for a vertical long-run Phillips curve. The third stage stems from the empirical fact that there is an apparently positive relationship between inflation and unemployment [2]. In this framework, Haug and King [3], in their study of the United States between 1952 and 2010, concluded that there is a strong and stable positive collaboration between inflation and unemployment in the medium to long run. They concluded that this long-term relationship is stable and unaffected by different fiscal and monetary policy regimes. In another study similar to this, Brenston, Menzio, and Wright [4] concluded that there was a positive collaboration between inflation and unemployment in the US between 1955 and 2010. On the other hand, Ormerod, Rosewell, and Phelps [5], using the clustering statistical technique, examined inflation and unemployment rates for the US, the UK, and Germany between 1871 and 2009 and concluded that, while there are similarities across countries, the typical inflation and unemployment rates experienced across regimes differ significantly, and that, even within a given regime, there are constant fluctuations in the degree of commitment of inflation and unemployment observations to that regime, so there is no stable exchange collaboration between inflation and unemployment even in the short run. Another study in this line, by Alisa [6], based on data from the Russian Federation, accepts the positive link between inflation and unemployment in the short run but concludes that the Phillips curve is not applicable to the modern Russian economy in the long run. In this framework, the study conducted by Karacan [7] using Granger Causality Analysis, Cointegration Tests, and Error Correction Models for the years 2005–2018 in Turkey concluded that there is no collaboration between inflation and unemployment. In addition, Uysal and Erdoğan [8], who examined the relation between unemployment and inflation in Turkey for the period 1980–2002, concluded that there was a positive relationship in the 1980s and a negative collaboration in the 1990s, while Ayvaz Güven and Ayvaz [9], in their research covering the years 1990–2014 in Turkey and using the Granger Causality Test, found a causal relationship from the unemployment rate to inflation rates. Akiş [10], on the other hand, concluded that there is a unidirectional link between inflation and unemployment in his research covering the years 2005–2020 in Turkey and using the Granger Causality Test based on the Vector Error Correction Model.
Another important factor affecting the labor market is the flexible exchange rate system. As a matter of fact, the flexible exchange rate system brings an additional monetary impact channel on top of the traditional channel that operates through labor market tightness [11]. In this framework, it is seen that different exchange rate regimes implemented from the past to the present have had significant effects on the economy and have been the cause of various economic crises [12]. Frenkel and Ros [13] conducted empirical studies within this framework and obtained significant evidence regarding the impact of the real exchange rate on unemployment in Latin American countries, including Argentina, Brazil, Chile, and Mexico. In this framework, Bakhshi and Ebrahimi [14], using a 30-year dataset for the period between 1981 and 2012 and the autoregressive economic model with distributed lags, found a significant and positive collaboration between economic growth and unemployment, as well as a negative relationship between exchange rate and unemployment in the Iranian economy. In another study, Choi and Choi [15], in their research on the optimal exchange rate policy of an open Keynesian economy, concluded that Yuan devaluation in China reduces unemployment and that the optimal exchange rate is an exchange rate that guarantees full employment. Ani, Joel, and Baajon [16] conducted unit root and Granger Causality Tests with the lagged distributed autoregressive model with a 31-year dataset covering the period between 1986 and 2017 in the Nigerian economy and concluded that the real exchange rate has a positive effect on unemployment. In a study conducted by Bilgin [12], the economic effects of exchange rate policies implemented in Turkey after 1980 were analyzed. The study found a strong correlation between exchange rates and unemployment rates. Selim and Ayvaz Güven [17] conducted a VAR (vector autoregression) analysis as well as unit root and Granger Causality Tests for the period 1990–2012 in Turkey and found that there is a strong relationship between the real effective exchange rate, inflation, and unemployment.
The number of unemployed, which is the main component of the labor force equation, or, in other words, labor force participation, which is the main factor in the equality of the unemployment rate, and the additional labor force effect, which is a cyclical result of unemployment affecting labor force participation, are other issues that should be emphasized within the theme of factors affecting unemployment. Kakinaka and Miyamoto [18] analyzed the labor force participation rate and unemployment rate in Japan from 1980 to 2010 using Cointegration Analysis. They found that there is a long-term relationship between these two variables for male workers, but not for female workers. In a similar study, Özerkek [19] examined 10 European countries (Belgium, Denmark, Ireland, France, Italy, Luxembourg, the Netherlands, Portugal, Sweden, and the United Kingdom) by using panel cointegration techniques for the period 1983–2009 and concluded that the long-run collaboration between unemployment and labor force participation exists only for women, and the discouraged worker effect emerges only for women. Yenilmez and Kılıç [20], in their study on the relation between labor force participation rate and unemployment rate in Turkey between 2014 and 2017, concluded that the additional worker effect is dominant for women with higher or vocational education, while there is no relationship for men.
During periods of low labor demand and high unemployment, pay rates see a sluggish decline. Hence, it is probable that the correlation between unemployment and the pace of pay rate change is not linear [21]. Given the existence of a non-linear relationship between unemployment and wage rates, it would be more realistic and appropriate to evaluate all important factors together rather than focusing on only one economic factor, as seen in the literature above. In this context, our study aims to reach more realistic regression results by conducting an analysis where more advanced analysis techniques such as machine learning, in which inflation, exchange rate, and the number of labor forces, which have gained intensity in research on unemployment, are considered together.
In this study, three forecasting algorithms, namely Artificial Neural Networks (ANNs), Support Vector Machines (SVM), and Extreme Gradient Boosting (XGBoost), are used. These forecasting models have been proven to have high forecasting power in different studies in the literature. The ANN is one of the most frequently used forecasting models in studies aiming to predict unemployment. Many statistical studies on unemployment forecasting have been conducted in the literature. In addition, prediction studies with deep learning methods are not at a sufficient level. However, when we look at the studies, it is seen that high accuracy percentages are achieved. For example, Moshiri and Brown (2004) used linear and non-linear forecasting methods to forecast the post-war unemployment rate in five OECD countries, namely the USA, Canada, the UK, France, and Japan, and made a comparison to determine the model with the best results. As a result of the comparison, it was found that the ANN model was as successful as univariate econometric time series models used in unemployment forecasting, and, in some cases, even more successful [22]. In their study, Purba et al. (2019) aimed to predict the future unemployment rate of Pematangsiantar city in Indonesia. In the study, annual unemployment data for the period between 2013 and 2017 were taken into account, and an ANN prediction model was used. At the end of the analysis, it was found that the model was able to predict the future unemployment rate with 79% accuracy [23]. In a similar study, Mutascu and Hegerty (2023) aimed to predict the future unemployment rate based on data for the period between 1998 and 2016. In the study, the annual unemployment rate of the 23 countries included was used as the dependent variable, while inflation, population, labor productivity, size of government, foreign direct investment, and past unemployment rates were used as independent variables. At the end of the analysis, it was observed that the ANN model reached 91.2% accuracy [24].
In a study conducted after the COVID-19 pandemic, Tufaner and Sözen (2021) used ANN and ARIMA forecasting models to predict Turkey’s post-pandemic unemployment rate. As a result, they found that the ANN model predicted a rate very close to the announced unemployment rate and gave relatively successful results [25]. Another prediction model used in unemployment forecasting is the SVM model. The SVM model, just like the ANN model, is a machine learning model that is frequently used in the literature and has achieved high accuracy percentages in many studies. Stasinakis et al. (2014) used the Kalman filter and SVM model to predict the unemployment rate in the United States, tested different prediction models, and achieved high accuracy percentages [26]. In another study, Ansari (2014) selected economic factors such as consumer price index, Treasury yield, and securities as independent variables and aimed to predict the future unemployment rate of the USA based on these variables. Based on the analysis, it was concluded that the unemployment rate forecasts made using the SVM model were the same as the actual unemployment rates, so the model worked with 100% accuracy. This study is considered to be very successful in terms of the input values used and the results expected from the study [27]. Sermpinis et al. (2014) emphasize that the SVM model can effectively adapt structural breaks for both inflation and unemployment. According to the study, the genetically compatible SVM model outperforms many forecasting models, even during periods of economic instability. This study also shows how accurate the SVM model can be even when the data are irregular [28]. Another study proving the high forecasting power of the SVM model is by Priliani et al. (2018). In their study, the researchers aimed to forecast inflation based on the TUFE (consumer price index) figures of Semerang city for the period between 2010 and 2018. As a result of the analysis, it was determined that the prediction power of the SVM model was 94.6% [29]. Using a combination of statistical and deep learning methods, Adenomon (2017) developed a forecasting model using ARIMA and the XGBoost algorithm to predict Nigeria’s unemployment rate. As a result, it was found that the accuracy percentages of the predictions made by the XGBoost algorithm were higher [30]. The algorithms used in this study are known to provide successful results not only in unemployment forecasts but also in the forecasting of different variables and economic indicators related to unemployment. For example, in their study, Kütük and Güloğlu (2019) used multiple forecasting models to predict the probabilities of transitioning from unemployment to employment and the probabilities of remaining in unemployment in Turkey. As a result of the analysis, it is seen that the XGBoost model reaches a higher accuracy percentage compared to the other models used in the study [31].
Economic sustainability is of great importance for all actors in the economy and in every field. One of the main problems to be solved in the process of economic development is unemployment. Economic sustainability is realized through the stability of development activities, and, in this context, the inability to control or predict unemployment is one of the major obstacles to a sustainable economy. Technological developments and the development of analytical methods contribute to the predictability of unemployment rates. The development of artificial intelligence and the diversification of machine learning methods increase the predictability of unemployment rates. The aim of this study is to estimate the unemployment rate in Turkey on a monthly basis using machine learning and deep learning methods. For this purpose, two different models are used in the study. Unemployment, inflation, the exchange rate, and the number of working labor forces collected on a monthly basis between 2005 and 2023, obtained from TURKSTAT (Turkish Statistical Institute), are modeled in two different applications. In the first model, firstly, the monthly unemployment data for the years 2005–2022 are trained with ANN and SVM algorithms and tested with the data for 2023. Here, the only input parameter used in the model is unemployment data. In the second model, in contrast to the first model, monthly inflation, exchange rate, and labor force (million) numbers for the years 2005–2022 are used as input data for the model, and unemployment rate forecasts for 2023 and the following years are made. In the literature, unemployment rates are generally estimated by traditional statistical methods. However, these methods cannot provide sufficient accuracy during economic crises, sudden changes, or periods of uncertainty. In this context, the potential of machine learning techniques for forecasting unemployment rates is quite high. In this study, ANN and SVM algorithms and the XGBoost algorithm are also used. The dependent variable is the unemployment rate, while inflation, the exchange rate, and the labor force are defined as independent variables. Thus, the results obtained by the methods used in this study are evaluated using a range of metrics. As a conclusion, all the results obtained in the two different models are evaluated and interpreted mutually. The findings reveal the potential of artificial intelligence technologies capable of modeling and forecasting different parameter values during periods of economic uncertainty. Especially in the context of the Turkish economy, this study shows the potential of machine learning methods to make forecasts with high accuracy rates, unlike traditional statistical methods.
2. Materials and Methods
In this study, two different models were used to forecast the unemployment rate on a monthly basis. In the first model, 228 monthly data points obtained from TURKSTAT covering the period between 2005 and 2023 were made ready for processing, and ANN and SVM algorithms were applied. We used the data covering the years 2005–2022 as the training set and the remaining data for the year 2023 as the test set. We compared the actual and predicted values with the 2023 data and calculated their performance metrics. We also attempted to predict the unrealized values for 2024 using the employed methods.
The second model estimated the unemployment rates for 2024 and the following years using monthly inflation, the exchange rate, and the labor force (in millions) between 2005 and 2023. We used three different machine learning methods in the second model: the ANN, SVM, and the XGBoost algorithms. As in Model-1, we divided the available data into training and test sets, then calculated performance metrics to determine the error percentages in the forecasts. Additionally, Table 1 and Table 2 display a portion of the dataset values. Since the dataset we used contains a total of 228 months of data, it is not possible to share all the numerical values in the table. As a result, we only display a few months’ worth of data.

Table 1.
Model-1 dataset.
Table 2.
Model-2 dataset.
The pre-feasibility studies tested a wide range of machine learning algorithms without creating two separate models. The algorithms with the highest accuracy percentages were used in the modeling of the study. The first model’s ANN is known for its high success rates in modeling datasets with complex and non-linear relationships, like economic data. The study established the data using a multilayer perceptron (MLP) architecture, and trained it using a back-propagation algorithm. By separating the data points with an optimal hyperplane, the SVM algorithm in the same model achieves high accuracy percentages in classification and regression problems. We optimized the model in our study using both linear and non-linear kernel functions.
The XGBoost algorithm applied in the second model provides high accuracy and efficiency, especially in large datasets and complex models. By increasing decision trees and using regularization techniques to prevent overlearning, XGBoost improves model performance. In this study, the XGBoost algorithm was used to increase the accuracy of the model and minimize error rates. The performance of the models was evaluated using metrics such as Mean Absolute Error (MAE), Root Mean Square Error (RMSE), and Mean Absolute Percentage Error (MAPE). Furthermore, cross-validation and hyperparameter optimization were applied to improve the accuracy of the models.
2.1. Artificial Intelligence Methods
The machine and deep learning models employed in this work were chosen for their capacity to manage the intricacy of non-linear datasets in economic systems affected by diverse socio-political aspects. Multiple AI models underwent feasibility assessments before the actual study. The study selected the ANN, SVM, and XGBoost algorithms based on the data structure.
2.1.1. Artificial Neural Networks (ANN)
An Artificial Neural Network (ANN) is a computational system that utilizes interconnected processing elements to collectively address a problem. It aims to emulate the functioning of the human brain by identifying patterns between input and output data. Additionally, ANNs have certain characteristics with biological neural networks. A neural network consists of numerous elementary processing units known as neurons. Every individual neuron forms a connection with other neurons, and these connections have specific weights assigned to them [32]. Figure 1 shows the general structure of ANN. ANNs have demonstrated their efficacy in handling nonparametric data characterized by non-linear functions, such as employment prediction, credit scoring, stock market forecast, business failure prediction, medicine, text mining, and image processing. An ANN offers significant advantages compared to traditional statistical techniques, primarily due to its reduced reliance on assumptions and its ability to effectively describe non-linear interactions based on the selection of appropriate activation functions. By acquiring knowledge about occurrences, individuals can make rational decisions when confronted with comparable circumstances. Trained Artificial Neural Networks (ANNs) are capable of generating output even when the data are inadequate. Data are distributed over the network, and the removal of some brain cells does not result in data loss [33]. Multilayer perceptron (MLP) models, the most well-known and widely used type of ANN today, are general-purpose, flexible, non-linear models consisting of neurons organized in multiple layers and capable of predicting many functions. MLP training is a widely used method due to the availability of many learning algorithms. An MLP is a type of neural network that includes an input layer, one or more hidden layers, and an output layer. It follows a feed-forward architecture. Each individual neuron inside a given layer forms connections with every neuron in the subsequent layer, resulting in a unidirectional flow of information from the input layer to the output layer. They operate according to a tutored learning strategy as both the inputs and the corresponding output values are presented to the network during training [34].
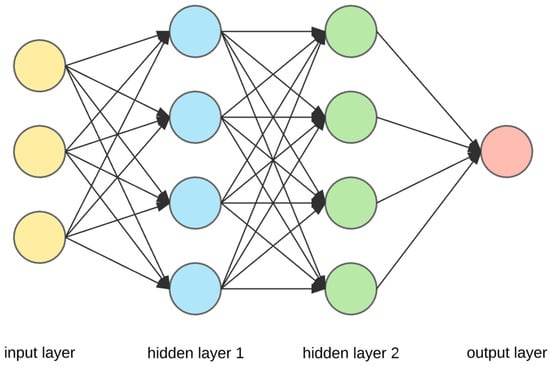
Figure 1.
Multilayer perceptron ANN structure.
2.1.2. Support Vector Machine (SVM)
The Support Vector Machine (SVM) is a machine learning technique that is rooted on statistical learning theory. This approach is commonly employed in regression and classification issues due to its ability to categorize and predict both linear and non-linear data. This technique generates an ideal separation hyperplane that partitions the data into two distinct categories by utilizing support vectors and class intervals. The primary objective is to effectively divide the data points using a hyperplane. Next, the initial training data are subjected to a non-linear transformation in a higher-dimensional space. This transformation guarantees that data may always be divided into two distinct classes using a hyperplane [35,36]. The mathematical expression for the SVM decision function in binary classification is as follows:
The prediction of the sample course, f(x), is determined by various factors. These include the example to be predicted, x, the label of the i-th support vector, yi, the Lagrange multiplier of the i-th support vector, αi, the kernel function (a transformed version of the dot product between x and xi), K(x,xi), and the bias term of the decision function, b. The utilization of a kernel function in this context enables the SVM to work in larger-dimensional spaces by employing a technique known as the kernel trick.
2.1.3. Extreme Gradient Boosting (XGBoost)
Artificial Neural Networks are widely utilized in several domains, particularly for tasks involving categorization, modeling, and forecasting. The XGBoost method, a refined algorithm within the Artificial Neural Networks collection, is a cutting-edge machine learning algorithm initially documented by Chen and Guestrin. Data scientists showed a keen interest in the released article. The XGBoost method is a refined version of the Gradient Boosting technique. The primary factor driving the widespread adoption of XGBoost is the significant advantages it offers compared to earlier versions. XGBoost utilizes the maximum depth parameter during the tree construction process. If the tree that has been created displays an excessive amount of downward movement, the process of pruning is carried out. This approach effectively prevents overlearning. XGBoost employs second-order functions to compute the loss function, whereas the Gradient Boosting technique uses a first-order function for this purpose [37].
XGBoost is a machine learning algorithm that falls within the boosting framework. Boosting is an ensemble technique that combines weak learners in a sequential manner to create a strong learner. In the case of XGBoost, decision trees are commonly used as the weak learners [38]. The primary aspect of the approach involves optimizing a regularized objective function that strikes a balance between the model’s faithfulness to the data and its intricacy (Equation (2)).
The variable L (θ) represents the overall loss that needs be minimized, represents a differentiable convex loss function measuring the discrepancy between the forecast ýi and the actual target Yi, fk denotes the term of regularization, defined as Ω, and fk = ƔT + ½ λ ||W||2, with T representing the tree’s number of leaves. The scores on leaves are denoted by W, and Ɣ is the complexity.
2.1.4. Model Performance Metrics
This study utilized performance criteria to demonstrate the adequacy of the models’ fit. The following metrics were used: the correlation coefficient (r), Mean Absolute Error (MAE), Root Mean Square Error (RMSE), Mean Absolute Percentage Error (MAPE), and coefficient of determination (R2). The correlation coefficient (r) measures the extent to which points in a scatter plot are close to a linear regression line produced by those points (Equation (3)). The range fluctuates between −1 and +1. A value of −1 indicates a completely linear negative correlation (descending slope), while a value of +1 indicates a completely linear positive correlation (ascending slope). The correlation coefficient, denoted as r, is directly linked to the coefficient of determination R2 in a clear manner, as shown in Equation (4). The R2 number quantifies the degree to which the regression line accurately represents the observed data, ranging from 0 to 1. When the value of R2 is equal to 1, it indicates a complete and accurate fit. When the coefficient of determination is equal to 0, it signifies that there is no observable correlation between the two variables.
where n represents the total number of observations, ∑xy is the total of the items of x and y values, ∑x and ∑y are the total of x and y values, and ∑x2 and ∑y2 are the total of the squares of x and y values.
The MAE is the total of the absolute value of the differences between the actual values and the forecast values in the dataset divided by the number of samples (Equation (5)). The Mean Absolute Error is a continuous variable that ranges from 0 to infinity. Performance improves as the value decreases.
RMSE is calculated by taking the sum of the squared differences between the actual and predicted values in the dataset and then dividing it by the number of samples (as shown in Equation (6)). Presence of outliers can significantly increase the Mean Square Error. RMSE is determined by taking the square root of the calculated value.
The MAPE, represented by Equation (7), is a statistical metric used to quantify the accuracy of a prediction system. Additionally, it serves as a loss function in machine learning situations. MAPE quantifies the magnitude of the error as a percentage [4].
In this context, n represents the quantity of fitted points, At denotes the actual value, and Ft signifies the predicted value.
3. Results
In this section, the graphs of the results of the algorithms used in Model-1 and Model-2 are explained in comparison with the reasons. Here, Turkey’s economic activities and economic management in the given years have played a decisive role in the change in unemployment rates.
3.1. Model-1
Figure 2 and Figure 3, created for the first model, display the graphs created by training the unemployment data for the years 2005–2022 with ANN and SVM algorithms and testing the data for 2023. TURKSTAT provided 228 months of unemployment data [39], which we divided into 216 months of training data and 12 months of test data between the mentioned years. In order to increase the accuracy of the model, the cross-validation method was applied, and the data were divided equally. We applied various performance metrics to determine the success percentages of the used algorithms. Additionally, we remodeled the predicted values for 2023 and generated a new prediction dataset for 2024. Figure 3 displays these values in a variety of colors. Furthermore, were calculated the MAE, MAPE, RMSE, and R2.
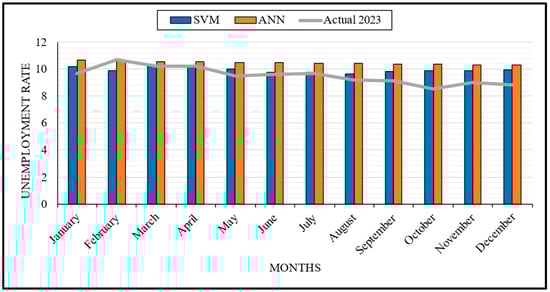
Figure 2.
Actual and prediction data for 2023.
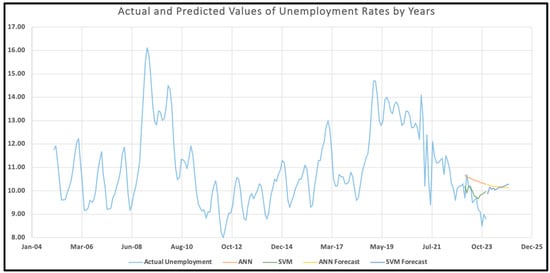
Figure 3.
Actual and predicted values of unemployment rates by year.
Figure 2 illustrates the general employment outlook in Turkey, showing a decline in unemployment rates and a rise in employment rates during the summer months. Upon examining the summertime values, the SVM algorithm yields the most accurate predictions. Two major factors influence this situation. First, employers transform the growth in the production process, caused by increased domestic and foreign demand in the summer months, into a demand for labor. The other reason is Turkey’s capacity to create seasonal employment. Especially in the agriculture and tourism sectors, the need for labor increases with the increase in employment opportunities in the summer months. Figure 2 shows that this situation also affects the success percentage of ANN and SVM analyses performed within Model-1. Especially between April and September, the SVM method is successful in predicting the actual value. The ANN algorithm matches the actual values better in May, June, and July. Furthermore, both the ANN and SVM methods predict values that are further from the actual values in the fall.
Figure 3 shows that the prediction success of the ANN and SVM tests in February is lower in percentage terms compared to other months. We need to provide specific details about this situation. On 6 February 2023, Turkey experienced two major earthquakes affecting 12 provinces. After the earthquakes, the activities of the enterprises in the affected provinces came to a standstill. This situation has resulted in a decrease in regional labor demand. As employment opportunities decreased and migration increased, part-time unemployment increased. This unusual situation caused the tests to make less accurate forecasts for the relevant month compared to the rest of the year. Overall, both algorithms predict general trends well. The differences in some months are due to the country’s changing dynamics.
Figure 3 clearly shows that the autumn and winter months are when unemployment tended to increase in Turkey between 2005 and 2023. Considering the general distribution of the trend, the unemployment level was between 9% and 12%, excluding non-standard deviations. Excluding the general distribution, four periods of maximum unemployment are noteworthy. First, the financial crisis and monetary contraction in the markets, triggered by the global mortgage crisis following the collapse of large US banks in 2008, significantly impacted small-scale employers in Turkey, leading to their bankruptcy. Therefore, the contraction in labor demand led to an increase in unemployment.
The second period when unemployment reached maximum levels was due to the military coup attempt on 15 July 2016. As a result of the periodic contraction in domestic and foreign demand, markets shrank. Following the increase in socio-political insecurity, foreign capital investment was reduced, causing unemployment to rise to its highest levels. The third period that caused unemployment to reach its maximum levels was the political crisis between Turkey and the US in 2018. The political crisis between Turkey and the US in 2018 created an environment of insecurity in global markets, which negatively affected foreign investors and increased the investment costs of capital owners, leading to the second highest level of unemployment.
Again, looking at Figure 3, at the end of 2019, unemployment reached one of the highest levels in recent history with the outbreak of the coronavirus pandemic in Turkey. To prevent the spread of the pandemic, restrictions and quarantine measures were implemented, resulting in many businesses shutting down or limiting their operations. Economic uncertainties and revenue losses resulted in layoffs to reduce personnel costs. As a result, unemployment rates in Turkey increased significantly, as did the number of job seekers. Figure 3 clearly shows that the unemployment rate in 2012 reached its lowest level in the last 20 years. The stable implementation of economic programs and policies in Turkey, especially after the global effects of the 2008 crisis, and the environment of confidence created by the political stability following the government’s victory in the general elections in 2011 had a positive impact on labor markets, and both domestic and foreign investments increased. As a result, the unemployment rate dropped significantly in the second half of 2012, reaching a low point.
3.2. Model-2
Unlike the first model, the second model used monthly inflation, exchange rate, and labor force (million) data for the years 2005–2022, and estimated the unemployment percentage for 2023 and the following years. As with Model-1, we obtained inflation, exchange rate, and labor force data for 228 months from TURKSTAT [40]. We divided the dataset into 216 months of training and 12 months of test data, applying the cross-validation method to enhance the model’s accuracy. While identifying the model, inflation, exchange rate, and labor force were defined as input parameters. We analyzed the impact of these three parameters’ changes over time on unemployment rates. All the results obtained were further evaluated using various performance criteria.
Figure 4 shows the graph of the expected and actual values of the forecasts made by modeling inflation, the exchange rate, and labor force rates, which are related to unemployment, for 2023. Figure 5 shows a scatter plot for a better understanding of the model. Upon examining the prediction performances of the algorithms, it becomes evident that the XGBoost algorithm produces predictions that are more accurate than the others. Especially in the period including October, November, December, and January, the error percentage of the forecasts is below 1. This shows that the algorithm makes very successful forecasts. ANN and SVM forecasts are generally closer to each other, but ANN usually makes lower forecasts, while SVM makes slightly higher forecasts. Although these two algorithms’ predictions are above the actual values in March and May, they are below the actual values in June and July.
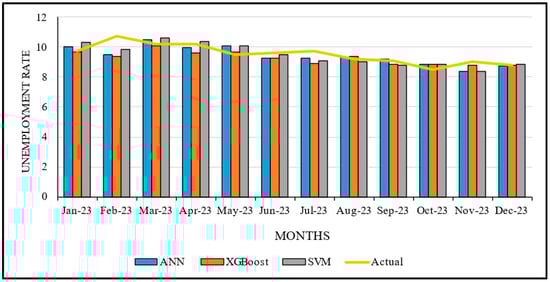
Figure 4.
Actual and predicted values of unemployment rates for 2023.
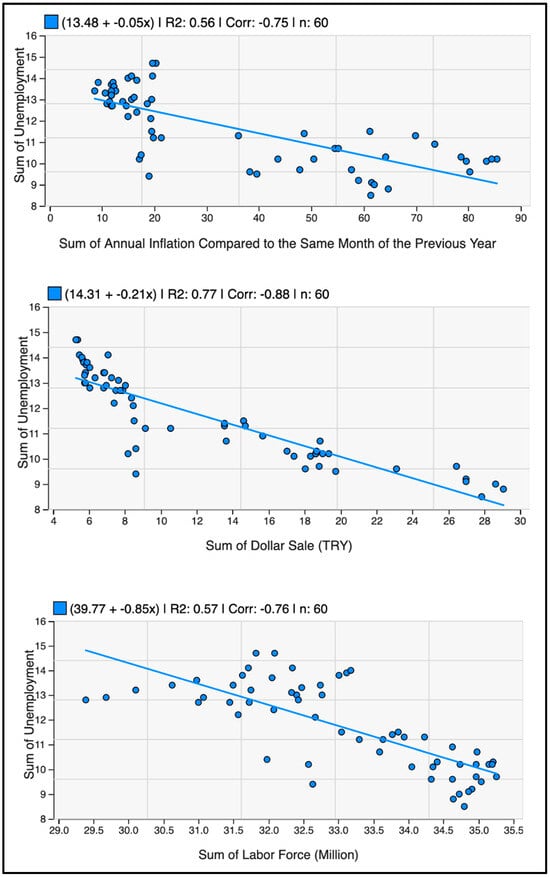
Figure 5.
Scatter plot of inflation, exchange rate, and labor force with total unemployment.
In Figure 5, a scatter plot showing the link between the exchange rate (in TL) and the total unemployment rate, the linear regression line shows a strong negative relationship between the two variables. Similarly, in the correlation analysis, there is a mostly negative link between the exchange rate and unemployment rates. Here, the R2 value shows that the sum of the sales of the exchange rate explains 77% of the change in unemployment rates. According to these data, unemployment rates generally decrease when the dollar exchange rate increases. When the distribution between unemployment and the exchange rate in Turkey is analyzed, it is observed that each unit increase in the exchange rate will lead to a 0.21 unit decrease in the unemployment rate. Although the general expectation of the society is that an increase in the dollar exchange rate will create unemployment, an increase in the exchange rate creates three different scenarios in labor markets. First, the dollar-based decrease in labor costs becomes an opportunity for employers. Secondly, it increases the investment of foreign capital in the country, and, finally, it allows exporting firms to grow.
The scatter plot depicting the correlation between inflation and unemployment rates exhibits a negative correlation. Moreover, there are negative correlations between inflation and unemployment. The R2 value of 0.56 indicates that the sum of annual inflation rates explains 56% of the change in unemployment rates. This situation demonstrates that the unemployment rate decreases every year as inflation increases in Turkey. Given these data, it is consistent with the Phillips curve theory. In line with the Phillips curve hypothesis, this finding suggests that there may be an inverse link between inflation and unemployment in the short run.
The scatter plot of the relationship between the labor force and unemployment shows that negative correlations have become more common over the years. The linear regression table shows that the unemployment rate decreases as the labor force size increases. This shows that the unemployment rate decreases by 0.85 units on average for each increasing million of labor force size. The correlation table shows that the negative correlation between labor force participation and unemployment was highest before and after the 2008 crisis. The young population’s high potential in Turkey has a positive effect on labor force participation. This finding suggests that the increase in the labor force in the economy increases employment opportunities and thus reduces unemployment.
Table 3 shows the performance metrics of Model-1 and Model-2. The results obtained are further explained in the discussion section.
Table 3.
Performance metrics for Model-1 and Model-2.
4. Discussion
This study employs three distinct machine learning techniques, creates two distinct forecasting models, and evaluates the prediction performance of these methods using numerous achievement measures. Depending on the amount of data in the two different models, we observed in the correlation coefficient evaluation section that both models produced prediction data that converged to the targeted accuracy with high correlation. We found that the correlation coefficients of the three different prediction models used ranged from 0.83 at the highest to 0.39 at the lowest. However, we found the highest determination coefficient at 0.70 and the lowest at 0.15. This means that, in Model-1, the ANN performs better than in Model-2, with higher R2 and r values. This indicates that the ANN explains the data very well and predicts with high accuracy. The SVM model has lower MAE (0.555) and RMSE (0.7) values than the ANN model, indicating that the magnitude of the model’s prediction errors is generally lower. However, its MAPE value is quite high (0.606), which indicates that it can make large percentage errors in some cases. Furthermore, the SVM model is more successful in reducing the overall error size, with lower MAE and RMSE values, whereas the ANN model performs better in terms of percentage errors.
Looking at Model-2, the correlation and determination coefficients are higher than in the SVM model’s performance in Model-1. This shows that the SVM model explains the data better and represents the relationship between variables better. Furthermore, in Model-2, the ANN and SVM produced better results with fewer errors than in Model-1, while XGBoost produced the fewest errors. Here, the XGBoost model has the lowest prediction error, MAE (0.368), and MAPE (0.37) values. This shows that the model makes more sensitive and accurate predictions. However, the RMSE value is slightly higher than for other models (0.518), indicating that the error magnitude may be larger in some predictions.
If the priority in this study is to better explain the data and represent the relationship between independent variables, the ANN model of Model-1 is the most appropriate choice. However, if minimizing prediction errors and making more precise predictions is the priority, the XGBoost model of Model-2 is the most appropriate choice. In terms of overall performance, all models of Model-2 (ANN, SVM, and XGBoost) have lower prediction errors than those of Model-1. Therefore, it may be more reasonable to choose Model-2 to reduce prediction errors.
Considering the studies on unemployment forecasting in the literature, it is evident that the results obtained for the two models we used are more successful than in many studies. Yamacli and Yamacli [41] conducted a study where they used ARIMA and ANN methods to measure the impact of oil, exchange rate, and interest rate on unemployment. Their forecasting models achieved R2 values of 0.70 and 0.82, effectively explaining the relationship between the variables. This study presented and used bGEBA-SVM, a wrapper feature selection approach based on the improved bat algorithm (GEBA) and Support Vector Machine, to predict and assess the slow employment phenomenon among college students [42]. The study selected 1694 graduates from Zhejiang universities’ class of 2022 and made predictions based on 18 characteristics. The study achieved a success rate of 92. Another study on unemployment forecasting investigated and analyzed time series and machine learning models for unemployment forecasting in various countries (Mediterranean, Baltic, Balkan, Scandinavian, and Benelux countries) for different forecast horizons [43]. It makes a comparison of time series, neural networks, Support Vector Machines, and multivariate adaptive regression spline models using monthly seasonally adjusted unemployment data (Eurostat database). We evaluated multiple models for each of the considered forecasting approaches and adopted a search strategy to determine the best one. Another study by Renkle and Ros [13], which investigates Latin America’s recent unemployment performance, examines the effect of the real exchange rate on unemployment. It shows the model of the determinants of unemployment and the channels through which the RER influences unemployment performance, as well as stylized facts and empirical results about this relationship, giving special attention to the cases of Latin American countries.
When we compare our study to similar studies in the literature, we find that both the accuracy percentages of the models we created and our unique approach have brought a fresh perspective to this field of research. While many studies in the past have generally utilized statistical data, investigations using machine learning methods have attempted to make predictions on single variables. Particularly in the second model we employed, the impact of three distinct independent parameters on the model’s performance and the achievement of low error percentages are crucial factors for the study’s success. Also, both models reveal that certain values in the actual and predicted months of 2023 closely align with each other, while others deviate significantly. The main reason for this is the depreciation of the Turkish lira against foreign currencies in the last two years, as well as the high inflation rate. Upon examining the graphs in Figure 1 and Figure 3 of the two models, it becomes evident that all actual and forecasted values exhibit consistency, with the exception of certain months. The sudden changes in economic interest rates, policy effects, and their impact on society explain the inconsistencies. The findings of this study provide important clues for understanding the impact of economic policies on macroeconomic indicators. It also emphasizes the importance of economic policymakers observing the balance between exchange rates, inflation, and labor force rates.
5. Conclusions
This study aimed to estimate the unemployment rate in Turkey on a monthly basis using machine learning methods. We modeled the monthly exchange rate, inflation rate, and labor force data obtained from TURKSTAT for the period 2005–2023 in two separate applications. The study employed two distinct models for this purpose. We first modeled unemployment data for the years 2005–2023 by dividing them into training and testing processes using ANN and SVM algorithms, and then calculated the accuracy and performance percentages of the obtained results. The results confirmed that the ANN and SVM are highly effective in predicting unemployment rates using previous data. These models were able to capture complex, non-linear relationships in the data and provide higher accuracy rates compared to traditional statistical methods. As the next step, the inclusion of the XGBoost algorithm in the second model significantly enhanced forecasting accuracy. This model, which incorporated additional economic parameters such as inflation, exchange rate, and labor force data, outperformed the ANN and SVM models. The XGBoost algorithm’s ability to handle large datasets and complex models makes it a valuable tool for economic forecasting. We then compared the forecasting performances of the ANN, SVM, and XGBoost models using standard evaluation parameters such as RMSE, MAE, MAPE, and R2. The study’s findings reveal that economic parameters such as exchange rate, inflation, and labor force have an impact on unemployment. The study’s forecasting results coincided with the actual unemployment rates. Moreover, after comparing all the findings and results, we concluded that the ANN is the best prediction method for Model-1, and the XGBoost model is the best for Model-2.
This study also shows that unemployment rates in Turkey are subject to seasonal fluctuations, with lower rates observed during the summer months due to increased demand in sectors such as agriculture and tourism. Moreover, major economic and political events, such as the 2008 financial crisis, the 2016 coup attempt, and the COVID-19 pandemic, had profound impacts on unemployment rates. These periods of instability underscore the importance of using robust predictive models that can adapt to sudden changes in economic conditions. In addition, the study provides valuable insights for policymakers. By using machine learning models, policymakers can gain better insight into unemployment trends, enabling more informed decisions to mitigate unemployment. The ability to forecast unemployment accurately helps in designing targeted interventions to stabilize the labor market, particularly during times of economic uncertainty. The research demonstrates that machine learning models are powerful tools for economic forecasting offering high accuracy and adaptability. The findings advocate for broader adoption of these methods in macroeconomic studies and policy planning. Future research could expand on this study by incorporating additional economic indicators, exploring other machine learning algorithms, and applying these models to different geographical regions or economic contexts. Furthermore, real-time data integration could enhance the models’ responsiveness to immediate economic changes, providing even more timely and accurate forecasts. In conclusion, this study underscores the potential of artificial intelligence and machine learning to transform economic forecasting, making it more precise, comprehensive, and reliable. By leveraging these advanced techniques, Turkey and other countries can better navigate the complexities of their labor markets, fostering economic stability and growth.
Author Contributions
Methodology, M.G. (Mehmet Güler); Validation, M.G. (Mustafa Güler); Formal analysis, M.G. (Mustafa Güler); Investigation, A.K. and Ö.K.; Resources, K.H.D.; Data curation, R.Ü.; Writing—original draft, M.G. (Mustafa Güler); Writing—review and editing, M.G. (Mehmet Güler), E.E., Y.S.T. and E.N.; Visualization, R.Ü.; Supervision, Y.S.T. and E.N. All authors have read and agreed to the published version of the manuscript.
Funding
This research received no external funding.
Data Availability Statement
Data are contained within the article.
Conflicts of Interest
The authors declare no conflicts of interest.
References
- ILO. Statistics of Labour Force, Employment, Unemployment and Underemployment; ILO: Genova, Italy, 1982; Available online: https://www.ilo.org/public/libdoc/ilo/1982/82B09_438_engl.pdf (accessed on 28 February 2024).
- Friedman, M. Nobel Lecture: Inflation and Unemployment. J. Political Econ. 1977, 85, 451–472. [Google Scholar] [CrossRef]
- Haug, A.A.; King, I.P. Empirical Evidence on Inflation and Unemployment in the Long Run. Univ. Otago Econ. Discuss. Pap. Ser. 2011, 1109. [Google Scholar] [CrossRef]
- Berentsen, A.; Menzio, G.; Wright, R. Inflation and Unemployment in the Long Run. Am. Econ. Rev. 2011, 101, 371–398. [Google Scholar] [CrossRef]
- Ormerod, P.; Rosewell, B.; Phelps, P. Inflation/unemployment regimes and the instability of the Phillips curve. Appl. Econ. 2013, 45, 1519–1531. [Google Scholar] [CrossRef]
- Alisa, M. The Relationship between Inflation and Unemployment: A Theoretical Discussion about the Philips Curve. J. Int. Bus. Econ. 2015, 3, 89–97. [Google Scholar] [CrossRef]
- Karacan, R. Phillips Eğrisi Yaklaşımı İle Türkiye’de Enflasyon ve İşsizlik ArasındakiNedensellik İlişkisi. Socıal Ment. Res. Thınkers J. 2018, 4, 242–249. [Google Scholar]
- Uysal, D.; Erdoğan, S. Enflasyon ile İşsizlik Oranı Arasındaki İlişki Ve Türkiye Örneği (1980–2002). Sos. Ekon. Araştırmalar Derg. 2003, 3, 35–47. [Google Scholar]
- Ayvaz Güven, E.T.; Ayvaz, Y.Y. Türkiye’de Enflasyon Ve İşsizlik Arasındaki İlişki: Zaman Serileri Analizi. KSÜ Sos. Bilim. Derg. 2016, 13, 241–262. [Google Scholar]
- Akiş, E. Türkiye’de Enflasyon ile İşsizlik Arasındaki İlişki (2005–2020). Yüzüncü Yıl Üniv. Sos. Bilim. Enstitüsü Dergisi 2020, 49, 403–420. [Google Scholar]
- Gordon, R.J. Inflatıon, Flexıble Exchange Rates, and the Natural Rate of Unemployment; Nber Working Paper Series: Cambridge, MA, USA, 1981. [Google Scholar] [CrossRef]
- Bilgin, M.H. Döviz Kuru İşsizlik İlişkisi: Türkiye Üzerine Bir İnceleme. Döviz Kuru İşsizlik İlişkisi Türkiye Üzerine Bir İnceleme 2004, 8, 80–94. [Google Scholar]
- Frenkel, R.; Ros, J. Unemployment and the Real Exchange Rate in Latin America. World Dev. 2006, 34, 631–646. [Google Scholar] [CrossRef]
- Bakhshi, Z.; Ebrahimi, M. The effect of real exchange rate on unemployment. Mark. Brand. Res. 2016, 3, 4–13. [Google Scholar] [CrossRef]
- Choi, Y.; Choi, K.E. Unemployment and optimal exchange rate in an open economy. Econ. Model. 2017, 69, 82–90. [Google Scholar] [CrossRef]
- Ani, E.C.; Joel, E.; Baajon, M.A. Exchange Rate and Unemployment in Nigeria: An Analysis. Int. J. Fam. Bus. Manag. 2019, 3, 1–7. [Google Scholar]
- Selim, S.; Ayvaz Güven, E.T. Türkiye’de Enflasyon, Döviz Kuru ve İşsizlik Arasındaki İlişkinin Ekonometrik Analizi. Ekon. Ve Sos. Araştırmalar Derg. 2014, 10, 127–145. [Google Scholar]
- Kakinaka, M.; Miyamoto, H. Unemployment and labour force participation in Japan. Appl. Econ. Lett. 2012, 19, 1039–1043. [Google Scholar] [CrossRef]
- Özerkek, Y. Unemployment and Labor Force Partıcıpatıon: A Panel Coıntegratıon Analysıs For European Countrıes. Appl. Econom. Int. Dev. 2013, 13, 67–76. [Google Scholar]
- Yenilmez, F.; Kılıç, E. Türkiye’de İşgücüne Katılma Oranı-İşsizlik Oranı İlişkisi: Cinsiyet ve Eğitim Düzeyine Dayalı Bir Analiz. Eskişehir Osman. Üniv. İİbf Derg. 2018, 13, 55–76. [Google Scholar]
- Phillips, A.W. The Relation Between Unemployment and the Rate of Change of Money Wage Rates in the United Kingdom, 1861–1957. Lond. Sch. Econ. Political Sci. 1958, 25, 283–299. [Google Scholar] [CrossRef]
- Moshiri, S.; Brown, L. Unemployment Variation Over the Business Cycles: A Comparison of Forecasting Models. J. Forecast. 2004, 23, 463–539. [Google Scholar] [CrossRef]
- Purpa, N.Z.; Anjar, W.; Okta, I.O. Implementation of Ann for Prediction of Unemployment Rate Based on Urban Village in 3 Sub-Districts of Pematangsiantar. Int. J. Inf. Syst. Technol. 2019, 3, 107–116. [Google Scholar]
- Mutascu, M.; Hegerty, S.W. Predicting the Contribution of Artifcial Intelligence to Unemployment Rates: An Artifcial Neural Network Approach. J. Econ. Financ. 2023, 47, 400–416. [Google Scholar] [CrossRef]
- Tufaner, M.B.; Sözen, İ. Forecasting Unemployment Rate in the Aftermath of the COVID-19 Pandemic: The Turkish Case. İzmir İktisat Derg. 2021, 36, 685–693. [Google Scholar] [CrossRef]
- Stasinakis, C.; Sermpinis, G.; Theofilatos, K.; Karathanasopuolos, A. Forecasting US Unemployment with Radial Basis Neural Networks, Kalman Filters and Support Vector Regressions. Comput. Econ. 2016, 47, 569–587. [Google Scholar] [CrossRef]
- Ansari, A. Application of Neural Network-Support Vector Technique to Forecast U.S. Unemployment Rate. Master’s Thesis, Vest Virginia University, Morgantown, WV, USA, 2014. [Google Scholar]
- Sermpinis, G.; Charalampos, S.; Konstantinos, T.; Andreas, K. Inflation and Unemployment Forecasting with Genetic Support Vector Regression. J. Forecast. 2014, 33, 471–487. [Google Scholar] [CrossRef]
- Priliani, E.M.; Putra, A.T.; Muslim, M.A. Forecasting Inflation Rate Using Support Vector Regression (SVR) Based Weight Attribute Particle Swarm Optimization (WAPSO). Sci. J. Inform. 2018, 5, 118–127. [Google Scholar] [CrossRef]
- Adenomon, M.O. Modelling and Forecasting Unemployment Rates in Nigeria Using Arima Model. FUW Trends Sci. Technol. J. 2017, 2, 525–531. [Google Scholar]
- Kütük, Y.; Güloğlu, B. Prediction of Transition Probabilities from Unemployment to Employment for Turkey Via Machine Learning and Econometrics: A Comparative Study. İktisat Araştırmaları Derg. 2019, 3, 58–75. [Google Scholar]
- Fausett, L.V. Fundamentals of Neural Networks: Architectures, Algorithms and Applications; Pearson Education: Noida, India, 2006. [Google Scholar]
- Xie, X.; Pu, Y.F.; Wang, J. A fractional gradient descent algorithm robust to the initial weights of multilayer perceptron. Neural Netw. 2023, 158, 154–170. [Google Scholar] [CrossRef]
- Maehashi, K.; Shintani, M. Macroeconomic forecasting using factor models and machine learning: An application to Japan. J. Jpn. Int. Econ. 2020, 58, 101104. [Google Scholar] [CrossRef]
- Atallah, R.; Al-Mousa, A. Heart Disease Detection Using Machine Learning Majority Voting Ensemble Method. In Proceedings of the 2nd International Conference on New Trends in Computing Sciences (ICTCS), Amman, Jordan, 9–11 October 2019. [Google Scholar]
- Shevade, S.K.; Keerthi, S.S.; Bhattacharyya, C.; Murthy, K.R.K. Improvements to the SMO algorithm for SVM regression. IEEE Trans. Neural Netw. 2000, 11, 1188–1193. [Google Scholar] [CrossRef] [PubMed]
- Chen, T.; Guestrin, C. Xgboost: A Scalable Tree Boosting System. In Proceedings of the 22nd acm Sigkdd International Conference on Knowledge Discovery and Data Mining, San Francisco, CA, USA, 13–17 August 2016. [Google Scholar]
- Lewis, C.D. Industrial and Business Forecasting Methods; Butterworths Publishing: London, UK, 1982; ISBN 978-0408005593. [Google Scholar]
- Total Unemployment Rate & TURKSTAT. 2024. Available online: https://data.tuik.gov.tr/Kategori/GetKategori?p=istihdam-issizlik-ve-ucret-108&dil=1 (accessed on 25 May 2024).
- Inflation, Exchange Rate and Labor Force Rates & TURKSTAT. 2024. Available online: https://data.tuik.gov.tr/Kategori/GetKategori?p=enflasyon-ve-fiyat-106&dil=1 (accessed on 25 May 2024).
- Yamacli, D.S.; Yamacli, S. Estimation of the unemployment rate in Turkey: A comparison of the ARIMA and machine learning models including COVID-19 pandemic periods. Heliyon 2023, 9, e12796. [Google Scholar] [CrossRef] [PubMed]
- Wei, Y.; Rao, X.; Fu, Y.; Song, L.; Chen, H.; Li, J. Machine learning prediction model based on enhanced bat algorithm and support vector machine for slow employment prediction. PLoS ONE 2023, 18, e0294114. [Google Scholar] [CrossRef] [PubMed]
- Katris, C. Prediction of unemployment rates with time series and machine learning techniques. Comput. Econ. 2020, 55, 673–706. [Google Scholar] [CrossRef]


Disclaimer/Publisher’s Note: The statements, opinions and data contained in all publications are solely those of the individual author(s) and contributor(s) and not of MDPI and/or the editor(s). MDPI and/or the editor(s) disclaim responsibility for any injury to people or property resulting from any ideas, methods, instructions or products referred to in the content. |
© 2024 by the authors. Licensee MDPI, Basel, Switzerland. This article is an open access article distributed under the terms and conditions of the Creative Commons Attribution (CC BY) license (https://creativecommons.org/licenses/by/4.0/).