Abstract
This study examines the relationship between digital transformation and both the corporate image and brand awareness of global companies through the mediating effects of functional value, symbolic value, experiential value, emotional value, and social value, all of which are components of customer value. This study mainly focuses on the structural relationship in which digital quality, which is subdivided into system quality, information quality, and service quality, affects non-financial corporate image as a company with good corporate governance, a company that is good at social contribution activities, and an eco-friendly company through the mediating function of customer value. As part of the empirical analysis, an online survey was conducted among 504 employees from different global companies in China, and the PLS structural equation model was employed as a specific analysis tool. Key findings indicate that changes in system quality, information quality, and service quality resulting from digital transformation have varying influences on the five components of customer value. These factors also deliver the effect of improving corporate image in the ESG dimension by penetrating customers’ emotional and social values. Essentially, all components of dynamic capability significantly impact all components of customer value. Furthermore, all components of customer value influence corporate performance, while uncertainty affects a company’s market performance.
1. Introduction
Companies around the world have begun to center their business strategies on the informational technology (IT) concept of digital transformation, an essential element of corporate management that goes beyond computerization and digitization [1]. In doing so, they are rapidly adopting digital transformation as a dynamic response of global companies to business environment uncertainty to dramatically increase their competitive advantage by creating customer value or to secure growth engines by advancing new businesses while proactively responding to changing digital technologies, such as artificial intelligence (AI), machine learning (ML), big data, and cloud services [2].
For companies to use digital transformation in achieving their business goals, they need to strategize for building innovative business types [1,3] and create high value-added profits based on them, which requires innovative changes to the organization [4], processes [5], and operational resources. What we also note is that a company’s digital transformation is linked to the sensing, seizing, and reconfiguring of dynamic capabilities, which are traditional strategic elements of global companies [6,7,8]. The reason is that digital transformation based on dynamic capabilities creates new types of customer value so that companies can respond sensitively to market opportunities and changes [9].
Dynamic capability is the ability of a company to control all its available resources [10]. Companies that sense technological changes and changes in market demand can therefore transform their business models and reorganize their resources, capabilities, and organizations accordingly [8]. Digital transformation based on dynamic capability develops traditional customer values that are functional, symbolic, and experiential values and further creates new types of customer value, such as social value, which is the unique identity of a group through a process that can reflect the preferences and interests of individual groups, and emotional value that is felt from a particular brand, service, or product through business model innovation.
Previous studies applying the above-mentioned factors to the exploration of digital transformation mainly compared small and medium-sized enterprises (SMEs) and large companies [11,12]. Other studies mainly focused on technology, marketing factors, and strategic management dimensions [13,14,15,16]. Digital transformation research comparing small and medium-sized businesses and large corporations emphasizes the drivers of digital transformation, such as new technologies and digital business development. Meanwhile, digital transformation research at the level of strategic management focuses on simultaneously pursuing, exploiting, and exploring strategies as essential elements for successful digital transformation and strategic leadership that utilizes dynamic capabilities and organizational learning. Hence, only a few studies have explored the impact of dynamic capability and digital transformation on corporate performance through customer value. Research on the relationship between service quality perceived by customers and digital transformation [17,18] also examines the direct effect on the relationship between changes in service quality due to digital transformation or examines the mediating function of digital transformation for the sustainable performance of an organization or considers moderators such as servitization. Therefore, detailed consideration of customer value linked to digital transformation based on dynamic capabilities has so far been rare.
This study aims to examine the impact of digital transformation and dynamic capability on corporate performance through customer value and provide theoretical and practical insights by surveying employees of global companies in China, along with empirical analysis. In doing so, we conceptualize the changes resulting from digital transformation as digital quality and subdivide this further into system, information, and service quality to identify different paths through which individual components stimulate various types of customer value.
In accordance with the above-mentioned research aims, the main research question posed by this article is to discover whether the three detailed components of digital quality are unique to customer value channels that affect non-financial market performance such as corporate image and brand awareness. The authors’ answer to this question is affirmative because traditional customer value channels such as functional, symbolic, and experiential values serve as practical channels for customer benefit, while customer value channels such as emotional and social value function as cognitive channels that stimulate corporate image, along with brand awareness. In particular, the corporate image addressed in this article is that of a company with good corporate governance, a company that is good at social contribution activities, and an eco-friendly company. Hereby, this study examines the meaning of digital transformation as another channel for ESG management, which has recently become a major issue in corporate management.
This study also demonstrates several methodological novelties. One is creating the concept of digital quality, which is subdivided into system, information, and service quality, as another component of service quality. It also has academic significance by examining the function of customer value that mediates service quality and corporate performance. Additionally, it conducts intradisciplinary research between sub-disciplines of business administration by examining a research model that simultaneously inputs strategic and marketing elements using data from global companies that entered China, a major emerging market.
Given the above research objectives, this study is organized as follows: Section 1, the introduction, describes the research objectives and question; Section 2 explains the theoretical background and research hypotheses; Section 3 covers the research design and details the research model, operational definition and measurement of variables, and analysis tools; Section 4 illustrates the results of the analysis, including demographic characteristics, evaluation, and validation; Section 5 discusses theoretical and practical implications based on the findings; and finally, Section 6 summarizes the findings and recommends future research directions.
2. Theoretical Background and Hypothesis Development
2.1. Main Concepts
2.1.1. Digital Transformation
The contemporary business landscape is characterized by the rapid and widespread adoption of digital technologies [19]. Digital transformation refers to transforming existing operations to increase efficiency and reconfigure business models to enable companies to cross industry boundaries [20,21], with adopters emerging as new competitors in areas traditionally dominated by incumbents [2,9]. To sustain this digital transformation, it is essential to consider its components and methodology [22,23], and digital-quality control from the customer’s perspective has been identified as an important factor in digital technology-based tasks [22,24].
Hwang, Lee, and Kim [25] analyzed the quality of the digitalization of library services and organized digital quality into three independent variables—system quality, information quality, and service quality. In doing so, they found that system quality consists of accessibility, security, and ease of use; information quality comprises sufficiency, variety, up-to-dateness, accuracy, and usefulness; and service quality involves customer support, customization, and reliability. This research used these studies to investigate the association between digital transformation and dynamic capability on companies’ service quality, changes in customer value due to this service quality, and corporate performance, as perceived by customers.
2.1.2. Customer Value
Customer value refers to the overall assessment of the utility perceived by customers, which is the basis for behavior and judgment that encourages customers to pay for or accept a product or service provided by companies [26]. Previous research has used the five values presented by [27] as a theoretical framework, and each element is useful for value analysis because it is distinctive from the others and represents the characteristics of individual products or services.
Through a theoretical review of each field, this study identifies the following five factors as constituents of customer value: tangible and practical functional value, such as the quality and price of a product or service [28]; symbolic value, which represents something unique that can be distinguished from others [29]; experiential value, which is obtained by using a product or service [30]; emotional value, which is felt from a particular product or service perceived by customers [27]; and social value, which refers to a unique sense of attribution by reflecting the interests and preferences of the individual group that consumes the product [27].
2.2. Hypothesis Development
2.2.1. Digital Transformation
While previous studies have illustrated the positive effects of digital transformation as a determinant of performance improvement, a key issue in traditional corporate research, discussions on the process of improving performance beyond the direct effect on firm performance remain understudied. Customer-perceived quality of service [31], including digital quality, is more important than objective quality in purchasing decisions [24]. Digital transformation innovates the business model that is offered to customers, and the resulting output, digital quality, can be divided into system quality, namely accessibility, security, and ease of use; information quality, namely sufficiency, variety, up-to-dateness, accuracy, and usefulness; and service quality, namely customer support, customization, and reliability [25].
To understand the process that digital transformation improves corporate performance, it is necessary to examine the mediating process of enhancing customer value, and the relationship between digital transformation and the creation of customer value is expected to be diverse because the value that customers seek in the consumption process is diverse. The values that customers seek through the consumption of products and services vary, including functional value, which relates to the characteristics and perceived functions of products and services; symbolic value, which allows customers to express their image; experiential value, which allows customers to experience products and services that meet their level and repeat consumption; emotional value, which solves customers’ inconveniences and makes them feel interest and enjoyment; and social value, which makes them feel a sense of belonging to a certain group and evokes shared values.
In general, the impact of digital quality, such as information, systems, and service quality, on customer differences due to digital transformation is expected to be positive. Nevertheless, the impact of each component on customer value is expected to vary depending on the characteristics of the company and the industry. Therefore, this research sets the following hypotheses:
Hypothesis 1.
Digital transformation will have a positive (+) relationship to customer value.
Hypothesis 2.
The impact of digital quality on customer value creation will vary by component (system, information, service).
2.2.2. Dynamic Capability
Dynamic capability refers to “a firm’s ability to recognize rapidly changing business environments and to integrate, deploy, and reconfigure available resources to respond to them” [10]. It is used by companies to deal with rapid internal and external environmental changes [8,32]. Dynamic capability can be divided into sensing, seizing, and reconfiguration. Sensing means the ability to obtain competitive advantages by rapid response in the changing business landscape and identify technological and market opportunities. Seizing indicates the ability to input available resources to the right place at the right time among the various opportunities identified. Reconfiguration is the ability to continuously align specific tangible and intangible assets and organizational operations [8].
Dynamic capability refers to the ability of a company to actively respond to the changing business environment to maintain its capability to compete sustainably [33] and is an important research topic in strategic management [34] and knowledge management [35] to achieve corporate performance. When the business environment changes, the company senses it and adjusts the available resources to respond quickly to secure competitiveness and integrates and reconfigures the company’s resources so that the various market opportunities identified can become the company’s revenue source, which is an essential factor for the company to create a competitive advantage. However, prior research on the impact of the components of dynamic capabilities on corporate performance, such as the ability to reconfigure resources of value [8,33,36] and the ability to manage costs efficiently [37], does not suggest that dynamic capabilities automatically improve corporate performance [38].
The dynamic capabilities of sensing, seizing, and reconfiguring [8] improve corporate performance through a channel called customer value. Customer value is the evaluation of a product or service based on the expected value generated by its consumption through market transactions. The components of creating customer value through digital transformation can be categorized as functional value, which can provide excellent performance for the price with a safe design and a design that fits the customer’s taste; symbolic value, which can make customers feel that they are receiving special benefits with an attractive and sophisticated image; experiential value, which can provide customers with beneficial, differentiated, diverse, and rich experiences; emotional value, which can put customers’ minds at ease with interesting fun and a lot of joy; and social value, which is a sense of belonging to a certain group or class.
Sensing refers to using well-established internal processes to clarify the target market and identify customer needs, changes in trends, and related innovative activities while always observing industry trends [8]. Therefore, it creates customer value satisfaction by providing products and services that meet the needs of customers in the target market by providing products and services consistent with the trends of market changes and developing new products. It also measures the current value, potential value, and long-term value of customers in the target market to facilitate corporate decision-making so that companies invest in securing solutions to acquire customers and maintain continuous connectivity. Moreover, it strengthens the seizing ability to collect reasonable opinions from customers and reflect them in corporate management and actively develop new business models while changing the existing way of operation. Firms with such sensing and seizing capabilities then engage in reconfiguration activities to absorb and integrate the knowledge and know-how gained by formulating and implementing new marketing strategies in response to the changes in the times identified through sensing and seizing while applying new ways of redeploying resources as needed. This dynamic capability, which consists of a series of sensing–seizing–reconfiguration capabilities, ultimately realizes customer value satisfaction based on new product-oriented need satisfaction and customer value creation based on new market-oriented need creation through technology orientation that leads technological change and customer orientation that continuously strives to meet changes in customers’ needs. Therefore, the following hypothesis was postulated:
Hypothesis 3.
Dynamic capability and customer value will have a positive (+) relationship.
2.2.3. Customer Value and Non-Financial Market Performance
Corporate performance refers to the result of the synthesis of highly efficient internal organizational power, externally available networks, and management strategies for market changes, and thus can be regarded as a company’s competitiveness [39]. Corporate performance can be mainly divided into financial and non-financial indicators [40]. Financial indicators are measured using objective financial information, such as profitability, return on assets, return on revenue, return on equity, sales, etc. [41]. Non-financial indicators can be measured from a customer perspective, internal perspective, learning growth perspective, etc. [42]. Non-financial indicators are more important for corporate performance because they can be a source of financial indicators and can be used to select and utilize competitive components within the organization [43]. Among the non-financial indicators, this study selected corporate image and brand awareness from the customer perspective [44]. This is the ability to prepare excellent products and services and translate them into sales.
A corporate image is a cumulative impression of continuous exposure of customers to a company’s products or services, and it is a holistic impression that reacts immediately to certain information [30]. The determinants of corporate image are various, including the role of the company, such as attention to providing excellent quality, low prices, and services, and support from social welfare dimensions, such as culture and the arts [45]. However, customer value, which comprises functional, symbolic, experiential, emotional, and social value, also functions as an important channel. Although the meaning of value varies depending on the type of product or service in each industry, it has similarities in that the creation of high value acceptable to customers is directly related to corporate performance.
Brand awareness, on the other hand, refers to the ability to encourage customers to distinguish and select products or services that they have purchased before or heard of from among the many brands to which they have previously been exposed [46]. Therefore, to increase the likelihood that a particular product or service will be purchased by a customer, brand awareness must be increased [47], which then leads to better corporate performance through higher purchasing power [48]. Since the information promoted in various ways that customers can recognize is functioning with the customer value channel, the following hypothesis was posited:
Hypothesis 4.
Customer value and corporate performance (corporate image, brand awareness) will have a positive (+) relationship.
2.2.4. Uncertainty
Uncertainty is defined as “recognizing that risk in something is increased or volatility is likely to happen but finding it difficult to specify the timing” [49,50]. Uncertainty is one of the most common factors reducing the effectiveness of corporate management, and when opaqueness to the future is increased according to its level, it acts as an obstacle to top management decision-making [51,52,53].
Although companies can maintain corporate performance through management activities that reflect their dynamic capabilities to keep uncertainty at a low level [54,55], uncertainty is generally not an endogenous factor that companies can control but rather a given from the environment (i.e., an exogenous factor that they cannot control). Types of uncertainty can be categorized as environmental uncertainty [56,57]; technological uncertainty [58]; state, effect, and response uncertainty [59]; competitive uncertainty; and supplier uncertainty [60]. It can also be classified into perceived and residual uncertainty, with perceived uncertainty being the factor to which the firm responds [52].
In this study, following the methodologies of [61] and [8] regarding surveys for empirical analysis, uncertainty is divided into environmental (market) uncertainty and technological uncertainty. Environmental (market) uncertainty takes the unpredictability and variety of changes in customer needs for products and services as a proxy and technological uncertainty is measured by the unpredictability and speed of technology and changes applied to products and services.
Each company has its business domain, and each domain has its structural characteristics, such as the structure of the industry, the stability and growth potential of the market, and the difficulty of entry barriers. These elements of environmental uncertainty have different fits to individual firms and thus significantly impact corporate performance [62]. In an environment of increasing uncertainty, companies need to maintain a certain level of competitive advantage through continuous innovation activities linked to existing business areas, as well as preparedness for new business areas and the ability to efficiently adapt to technology [63].
In perceiving the advent of uncertainty, corporations invest heavily in technology development to gain and maintain competitive advantage [64,65,66], but this may adversely affect short-term corporate performance [67]. In addition, to proactively respond to changes in the marketplace, companies increase their investment heavily in maintaining and revitalizing their networks [68,69], but this may not generate direct performance improvements.
Uncertainty can therefore have both a negative and a positive function in controlling the effects of sharpened competitive advantage and strategic actions that firms pursue to improve performance. When uncertainty is high, companies mobilize their resources to undertake activities that reduce uncertainty, which can impede their ability to achieve their goals. However, the strategic choice of mobilizing and investing resources to respond to technological changes and changes in customer needs is to invest available resources in expanding existing markets and creating new markets, which results in meeting customer needs through technological innovation and new product development. Companies’ efforts to respond to rapid technological changes in the market and changes in various customer needs strengthen their viability in increasing market competition, allowing only companies with quality technology to survive in the market. As a result, customers’ satisfaction with the products and services provided by these companies increases. This eventually enhances the image of the surviving companies and strengthens brand awareness. Therefore, the following hypothesis was developed:
Hypothesis 5.
Uncertainty (technology uncertainty and market uncertainty) will have a positive (+) relationship with corporate performance (corporate image and brand awareness).
3. Methodology
3.1. Research Model
This study aims to empirically examine the effects of digital transformation and dynamic capabilities on corporate performance through customer value. Based on the theoretical background and research hypotheses, digital transformation consists of system, information, and service quality; dynamic capabilities include sensing, seizing, and reconfiguration; and customer value involves functional, symbolic, experiential, emotional, and social values. To investigate the effect of these on corporate image brand awareness and corporate performance, a research model was designed as follows (Figure 1):
where CP refers to corporate performance, DC refers to dynamic capabilities, DT refers to digital transformation, CV refers to customer value, UNC refers to uncertainty, ε is an error term, and i indicates an entity.
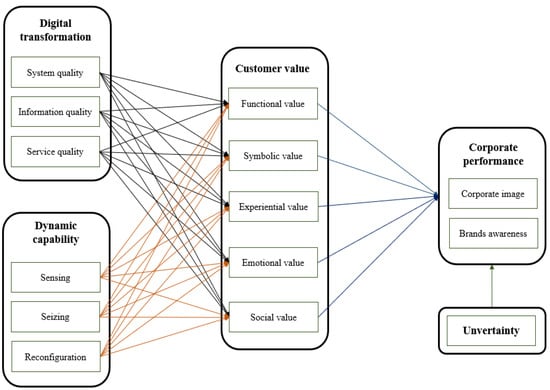
Figure 1.
Research model.
3.2. Variable Measurement
The conceptual definition of each variable and measurement variables are described in Table 1. For all measurement items used in the survey, a seven-point Likert scale, which ranges from ‘not at all’ to ‘very probably’, was used for respondents to evaluate each item (see Appendix A).
3.2.1. Digital Transformation
On the premise that digital transformation refers to developing a business model in the form of the provision of products and services to customers, quality was largely divided into system quality, information quality, and service quality based on research showing that the quality of service perceived by customers [31] is more important than the objective quality [24]. System quality was subdivided into accessibility, security, and ease of use, which was then evaluated with six items: ‘fast access’ and ‘available at any time’ for accessibility; ‘safe from hacking’ and ‘excellent security system’ for security; and ‘simple usage’ and ‘provision of user-friendly interface (system, design)’ for ease of use. The information quality was subdivided into sufficiency, variety, up-to-dateness, accuracy, and usefulness, which were evaluated five times in terms of ‘provision of sufficient information’, ‘provision of various information’, ‘provision of up-to-date information’, ‘provision of accurate information’, and ‘provision of useful information’. The service quality was subdivided into customer support, customization, and reliability, which were measured with six items: ‘rapid response to customer requests’ and ‘sincere response to customer requests’ for customer support; ‘provision of customized products that suit customer interests’ and ‘provision of customized products that suit customer knowledge (technology) levels’ for customization; and ‘excellent customer problem-solving ability’ and ‘provision of the promised service (time and content) to customers’ for reliability. To determine whether the measurement index consistently measures the contents of the latent variables, Cronbach’s Alpha value, used to evaluate internal consistency, was examined, and it was confirmed that the value of system quality was 0.767, the value of information quality was 0.772, and the value of service quality was 0.801, all exceeding 0.7, the reference value.
3.2.2. Dynamic Capability
Dynamic capabilities are a company’s ability to recognize rapidly changing business environments and to integrate, build, and reconfigure available internal and external resources and capabilities to adapt to them. Based on the survey items of [8], dynamic capabilities were subdivided into sensing, seizing, and reconfiguration capabilities. The sensing capability was measured with three items: ‘observation of industry trends at all times’, ‘using established processes to identify target markets, changes in customer needs and related innovations’, and ‘continuous participation in professional knowledge exchange activities and seminars’. The seizing capability was measured with three items: ‘investment in securing solutions for customers’, ‘change of operating method by collecting reasonable opinions from customers’, and ‘active development of new business methods’. The reconfiguration capability was measured with three items: ‘execution of new marketing strategies or methods in response to the change of the times’, ‘application of a new method for the redeployment of resources in response to the changing times’, and ‘integration of knowledge and know-how in response to the changes of the times’. To determine whether the measurement index consistently measures the contents of the latent variables, Cronbach’s Alpha value, used to evaluate internal consistency, was examined, and it was confirmed that the value was 0.806, exceeding 0.7, the reference value.
3.2.3. Customer Value
Customer value is a belief in what people desire or want and is also defined as a criterion that determines the organization, direction, and strength of behavior to continuously act as a standard for all behaviors and judgments beyond a specific situation or subject [70]. Based on the research of [27,71], measurement items were subdivided into functional, symbolic, experiential, emotional, and social values. The functional value was measured with three items: ‘provision of design that suits customer’s taste’, ‘safe design’, and ‘provision of superior performance at a low cost’. The symbolic value was measured with three items: ‘good social reputation’, ‘provision of attractive and sophisticated image’, and ‘enabling customers to feel special benefits’. The experiential value was measured with three items: ‘provision of diverse and rich experiences to customers’, ‘provision of beneficial experiences to customers,‘ and ‘provision of differentiated experiences to customers’. The emotional value was measured with three items: ‘providing much pleasure to customers’, ‘making customers feel comfortable’, and ‘providing interesting experiences to customers’. The social value was measured with three items: ‘exhibiting customer’s social status’, ‘enhancing favorability of others toward customers’, and ‘improving customer’s social image’. To determine whether the measurement index consistently measured the contents of the latent variables, Cronbach’s Alpha value was used to evaluate the internal consistency, and it was confirmed that the functional value was 0.724, the symbolic value was 0.773, the experiential value was 0.732, the emotional value was 0.793, and the social value was 0.824, all exceeding 0.7, the reference value.
3.2.4. Corporate Performance
Previous studies seeking to demonstrate the relationship between environmental characteristics, management strategies, and organizational structure as independent variables and corporate performance [55,56] adopt finance performance indicators, such as return on assets (ROA), return on sales (ROS), return on equity (ROE), sales volume, operating margin, return on investment, and labor productivity per employee as proxies for corporate performance. In contrast, this study defines corporate performance as the result of corporate strategies and management judgments made in response to market conditions. Based on the research of [72,73], the proxies were subdivided into corporate image and brand awareness from the perspective of the non-financial performance dimension.
Corporate image is determined by various factors, such as the company’s role in quality and price or support for social welfare [74]; however, in this study, corporate image was measured using three items: ‘evaluated as a company with good corporate governance’, ‘evaluated as a company that makes many social contributions’, and ‘evaluated as an eco-friendly company’. These three measurement criteria are expected to shape the corporate image related to ESG management. Brand awareness was measured with three items: ‘easy to remember the brand’, ‘easy to remember the trademark’, and ‘easy to remember the product category’. To examine whether the measurement index consistently measures the contents of the latent variables, Cronbach’s Alpha value, which evaluates internal consistency, was examined, and it was confirmed that the functional value was 0.811, exceeding 0.7, the reference value.
3.2.5. Uncertainty
Uncertainty is a case in which it is possible to know the possibility that something might happen, but the probability distribution is not known. Based on the research of [75] and [76,77], it was subdivided into technology uncertainty and market uncertainty. The technology uncertainty was measured with two items: ‘difficulties in predicting technological changes applied to products and services’ and ‘rapid changes of technologies in product and service areas’. The market uncertainty was measured with two items: ‘difficulties in predicting changes of customer needs in product and service industries’ and ‘rapid changes of customer needs in product and service areas’. To examine whether the measurement index consistently measures the contents of the latent variables, Cronbach’s Alpha value, which evaluates internal consistency, was examined, and it was confirmed that the value was 0.727, exceeding 0.7, the reference value.

Table 1.
Measurement variables and related studies of research factors.
Table 1.
Measurement variables and related studies of research factors.
| Factor | Conceptual Definition | Measurement Variable | Reference | |
|---|---|---|---|---|
| Digital transformation | System quality | Accessibility | Fast access Available at all times | [78,79,80,81,82] |
| Security | Safe from hacking Superior security system | |||
| Ease of use | Simple usage Provision of user-friendly interface | |||
| Information quality | Sufficiency | Provision of sufficient information | [79,80,83,84,85] | |
| Variety | Provision of various information | |||
| Up-to -dateness | Provision of up-to-date information | |||
| Accuracy | Provision of accurate information | |||
| Usefulness | Provision of useful information | |||
| Service quality | Customer Supported | Rapid response to customer requests Sincere response to customer requests | [78,79,80,81,83,84,85] | |
| Customization | Provision customized products that suit customer interests Provision of customized products that suit customer knowledge (technology) levels | |||
| Reliability | Excellent customer problem-solving ability Provision of promised services to customers | |||
| Dynamic capability | Sensing | Observation of industry trends at all times Identification of the target market, changes in customer needs, and related innovations Continuous participation in professional knowledge exchange activities and seminars | [8,86,87,88] | |
| Seizing | Investment in securing solutions for customers Collection of customers’ reasonable opinions to reflect them in operational method Active development of new business methods | [8,87,88] | ||
| Reconfiguration | Execution of new marketing strategies in response to the current times Redeployment of new resources in response to the current of the times Integration of knowledge or know-how into the organization in response to the current times | [8,87,88] | ||
| Customer value | Functional value | Design that suits customers’ tastes Safe design Superior cost–performance ratio | [27,28,89] | |
| Symbolic value | Good social reputation Sophisticated image Perception of Special benefits | [27,29,72] | ||
| Experiential value | Diverse and rich experience Beneficial experience Differentiated experience | [27,90,91] | ||
| Emotional value | Much pleasure Comfortable state of mind Interesting and funny | [27,72,92] | ||
| Social value | Social status Favorability of others Social image | [27,93,94] | ||
| Corporate performance | Corporate image | Good corporate governance Company that makes many social contributions Eco-friendly company | [73,95] | |
| Brand awareness | Easy to remember the brand Easy to remember the trademark Easy to remember the product category | [49,73] | ||
| Uncertainty | Technology | Difficulties in predicting technological changes Rapid changes in technologies | [75,76,77,96] | |
| Market | Difficulties in predicting changes in customer needs Rapid changes in customer needs | |||
3.3. Data Collection and Analysis Tool
This study surveyed 504 employees working for global companies located in China from 7 June 2022 to 22 June 2022. A survey was requested from an authoritative local professional survey agency in China, and the survey was conducted on organizational members at the manager level or higher who were able to answer the company’s strategic issues. Among the 550 respondents, the final data for 504 respondents were employed in this study, excluding those with missing or careless responses.
If designed systematically, surveys have the advantage of being able to collect quantitative data about a firm’s internal information and of being able to study companies with diverse demographics, geographic locations, and cultural backgrounds. On the other hand, survey data have limitations as it is cognitive rather than empirical. However, following previous research results showing that cognitive data are not that different from objective data, this study intends to use survey data for corporate analysis.
The survey results of this study were analyzed using Smart-PLS3.0 for a structural equation analysis. Structural equation analysis is a statistical technique used to measure abstract concepts presented by researchers and test causal relationships, including correlation and covariance between latent variables [97]. Partial least squares (PLS), a technique of structural equation modeling, is not limited by the number of variables, and analysis can be carried out regardless of sample size. In addition, it is quite useful even if the accuracy of the survey and measurement is somewhat low [98] and can be used when the number of samples is small or the theoretical basis is not sufficient [99].
4. Results
4.1. Analysis
Looking at the demographic characteristics of survey respondents, in terms of nationality, the employees are made up of 498 Chinese people (98.8%), 3 Americans (0.6%), 2 British people (0.4%), and 1 German person (0.2%). In terms of company size, 14 people (2.8%) work for venture companies (start-ups), 205 people (40.7%) for small and medium-sized enterprises, 285 people (56.5%) for mid-sized companies, and no employees work for large corporations. By industrial field, 148 people (29.4%) are engaged in IT and telecommunications, 264 people (52.4%) in the manufacturing industry, 73 people (14.5%) in the service industry, 12 people (2.4%) in the distribution industry, and 7 people (1.4%) in other industries. As for work areas, 87 people (17.3%) are in charge of IT, 100 people (19.8%) are in charge of production, 88 people (17.5%) are in charge of planning, 103 people (20.4%) are in charge of marketing, 38 people (7.5%) are in charge of financial affairs, 80 people (15.9%) are in charge of R&D, and 8 people (1.6%) for others. By position, there are 46 (9.1%) employees (researchers), 177 (35.1%) assistant managers (chiefs), 158 (31.3%) section chiefs (seniors), 50 (9.9%) deputy general managers (responsible persons), and 68 (13.5%) general managers (heads), and there are no executives, and there are five representatives (1.0%). Considering the sample size, the data collected for this study show a balanced proportion between small and medium-sized enterprises and mid-sized companies in terms of company size, and in terms of industry, the logistics industry accounts for a somewhat small proportion, which raises the issue of an imbalanced proportion between industries. Convenience sampling was used for the sampling method, which randomly selects desired companies and respondents from randomly selected regions because this study targets global companies entering Chinese market, and the 95% confidence interval was used. In addition, a robustness test was conducted using bootstrapping to resolve inherent problems caused by the sampling method, and the common method bias and the non-response bias were tested to increase the significance degree of the sample and narrow the sampling error (Table 2).
Table 2.
Demographic characteristics.
4.2. Measurement Model Assessment
Before analysis, a research model assessment was undertaken. A reliability and conceptual validity (convergent validity) test, as well as a multicollinearity analysis between items, were carried out, and discriminant validity was additionally confirmed.
4.2.1. Multicollinearity: Pearson Correlation and Variance Inflation Factor (VIF)
Items that constitute a concept should have independence. If the degree of correlation between these items is high and thus multicollinearity exists, the variance of the regression coefficient expands, and the standard error increases, which results in reliability problems in the estimated regression coefficients or distortion of empirical analysis results [100]. Therefore, in this study, a multicollinearity test between items through Pearson correlation coefficients and variance inflation factor values was performed for verification. Pearson correlation coefficient, an independent measurement method, was used since the tolerance limit equation, another method of checking multicollinearity, is linked to the VIF measurement equation. VIF is used to find variables that cause multicollinearity when the sample size is small and the correlation coefficient between independent variables is large, as in the case of the empirical data used in this study.
In the Pearson correlation coefficient test, the cut-off value, which indicates no multicollinearity problem, is 0.7 (or more). The verification results presented show that none of the configuration items exceeded the cut-off value. Meanwhile, there is a general opinion that a VIF value of more than 10 implies a potential multicollinearity problem [101], while a competing opinion is that a mean VIF value of more than 3.3 for each item suggests multicollinearity [102,103]. This study’s verification results demonstrated that none of the items exceeded 10, the cut-off value based on the general opinion (Table 3).
Table 3.
Pearson correlation.
4.2.2. Reliability and Convergent Validity: Cronbach’s Alpha, Composite Reliability, Average Variance Extraction (AVE)
A factor analysis was conducted on 13 constructs and 57 measurement items used in this study. The analysis found that the factor loading of measurement items constituting each concept was 0.7 or higher. Additionally, the average variance extraction for constructs was greater than 0.5 [104,105], and the Cronbach’s Alpha value was more than 0.7, the reference value, which shows reliability to confirm whether respondents responded consistently to survey questions on the same topic. Meanwhile, the composite reliability, which measures the internal consistency of the measurement of variables, was also higher than the reference value of 0.7 [106], which suggests that the convergent validity of the research model was finally verified (Table 4 and Table 5).
Table 4.
Factor loadings.
Table 5.
Reliability and validity.
4.2.3. Discriminant Validity Test: Criteria
Discriminant validity was performed to identify whether independence was secured between the constructs. The discriminant validity test method is generally tested with two indicators. The outer loading value associated with the construct to which each of the measurement items that constitute one construct belongs should be greater than the cross-loading associated with all constructs [100]. As an alternative to complement this method, a conservative method proposed by [105] is used. This method checks whether the square root of the average variance extraction value is greater than the correlation value between variables [106]. This study conducted discriminant validity using the above two methods. The result of a comparison between outer loading and cross-loading revealed that the outer loading of all items was larger than the cross-loading. For emotional value, the single loading (0.750) is larger than a series of cross-loadings (0.497, 0.371, etc.), and for technology orientation, the single loading (0.705) is larger than a series of cross-loadings (0.420, 0.527, etc.) (Table 6).
Table 6.
Discriminant validity test (Fornell and Larcker method).
4.3. Robustness Verification
To confirm the consistency of the research results, a common method bias test to determine whether the correlation between variables is overestimated and a non-response bias test for errors caused by response time intervals were carried out (Table 7).
Table 7.
Bootstrapping.
4.3.1. Non-Response Bias: [107] T-Test
As suggested by [107], a t-test was conducted on the main variables for 25% of the data collected in the first half and second half of the survey period to identify any potential non-response bias. As a result, there was no significant difference between the averages of the measured variables by group. Therefore, there is no non-response bias.
4.3.2. Common Method Bias: Over/Underestimation Error Confirmation
In the case of the survey data, the problem of common method bias, which is a systematic error in overestimating the correlation between variables, may be latent in representing the “perceived values”, not the actual values for the survey items. The overestimation can lead to an error that makes a statistically insignificant relationship significant, [108,109] or a Type II error, as it reduces the correlation [110]. The method of checking the common method bias is verifying whether all items are grouped into one factor (construct) or whether a dominant factor (construct) explains most of the total variance ([111,112,113,114]. Specifically, Harman’s single-factor test [114] is generally and frequently used. This study adopted this method for common method bias. Harman’s single factor test assumes that the common method bias exists if one factor explains more than 50% of the variance in the measured variables. As a result of the analysis, the explanatory power of the factor with the most explanatory power was found to be 47.93%, which did not account for half of the total explanatory power, confirming that there was no problem with the common method bias.
4.3.3. Bootstrapping
Because PLS-SEM does not assume that data have a normal distribution, bootstrapping is needed to proceed with the test of significance. In addition, bootstrapping was performed to check the consistency of the analysis results of this study. Bootstrapping does not require assumptions about the distribution of variables or the standard distribution of statistics and can be applied to small sample sizes, as in this study using 504 survey data. Accordingly, it is methodologically valid to process statistics with the PLS-SEM model [115]. Therefore, this study set the number of iterations for sampling to 1.000 for stricter processing as an analysis option for the PLS-SEM model.
4.4. Statistical Analysis Results
The analysis confirmed that the impact of corporate strategy attributes, digital transformation, and dynamic capabilities on corporate performance through value is statistically significant. Moreover, digital transformation was found to positively (+) affect customer value (Hypothesis 1). In addition, the impact of digital quality on value is confirmed to be different for each component (system, information, service) (Hypothesis 2). System quality has a statistically significant positive (+) effect on functional value and symbolic value at a significance level of 1%, and information quality has a statistically significant positive (+) effect on functional value and emotional value at a significance level of 1% or 5%. Service quality is also confirmed to have a statistically significant positive (+) effect on emotional value, experiential value, functional value, and social value at a significance level of 1% or 5%.
Dynamic capability is confirmed to have a statistically significant positive (+) effect on all five components of value at the 1% significance level (Hypothesis 3), and value and corporate performance have a statistically significant positive (+) effect at the 1% significance level (Hypothesis 4). Uncertainty is confirmed to have a statistically significant positive (+) effect on corporate performance at a significance level of 5% (Hypothesis 5) (Figure 2).
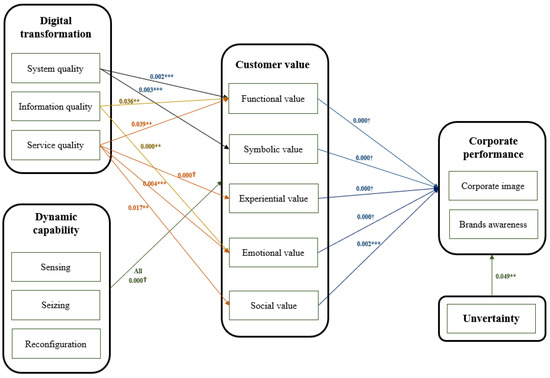
Figure 2.
Analysis results.
5. Discussion
Evaluating the hypotheses on the impact of digital quality and dynamic capabilities on corporate performance through the mediating function of customer value and the hypothesis on the controlling effect of uncertainty on corporate performance, several theoretical and practical implications can be drawn as follows.
5.1. Theoretical Implications
Unlike traditional studies that examine the relationship between perceived quality and customer satisfaction and purchase intentions, this study explored the relationship between digital quality and dynamic capability in digital transformation and between customer value and corporate performance, thus enabling high-level generalizations capable of explaining all cases and situations, rather than drawing low-level generalized conclusions limited to specific cases and situations. The theoretical implications of this study are as follows:
First, although interest in the digital transformation of enterprises is increasing day by day, there are many trials and errors from strategizing to executing digital transformation, where digital transformation is perceived as migrating local data to the cloud [13,116,117]. Given that there is a need for a theoretical foundation to address this reality, the factor of “perceived service quality”, a subjective criterion of customers rather than an objective criterion of products and services, is important [31].
In the previous literature, digital transformation increased customer satisfaction, which generates customer recommendations that affect corporate performance [22,23,118]. In this process, many quality dimensions are viewed as antecedents of customer satisfaction, but the existing concept of customer value, such as the offsetting relationship between the costs and benefits customers expect from a purchase [119], is insufficient to examine the relationship between the components of digital quality and corporate performance.
An organization’s identity is secured through its core characteristics, uniqueness that distinguishes it from other organizations, and temporal permanence [120]. Corporate image, which is inferred from the beliefs of those outside the organization or the beliefs of those inside the organization [121], yields different results when people have different information about the organization or have different values for interpreting the information.
The three elements that make up digital quality can be classified as informatization, service, and systemization [25,122], and each element has different relationships with the components of customer value. Specifically, this study shows that system quality affects functional value and symbolic value, information quality affects functional value and emotional value, and service quality affects functional, experiential, emotional, and social value but not symbolic value.
Digital quality is not simply a tool for improving service quality; it penetrates existing customer value channels (functional, symbolic, experiential value) and new channels (emotional, social value) to stimulate market performance, something called corporate image. Traditional customer value channels such as functional, symbolic, and experiential values increase brand awareness by providing taste, sophisticated images, and beneficial experiences to enable customers to pursue their interests. On the other hand, new customer value channels such as emotional and social value are cognitive value channels that stimulate customers’ enjoyment and social image. As a result, the corporate image in the ESG dimension is favored as a company with good governance, a company that is good at social contribution activities, and an eco-friendly company.
The structural relationship in which system quality, including accessibility, security, and ease of use, and information quality, such as sufficiency, diversity, up-to-dateness, accuracy, and usefulness, stimulate customer value is used to improve the functionality of products and services and to develop new markets. It conveys the meaning of technology orientation that focuses on developing groundbreaking new products [123,124,125]. On the other hand, the fact that service quality, including customer support, customization, and reliability, has a positive impact on emotional and social values in addition to functional and experiential values by ultimately improving a company’s market performance, conveys the performance implications of customer orientation. Customer orientation, which accurately identifies the needs of target customers and continuously provides better value to customers [61,126], is based on service quality realized through digital transformation, combining traditional value channels and recognition. It penetrates the corporate value channel and ultimately creates a corporate image in the ESG dimension as a company with good governance, a company that is good at social contribution activities, and is an eco-friendly company.
Therefore, while it is essential to consider digital quality from the general perspective of evaluating the degree of its performance and reliability that meets customer expectations, the specific components of digital quality should be applied as important variables as antecedents of customer value linked to non-financial corporate performance. The process of forming system quality, information quality, and service quality according to digital quality through customer value channels to form a company’s market performance and subsequently its corporate image, needs to be theoretically conceptualized as a black box that needs to be newly examined from a sustainability perspective.
Second, existing reviews on dynamic capabilities have concentrated on competitive advantage, organizational flexibility, and strategic leadership [22,23]. It is necessary to extend this traditional perspective to study the interaction between business ecosystem components that affect corporate performance by changing the value perceived by customers through dynamic capability enhancement. In the same vein, this study investigates dynamic capability as an antecedent of customer value, which is an antecedent of corporate performance. The results confirmed that dynamic capabilities of sensing, seizing, and reconfiguration [6,7,8] significantly affect functional value, symbolic value, experiential value, emotional value, and social value and that all components of customer value significantly influence corporate performance.
Sensing refers to the use of well-established internal processes to clarify the target market and identify customer needs, changes in trends, and related innovative activities while keeping an eye on industry trends [127]. This information about risks and opportunities is then absorbed into the company and used as resources to drive organizational capabilities to create customer value [128], and customers recognize and prefer the special value of the company’s products, which leads to increased loyalty to the company’s image and brand, and finally leads to corporate performance [129].
Seizing indicates that a company invests in acquiring solutions to have customers and keep them connected and actively develops new business models by incorporating rational feedback from customers into the company’s management and changing the way it traditionally operates [127]. Business models developed based on this awareness of customers and markets are continuously innovated to provide products and services that lead to better understanding customer needs and trends [8], and the company’s image and brand continue to drive customer interest.
Reconfiguration refers to the absorption and integration of knowledge and know-how gained from creating and implementing new marketing strategies in response to changes in the times identified through sensing and seizing while applying new ways of redeploying resources as needed [127]. This reconfiguration is a strategic choice for companies that are proactive and fast-paced yet successful [8]. Consequently, companies can continue to secure their corporate image and brand awareness by reconfiguring their strategies, organizations, and resources to provide competitive prices and differentiated products in line with the changing market technologies and customer needs.
Third, the examination of the positive relationship of uncertainty with corporate performance should open another horizon in corporate strategy research by establishing a perspective that balances the environmental determinism theory [130], which states that the business environment determines a company’s market survival, and the environmental adaptation theory [130], which emphasizes the aspect of adapting to environmental changes. This study explored the impact of uncertainty as a control variable on market performance, such as corporate image [32], which accumulates as customers are continuously exposed to a firm’s products or services, and brand awareness [48], which enables customers to distinguish and select products or services among various exposed brands, rather than finance performance, which is a traditional proxy for corporate performance. The results of the analysis revealed that uncertainty functions as a control variable that affects the market performance of companies. Specifically, there is a statistically significant positive relationship.
However, from the relationship that market performance, such as corporate image and brand awareness, is improved by the control of uncertainty, it is hard to conclude a positive linear relationship between them. In this study, uncertainty is defined as a situation in which changes in technology applied to products and services are difficult to predict, the rate of change in that technology is rapid, and changes in customer needs are also difficult to predict and change rapidly. Consumers purchase products and services as their expectations of various values such as functional, symbolic, experiential, emotional, and social values are satisfied [131], and companies generate profits, and, simultaneously, the market’s evaluation of the company (corporate image and brand awareness) improves.
In this structural relationship, higher levels of uncertainty in the business environment do not guarantee the improvement of a firm’s market performance. Rather, in response to uncertainty, companies improve their performance by allocating resources to expanding existing markets and creating new markets through technological innovation, shifting their business model to seize opportunities created by market changes or reallocating resources to fit the shifted business model [8]. Companies’ environmental adaptation strategies produce temporary competitive advantages that are environmentally adapted to the changed environment, and this competitive advantage production occurs repeatedly [132]. Uncertainty can also moderate the relationship between customer value and corporate performance, turning the relationship between them into a positive or negative relationship. Although this study did not find a moderating effect of uncertainty on the relationship between customer value and corporate performance, the role of uncertainty as a moderating variable suggests an epistemological perspective that blurs the boundary between environmental determinism and environmental adaptation.
5.2. Managerial Implications
Rather than generating ideas for management practices that can be applied to specific cases and situations, this study derived management tools with a high degree of generalization that can be applied to all practice situations. Companies do not create customer satisfaction directly through digital quality as a result of digital transformation but rather by creating a value that customers seek. This black box of business has several practical implications that contradict the logic that global companies develop business strategies or tools for customer satisfaction primarily for specific and limited sustainable purposes.
First, in the pursuit of competitive advantage, companies must not seek an absolute numerical increase compared to their competitors but rather a differentiated competitive advantage based on the unique customer value of their products or services. In addition, in the contemporary business environment of increased uncertainty, the strategic choice for companies to gain competitive advantage is to continuously target temporary competitive advantages rather than sustainable competitive advantages. Rapid technological change in the market and the diversity of customer needs require competitive advantages that can realize the unique customer value of each company’s products and services, but these competitive advantages are difficult to sustain and have temporary properties. In the era of contemporary uncertainty, the rapid development of information technologies has led to a series of unprecedented events that have promoted the emergence of innovative business models that defy the categorization of industries and fundamentally disrupt the value chains associated with traditional businesses. Under these conditions, it is difficult for companies to survive in the marketplace unless they can continuously and flexibly create business models that respond to changes in technology and customer needs. In the early 2000s, there were no music streaming services. Raincom, an MP3 technology creator, occupied 70% of the Korean market and 30% of the global market. It appeared that it would hold such a dominant position forever. However, it disappeared from the market after the launch of the iPhone in 2007.
A company’s digital transformation realizes system quality, information quality, and service quality. These digital qualities are new value channels based on cognitive values such as emotional and social values, in addition to value channels based on the traditional corporate role of symbolic, functional, and experiential values. Ultimately, it creates an image of corporate sustainability through the customer value channel. The process between digital transformation and customer value constitutes another black box that leads to market performance referred to as the corporate image in addition to the company’s financial performance. Consequently, a corporate image in the ESG dimension is created as a company with good governance, a company that is good at social contribution activities, and is an eco-friendly company. It provides companies with another competitive advantage resource.
Second, when companies consider service quality, they have typically focused on what has traditionally been emphasized, such as process quality, outcome quality, and physical environment quality. However, as companies realize digital quality’s increasing value to digitally transform the way they work and stay connected to their customers, they are investing more in digital transformation. The problem is that most organizations are still conventionally managing digital quality because they lack an understanding of the three pillars that make up digital quality. System quality consists of accessibility, security, and ease of use. For instance, NAVER Cloud’s reliability is reported to accomplish more than 99% of the Service-Level Agreement (SLA), Kakao Bank’s processing speed can allegedly run 10,000 transactions per second, and Toss Bank is said to have a user-friendly interface on its mobile app.
Information quality comprises sufficiency, variety, up-to-dateness, accuracy, and usefulness, which can be illustrated by the examples of Naver and Google Maps. These provide satellite photos and 3D maps, a variety of information, such as locations, keyword search and filter functions, up-to-date information on real-time traffic and trends, accurate information with search results updated and provided in real-time, and customized and useful information in the form that users want.
Service quality is composed of customer support, customization, and reliability. Coupang, Naver Shopping, and G-market all support customers through 24/7 customer centers, provide customized product recommendations and various functions for convenience, and increase reliability through services promised to customers such as a 100% money-back guarantee and early morning delivery. These companies have achieved their current competitive advantage by actively investing in specific areas of digital quality. The problem is that system quality, information quality, and service quality, which are components of digital quality, are the most clearly measurable factors when verifying the effectiveness of a company’s digital transformation. One factor that makes companies hesitant to invest the large amounts of capital required to drive digital transformation is the difficulty in measuring the results of digital transformation. The three pillars of digital quality provide an answer to this question, as each company has a different source of competitive advantage. Thus, companies should consider their competitive advantages and start their digital transformation where they can be most efficiently deployed.
Third, a company’s ability to choose digital quality as a strategy to respond to changing technologies and customer needs stems from its inherent dynamic capabilities. Companies implement various strategies to maintain their competitive advantage in their industry, to keep competitors in check or out of business, or to survive competition from incumbents when entering new markets. At this time, it is important to sense changes in industry trends, target markets and customer needs, prepare to develop and operate new business models to turn them into opportunities for the company, and reallocate resources to ensure that the company continues to have dynamic capabilities in response to changes in the business environment. Utilizing such a dynamic social structure, Coupang, a logistics company, witnessed rapid urbanization and a surge in single-person households. Thus, it has developed a new market for same-day ordering and delivery by operating some products in its inventory. By implementing a service that delivers food within an hour of ordering, it has reconfigured its capabilities to become unique and gain a strong market share. Another example is the case of Southwest Airlines, the most competitive low-cost airline in the United States, which eliminated in-flight services while also organizing air routes connecting small cities to ensure on-time departures and arrivals.
Companies must continuously monitor changes in the internal and external business environment, have a dynamic capability to acquire new technologies, utilize controllable assets according to market changes, and have a high level of system quality, information quality, and service quality for digital transformation. In this process, the most important thing is the ability to manage uncertainty, which has positive and negative effects. South Korea’s LG Electronics has more than 50% of the world’s new battery market as a result of sustained technical and financial investment in secondary batteries as a future strategy for home appliances despite high uncertainty. Samsung Electronics and SK Hynix have grown from latecomers in the memory semiconductor field, which was invented by companies in the United States and mass-produced by Japanese firms, to leaders that now seize 50% of the global market share and are expanding into the system semiconductor field. However, if a company neglects to identify technological changes in the market and changes in customer needs and establishes a business model accordingly, it will fail to compete in the market. Kodak, a filmmaker, was unable to keep up with the technological changes in digital cameras and disappeared from the market, while Nokia and Motorola, the two biggest players in 2G cell phones, have been overtaken by Apple’s iPhone and Samsung’s Galaxy.
The ongoing management of ambivalent uncertainty is a vital factor in executive decisions directly impacting corporate performance. However, our understanding of the structural relationships through which uncertainty improves corporate performance is still incomplete. In the same vein, there is a need to strategically manage the black box in which companies make strategic choices to increase the perception that they have good corporate governance, are rated as socially responsible and environment-friendly, and are characterized by memorable brands, recognizable trademarks, and memorable product categories. In addition, considering the results of prior research on various performance-determinant models, the landscape inside the black box is expected to be different depending on the type of performance, such as financial performance, market performance, innovation performance, and organizational performance. Considering the two-sided nature of uncertainty with positive and negative effects, corporate uncertainty management, which is based on the keywords of balance and level, should have different systems for those different types of performance.
6. Conclusions
6.1. Main Findings
This study examines the impact of digital transformation and dynamic capability on corporate performance through the mediating variables of customer value and uncertainty. It produces findings that are highly generalizable and applicable to improving corporate performance.
First, digital transformation, as explored by digital quality, is found to impact customer value, but only selectively on some of the five elements. Therefore, companies should regularly identify and acquire their digital transformation capabilities, develop strategies to enhance them, and create structures to ensure that they are embedded and reinforced within the organization. Second, dynamic capabilities impact all elements of customer value, confirming that they are an essential component of measuring corporate performance. Accordingly, it is necessary to provide enterprise-wide support through systems, equipment, and training to enable all members of the organization to perform at a high level of capability. Third, all the components that make up customer value have been shown to affect corporate performance, and digital transformation and dynamic capability are important parameters for the impact of corporate performance. Consequently, organizations should develop and implement strategies to identify and redefine the elements of customer value that they can create. Fourth, system quality, information quality, and service quality implemented through digital transformation penetrate the customer value channel and ultimately shape the company’s image of sustainability. In this process, the concept of customer value channels is expanded to encompass cognitive value channels in addition to traditional values. Lastly, since uncertainty has been demonstrated to affect corporate performance, companies should continue to engage in management activities to manage uncertainty so that it does not rise above a certain level.
The results confirmed the hypothesis that digital transformation and dynamic capability are crucial factors affecting corporate performance through the mediation of customer value and uncertainty; thus, companies should select and reflect digital quality, dynamic capability, and value as essential factors in strategizing processes to secure competitive advantage and sustainable growth.
6.2. Future Research Themes
Although there are many prior studies on digital transformation and dynamic capability, empirical studies on customer value creation and its impact on corporate performance through uncertainty are still insufficient. This study’s findings provide valuable theoretical and practical implications. Nevertheless, the limitations of this study and future research directions are as follows:
First, digital transformation has examined the three components of digital quality: system quality, information quality, and service quality, but further examination of the sub-components of each quality component is needed to consider system quality attributes, such as packet loss, latency, and recovery time; information quality attributes, such as visibility, public interest, education, entertainment, artistry, and creativity; and service quality attributes, such as scalability and persistence. Second, this study surveyed employees of companies located in China that provide manufacturing-oriented products and services by focusing on digital transformation and customer value creation. Therefore, it is necessary to conduct cross-industry, cross-country, and cross-study research in each industry segment, covering emerging markets in Asia, such as Vietnam, Thailand, and Indonesia, as well as major countries in the Americas and Europe, such as the United States and the United Kingdom, to draw generalized conclusions that can be applied to all industries.
Third, it is important to consider the digital literacy of the surveyed respondents. While a wide variation in the digitalization level across countries is a concern, it is also expected that the level of digitalization of individuals within the same country or industry will vary greatly, so it is vital to strategize on dealing with this variable. If a certain level of digital literacy can be identified, it will be possible to provide content by literacy level, which is expected to be the most important element of digital transformation that can create new business areas. Fourth, the control that the unpredictability and rapid pace of technological change and needs change over consumers’ evaluation of a company’s image and brand awareness through value channels is realized through another behavior, namely, the company’s strategic choices. Therefore, further research on these detailed components is suggested to determine the relationship between uncertainty and market performance. This is expected to expand another horizon for uncertainty research. Fifth, in addition to corporate image and brand awareness, other market performance indicators, such as market seizing rate, customer satisfaction, and corporate recognition, need to be further examined to ensure the consistency of the study’s results. Moreover, research on overseas expansion performance, such as return on sales in export markets and sales growth rate; innovation performance, such as patent applications and new product releases; and organizational performance, such as organizational commitment, job commitment, and organizational innovation is also recommended for robustness checks.
The effects of digital transformation on international companies’ corporate image and brand awareness can only be fully understood when the above-mentioned future research topics are considered.
Author Contributions
Conceptualization, C.-G.K. and O.-S.Y.; methodology, O.-S.Y.; writing and editing, C.-G.K.; funding acquisition, C.-G.K. All authors have read and agreed to the published version of the manuscript.
Funding
This work was supported by Innovative Human Resource Development for Local Intellectualization program through the Institute of Information & Communications Technology Planning & Evaluation (IITP) grant funded by the Korean government (MSIT) (IITP-2024-RS-2023-00260267).
Institutional Review Board Statement
Not applicable.
Informed Consent Statement
Not applicable.
Data Availability Statement
All data generated or analyzed during this study is available from the corresponding authors upon reasonable request.
Acknowledgments
The authors would like to thank the anonymous reviewers and editor.
Conflicts of Interest
The authors declare no conflicts of interest.
Appendix A. Survey Questionnaire
- Corporate Strategy Attributes
| Question | Not at All Neutral Very Much So |
| 1. Our company systematically explores new technology trends more than our competitors. | ① ② ③ ④ ⑤ ⑥ ⑦ |
| 2. Our company responds to technological changes more quickly than our competitors. | ① ② ③ ④ ⑤ ⑥ ⑦ |
| 3. Our company launches new products (services) faster than our competitors. | ① ② ③ ④ ⑤ ⑥ ⑦ |
| 4. Our company understands customer needs more accurately than our competitors. | ① ② ③ ④ ⑤ ⑥ ⑦ |
| 5. Our company supports customers’ purchasing decisions more soundly than our competitors. | ① ② ③ ④ ⑤ ⑥ ⑦ |
| 6. Our company operates customer service (support) times more flexibly than our competitors. | ① ② ③ ④ ⑤ ⑥ ⑦ |
- II.
- Digital Transformation
Please respond to the survey by comparing your company’s digital products and services with those of your competitors based on the last three years.
| Question | Not at All Neutral Very Much So | |
| 7 | Access speed is fast. | ① ② ③ ④ ⑤ ⑥ ⑦ |
| 8 | It can be used at any time. | ① ② ③ ④ ⑤ ⑥ ⑦ |
| 9 | It is safe from hacking. | ① ② ③ ④ ⑤ ⑥ ⑦ |
| 10 | The security system is excellent. | ① ② ③ ④ ⑤ ⑥ ⑦ |
| 11 | It’s simple to use. | ① ② ③ ④ ⑤ ⑥ ⑦ |
| 12 | It provides a user-friendly interface (system, design). | ① ② ③ ④ ⑤ ⑥ ⑦ |
| 13 | It provide sufficient information. | ① ② ③ ④ ⑤ ⑥ ⑦ |
| 14 | It provides a variety of information. | ① ② ③ ④ ⑤ ⑥ ⑦ |
| 15 | It provides the latest information. | ① ② ③ ④ ⑤ ⑥ ⑦ |
| 16 | It provides accurate information. | ① ② ③ ④ ⑤ ⑥ ⑦ |
| 17 | It provides useful information. | ① ② ③ ④ ⑤ ⑥ ⑦ |
| 18 | It responds quickly to customer requests. | ① ② ③ ④ ⑤ ⑥ ⑦ |
| 19 | It responds faithfully to customer requests. | ① ② ③ ④ ⑤ ⑥ ⑦ |
| 20 | It provides customized services to suit customer interests. | ① ② ③ ④ ⑤ ⑥ ⑦ |
| 21 | It provides customized services tailored to the customer’s level of knowledge (technology). | ① ② ③ ④ ⑤ ⑥ ⑦ |
| 22 | It has excellent ability to solve customer problems. | ① ② ③ ④ ⑤ ⑥ ⑦ |
| 23 | It provides promised services (time and content) to customers. | ① ② ③ ④ ⑤ ⑥ ⑦ |
- III.
- Dynamic Capabilities
| Question | Not at All Neutral Very Much So |
| 24. Our company always observes industry trends. | ① ② ③ ④ ⑤ ⑥ ⑦ |
| 25. Our company utilizes established processes to identify target markets, changes in customer needs, and related innovations. | ① ② ③ ④ ⑤ ⑥ ⑦ |
| 26. Our company continuously participates in professional knowledge exchange activities and seminars. | ① ② ③ ④ ⑤ ⑥ ⑦ |
| 27. Our company invests in securing solutions for our customers. | ① ② ③ ④ ⑤ ⑥ ⑦ |
| 28. Our company changes its operation method by collecting reasonable opinions from customers. | ① ② ③ ④ ⑤ ⑥ ⑦ |
| 29. Our company actively develops new business methods. | ① ② ③ ④ ⑤ ⑥ ⑦ |
| 30. Our company implements new marketing strategies or methods that fit the changing times. | ① ② ③ ④ ⑤ ⑥ ⑦ |
| 31. Our company applies new resource reallocation methods appropriate for changing times. | ① ② ③ ④ ⑤ ⑥ ⑦ |
| 32. Our company absorbs and integrates knowledge and know-how appropriate for changing times into the organization. | ① ② ③ ④ ⑤ ⑥ ⑦ |
- IV.
- Customer Value
Please respond to the survey by comparing your company’s digital products and services with those of your competitors based on the last three years.
| Question | Not At All Neutral Very Much So | |
| 33 | It provides designs that suit the customer’s taste. | ① ② ③ ④ ⑤ ⑥ ⑦ |
| 34 | It is designed to be safe. | ① ② ③ ④ ⑤ ⑥ ⑦ |
| 35 | It provides excellent performance for the price. | ① ② ③ ④ ⑤ ⑥ ⑦ |
| 36 | It has a good social reputation | ① ② ③ ④ ⑤ ⑥ ⑦ |
| 37 | It Provides an attractive and sophisticated image. | ① ② ③ ④ ⑤ ⑥ ⑦ |
| 38 | It allows customers to feel special benefits. | ① ② ③ ④ ⑤ ⑥ ⑦ |
| 39 | It provides diverse and rich experiences to our customers. | ① ② ③ ④ ⑤ ⑥ ⑦ |
| 40 | It provides beneficial experiences to customers. | ① ② ③ ④ ⑤ ⑥ ⑦ |
| 41 | It provides differentiated experiences to customers. | ① ② ③ ④ ⑤ ⑥ ⑦ |
| 42 | It provides a lot of fun to our customers. | ① ② ③ ④ ⑤ ⑥ ⑦ |
| 43 | It puts the customer’s mind at ease. | ① ② ③ ④ ⑤ ⑥ ⑦ |
| 44 | It provides exciting fun to customers. | ① ② ③ ④ ⑤ ⑥ ⑦ |
| 45 | It clearly indicates the social status of the customer. | ① ② ③ ④ ⑤ ⑥ ⑦ |
| 46 | It increases others’ favorability toward customers. | ① ② ③ ④ ⑤ ⑥ ⑦ |
| 47 | It improves the social image of customers. | ① ② ③ ④ ⑤ ⑥ ⑦ |
- V.
- Corporate Performance
Please respond to the survey comparing your company’s performance over the past three years with that of your competitors.
| Question | Not at All Neutral Very Much So | |
| 48 | It is evaluated as a company with good corporate governance. | ① ② ③ ④ ⑤ ⑥ ⑦ |
| 49 | It is evaluated as a company that is good at social contribution activities. | ① ② ③ ④ ⑤ ⑥ ⑦ |
| 50 | It is evaluated as an eco-friendly company. | ① ② ③ ④ ⑤ ⑥ ⑦ |
| 51 | The brand is easy to remember. | ① ② ③ ④ ⑤ ⑥ ⑦ |
| 52 | The brand is easy to recognize. | ① ② ③ ④ ⑤ ⑥ ⑦ |
| 53 | Product categories are easy to remember. | ① ② ③ ④ ⑤ ⑥ ⑦ |
- VI.
- Uncertainty
| Question | Not At All Neutral Very Much So |
| 54. It is very difficult to predict technological changes applied to our company’s products and services. | ① ② ③ ④ ⑤ ⑥ ⑦ |
| 55. Technologies in our company’s product and service areas are changing rapidly. | ① ② ③ ④ ⑤ ⑥ ⑦ |
| 56. It is very difficult to predict changes in the needs of customers in our company’s products and service industries. | ① ② ③ ④ ⑤ ⑥ ⑦ |
| 57. Customer needs in our company’s product and service areas are changing rapidly. | ① ② ③ ④ ⑤ ⑥ ⑦ |
- VII.
- General Details
| Question | Select an Item |
| 58. Please select the size of the company you work for. | ①Venture company (Startup etc.) ②Small and medium-sized enterprises(SMEs) ③Mid-sized company ④Large company |
| 59. Please select the industry sector of the company you are working for. | ①IT & Telecommunications ②Manufacturing industry ③Service industry ④Distribution industry ⑤etc. |
| 60. Please select the occupation you are working in. | ①IT ②Production ③Planning ④Marketing ⑤Finance ⑥R&D ⑦etc. |
| 61. Please select your position as a respondent. | ①Employee (Researcher) ②Assistant manager (Senior researcher) ③Manager (Principal researcher) ④Deputy general manager (Lead researcher) ⑤General manager (Chief researcher) ⑥Executive ⑦CEO ⑧etc. |
| 62. Please tell us the name of the company you are working for. (It will be used only as statistical data and will be anonymized.) | ( ) |
| 63. Please tell us your nationality. | ( ) |
References
- Matt, C.; Hess, T.; Benlian, A. Digital transformation strategies. Bus. Inf. Syst. Eng. 2015, 57, 339–343. [Google Scholar] [CrossRef]
- Berman, S.J.; Bell, R. Digital Transformation: Creating New Business Models Where Digital Meets Physical. Executive Report; IBM Global Business Service: New York, NY, USA, 2011. [Google Scholar]
- Bharadwaj, A.; El Sawy, O.A.; Pavlou, P.A.; Venkatraman, N. Digital business strategy: Toward a next generation of insights. MIS Q. Manag. Inf. Syst. 2013, 37, 471–482. [Google Scholar] [CrossRef]
- Selander, L.; Jarvenpaa, S.L. Digital action repertoires and transforming a social movement organization. MIS Q. 2016, 40, 331–352. [Google Scholar] [CrossRef]
- Carlo, J.L.; Lyytinen, K.; Boland, R.J., Jr. Dialectics of collective minding: Contradictory appropriations of information technology in a high-risk project. MIS Q. 2012, 36, 1081–1108. [Google Scholar] [CrossRef]
- Helfat, C.E.; Raubitschek, R.S. Dynamic and integrative capabilities for profiting from innovation in digital platform-based ecosystems. Res. Policy 2018, 47, 1391–1399. [Google Scholar] [CrossRef]
- Schilke, O.; Hu, S.; Helfat, C.E. Quo vadis, dynamic capabilities? A content-analytic review of the current state of knowledge and recommendations for future research. Acad. Manag. Ann. 2018, 12, 390–439. [Google Scholar] [CrossRef]
- Teece, D.J. Explicating dynamic capabilities: The nature and microfoundations of (sustainable) enterprise performance. Strateg. Manag. J. 2007, 28, 1319–1350. [Google Scholar] [CrossRef]
- Verhoef, P.C.; Broekhuizen, T.; Bart, Y.; Bhattacharya, A.; Dong, J.Q.; Fabian, N.; Haenlein, M. Digital transformation: A multidisciplinary reflection and research agenda. J. Bus. Res. 2021, 122, 889–901. [Google Scholar] [CrossRef]
- Teece, D.J. Dynamic capabilities: Routines versus entrepreneurial action. J. Manag. Stud. 2012, 49, 1395–1401. [Google Scholar] [CrossRef]
- Müller, E.; Hopf, H. Competence center for the digital transformation in small and medium-sized enterprises. Procedia Manuf. 2017, 11, 1495–1500. [Google Scholar] [CrossRef]
- Peter, M.K.; Kraft, C.; Lindeque, J. Strategic action fields of digital transformation: An exploration of the strategic action fields of Swiss SMEs and large enterprises. J. Strategy Manag. 2020, 13, 160–180. [Google Scholar] [CrossRef]
- Hess, T.; Matt, C.; Benlian, A.; Wiesböck, F. Options for formulating a digital transformation strategy. MIS Q. Exec. 2016, 15, 123–139. [Google Scholar]
- Bouncken, R.B.; Kraus, S.; Roig-Tierno, N. Knowledge-and innovation-based business models for future growth: Digitalized business models and portfolio considerations. Rev. Manag. Sci. 2021, 15, 1–14. [Google Scholar] [CrossRef]
- Liu, D.Y.; Chen, S.W.; Chou, T.C. Resource fit in digital transformation: Lessons learned from the CBC Bank global e-banking project. Manag. Decis. 2011, 49, 1728–1742. [Google Scholar] [CrossRef]
- Teichert, R. Digital transformation maturity: A systematic review of literature. Acta Univ. Agric. Silvic. Mendel. Brun. 2019, 67, 1673–1687. [Google Scholar] [CrossRef]
- Aldaarmi, A.A. Fintech Service Quality of Saudi Banks: Digital Transformation and Awareness in Satisfaction, Re-Use Intentions, and the Sustainable Performance of Firms. Sustainability 2024, 16, 2261. [Google Scholar] [CrossRef]
- Li, C.; Feng, W.X.; Han, S.; Gupta, S.; Kamble, S. Digital adaptive governance, digital transformation, and service quality in logistics enterprises. J. Glob. Inf. Manag. (JGIM) 2022, 30, 1–26. [Google Scholar] [CrossRef]
- Westerman, G.; Bonnet, D.; McAfee, A. The nine elements of digital transformation. MIT Sloan Manag. Rev. 2014, 55, 1–6. [Google Scholar]
- Visnjic, I.; Wiengarten, F.; Neely, A. Only the brave: Product innovation, service business model innovation, and their impact on performance. J. Prod. Innov. Manag. 2016, 33, 36–52. [Google Scholar] [CrossRef]
- Zott, C.; Amit, R.; Massa, L. The business model: Recent developments and future research. J. Manag. 2011, 37, 1019–1042. [Google Scholar]
- Vial, G. Understanding digital transformation: A review and a research agenda. J. Strateg. Inf. Syst. 2019, 28, 118–144. [Google Scholar] [CrossRef]
- Warner, K.S.R.; Wäger, M. Building dynamic capabilities for digital transformation: An ongoing process of strategic renewal. Long Range Plan. 2019, 52, 326–349. [Google Scholar] [CrossRef]
- Yang, O.S.; Kim, S.H. The research on the components of brand equity in the banking industry: The effect of digital quality on customer satisfaction and brand loyalty. Korean Manag. Consult. Rev. 2022, 22, 353–371. [Google Scholar]
- Hwang, J.Y.; Lee, E.B.; Kim, J.H. Assessing e-service quality of digital libraries. J. Korean Soc. Libr. Inf. Sci. 2007, 41, 55–79. [Google Scholar]
- Zeithaml, V.A. Consumer perception of price, quality and value: A means-end model and synthesis of evidence. J. Mark. 1998, 52, 2–22. [Google Scholar] [CrossRef]
- Sheth, J.N.; Newman, B.I.; Gross, B.L. Why we buy what we buy: A theory of consumption values. J. Bus. Res. 1991, 22, 159–170. [Google Scholar] [CrossRef]
- Thompson, C.J.; Troester, M. Consumer value systems in the age of postmodern fragmentation: The case of the natural health microculture. J. Consum. Res. 2002, 28, 550–571. [Google Scholar] [CrossRef]
- Holt, D.B. How consumers consume: A typology of consumption practices. J. Consum. Res. 1995, 22, 1–16. [Google Scholar] [CrossRef]
- Park, S.R.; Park, H.S. A study of the effect of corporate social responsibility in mediated corporate image on corporate performance. Korean J. Bus. Adm. 2013, 26, 961–985. [Google Scholar]
- Yang, O.S.; Park, S.W. The moderating effect of information asymmetry on the linkage of service quality-consumer satisfaction-consumer loyalty of domestic and foreign banking users. Korean J. Bus. Adm. 2015, 28, 2259–2276. [Google Scholar]
- Eisenhardt, K.M.; Martin, J.A. Dynamic capabilities: What are they? Strateg. Manag. J. 2000, 21, 1105–1121. [Google Scholar] [CrossRef]
- Teece, D.J.; Pisano, G.; Shuen, A. Dynamic capabilities and strategic management. Strateg. Manag. J. 1997, 18, 509–533. [Google Scholar] [CrossRef]
- Ringov, D. Dynamic capabilities and Firm performance. Long Range Plan. 2017, 50, 653–664. [Google Scholar] [CrossRef]
- Huarng, K.H. Essential research in technology management. J. Bus. Res. 2010, 63, 451–453. [Google Scholar] [CrossRef]
- Day, G.S.; Schoemaker, P.J. Adapting to fast-changing markets and technologies. Calif. Manag. Rev. 2016, 58, 59–77. [Google Scholar] [CrossRef]
- Vanpoucke, E.; Vereecke, A.; Wetzels, M. Developing supplier integration capabilities for sustainable competitive advantage: A dynamic capabilities approach. J. Oper. Manag. 2014, 32, 446–461. [Google Scholar] [CrossRef]
- Ambrosini, V.; Bowman, C. What are dynamic capabilities and are they a useful construct in strategic management? Int. J. Manag. Rev. 2009, 11, 29–49. [Google Scholar] [CrossRef]
- Jahng, J.H. The Influence of Commercialization Factors on the Management Performance. Master’s Thesis, Chungnam National University, Daejeon, Republic of Korea, 2010. [Google Scholar]
- Bae, S.K. An Empirical Study on the Determinants of Firm Performance for Korean Spatial Information Companies. Doctoral Thesis, Inha University, Incheon, Republic of Korea, 2014. [Google Scholar]
- Venkatataman, N.; Ramanujam, V. Measurement of business performance in strategy research: A comparison of approaches. Acad. Manag. Rev. 1986, 11, 801–814. [Google Scholar] [CrossRef]
- Lee, M.U.; Jeon, J.W. An empirical study on the effectiveness of BSC to measure service quality performance-on based hotel industry. J. Tour. Policy 2005, 11, 191–210. [Google Scholar]
- Yu, H.K.; Kim, M.Y.; Chung, H.K. Employees’ big 5 personality, perceived organizational support, and customer performance in food service corporations. Korean J. Hosp. Tour. 2007, 165, 201–219. [Google Scholar]
- Park, M.H.; Park, J.A. The relationships among BSC evaluation indicators in the hotel industry. J. Tour. Sci. 2004, 28, 161–179. [Google Scholar]
- Winter, S.G. Understanding dynamic capabilities. Strateg. Manag. J. 2003, 24, 991–995. [Google Scholar] [CrossRef]
- Keller, K.L.; Aaker, D.A. The effects of sequential introduction of brand extensions. J. Mark. Res. 1992, 29, 35–50. [Google Scholar] [CrossRef]
- Nedungadi, P. Recall and consumer consideration sets: Influencing choice without altering brand evaluations. J. Consum. Res. 1990, 17, 263–276. [Google Scholar] [CrossRef]
- Hoyer, W.D.; Brown, S.P. Effects of brand awareness on choice for a common, repeat-purchase product. J. Consum. Res. 1990, 17, 141–148. [Google Scholar] [CrossRef]
- Miller, D. Some organizational consequences of CEO succession. Acad. Manag. J. 1993, 36, 644–659. [Google Scholar] [CrossRef]
- Werner, S.; Brouthers, L.E.; Brouthers, K.D. International risk and perceived environmental uncertainty: The dimensionality and internal consistency of Miller’s measure. J. Int. Bus. Stud. 1996, 27, 571–587. [Google Scholar] [CrossRef]
- Blair, R.D.; Kaserman, D.L. Ownership and control in the modern corporation: Antitrust implications. J. Bus. Res. 1983, 11, 333–343. [Google Scholar] [CrossRef]
- Courtney, H.; Kirkland, J.; Viguerie, P. Strategy under uncertainty. Harv. Bus. Rev. 1997, 75, 67–79. [Google Scholar]
- Das, T.K.; Teng, B.S. The risk-based view of trust: A conceptual framework. J. Bus. Psychol. 2004, 19, 85–116. [Google Scholar] [CrossRef]
- Helfat, C.E.; Finkelstein, S.; Mitchell, W.; Peteraf, M.A.; Singh, H.; Teece, D.J.; Winter, S.G. Dynamic Capabilities: Understanding Strategic Change in Organizations; Blackwell: London, UK, 2007; pp. 30–45. [Google Scholar]
- Miller, D.; Friesen, P.H. Strategy-making and environment: The third link. Strateg. Manag. J. 1983, 4, 221–235. [Google Scholar] [CrossRef]
- Ettlie, J.E.; Reza, E.M. Organizational integration and process innovation. Acad. Manag. J. 1992, 35, 795–827. [Google Scholar] [CrossRef]
- Pfeffer, J.; Salancik, G.R. The External Control of Organizations: A Resource Dependence Perspective; Stanford University Press: Redwood City, CA, USA, 2003. [Google Scholar]
- Rindfleisch, A.; Heide, J.B. Transaction cost analysis: Past, present, and future applications. J. Mark. 1997, 61, 30–54. [Google Scholar] [CrossRef]
- Milliken, F.J. Three types of perceived uncertainty about the environment: State, effect, and response uncertainty. Acad. Manag. Rev. 1987, 12, 133–143. [Google Scholar] [CrossRef]
- Sutcliffe, K.M.; Zaheer, A. Uncertainty in the transaction environment: An empirical test. Strateg. Manag. J. 1998, 19, 1–23. [Google Scholar] [CrossRef]
- Jaworski, B.J.; Kohli, A.K. Market orientation: Antecedents and consequences. J. Mark. 1993, 57, 46–77. [Google Scholar] [CrossRef]
- Sandberg, W.R.; Hofer, C.W. Improving new venture performance: The role of strategy, industry structure, and the entrepreneur. J. Bus. Ventur. 1987, 2, 5–28. [Google Scholar] [CrossRef]
- Harreld, J.B.; O’Reilly, C.A., III; Tushman, M.L. Dynamic capabilities at IBM: Driving strategy into action. Calif. Manag. Rev. 2007, 49, 21–43. [Google Scholar] [CrossRef]
- Hartman, R. The effects of price and cost uncertainty on investment. J. Econ. Theory 1972, 5, 258–266. [Google Scholar] [CrossRef]
- Abel, A.B. Optimal investment under uncertainty. Am. Econ. Rev. 1983, 73, 228–233. [Google Scholar]
- Caballero, R.J. On the sign of the investment-uncertainty relationship. Am. Econ. Rev. 1991, 81, 279–288. [Google Scholar]
- Wilbon, A.D. Predicting survival of high-technology initial public offering firms. J. High Technol. Manag. Res. 2002, 13, 127–141. [Google Scholar] [CrossRef]
- Bensaou, M.; Anderson, E. Buyer-supplier relations in industrial markets: When do buyers risk making idiosyncratic investments? Organ. Sci. 1999, 10, 460–481. [Google Scholar] [CrossRef]
- Bhagat, S.; Black, B.; Blair, M. Relational investing and firm performance. J. Financ. Res. 2004, 27, 1–30. [Google Scholar] [CrossRef]
- Kwon, M.H.; Lee, K.C. A study on differences of consumer values among adolescent consumers groups. Korean J. Youth Stud. 2000, 7, 169–193. [Google Scholar]
- Koo, M.J.; Kim, R.D.; Kim, S.Y.; Rha, J.Y.; Yeo, J.S.; Choe, H.C. Measuring and mapping consumption values. J. Consum. Stud. 2015, 26, 235–266. [Google Scholar]
- Saxe, R.; Weitz, B.A. The SOCO scale: A measure of the customer orientation of salespeople. J. Mark. Res. 1982, 19, 343–351. [Google Scholar] [CrossRef]
- Williams, R.J. Simple statistical gradient-following algorithms for connectionist reinforcement learning. Mach. Learn. 1992, 8, 229–256. [Google Scholar] [CrossRef]
- Winters, L.C. The effect of brand advertising on company image: Implications for corporate advertising. J. Advert. Res. 1986, 26, 54–59. [Google Scholar]
- Bitner, M.J. Servicescapes: The impact of physical surroundings on customers and employees. J. Mark. 1992, 56, 57–71. [Google Scholar] [CrossRef]
- Baker, J.; Grewal, D.; Parasuraman, A. The influence of store environment on quality inferences and store image. J. Acad. Mark. Sci. 1994, 22, 328–339. [Google Scholar] [CrossRef]
- Yi, Y.J.; Kim, W.C. The influence of physical environment on service quality perception: A comparative study. Korean J. Mark. 1998, 13, 61–86. [Google Scholar]
- Cheung, C.M.K.; Lee, M.K.O. Research framework for consumer satisfaction with internet shopping. In Proceedings of the 7th International Conference on Electronic Commerce, Xi’an, China, 15–17 August 2005; Volume 13, pp. 327–334. [Google Scholar] [CrossRef]
- DeLone, W.H.; McLean, E.R. The DeLone and McLean model of information systems success: A ten-year update. J. Manag. Inf. Syst. 2003, 19, 9–30. [Google Scholar]
- Hernon, P.; Calvert, P. E-service quality in libraries: Exploring its features and dimensions. Libr. Inf. Sci. Res. 2005, 27, 377–404. [Google Scholar] [CrossRef]
- Kyrillidou, M.; Hipps, K. Symposium on measuring library service quality. J. Libr. Adm. 2001, 35, 55–61. [Google Scholar] [CrossRef]
- Zeithaml, V.A.; Parasuraman, A.; Malhotra, A. Service quality delivery through web sites: A critical review of extant knowledge. J. Acad. Mark. Sci. 2002, 30, 362–375. [Google Scholar] [CrossRef]
- Kang, H.I. An overview of e-services operation strategy. ETRI-Electron. Telecommun. Trends 2002, 17, 83–85. [Google Scholar]
- Kim, H.S.; Park, Y.J. Development and measurement of user satisfaction index model for information systems. J. Korean Soc. Inf. Manag. 2004, 21, 153–171. [Google Scholar]
- Barnes, S.J.; Vidgen, R. An evaluation of cyber-bookshops: The WebQual method. Int. J. Electron. Commer. 2001, 6, 11–30. [Google Scholar] [CrossRef]
- Danneels, E. Organizational antecedents of second-order competences. Strateg. Manag. J. 2008, 29, 519–543. [Google Scholar] [CrossRef]
- Jantunen, A.; Puumalainen, K.; Saarenketo, S.; Kyläheiko, K. Entrepreneurial orientation, dynamic capabilities and international performance. J. Int. Entrep. 2005, 3, 223–243. [Google Scholar] [CrossRef]
- Wilden, R.; Gudergan, S.P.; Nielsen, B.B.; Lings, I. Dynamic capabilities and performance: Strategy, structure and environment. Long Range Plan. 2013, 46, 72–96. [Google Scholar] [CrossRef]
- Rusbult, C.E.; Farrell, D. A longitudinal test of the investment model: The impact on job satisfaction, job commitment, and turnover of variations in rewards, costs, alternatives, and investments. J. Appl. Psychol. 1983, 68, 429. [Google Scholar] [CrossRef]
- Park, K.Y.; Yoo, S.Y.; Seo, J.W. The effect of perceived quality on experiential value and satisfaction. J. Tour. Res. 2013, 25, 401–415. [Google Scholar]
- Chang, E. Hedonic Shopping value as a determinant of brand loyalty in apparel shopping. Int. J. Costume Cult. 2001, 4, 203–216. [Google Scholar]
- Kim, E.J.; Kim, J.W. A study on repurchase intention for the products of social enterprise. J. Korea Soc. Ind. Inf. Syst. 2012, 17, 107–108. [Google Scholar] [CrossRef]
- Kwon, M.W.; Lee, K.C. Consumption values of adolescent consumers and related variables. J. Korean Home Econ. Assoc. 1998, 36, 141–158. [Google Scholar]
- Rhee, H.J.; Ryu, S.H. Effects of social values of social enterprises on attitude towards social enterprises and purchase intention: Mediating effects of identification. Acad. Cust. Satisf. Manag. 2012, 14, 197–216. [Google Scholar]
- Andreassen, T.W.; Lindestad, B. The effect of corporate image in the formation of customer loyalty. J. Serv. Res. 1998, 1, 82–92. [Google Scholar] [CrossRef]
- Tsai, K.H.; Yang, S.Y. The contingent value of firm innovativeness for business performance under environmental turbulence. Int. Entrep. Manag. J. 2014, 10, 343–366. [Google Scholar] [CrossRef]
- Woo, J.P. Structural Equation Model Concepts and Understanding; Hannarae: Seoul, Republic of Korea, 2012. [Google Scholar]
- Kim, K.S. The effect of differential education quality on student satisfaction and student loyalty. J. Korean Soc. Qual. Manag. 2013, 41, 53–68. [Google Scholar] [CrossRef]
- Dippé, M.A.; Wold, E.H. Antialiasing through stochastic sampling. In Proceedings of the 12th Annual Conference on Computer Graphics and Interactive Techniques, San Francisco, CA, USA, 22–26 July 1985; pp. 69–78. [Google Scholar]
- Yang, O.S.; You, W.P. The effect of the cultural value on consumers beer purchasing behavior in global markets: Evidence from 5 asian countries. Int. Bus. Rev. 2021, 25, 129–150. [Google Scholar] [CrossRef]
- Hair, J.F.; Ringle, C.M.; Sarstedt, M. PLS-SEM: Indeed a silver bullet. J. Mark. Theory Pract. 2011, 19, 139–152. [Google Scholar] [CrossRef]
- Diamantopoulos, A.; Siguaw, J.A. Formative versus reflective indicators in organizational measure development: A comparison and empirical illustration. Br. J. Manag. 2006, 17, 263–282. [Google Scholar] [CrossRef]
- Petter, S.; Straub, D.; Rai, A. Specifying formative constructs in information systems research. MIS Q. 2007, 31, 623–656. [Google Scholar] [CrossRef]
- Chin, W.W. Commentary: Issues and opinion on structural equation modeling. MIS Q. 1998, 22, 7–16. [Google Scholar]
- Fornell, C.; Larcker, D.F. Structural equation models with unobservable variables and measurement error: Algebra and statistics. J. Mark. Res. 1981, 18, 382–388. [Google Scholar] [CrossRef]
- Nunnally, J.C.; Bernstein, I.H. Psychometric Theory; McGraw-Hill: New York, NY, USA, 1994. [Google Scholar]
- Armstrong, J.S.; Overton, T.S. Estimating nonresponse bias in mail surveys. J. Mark. Res. 1977, 14, 396–402. [Google Scholar] [CrossRef]
- Billings, R.S.; Wroten, S.P. Use of path analysis in industrial/organizational psychology: Criticisms and suggestions. J. Appl. Psychol. 1978, 63, 677. [Google Scholar] [CrossRef]
- Lindell, M.K.; Whitney, D.J. Accounting for common method variance in cross-sectional research designs. J. Appl. Psychol. 2001, 86, 114. [Google Scholar] [CrossRef]
- Cote, J.A.; Buckley, M.R. Measurement error and theory testing in consumer research: An illustration of the importance of construct validation. J. Consum. Res. 1988, 14, 579–582. [Google Scholar] [CrossRef]
- Andersson, L.M.; Bateman, T.S. Cynicism in the workplace: Some causes and effects. J. Organ. Behav. Int. J. Ind. Occup. Organ. Psychol. Behav. 1997, 18, 449–469. [Google Scholar] [CrossRef]
- Aulakh, P.S.; Gencturk, E.F. International principal–agent relationships: Control, governance and performance. Ind. Mark. Manag. 2000, 29, 521–538. [Google Scholar] [CrossRef]
- Awad, N.F.; Krishnan, M.S. The personalization privacy paradox: An empirical evaluation of information transparency and the willingness to be profiled online for personalization. MIS Q. 2006, 30, 13–28. [Google Scholar] [CrossRef]
- Podsakoff, P.M.; MacKenzie, S.B.; Lee, J.Y.; Podsakoff, N.P. Common method biases in behavioral research: A critical review of the literature and recommended remedies. J. Appl. Psychol. 2003, 88, 879. [Google Scholar] [CrossRef] [PubMed]
- Yu, X.R.; Yang, O.S. Knowledge type, knowledge sharing, knowledge creation and firm performance: Evidence from the multinational enterprises in China. J. Strateg. Manag. 2018, 21, 23–48. [Google Scholar]
- Fitzgerald, M.; Kruschwitz, N.; Bonnet, D.; Welch, M. Embracing digital technology: A new strategic imperative. MIT Sloan Manag. Rev. 2014, 55, 1–12. [Google Scholar]
- Singh, A.; Hess, T. How chief digital officers promote the digital transformation of their companies. MIS Q. Exec. 2017, 16, 1–17. [Google Scholar]
- Osmundsen, K.; Iden, J.; Bygstad, B. Digital transformation: Drivers, success factors, and implications. MCIS 2018 Proc. 2018, 37, 1–16. [Google Scholar]
- Li, D.Y.; Liu, J. Dynamic Capabilities, Environmental Dynamism, and Competitive Advantage: Evidence from China. J. Bus. Res. 2014, 67, 2793–2799. [Google Scholar] [CrossRef]
- Albert, S.; Whetten, D.A.; Cummings, L.L.; Staw, B.M. Organizational identity. In Revealing the Corporation: Perspectives on Identity, Image, Reputation, Corporate Branding, and Corporate-Level Marketing: An Anthology; Routledge: London, UK, 1985; pp. 77–105. [Google Scholar]
- Dutton, J.E.; Dukerich, J.M.; Harquail, C.V. Organizational images and member identification. Adm. Sci. Q. 1994, 39, 239–263. [Google Scholar] [CrossRef]
- Lee, M.K. e-SERVQUAL: A scale for measuring consumer evaluations of internet service quality. Korean J. Mark. 2002, 17, 73–95. [Google Scholar]
- Zahra, S.A.; Bogner, W.C. Technology strategy and software new ventures’ performance: Exploring the moderating effect of the competitive environment. J. Bus. Ventur. 2000, 15, 135–173. [Google Scholar] [CrossRef]
- Gatignon, H.; Xuereb, J.M. Strategic orientation of the firm and new product performance. J. Mark. Res. 1997, 34, 77–90. [Google Scholar] [CrossRef]
- Cooper, R.G. Winning with new products: Doing it right. Ivey Bus. J. 2000, 64, 54–60. [Google Scholar]
- Narver, J.C.; Slater, S.F. The effect of a market orientation on business profitability. J. Mark. 1990, 54, 20–35. [Google Scholar] [CrossRef]
- Teece, D.J. Dynamic capabilities as (workable) management system theory. J. Manag. Organ. 2018, 24, 359–368. [Google Scholar] [CrossRef]
- Cohen, W.M.; Levinthal, D.A. Absorptive capacity: A new perspective on learning and innovation. Adm. Sci. Q. 1990, 35, 128–152. [Google Scholar] [CrossRef]
- Park, S.H. The effects of experiential value on brand attitude, brand trust and brand loyalty. J. Brand Des. Assoc. Korea 2019, 17, 103–118. [Google Scholar]
- Kang, Y.K. A Theoretical study on the rise and development of Korean Chaebol from the perspective of macro-organizational theory. Korean Corp. Manag. Rev. 2016, 65, 107–129. [Google Scholar]
- Shiv, B.; Huber, J. The impact of anticipating satisfaction on consumer choice. J. Consum. Res. 2000, 27, 202–216. [Google Scholar] [CrossRef]
- Wiggins, R.R.; Ruefli, T.W. Sustained competitive advantage: Temporal dynamics and the incidence and persistence of superior economic performance. Organ. Sci. 2002, 13, 81–105. [Google Scholar] [CrossRef]
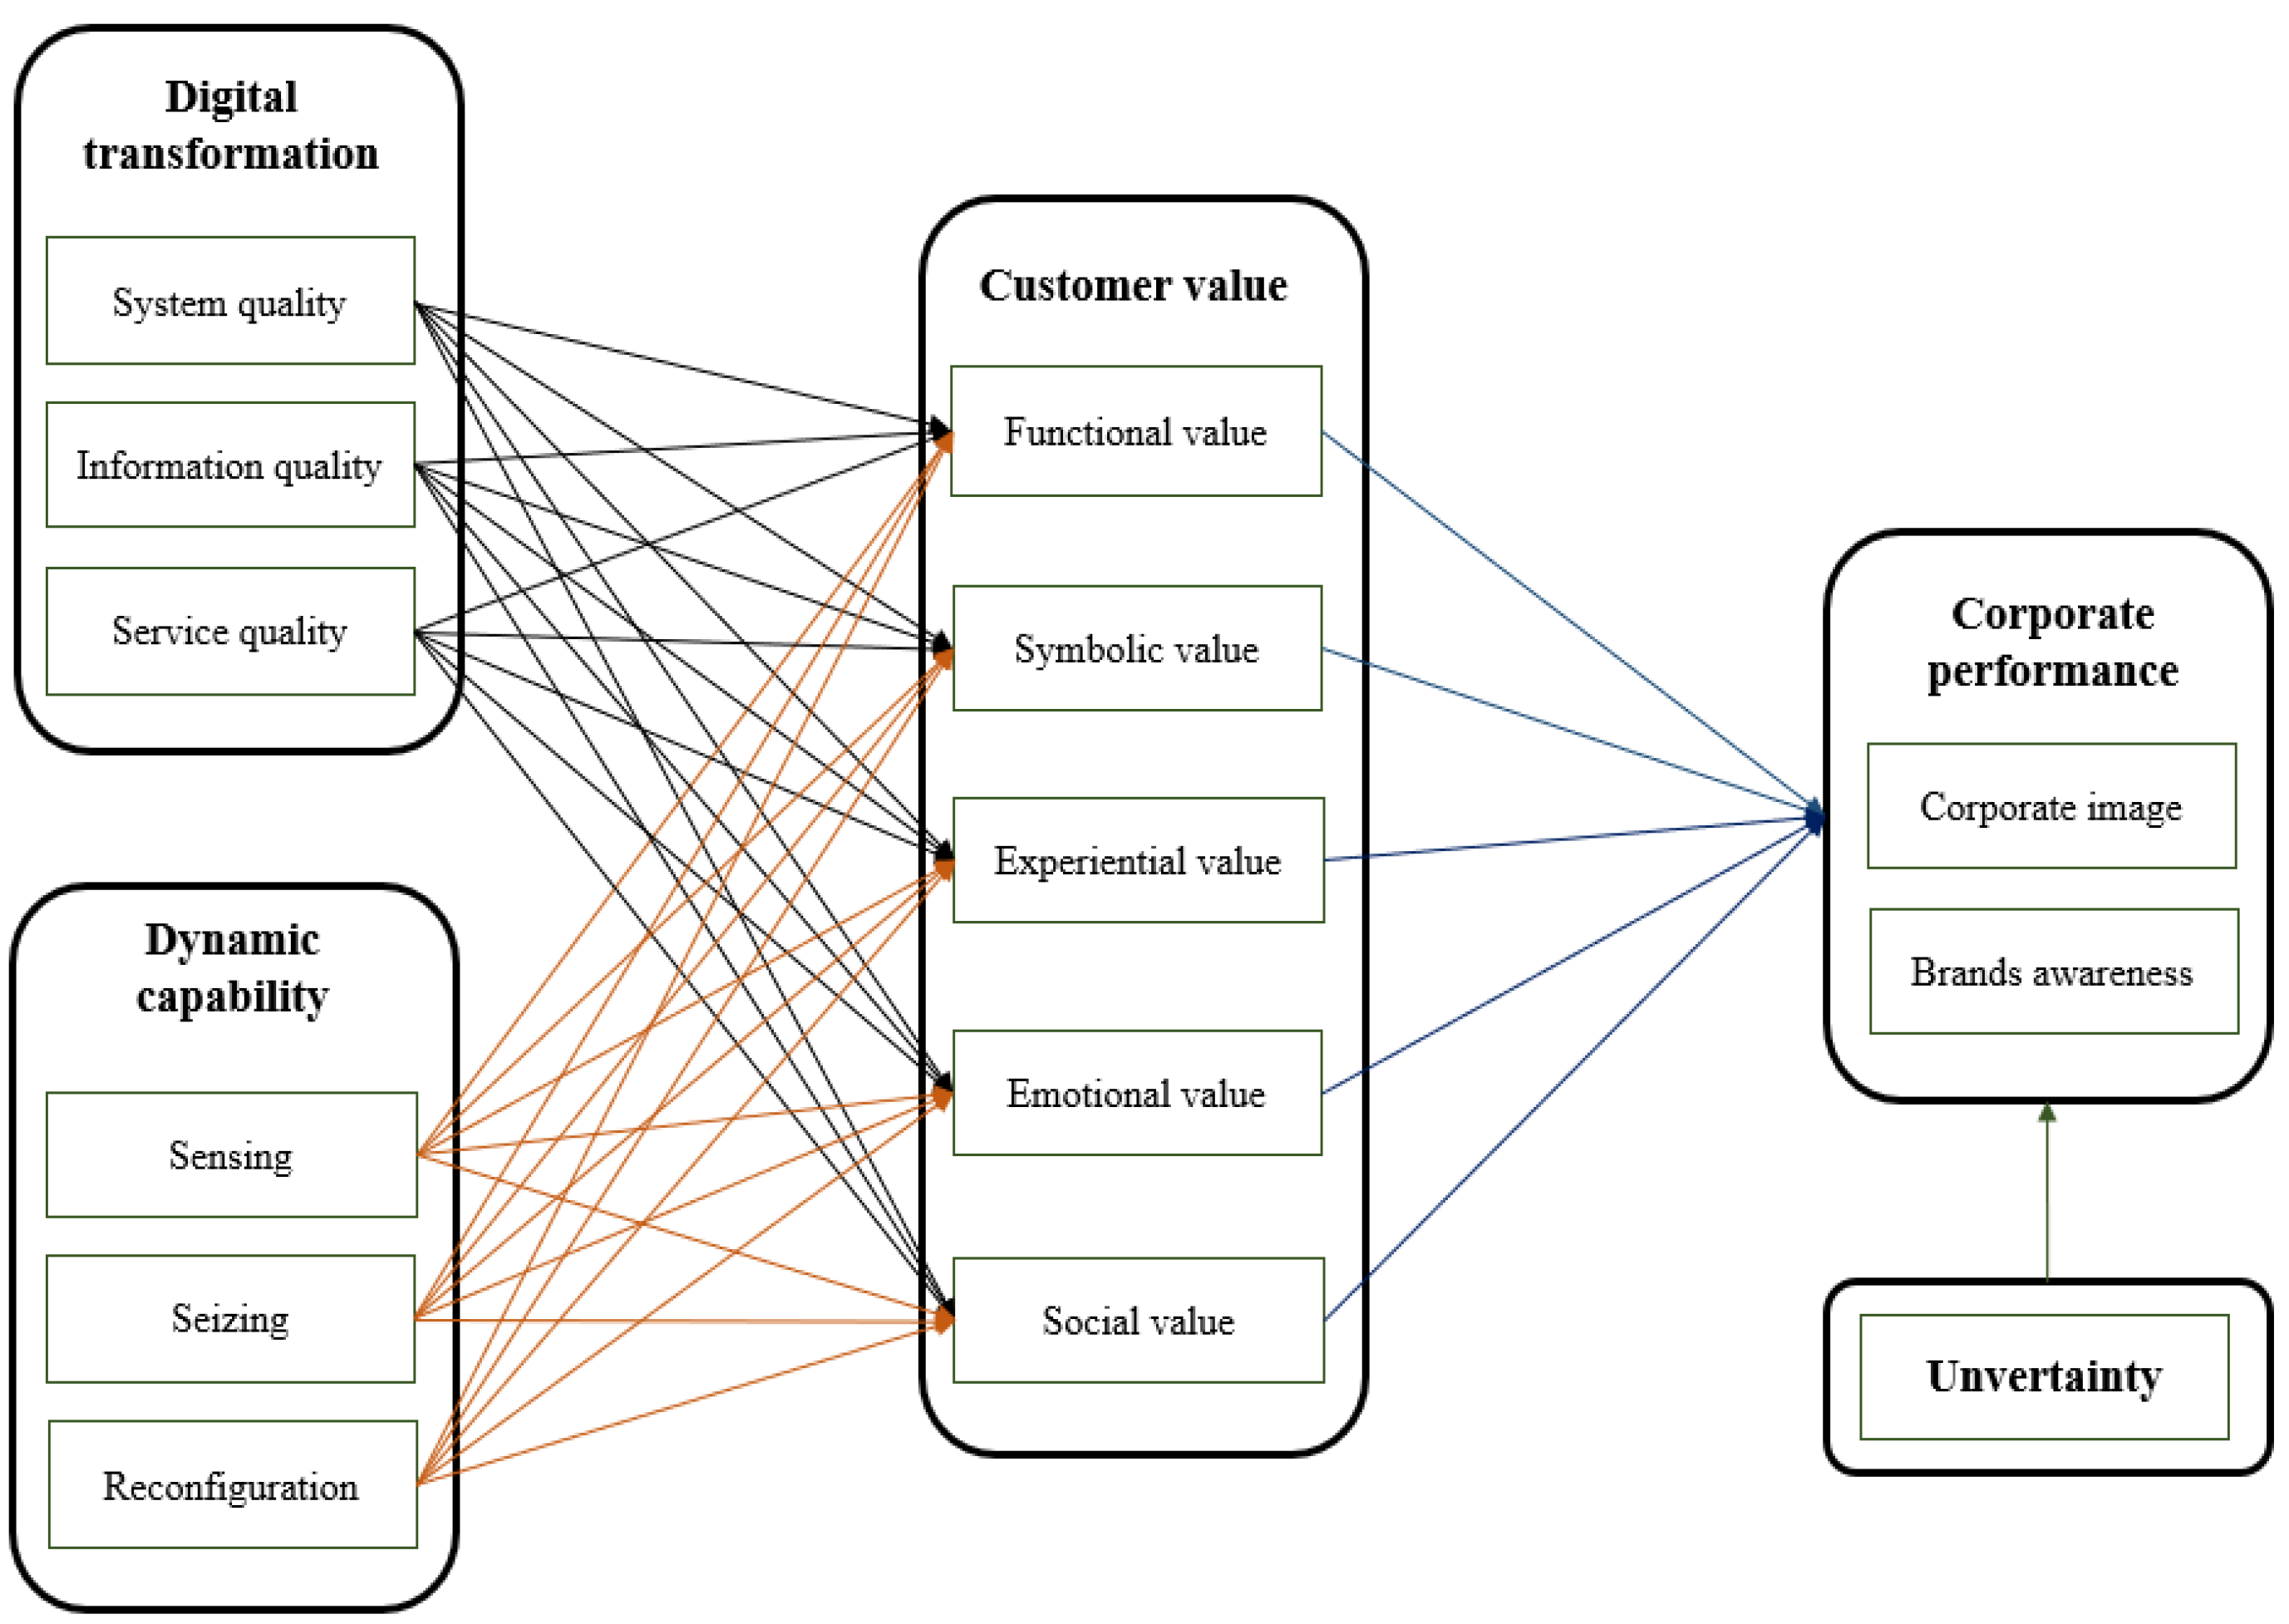
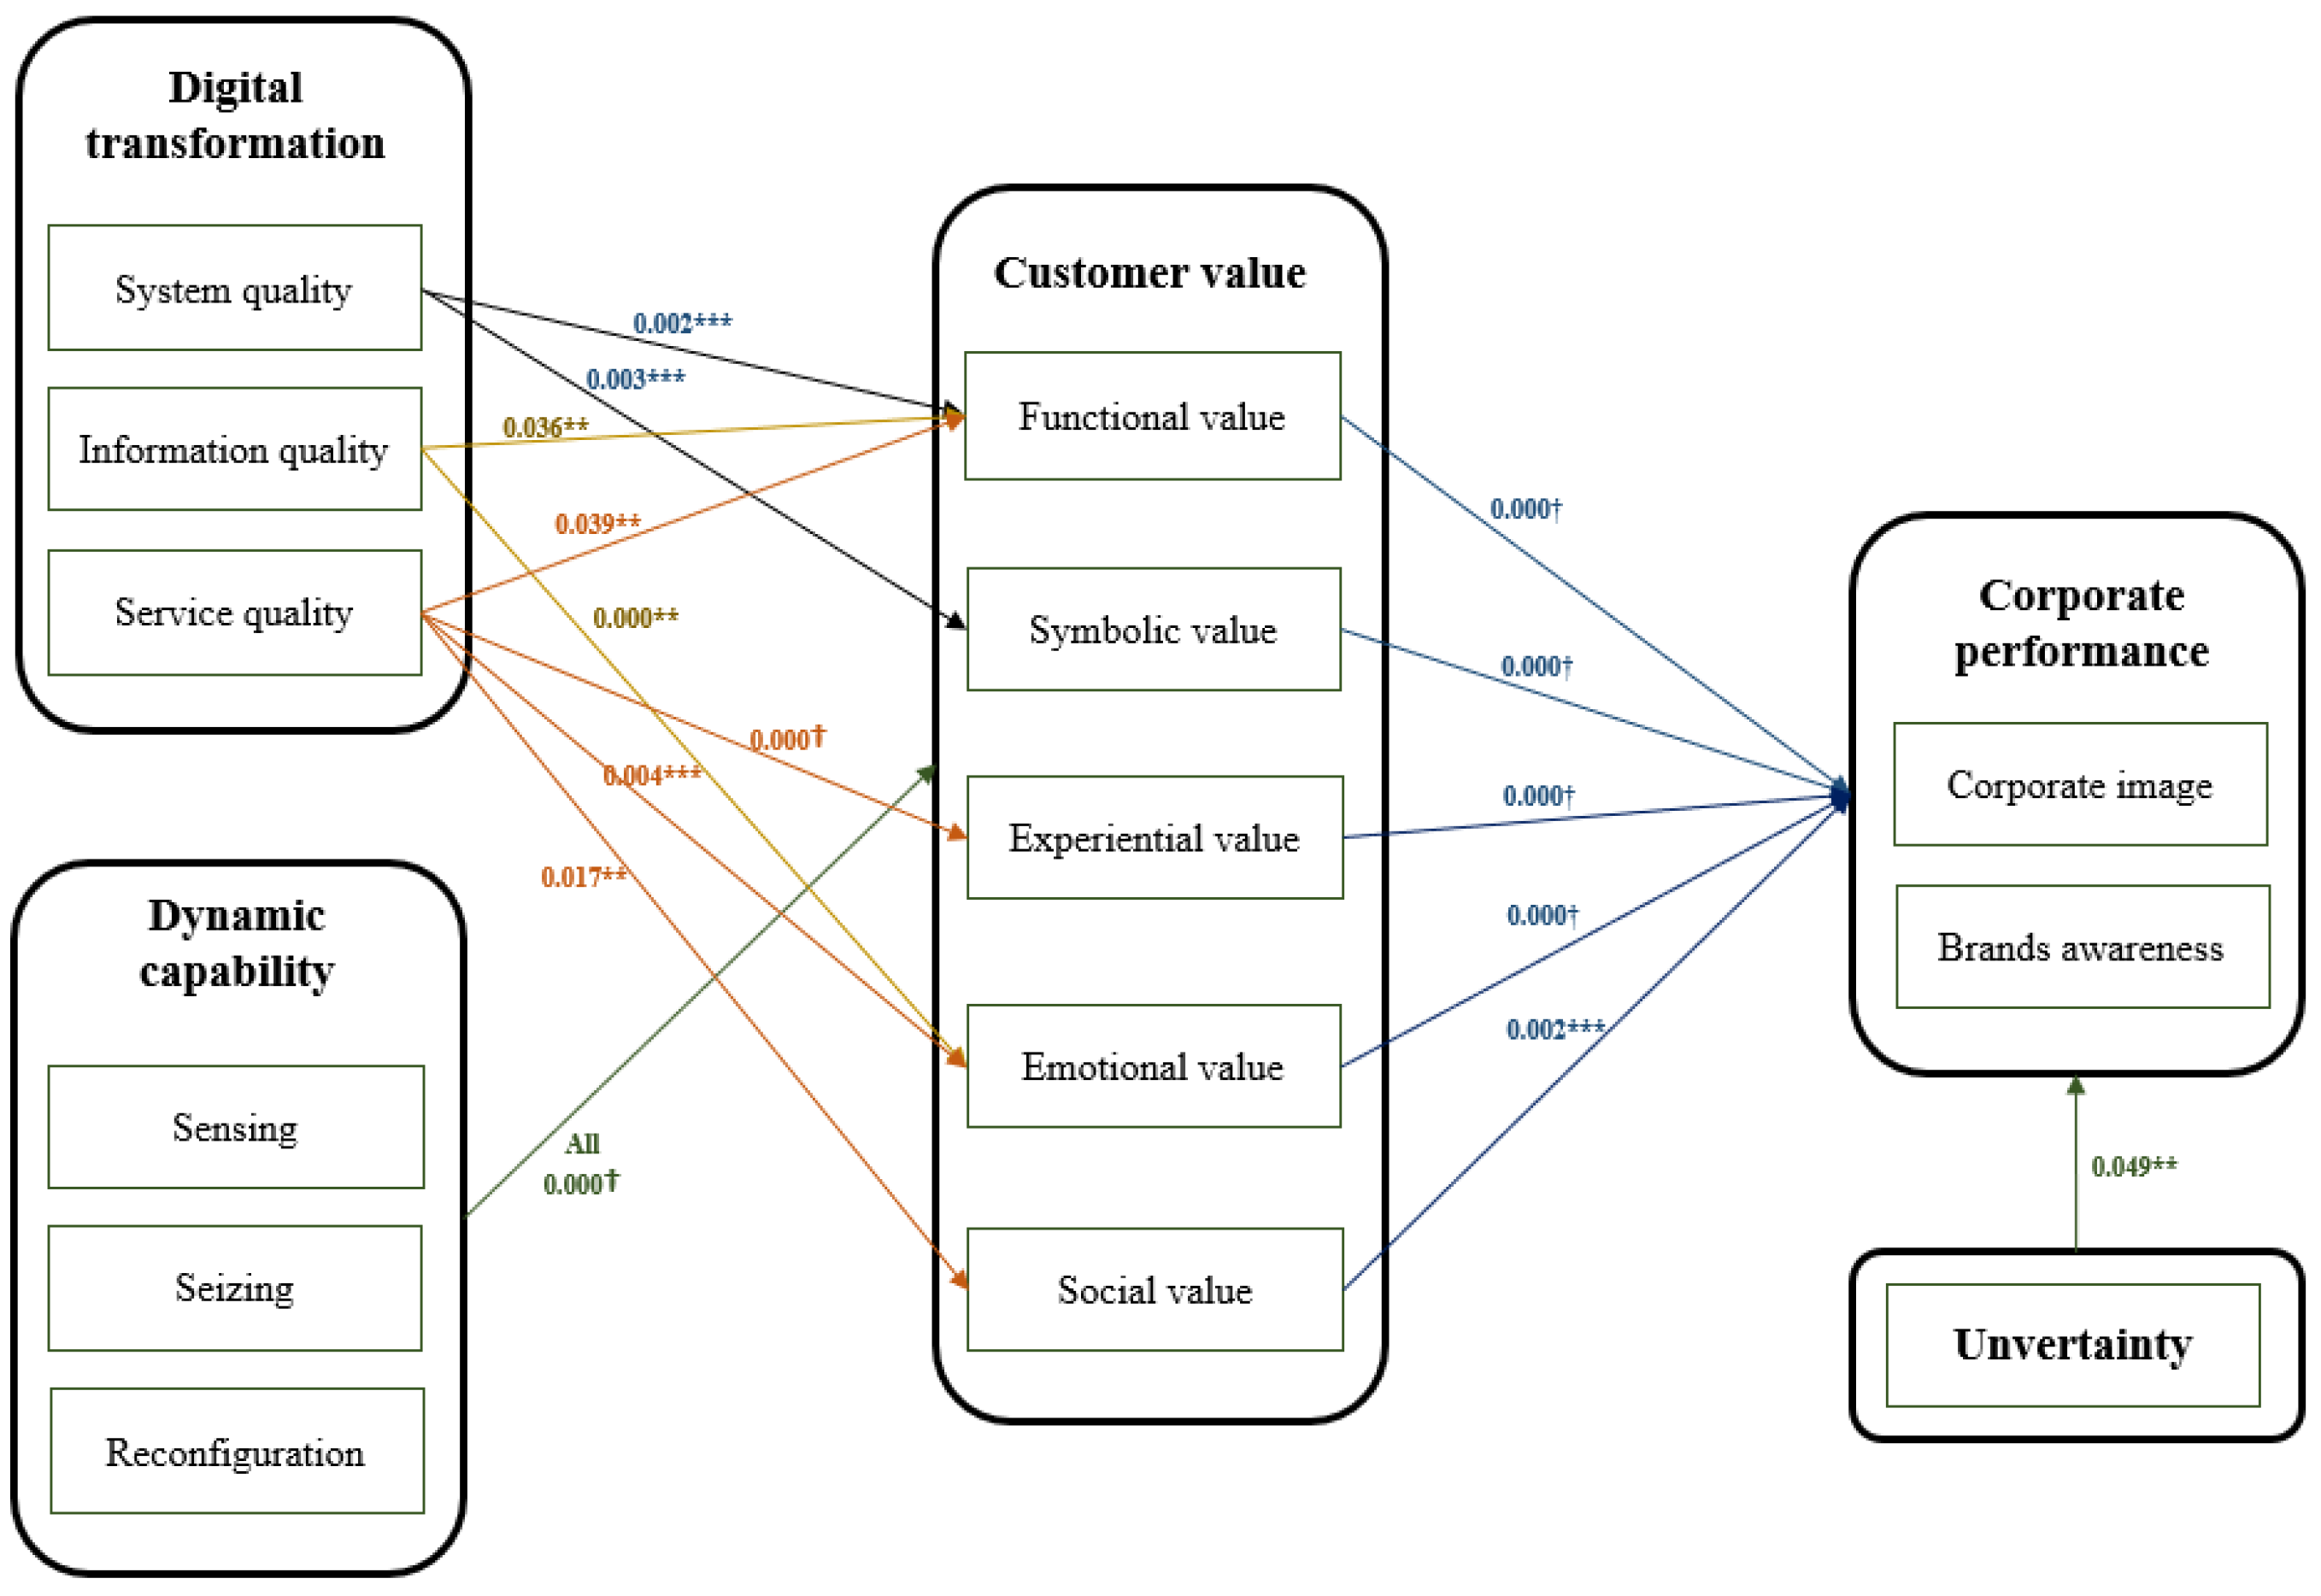
Disclaimer/Publisher’s Note: The statements, opinions and data contained in all publications are solely those of the individual author(s) and contributor(s) and not of MDPI and/or the editor(s). MDPI and/or the editor(s) disclaim responsibility for any injury to people or property resulting from any ideas, methods, instructions or products referred to in the content. |
© 2024 by the authors. Licensee MDPI, Basel, Switzerland. This article is an open access article distributed under the terms and conditions of the Creative Commons Attribution (CC BY) license (https://creativecommons.org/licenses/by/4.0/).