Article

Classified Spatial Clustering and Influencing Factors of New Retail Stores: A Case Study of Freshippo in Shanghai

1
School of Urban Design, Wuhan University, Wuhan 430072, China
2
School of Resource and Environmental Sciences, Wuhan University, Wuhan 430079, China
*
Author to whom correspondence should be addressed.
Sustainability 2024, 16(15), 6643; https://doi.org/10.3390/su16156643 (registering DOI)
Submission received: 17 June 2024 / Revised: 1 August 2024 / Accepted: 1 August 2024 / Published: 3 August 2024

Abstract

:
The diversified innovative strategies adopted by the new retail format in urban spaces have significantly driven retail transformation and innovation. The combination of online platforms and physical stores provides a substantial advantage in market competition. This paper takes “Freshippo”, a typical representative of China’s new retail, as an example. Based on multi-source data and using tools such as GIS spatial analysis, statistical analysis, and geographical detectors, this study comprehensively examines the spatial clustering characteristics and influencing factors of Freshippo physical stores in Shanghai. The findings show that Freshippo has significantly expanded in the Shanghai fresh food market by innovatively opening various types of stores. However, there are substantial differences in the proportions of different types of stores, with 94% of the stores having online retail capabilities. Each offline store in the new retail format presents a multi-level “complementary” spatial distribution feature across the urban space, with distinctive clusters in the urban central districts, urban periphery areas, and outer suburban districts. The radiation range of logistics and distribution services exhibits characteristics of “central agglomeration and multi-point distribution”, providing residents with diverse and accurate services. Additionally, the comparison of multiple model results shows that the location selection of various types of new retail stores is significantly influenced by multiple factors, especially the nonlinear amplification effect of factor interactions on store agglomeration. These findings provide an important scientific reference for understanding the development of new retail formats and offer new ideas that promote the transformation and innovation of the retail industry, thereby achieving sustainable development.

1. Introduction

With the rapid development of digital technologies and the global digital economy, innovations such as the Internet and artificial intelligence have accelerated the lifecycle processes of the retail industry [1,2]. Online retail models using the Internet and big data analytics offer greater shopping convenience, lower costs, and a wider selection of products. These advantages have intensified competition among enterprises, leading to the closure of some physical retail stores and prompting retailers to adopt different strategies. Some physical retailers have responded by closing underperforming stores, while others have transformed their operations by adding online channels [3,4]. Notably, online retailers such as Amazon, Alibaba, Jingdong, and Suning are also opening physical stores. Whether physical retailers expand online or online retailers open physical stores, the goal remains to meet diverse consumer demands. This retail model is known as “new retail” in China’s retail sector [5,6]. The specific definition of “new retail” has not yet reached a consensus. Alibaba was the first to propose the concept of “new retail”, defining it as an omni-channel retail model focused on consumer experience. Some scholars suggest that “new retail” is based on new technologies and new logistics, integrating online and offline channels to form an “online + offline + smart logistics” development model. It utilizes technologies such as artificial intelligence, the Internet of Things, and big data to support the flows of information, capital, and business, focusing on enhancing offline service experiences and improving logistics delivery efficiency [7,8,9]. Currently, new retail enterprises are opening stores in various urban areas, offering different service functions such as offline sales, online sales, logistics delivery, and consumer self-pickup, as seen in companies like Freshippo, Sam’s Club, and Taocaicai. These new retail stores embody digitalization, intelligence, integration of online and offline channels, and an omni-channel approach, all of which align with the characteristics of new consumption patterns. Therefore, given the numerous innovative features of “new retail”, we believe that in the new era of retail transformation and the pursuit of sustainable development, “new retail” can be regarded as an optimized form or extension of many retail models, better meeting the diverse and changing needs of the consumer market.
Before the emergence of online retail, traditional commercial center expansion models exhibited “core–periphery” diffusion characteristics. However, they gradually encountered issues such as severe homogenization of competition, indiscriminate selection of store locations, and detachment from consumer needs. With the rise of online retail, single-channel physical retail centers were significantly impacted, leading to the bankruptcy of some retail enterprises and the closure of stores [10,11]. Compared to traditional retail, new retail models offer consumers convenience that covers almost every aspect of the service process, including online, offline, and logistics delivery [12,13]. These models are more competitive in such aspects as operating models [14,15], service concepts [16,17], and technological innovation [18]. However, new retail enterprises still face significant challenges in integrating online and offline resources, achieving a seamless shopping experience, and responding to rapidly changing market demands [3,7,8,19,20]. Specifically, to ensure efficient logistics and provide high-quality services through precise location selection, enterprises need to invest substantial resources and effort. Therefore, the precise placement of stores by new retail enterprises in urban spaces is crucial for their future survival and sustainable development.
Scholars from various fields have conducted extensive research on the spatial distribution and site selection of retail stores, primarily focusing on consumer needs and market changes. Researchers have significantly enriched the data sources for scientific research by using geographic information system (GIS), remote sensing (RS), and Global Positioning System (GPS) technologies (referred to as “3S”) to collect multi-source data and conduct big data analysis and processing with Python. This approach has greatly aided spatial clustering studies by analyzing POI data, remote sensing images, and mobile signaling data [7,19,21]. The data processing and visualization capabilities of “3S” technology enhance data analysis. Various methods, such as geographic detectors [22], AHP [23], binary logistic regression models [24], and Huff models [25], have been used for quantitative analysis to identify factors influencing commercial store distribution [20,26,27]. These studies thoroughly examine the impact of the business environment, consumer distribution, road traffic, distance costs, service industry development, rent costs, and intelligent logistics on store distribution [10,28,29,30,31,32]. These methods provide strong support for conclusions about retail store site selection preferences. Moreover, retail geography and commercial location theory offer theoretical guidance for studying urban retail spaces [3,24]. Regarding the research findings on new retail formats, some scholars have discussed the correlation between the spatial distribution of new retail stores and various factors [7,8,27,32]. However, detailed exploration of the site selection characteristics and factors of various new retail store types, especially systematic comparisons of retail store categories within a single enterprise, is still lacking. Specifically, this paper focuses on exploring the clustering patterns and key factors for new retail stores with different service models in urban spaces. This includes analyzing the clustering patterns and related factors for stores with offline sales, “online + offline” sales, and “online + self-pickup” services.
In 2016, Alibaba established “Freshippo (China) Co., Ltd.” (hereinafter referred to as “Freshippo”), which is China’s first new retail supermarket enterprise [5,33]. It developed a supply chain model centered around “farmers—Freshippo village—Freshippo stores”, successfully creating a bidirectional supply–demand channel between urban and rural areas [34,35]. Within this model, Freshippo village focuses on producing high-quality agricultural products [36,37], while Freshippo stores are tasked with efficiently delivering fresh products to consumers. The strengths of the new retail model were particularly evident during Freshippo’s response to the COVID-19 pandemic, where the company’s service orientation and societal impact were widely recognized. In addition, Freshippo stores encompass various retail formats, such as fresh food supermarkets, high-end membership supermarkets, community convenience stores, discount stores, and community grocery stores. These formats cater to different consumer groups and provide targeted services. Therefore, considering the representativeness of the case study and the limitations of existing research, we chose Freshippo as the research subject. This choice allows us to systematically reveal the clustering characteristics of different categories of new retail stores under the same enterprise and significantly enhances our practical understanding of retail geography and commercial location theory. It provides valuable insights for the sustainable transformation of traditional retail industries.
Considering the distribution of Freshippo stores in China and Shanghai’s suitability as a study area, this research focuses on Shanghai. First, it uses ArcGIS software for spatial analysis, including kernel density estimation, clustering, and outlier detection, to uncover the clustering characteristics and heterogeneity of different types of Freshippo stores. Additionally, it examines the distribution of logistics service areas and analyzes the interactions between online order service areas and physical store locations. Second, using indicators such as rent prices, population density, community size, and points of interest (POIs), the study employs geospatial analysis tools to quantitatively explore the factors influencing site selection for new retail stores. Finally, this study aims to explore the spatial clustering characteristics and influencing factors of different types of new retail stores, thereby enhancing theoretical understanding and offering practical insights into retail geography and commercial location theory. The conclusions of this study are intended to provide scientific references for the spatial distribution of physical retail stores and offer a basis for urban managers and planners to optimize urban commercial spaces, ultimately contributing to the sustainable development of the retail industry.

2. Materials and Methods
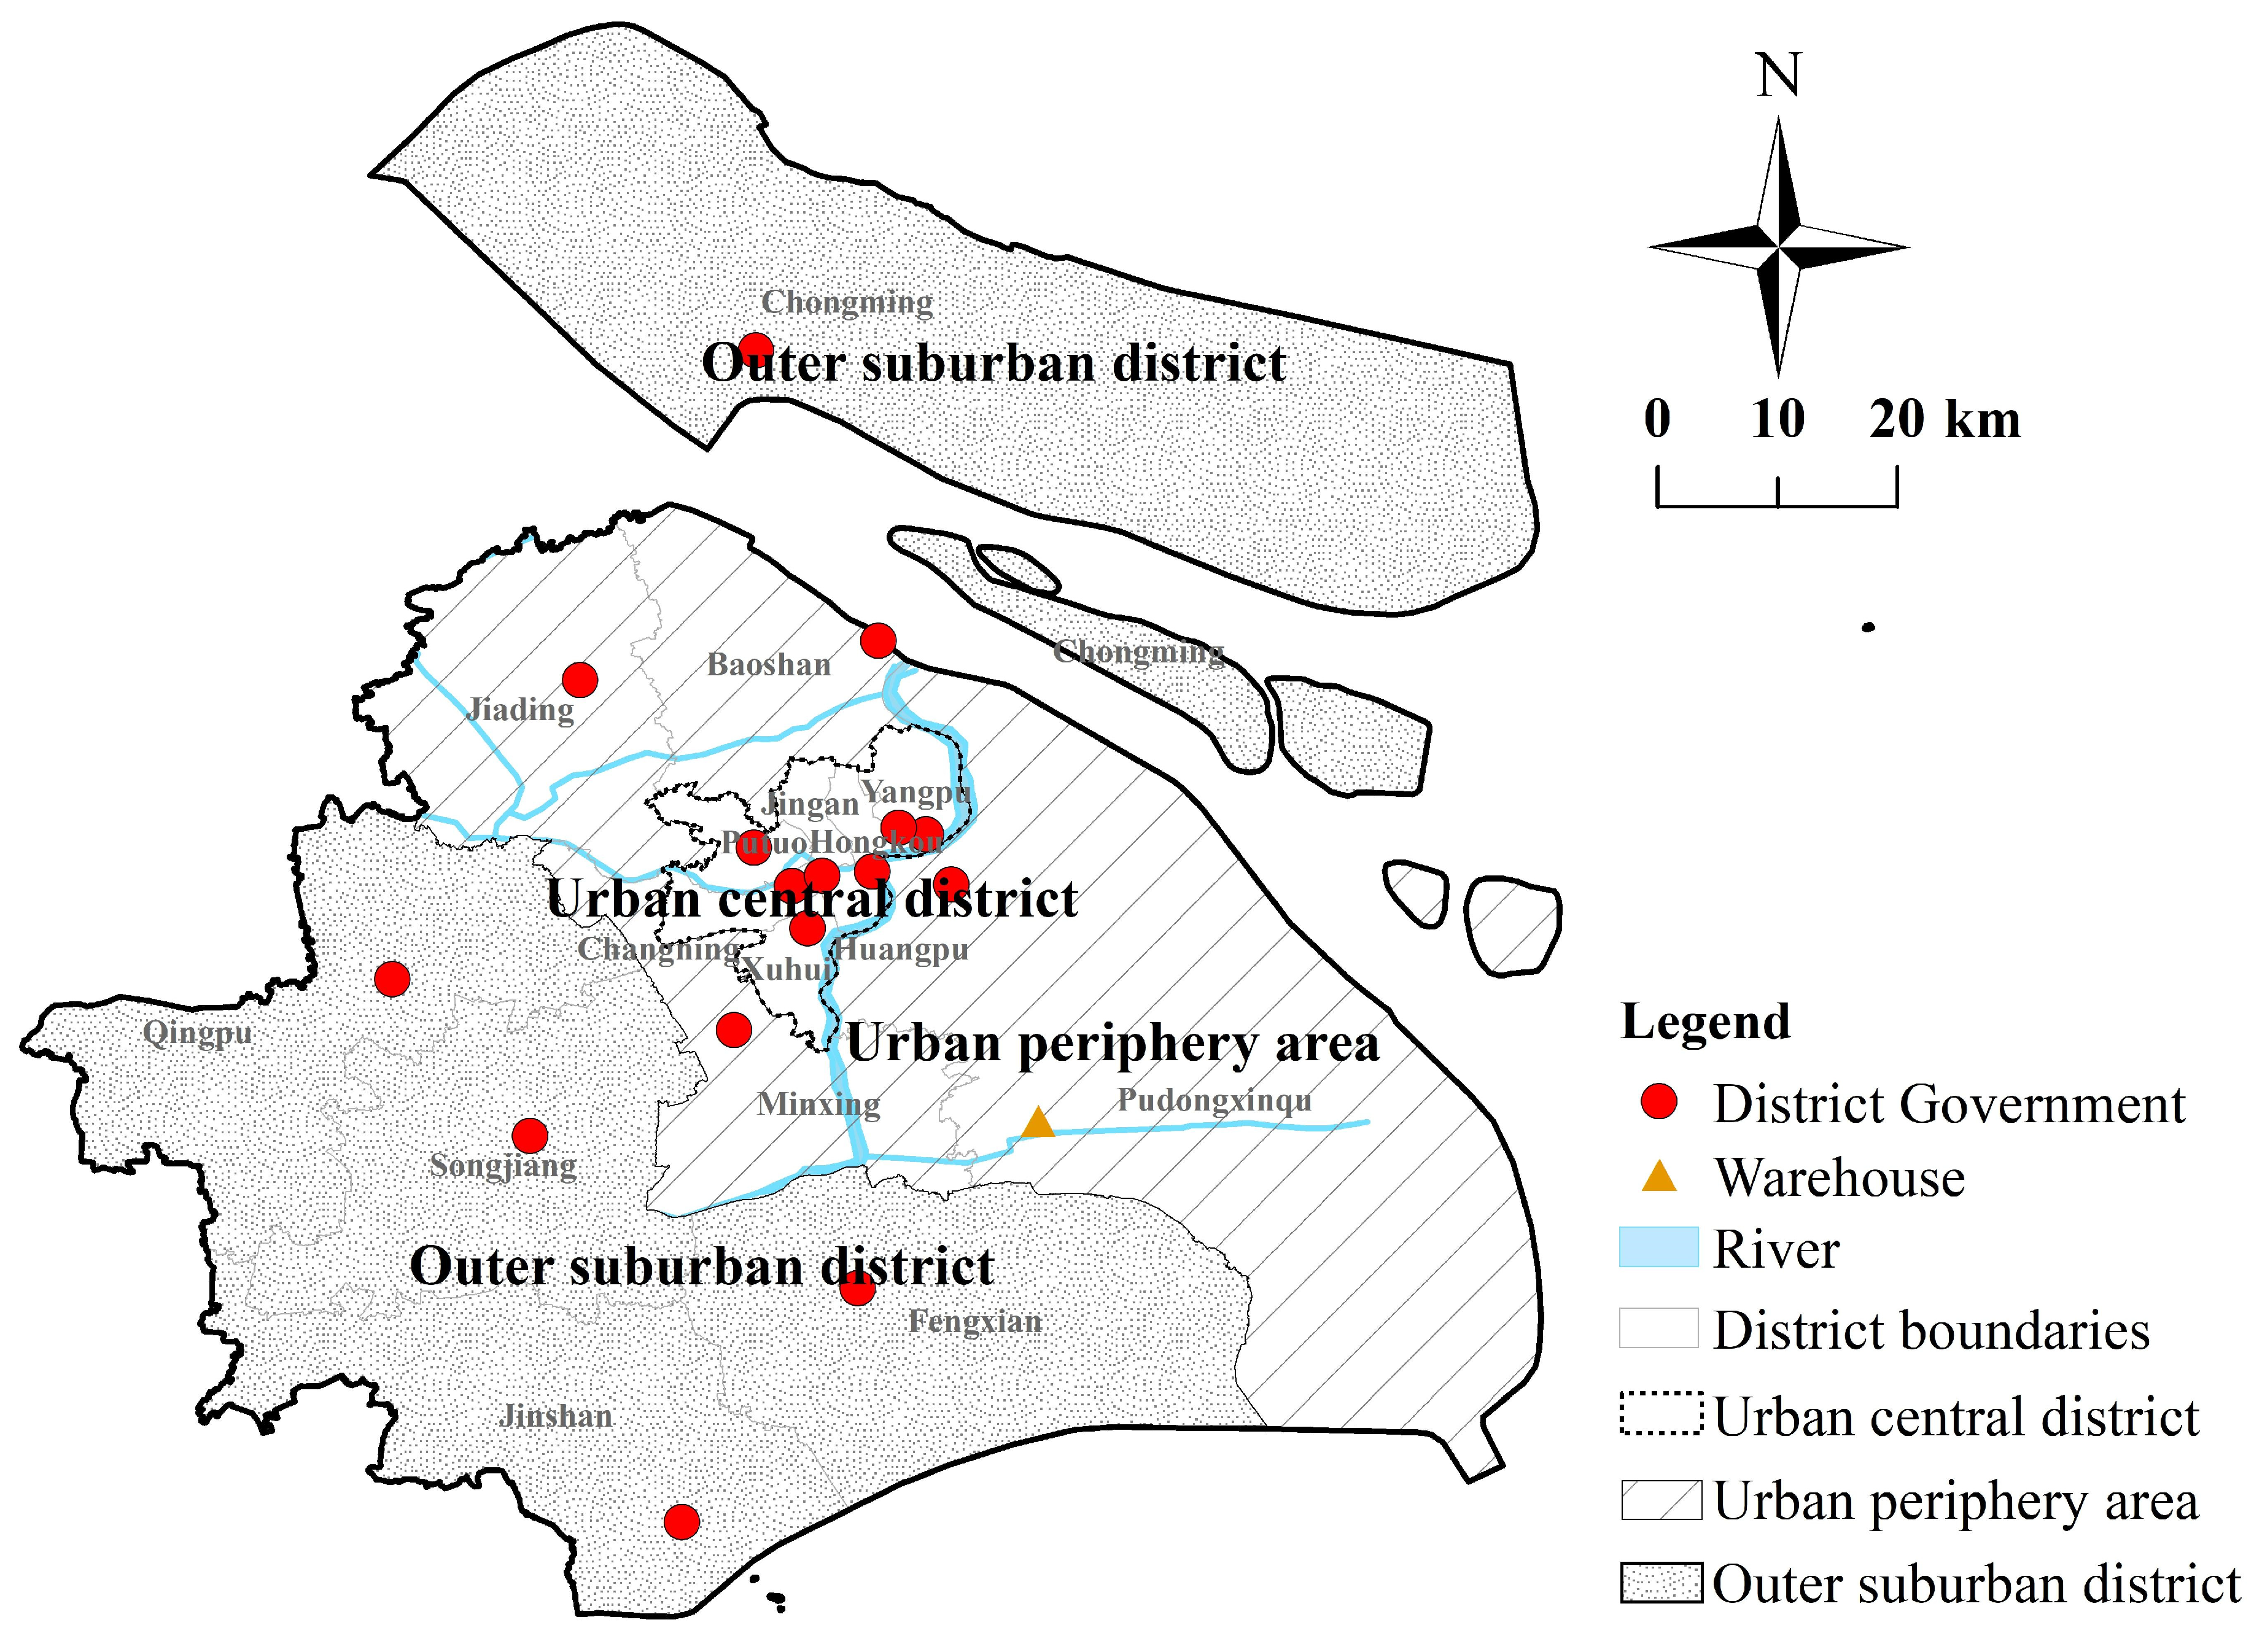
2.1. Study Area

Among all major cities in China, Shanghai has long been recognized for its advanced economic development, open-market environment, innovative industrial policies, and well-developed infrastructure (Figure 1). In 2022, it recorded total retail sales of 1.64 trillion yuan, with a permanent population of 24.8 million, a per capita GDP of 179,900 yuan, and an urbanization rate of 89.3%. Additionally, Shanghai has emerged as a pioneer in promoting new retail formats, having already established 450 Freshippo stores, which represent the highest number of such stores worldwide. Therefore, based on the distribution of Freshippo stores in Shanghai and referencing existing research findings [38,39], the 16 administrative districts are classified as urban central districts, urban periphery areas, and outer suburban districts. The urban central districts include Huangpu District, Xuhui District, Changning District, Jingan District, Putuo District, Hongkou District, and Yangpu District. These areas serve as highly concentrated centers of commerce, finance, and culture, boasting modern CBD areas and bustling commercial districts. The urban periphery areas include Pudong New District, Minhang District, Baoshan District, and Jiading District, characterized by high urbanization levels, rapid development, and favorable urban infrastructure and living environments. The outer suburban districts include Jinshan District, Songjiang District, Qingpu District, Fengxian District, and Chongming District. These areas are geographically relatively remote but are gradually evolving into emerging zones for both commerce and residence with the continuous advancement of urban construction.

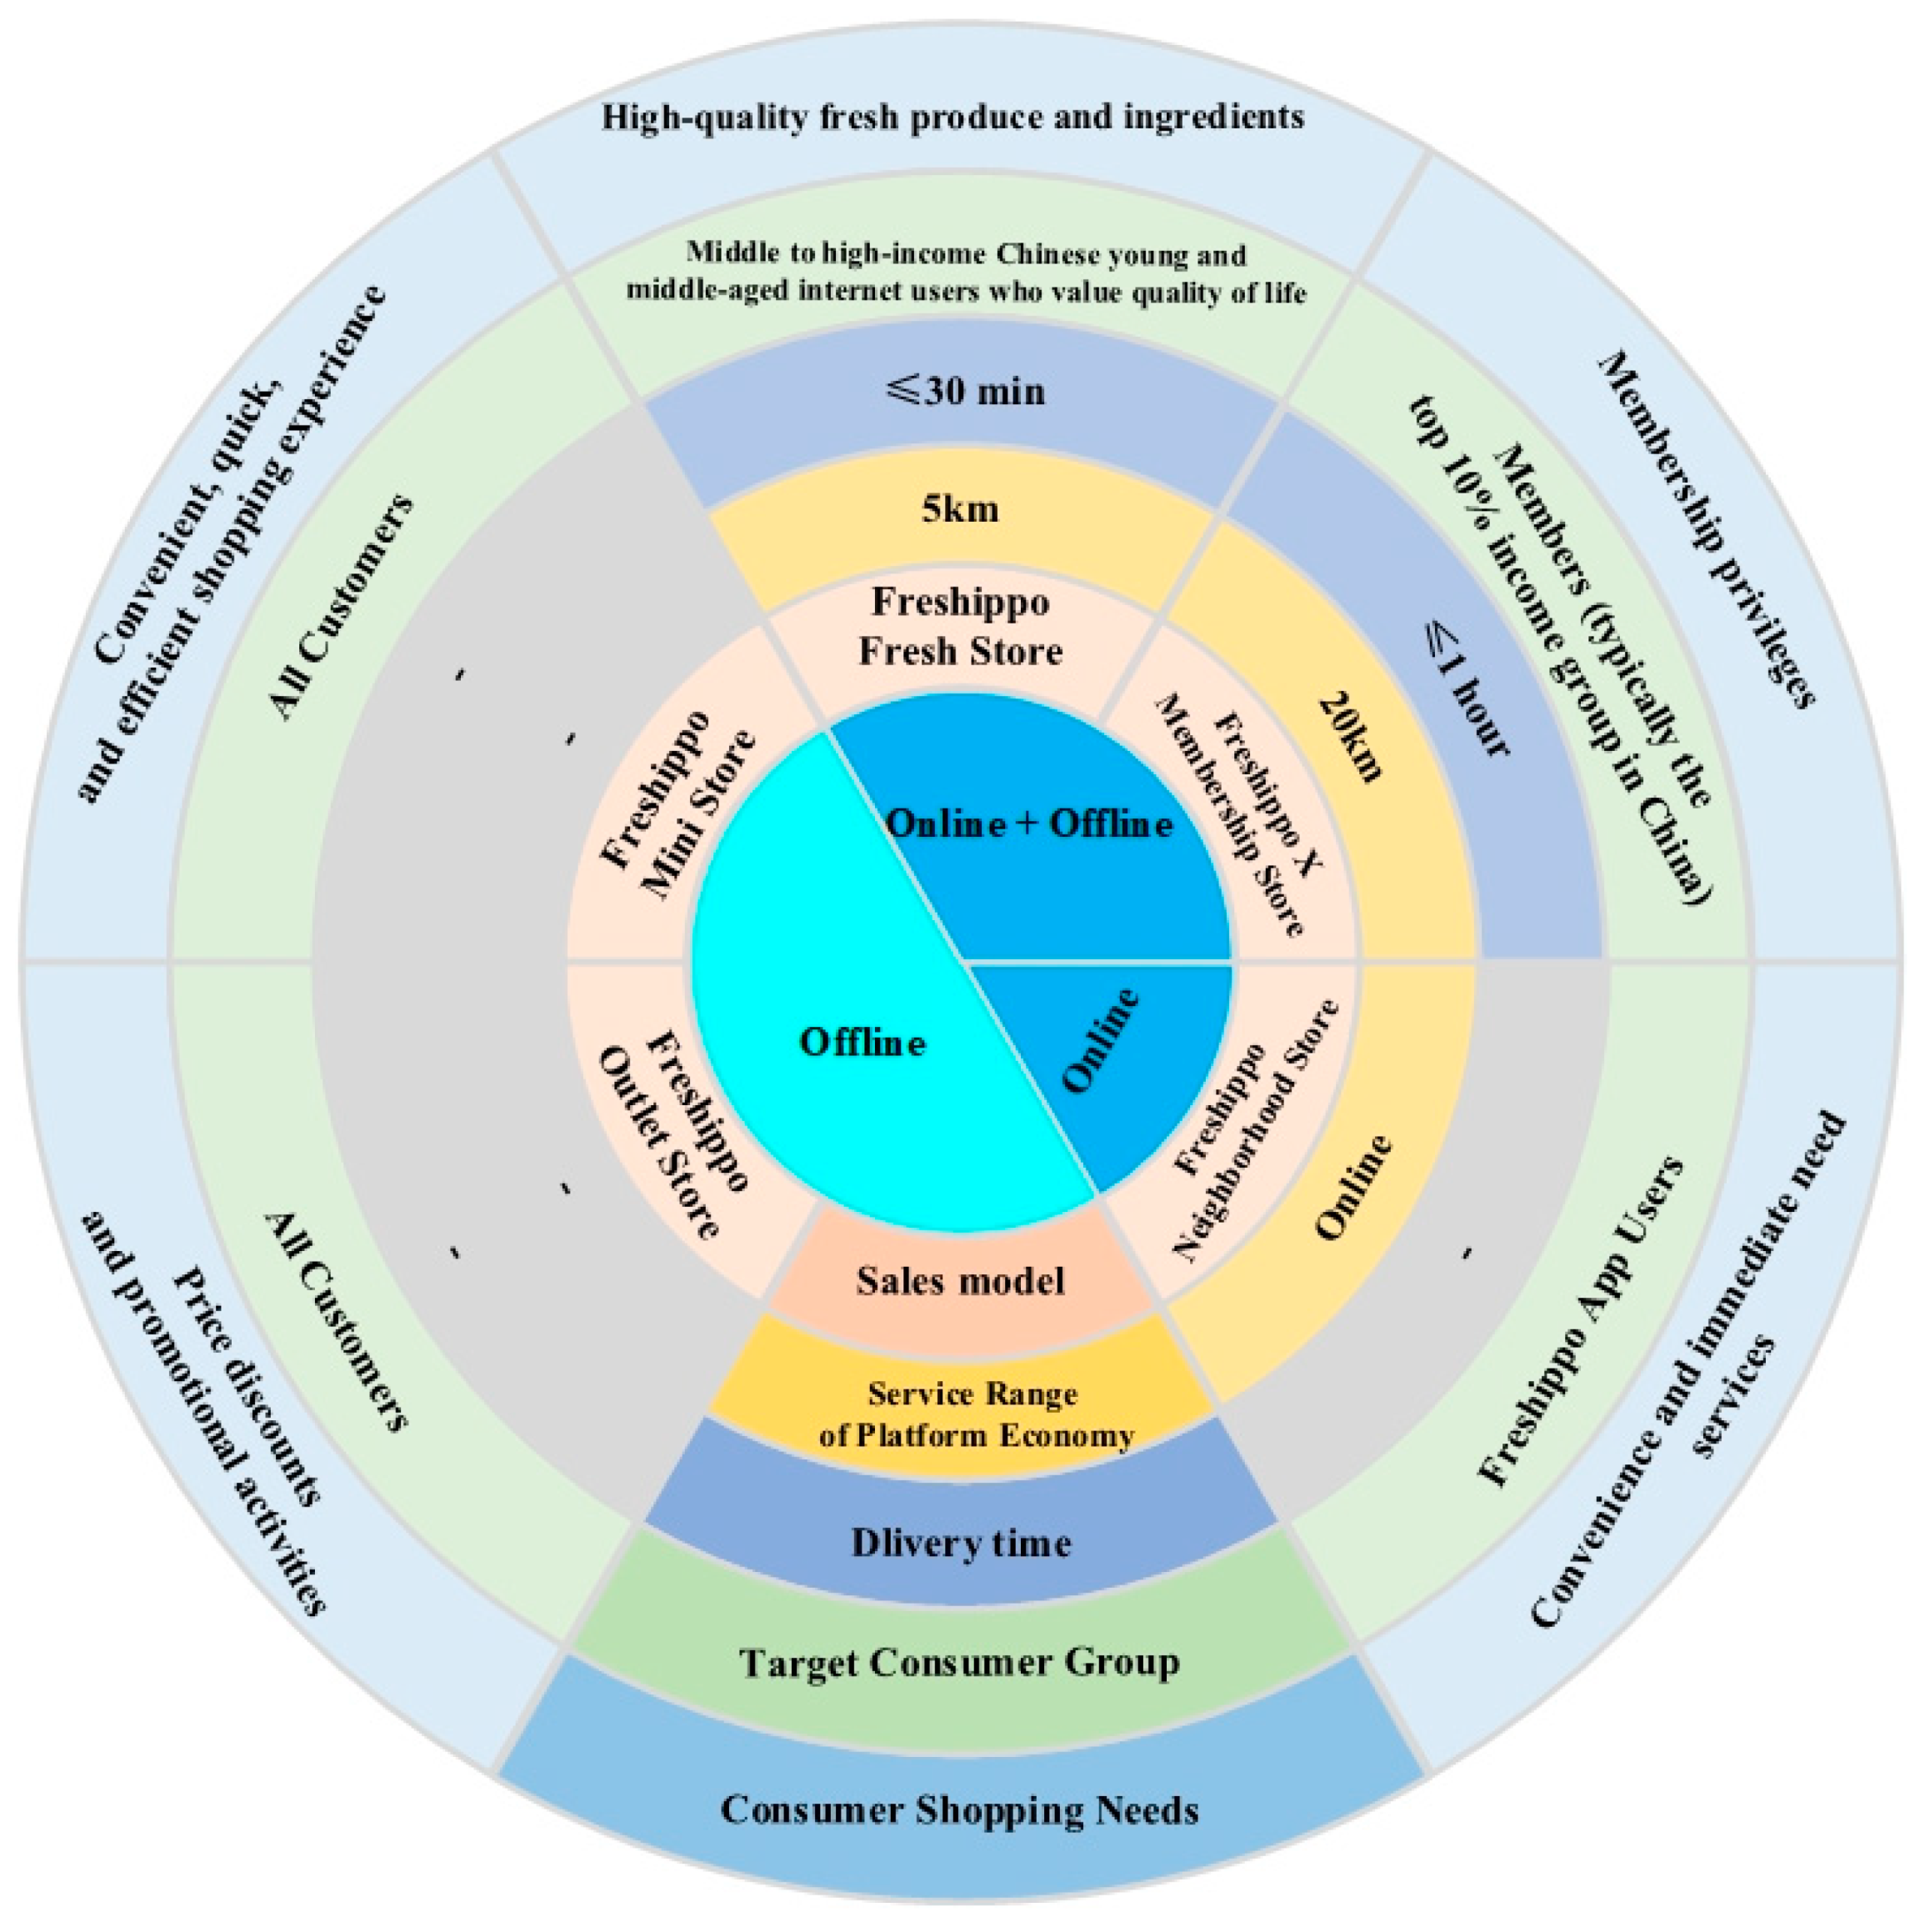
2.2. Research Object

Freshippo, a pioneering innovator in the new retail format, is recognized as China’s inaugural new retail chain supermarket, dedicated to the sale and supply of fresh products. In 2022, operating more than 300 stores, the company achieved a sales revenue of 61 billion yuan and secured the top position for the highest annual sales growth rate among “China’s Top 10 Supermarkets (2022)”. In 2023, based on the survey results of supermarket industry operations, the China Chain Store & Franchise Association (CCFA) released the “Top 100 Supermarkets in China (2022)” report. To highlight the comparative results, this study focuses on the top 10 ranked companies (see http://www.ccfa.org.cn/). By integrating physical stores with online shopping platforms, and by offering high-quality products alongside a digitized consumer experience, Freshippo seamlessly merges “people, goods, and places”. It has successively launched various store types, including Freshippo fresh stores, x membership stores, mini stores, outlet stores, and neighborhood stores. These stores demonstrate diversity in development positioning, service quality, and product quality (Figure 2).
Freshippo fresh stores are positioned as supermarkets specializing in high-quality fresh products and ingredients. They offer fresh produce, cooked food, self-service meals, and other food items, along with a dining area. Freshippo x membership stores cater primarily to high-end consumers with unique, imported specialty ingredients and gourmet experiences, featuring areas such as a seafood bar and a wine tasting area. Freshippo mini stores, small community convenience stores, provide a quick and convenient shopping experience with basic fresh products, convenience food, and daily necessities. Freshippo outlet stores offer discounts and special promotions on fresh products and ingredients, targeting price-sensitive consumers. Finally, Freshippo neighborhood stores serve as community convenience stores, offering customers convenient, fast, and efficient purchasing services to meet immediate needs for daily necessities, quick meals, and basic fresh ingredients.

2.3. Research Methods

By integrating GIS technology, radar chart analysis, and geographical detectors, we have developed a comprehensive and innovative research framework for in-depth analysis of the spatial distribution and influencing factors of Freshippo stores. This multidimensional approach reveals the spatial clustering patterns and density characteristics of different types of stores, and it enables intuitive comparisons through data analysis and visualization. This deeper understanding of the geographical factors driving these distributions makes the integrated method highly innovative and practical, providing a powerful tool and a new perspective for future research in retail spatial analysis.

2.3.1. GIS Technology

1.
Kernel Density Estimation
The kernel density estimation (KDE) method is a representative of modern non-parametric statistical methods and is commonly used to detect the density (or intensity) of measurable events at any location within a region [35,40,41]. The article employs this method to visualize and present the kernel density characteristics of various types of Freshippo stores, thereby facilitating the analysis of spatial heterogeneity relationships. The formulas are as follows:
f ( x ) = 1 n h n i = 1 n k x x i h n
In the equation, n represents the data of a certain type of store, and “hn” is the bandwidth, which refers to the search radius. A higher kernel density value indicates a higher probability of event occurrence and a denser distribution of elements, while a lower value indicates a more scattered distribution.
2.
Clustering and Outlier Analysis
Cluster analysis and outlier analysis involve computing and analyzing local statistics to identify statistically significant spatial clusters and outliers [42,43,44]. This method is applied in the article to analyze the clustering and distribution equilibrium of different types of Freshippo stores in urban space, including the identification of outliers and spatial non-stationarity. The formula for local Moran’s I is expressed as follows:
I j = Z i i Z i 2 j w i j Z j
In the formula, Zi and Zj represent the mean deviations of the store quantities for spatial analysis units i and j, while Wij represents the spatial relationship between spatial analysis units i and j. By using ArcGIS for cluster and outlier analysis, local Moran’s I can be computed, and five visual distribution results can be obtained. Among them, “High–High Cluster” indicates high–high clustering, where both the region itself and its neighboring regions have high values of store quantity. “High–Low Outlier” indicates high–low clustering, where the region itself has a high store quantity while its neighboring regions have a low store quantity. “Low–High Outlier” indicates low–high clustering, where the region itself has a low store quantity while its neighboring regions have a high store quantity. “Low–Low Cluster” indicates low–low clustering, where both the region itself and its neighboring regions have low values of store quantity. “Not Significant” indicates no statistical significance.

2.3.2. Radar Chart Analysis

In scientific research, radar charts are intuitive tools that provide clear visual analyses of multi-dimensional data. They facilitate comparison and evaluation of various indicators across different dimensions. Additionally, side-by-side displays of multiple radar charts clearly highlight differences, making them widely applicable in scientific research [45,46]. In this study, the evaluation indicators are given equal weights, and the indicators are first normalized and then visualized by using a radar chart with the same weights. By comparing the radar charts of multiple variables, the overall level of variables within the store location and the balance of each evaluation indicator can be analyzed.
S   = i = 1 n 1 j > 1 n R i R j sin 360 ° n
L   = i = 1 n 1 j > 1 n 2 R i 2 + R j 2 2 R i   R j   sin 360 ° n
In the formula, S represents the area of the radar chart, which is used to compare the dispersion or variability of data variables. The larger the area, the greater the range and differences in variable values; the smaller the area, the smaller the range and differences in variable values. The similar areas indicate that they may have similar data distributions and variations. L represents the perimeter of the radar chart, which reflects the relationships and continuity of data among different variables. A longer perimeter indicates larger differences or more complex relationships among variables, while a shorter perimeter indicates smaller differences or simpler relationships among variables. n represents the number of indicators, and Ri and Rj respectively represent the lengths of indicator axes i and j.

2.3.3. Geographical Detector

The geographical detector is used to detect spatial variations and uncover the driving forces by examining the consistency in the spatial distribution of two variables [47,48]. The factor detector assesses the influence of specific geographic factors on the spatial distribution differences of variable p, while the interaction detector effectively identifies interactions among different factors. Using Geodetector to investigate the factors influencing the spatial distribution of various types of Freshippo stores enables the integration of multi-source data, facilitates multi-factor quantitative analysis, identifies spatial heterogeneity among different types of stores, and enhances the systematic and analytical accuracy of the research. The formulas are as follows:
q = 1 h = 1 L N h σ h 2 N σ 2 = 1 S S W S S T
S S W = h = 1 L N h σ 2 , S S W = N σ 2
In the formula, q represents the degree of explanation of the factor for the variation in the number of stores. L represents the stratification or classification of variables or factors. Nh and N represent the number of units in stratum h and the entire region, respectively, where h = 1, 2, …, σh2 and σ2 represent the variances of the number of stores in stratum h and the entire region, respectively. SSW and SST represent the sum of within-stratum variances and the total variance of the entire region, respectively. The range of q is [0, 1], and a larger value indicates a stronger spatial variation in the number of stores. Determining the interaction effect types, if q(xixj) < Min(q(xi), q(xj)), the interaction effect type is nonlinear weakening; if Min(q(xi), q(xj)) < q(xixj) < Max(q(xi), q(xj)), the interaction effect type is univariate nonlinear weakening; if q(xixj) > Max(q(xi), q(xj)), the interaction effect type is bivariate enhancement; if q(xixj) = q(xi) + q(xj), the interaction effect type is independent; if q(xixj) > q(xi) + q(xj), the interaction effect type is nonlinear enhancement.

2.4. Data

When constructing the indicator system, the accuracy of official statistical data in Shanghai and the advantages of big data were considered, and the indicator data were collected and organized. After processing the raw data using “3S” technology and statistical methods, a geographic spatial database was constructed to meet the research requirements. The main sources of data are described as follows:
  • The data of the research subject mainly come from the continuous tracking research conducted by the research team on the new retail industry in Shanghai from 2016 to 2022. We obtained information on store locations, target consumer groups, types, product categories, delivery ranges, and operating models from the website provided by Freshippo. After verifying the information for each store through a survey, we converted it into the data required for this study using ArcGIS 10.8 and Excel 2021 software (see https://www.freshippo.com/, accessed on 1 January 2023);
  • Economic and social development data of districts and counties were obtained by compiling government announcements, statistical bureaus, “Shanghai Statistical Yearbook”, and other materials. The data released by the government are usually collected through rigorous review and statistical methods, ensuring high authority and reliability. These data provide a reliable, comprehensive, timely, and comparable foundation for scientific research, facilitating in-depth and valuable studies (see https://tjj.sh.gov.cn/, accessed on 10 January 2023);
  • High-resolution satellite remote sensing imagery data can capture the geographical features and human activities in the Shanghai urban area in detail. They reflect the city’s vitality and economic activities through nighttime brightness, providing significant multipurpose value in supporting urban planning, environmental monitoring, and socio-economic analysis. Therefore, we obtained raw remote sensing imagery data from the Luojia-1 satellite website, which, after processing with RS and GIS technologies, serves as one of the key supporting data sources for this research project (http://59.175.109.173:8888/app/login.html, accessed on 10 January 2023);
  • Compared to government bulletins and statistical data, POIs (points of interest) offers advantages such as a large sample size, diversity, and real-time updates, and it has been widely used by many scholars in urban studies. Consequently, in January 2023, we used Python to collect spatial attribute data on various types of facilities in Shanghai from the Amap website, including public infrastructure, healthcare facilities, hotel services, and life services (https://lbs.amap.com/, accessed on 10 February 2023);
  • Vector data of administrative boundaries, roads, rivers, etc. in Shanghai were downloaded from the National Platform for Common GeoSpatial Information Services (https://www.tianditu.gov.cn/, accessed on 20 January 2023).

3. Results

3.1. The Changes in the Number of Stores

3.1.1. Changes in the Number of Different Types of Stores

This paper explores the temporal characteristics of Freshippo stores in Shanghai by analyzing the types, quantities, and timeline of store openings from 2016 to 2022 (Figure 3). The following patterns are observed:
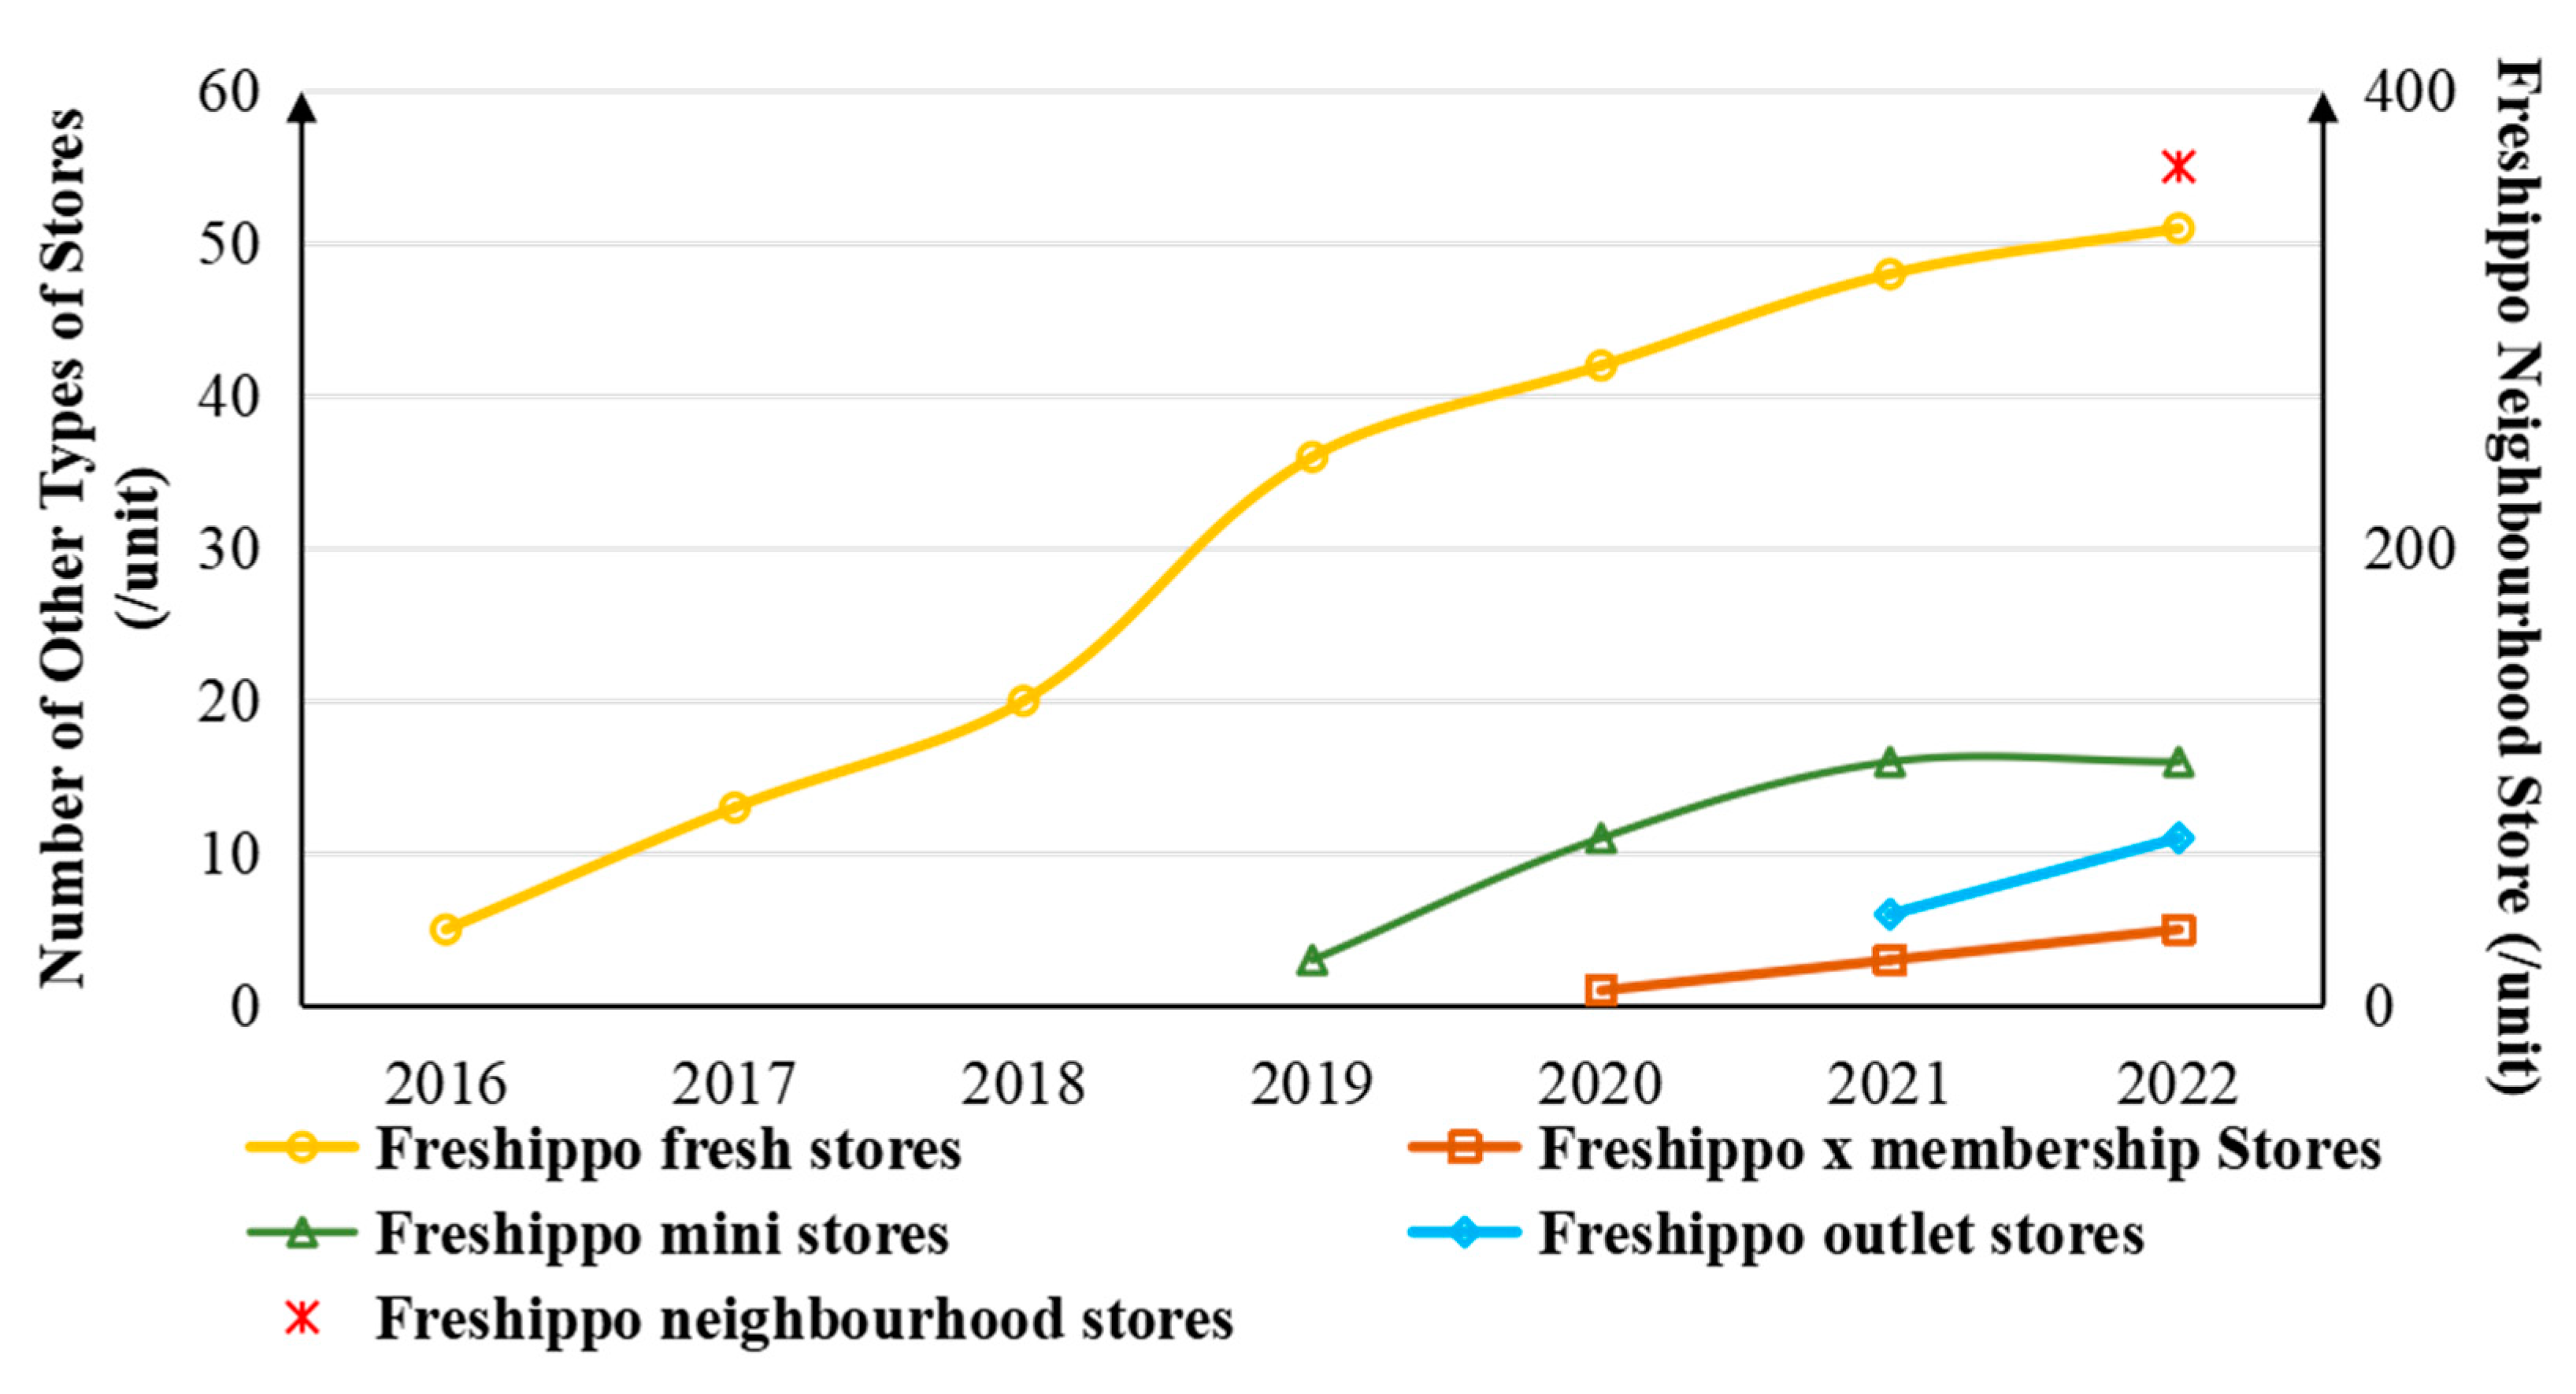
  • Overall, there is a growing trend in the number of Freshippo stores. The first store was opened in 2016, and by 2022, through investments in funds, technology, and personnel, the number had reached 450. This trend underscores Freshippo’s gradual expansion in Shanghai;
  • Significant differences exist in the number of Freshippo stores among different types. Between 2016 to 2021, Freshippo fresh stores consistently had the highest number of stores, increasing from one store to 51 stores. The growth rate of Freshippo stores has been gradually slowing. With the opening of new stores and the transformation in service strategies of other types of stores, the number of Freshippo outlet stores has also increased. However, during this period, the number of Freshippo x membership stores, which primarily serve members, has remained relatively low. In 2022, Freshippo neighborhood stores were introduced as a new retail format, with 367 stores opening in Shanghai. Compared to the years 2016–2019, during the spread of the COVID-19 pandemic, concerns among investors and operators about investment risks may have contributed to the relatively slowed growth in the number of Freshippo stores, including Freshippo and Freshippo mini stores, in 2020 and 2021;
  • From 2016 to 2021, only Freshippo fresh and Freshippo x membership stores in Shanghai offered online retail functions. In 2022, with the introduction of Freshippo neighborhood stores across Shanghai, a retail model that combines online retail services and consumer self-pickup was implemented, further bridging the service gap between online and offline retail. Concurrently, the proportion of stores equipped with online retail capabilities increased significantly, reaching 94%.

3.1.2. Changes in the Number of Stores in Each District

To facilitate the visual analysis for each type of store, separate graphs were created, including the Freshippo store count variation graph and the comparison graph between Freshippo neighborhood stores and other types (Figure 4).
  • The distribution of Freshippo stores across the urban central districts, urban periphery areas, and outer suburban districts shows dynamic and significant imbalances. From 2016 to 2021, the number of Freshippo stores in the urban periphery areas consistently exceeded that in the outer suburban districts, while the urban central district maintained a moderate number of stores. However, in 2022, the urban central districts had the fewest Freshippo stores, with the urban periphery areas and outer suburban districts having 6.86 and 4.27 times the number of stores in the urban central districts, respectively. The changes observed in 2022 reflect a strategic shift in Freshippo’s expansion efforts, placing greater emphasis on the urban periphery areas and outer suburban districts while reducing its presence in the urban central districts. This strategic pivot might stem from evolving market demands or Freshippo’s enhanced understanding of consumer purchasing behaviors in different regions, leading to a recalibration of store distribution. Such dynamic adjustments underscore the company’s robust adaptability and strategic agility in response to regional market trends;
  • The annual growth rates of Freshippo stores in the urban central districts, urban periphery areas, and outer suburban districts of Shanghai have exhibited significant variations, characterized by cycles of growth and contraction. Each area reached its peak growth rate in different years, 2019 for both the urban central districts and urban periphery areas, and 2020 for the outer suburban districts. This reflects the distinct market dynamics and consumer behaviors in each region. This variability suggests that Freshippo employs distinct growth strategies and demonstrates market adaptability across various urban areas, influenced by diverse levels of market competition, evolving demands, and consumer purchasing patterns. As a result, Freshippo may need to develop customized marketing strategies and store designs in different regions to optimize market responsiveness and drive business growth;
  • There is a notable misalignment in the distribution between Freshippo neighborhood stores and other types of Freshippo stores. The urban central districts contain only two Freshippo neighborhood stores compared to 37 stores of other types. In contrast, the outer suburban districts host 151 Freshippo neighborhood stores but only seven stores of other types. These variances in store distribution likely reflect Freshippo’s strategic market positioning and choices across different regions. In the urban central districts, Freshippo may opt to open other types of stores due to the dense population and well-developed commercial sectors. Conversely, in the outer suburban districts, Freshippo might prefer to establish neighborhood stores to serve the larger residential populations and compensate for the relative scarcity of convenient facilities, thus positioning these stores advantageously for meeting daily needs.

3.2. Cluster Analysis and Outlier Analysis of Spatial Distribution

Although initially using the 16 municipal districts of Shanghai as basic units provided some insights into local clustering characteristics, the limited number of these units may lead to less precise and detailed results. To improve accuracy and visualization, this study opts to use towns, which are smaller administrative levels, as the basic units for data processing. ArcGIS software is used to perform spatial clustering and outlier analysis for each type of Freshippo stores (Figure 5). The results are then validated through a combination of software visualization and field investigations. Additionally, the analysis of the spatial clustering of the five types of Freshippo stores reveals notable local heterogeneity and regional differences (Table 1).
Freshippo fresh stores exhibiting high–high clustering are predominantly dispersed across various districts of the urban central districts and adjacent near suburbs (including Pudong New Area and Minhang District). Meanwhile, those displaying low–high clustering are primarily concentrated in various districts of the urban central districts, the northern region of Pudong New Area, and the southern area of Baoshan District. There is one town characterized by high–low clustering, situated in the central part of Songjiang District.
Freshippo x membership stores demonstrating low–low clustering are mainly situated on the periphery of the outer suburban districts, whereas those with low–high clustering are primarily located in the border regions of Changning District, Songjiang District, Qingpu District, and Jiading District. Two towns, Sanlin and Gaoxing in Pudong New Area, exhibit high–low clustering.
Freshippo mini stores with low–low clustering are primarily distributed along the streets of Hongqiao in Changning District, Tianlin in Xuhui District, and in the central areas of the urban central districts and nearby suburban regions. Those with low–high clustering are predominantly found in the northern region of Pudong New Area, eastern Yangpu District, and northern Fengxian District. Three towns exhibit high–low clustering: Sheshan, Chuansha New Town, and Qibao Town.
Freshippo outlet stores with low–low clustering are mainly located in the peripheral areas of Qingpu District and Chongming District, while those with low–high clustering are primarily situated in Xuhui District, Jinshan District, Baoshan District, and Pudong New Area. Three towns exhibit high–low clustering: Zhujing Town, Zhoupu Town in Jinshan District, and Shanyang Town.
In summary, common factors such as consumer demographics, local demand, and market potential play crucial roles. Each store type is tailored to suit the characteristics and preferences of target consumer groups in specific regions. The heterogeneity arises from differences in regional economic development, consumer behavior, and urban planning. For instance, urban high-income areas tend to have more Freshippo fresh and Freshippo x membership stores, reflecting the demand for premium products and convenience. Conversely, urban periphery areas and lower-income regions have a higher concentration of Freshippo mini and Freshippo outlet stores, catering to price-sensitive consumers and expanding into emerging markets. Additionally, outer suburban and urban periphery areas, which lack adequate retail options, have more Freshippo neighborhood stores, bridging the gap in convenience and access to fresh products. Overall, the distribution of Freshippo stores across different regions exemplifies an adaptive approach to meeting diverse consumer needs while maximizing market coverage and potential.

3.3. Clustering Characteristics of Freshippo Stores

Based on existing research findings [5,35], we define the clustering characteristics of Freshippo stores as the phenomenon of concentrated distribution of the same or different types of stores in geographical space, as well as the regional characteristics formed thereby. These characteristics reflect the high-density distribution of Freshippo stores within specific geographical areas, along with the underlying business logic, market strategies, and regional development patterns. Specifically, these clustering characteristics can be described and analyzed through various dimensions such as geographical location, service functions, target customer groups, product types, and logistics models.
Unlike traditional retail, which focuses solely on offline spatial distribution, the defining feature of the new retail format is the integration of both online and offline channels. To reveal the spatial clustering characteristics of Freshippo’s sales chain, it is insufficient to consider only the distribution of physical stores, as digital intelligence logistics also plays a crucial role in restructuring retail spaces [2,8,31]. Hence, this research examines Freshippo store sales from two perspectives, the spatial clustering of physical store locations and logistics distribution services.

3.3.1. Spatial Clustering Characteristics of Offline Stores

By conducting kernel density analysis on various store types, the spatial clustering characteristics of offline store locations in the Freshippo retail chain are revealed (Figure 6).
1.
Spatial clustering characteristics of Freshippo fresh stores
The spatial distribution of Freshippo fresh stores shows a pattern of “high concentration in the urban central districts and sparse distribution outside” (Figure 6a). This pattern is closely linked to the urban central districts as a commercial, political, and residential hub. Additionally, several high-density zones outside the urban central districts are primarily located in administrative centers or densely populated residential areas in Minhang District, Songjiang District, Jiading District, and Pudong New Area.
2.
Spatial clustering characteristics of Freshippo x membership stores
The spatial distribution of Freshippo x membership stores is located between the urban central districts and nearby suburbs, extending in the northeast, southeast, southwest, and northwest directions (Figure 6b). These stores are strategically positioned at certain distances from local government seats and city centers. Surrounded by high-end shopping malls and office buildings, they benefit from convenient transportation and well-developed public infrastructure. This distribution pattern aligns with the service positioning of warehouse-style membership stores, catering to middle-class families. The current locations offer cost-effective products and offline shopping experiences, enhancing customer engagement while facilitating convenient 20 km online delivery.
3.
Spatial clustering characteristics of Freshippo mini stores
The spatial distribution of Freshippo mini stores shows a “multi-core aggregation, belt-like distribution” pattern (Figure 6c). Circular kernel density clusters are found in the eastern part of the urban central districts, surrounding district government seats. Belt-like kernel density clusters are primarily located between different administrative districts. This pattern indicates that store locations avoid areas with a high concentration of county government offices and are not positioned near district government seats.
4.
Spatial clustering characteristics of Freshippo outlet stores
The kernel density spatial distribution of Freshippo outlet stores exhibits a “multi-core scattered distribution” pattern (Figure 6d). High-density areas of these stores are primarily concentrated in the urban central districts of Shanghai, Baoshan District, the northern part of Pudong New Area, and the northern and southern ends of Jinshan District. Additionally, most stores are located in the built-up areas of towns with high population density, while fewer stores are found in the central parts of the urban central districts.
5.
Spatial clustering characteristics of Freshippo neighborhood stores
The spatial clustering characteristics of Freshippo neighborhood stores differ significantly from the other types of stores, especially when contrasted with the clustering patterns of Freshippo fresh stores (Figure 6a,e). The kernel density clusters are absent in the urban central districts; instead, they are distributed in the urban periphery areas and outer suburban districts, with significant clustering in Chongming District as well, forming a pattern of “multiple cores, multiple points, and interconnections”. Comparing the distribution of core areas with the built-up and residential areas, it is evident that the core areas show a high degree of overlap with the urban built-up areas surrounding local government towns and are also highly coincident with high-density residential areas in other core regions.

3.3.2. Service Range of Logistics for Platform Consumption

Based on Shanghai’s urban road network and publicly disclosed delivery standards, we used ArcGIS software to simulate delivery ranges, revealing the spatial clustering characteristics of online order deliveries (Figure 7). This simulation considers the attributes of traffic routes, stations, and intersection nodes, starting from various types of Freshippo stores.
The geographic distribution of Freshippo fresh stores’ logistics and distribution services follows a “one center, two satellites” spatial pattern within the urban area. The “one center” extends from the urban core to the urban central districts and nearby suburban boundaries. The “two satellites” are mainly located in Jiading District and Songjiang District (Figure 7a). Freshippo x membership stores have a spatial delivery range covering the main city area in four directions, showing a “center–periphery” pattern (Figure 7b). Freshippo neighborhood stores have a scattered distribution, primarily located in areas with dense transportation networks in the nearby and outer suburbs (Figure 7c).
Based on the spatial and residential community coverage statistics for the delivery range of each store type (Table 2), and considering the overall characteristics of the logistics distribution along the sales chain, the following conclusions are drawn:
  • The logistics delivery areas of each store type exhibit a “complementary” spatial distribution feature (Figure 7d). The overall logistics service range is mainly distributed in the urban central districts, nearby suburbs, and far suburbs, showing the phenomena of intersection, integration, and complementarity in the border areas. It already covers 88.02% of the total urban area of Shanghai;
  • The coverage area of different types of stores closely correlates with the number of residential communities. By comparing the numbers, density, and categories of residential communities within the service range, it is evident that Freshippo offers diverse and precise service products. Freshippo has achieved comprehensive coverage of densely populated residential areas, reaching 88.02% of the city’s total population.

3.3.3. Analysis of Sales Spatial Clustering Features

1.
Comparative analysis of spatial clustering characteristics of different store types
Freshippo fresh stores, aimed at the high-end market, are primarily located in upscale residential communities, shopping centers, and business districts, where property prices, rentals, and consumption levels are significantly higher. Freshippo x membership stores target VIP customers by offering more personalized and high-quality services. They are primarily located in high- to mid-end commercial areas, business districts with high foot traffic, and areas near high-traffic transportation hubs, as well as communities and residential areas with strong purchasing power.
In comparison to Freshippo fresh stores and Freshippo x membership stores, Freshippo mini stores and Freshippo outlet stores primarily target lower-tier markets. The former mainly serve consumers with lower incomes and are frequently located in urban periphery areas and towns. They benefit from lower investment, shorter return cycles, and higher floor efficiency for rapid expansion. The latter prioritize locations in towns with permanent residents over 40,000. These stores are often situated near grocery markets, commercial streets, old streets, community mall storefronts, or large community entrances.
Additionally, Freshippo neighborhood stores are predominantly located in outer suburban and urban periphery areas, complementing Freshippo fresh stores, Freshippo mini stores, Freshippo x membership stores, and other fresh retail formats in urban regions.
2.
Analysis of innovative spatial clustering characteristics of Freshippo stores
Based on field investigations and kernel density distributions, Freshippo stores exhibit diverse spatial clustering patterns and a complementary spatial distribution. Clustering differences among store types are influenced by consumer groups (income, age, online awareness) and factors like store rental prices [29,30], commercial environment [49], road traffic convenience [50], community distribution [51], and government administrative centers [52]. These differences align with the service positioning of the stores.
Meanwhile, compared to the clustering characteristics of traditional retail store locations, the site selection for new fresh retail store formats retains some features of traditional retail store locations but exhibits notable changes. For instance, the chain store locations of Freshippo no longer strictly adhere to traditional retail store location principles; instead, they place greater emphasis on the relationship between “consumers” and “consumer spaces”. By launching stores with different service type positioning, an optimized layout of fresh retail spaces is achieved.
Freshippo prioritizes a consumer-centric approach by leveraging big data analytics to understand customer behavior. Additionally, it implements a multi-point layout for a rapid end-to-end logistics network, providing customized logistics services for home consumers and thereby enhancing the shopping experience.

4. Influencing Factors Analysis

4.1. Indicator System Construction

Some researchers believe that factors such as the commercial environment, rental prices, and traffic accessibility greatly influence physical store locations [23,26,29,30,32,49,50,51]. However, to achieve a precise spatial distribution of retail locations in new retail formats, additional urban elements need to be considered [8]. Therefore, after excluding insignificant or weakly significant factors, 18 key urban factors were selected for quantitative analysis in this study (Table 3). Considering Shanghai’s highly urbanized characteristics and existing literature on spatial location divisions in the retail industry, the current spatial distribution of Freshippo stores was used to divide the research area into a grid of 1 km × 1 km cells using ArcGIS software. This study combines the advantages of qualitative and quantitative analysis by assigning data from multiple sources to the 9763 basic units.

4.2. Results of Influencing Factors Analysis

4.2.1. Source Data Statistical Analysis

Using radar charts, we compared the average, standard deviation, and coefficient of variation of 18 variables among different entities, including Freshippo fresh stores, Freshippo neighborhood stores, Freshippo x membership stores, Freshippo mini stores, and Freshippo outlet stores, to assess the numerical relationships between different object variables (Figure 8, Figure 9 and Figure 10).
Comparing the average values of the 18 grid variables between the stores and the overall city (Figure 8), the following observations were made:
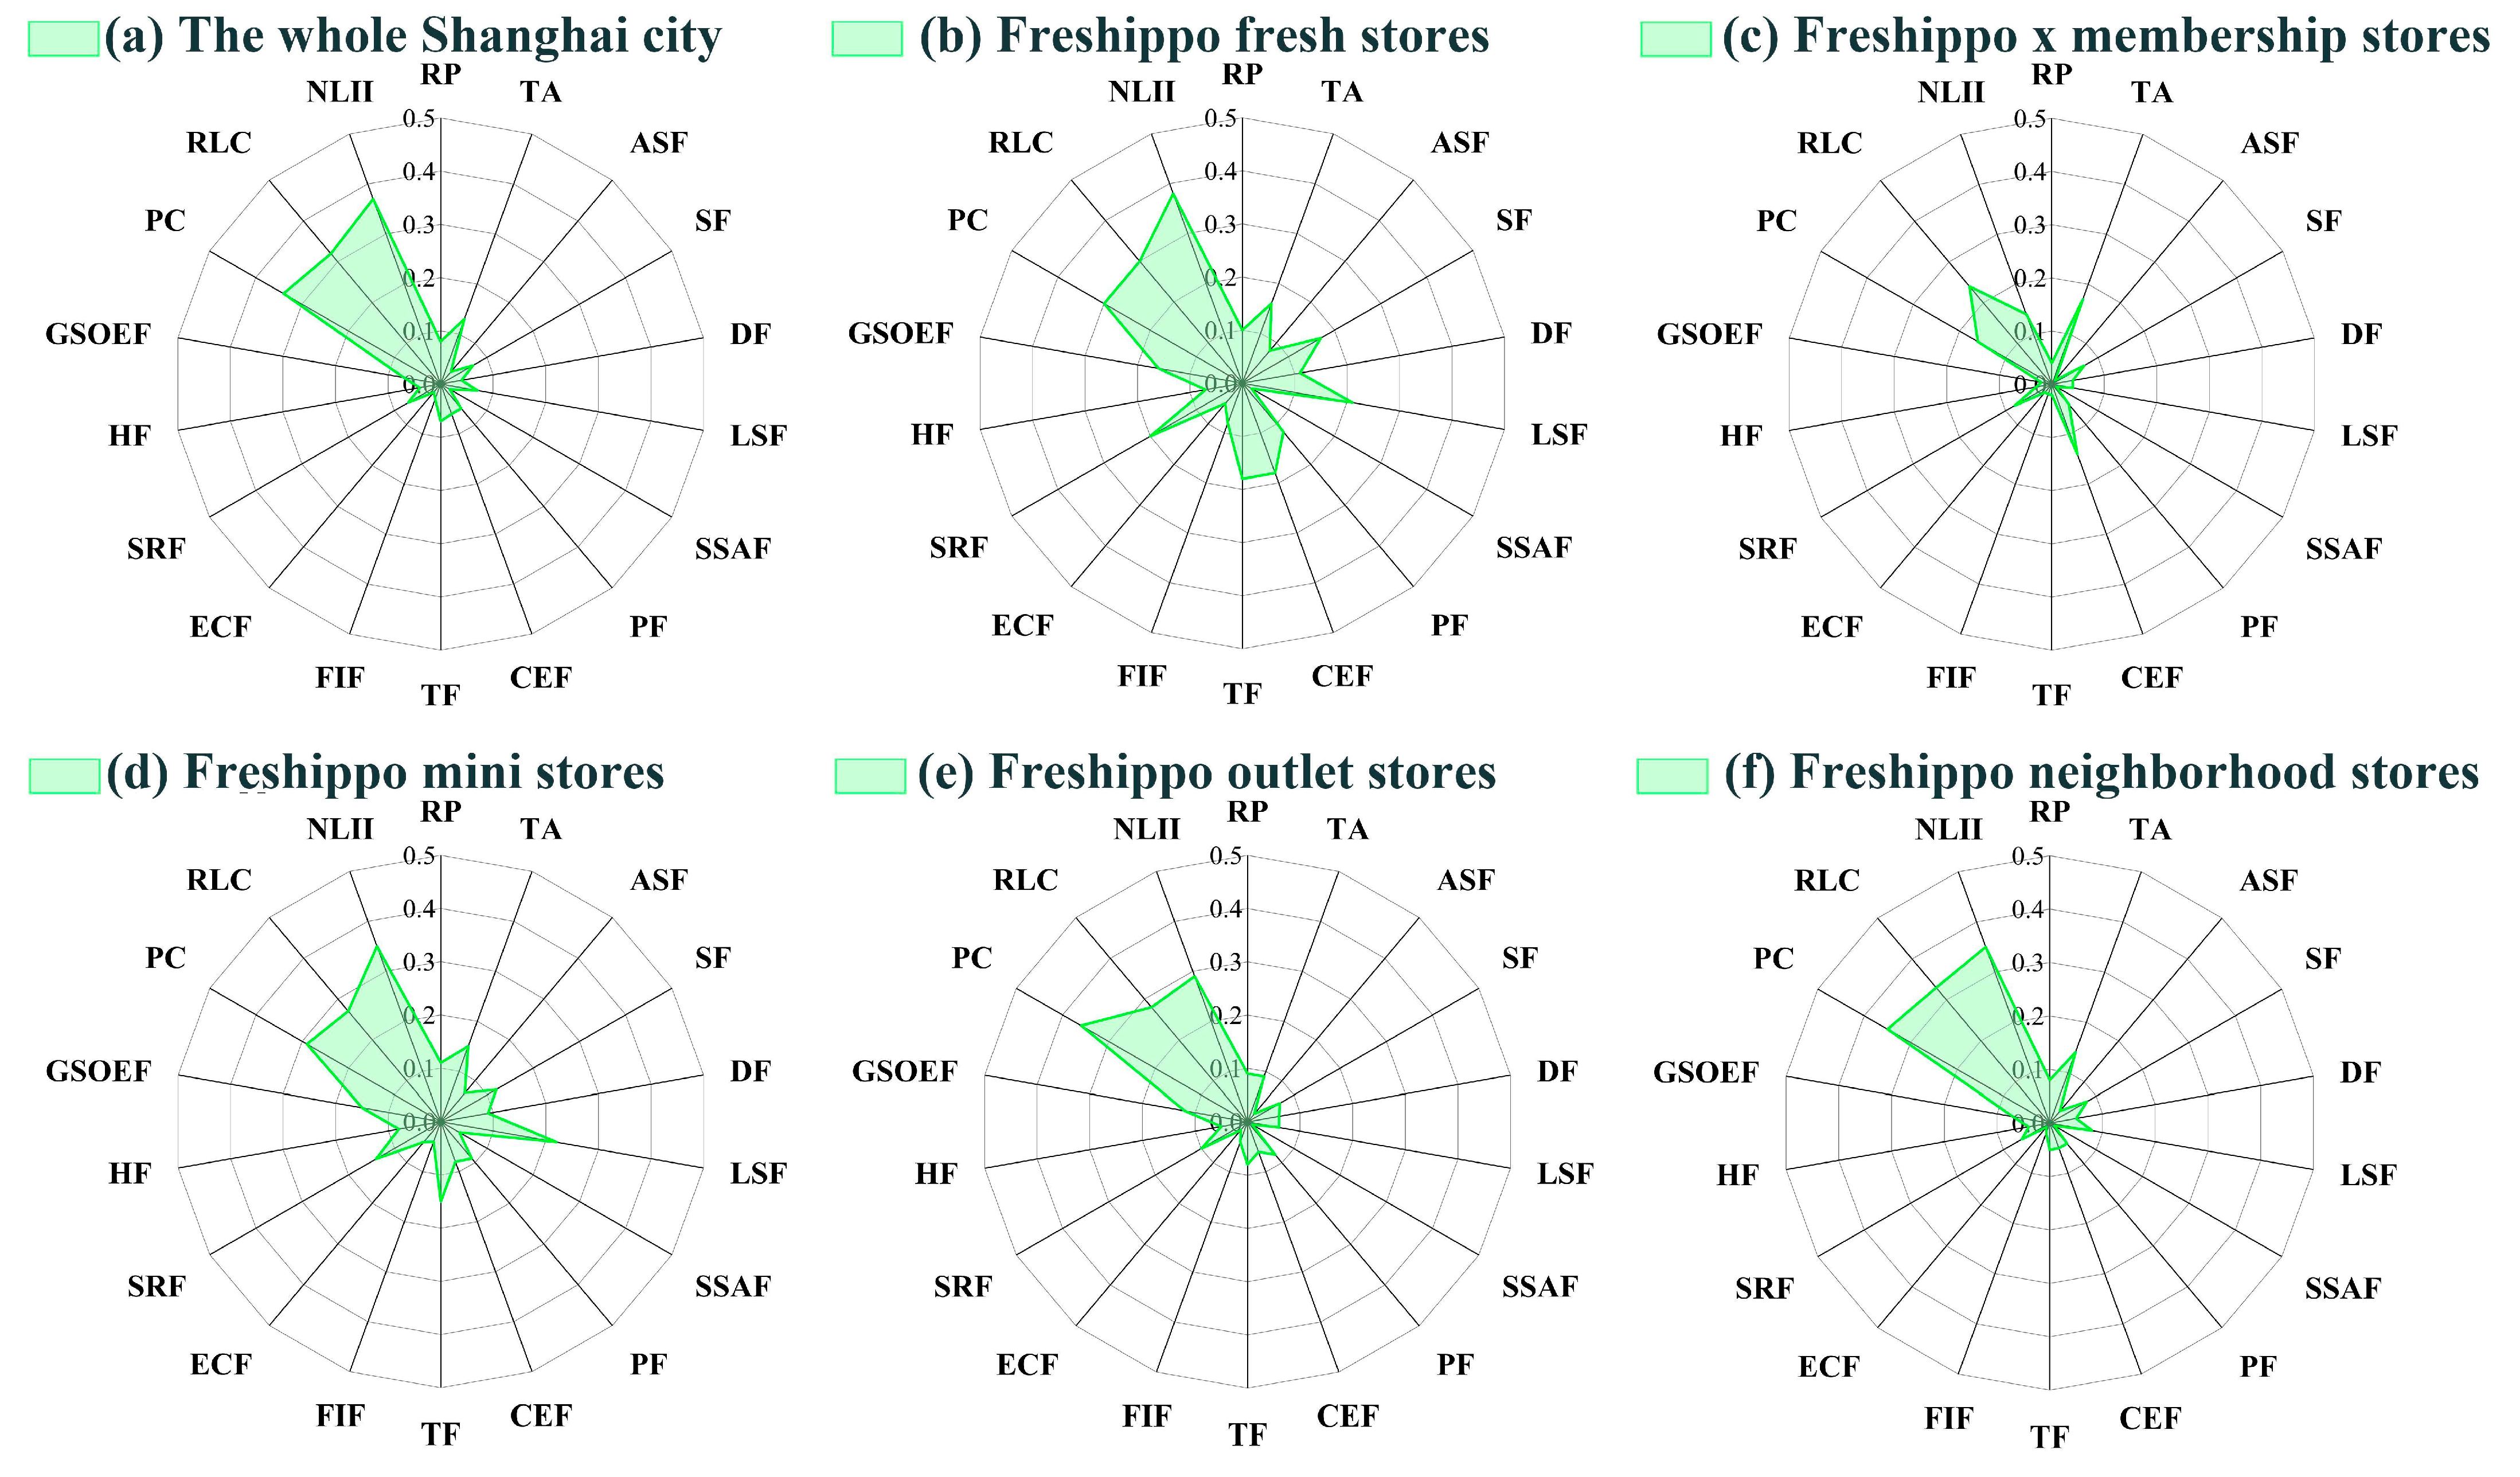
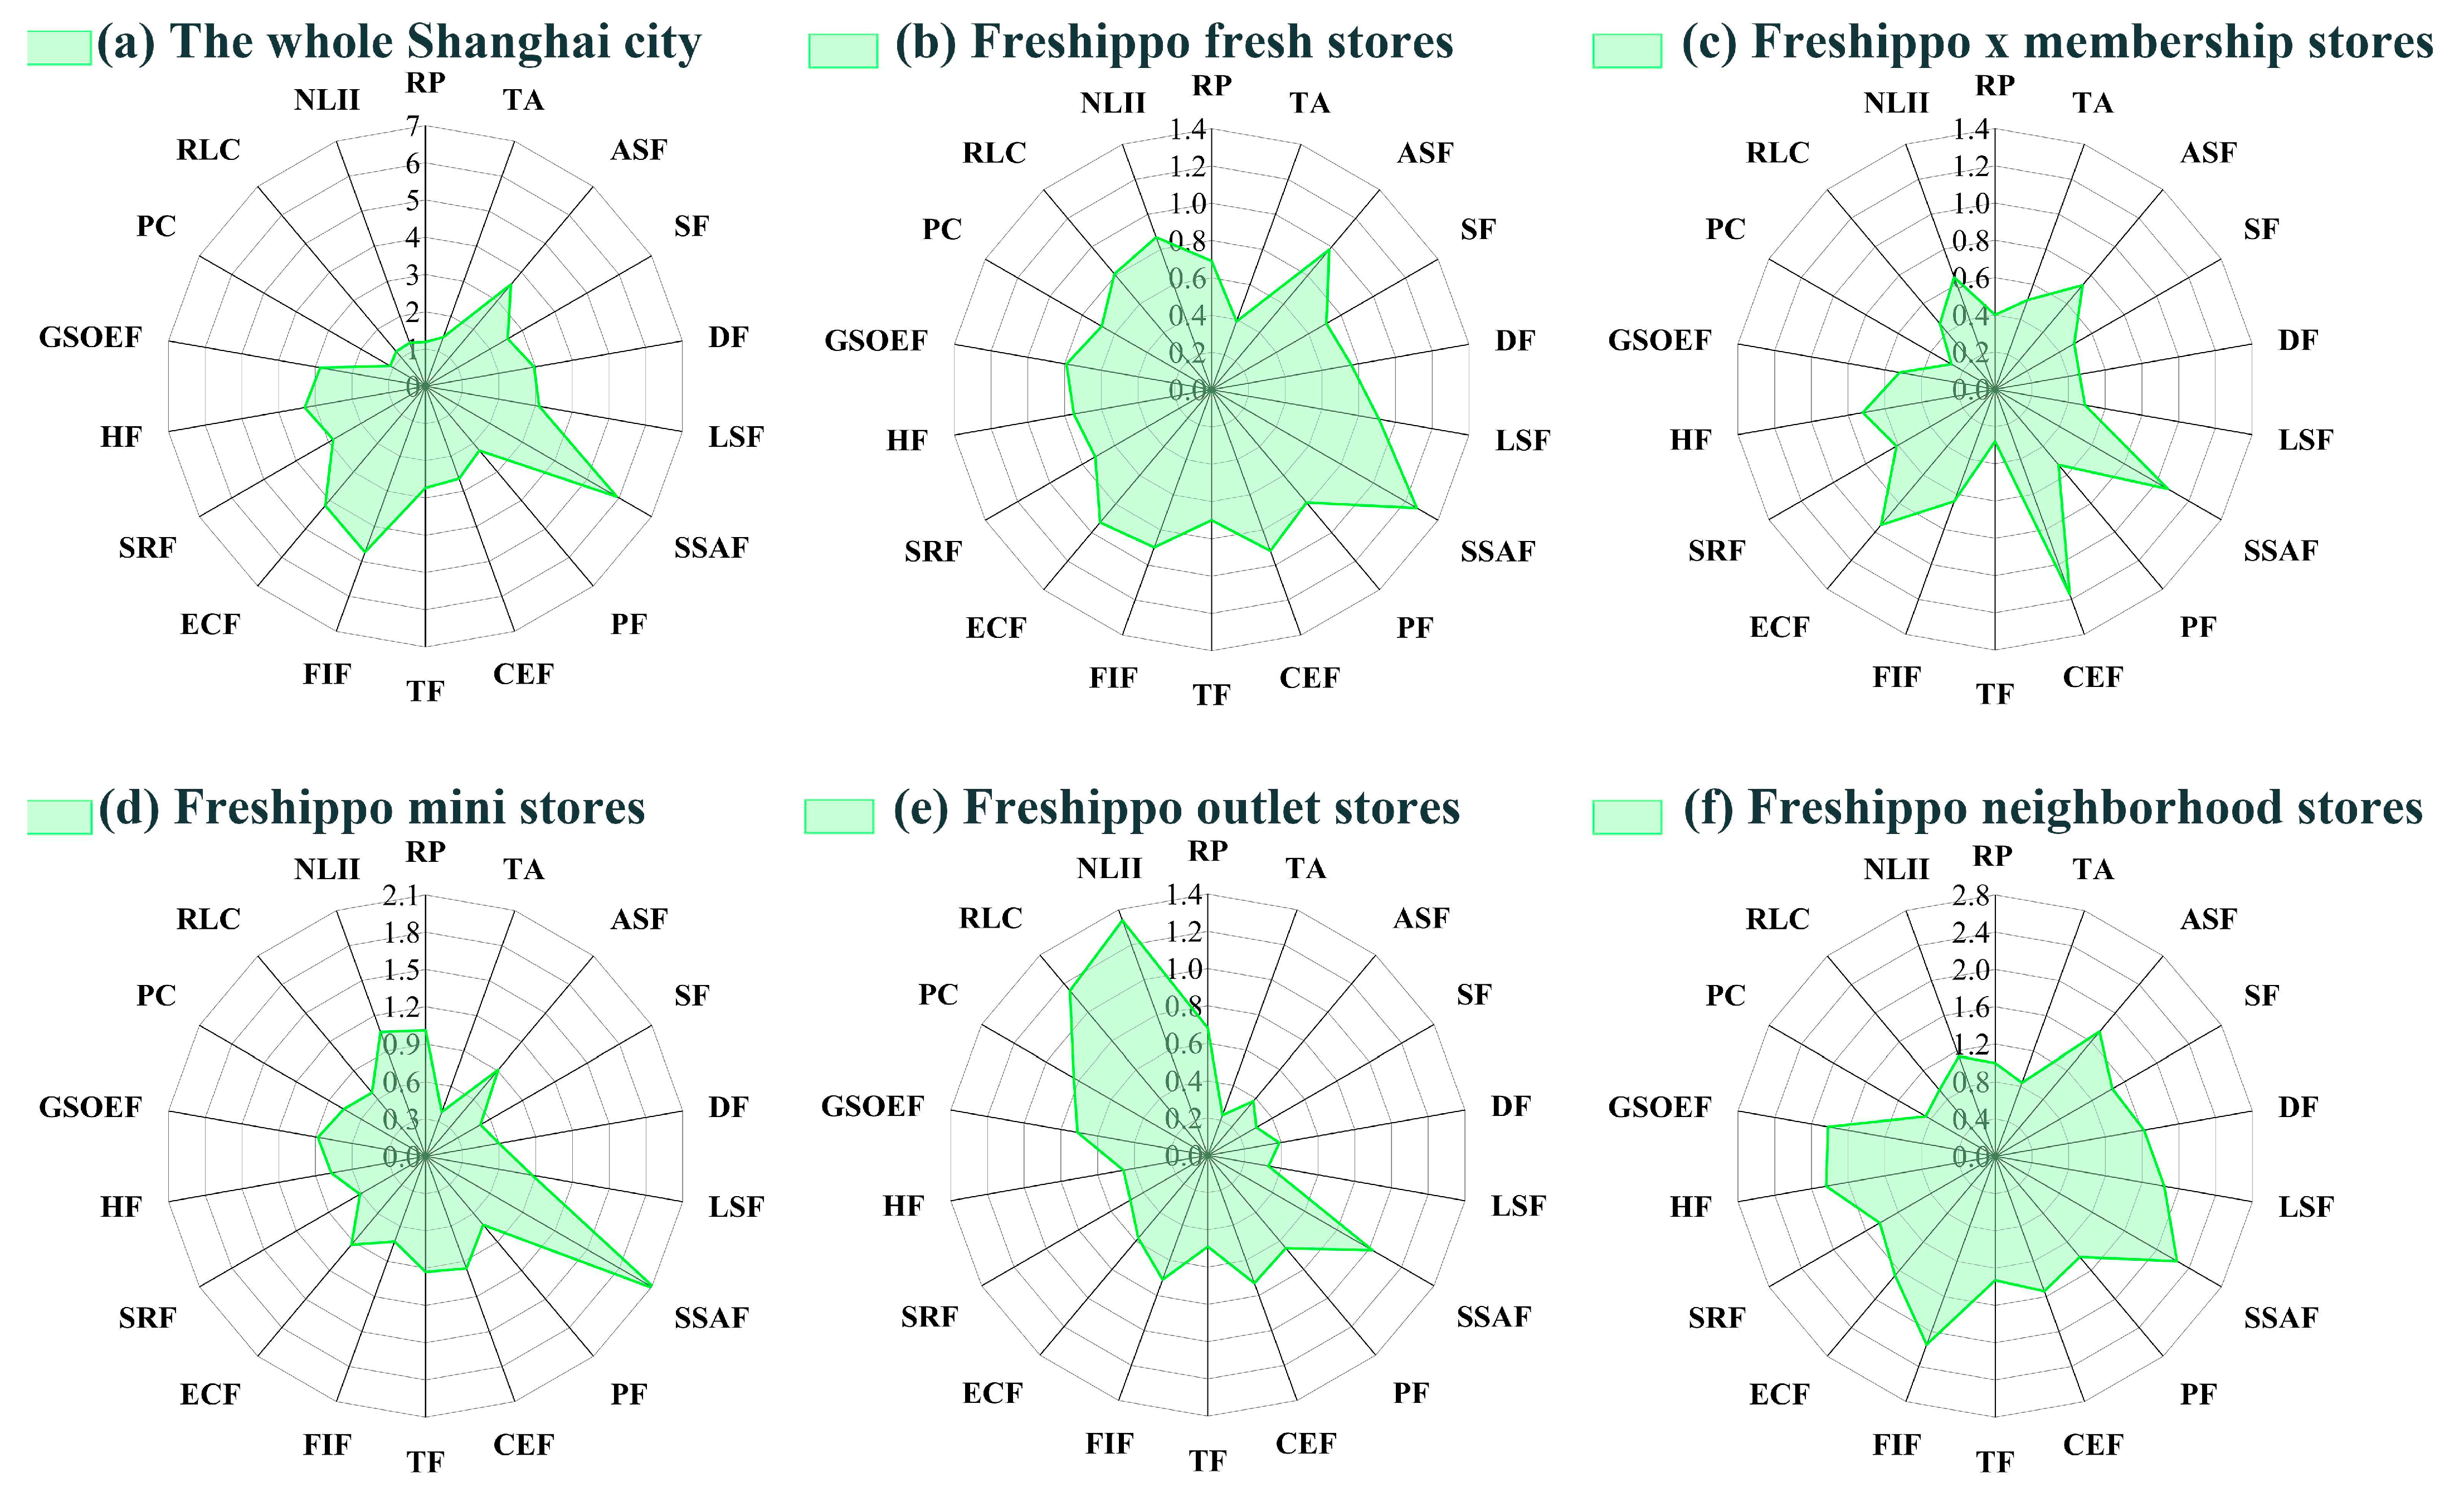
  • There is a significant variation in the radar charts of the average values between the overall city and the five types of stores. Except for residential land count (RLC) and nighttime light intensity index (NLII), the average values of 16 variables in the areas with all types of stores are higher than the overall city average level;
  • There are also notable differences in the average values of the 18 variables among the grids where different types of stores are located. Specifically, the average values of 12 variables in the grids of Freshippo fresh stores are higher than those in other store types, while the average values of 14 variables in the grids of Freshippo neighborhood stores are lower than those in other store types. Population count (PC), residential land count (RLC), nighttime light intensity index (NLII), and transport accessibility (TA) are prominent in various radar charts. Based on the comprehensive comparison results, the store locations for all types tend to be above the urban average level and are biased toward areas with higher human activities, production, and travel densities.
Due to the inconsistency in dimensions, the common characteristics of the standard deviation radar charts and the differences in the numerical dispersion of the individual radar charts were summarized (Figure 9). Among the six radar charts, variables with significant fluctuations in the standard deviation data of the 18 variables are primarily population count (PC), residential land count (RLC), and nighttime light intensity index (NLII). Additionally, the stability of the numerical dispersion of other types of factors in the individual radar charts of each store’s grid is relatively weak, exhibiting varying degrees of fluctuations, such as transportation facilities (TFs) in Figure 9b, transportation accessibility (TA) in Figure 9d, and lifestyle service facilities (LSFs) in Figure 9d.
These radar charts of coefficients eliminate the drawback of inconsistent dimensions. By comparing the area and axis lengths on the radar charts (Figure 10), the following observations were made:
  • Significant differences exist between variables. The same variable shows considerable differences in length or area size among different radar charts, indicating substantial variations in different datasets;
  • Certain similarities are also observed. By examining the trend in the length or area size of the same variable across different radar charts, consistent patterns of variability become apparent. These consistent lengths or area sizes suggest similar variation trends across different datasets or time points;
  • Group comparisons reveal both commonalities and distinctions. Variables with similar lengths or area sizes in different radar charts were grouped together. The clustering patterns and correlations between these groups exhibit unique as well as shared characteristics.
In summary, comparing the average, standard deviation, and coefficient of variation of different objects through radar charts reveals significant differences among store types. However, store locations overall tend to be higher than the urban average level and are concentrated in areas with high population activity density.

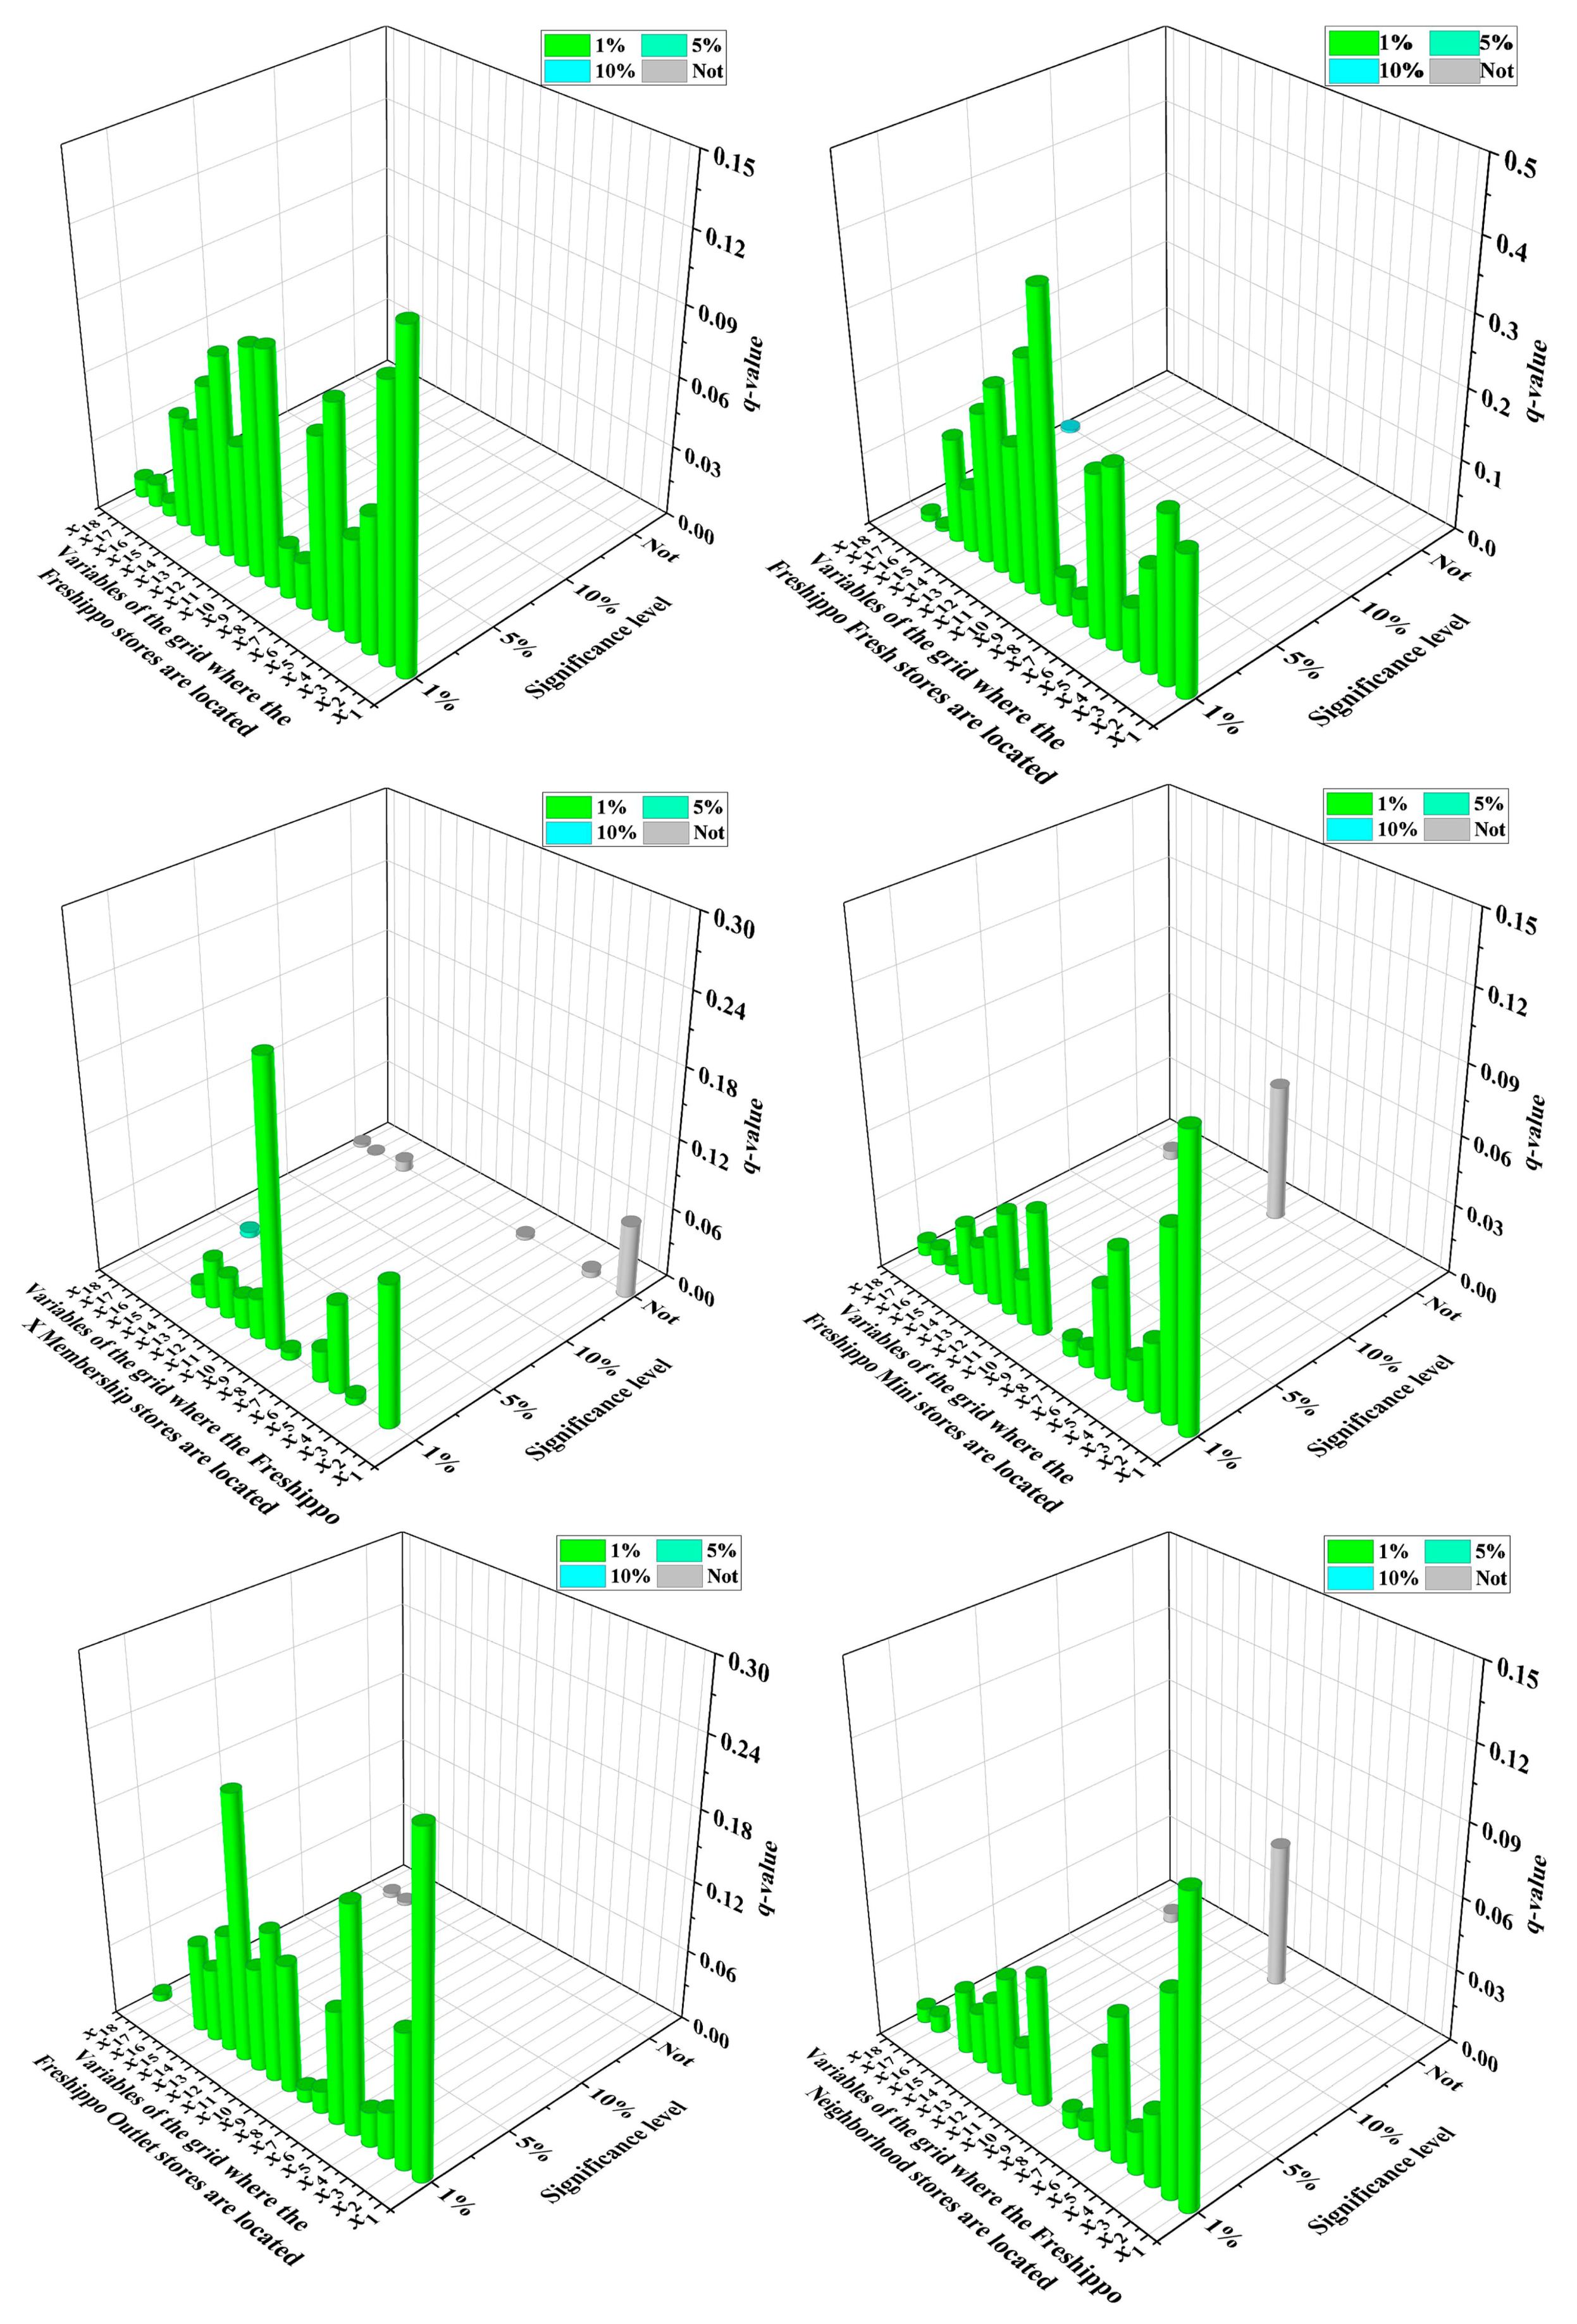
4.2.2. Comparison of Influencing Factors Driving Forces

After analyzing the numerical differences among various types, we further use the geographical detector to reveal the factors influencing store clustering and compare their significance and strength. First, the study uses the total number of stores within 1 km2 grids as the dependent variable and 18 factors as the independent variables, conducting both single-factor and interaction detections. Then, we use the number of each type of store as the dependent variable to identify the significant factors influencing the clustering of each store type.
According to the single-factor analysis (Figure 11), all 18 factors were statistically significant at the 1% level. For Freshippo fresh store aggregation, 17 factors were significant at the 1% level, and one factor was significant at the 10% level. For Freshippo x membership store aggregation, 11 factors were significant at the 1% level, with one factor showing significance at the 5% level. For Freshippo mini store aggregation, 16 factors were significant at the 1% level, with one factor showing significance at the 10% level. For Freshippo outlet store aggregation, 16 factors were significant at the 1% level. For Freshippo neighborhood store aggregation, 15 factors were significant at the 1% level, and one factor was significant at the 5% level (Figure 11). The results indicated the following:
  • Various factors had a significant impact on the overall store aggregation pattern of Freshippo stores;
  • The factors influencing different types of Freshippo store clustering showed the similarities and differences, with common factors mainly including x2, x4, x5, x6, x8, x10, x11, x12, x13, and x14, while factors such as x1, x3, x7, x9, x15, x16, x17, and x18 showed varying significance across different models.
Based on the single-factor detection, dual-factor interaction detection was conducted (Figure 12). After conducting statistical analysis on the dual-factor detection results, we found that the comprehensive interpretability of the simultaneous action of any two independent variables on the dependent variable revealed variations in the combinations of factors exhibiting the highest dual-factor driving force across different store types. Among them, for overall Freshippo stores (Figure 12a), the strongest dual-factor interaction is x1x2 (0.888), followed by x1x9 (0.790); for Freshippo fresh stores (Figure 12b), the strongest dual-factor interaction is x5x9 (0.980), followed by x1x9 (0.978); for Freshippo x membership stores (Figure 12c), the strongest dual-factor interaction is x2x5 (0.989), followed by x2x6 (0.983); for Freshippo mini and Freshippo outlet stores (Figure 12d,e), the strongest dual-factor interaction is x1x5 (0.997, 0.989), followed by x2x5 (0.969, 0.971); for Freshippo neighborhood stores (Figure 12f), the strongest dual-factor interaction is x1x2 (0.876), followed by x2x9 (0.767). Compared to single-factor effects, the q-values of dual-factor interactions are significantly increased to a certain degree. This result indicates the following:
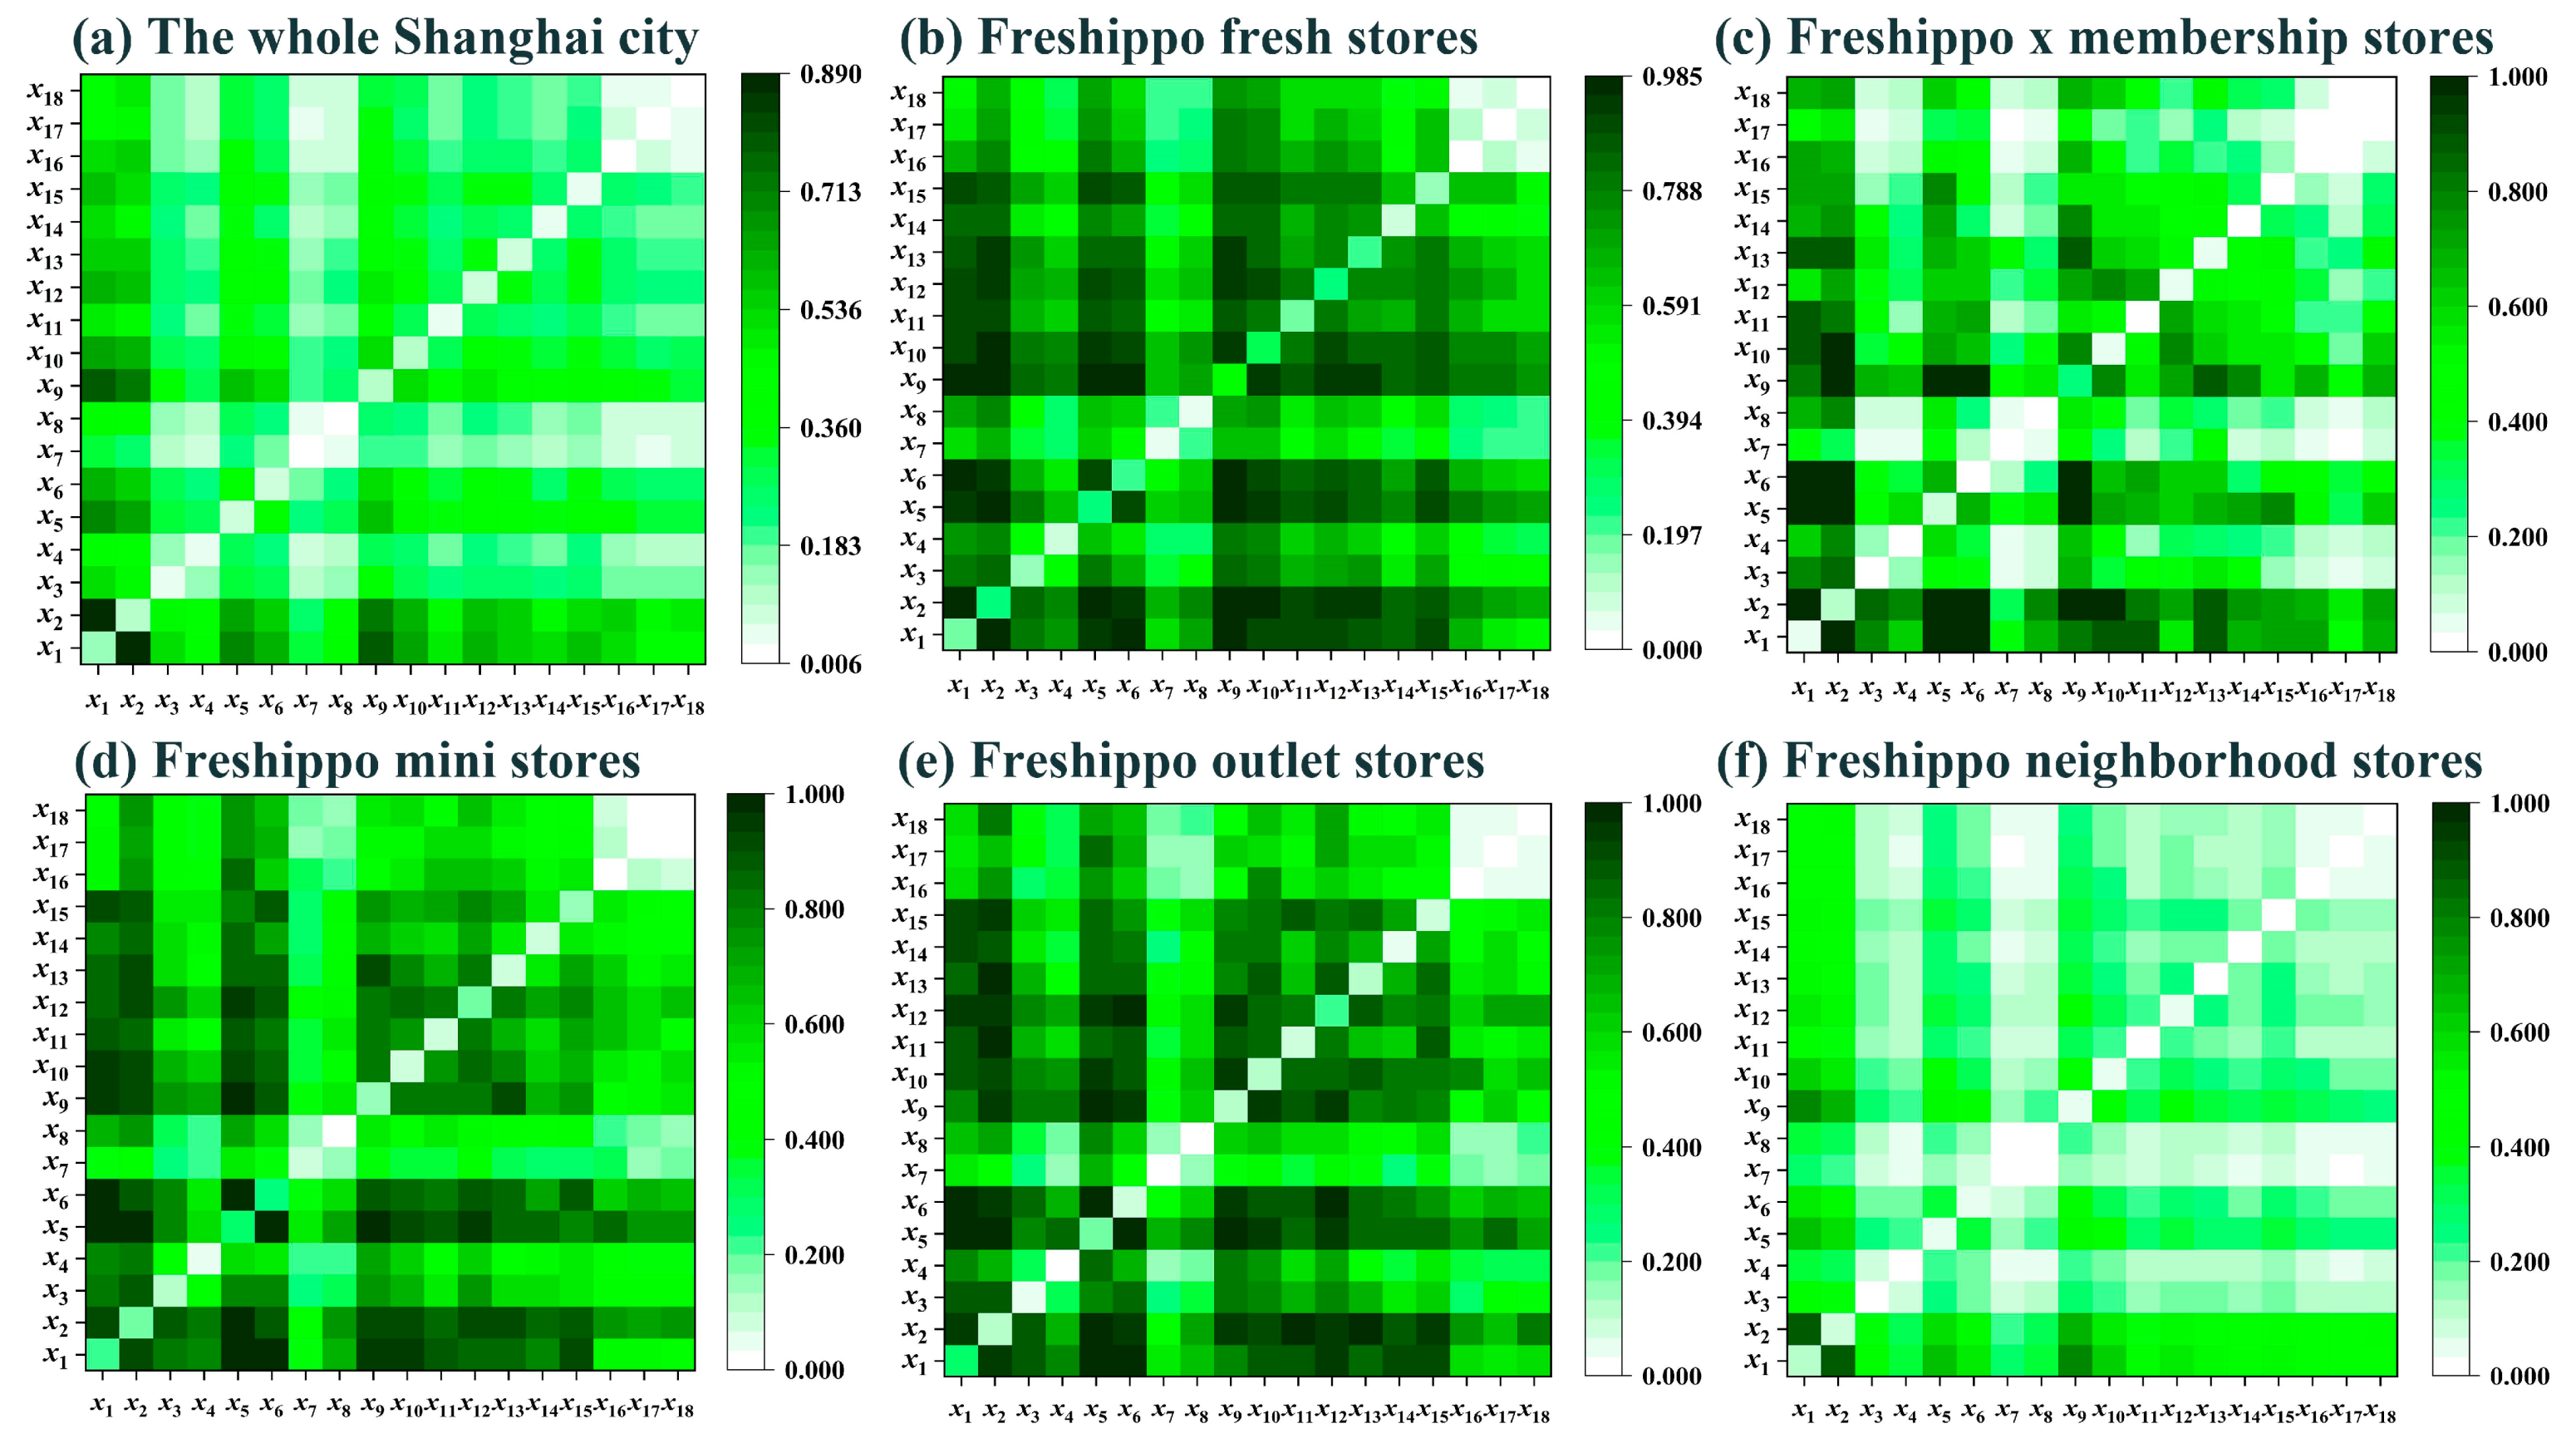
  • Influenced by multiple factors, the detection results of dual-factor interactions can better explain the impact of factors on the clustering characteristics, where rental costs (x1), transportation accessibility (x2), corporate enterprises (x9), dining facilities (x6), and lifestyle services (x5) play a significant role. Thus, with more diversity, new retail partly has the same factors with traditional retail in the site selection;
  • The interpretability of the clustering characteristics is enhanced after the detection of factors through interaction, indicating that the site selection of various types of stores is influenced by multiple factors in urban space, rather than solely focusing on or around commercial districts as the primary choice;
  • After the factor interactions, the interaction values are greater than the sum of the two-factor single effects and indicate a significant enhancement effect of dual-factor interaction, without weakening or independent action types.

5. Discussion

Numerous studies show that in the context of new retail, urban physical stores are no longer just limited to selling products. They also serve as centers for providing consumers with shopping experiences and services, creating commercial radiating effects in the physical retail space [27]. At the same time, online retail acts as a bridge linking supply and demand, offering personalized services and building a platform for multiple parties to participate, thereby facilitating interaction between suppliers and consumers in the virtual vertical space [1]. Furthermore, the new retail model tightly integrates urban physical space with digital virtual space, promoting the optimization of business center locations and the redistribution of commercial resources [6,53]. In April 2024, the Fuxi Institution, in collaboration with Tencent Smart Retail, released the “Study on the Comprehensive Digital Transformation Assessment Model”. This report shows that industrial digitalization is enhancing the interoperability between physical stores and online platforms, enriching the digital transformation processes within the retail industry. The integration of online and offline retail spaces has proven to be an effective strategy for promoting the digital transformation and sustainable development of the sector. In April 2024, the Fuxi Institution, in collaboration with Tencent Smart Retail, released the report titled “Comprehensive Digital Transformation Assessment Model” (https://file.retail.tencent.com, accessed on 21 May 2024). Building on these findings, we have developed a framework for discussing the application of the new retail model in urban spaces (Figure 13).
Unlike traditional retail practices that rely on city commercial centers, new retail enterprises are addressing long-standing market isolation issues [54]. Consequently, their stores are no longer limited to central urban areas; suburban and exurban markets have also become important locations [52,55]. Based on factors such as regional consumption levels, residential grades, population density, facility configurations, and business district environments, these companies allocate different types of stores to meet demand and supply various goods. Stores with delivery functions require better road traffic conditions to meet transportation needs and ensure efficient logistics distribution.
Various types of stores, through a layered spatial distribution in urban areas (Figure 5, Figure 6 and Figure 7), not only effectively avoid homogeneous competition but also facilitate interaction with different consumer groups, laying the groundwork for delivery services from physical stores with online sales capabilities. For Freshippo, the type of store placed in the urban central districts, urban periphery areas, and outer suburban districts depends on an analysis of consumer demographics. The choice of specific locations also relies on a comprehensive analysis of factors such as rental costs, population density, accessibility, public facilities, and the commercial environment (Figure 11 and Figure 12).
Moreover, traditional retail stores face challenges such as inflexible inventory management and opaque information. This often leads to some stores having inventory backlogs, while others may experience stockouts, making it difficult to meet consumer demand in a timely manner [9]. However, new retail companies collaborate along the supply chain by sharing inventory and order information among physical locations to efficiently complete delivery tasks. For example, merchandise at Freshippo outlet stores mostly comes from surplus inventory or near-expiration items from other types of Freshippo stores. These items are sold at discounted prices, reducing waste while creating more value. In 2023, the China Chain Store and Franchise Association released the “Market-End Near-Expiration Food Operation Status Report”, which indicated that the products in Freshippo outlet stores mainly come from excess stock and near-expiration items from Freshippo orders, but not from discontinued products (http://www.ccfa.org.cn, accessed on 21 May 2024). The “complementary” layout strategy of physical stores in new retail enterprises offers services and products tailored to local conditions and breaks the traditional site selection model, reducing the influence of business district effects.
The advancement of Internet technology in the retail industry has enabled new retail enterprises to establish a comprehensive service system that combines online platforms with physical stores. This system evolves service models such as online ordering, offline delivery, and traditional offline shopping, thereby expanding market space [9,56]. By leveraging logistics distribution functions, these platforms allocate orders to the nearest stores and optimize routes based on detailed traffic data analysis, effectively bridging the gap between virtual and physical sales chains. Moreover, online platforms can achieve precise inventory optimization through data analysis, reducing stockouts and unsold goods by dynamically reallocating inventory across regions. This improves turnover rates and maintains product freshness and timeliness [14,16]. For instance, Freshippo fresh stores and Freshippo x membership stores guarantee delivery within 30 min and 1 h, respectively, covering major urban high-end residential areas and business centers. These strategies ensure the freshness and quality of products, catering to middle- and high-end consumer groups. Freshippo neighborhood stores are designed to address the “last mile” challenge, offer convenient pickup times, and reduce operational costs. This online-driven sales model not only increases the efficiency of the retail industry but also bridges the gap between online shopping and physical stores in urban areas. Therefore, Freshippo’s new retail model can be considered a combination of various service methods such as “online ordering + logistics delivery” and “online ordering + self-pickup”.
Amid dynamic changes in urban–rural supply and demand patterns and increasingly diverse consumer needs, operators must actively adjust their strategies [57,58]. Companies aim for a larger market share by refining management systems, optimizing location selection, enhancing the industrial chain, and developing pricing strategies. Online platforms leverage e-commerce advantages by offering a wide range of products and inventory, using big data analysis and AI to predict and recommend personalized orders for consumers, which is key to attracting internet users. The profitability of traditional retail stores mainly depends on factors such as location rent, transportation costs, and consumer demographics. However, by implementing strategies such as big data location selection, cold chain transportation, logistics distribution, and brand building, companies can reduce operational costs and improve product circulation efficiency [31]. Additionally, opening physical stores remains crucial for enhancing consumer experience and loyalty. Therefore, this “complementary” clustering, integrating online platforms and physical stores, highlights an innovative strategy of China’s new retail sector in a complex market environment.
Although this study focuses on Freshippo stores as a typical representative of the new retail industry and explores in depth the clustering characteristics and influencing factors of different types of stores, there are still some limitations and unresolved issues that deserve attention in future research. Through the analysis of long-term tracking survey data and existing research findings, we have observed that China’s new retail industry is still in a rapid growth stage and has not yet fully matured. Therefore, we argue that the emergence of new retail formats is a result of innovation and redevelopment within the traditional retail industry. This perspective requires further confirmation through continued attention and tracking studies by additional scholars. Furthermore, our study specifically examines fresh food retail enterprises, and future research should also investigate other types of new retail enterprises to compare differences in location selection among various new retail stores. Such comparative results will provide deeper scientific guidance for the sustainable development of the retail industry.

6. Conclusions and Suggestions

6.1. Conclusions

Based on multi-source data from the Shanghai region and Freshippo store data from 2016 to 2022, this study integrates multidisciplinary perspectives and utilizes GIS, Origin 2022, and Excel 2021 software. Employing computer visualization techniques, geographic detectors, and Radar Chart analysis, it systematically investigates the clustering characteristics and the drivers and significance of the main influencing factors of different types of new retail stores. The conclusions are as follows:
  • Freshippo has entered the Shanghai fresh market, introducing a range of innovative store formats. The temporal analysis indicates significant variances in growth rates and expansion scales across these formats, with stores that combine “online + offline” sales functions showing a consistent annual increase. Moreover, the introduction of Freshippo neighborhood stores in 2022 has effectively filled the service gap between online and offline retail channels. Trends in store quantity initially rose, followed by a decrease in growth rates, with noticeable fluctuations in peak years and annual rates. Spatially, the characteristics of store distribution vary considerably among towns, highlighting the flexibility and adaptability of new retail companies in strategizing their market presence;
  • New retail offline stores exhibit multi-level differentiated clustering characteristics and demonstrate an urban “complementary” spatial distribution. Specifically, Freshippo fresh stores are highly clustered in the urban central districts, closely associated with commercial centers, political centers, and major residential activity centers. Freshippo x membership stores are located at the borders between the urban central districts and the suburbs, matching environments with high-end shopping malls and office concentrations, serving middle-class families. Freshippo mini stores avoid areas with concentrated county government offices, displaying multi-core clustering and strategic distribution patterns. Freshippo outlet stores are widely scattered across the urban central districts and densely populated towns. Additionally, the spatial clustering characteristics of Freshippo neighborhood stores and Freshippo fresh stores differ significantly, primarily distributed in urban periphery areas and outer suburban districts, in multiple communities in a multi-core, multi-point manner. By opening different types of stores tailored to local conditions, the company effectively meets market demands;
  • The GIS simulation results show that the service range of online orders from three types of Freshippo stores exhibits a “central clustering, multi-point distribution” spatial clustering characteristic, covering 88.02% of residential areas. Specifically, the logistics and delivery service range of Freshippo fresh stores and Freshippo x membership stores covers 67.87% and 82.31% of the urban areas, respectively. Meanwhile, Freshippo neighborhood stores primarily offer self-pickup services to residents within a 1 km radius in the suburbs, tailoring diverse and precise services to local conditions;
  • Multiple spatial factors significantly influence the site selection for new retail offline stores. Key factors include the densities of roads, shopping and restaurant facilities, lifestyle and public services, transportation, financial and insurance institutions, as well as scientific, educational, cultural, sports, leisure, and medical health facilities. However, the importance of other factors may vary according to different model results. Moreover, double-factor interaction detection reveals that the combined explanatory power of any two factors surpasses that of each factor individually, suggesting that store clustering is influenced by the synergistic effects of multiple factors. This interaction notably enhances the explanatory power of clustering analysis, revealing a distinct nonlinear enhancement relationship. This indicates that store clustering results from the complex interplay of multiple factors, with interactions playing a crucial role.

6.2. Suggestions

Based on the research findings in this article, we offer the following recommendations for retail managers and urban planners.
  • To enhance the accuracy of site selection decisions for different types of retail stores, enterprises can follow several steps using advanced technologies. First, use big data to analyze consumer behavior and preferences. By gathering and analyzing consumer shopping behavior, social media, traffic, and other data, enterprises can gain insights into demand and potential across various areas to identify the best locations for different types of stores. Second, apply quantitative models to analyze factors such as population density, traffic flow, and the competitive environment. Integrate the results of big data analysis with those from quantitative models to evaluate the commercial value of different areas and ensure scientific and rational site selection. Additionally, employ artificial intelligence and machine learning algorithms to build site selection decision models, predict potential store revenue and risks, and optimize site selection plans. Finally, employ intelligent logistics and supply chain management systems to evaluate and plan logistics routes and delivery costs, ensuring logistical accessibility and operational efficiency for new stores;
  • Develop an omnichannel layout that integrates online and offline channels to optimize the retail network. First, define the functions and positioning of different types of stores, such as fresh food supermarkets, membership-based high-end supermarkets, community convenience stores, discount stores, and community grocery stores. Ensure each type of store meets the needs of various consumer groups. Second, implement omnichannel integration to optimize resource allocation and efficiency through inventory and supply chain management, a unified membership system, and data sharing and analysis. Additionally, develop a robust online platform, establish a smart logistics system, and apply new technologies such as artificial intelligence, big data, and the Internet of Things to improve operational efficiency. Moreover, combining online promotions with offline experiences, offering diverse delivery methods, and implementing a unified customer service system can help increase consumer satisfaction and loyalty. Finally, continuously refine store layouts and supply chain management through data-driven decision-making, consumer feedback mechanisms, and market research and adjustments to enhance operational efficiency and customer experience, thereby achieving sustained development in a competitive market;
  • Optimize the management of urban commercial spaces to promote the sustainable development of the retail industry. First, urban planners should incorporate data-driven decision-making into their planning processes by thoroughly analyzing consumer behavior, population distribution, traffic flow, and the commercial environment to ensure the optimal allocation of commercial resources. Second, planners should consider a diversified spatial distribution of new retail formats, distributing various types of stores appropriately across different urban areas to meet diverse consumer needs. Third, enhance logistics infrastructure and delivery networks by integrating advanced technologies into warehouse operations, smart parking facilities, and other essential infrastructure to ensure the efficient operation of logistics systems. Additionally, encourage retail enterprises to adopt innovative technologies and focus on the flexible design of commercial spaces to enhance their adaptability and functionality. Finally, implement relevant policies and regulations to encourage the adoption of sustainable practices, adopt green technologies, minimize environmental impact, and improve the overall efficiency and service quality of commercial spaces, thereby supporting the continued growth and resilience of urban retail.

Author Contributions

Conceptualization, G.W. and E.Z.; methodology, E.Z. and Y.Z.; software, E.Z. and Y.Z.; validation, G.W., Y.Z., E.Z. and G.C.; formal analysis, E.Z. and Y.Z.; investigation, E.Z. and G.C.; resources, E.Z. and G.W.; data curation, E.Z. and G.C.; writing—original draft, E.Z.; writing—review and editing, G.W. and E.Z.; visualization, E.Z. and G.W.; supervision, G.W.; project administration, G.W.; funding acquisition, G.W. All authors have read and agreed to the published version of the manuscript.

Funding

This research was partly funded by the National Natural Science Foundation of China, grant number 51878516 (G.W) (name: “Research on the evolution and reconstruction of commercial centers in China’s metropolis under the ‘new retail’ environment”).

Institutional Review Board Statement

Not applicable.

Informed Consent Statement

Not applicable.

Data Availability Statement

The authors have no data to share.

Acknowledgments

The authors would like to thank the editors and reviewers for this manuscript.

Conflicts of Interest

The authors declare no known conflicts of interest.

References

  1. Thaichon, P.; Phau, I.; Weaven, S. Moving from multi-channel to Omni-channel retailing: Special issue introduction. J. Retail. Consum. Serv. 2022, 65, 102311. [Google Scholar] [CrossRef]
  2. Cheah, J.-H.; Lim, X.-J.; Ting, H.; Liu, Y.; Quach, S. Are privacy concerns still relevant? Revisiting consumer behaviour in omnichannel retailing. J. Retail. Consum. Serv. 2022, 65, 102242. [Google Scholar] [CrossRef]
  3. Zhou, L.; Wang, S.; Li, H. Store network expansion in the era of online consumption: Evidence from the Suning Appliance retail chain in China. Appl. Geogr. 2024, 165, 103225. [Google Scholar] [CrossRef]
  4. Fildes, R.; Kolassa, S.; Ma, S. Post-script-Retail forecasting: Research and practice. Int. J. Forecast. 2022, 38, 1319–1324. [Google Scholar] [CrossRef]
  5. Wang, Y.; Coe, N.M. Platform ecosystems and digital innovation in food retailing: Exploring the rise of Freshippo in China. Geoforum 2021, 126, 310–321. [Google Scholar] [CrossRef]
  6. Tang, P.; Chen, J.; Raghunathan, S. Physical Stores as Warehouses for Online Channels: Implications for Channel Choices Under Competition. Inf. Syst. Res. 2023, 34, 1554–1581. [Google Scholar] [CrossRef]
  7. Zhou, R.; Wang, C.; Bao, D.; Xu, X. Shopping Mall Site Selection Based on Consumer Behavior Changes in the New Retail Era. Land 2024, 13, 855. [Google Scholar] [CrossRef]
  8. Yao, Y.; Jing, Y. The Realization Logic of New Retail-driven Consumption Revolution Taking Hema’s Digital Practice as an Example. Issues Agric. Econ. 2024, 1–13. [Google Scholar] [CrossRef]
  9. Cai, Y.-J.; Lo, C.K.Y. Omni-channel management in the new retailing era: A systematic review and future research agenda. Int. J. Prod. Econ. 2020, 229, 107729. [Google Scholar] [CrossRef]
  10. Liu, X.; Tong, D.; Huang, J.; Zheng, W.; Kong, M.; Zhou, G. What matters in the e-commerce era? Modelling and mapping shop rents in Guangzhou, China. Land Use Pol. 2022, 123, 106430. [Google Scholar] [CrossRef]
  11. Helmi, A.; Komaladewi, R.; Sarasi, V.; Yolanda, L. Characterizing Young Consumer Online Shopping Style: Indonesian Evidence. Sustainability 2023, 15, 3988. [Google Scholar] [CrossRef]
  12. Wang, Y.; Ding, A.S.; Xu, C. The impact of paid social Q&A on panic buying and digital hoarding at the stage of coexistence with COVID-19: The moderating role of sensitivity to pain of payment. Int. J. Disaster Risk Reduct. 2023, 84, 103472. [Google Scholar] [CrossRef] [PubMed]
  13. Truong, D.; Truong, M.D. How do customers change their purchasing behaviors during the COVID-19 pandemic? J. Retail. Consum. Serv. 2022, 67, 102963. [Google Scholar] [CrossRef]
  14. Van Bavel, J.J.; Cichocka, A.; Capraro, V.; Sjåstad, H.; Nezlek, J.B.; Pavlović, T.; Alfano, M.; Gelfand, M.J.; Azevedo, F.; Birtel, M.; et al. National identity predicts public health support during a global pandemic. Nat. Commun. 2022, 13, 517. [Google Scholar] [CrossRef] [PubMed]
  15. Battisti, S.; Agarwal, N.; Brem, A. Creating new tech entrepreneurs with digital platforms: Meta-organizations for shared value in data-driven retail ecosystems. Technol. Forecast. Soc. Chang. 2022, 175, 121392. [Google Scholar] [CrossRef]
  16. Kamble, S.S.; Gunasekaran, A.; Parekh, H.; Joshi, S. Modeling the internet of things adoption barriers in food retail supply chains. J. Retail. Consum. Serv. 2019, 48, 154–168. [Google Scholar] [CrossRef]
  17. Lee, S.M.; Lee, D. “Untact”: A new customer service strategy in the digital age. Serv. Bus. 2020, 14, 1–22. [Google Scholar] [CrossRef]
  18. Kang, W.; Shao, B. The impact of voice assistants? intelligent attributes on consumer well-being: Findings from PLS-SEM and fsQCA. J. Retail. Consum. Serv. 2023, 70, 103130. [Google Scholar] [CrossRef]
  19. Jia, D.; Li, H. Spatial Distribution and Influencing Factors of New-Style Tea Chain Stores in China. World Regional Studies. 2024, 1–12. Available online: http://kns.cnki.net/kcms/detail/31.1626.P.20231027.1340.002.html (accessed on 27 October 2023).
  20. Lu, J.; Zheng, X.; Nervino, E.; Li, Y.; Xu, Z.; Xu, Y. Retail store location screening: A machine learning-based approach. J. Retail. Consum. Serv. 2024, 77, 103620. [Google Scholar] [CrossRef]
  21. Feizizadeh, B.; Omarzadeh, D.; Blaschke, T. Spatiotemporal mapping of urban trade and shopping patterns: A geospatial big data approach. Int. J. Appl. Earth Obs. Geoinf. 2024, 128, 103764. [Google Scholar] [CrossRef]
  22. Zhou, Y.; He, X.; Zikirya, B. Boba Shop, Coffee Shop, and Urban Vitality and Development-A Spatial Association and Temporal Analysis of Major Cities in China from the Standpoint of Nighttime Light. Remote Sens. 2023, 15, 903. [Google Scholar] [CrossRef]
  23. Hao, F.; Yang, Y.; Wang, S. Patterns of location and other determinants of retail stores in urban commercial districts in Changchun, China. Complexity 2021, 1–14. [Google Scholar] [CrossRef]
  24. Wang, H.-M.D.; Ho, F.N. The Effects of Information Technology in Retailer Performance and Survival: The Case of Store-Based Retailers. SAGE Open 2023, 13, 21582440231215641. [Google Scholar] [CrossRef]
  25. De Beule, M.; Van Den Poel, D.; Van De Weghe, N. An extended Huff-model for robustly benchmarking and predicting retail network performance. Appl. Geogr. 2014, 46, 80–89. [Google Scholar] [CrossRef]
  26. Crönert, T.; Martin, L.; Minner, S.; Tang, C.S. Inverse optimization of integer programming games for parameter estimation arising from competitive retail location selection. Eur. J. Oper. Res. 2024, 312, 938–953. [Google Scholar] [CrossRef]
  27. Lin, P.-C.; Cheng, T.C.E.; Hsu, C.-H. Retail location modeling of supermarket chains in Taipei city. Appl. Geogr. 2023, 161, 103126. [Google Scholar] [CrossRef]
  28. Hou, C.; Lu, M. Allocating Inventory Risk in Retail Supply Chains: Risk Aversion, Information Asymmetry, and Outside Opportunity. M&SOM-Manuf. Serv. Oper. Manag. 2024, 26, 1189–1585. [Google Scholar] [CrossRef]
  29. Dolega, L.; Lord, A. Exploring the geography of retail success and decline: A case study of the Liverpool City Region. Cities 2020, 96, 102456. [Google Scholar] [CrossRef]
  30. Moussawi-Haidar, L.; Çömez-Dolgan, N. Percentage rent contracts between co-stores. Eur. J. Oper. Res. 2017, 258, 912–925. [Google Scholar] [CrossRef]
  31. Buldeo Rai, H.; Dablanc, L. Hunting for treasure: A systematic literature review on urban logistics and e-commerce data. Transp. Rev. 2023, 43, 204–233. [Google Scholar] [CrossRef]
  32. Xu, L.; Li, F.; Huang, K.; Ning, J. A Two-Layer Location Choice Model Reveals What’s New in the “New Retail”. Ann. Am. Assoc. Geogr. 2023, 113, 635–657. [Google Scholar] [CrossRef]
  33. Xue, X.; Gao, J.; Wu, S.; Wang, S.; Feng, Z. Value-Based Analysis Framework of Crossover Service: A Case Study of New Retail in China. IEEE Trans. Serv. Comput. 2022, 15, 83–96. [Google Scholar] [CrossRef]
  34. Guo, C.; Guo, W. Perspective of Hema Vilages from the Space of Flows:A Developmental Reconstruction of Modernization of Agriculture and Rural Areas Driven by Digital Agricultural Economy. Issues Agric. Econ. 2023, 1, 88–107. [Google Scholar] [CrossRef]
  35. Peng, X.; Wang, G.; Chen, G. Spatial Distribution of Freshippo Villages under the Digitalization of New Retail in China. Sustainability 2023, 15, 3292. [Google Scholar] [CrossRef]
  36. Yao, Y.; Jing, Y. The Path Practice of Connecting Smallholders with Large Market under the Background of New Retail—Take “Hema Village” for Example. J. China Agric. Univ. (Soc. Sci.) 2024, 41, 1–22. [Google Scholar] [CrossRef]
  37. Guo, C.; Guo, W. Research on the Economic Mode of Hema Villages under the New Retail in China. Issues Agric. Econ. 2020, 7, 14–24. [Google Scholar] [CrossRef]
  38. Wu, Y.; Wei, Y.D.; Li, H.; Liu, M. Amenity, firm agglomeration, and local creativity of producer services in Shanghai. Cities 2022, 120, 103421. [Google Scholar] [CrossRef]
  39. Chen, Y.; Chen, G.; Liu, Y.; Dong, G.-H.; Yang, B.-Y.; Li, S.; Huang, H.; Jin, Z.; Guo, Y. Exposure to greenness during pregnancy and the first three years after birth and autism spectrum disorder: A matched case-control study in shanghai, China. Environl. Pollut. 2024, 340, 122677. [Google Scholar] [CrossRef]
  40. Zheng, C.; Feng, Z.; Pearce, J. A longitudinal analysis of the impact of the local tobacco retail availability and neighbourhood deprivation on male smoking behaviours in Shanghai, China. Health Place 2024, 85, 103171. [Google Scholar] [CrossRef]
  41. Li, H.; Justin, S. COVID-19 and Urban Futures: Impacts on Business Closures in Miami-Dade County. Am. Assoc. Geogr. 2023, 113, 834–856. [Google Scholar] [CrossRef]
  42. Zhang, E.; Wang, Z.; Chen, G.; Wang, G.; Zhou, Y.; Hu, P.; Zhao, H. Spatial-Temporal Evolution Patterns and Influencing Factors of Hotels in Yellow River Basin from 2012 to 2022. Land 2023, 12, 770. [Google Scholar] [CrossRef]
  43. Wang, T.; Ma, Y.; Luo, S. Spatiotemporal Evolution and Influencing Factors of Soybean Production in Heilongjiang Province, China. Land 2023, 12, 2090. [Google Scholar] [CrossRef]
  44. Gonzalez-Iglesias, V.; Martinez-Perez, I.; Rodriguez Suarez, V.; Fernandez-Somoano, A. Spatial distribution of hospital admissions for asthma in the central area of Asturias, Northern Spain. BMC Public Health 2023, 23, 787. [Google Scholar] [CrossRef] [PubMed]
  45. Dy, B.; Ibrahim, N.; Poorthuis, A.; Joyce, S. Improving Visualization Design for Effective Multi-Objective Decision Making. IEEE Trans. Vis. Comput. Graph. 2022, 28, 3405–3416. [Google Scholar] [CrossRef]
  46. Wang, Q.; Yao, S.; Tao, J.; Xu, Y.; Yan, H.; Zhang, H.; Yang, S.; Fan, F. Air pollution characteristics, health risks, and typical pollution processes in autumn and winter in a central city of China. Air Qual. Atmos. Health 2023, 16, 1777–1787. [Google Scholar] [CrossRef]
  47. Liu, Y.; Wang, K.; Xing, X.; Guo, H.; Zhang, W.; Luo, Q.; Gao, S.; Huang, Z.; Li, H.; Li, X.; et al. On spatial effects in geographical analysis. Acta Geogr. Sin. 2023, 78, 517–531. [Google Scholar] [CrossRef]
  48. Wang, J.; Xu, C. Geodetector: Principle and prospective. Acta Geogr. Sin. 2016, 72, 116–134. [Google Scholar] [CrossRef]
  49. Palmie, M.; Miehe, L.; Oghazi, P.; Parida, V.; Wincent, J. The evolution of the digital service ecosystem and digital business model innovation in retail: The emergence of meta-ecosystems and the value of physical interactions. Technol. Forecast. Soc. Chang. 2022, 177, 121496. [Google Scholar] [CrossRef]
  50. Kim, W.; Wang, X. To be online or in-store: Analysis of retail, grocery, and food shopping in New York city. Transp. Res. Pt. C-Emerg. Technol. 2022, 126, 103052. [Google Scholar] [CrossRef]
  51. Roggeveen, A.L.; Grewal, D.; Schweiger, E.B. The DAST Framework for Retail Atmospherics: The Impact of In- and Out-of-Store Retail Journey Touchpoints on the Customer Experience. J. Retail. 2020, 96, 128–137. [Google Scholar] [CrossRef]
  52. O’Driscoll, C.; Crowley, F.; Doran, J.; McCarthy, N. Retail sprawl and CO2 emissions: Retail centres in Irish cities. J. Transp. Geogr. 2022, 102, 103376. [Google Scholar] [CrossRef]
  53. Alexander, D.; Karger, E. Do Stay-at-Home Orders Cause People to Stay at Home? Effects of Stay-at-Home Orders on Consumer Behavior. Rev. Econ. Stat. 2023, 105, 1017–1027. [Google Scholar] [CrossRef]
  54. Ballantyne, P.; Singleton, A.; Dolega, L.; Macdonald, J. Integrating the Who, What, and Where of U.S. Retail Center Geographies. Ann. Am. Assoc. Geogr. 2023, 113, 488–510. [Google Scholar] [CrossRef]
  55. Zhu, Y.; Wang, D. Growing threat to urban retail? Residential suburbanization and shopping behavior change in Shanghai, China. Cities 2022, 131, 104029. [Google Scholar] [CrossRef]
  56. Li, N.; Wang, Z. Inventory Control for Omnichannel Retailing Between One Warehouse and Multiple Stores. IEEE Trans. Eng. Manage. 2023, 71, 1–18. [Google Scholar] [CrossRef]
  57. Qiu, Z.; Liu, J.; He, J. Structural Characteristics and Driving Factors of the Commercial Circulation Network in China. China Bus. Mark. 2023, 37, 31–42. [Google Scholar] [CrossRef]
  58. Saxena, N.; Sarkar, B. How does the retailing industry decide the best replenishment strategy by utilizing technological support through blockchain? J. Retail. Consum. Serv. 2023, 71, 103151. [Google Scholar] [CrossRef]
Figure 1. Study area map.
Sustainability 16 06643 g001
Figure 2. Attribute differences of different types of Freshippo stores.
Sustainability 16 06643 g002
Figure 3. Number of various types of Freshippo stores.
Sustainability 16 06643 g003
Figure 4. Differential comparison of the number of Freshippo stores in different districts. Note: for the purpose of visualizing the variation in the number of stores, Freshippo neighborhood stores with larger quantities and other types of stores are visualized separately.
Sustainability 16 06643 g004
Figure 5. Distribution of Freshippo stores clusters and outlier regions.
Sustainability 16 06643 g005
Figure 6. Spatial distribution of kernel density for different types of Freshippo stores.
Sustainability 16 06643 g006
Figure 7. Clustering characteristics of Freshippo sales end logistics distribution service range.
Sustainability 16 06643 g007
Figure 8. Radar chart of average values of relevant factors.
Sustainability 16 06643 g008
Figure 9. Radar chart of standard deviations of relevant factors.
Sustainability 16 06643 g009
Figure 10. Radar chart of coefficients of variation of relevant factors.
Sustainability 16 06643 g010
Figure 11. Single-factor detection results of different types of Freshippo stores.
Sustainability 16 06643 g011
Figure 12. Two-factor interaction detection results of different types of Freshippo stores.
Sustainability 16 06643 g012
Figure 13. Application of new retail models in urban spaces.
Sustainability 16 06643 g013
Table 1. Statistical count of geographical units showing clustering of Freshippo stores in local areas.
Store TypeNumber of Geographical Units in Aggregated State
“High–High”
Aggregation
“Low–Low”
Aggregation
“Low–High”
Aggregation
“High–Low”
Aggregation
Freshippo fresh store290571
Freshippo x membership store05102
Freshippo mini store02123
Freshippo outlet store0363
Freshippo neighborhood store199756
Table 2. Distribution space coverage and residential community coverage.
TypeUrban Space CoverageResidential Community Quantity Coverage
Freshippo fresh store13.23%67.87%
Freshippo x membership store28.48%82.31%
Freshippo neighborhood store4.27%7.01%
Service range union31.92%88.02%
Table 3. Indicator variables and descriptions.
Variable NameAbbreviationNumberExplanationUnit
Rent priceRPx1Average daily rent per square meter of street-facing and underground shops within the gridYuan/day/m2
Transport accessibilityTAx2Road density per unit area within the gridYuan/day/m2
Accommodation service facilitiesASFsx3Density of accommodation service facilities per unit area within the gridNumber/km2
Shopping facilitiesSFsx4Density of shopping facilities per unit area within the gridNumber/km2
Dining facilitiesDFsx5Density of dining facilities per unit area within the gridNumber/km2
Lifestyle service facilitiesLSFsx6Density of lifestyle service facilities per unit area within the gridNumber/km2
Scenic spots and attractions facilitiesSSAFsx7Density of scenic spots and attractions per unit area within the gridNumber/km2
Public facilitiesPFsx8Density of public facilities per unit area within the gridNumber/km2
Companies and enterprises facilitiesCEFsx9Density of companies and enterprises per unit area within the gridNumber/km2
Transportation facilitiesTFsx10Density of transportation facilities per unit area within the gridNumber/km2
Financial and insurance facilitiesFIFsx11Density of financial and insurance organizations per unit area within the gridNumber/km2
Educational and cultural facilitiesECFsx12Density of educational and cultural facilities per unit area within the gridNumber/km2
Sports and recreational facilitiesSRFsx13Density of sports and recreational facilities per unit area within the gridNumber/km2
Healthcare facilitiesHFsx14Density of healthcare facilities per unit area within the gridNumber/km2
Government agencies and social organizations facilitiesGSOEFsx15Density of government agencies and social organizations per unit area within the gridNumber/km2
Population countPCx16Density of permanent residents per unit area within the gridTen thousand people/km2
Residential land countRLCx17Density of residential land per unit area within the grid/km2
Nighttime light intensity indexNLIIx18Nighttime light remote sensing value per unit area within the grid/km2
Disclaimer/Publisher’s Note: The statements, opinions and data contained in all publications are solely those of the individual author(s) and contributor(s) and not of MDPI and/or the editor(s). MDPI and/or the editor(s) disclaim responsibility for any injury to people or property resulting from any ideas, methods, instructions or products referred to in the content.

