Article

A Dispatch Strategy for the Analysis of the Technical, Economic, and Environmental Performance of a Hybrid Renewable Energy System

by
Mehmet Ali Köprü
1,*,
Dursun Öztürk
2 and
Burak Yıldırım
1
1
Vocational School of Technical Sciences, Bingöl University, Bingöl 12100, Türkiye
2
Department of Electrical-Electronics Engineering, Faculty of Engineering and Architecture, Bingöl University, Bingöl 12100, Türkiye
*
Author to whom correspondence should be addressed.
Sustainability 2024, 16(17), 7490; https://doi.org/10.3390/su16177490
Submission received: 5 August 2024 / Revised: 26 August 2024 / Accepted: 28 August 2024 / Published: 29 August 2024

Abstract

:
The use of renewable energy sources (RESs) is increasing every day to meet increasing energy demands and reduce dependence on fossil fuels. When designing hybrid renewable energy systems (HRESs), it is necessary to examine their technical, economic, and environmental feasibility. In this study, a new strategy is proposed using the HOMER Matlab Link (ML) connection for an HRES model consisting of a photovoltaic (PV) system, a wind turbine (WT), a biogas generator (BGG), and a battery storage system (BSS) designed to meet the electrical energy needs of Doğanevler village located in the rural area of Bingöl province. The data obtained as a result of the proposed strategy (PS) are compared with HOMER’s loop charging (CC) and load following (LF) optimization results. According to the PS, the optimum capacity values for the HRES components are 10 kW for WT, 10 kW for PV, 8 kW for BGG, 12 kWh for BSS, and 12 kW for the converter. According to the optimum design, 16,205 kWh of the annual energy produced was generated by PV systems, 22,927 kWh by WTs, and 22,817 kWh by BGGs. This strategy’s NPC and LCOE (Levelized Cost of Energy) values are calculated as USD 130,673.91 and USD 0.207/kWh, respectively. For the CC dispatch strategy, the NPC and LCOE values are calculated as USD 141,892.28 and USD 0.240/kWh, while for the LF dispatch strategy, these values are USD 152,456.89 and USD 0.257/kWh. The CO2 emission value for the system using a BGG was calculated as 480 kg/year, while for the system using a DG, this value increased approximately 57 times and was calculated to be 27,709 kg/year. The results show that the PS is more economical than the other two strategies. The PS provides energy security, reduces costs, and increases environmental sustainability. Finally, a sensitivity analysis was conducted based on the availability of renewable resources, fuel cost, and inflation parameters, and the results were analyzed.

1. Introduction

Today, the demand for energy is increasing due to rapid industrialization, population growth, and technological developments [1]. In the current political scenario, the energy demand is projected to grow by 0.7% by 2030, but at a slower pace compared to the previous period. The demand for energy is expected to continue with this upward trend until 2050 [2]. Countries’ dependence on fossil fuels to meet this demand causes severe difficulties in terms of energy security and environmental problems. Using fossil fuels causes greenhouse gas emissions in the atmosphere, and consequently, global warming and climate change problems arise [3]. To reduce all these problems, limiting the use of fossil fuels and transitioning to RESs are of great importance [4,5]. RESs are easily accessible, unlimited, natural, and environmentally friendly energy sources like solar, wind, and biomass. These resources, which are important for sustainable development, provide socio-economic benefits by meeting the increasing energy demand [6].
Since RESs such as solar and wind are inherently unstable and unpredictable, it is not possible to generate constant and continuous power with these resources [7]. This limits power reliability. Distributed energy resources (DERs) such as BSSs, BGGs, or diesel generators (DGs) can be added to ensure power reliability [8,9,10]. HRESs provide the opportunity for the integration of such local DERs. HRESs are a promising solution to increase efficiency and stability in power generation [11]. By combining different DERs and BSSs, these systems offer significant advantages, especially in rural areas without access to the electricity grid [12]. However, more research and development are needed to control these systems and their energy management [11].
Different dispatch strategies have been used for the optimal design and techno-economic analysis of HRESs, which have attracted increasing attention in recent years. These optimally designed systems offer significant advantages such as energy security, lower electricity costs, system reliability, the integration of different RESs into the microgrid (MG), economic growth in rural areas by providing electricity to remote areas, and emission reduction [13].
Communities engaged in animal husbandry and agriculture in rural areas have limited access to electricity networks. Prolonged power outages, especially in the winter months when snowfall is high, reduce the quality of life of communities, negatively affect life, and cause economic losses. Some of the ways in which an MG formed of local RESs can increase the living standards of the communities living in rural areas are as follows.
  • Providing people in the region with access to continuous and uninterrupted electrical energy improves their quality of life.
  • Rural communities’ access to uninterrupted energy reduces labor loss by expanding the use of electrical equipment in agriculture and animal husbandry. This supports economic activities.
  • Uninterrupted electricity contributes to society’s social development. It increases welfare levels by facilitating communication and education services.
  • Because they use local resources, HRESs contribute to the sustainable development of rural areas, which reduces the development gap between urban and rural areas.
This study, which was carried out to provide sustainable energy access to Doğanevler village in Bingöl province by using its own resources, aimed to achieve the following points.
  • To increase energy security by designing an MG using RESs and to contribute to the sustainability of energy demands as a result of system optimization;
  • To contribute to the prevention of environmental pollution by reducing greenhouse gas emissions;
  • To reduce capital, operation/maintenance/repair, and conversion costs and to make a cost-effective energy production with the energy management strategy created in MATLAB environment;
  • To ensure the uninterrupted energy security of the MG, which is created independently from the grid, by using the biogas potential of the community to both realize uninterrupted energy production and prevent environmental pollution by disposing of animal waste.
In this study, a hybrid system consisting of PV, WT, BGG, and BSS components is designed considering the actual electrical load values of a small community of 53 households in a rural area of Bingöl province. An energy dispatch strategy is developed for the designed system in the MATLAB environment. The PS’s results are compared with HOMER’s CC and LF strategies.
The primary novelty of this study is the design of a system that integrates PV, WT, BGG, and BSS components and is analyzed for the first time using both HOMER’s LF and CC strategies as well as the ML strategy. Additionally, no prior models have been developed for the studied region in the existing literature.

Literature

El-Maaroufi et al. designed an HRES consisting of PV, WT, BGG, and BSS components to meet the annual energy demand of residential buildings in the Zoumi region of Morocco. As a result of the analysis carried out using the HOMER Pro software (version 3.14.2, Homer Energy LLC, Boulder, CO, USA), they reported that this system produces 11.14 GWh of energy per year, has an LCOE value of 0.125 USD/kWh, and reduces the CO2 emissions by approximately 5900 tons per year compared to diesel generators [14].
Nadeem et al. developed a model that included PV, BGG, and BSS components to design an off-grid HRES in Pakistan. As a result of optimization using the HOMER Pro software, the system they designed consists of a 15 kW BGG, a 11.5 kW PV module, a 1 kWh capacity BSS, and a 10.8 kW converter. The NPC and LCOE values were calculated as USD 95,858 and USD 0.104/kWh, respectively [15].
Khalil et al. used the HOMER Pro software to design an HRES consisting of PV, DG, and BSS components in the Karak region of Jordan. As a result of the analysis, the LCOE value of the designed system was 0.488 USD/kWh and it produces 610.73 kilotons of CO2 emissions per year. It was also found that when WT was added to the system, the LCOE value increased to 0.489 USD/kWh and the LCOE value of a system consisting only of DG was calculated as 0.727 USD/kWh [16].
Santos et al. presented a new methodology for dimensioning and simulating MGs using ML and AMPL (A Modeling Language for Mathematical Programming) tools in HOMER Pro. They tested the methodology with data from an MG installed on the campus of the University of Campinas. They reported that the ML + EMS strategy provides economic advantages over LF and CC strategies and reduces dependency on the main grid [17].
Miah et al. [18] presented a strategy for designing a grid-connected PV system in Bangladesh using the Homer Pro ML tool. They planned a 3000 kW PV system with a cost of 493,469,200 taka and an LCOE of 5.31 taka/kWh.
Toopshekan et al. developed a new dispatch strategy using ML in HOMER software for a grid-connected PV/WT/DG/BSS system for a residential area with a daily energy demand of 112.7 kWh in Tehran, Iran. They reported that their PS leads to economic improvements of 9% and 4% compared to the LF and CC strategies in HOMER, respectively. In addition, the NPC and LCOE values of the designed system were obtained as USD 75,861 and USD 0.128/kWh, respectively [19].
Yazhini et al. designed and analyzed five different configurations of grid-connected and off-grid models for a village in South India regarding their economic viability. The system, which consists of a combination of PV, DG, WT, and BSS, was reported to have the lowest LCOE among the off-grid models. The grid-connected system has the lowest LCOE compared to all models [20].
In the study by Aziz et al. [21], a new dispatch strategy for an off-grid HRES consisting of WTs, DGs, and BSSs is developed using an ML tool. Their proposed strategy is compared with the LF and CC strategies in HOMER regarding their techno-economic and environmental performances. The NPC value of the proposed dispatch strategy is USD 56,473, which is lower than the NPC value of the LF dispatch strategy (USD 63,681) and the NPC value of the CC dispatch strategy (USD 62,545).
Ishraque et al. performed technical, environmental, and economic analyses of their proposed MG with the HOMER Pro software and a power system response analysis with the DIgSILENT Power Factory software. As a result of the evaluation, it was stated that the CC strategy had the worst performance in both the grid-connected and off-grid models. In the grid-connected model, the DO (Generator Order) strategy performed the best (NPC: USD 113,137, LCOE: USD 0.166/kWh), while in the off-grid model, the LF strategy performed the best (NPC: USD 141,448, LCOE: USD 0.024/kWh) [22].
Melit et al. designed and analyzed the results of an economic analysis of two different PV system scenarios with and without grid-connected energy storage to meet the electricity demand of a residential house in Northern Algeria using the HOMER Pro software. As a result of the economic analysis, it was reported that the grid-connected PV system without energy storage has the lowest NPC and LCOE values [23].
Chebabhi et al. performed an economic analysis of three different systems consisting of PV, PV/WT and PV/WT/DG at Biska plant in Algeria using HOMER software. As a result of the analysis, NPC values were calculated as 11.7 MUSD, 13.3 MUSD, and 9.45 MUSD, while the LCOE values were 0.19 USD/kWh, 0.728 USD/kWh, and 0.188 USD/kWh, respectively [24].
Some of the studies on HRESs that include components such as PV cells, WTs, fuel cells (FCs), internal combustion engines (ICEs), micro gas turbines (MGTs), combined heat and power (CHP), and hydrogen tanks (HTs), and that examine parameters such as NPC, LCOE, loss of power supply probability (LPSP), and renewable fraction (RF) in the literature are presented in Table 1.

2. Materials and Methods

2.1. System Modeling
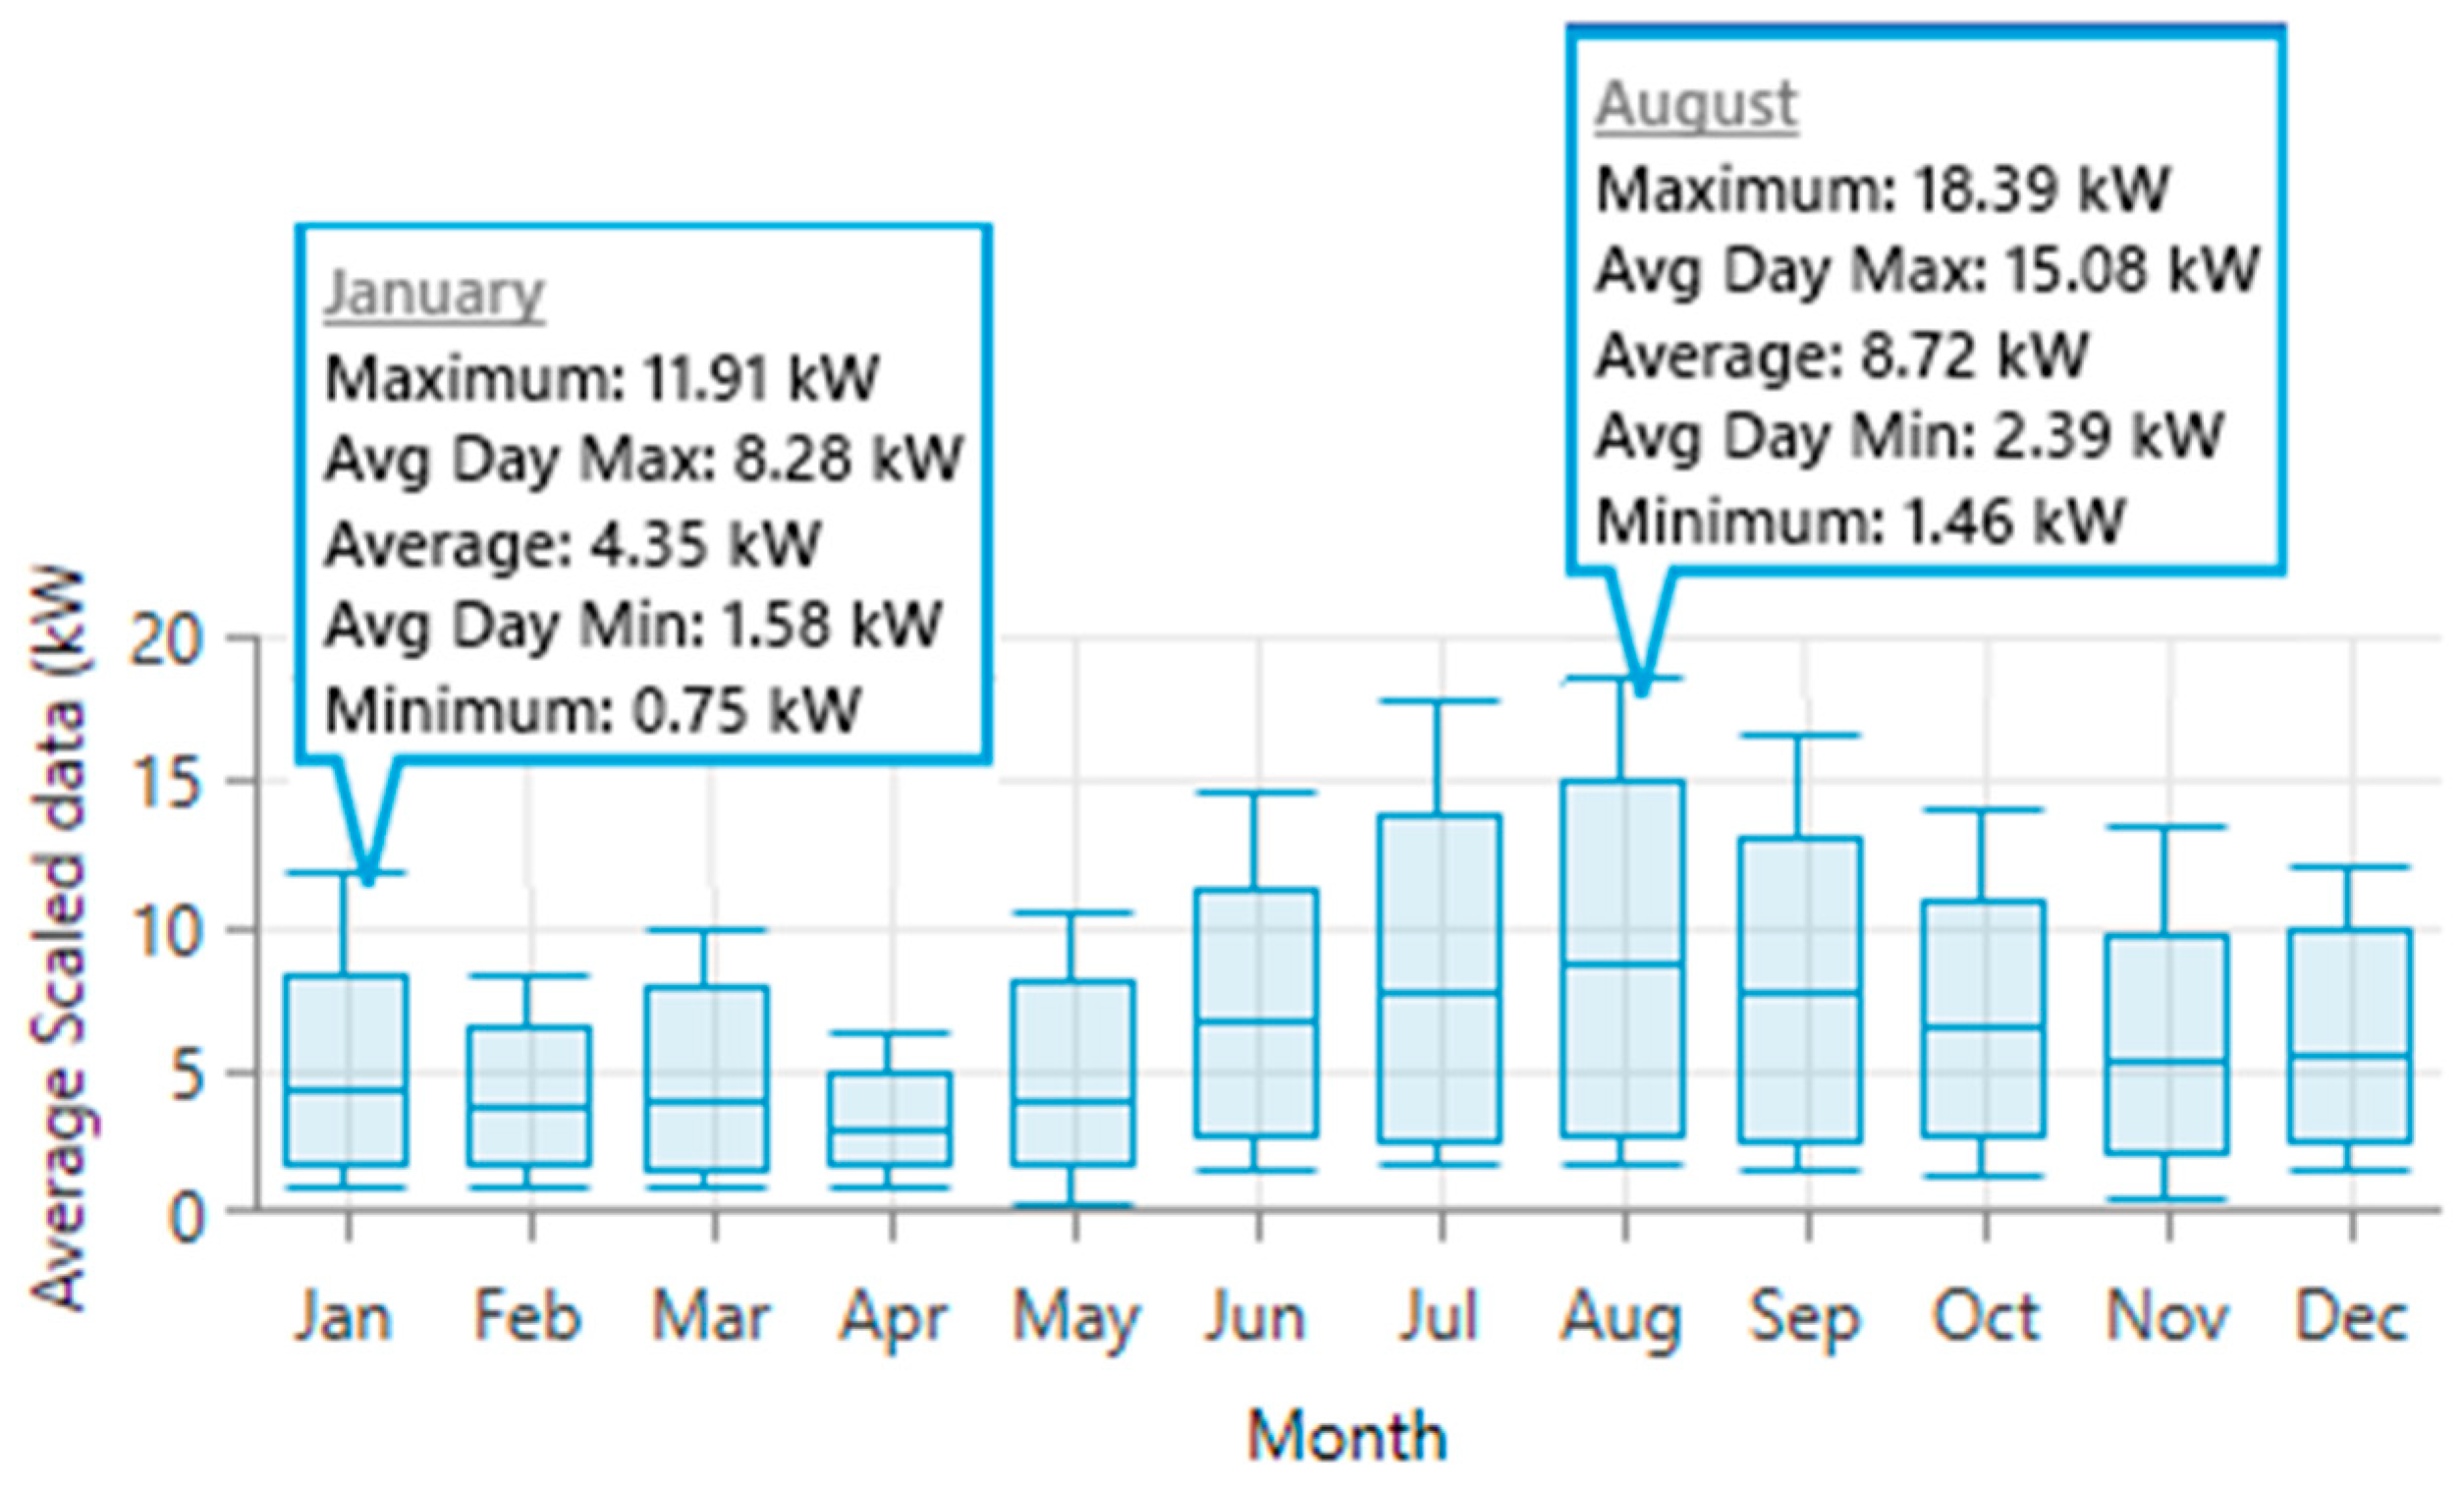
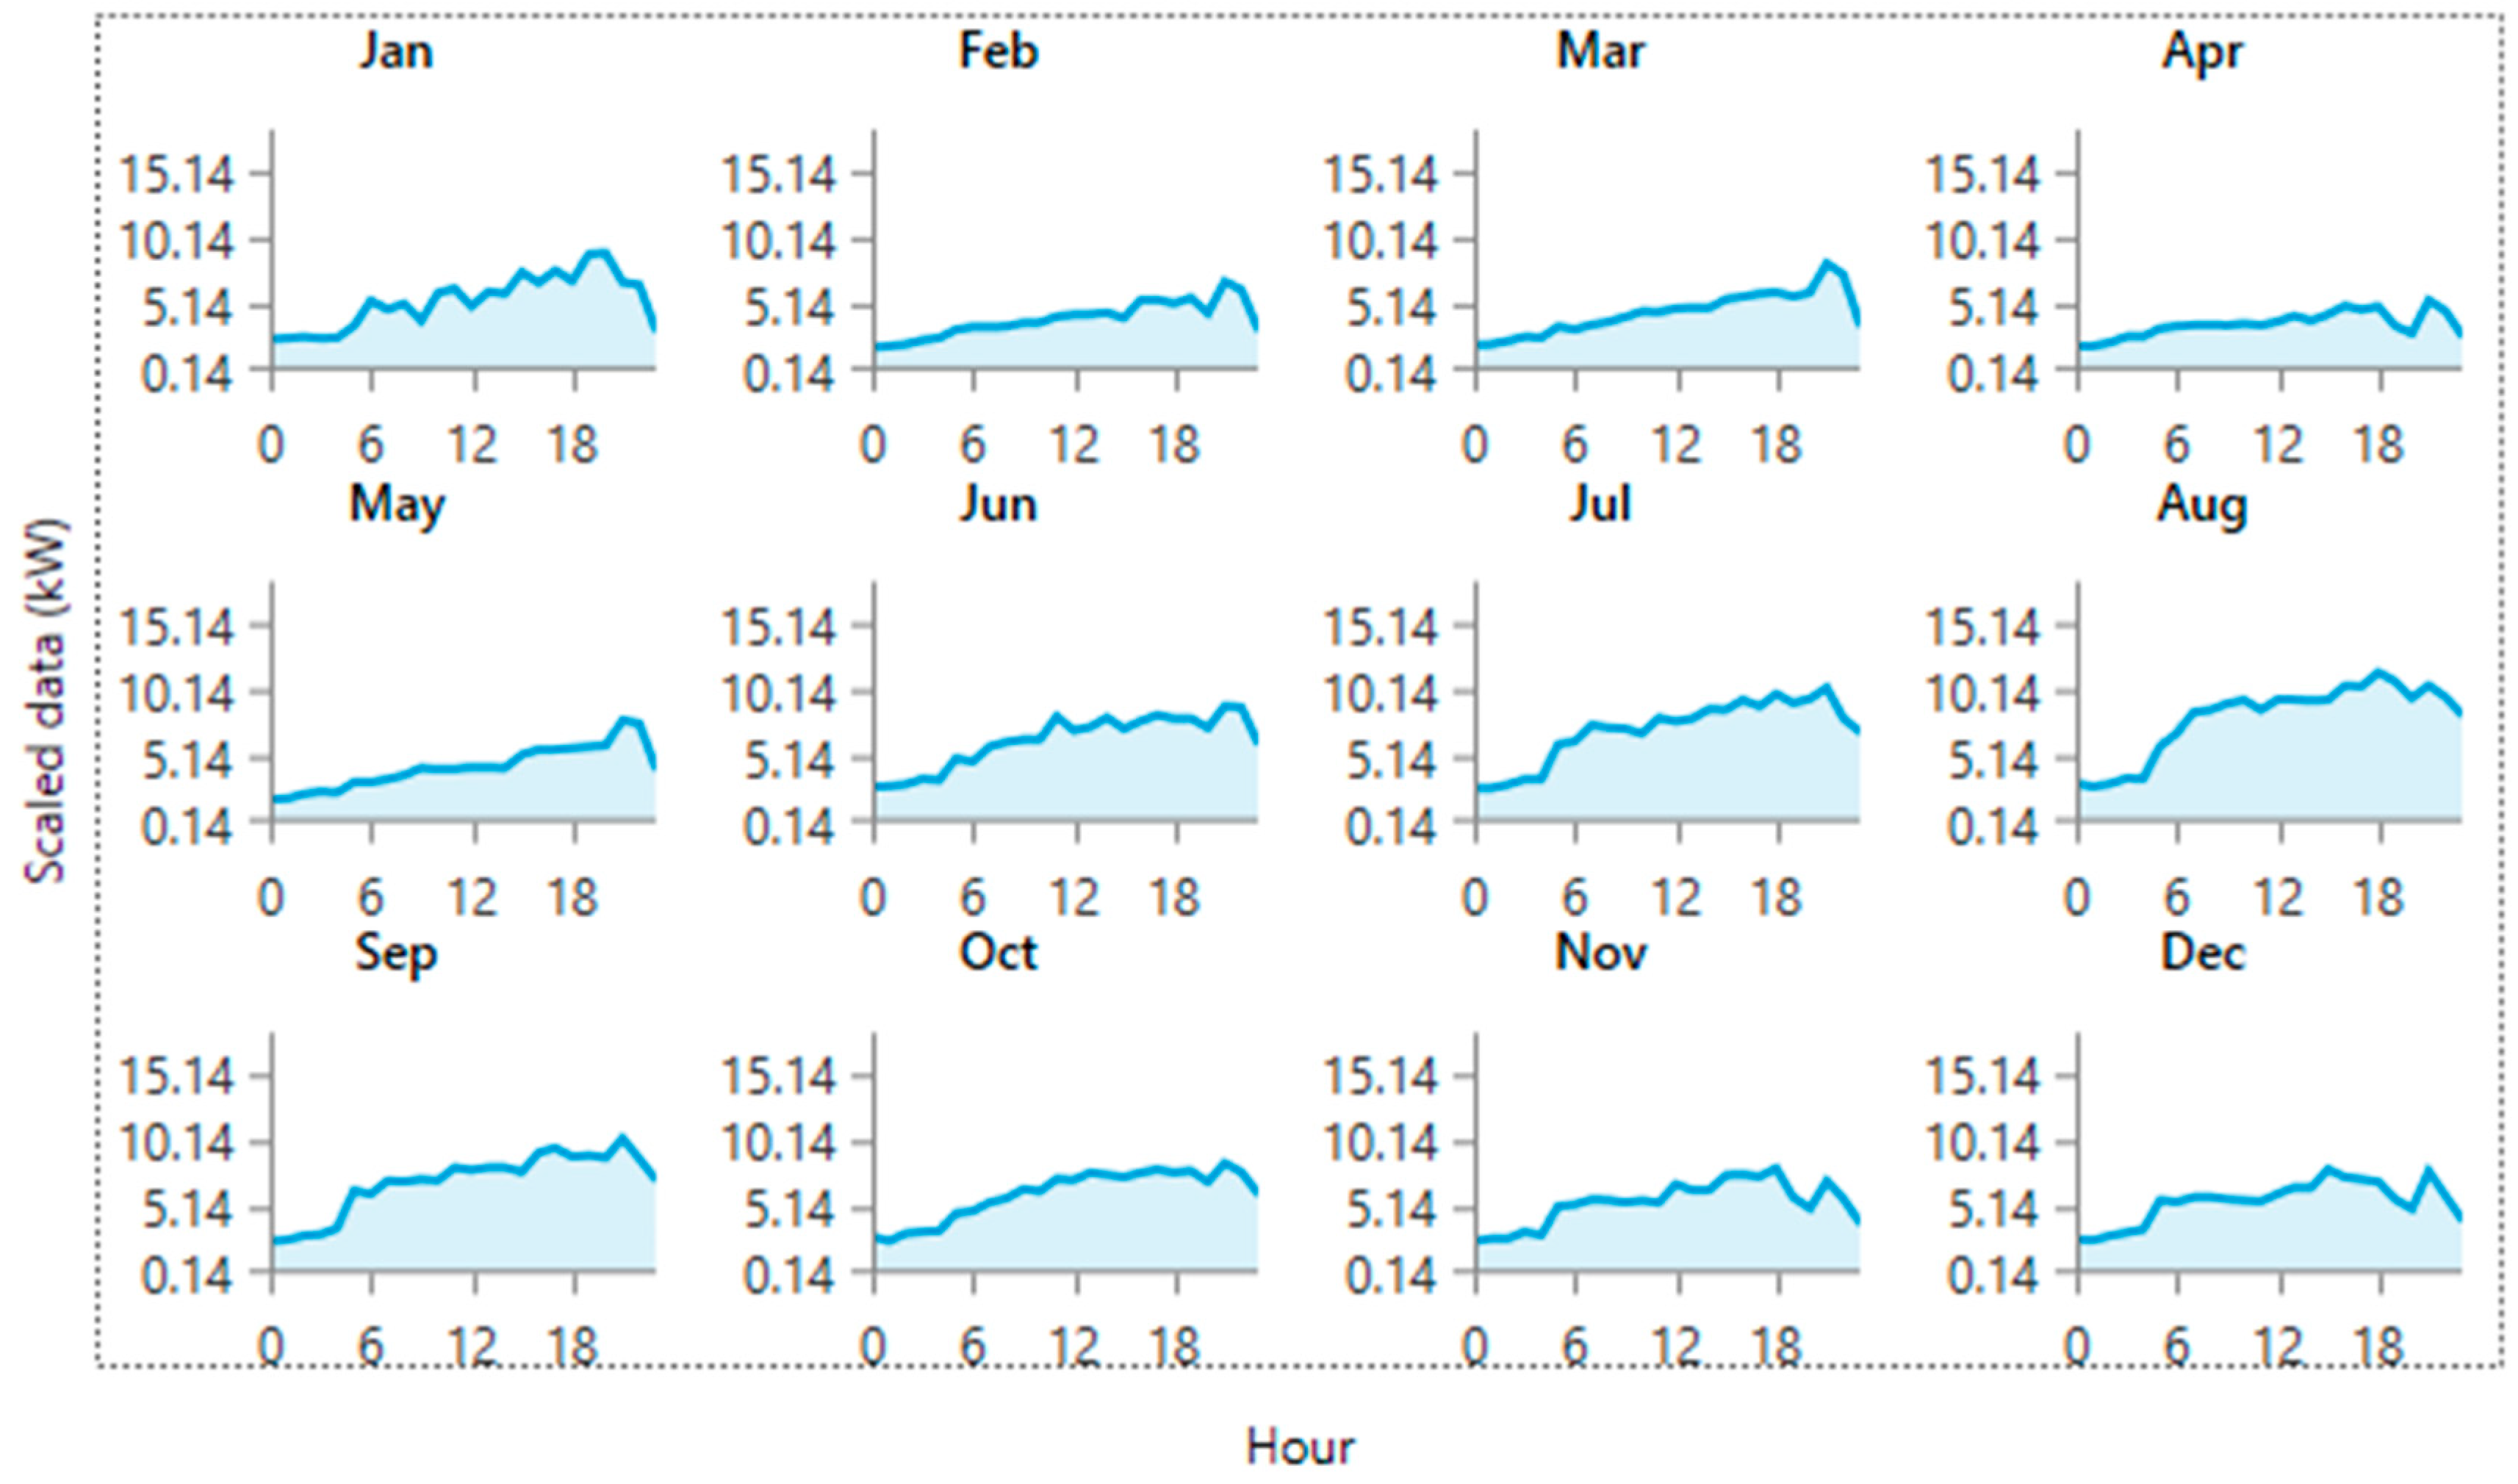
Many software programs are used in the literature to design and optimize HRESs. In this study, HOMER (Hybrid Optimization of Multiple Electric Renewables), one of the most widely used software programs, is preferred. This software is extensively used to plan and design off-grid or grid-connected HRESs [44]. HOMER simulates the operation of a system, making energy balance programs for each period of the year. In each period, it compares the electrical and thermal demand with the energy the system can provide at that time and calculates the incoming and outgoing energy flows from each participant in the system. In systems with batteries or fuel-powered generators, HOMER also determines how to run the generators and whether to charge the batteries. These energy balance programs can be tailored to the system configuration under consideration. It also determines whether a component can meet the electrical demand under your conditions (i.e., whether it is feasible) and estimates the cost of installing and operating the system over the life of the system. System cost programs include costs such as capital, replacement, operation and maintenance, fuel, and interest [45].
In this study, the electricity demand of Doğanevler, a village of 53 households located in a rural area of Bingöl province, where frequent power outages occur due to adverse weather conditions, is analyzed. Power outages due to adverse weather conditions and the long time it takes to repair the faults due to the region’s difficult terrain negatively affect the villagers’ quality of life. To meet the region’s energy demand, an HRES consisting of off-grid PV, WT, BGG, and BSS components is designed. The structure of the HRES designed in the HOMER program is given in Figure 1.

2.1.1. Load Profile

In the HOMER program, actual monthly consumption values were used to model the community load. The average monthly and hourly load profiles are given in Figure 2 and Figure 3. In the summer months, the electricity demand increases due to the increase in population, agricultural irrigation, and the production of animal products. In the winter months, the population decreases, and the electricity demand decreases accordingly. Since real community data are used, some differences in consumption are due to prolonged power outages in the winter months.

2.1.2. Meteorologic Data of the Region

The solar radiation and wind data for the region selected in this study were obtained from the NASA database integrated into the HOMER Pro software. TMY2 (typical meteorological year) and TMY3 datasets are provided free of charge by the US National Renewable Energy Laboratory. The TMY2 datasets and guidance were produced by the Analytical Studies Division of the National Renewable Energy Laboratory (NREL) under the Resource Assessment Program funded and monitored by the US Department of Energy’s Office of Solar Energy Transition [46]. TMY2 and TMY3 files can be imported directly from HOMER’s resource inputs window [45]. The average annual solar radiation value is 4.75 kWh/m2/day and the average wind speed is 4.03 m/s. Monthly average solar radiation data for the region are shown in Figure 4 and monthly average wind speed data are shown in Figure 5.

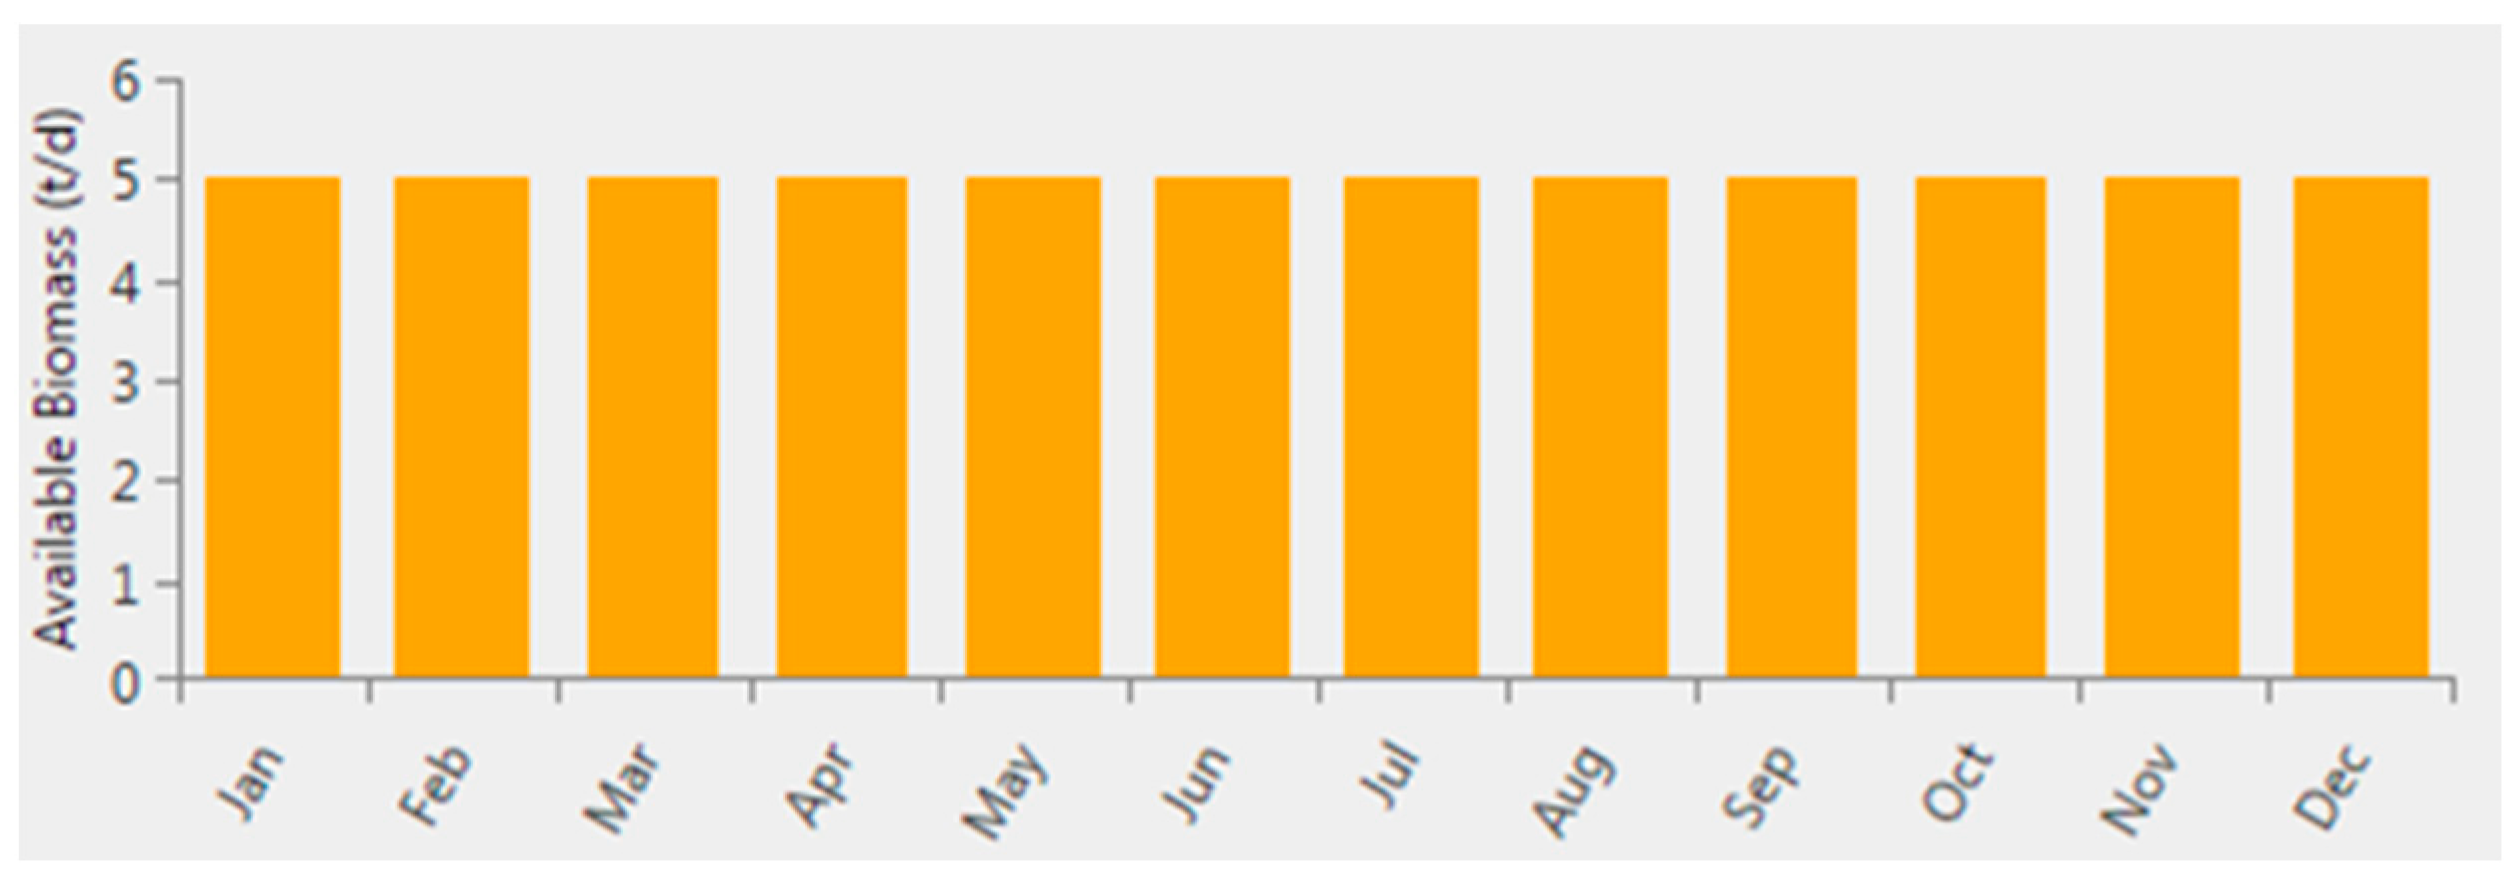
2.1.3. Biomass Resources

In the region that is engaged in animal husbandry and agriculture, goat and cow breeding is mostly practiced. In this study, instead of diesel generators, a BGG is used in the system to utilize the energy of existing animal waste. Thus, the biogas energy in animal waste is converted into electricity and heat energy. The community’s biomass values are given in Figure 6.
On average, cattle produce about 10 kg of wet manure daily, while this value is about 1 kg for small ruminants [47]. The community of 53 households has an average livestock of 300 cows and 2000 goats. Considering these values, the region’s biomass resource was entered as data into the HOMER Pro software as five tons per day.

2.2. Mathematical Modeling of System Components

2.2.1. System Limitations

The margin of error in the mathematical calculations of HRES components is a critical factor in the accuracy and reliability of the system design. This margin of error can be caused by uncertainties affecting various components’ performance and cost calculations. These uncertainties, such as the weather-related variability of RESs, such as solar and wind, can lead to instability in energy production [48]. Off-grid HRESs should have sufficient resources and storage capacity to meet the energy demand. However, due to the cost, the capacity of the BSS may be limited, which may cause outages during high energy demands. These systems consist of multiple energy sources and storage systems [49]. Therefore, their coordination is complex. Failure of the components that make up the HRES may cause interruptions in energy production. Inaccurate estimation of load demand in the design of HRES or errors in capacity planning can cause it to fail to meet energy demand.
These limitations and sources of error are challenges and issues that need to be considered during the design and operation of HRESs. These issues can be minimized by developing appropriate energy management systems and strategies.

2.2.2. Mathematical Model of PV System

PV converts solar energy directly into electrical energy [50]. Homer calculates the output of the PV array according to Equation (1) [45].
P P V = Y P V f P V G T ¯ G T , S T C ¯ 1 + α P T c T c , S T C
where Y P V is the power output (kW) under the test conditions, f P V is the PV depreciation factor (%), G T ¯ is the solar radiation value (kW/m2) falling on the PV array at the current time step, G T , S T C ¯ is the incident radiation value (1 kW/m2) under standard test conditions, α P is the power temperature coefficient (%/°C), T c is the PV cell temperature (°C) at the current time step, and T c , S T C is the PV cell temperature (25 °C) under standard test conditions.

2.2.3. Wind Turbine

A wind turbine was used to exploit the wind potential of the region. At each time step, HOMER uses the values entered in the wind source input window to calculate the wind speed at the hub height of the turbine using the logarithmic law as given in Equation (2).
U h u b = U a n e m   . l n z h u b / Z 0 l n z a n e m / Z 0
where U h u b is the wind speed at the hub height of the wind turbine (m/s), U a n e m is the wind speed at the anemometer height (m/s), z h u b is the hub height of the wind turbine (m), z a n e m is the anemometer height (m), Z 0 is the surface roughness length (m), and α is the power law exponent.

2.2.4. Biogas Generator

Biogas, formed from the biodegradation of organic materials, is used as fuel by the BGG to generate electrical energy. The biogas generator’s power output Pbio is calculated according to Equation (3) [51,52].
P b i o = B C V B G η B G η G a z 3600
where B represents the amount of biomass (kg), C V B G represents the calorific value of biogas (kj/kg), η B G represents the biogas generator efficiency, and η G a z represents the gasification efficiency of the gasifier.

2.3. Economic Modeling

Economic analysis is the most important element in planning and designing a hybrid system [44]. HOMER Pro calculates the proposed system’s NPC and LCOE using Equations (4)–(7) [44,53,54].
N P C = C a n n , t o t C R F   d , Y r
C R F = d 1 + d Y r 1 + d Y r 1
d = i f 1 + f
L C O E = C a n n , t o t E s e r v e d
where C a n n , t o t is the total cost of the system, CRF is the capital recovery factor, d is the discount rate, i is the nominal interest rate, f is the inflation rate, Y r is the projected life, and E s e r v e d is the total electricity load served (kWh/yr). The unit cost values of the components used in the proposed system are given in Table 2.

2.4. Dispatch Strategy

HOMER Pro can perform simulations using different strategies for the designed systems. Each strategy follows a different method and tries to optimize different aspects of the system. Some of the strategies in HOMER Pro include the following [45,55]:
Load Following (LF): This strategy’s objective is to prioritize the use of renewable resources, meet load demand for as long as possible, and minimize the system’s outage time. According to this strategy, when a generator needs to operate, it will operate under minimum load conditions. Batteries are charged with energy from renewable sources.
Cycle Charging (CC): Under this strategy, a generator will run at full capacity when it comes online and the excess power will be used to recharge the batteries.
MATLAB Link (ML): This strategy reads and applies the strategy created by the user in the MATLAB environment [45,55]. The proposed strategy was developed based on the strategy in reference [56].
A flowchart of the dispatch strategy proposed for the operation of the HRES designed in this study is given in Figure 7. The proposed strategy aims to provide a more effective distribution strategy for HRESs. The operation of this strategy is as follows:
If the power generated by PV systems and WTs is equal to the load demand, the RESs will only supply the load. In this case, the battery will not be charged and the BGG will not operate.
If the power generated by PV systems and WTs is more than the load demand, RESs will cover the load and the excess energy will be used for the BSS.
If PV and WT cannot meet the load demand, the biogas storage (BioSt) is checked. If the BioSt is full and the Battery State of Charge (SOC) is below the specified minimum level (SOC < SOC min), the BGG is operated to meet the remaining load and the excess energy is directed to the BSS. However, if the SOC is below the specified minimum level (SOC < SOC min) the BGG will only feed the load.
If the biogas tank is empty (BioStEmpyty) and the SOC is above the specified minimum level (SOC > SOC min), the load will be covered by the BSS.
If the PV systems and WTs cannot meet the load demand and SOC is above the specified minimum level (SOC > SOC min), the BSS will discharge and feed the load along with PV and WT. If the PV systems and WTs cannot meet the load demand and BioSt is not empty, the BGG will operate and supply the remaining load.
If the SOC is below the specified minimum level (SOC < SOC min) and the PV systems and WTs are not producing enough power to meet the load demand, the BGG will run to meet the load demand.
When the BGG load demand is below the minimum load level, the BGG will operate at a minimum load, both feeding the load and charging the battery with excess power. The minimum load rating of the BGG refers to the lowest acceptable load level of the BGG and is expressed as a percentage of the capacity of the BGG.

3. Results and Discussion

In this study, a new dispatch strategy is proposed by designing an HRES consisting of PV, WT, BGG, and BSS components for Doğanevler village located in a rural area of Bingöl province. For the proposed HRES, HOMER’s own LF and CC strategies and the strategy developed in this study are analyzed and compared in terms of their technical, economic, and environmental impacts. As a result of the simulation, the optimum capacity values of the HRES components according to the strategies are given in Table 3.

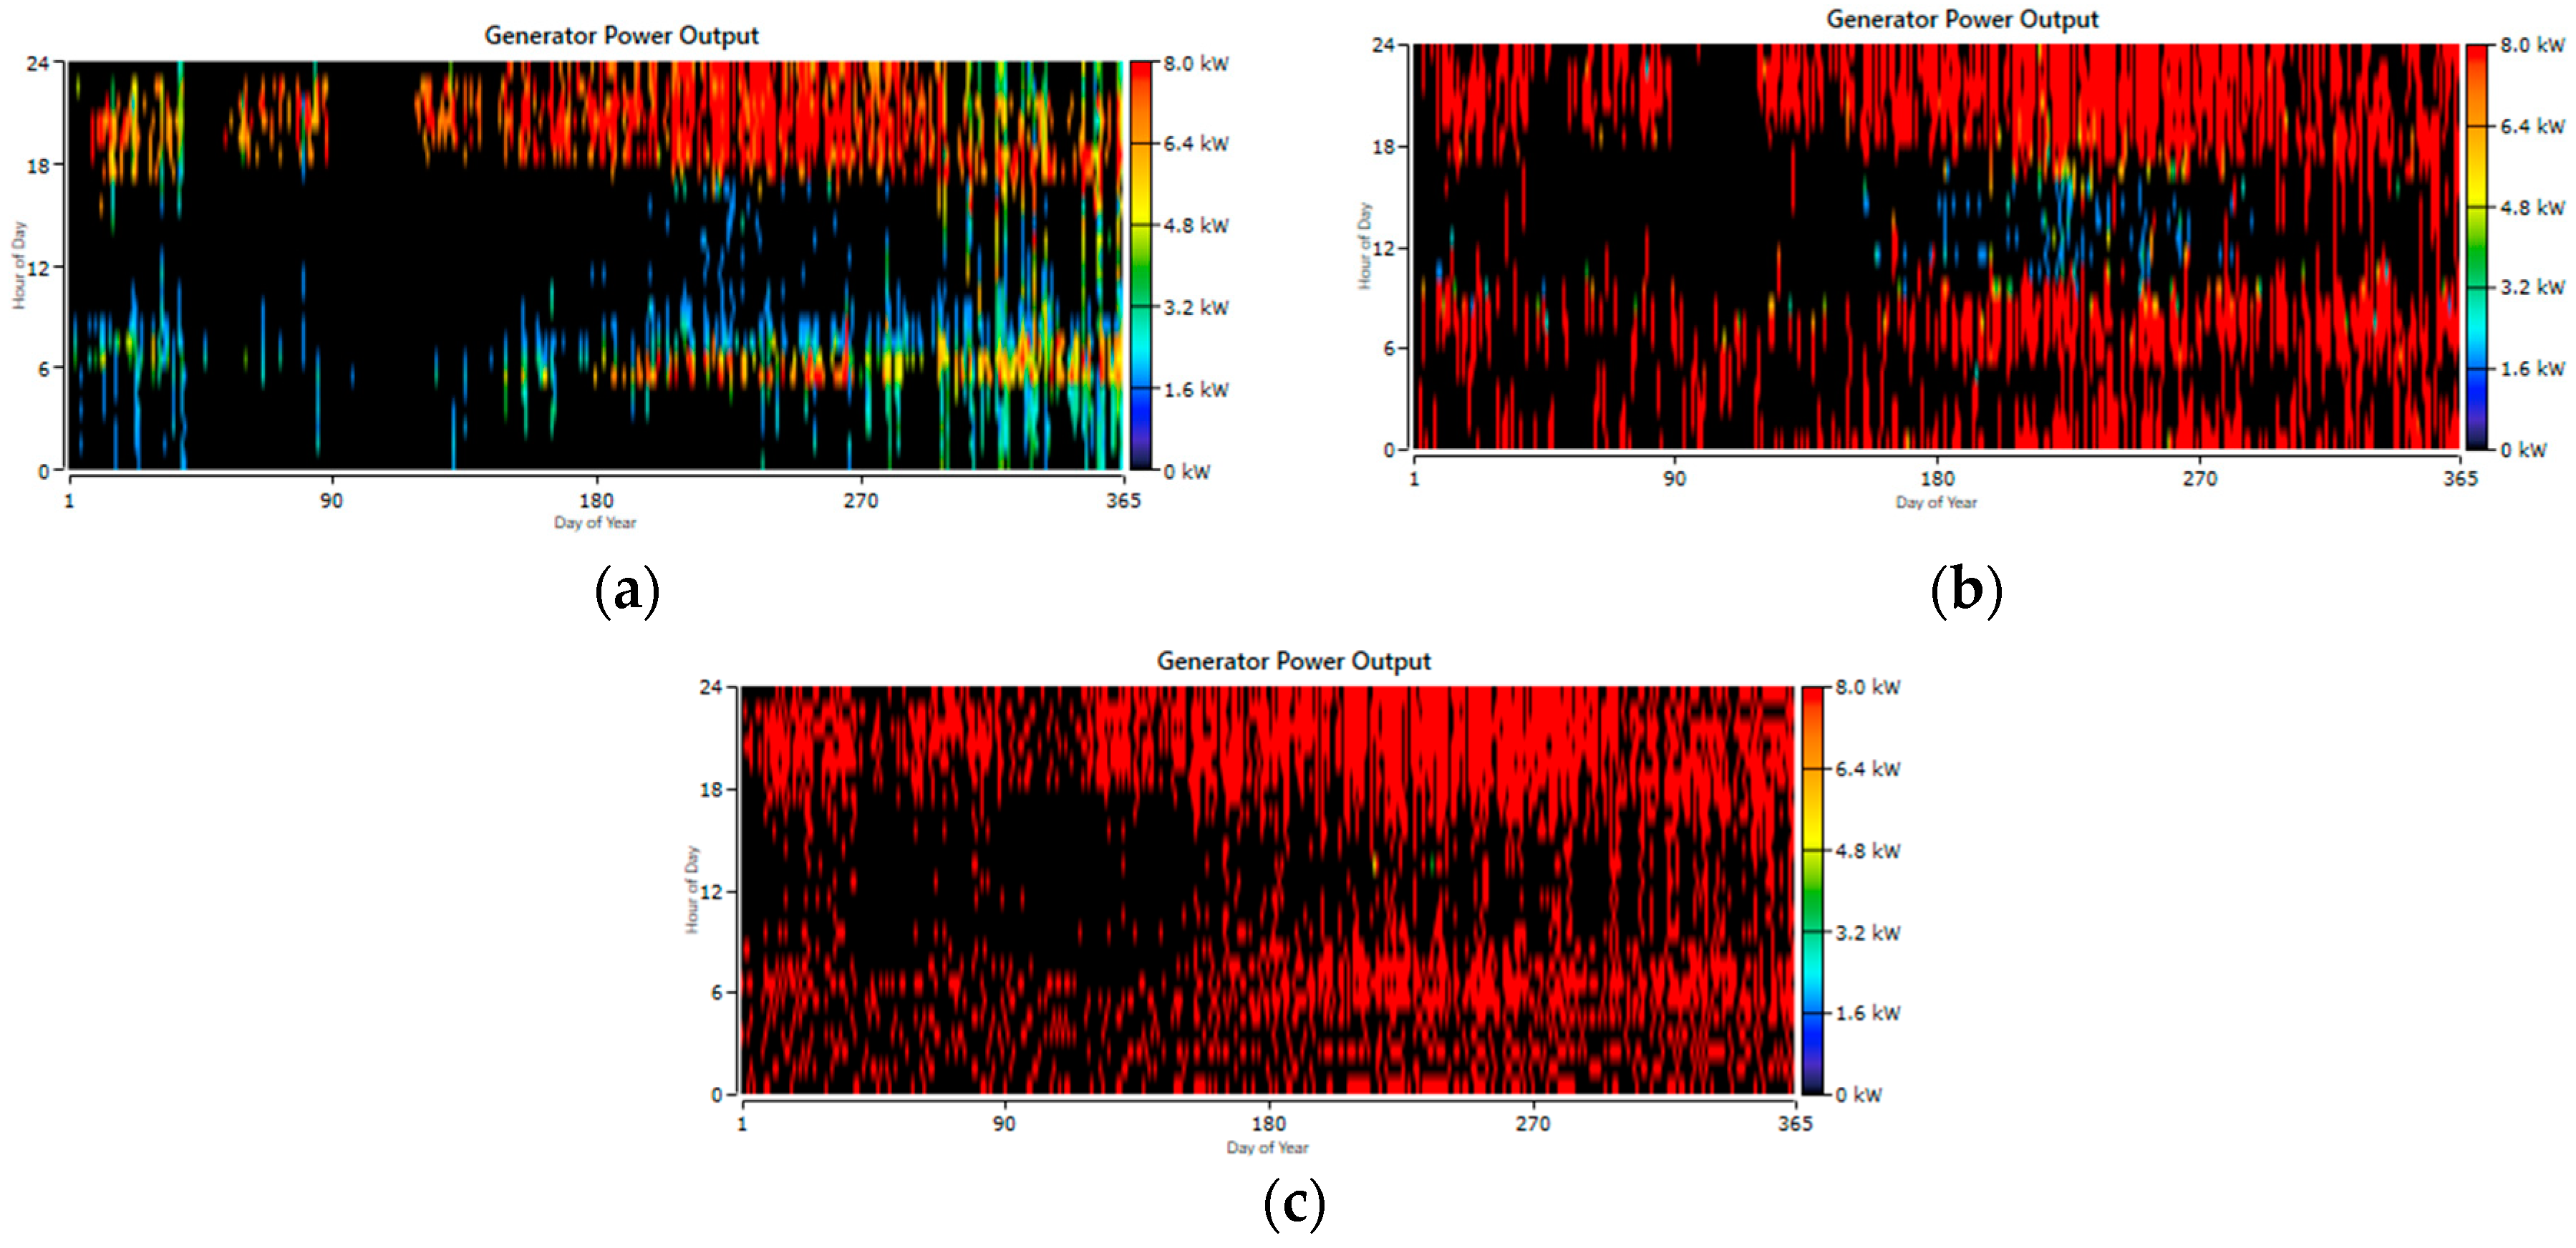
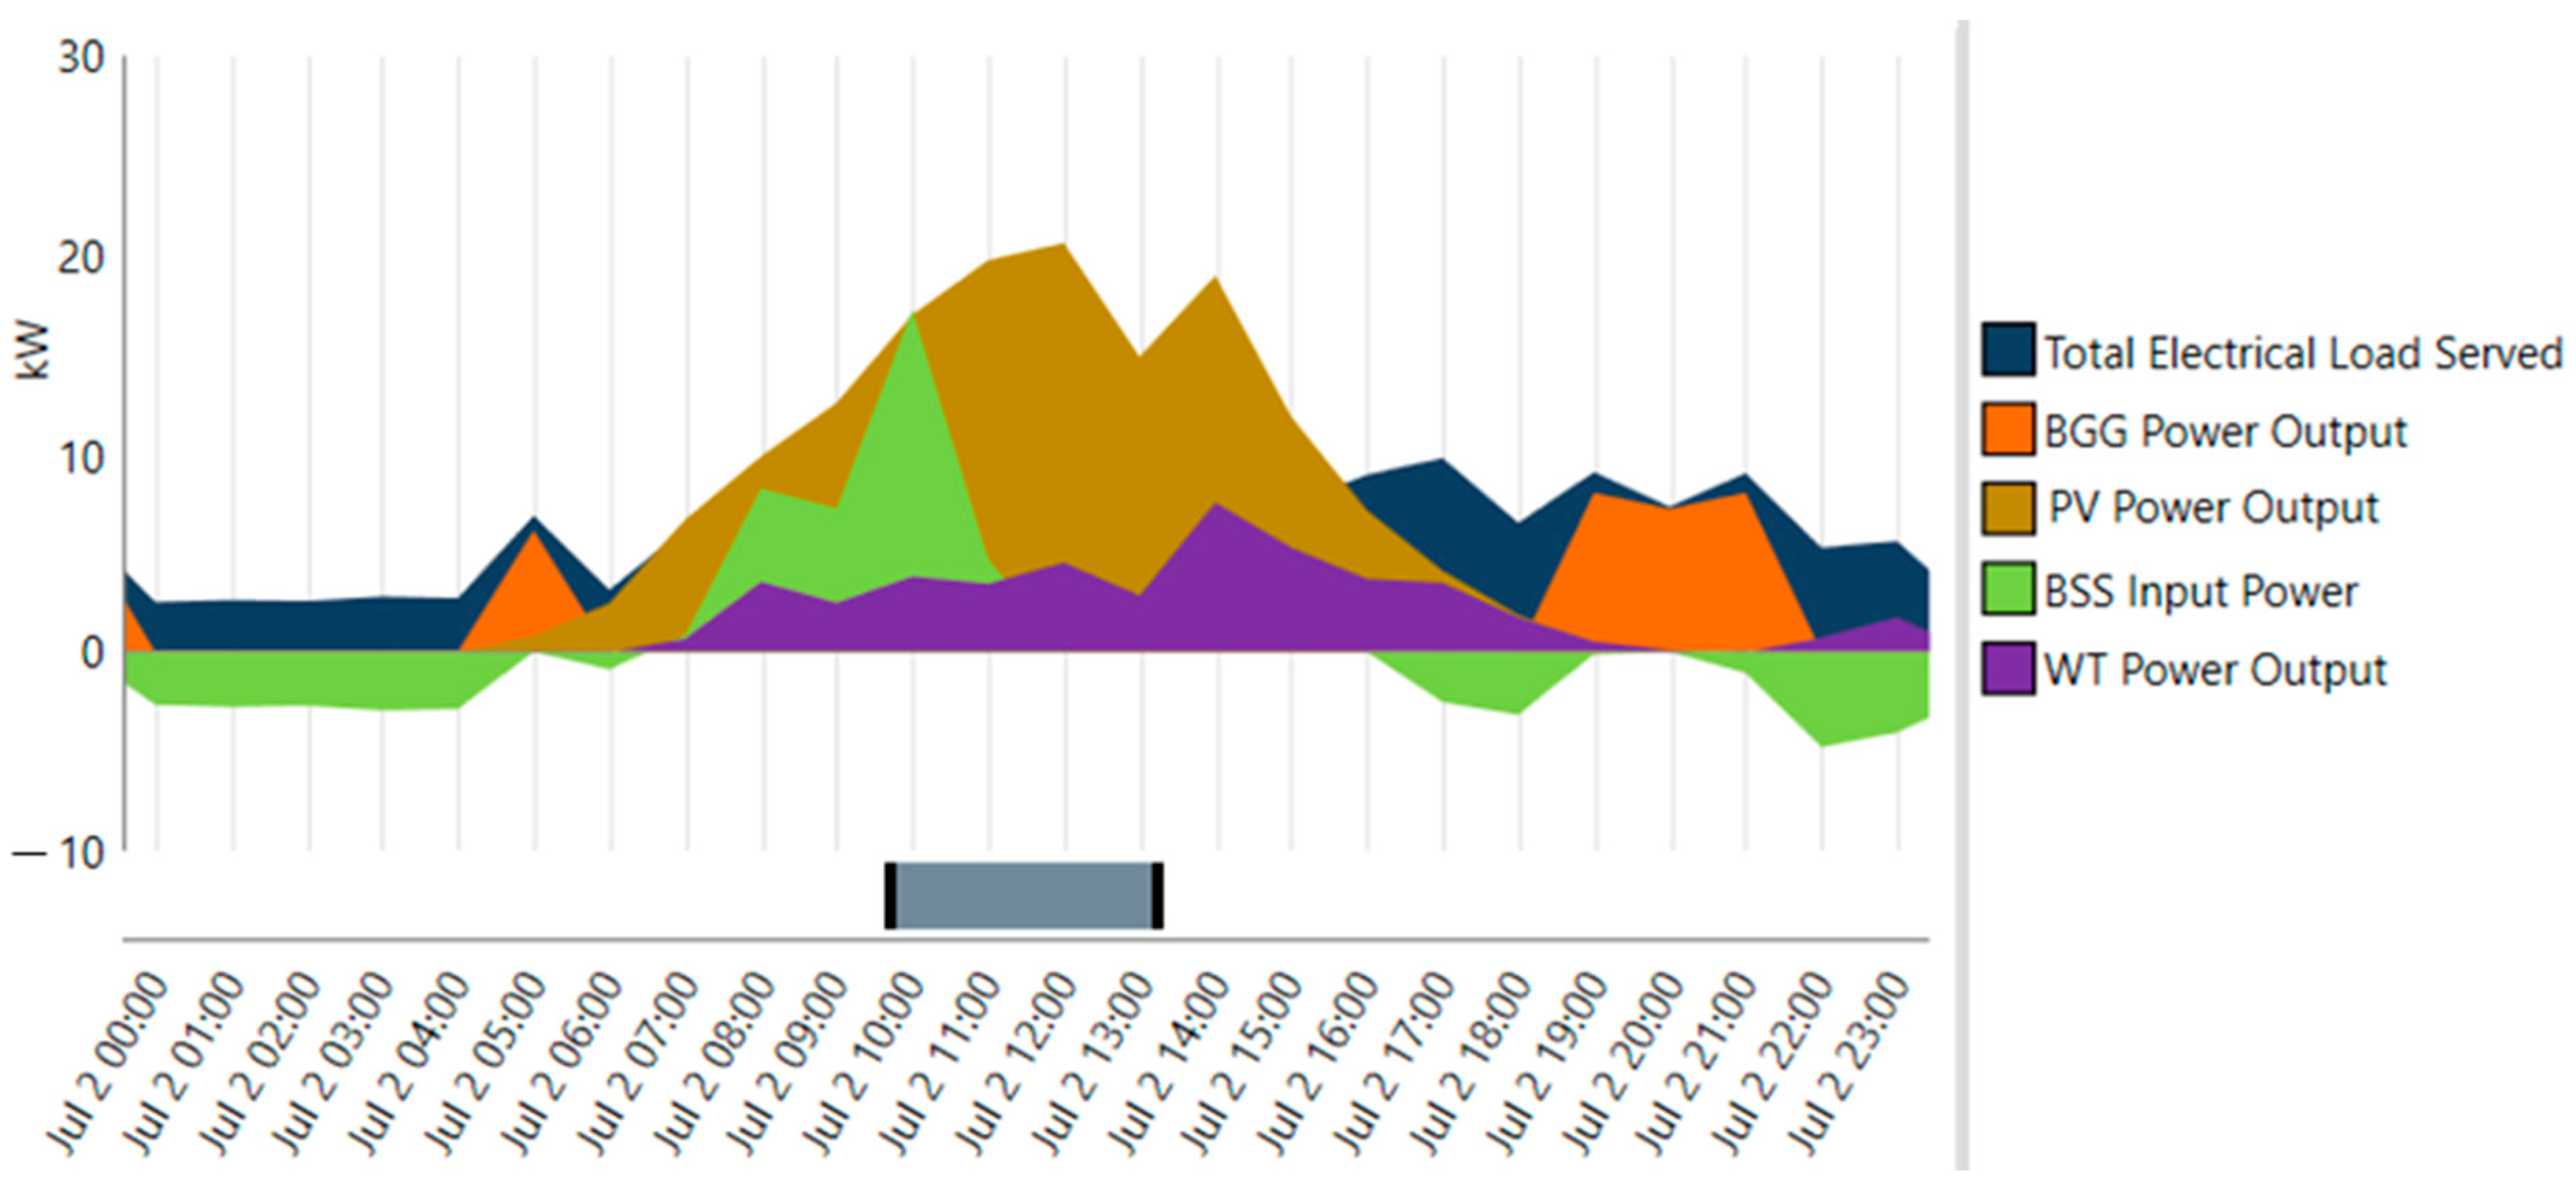
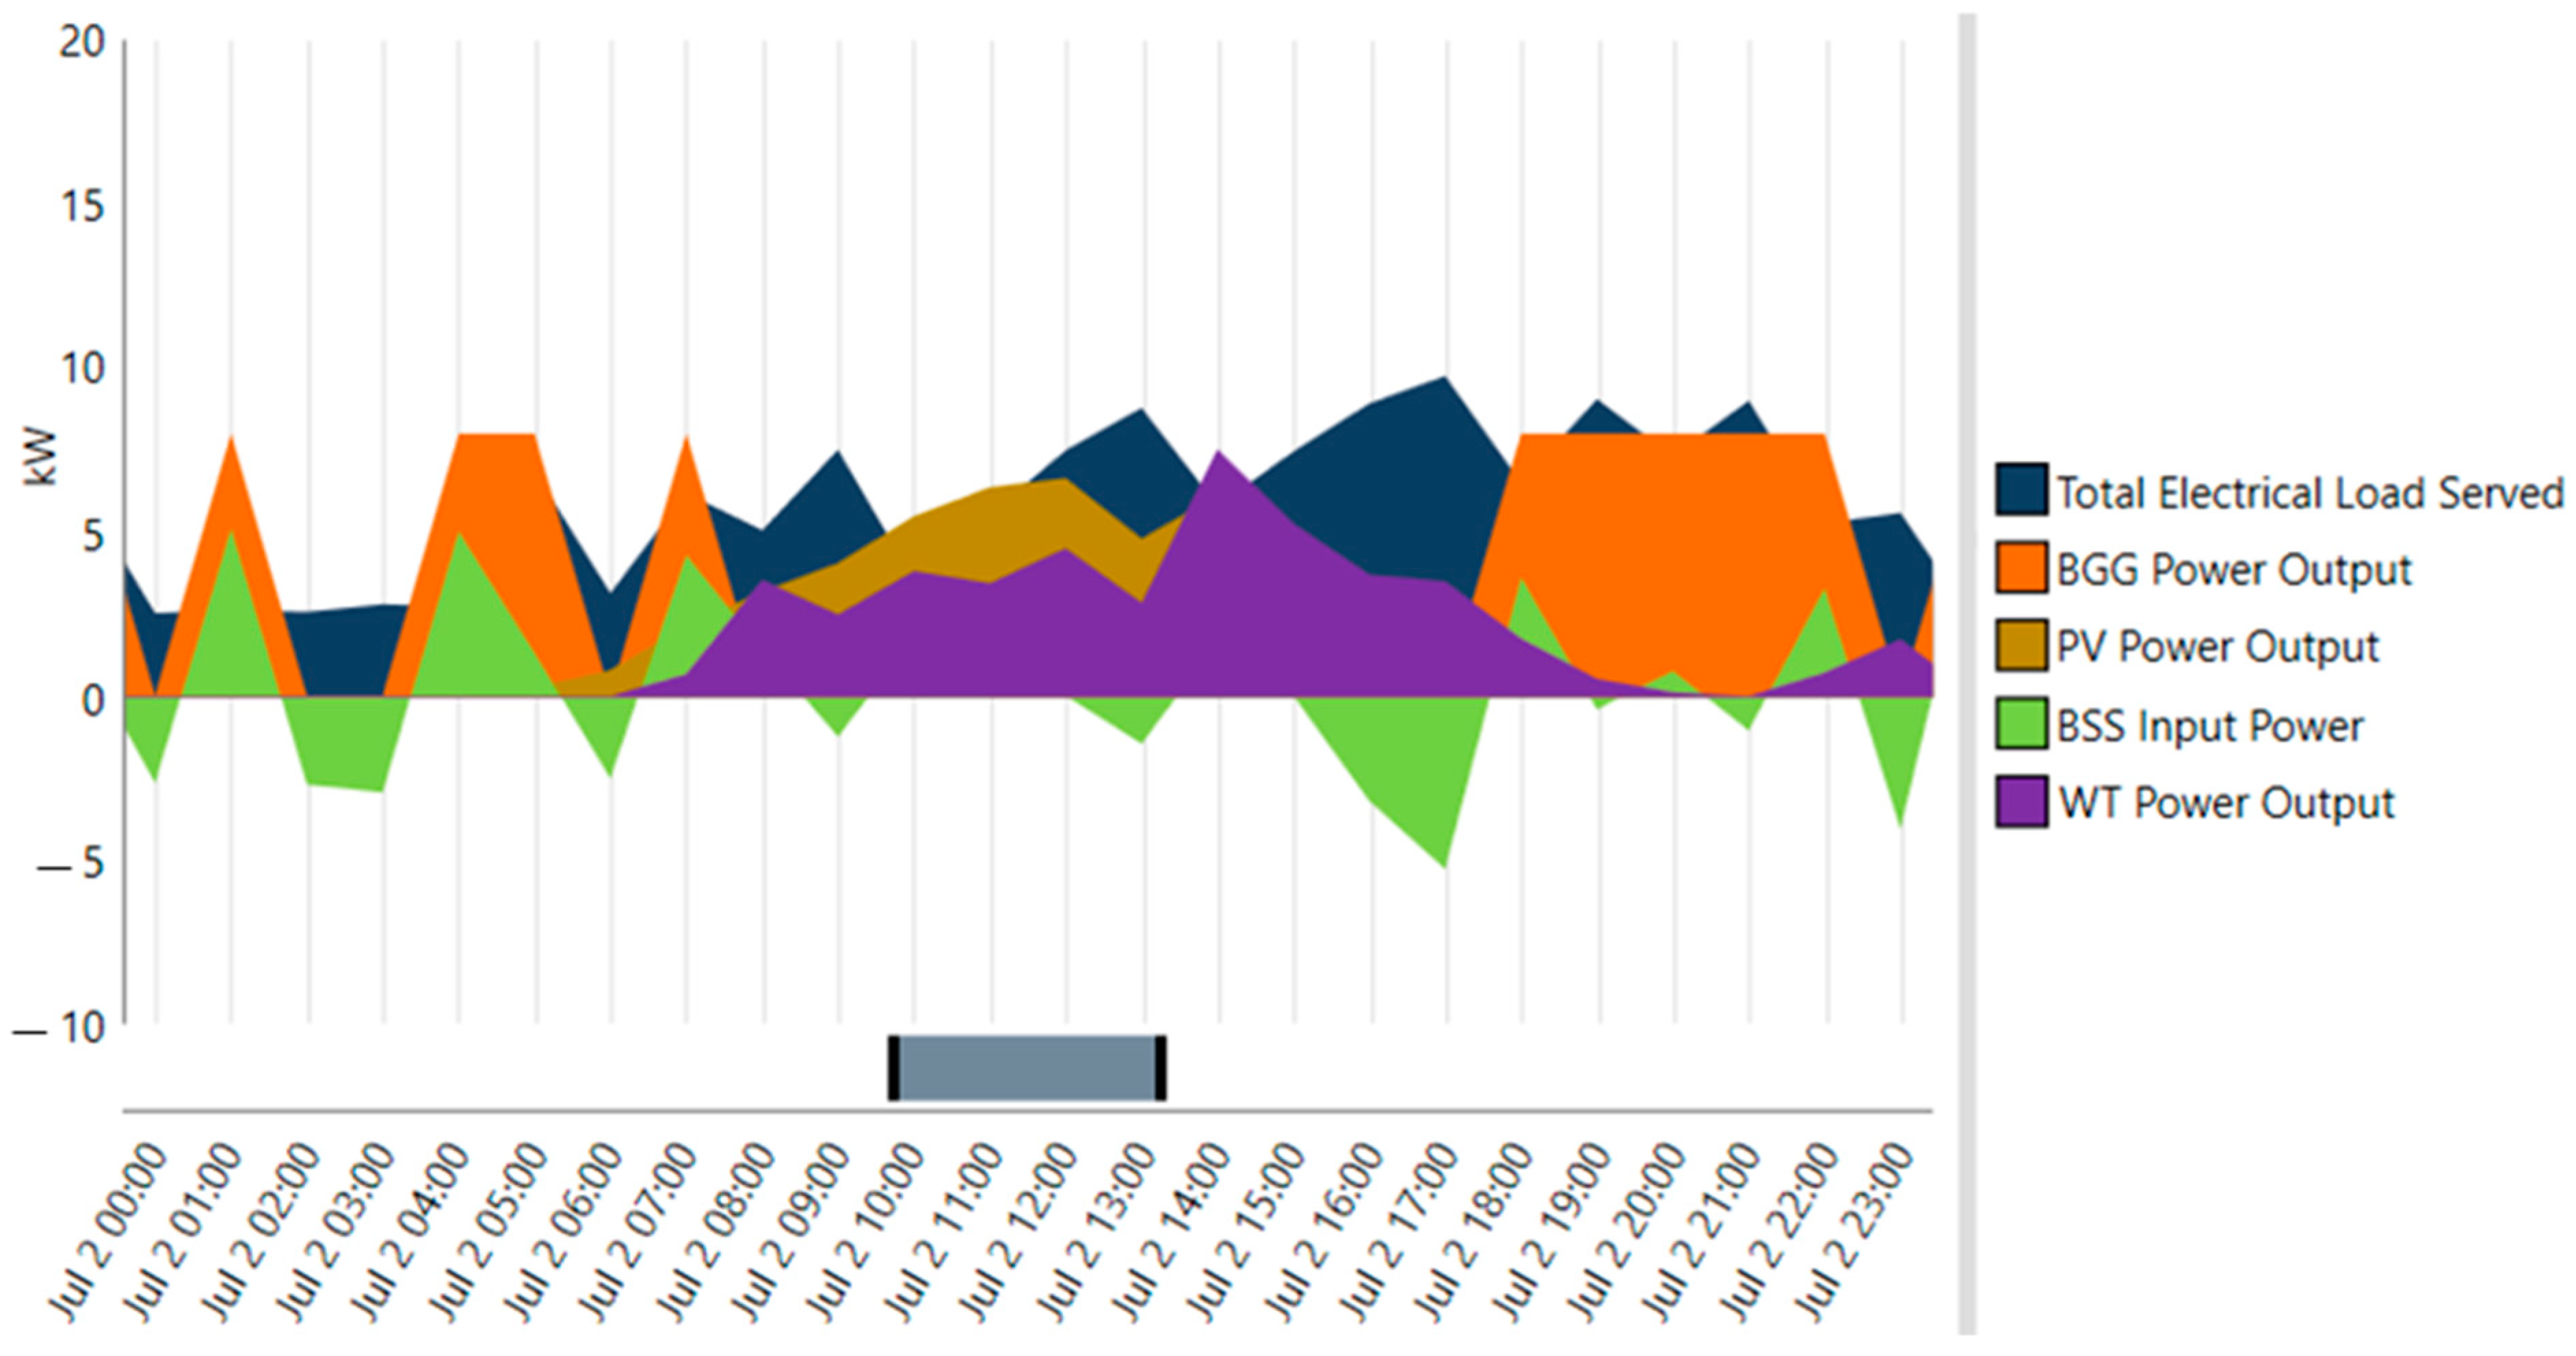
3.1. Electrical Analysis

The daily load demand of the HRES designed for Doğanevler village is 135 kWh. As a result of the simulations performed separately according to LF, CC, and the PS, the monthly generation amounts of the HRES components are given in Figure 8, respectively.
According to the LF dispatch strategy, the PV system produces 50,196 (60.3%) kWh of energy per year, while the WT and BGG produce 22,927 kWh (27.6%) and 10,085 (12.1%) kWh, respectively. According to the CC dispatch strategy, the amounts of energy produced by PV, WT, and BGG are 27,927 (39.7%) kWh, 22,927 (32.6%) kWh, and 19,523 (27.7%) kWh, respectively. According to the proposed dispatch strategy, the annual amounts of energy produced are 16,205 (26.2%) kWh for PV, 22,927 (37%) kWh for WT, and 22,817 (36.8%) kWh for BGG.
When the PS is compared with LF and CC strategies, it is clear that there are significant differences in the utilization of resources, especially the BSS. With the PS, the production of energy is balanced and all three resources are used effectively.
The reason for the more balanced energy production of the PS compared to the LF and CC strategies is the smaller size of BSS (12 kWh) used in the PS and the efficient utilization of PV and WT components. In the PS, the PV and WT components meet the energy demand during daytime hours, while the BGG supports energy production at night and when solar/wind production is low. This approach allowed for the stabilization of fluctuations in energy production and the consistent measurement of energy consumption.
If energy production exceeds demand, excess energy needs to be stored; otherwise, energy waste can occur, which can negatively affect the system’s cost-effectiveness and stability. The excess electricity generation in the LF, CC, and PS strategies was measured as 31,527 kWh, 18,674 kWh, and 10,558 kWh, respectively. Although the LF and CC strategies have larger BSS capacities than the PS, energy wastage is bigger due to the higher PV capacities.
In HRESs, BSSs are used to store the excess electrical energy generated by power sources and to provide the desired power when the demand is high. The appropriate size of the BSSs can increase the technical and economic viability of the system [21,57]. One of the most important factors affecting BSS lifetime is the number of charge–discharge cycles per year. This reduces the lifetime of the BSS [58]. Battery input and output energies for the deployment strategies are given in Figure 9.
While a 12 kWh BSS is used in the PS, 54 kWh and 33 kWh BSSs are used in the LF and CC strategies, respectively. The PS has the smallest BSS size, which has a significant effect on the cost reduction.
The power output curves for the LF, CC, and PS are given in Figure 10. BGG consumed 10,594 kg of fuel in the PS and produced 22,817 kWh of energy by operating for 2853 hrs/yr. The PS is followed by the CC strategy with 2541 hrs/yr of operation and 9111 kg of fuel consumption per year, producing 19,523 kWh of energy. In the LF strategy, the BGG worked 1854 hrs/yr, consumed 4962 kg of fuel, and produced 10,085 kWh of energy. These values show that BGG produces more energy by working harder in the PS.
When the BGG power output curves of the dispatch strategies are analyzed, it is seen that the BGG generates energy intensively throughout the year in the PS and CC strategies. In the LF strategy, it is seen that it works intensively for between 18 and 24 h when there is no PV generation, especially in the summer months. Since energy generation from PV panels is primarily preferred during daytime hours, the operating time of the BGG decreases. Still, compared to the other two strategies, this strategy provides the highest energy production throughout the year. Since higher capacity PV and BSS are used in LF, the energy production with the BGG is less than that of the other two strategies.
July 2 (24 h) was chosen to verify the balance between the electricity generation and consumption of the system’s HRES components according to the strategies. Figure 11, Figure 12 and Figure 13 show a 24 h time series of electricity generation and consumption for the strategies.
In the LF strategy shown in Figure 11, between 00:00 and 04:00, the load is fed only by the BSS. From 04:00 onwards, the BGG and some of the PV cells are also activated. From 06:00 until 16:00, the demanded load is fully supplied by PV cells and WTs. After 16:00, the BSS comes into operation again, and after 18:00, mainly the BGG and BSS feed the load, with the PV system out of operation.
In the CC strategy shown in Figure 12, between 00:00 and 06:00, when the BSS was able to meet the load, it fed the load, and when it could not, the BGG operated at full capacity, both feeding the load and charging the BSS. While the PV and WT systems fed the load until 15:00, the BSS was also activated from this time onwards. After 18:00, mainly the BGG and partially the BSS and WT fed the load.
In the PS shown in Figure 13, between 00:00 and 06:00 and 18:00 and 00:00, when the BSS could not fully meet the load, the BGG operated at full capacity, both feeding the load and charging the BSS. During daytime hours, the PV and WT systems both fed the load and charged the BSS. During daytime hours, when the PV and WT systems are insufficient, it is seen that the BSSs are activated again.

3.2. Economic Analysis

In addition to the technical analysis of a designed system, an economic analysis is required for the system to be economically viable. NPC and LCOE values are considered in the economic analysis of HRESs. NPC provides a comprehensive analysis of the total cost of the project. The HOMER software determines the NPC of a system by calculating the present value of all expenditures incurred and all revenues generated over its lifetime [59]. LCOE calculates the average cost of energy production over the system’s lifetime, considering capital investments, operating expenses, and maintenance costs [60]. For each strategy, the initial investment cost of the components, replacement cost, operation and maintenance (O&M) cost, recycling cost, and the total system cost calculated separately by HOMER are presented and compared in Table 4.
When the table presenting the cost summary of the system is analyzed, it is seen that the PS has the lowest NPC value at USD 130,673.91. The NPC values of LF and CC strategies are USD 152,456.89 and USD 141,892.28, respectively. The installation costs of PV panels for PS, LF, and CC strategies are 7000 USD, 21,683.76 USD, and 12,063.75 USD, respectively. The initial installation costs of the BSS for these strategies are USD 6600, USD 29,700, and USD 18,150, respectively. The most important reason for the low NPC value of PS compared to the other two strategies is that the initial costs of the BSS and PV components are considerably lower than the other strategies. In the PS, more BGG power is utilized, and thus, fewer storage units and PV panels are used.
LCOE values, another parameter considered in the economic analysis, are 0.207 USD/kWh, 0.239 USD/kWh, and 0.223 USD/kWh for PS, LF, and CC, respectively. These values show that the PS is the most economical strategy in terms of LCOE value.

3.3. Environmental Analysis

In many studies in the literature, diesel generators have been used to ensure energy security in cases where systems consisting of renewable energy sources are insufficient [51,52,53]. In this study, a BGG is used instead of diesel generators. The CO2 emissions from biogas are 26 gr CO2/kWh, which is lower than the emission value of diesel fuels (1.27 kg CO2/kWh) [54,55]. Therefore, BGGs are a better option than diesel generators for environmental protection and sustainable power generation. To demonstrate the environmental superiority of the PS, the BGG was removed and replaced with a DG in the designed system and the calculations were performed again. While the CO2 emission value of the system with the BGG was obtained as 480 kg/yr, this value increased approximately by 57 times for the system with the DG and was found to be 27,709 kg/yr. “Electricity Generation and Electricity Consumption Point Emission Factors”, which represent the amount of greenhouse gas emissions emitted per unit of gross electricity generation and per unit of electricity consumption in Turkey, are used in various fields such as carbon footprint calculations and the calculation of the amount of greenhouse gas mitigated through energy efficiency improvements. According to the calculations, an average of 0.439 tons of CO2-equivalent greenhouse gas emissions are emitted per 1 MWh of gross electricity generation in Turkey [61]. The values obtained for the PS show that the proposed system is not only technically and economically superior but also environmentally superior.

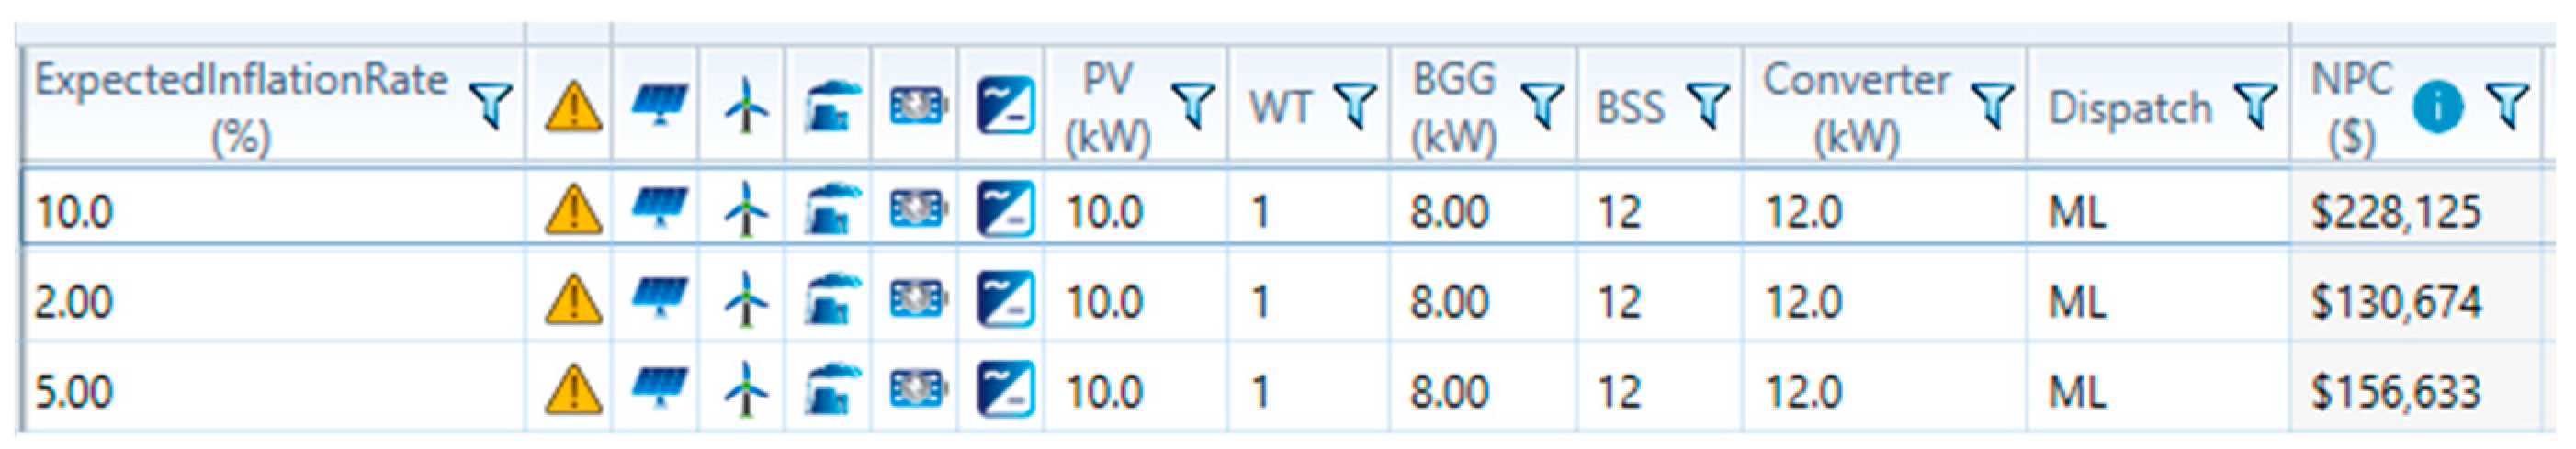
3.4. Sensitivity Analysis

A sensitivity analysis is a study used to assess the robustness and reliability of a proposed hybrid energy system under changing conditions. By examining the effects of changes in key parameters on the system performance, potential risks are identified and the viability of the system under various scenarios is guaranteed. The effect of PV and WT systems on NPC and LCOE depending on the change in solar radiation and wind speed is given in Table 5.
Table 5 shows four different scenarios. In the first scenario, solar radiation and wind speed are low, while both are high in the third scenario. In the second scenario, irradiance is low while wind speed is high, and in the fourth scenario, irradiance is high while wind speed is low. The cost of the third scenario is more favorable than the others. The reason for this is that the production of BGG decreases due to the high production in PV and WT systems, which leads to a decrease in costs. In the first scenario, the O&M and conversion costs of BGG are 39,506USD and 20,005USD, respectively, while in the third scenario, these values decrease to 21,666USD and 9152USD respectively. All these evaluations show that the changes in the amount of energy generated in PV and WT systems affect the amount of energy generated by the BGG and, indirectly, the cost of the system.
In the second sensitivity analysis, the effect of the change in the fuel cost of BGG on the system cost is analyzed. System costs were calculated by considering a case where the fuel used in the BGG is produced from existing biomass resources (USD 0) and a case where it is purchased (USD 1). It was observed that the NPC and LCOE values of the system increased by approximately two times if the fuel price was USD 1
In another sensitivity analysis, the effect of changes in inflation on system cost was analyzed. Figure 14 shows that the system’s NPC value will increase with the increase in the annual inflation rate.

4. Conclusions

In this study, an off-grid HRES consisting of the existing RESs in the region is designed for Doğanevler village of Bingöl province using the HOMER program. A new dispatch strategy is proposed for the HRES consisting of PV, WT, BGG, and BSS components, which is different from the existing LF and CC dispatch strategies proposed by HOMER, and technical, economic, and environmental analyses are performed for these three strategies and the results are compared.
As a result of the technical analysis, the capacity values and energy production amounts of the HRES’s components differed according to each strategy. The annual energy generated from PV panels for the PS, LF, and CC strategies was 16,205 kWh (26.2%), 50,196 kWh (60.3%), and 27,927 kWh (39.7%), respectively. The annual amounts of energy produced by the BGG were calculated as 22,817 kWh (36.8%), 10,085 kWh (12.1%), and 19,523 kWh (27.7%) for the PS, LF, and CC, respectively, while the amounts of energy produced from WT were equal for all three strategies (22,927 kWh/yr). These values show that the PS has a more balanced production regarding resources (PV: 26.2%-BGG: 36.8%, WT: 37%).
The economic analysis of the designed system was also performed, and NPC and LCOE values were calculated for all three strategies. The NPC values for PS, LF, and CC strategies are calculated as USD 130,673.91, USD 152,456.89, and USD 141,892.27, respectively. LCOE values were obtained as 0.207 USD/kWh for PS, 0.257 USD/kWh for the LF strategy, and 0.240 USD/kWh for the CC strategy. The installation costs of PV panels for the PS, LF, and CC strategies are 7000 USD, 21,683.76 USD, and 12,063.75 USD, respectively. The initial installation costs of the BSS for these strategies are USD 6600, USD 29,700, and USD 18,150, respectively. The PS was shown to have the most economical value for both values.
The emission values were analyzed by considering a case where the proposed system is designed with a DG instead of a BGG. The emission value of the system with a DG (27,709 kg/yr) is approximately 57 times higher than the emission value of the system with BGG (480 kg/yr).
Finally, a sensitivity analysis was performed for the availably of renewable resources, fuel cost, and different inflation rates. It has been shown that system costs are significantly affected by solar radiation and wind speed changes affecting PV, WT, and, indirectly, BGG production. Moreover, the increase in the fuel cost of BGG and changes in the annual inflation rate significantly increased the system’s total cost.
These results demonstrate the technical, economic, and environmental superiority of the proposed strategy for the created HRES. This study intends to encourage the design of HRESs utilizing the potential energy resources of other rural areas and contribute to developing new strategies.

Author Contributions

Conceptualization and methodology, M.A.K.; data curation, M.A.K. and D.Ö.; formal analysis, B.Y.; writing—review and editing, M.A.K., D.Ö. and B.Y.; visualization, M.A.K.; writing—review and editing and design, M.A.K., D.Ö. and B.Y. All authors have read and agreed to the published version of the manuscript.

Funding

This research received no external funding.

Institutional Review Board Statement

Not applicable.

Informed Consent Statement

Not applicable.

Data Availability Statement

The data could be provided after request to authors.

Conflicts of Interest

The authors declare no conflicts of interest.

References

  1. Jain, A.K.; Barua, A.; Mishra, P.K. Optimal design and development of a microgrid for off-grid rural communities. Int. J. Inf. Technol. 2024, 16, 2229–2239. [Google Scholar] [CrossRef]
  2. Available online: https://www.iea.org/reports/world-energy-outlook-2023/overview-and-key-findings (accessed on 21 August 2024).
  3. Chiari, L.; Zecca, A. Constraints of fossil fuels depletion on global warming projections. Energy Policy 2011, 39, 5026–5034. [Google Scholar] [CrossRef]
  4. Levitan, O.; Dinamarca, J.; Hochman, G.; Falkowski, P.G. Diatoms: A fossil fuel of the future. Trends Biotechnol. 2014, 32, 117–124. [Google Scholar] [CrossRef]
  5. Halkos, G.E.; Gkampoura, E.-C. Reviewing usage, potentials, and limitations of renewable energy sources. Energies 2020, 13, 2906. [Google Scholar] [CrossRef]
  6. Zia, M.F.; Elbouchikhi, E.; Benbouzid, M. Microgrids energy management systems: A critical review on methods, so-lutions, and prospects. Appl. Energy 2018, 222, 1033–1055. [Google Scholar] [CrossRef]
  7. Parhizi, S.; Lotfi, H.; Khodaei, A.; Bahramirad, S. State of the art in research on microgrids: A review. IEEE Access 2015, 3, 890–925. [Google Scholar] [CrossRef]
  8. Tazvinga, H.; Dzobo, O. Feasibility Study of a Solar-Biogas System for Off-Grid Applications. In Proceedings of the 2019 9th International Conference on Power and Energy Systems (ICPES), Perth, WA, Australia, 10–12 December 2019; IEEE: Piscataway, NJ, USA, 2019; pp. 1–5. [Google Scholar]
  9. Ashraful Islam, M.; Naushad Ali, M.M.; Mollick, T.; Islam, A.; Benitez, I.B.; Sidi Habib, S.; Al Mansur, A.; Shahadat Hossain Lipu, M.; Flah, A.; Kanan, M. Assessing the feasibility and quality performance of a renewable Energy-Based hybrid microgrid for electrification of remote communities. Energy Convers. Manag. X 2024, 23, 100674. [Google Scholar] [CrossRef]
  10. Erdal, S.; Aydın, E.; Andiç, C. Design of a Stand-Alone Hybrid Solar/Wind/Batt ery/D iesel Microgrid for a Wastewater Treatment Plant in İzmir Using HOMER Pro Software. Turk. J. Electr. Power Energy Syst. 2024, 4, 26–39. [Google Scholar]
  11. Roy, P.; He, J.; Zhao, T.; Singh, Y.V. Recent advances of wind-solar hybrid renewable energy systems for power gener-ation: A review. IEEE Open J. Ind. Electron. Soc. 2022, 3, 81–104. [Google Scholar] [CrossRef]
  12. Rekioua, D.; Rekioua, D. Hybrid renewable energy systems overview. In Hybrid Renewable Energy Systems: Optimization and Power Management Control; Springer: Cham, Switzerland, 2020; pp. 1–37. [Google Scholar]
  13. Murty, V.V.; Kumar, A. Optimal energy management and techno-economic analysis in microgrid with hybrid renewable energy sources. J. Mod. Power Syst. Clean Energy 2020, 8, 929–940. [Google Scholar] [CrossRef]
  14. El-Maaroufi, A.; Daoudi, M.; Ahl Laamara, R. Techno-economic analysis of a PV/WT/biomass off-grid hybrid power system for rural electrification in northern Morocco using HOMER. Renew. Energy 2024, 231, 120904. [Google Scholar] [CrossRef]
  15. Nadeem, T.B.; Ahmed, A.; Saad, M.; Naqvi, A.A. Design and optimization of off-grid solar PV and biomass-based hybrid renewable energy system (HRES) for electrification of a rural community in Tharparkar, Pakistan. Environ. Dev. Sustain. 2024. [Google Scholar] [CrossRef]
  16. Khalil, H.; Abd El-Hamied, R. Comparative Analysis and Assessment of Economic Profitability of a Hybrid Renewable Energy Framework via HOMER Optimization in Jordan. Int. J. Heat Technol. 2024, 42, 933–948. [Google Scholar] [CrossRef]
  17. Santos, L.H.S.; Silva, J.A.A.; López, J.C.; Arias, N.B.; Rider, M.J.; Da Silva, L.C.P. Integrated optimal sizing and dispatch strategy for microgrids using HOMER Pro. In Proceedings of the 2021 IEEE PES Innovative Smart Grid Technologies Conference—Latin America (ISGT Latin America), Lima, Peru, 15–17 September 2021; IEEE: Piscataway, NJ, USA, 2021; pp. 1–5. [Google Scholar]
  18. Miah, M.S.; Swazal, M.A.M.; Mittro, S.; Islam, M.M. Design of a grid-tied solar plant using homer pro and an optimal home energy management system. In Proceedings of the 2020 IEEE International Conference for Innovation in Technology (INOCON), Bangluru, India, 6–8 November 2020; IEEE: Piscataway, NJ, USA, 2020; pp. 1–7. [Google Scholar]
  19. Toopshekan, A.; Yousefi, H.; Astaraei, F.R. Technical, economic, and performance analysis of a hybrid energy system using a novel dispatch strategy. Energy 2020, 213, 118850. [Google Scholar] [CrossRef]
  20. Yazhini, K.; Aarthi, N. Optimal Sizing of Rural Microgrid using HOMER Pro Software. In Proceedings of the 2022 IEEE 7th International Conference on Recent Advances and Innovations in Engineering (ICRAIE), Mangalore, India, 1–3 December 2022; IEEE: Piscataway, NJ, USA, 2022; pp. 455–460. [Google Scholar]
  21. Aziz, A.S.; Tajuddin, M.F.N.; Hussain, M.K.; Adzman, M.R.; Ghazali, N.H.; Ramli, M.A.M.; Khalil Zidane, T.E. A new optimization strategy for wind/diesel/battery hybrid energy system. Energy 2022, 239, 122458. [Google Scholar] [CrossRef]
  22. Ishraque, M.F.; Rahman, A.; Shezan, S.A.; Shafiullah, G. Operation and assessment of a microgrid for maldives: Islanded and grid-tied mode. Sustainability 2022, 14, 15504. [Google Scholar] [CrossRef]
  23. Melit, A.; Chekired, F.; Meflah, A. Optimal Sizing of a Hybrid Microgrid System in a Mediterranean Climate. In Proceedings of the 2023 14th International Renewable Energy Congress (IREC), Sousse, Tunisia, 16–18 December 2023; IEEE: Piscataway, NJ, USA, 2023; pp. 1–5. [Google Scholar]
  24. Chebabhi, A.; Tegani, I.; Benhamadouche, A.D.; Kraa, O. Optimal design and sizing of renewable energies in microgrids based on financial considerations a case study of Biskra, Algeria. Energy Convers. Manag. 2023, 291, 117270. [Google Scholar] [CrossRef]
  25. Merino, C.; Castro, R. Optimization of a Hybrid Solar–Wind Microgrid for Sustainable Development: A Case Study in Antofagasta, Chile. Sustainability 2024, 16, 3668. [Google Scholar] [CrossRef]
  26. Yadav, S.; Kumar, P.; Kumar, A. Techno-economic assessment of hybrid renewable energy system with multi energy storage system using HOMER. Energy 2024, 297, 131231. [Google Scholar] [CrossRef]
  27. Odekunle, O.; Asare, T.; Beem, H.R. Feasibility study of a PV/biogas/grid system for the Micro-grid supply at Ashesi University. In Proceedings of the IEEE Green Energy and Systems Conference (IGESC), Long Beach, CA, USA, 13–14 November 2023; IEEE: Piscataway, NJ, USA, 2023; pp. 1–6. [Google Scholar]
  28. Maleki, A.; Khajeh, M.G.; Rosen, M.A. Two heuristic approaches for the optimization of grid-connected hybrid solar–hydrogen systems to supply residential thermal and electrical loads. Sustain. Cities Soc. 2017, 34, 278–292. [Google Scholar] [CrossRef]
  29. Khan, M.U.; Hassan, M.; Nawaz, M.H.; Ali, M.; Wazir, R. Techno-economic Analysis of PV/wind/biomass/biogas hybrid system for remote area electrification of Southern Punjab (Multan), Pakistan using HOMER Pro. In Proceedings of the 2018 International Conference on Power Generation Systems and Renewable Energy Technologies (PGSRET), Islamabad, Pakistan, 10–12 September 2018; IEEE: Piscataway, NJ, USA, 2018; pp. 1–6. [Google Scholar]
  30. Hosseinalizadeh, R.; Shakouri, H.; Amalnick, M.S.; Taghipour, P. Economic sizing of a hybrid (PV–WT–FC) renewable energy system (HRES) for stand-alone usages by an optimization-simulation model: Case study of Iran. Renew. Sustain. Energy Rev. 2016, 54, 139–150. [Google Scholar] [CrossRef]
  31. Lata-García, J.; Jurado, F.; Fernández-Ramírez, L.M.; Sánchez-Sainz, H. Optimal hydrokinetic turbine location and techno-economic analysis of a hybrid system based on photovoltaic/hydrokinetic/hydrogen/battery. Energy 2018, 159, 611–620. [Google Scholar] [CrossRef]
  32. Luta, D.N.; Raji, A.K. Optimal sizing of hybrid fuel cell-supercapacitor storage system for off-grid renewable applications. Energy 2019, 166, 530–540. [Google Scholar] [CrossRef]
  33. Atik, I.; Sekin, A. Hibrit yenilenebilir enerji sistem tasarımı: Balıkesir örneği. Dicle Üniversitesi Mühendislik Fakültesi Mühendislik Derg. 2022, 13, 517–529. [Google Scholar] [CrossRef]
  34. Chowdhury, S.; Hossan, A.; Semel, S.A.; Zhou, M. Hydrogen Energy Storage Based Biogas Power Plant in Bangladesh: Design and Optimal Cost Analysis. In Proceedings of the 2022 10th International Conference on Smart Grid (icSmartGrid), Istanbul, Turkey, 27–29 June 2022; IEEE: Piscataway, NJ, USA, 2022; pp. 35–39. [Google Scholar]
  35. Yimen, N.; Monkam, L.; Tcheukam-Toko, D.; Musa, B.; Abang, R.; Fombe, L.F.; Abbasoglu, S.; Dagbasi, M. Optimal design and sensitivity analysis of distributed biomass-based hybrid renewable energy systems for rural electrification: Case study of different photovoltaic/wind/battery-integrated options in Babadam, northern Cameroon. IET Renew. Power Gener. 2022, 16, 2939–2956. [Google Scholar] [CrossRef]
  36. Das, B.K.; Al-Abdeli, Y.M. Optimisation of stand-alone hybrid CHP systems meeting electric and heating loads. Energy Convers. Manag. 2017, 153, 391–408. [Google Scholar] [CrossRef]
  37. Shah, K.K.; Mundada, A.S.; Pearce, J.M. Performance of US hybrid distributed energy systems: Solar photovoltaic, battery and combined heat and power. Energy Convers. Manag. 2015, 105, 71–80. [Google Scholar] [CrossRef]
  38. Li, C.; Zhou, D.; Wang, H.; Lu, Y.; Li, D. Techno-economic performance study of stand-alone wind/diesel/battery hybrid system with different battery technologies in the cold region of China. Energy 2020, 192, 116702. [Google Scholar] [CrossRef]
  39. Ma, T.; Javed, M.S. Integrated sizing of hybrid PV-wind-battery system for remote island considering the saturation of each renewable energy resource. Energy Convers. Manag. 2019, 182, 178–190. [Google Scholar] [CrossRef]
  40. Nouh, A.; Khatab, M.F. Partitioning Street Lights Load on Grid-Photovoltaic System as an Alternative Solution for Illuminating Al-Bayda City Roads. In Proceedings of the 2020 11th International Renewable Energy Congress (IREC), Hammamet, Tunisia, 29–31 October 2020; IEEE: Piscataway, NJ, USA, 2020; pp. 1–6. [Google Scholar]
  41. Qhadafhi, M.; Raharjo, J.; Adam, K.B. Implementation of Home Energy Management System for Indonesia Homes with Hybrid Power Plant. In Proceedings of the 2023 4th International Conference on High Voltage Engineering and Power Systems (ICHVEPS), Denpasar Bali, Indonesia, 6–10 August 2023; IEEE: Piscataway, NJ, USA, 2023; pp. 118–122. [Google Scholar]
  42. Alghamdi, A.H.S. Technical and Economic Analysis of Solar Energy Application for a Hospital Building in Dammam, Saudi Arabia. Master’s Thesis, Auckland University of Technology, Auckland, New Zealand, 2019. [Google Scholar]
  43. Ammari, C.; Belatrache, D.; Makhloufi, S.; Saifi, N. Techno-economic analysis of a stand-alone photovoltaic system with three different storage systems for feeding isolated houses in south Algeria. Energy Storage 2021, 3, e211. [Google Scholar] [CrossRef]
  44. Aziz, A.S.; Tajuddin, M.F.N.; Zidane, T.E.K.; Su, C.-L.; Alrubaie, A.J.K.; Alwazzan, M.J. Techno-economic and environ-mental evaluation of PV/diesel/battery hybrid energy system using improved dispatch strategy. Energy Rep. 2022, 8, 6794–6814. [Google Scholar] [CrossRef]
  45. Available online: https://homerenergy.com/pdf/HOMERHelpManual.pdf (accessed on 21 February 2024).
  46. Available online: https://sel.me.wisc.edu/trnsys/weather/tmy2data.htm (accessed on 22 August 2024).
  47. Bhatt, A.; Sharma, M.P.; Saini, R.P. Feasibility and sensitivity analysis of an off-grid micro hydro–photovoltaic–biomass and biogas–diesel–battery hybrid energy system for a remote area in Uttarakhand state, India. Renew. Sustain. Energy Rev. 2016, 61, 53–69. [Google Scholar] [CrossRef]
  48. Razmi, D.; Lu, T. A literature review of the control challenges of distributed energy resources based on microgrids (MGs): Past, present and future. Energies 2022, 15, 4676. [Google Scholar] [CrossRef]
  49. Khare, V.; Nema, S.; Baredar, P. Solar–wind hybrid renewable energy system: A review. Renew. Sustain. Energy Rev. 2016, 58, 23–33. [Google Scholar] [CrossRef]
  50. Peng, C.-Y.; Kuo, C.-C.; Tsai, C.-T. Optimal configuration with capacity analysis of PV-plus-BESS for behind-the-meter application. Appl. Sci. 2021, 11, 7851. [Google Scholar] [CrossRef]
  51. Liu, G.; Li, M.; Zhou, B.; Chen, Y.; Liao, S. General indicator for techno-economic assessment of renewable energy resources. Energy Convers. Manag. 2018, 156, 416–426. [Google Scholar] [CrossRef]
  52. Mudgal, V.; Reddy, K.; Mallick, T. Techno-economic analysis of standalone solar photovolta-ic-wind-biogas hybrid renewable energy system for community energy requirement. Future Cities Environ. 2019, 5, 11. [Google Scholar] [CrossRef]
  53. Ibrahim, M.M.; Mostafa, N.H.; Osman, A.H.; Hesham, A. Performance analysis of a stand-alone hybrid energy system for desalination unit in Egypt. Energy Convers. Manag. 2020, 215, 112941. [Google Scholar] [CrossRef]
  54. Alqahtani, N.; Balta-Ozkan, N. Assessment of rooftop solar power generation to meet residential loads in the city of neom, Saudi Arabia. Energies 2021, 14, 3805. [Google Scholar] [CrossRef]
  55. Irigoyen Tineo, A. Energy Management System Benchmarking for a Remote Microgrid; UC3M: Getafe, Spain, 2017. [Google Scholar]
  56. Available online: https://data.mendeley.com/datasets/f39n2kpk79/1 (accessed on 15 July 2024).
  57. Abdulgalil, M.A.; Khalid, M.; Alismail, F. Optimal sizing of battery energy storage for a grid-connected microgrid subjected to wind uncertainties. Energies 2019, 12, 2412. [Google Scholar] [CrossRef]
  58. Aziz, A.S.; Tajuddin, M.F.N.; Adzman, M.R.; Ramli, M.A.; Mekhilef, S. Energy management and optimization of a PV/diesel/battery hybrid energy system using a combined dispatch strategy. Sustainability 2019, 11, 683. [Google Scholar] [CrossRef]
  59. Ennemiri, N.; Berrada, A.; Emrani, A.; Abdelmajid, J.; El Mrabet, R. Optimization of an off-grid PV/biogas/battery hybrid energy system for electrification: A case study in a commercial platform in Morocco. Energy Convers. Manag. X 2024, 21, 100508. [Google Scholar] [CrossRef]
  60. Gökçek, M.; Kale, C. Techno-economical evaluation of a hydrogen refuelling station powered by Wind-PV hybrid power system: A case study for İzmir-Çeşme. Int. J. Hydrogen Energy 2018, 43, 10615–10625. [Google Scholar] [CrossRef]
  61. Available online: https://enerji.gov.tr/evced-cevre-ve-iklim-elektrik-uretim-tuketim-emisyon-faktorleri (accessed on 24 August 2024).
Figure 1. Schematic of hybrid system.
Sustainability 16 07490 g001
Figure 2. Average monthly electricity load profile.
Sustainability 16 07490 g002
Figure 3. Hourly load profile.
Sustainability 16 07490 g003
Figure 4. Monthly average solar radiation and clarity index.
Sustainability 16 07490 g004
Figure 5. Average monthly wind speed.
Sustainability 16 07490 g005
Figure 6. Biomass technical potential.
Sustainability 16 07490 g006
Figure 7. Proposed dispatch strategy.
Sustainability 16 07490 g007
Figure 8. Generation amount of HRES sources: (a) LF; (b) CC; (c) PS.
Sustainability 16 07490 g008
Figure 9. BSS input–output energies for dispatch strategies.
Sustainability 16 07490 g009
Figure 10. BGG curves for dispatch strategies: (a) LF; (b) CC; (c) PS.
Sustainability 16 07490 g010
Figure 11. The annual time series of electricity generation and consumption is used for the LF dispatch strategy.
Sustainability 16 07490 g011
Figure 12. Annual time series of electricity generation and consumption for the CC dispatch strategy.
Sustainability 16 07490 g012
Figure 13. Annual time series of electricity generation and consumption for the PS dispatch strategy.
Sustainability 16 07490 g013
Figure 14. Impact of different inflation rates on NPC.
Sustainability 16 07490 g014
Table 1. Different studies on HRESs.
HRESGridStorageSoftwarePerformance Parameters
PV/WT [25]On-grid-HOMERNPC, LCOE
PV/WT/FC [26]Off-gridBSS/HTHOMERNPC, LCOE, Capacity,
PV/BGG [27]On-gridBSSHOMERNPC, LCOE
PV/FC [28]On-gridBSSPSOAIW-PSOCFNPC, LCOE
PV/WT/BGG [29]Off-gridBSSHOMERNPC, LCOE
PV/WT/FC [30]Off-gridBSS/HT-LCOE
PV/Hydrokinetic/FC [31]Off-gridBSS/HTHOMERNPC, LCOE, Capacity, Shortage
PV/FC [32]Off-gridHT/Super CapacitorsHOMERNPC, LCOE
PV/WT [33]On-grid
Off-grid
BSSHOMERNPC, LCOE
BGG [34]Off-gridHTHOMERHydrogen (H2)
PV/WT/BGG [35]Off-gridBSSHOMERLCOE
PV/ICE, PV/MGT [36]Off-gridBSSMATLAB-Genetic AlgorithmLCOE, ηCHP
PV/CHP [37]Off-gridBSSHOMERTechnic
WT/DG [38]Off-gridBSSHOMERLCOE, NPC, RF, CO2
PV/WT [39]Off-gridBSSMATLAB (Simulink)LCOE, LPSP
PV [40]On-gridBSSHOMER-MATLAB (Simulink)Technic -LCOE
PV [41]On-gridBSSHOMER-MLNPC, LCOE
PV/DG [42]On-grid-HOMER-MLNPC, LCOE
PV [43]Off-gridBSS-HTHOMER-MATLAB (Simulink)NPC
Table 2. Unit cost values of HRES components.
ComponentsInstallation Cost (USD/kW)Renewal Cost (USD/kW)O&M
(USD/kW/yr)
Lifespan
(yr)
PV system7007001025
WT290,00025,0002020
BGG200012500.01/h20,000 h
Battery300/battery300/battery10/battery10
Converter300300015
Table 3. Capacity values of HRES components according to strategies.
NameProposed
Dispatch Strategy
LF
Dispatch Strategy
CC
Dispatch Strategy
WT (kW)101010
PV (kW)103117.2
BGG (kW)888
BSS (kWh)125433
Converter (kW)121311.2
Table 4. Detailed cost analysis of LF, CC, and PS.
Dispatch StrategyBGG BSSWTPVConv.System
Initial
Capital
(USD)
PS16,000660029,0007000360062,200
LF16,00029,70029,00021,683.763890.41100,274.17
CC16,00018,15029,00012,063.753371.9678,585.72
Replacement
(USD)
PS14,191.3919,250.647970.1801527.3942,939.59
LF8311.4012,681.717970.1801650.6030,613.89
CC13,036.8516,479.237970.1801430.6338,916.90
O&M
(USD)
PS29,505.761551.30129.281292.75032,479.09
LF19,174.096980.86129.284004.53030,288.76
CC26,279.064266.08129.282227.92032,902.33
Salvage
(USD)
PS1039.081126.514491.710287.476944.71
LF1634.982282.584491.710310.668719.94
CC1973.361778.344491.710269.268512.67
Total
(USD)
PS58,658.0726,275.4232,607.758292.754839.92130,673.91
LF41,850.5147,079.9832,607.7525,688.295230.35152,456.89
CC53,342.5537,116.9732,607.7514,291.674533.34141,892.28
Table 5. Impact of renewable resource change on the economic parameters of the optimal system.
Solar irradiation (kWh/m2/day)Wind Speed
m/s
PV
(kWh)
WT
(kWh)
BGG
(kWh)
Fuel Price
(USD)
NPC
(USD)
LCOE
(USD/kWh)
1.8603.650656518,11630,560-149,2010.239
1332,618.700.533
1.8604.590656532,10923,048-130,267.800.207
1268,599.300.428
7.9104.59023,77932,10916,757-114,204.300.180
1214,777.800.340
7.9103.65023,77918,11621,758-127,281.600.203
1257,8730.411
Disclaimer/Publisher’s Note: The statements, opinions and data contained in all publications are solely those of the individual author(s) and contributor(s) and not of MDPI and/or the editor(s). MDPI and/or the editor(s) disclaim responsibility for any injury to people or property resulting from any ideas, methods, instructions or products referred to in the content.

