Article

Characteristics of Spatial–Temporal Evolution of Carbon Emissions from Land Use and Analysis of Influencing Factors in Hubao-Eyu Urban Agglomerations, China

1
School of Geography Science, Qinghai Normal University, Xining 810008, China
2
Research Institute of Forestry Policy and Information, Chinese Academy of Forestry, Beijing 100091, China
*
Author to whom correspondence should be addressed.
Sustainability 2024, 16(17), 7565; https://doi.org/10.3390/su16177565 (registering DOI)
Submission received: 24 July 2024 / Revised: 19 August 2024 / Accepted: 29 August 2024 / Published: 1 September 2024

Abstract

:
Exploring the dynamic relationship between land use change and carbon emissions is of great significance in promoting regional low-carbon sustainable development and “dual-carbon”. We reveal the characteristics of the evolution of spatial temporal patterns of land use carbon emissions at the county scale in resource-based urban agglomerations over the past 20 years and the analysis of influencing factors. The research results show that: (1) In terms of spatial and temporal characteristics, from 2000 to 2020, net carbon emissions from land use showed an overall upward trend, with construction land being the main source of increased carbon emissions; the spatial distribution pattern of carbon emissions shows a trend of further clustering of centers in the northeast-southwest direction, which mainly occurs in areas rich in coal resources; the economy-contributive coefficient is increasing, but ecological support coefficients are decreasing; (2) In the analysis of influencing factors, land use structure is the most significant factor contributing to the increase of carbon emissions, followed by economic level, while land use intensity per unit of GDP is the most significant factor inhibiting the increase of carbon emissions. The results of the study provide a useful reference for resource-based urban agglomerations to formulate regionally appropriate emission reduction strategies and realize low-carbon sustainable development.

1. Introduction

Carbon emissions are a global problem that affect the natural and ecological environment, jeopardize human health, and threaten the overall goal of sustainable development [1]. Since the industrial revolution in the 18th century, and especially over the past few decades, human activities have led to a steady increase in carbon emissions, which has become the main cause of global warming. For this reason, the Chinese government proposed that it would achieve a carbon peak by 2030 and carbon neutrality by 2060 at the 75th United Nations General Assembly in 2020, with the aim of realizing the “double carbon” goal. China therefore faces the double challenge of reducing carbon emissions while also ensuring economic growth [2]. Among various influencing factors, land use changes are considered to be one of the most significant factors to change carbon emissions in terrestrial ecosystems. Therefore, studies related to land use change on carbon emission and absorption have become one of the hot topics of research. Land is an essential natural resource for human beings, and land use is one of the main ways by which human activities affect the natural environment, constituting 23% of the carbon dioxide (CO2), 60% of the methane (CH4), and 23% of the nitrous oxide (N2O) emitted globally, exacerbating climate change [3]. Land use change is an important source of regional carbon emissions, accounting for approximately 1/3 of anthropogenic carbon emissions and is second only to fossil fuel combustion [4]. Research into the spatial and temporal characteristics of carbon emissions from land use and the influencing factors is of great practical significance for realizing low-carbon land use, reducing carbon emissions, and developing a low-carbon economy.
In recent years, research into the carbon emissions associated with land use change has received increasing attention from international scholars, with the mainly focus on carbon emission accounting, spatial and temporal characterization, the driving mechanisms, and forecasting [5,6,7,8]. Moreover, there are numerous studies about carbon emissions from different land use types. Some pay attention to one or two types of land use to estimate their abilities of carbon absorption or emission, for instance, forest, wetland, and agricultural land [9,10,11]. Land use carbon emission accounting methods are summarized as bottom-up and top-down, with bottom-up methods including model simulation, sample plot inventory, and remote sensing estimation and top-down methods comprising material measurement, carbon emission coefficient, and actual measurement [12,13]. Firstly, relevant studies have concluded that the spatial autocorrelation and standard deviation elliptic regression models are generally applied for spatial and temporal analysis [14]. Secondly scholars have analyzed the influencing factors and driving mechanisms and effects of land use carbon emissions to ascertain the influencing factors and predict carbon emissions using methods such as multifactor analysis, LMDI, the STIRPAT model, Laspeyes index method, the IPAT model, and the panel data regression model among others [15,16,17].
These studies have enriched the research content of land use carbon emissions on both spatial and temporal scales, driving mechanism and prediction analyses and providing a profound theoretical foundation and mature technical methods for clarifying the mechanism and effects of land use carbon emissions, and are thus of strong guiding significance for this study [18]. Therefore, our contributions are as follows: Firstly, in terms of research scale with fewer studies investigating land use emissions at the county scale, most existing studies estimated carbon emissions at relatively large spatial scales, but it leads to the neglect of smaller-scale regions’ carbon emissions fluctuating and is not beneficial to propose fine-grained and adapted emission reduction strategies. Secondly, in terms of research content, we have revealed the mechanism of land use carbon emissions from the perspective of the economic contribution coefficient or the ecological carrying capacity of the carbon sink. Finally, in terms of research objects, our research focuses on only few, exploring the resource-based urban agglomerations of the western region [19].
In 2018, the State Council formally approved the implementation of the Hubao-Eyu Urban Agglomerations Development Plan (the “Plan”), with a planning period until 2035. The Plan clearly positions the Hubao-Eyu urban agglomerations as “a national high-end energy and chemical base, a strategic pivot for opening up to the north and west, an ecological civilization cooperation and co-construction zone in the northwest, and a pioneer urban-rural integration and development zone in the ethnic areas”, which demonstrates the strategic intention of the state to promote the construction of the urban agglomerations in central and western China and also requires timely and thematic research in the academic community. Therefore, taking the Hubao-Eyu urban agglomeration as an example, we carry out a study on the decoupling relationship between land use and carbon emissions, with a view to providing a low-carbon development program for the western resource-based and agropastoral combined regions. In this study, Hubao-Eyu, a cluster of resource cities in the middle reaches of the Yellow River. We take as the research object and land use data and comprehensive socio-economic data from 2000 to 2020, which is utilized with the land use carbon emission to analyze the characteristics of the spatial and temporal evolution that are associated with the land use, carbon balance, and its drivers to suggest carbon emission reduction mechanisms [20] (Figure 1).

2. Research Methods and Data

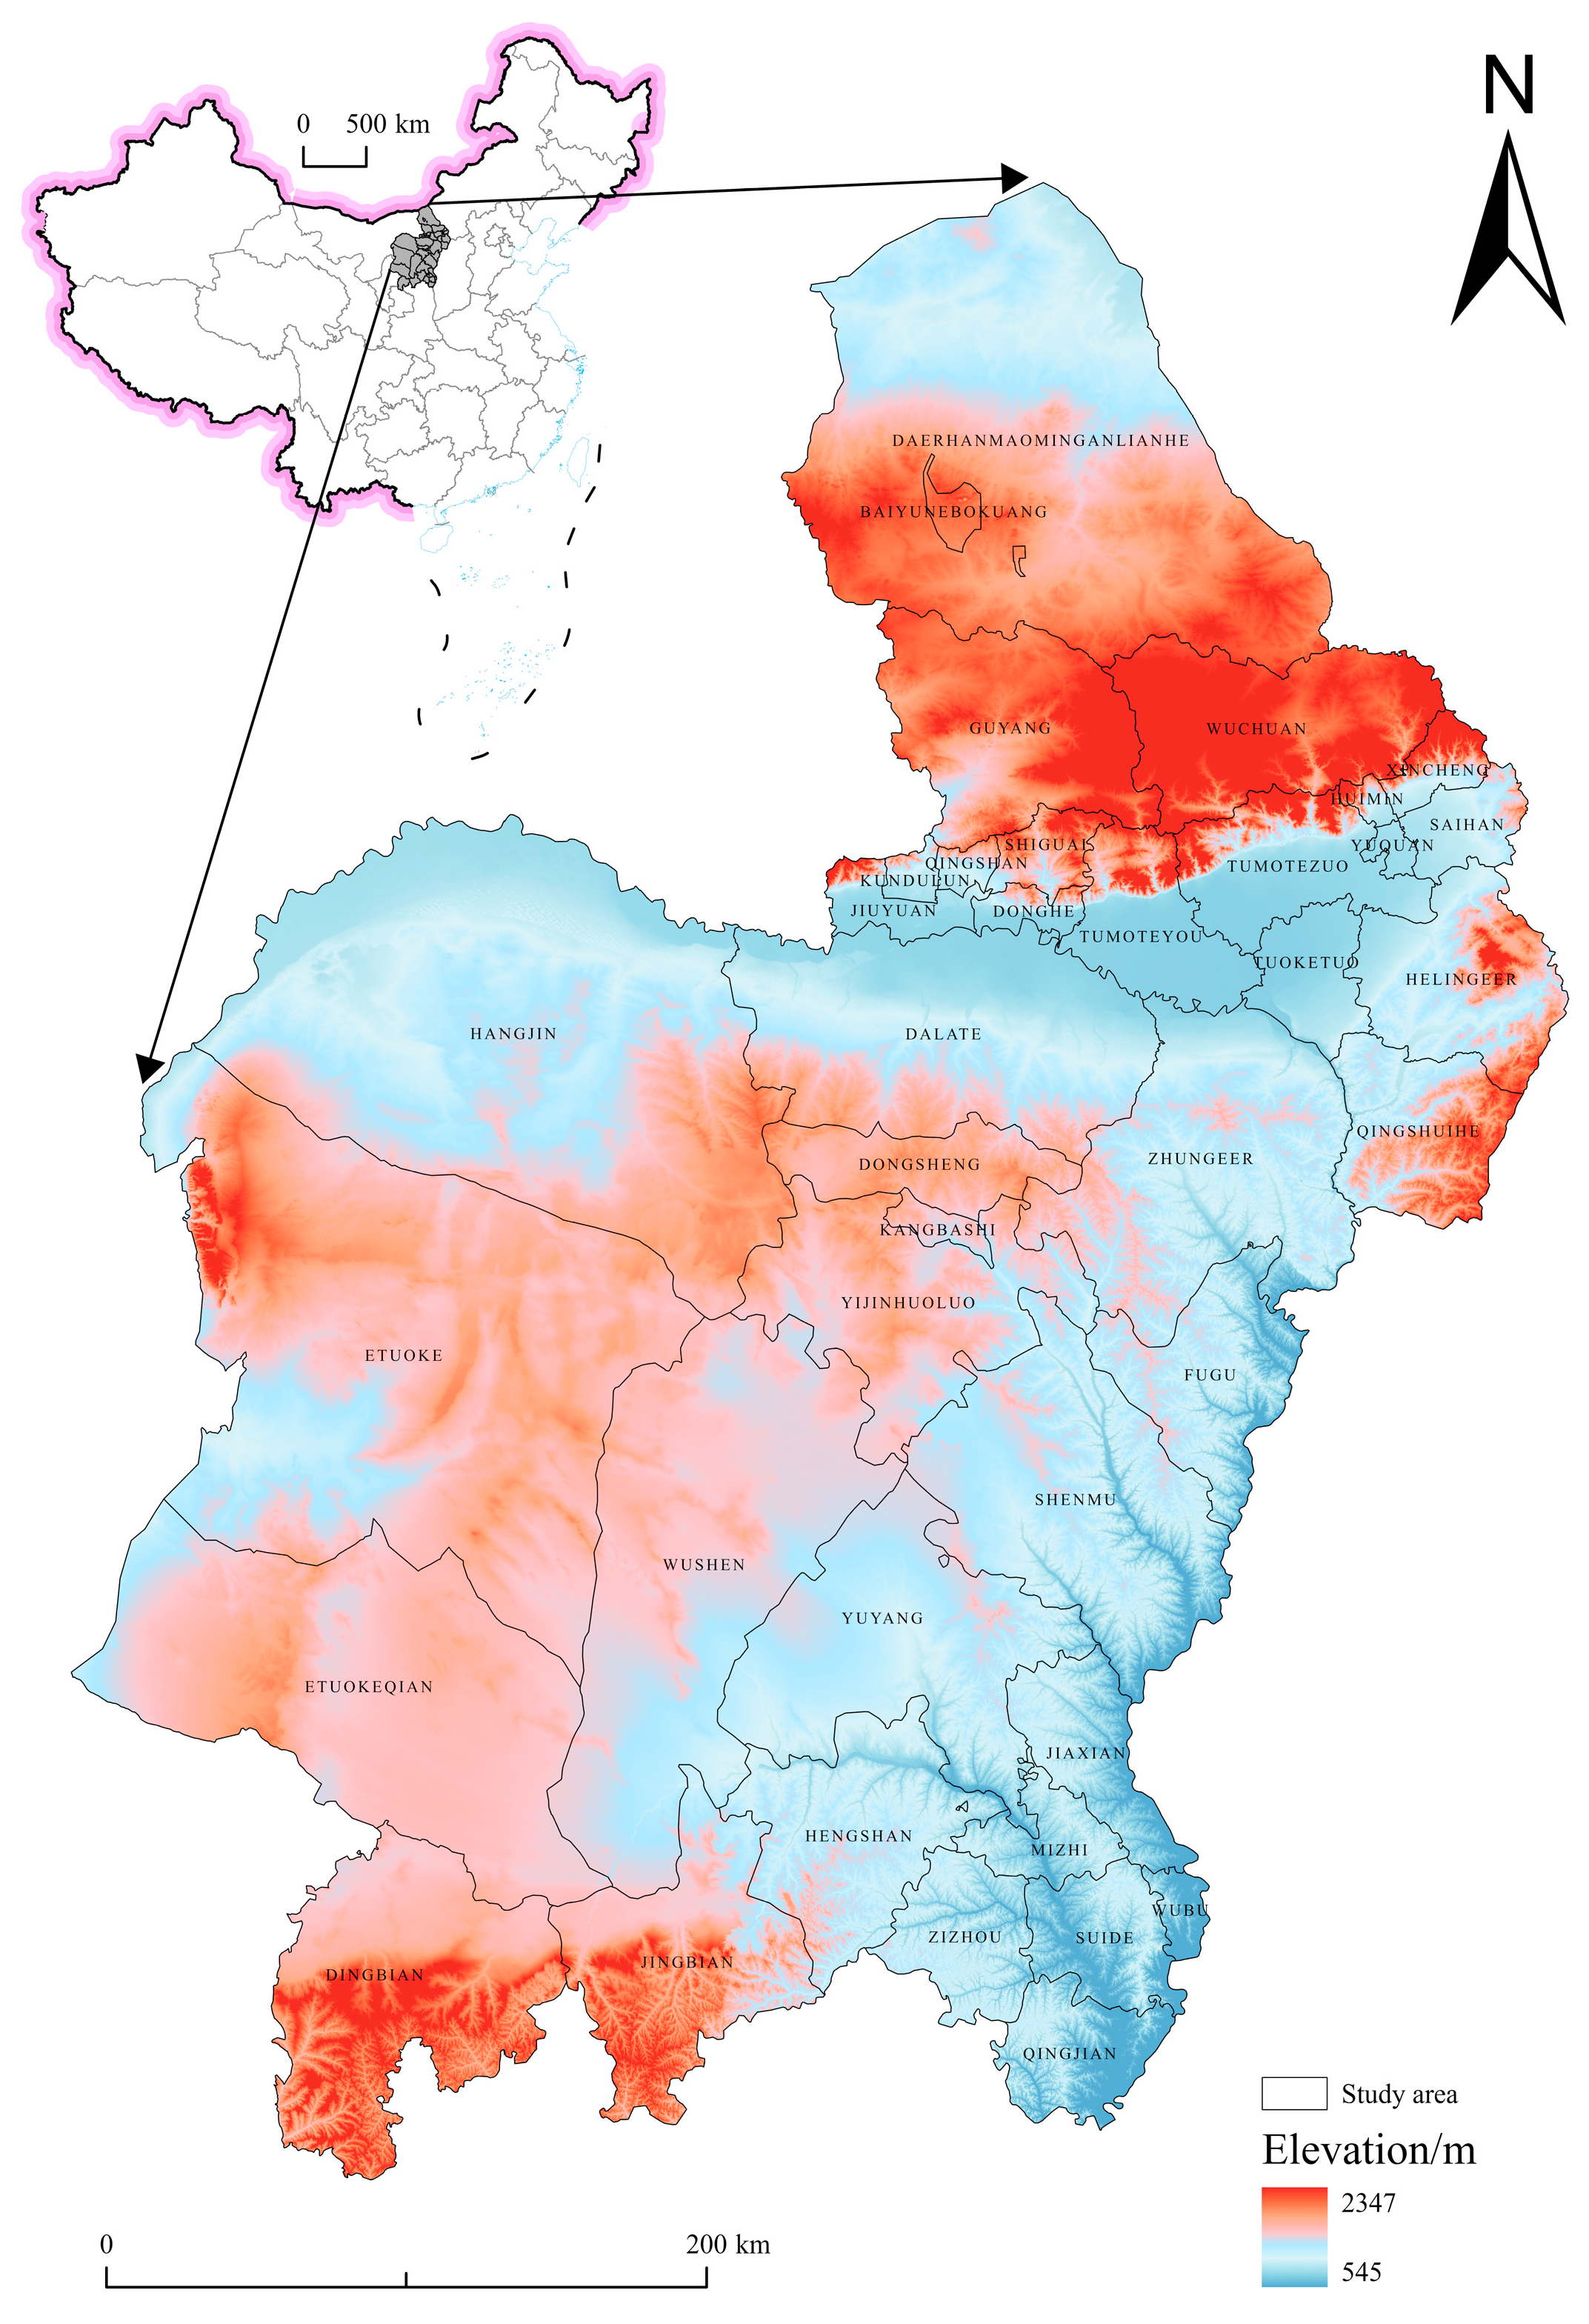
2.1. Overview of the Study Area

The Hubao-Eyu urban agglomerations is a national city cluster composed of Hohhot, Baotou, Ordos in the Inner Mongolia Autonomous Region, and Yulin in Shaanxi Province and is one of the 19 national city clusters in China’s “Two Horizontal and Three Vertical” urbanization strategy layout. As a typical area of rapid urbanization in China, the Hubao-Eyu urban agglomeration is the main center of both population and productivity in the Yellow River Basin. The city cluster covers a land area of 175,000 km2 and includes mountain ranges, plains, and sandy areas, with an average elevation of 1300 m, a temperate continental monsoon climate, a resident population of 12,004,000, and a GDP of 1.75 trillion yuan in 2021. The urban agglomeration was located in an intertwined agricultural and animal husbandry zone with fragile ecological fundamentals. Resource exploitation and urban land expansion have led to the fragmentation of the ecological land, and the local ecosystems are extremely vulnerable to damage. The transformation and upgrading of the Hubao-Eyu urban agglomeration face serious challenges under the goal of carbon neutrality [21]. The cities of Erdos and Yulin have made rapid economic progress by relying on the development of rich underground resources; however, the ecological environment is very fragile because the cities lie on the edge of the Mao Wusu Desert and are often affected by wind and sand. Hohhot and Baotou, which are located directly north of the “several” bends in the Yellow River, are increasingly becoming more arid, with potential for further desertification resulting from the arid climate and fragile ecological environment. Compared to other urban agglomerations, the uniqueness of land use carbon emissions in the Hubao-Eyu urban agglomeration lies in the fact that the carbon emissions in the region are the consumption of energy resources This is of great significance for the rational development of resources and the protection of the ecological environment [22]. The remainder of the paper is organized as follows: the methodology and data are presented in Section 2; the results are provided in Section 3; the results are discussed in Section 4, and any conclusions and recommendations are given in Section 5 (Figure 2).

2.2. Data Sources

To estimate the carbon emissions that are associated with land use changes, the extent and characteristics of the land use change first require calculation. The data used in this study include administrative boundary vectors, land use, DEM, energy consumption, and socioeconomic data. Administrative boundaries of the study area, county locations, were obtained from the National Center for Basic Geographic Information (http://www.ngcc.cn/dlxxzy/gjjcdlxxsjk/, accessed on 28 August 2024). Land use data were obtained from the Resource and Environment Science and Data Center of the Chinese Academy of Sciences (http://www.resdc.cn, accessed on 23 July 2024), with an accuracy of 30 × 30 m produced using Landsat TM/ETM remote sensing images from each period as the primary data source and reclassified into six categories using ArcGIS 10.8: cultivated land, forest, grassland, watersheds, built-up land, and unused land. Land use data describing the Hubao-Eyu urban agglomeration were obtained for 2000, 2005, 2010, 2015, and 2020 after vector data cropping DEM data from Geospatial Data Cloud (https://www.gscloud.cn/search, accessed on 23 July 2024) GDEMV3 30M resolution digital elevation data; energy consumption and socioeconomic data, such as the gross regional product, energy consumption per unit of GDP, and population, were obtained from the 2000–2020 Statistical Yearbook of Hubau-Eyu Prefecture-Level Cities (https://tjj.ordos.gov.cn/, accessed on 23 July 2024), (http://tjj.baotou.gov.cn/, accessed on 23 July 2024), (http://tjj.huhhot.gov.cn/, accessed on 23 July 2024), (https://tjj.yl.gov.cn, accessed on 28 August 2024).

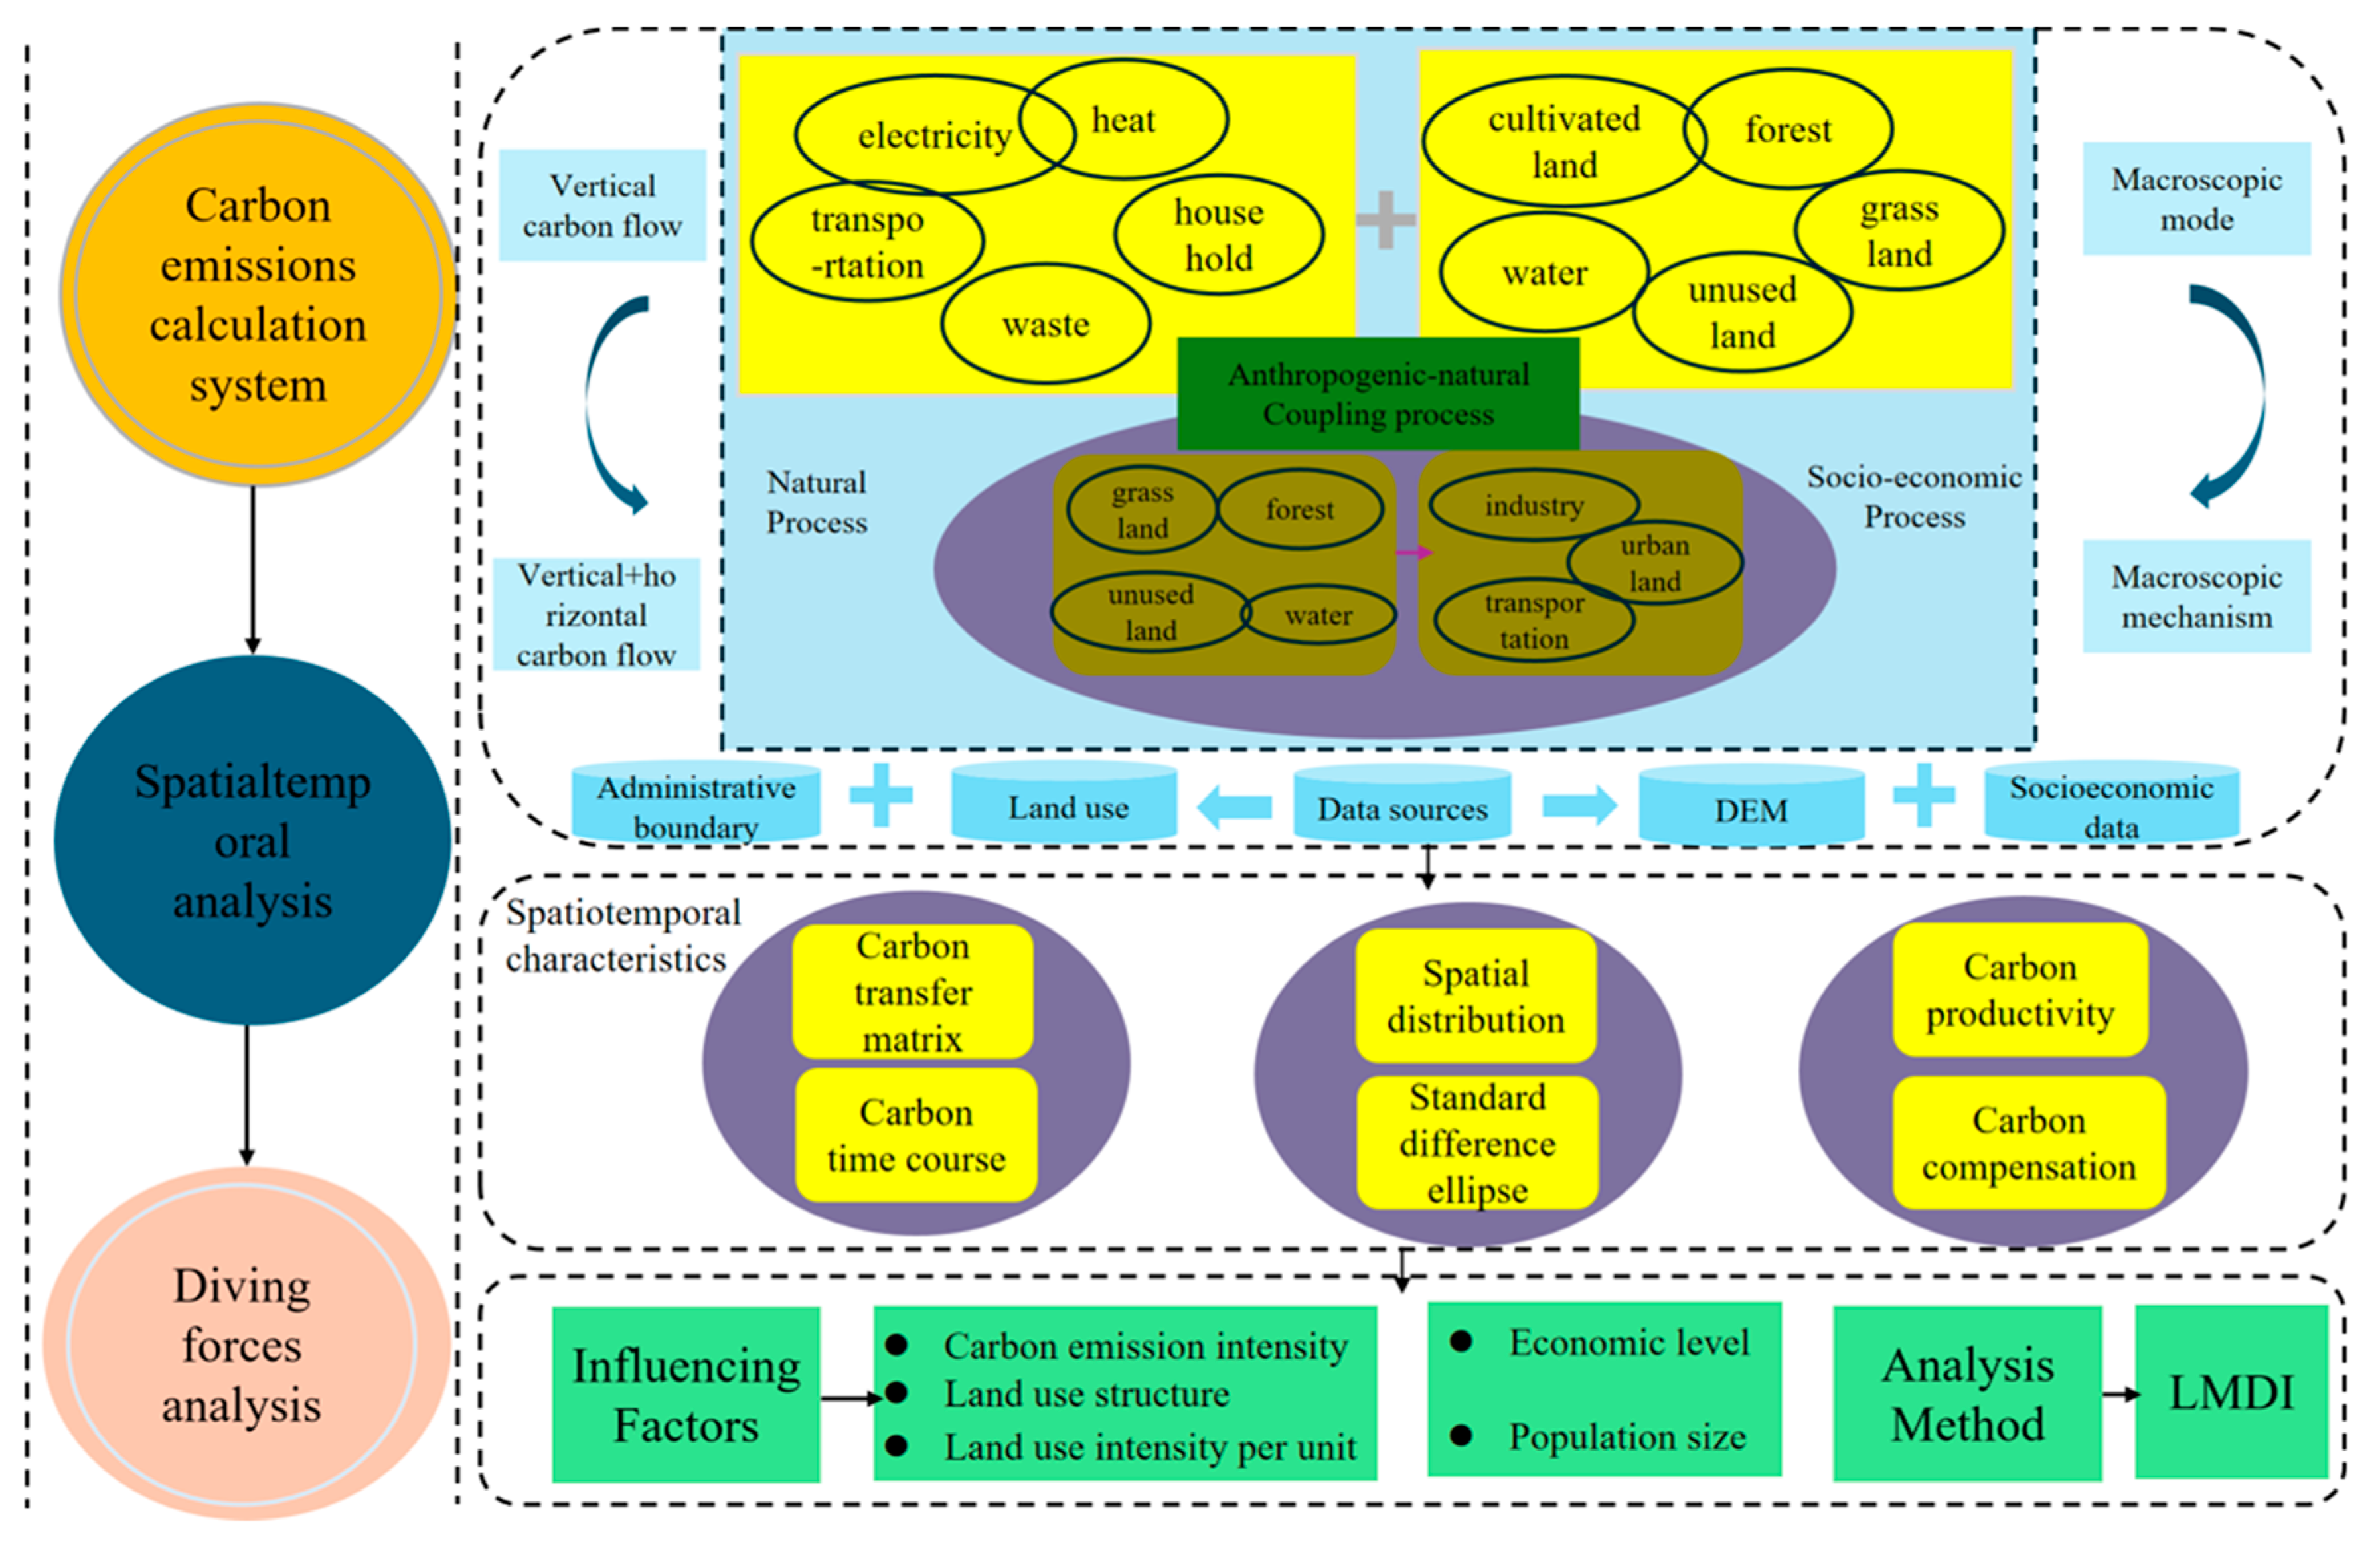
2.3. Research Methods

2.3.1. Estimation of Land Use Carbon Emissions

Land plays a dual role as both carbon source and sink, with arable land acting as both; however, the emissions tend to be larger than absorption for this type of land it is generally considered a source [23], as is cultivated land. Forest, grassland, waterland, and unused land are regarded as carbon sinks. In this study, the carbon emission coefficient method was used to estimate the direct and indirect carbon emissions from land in the Hubao-Eyu urban agglomeration.
The direct carbon emission coefficient method was used to measure the carbon emissions from cultivated, forest, grassland, water land, and unused land, with the following formula used [24]:
C E a n = C E i = A i × γ i
where C E a n is the direct carbon emissions associated with county n and district and C E i , A i , and γ i denote the carbon emission, area, and carbon emission coefficient for the i land use type. The carbon emission coefficients of different land use types were obtained based on previous studies, for which the latitude and longitude and actual geographic conditions of the study area are considered (Table 1).
Bulit-up land involves large amounts of human activity; thus, carbon emissions can be estimated indirectly from the energy consumption within an urbanized area. Referring to the existing research results [30], the carbon emissions from construction land in each county and district are estimated based on the energy consumption per unit of G D P using the following calculation formula:
C E b n = E n × β = G D P n × α n × β
where C E b n , E n , G D P n , and α n denote the indirect carbon emissions, total energy consumption, gross regional product, and the energy consumption per unit of G D P for the n county and district, respectively, and b is the carbon emission coefficient of standard coal, which is 0.67 tons of carbon/ton of standard coal (tc/tce) according to the recommendation of the Energy Research Institute of the National Development and Reform Commission. The total net carbon emissions from regional land use obtained by combining the results using the calculation formula:
C E t n = C E a n + C E b n
where C E t n , C E b n , and C E a n are the total net carbon emissions from land use, direct carbon emissions, and the indirect carbon emissions in the n county and district, respectively.

2.3.2. Land Use Transfer Matrix and Carbon Emission Transfer Matrix Construction

(1)
Land use transfer matrix
The transfer of land use types from the beginning to the end of the regional study was reflected by creating a two-dimensional matrix using the following expression [31]:
A i j = [ A 11 A 12 A 1 m A 21 A 21 A 2 m A m 1 A m 2 A m m ]
where A i j represents the area (hm2) of land type i that has been converted to land type j , and m is the number of land use types.
(2)
Land use change dynamics
A single land use dynamic attitude was used to analyze the land use changes in the Hubao-Eyu urban agglomeration using the formula:
K = U b U a U a × 1 T × 100 %
where K is a single land use statistic, U a is the initial land use data, U b is the final land use data, and T is the time period.
(3)
Land use carbon emissions transfer
The formula for calculating the amount of carbon emissions associated with a change in land use type is as follows:
C E i j = ( γ T γ 0 ) ×   A i j
where C E i j is the change in carbon emissions that results from the transformation of land type i into land type j and γ 0 and γ T are the carbon emission factors before and after the transfer of land types, respectively (with the carbon emission factor for construction land the quotient of the indirect carbon emissions and the area of built-up land).

2.3.3. Center of Gravity–Standard Deviation Elliptic

The center of gravity trajectory migration model can express the spatiotemporal migration law of geographic elements based on their weighted centers, whereas the standard deviation ellipse can reveal the direction of their spatiotemporal distribution by identifying the distribution characteristics and spreading direction of such elements [32]. Combining the two can therefore accurately reveal spatial distribution characteristics such as centrality, directionality, and the spreading of various weighting elements [33] and has been widely used in analyzing spatiotemporal pattern changes and transfer patterns at the regional scale. In this paper, the center of gravity–standard deviation ellipse method is used to investigate the spatial and temporal evolution of the carbon emissions in the Hubao-Eyu urban agglomeration, with the core parameters including the weighted center of gravity, long axis, short axis, and the azimuthal angle, among others. The formulas used are as follows:
Weighted center of gravity:
X ω ¯ = k = 1 n ω k x k k = 1 n ω k ; Y ω ¯ = k = 1 n ω k y k k = 1 n ω k
The X -axis standard deviation:
σ x = k = 1 n ( w k x k ˜ cos θ w k y k ˜ sin θ ) 2 k = 1 n w 2 k
The Y -axis standard deviation:
σ y = k = 1 n ( w k x k ˜ sin θ w k y k ˜ cos θ ) 2 k = 1 n w 2 k
Elliptic azimuth q:
tan θ = ( k = 1 n w k 2 x k ˜ 2 k = 1 n w k 2 y k ˜ 2 ) + ( k = 1 n w k 2 x k ˜ 2 k = 1 n w k 2 y k ˜ 2 ) 2 + 4 k = 1 n w k 2 x k ˜ 2 y k ˜ 2 2 k = 1 n w k 2 x k ˜ y k ˜
where ( x k , y k ) is the spatial coordinate of the research object, ω k is the weight of the net carbon emissions, and ( x k ˜ , y k ˜ ) is the coordinate deviation of each research object from the weighted center of gravity, ( X ω ¯ , Y ω ¯ ) .

2.3.4. Carbon Balance Analysis

(1)
Economy contributive coefficient
The economy contributive coefficient (ECC) was used to measure the differences in the carbon emissions in different regions from the perspective of economic efficiency, which reflects the productivity of regional carbon emissions and can evaluate the fairness of the economic contribution of emissions within a study area [34]. The ECC is calculated using the following formula:
E C C = G D P n n G D P n / C n n C n
where G D P n and n G D P n denote the G D P in county n and the whole region, respectively; C n and n C n denote the total carbon emissions of the n county and the whole region in terms of carbon source categories, respectively, with a result of >1 indicating high energy utilization efficiency and carbon productivity and a result of <1 indicating relatively low energy utilization efficiency and carbon productivity.
(2)
Ecological support coefficient
The ecological support coefficient (ESC), which is an indicator of the capacity of regional carbon sequestration within an area, can be used to measure the contribution and evaluate the equity of carbon ecological capacity contribution in the area [35]. The ESC is calculated using the formula:
E S C = C S n n C S n / C n n C n
where C S n and n C S n denote the total amount of carbon absorbed by sinks in n county and the whole region; C n and n C n denote the total amount of carbon emitted by the carbon sources in n county and the whole region. A result of >1 indicates that a county has a high carbon sink capacity, while a result of <1 means that the capacity of the carbon sinks in the county is weak.

2.3.5. Decomposition of Land Use Carbon Emission Factors Based on the LMDI Method

The Kaya equation is mainly used to explain the relationship between carbon emissions and traditional socioeconomic factors such as energy, economy, and population. Based on existing studies, this study extends the Kaya equation based on the land use perspective [36] and constructs a Kaya model of the carbon emission impact factors of land use in Hubao-Eyu in terms of land carbon emission intensity, land use structure, unit land use intensity per capita, and population size.
C E = i C E i A i × A i A × A G D P × G D P P O P × P O P
where C E , A , G D P , and P O P denote the total land use carbon emissions, total land use area, gross regional product, and total population of the research object, respectively; C E i is the total land use carbon emissions of each type of land use; and A i is the area covered by each type of land use.
LMDI is recognized as an accurate exponential decomposition method (index decomposition analysis, IDA) that can effectively avoid residual terms and data zero values and is widely used in factor decomposition research into carbon emissions [37]. LMDI can be decomposed into multiplicative and additive models. In this study, based on the decomposition of the Kaya model in Equation (14), the additive model was used to analyze the degree of influence of each driving factor on the carbon emissions of the Hubao-Eyu urban agglomeration using the following formula:
C E = i C E i A i × A i A × A G D P × G D P P O P × P O P = i f i × s i × g × e × p
where f i = C E i / A i characterizes the land carbon emission intensity; s i = A i / A characterizes the land use structure; g = A / G D P characterizes the land use economic efficiency factor—that is, the intensity of land use per unit of G D P , e = G D P / P O P indicates the value of g per capita, which characterizes the level of the economy; and G D P characterizes the size of the population.
Assuming that the total land use carbon emissions at the beginning of the study are C E 0 and the total land use carbon emissions at the end of the study are C E T , the model equations are as follows:
Δ C E = C E T C E 0 = Δ C E f i + Δ C E s i + Δ C E g + Δ C E e + Δ C E p
where Δ C E represents the total effect of the carbon emission changes in period Τ that is equivalent to the base period and i represents different land use types; Δ C E f i , Δ C E s i , Δ C E g , Δ C E e , and Δ C E p represent the sub-effects of land use carbon intensity, land use structure, land use intensity per unit of GDP, economic level, and population size factors on carbon emission changes, respectively. The results of the differential decomposition of each factor and the expression for the contribution rate of the decomposition factors are as follows [38,39,40]:
Δ C E f i = i C E i T C E i 0 ln C E i T ln C E i 0 ln ( f i T f i 0 )
Δ C E s i = i C E i T C E i 0 ln C E i T ln C E i 0 ln ( s i T s i 0 )
Δ C E g = i C E i T C E i 0 ln C E i T ln C E i 0 ln ( g T g 0 )
Δ C E e = i C E i T C E i 0 ln C E i T ln C E i 0 ln ( e T e 0 )
Δ C E p = i C E i T C E i 0 ln C E i T ln C E i 0 ln ( p T p 0 )
K f / s / g / e / p = ( Δ C E f / s / g / e / p / Δ C E ) × 100 %
where K f / s / g / e / p expresses the contributions of land carbon intensity, land use structure, land use intensity per unit GDP, economic level, and population size [41].
In this section, for the research methodology and data, we first carried out visual interpretation of the acquired land use data, then calculated the carbon emissions and sinks of each land use category using the IPCC factorization method. Finally, based on the calculated data, we analyzed the spatial and temporal characteristics and LMDI influencing factors.

3. Results

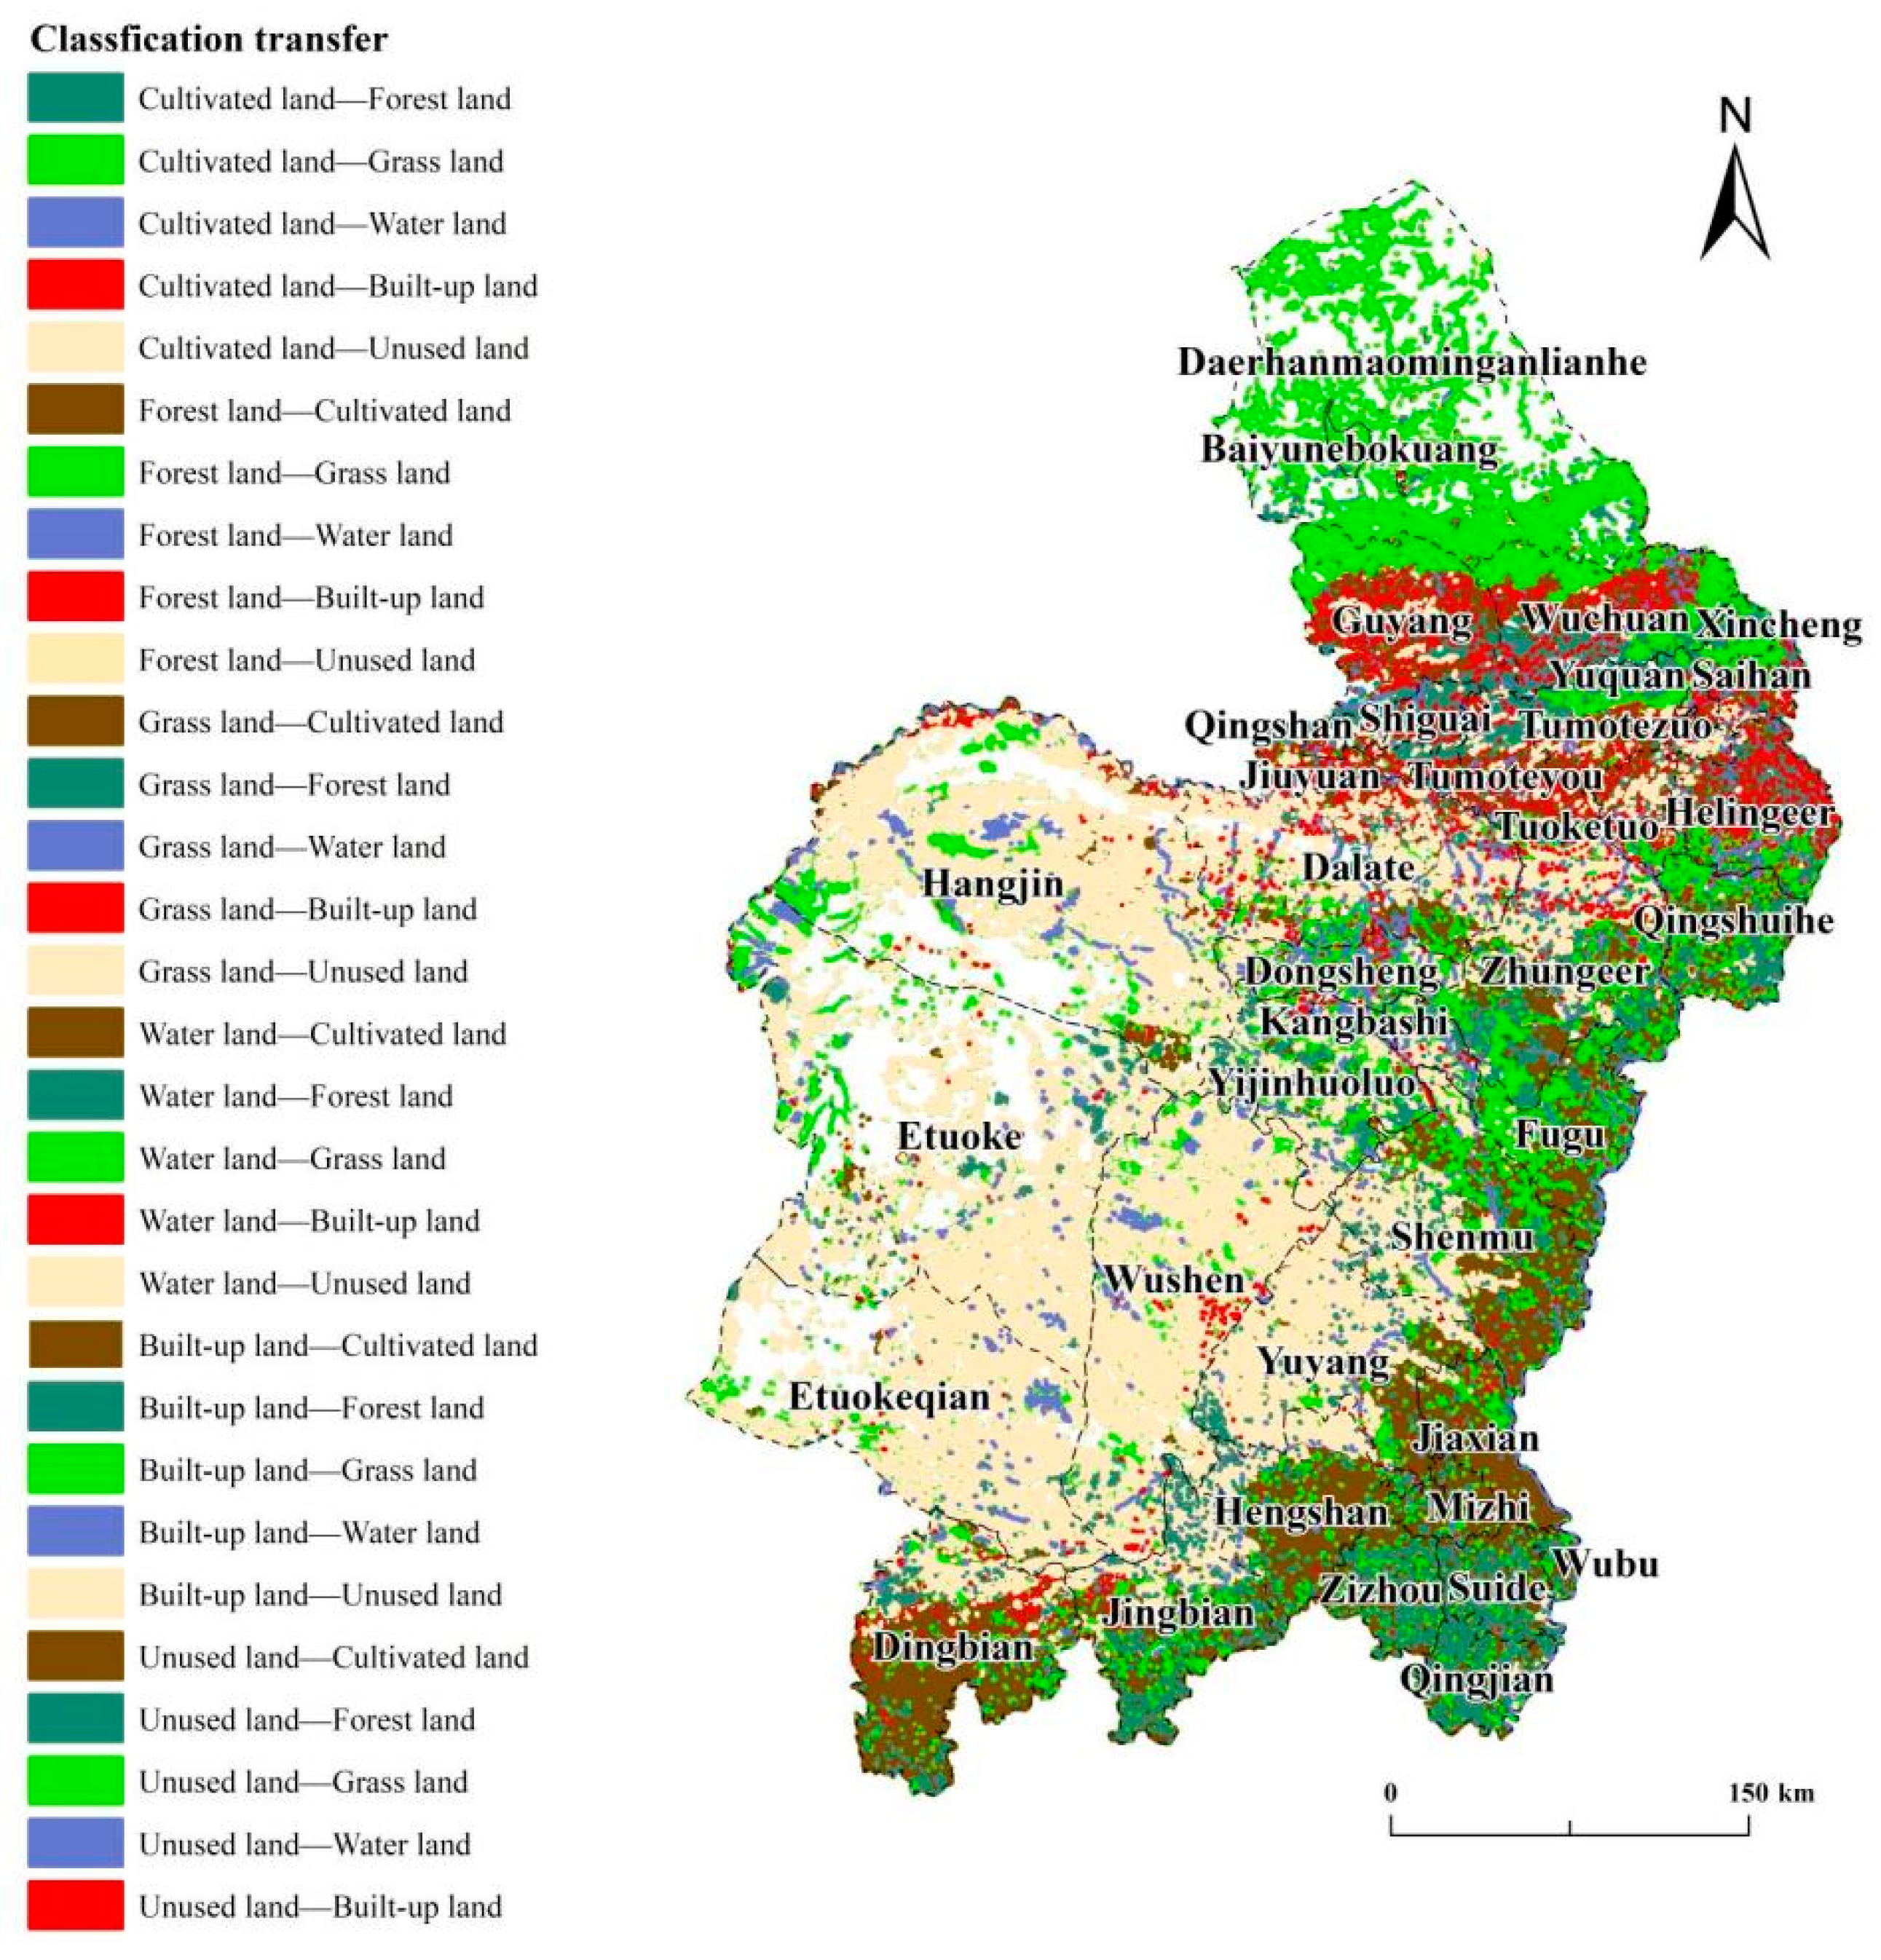
3.1. Changes in the Spatial and Temporal Land Use Patterns

The changes observed in the area share and motivation of land use types in the Hubao-Eyu urban agglomeration indicate different characteristics for different periods and land use types. Overall, the largest area share observed during the period from 2000–2020 was grassland, followed by cultivated and unutilized land, with the sum of the three accounting for more than 90% of the total land use area, indicating that these were the main land use types in the Hubao-Eyu urban agglomeration at this time. The area share of the other land use types was smaller in all periods. Land use changes during the study period were relatively strong, as manifested by the significant change in the amount of built-up land, forest, and water land area, with the 248,056.47 ha increase in construction land area being the most prominent over the past 20 years. Grassland increased and then decreased, while unutilized land decreased continuously. Over the period from 2000 to 2005, single land use showed the trend “three increases and three decreases”, with the area of forest land, construction land, and unutilized land increasing and the area of arable land, grassland, and water area decreasing. The greatest increases during this period were observed for forest and built-up land, with respective increases of 2.37% and 2.06%. The most significant increase during the period from 2005 to 2010 was in development, with a 6.14% increase in the amount of built-up land associated with significant urbanization and a rapid increase in urban area—followed by unused land, forest land, and water land—for which the rate of decrease was enhanced significantly as compared with the previous period. Changes in the amount of cultivated and grassland remained minimal during this period. The area of built-up land also increased from 2010 to 2015, rising by 31,274.28 ha during this time, meaning that the area devoted to all other land categories decreased. The greatest change was still in terms of built-up land over the period of 2015–2020, with the 4.70% increase followed by forest land and water areas. The continual decreases in the amounts of arable land and grassland during this period are associated with the accelerating urbanization during this period (Table 2).
Land types with carbon sink functions had a tendency to shift to the north, east, and south during the study period, while land types with carbon emission functions show obvious diffusion towards the center and southeast. In particular, the southeast is dominated by the transfer of cultivated land and the northeast by the transfer of built-up land. west. The land type changes in the west is dominated by the development of unutilized land, and those in the central part are dominated by the transfer of construction land, mainly in Guyang County, Shibian District, Jiuhuan District, Tumet Right Banner of Baotou City, Helin County, and Hohhot City in Tuo County (Figure 3).

3.2. Characteristics of Spatial and Temporal Evolution of Carbon Emissions in Association with Land Use

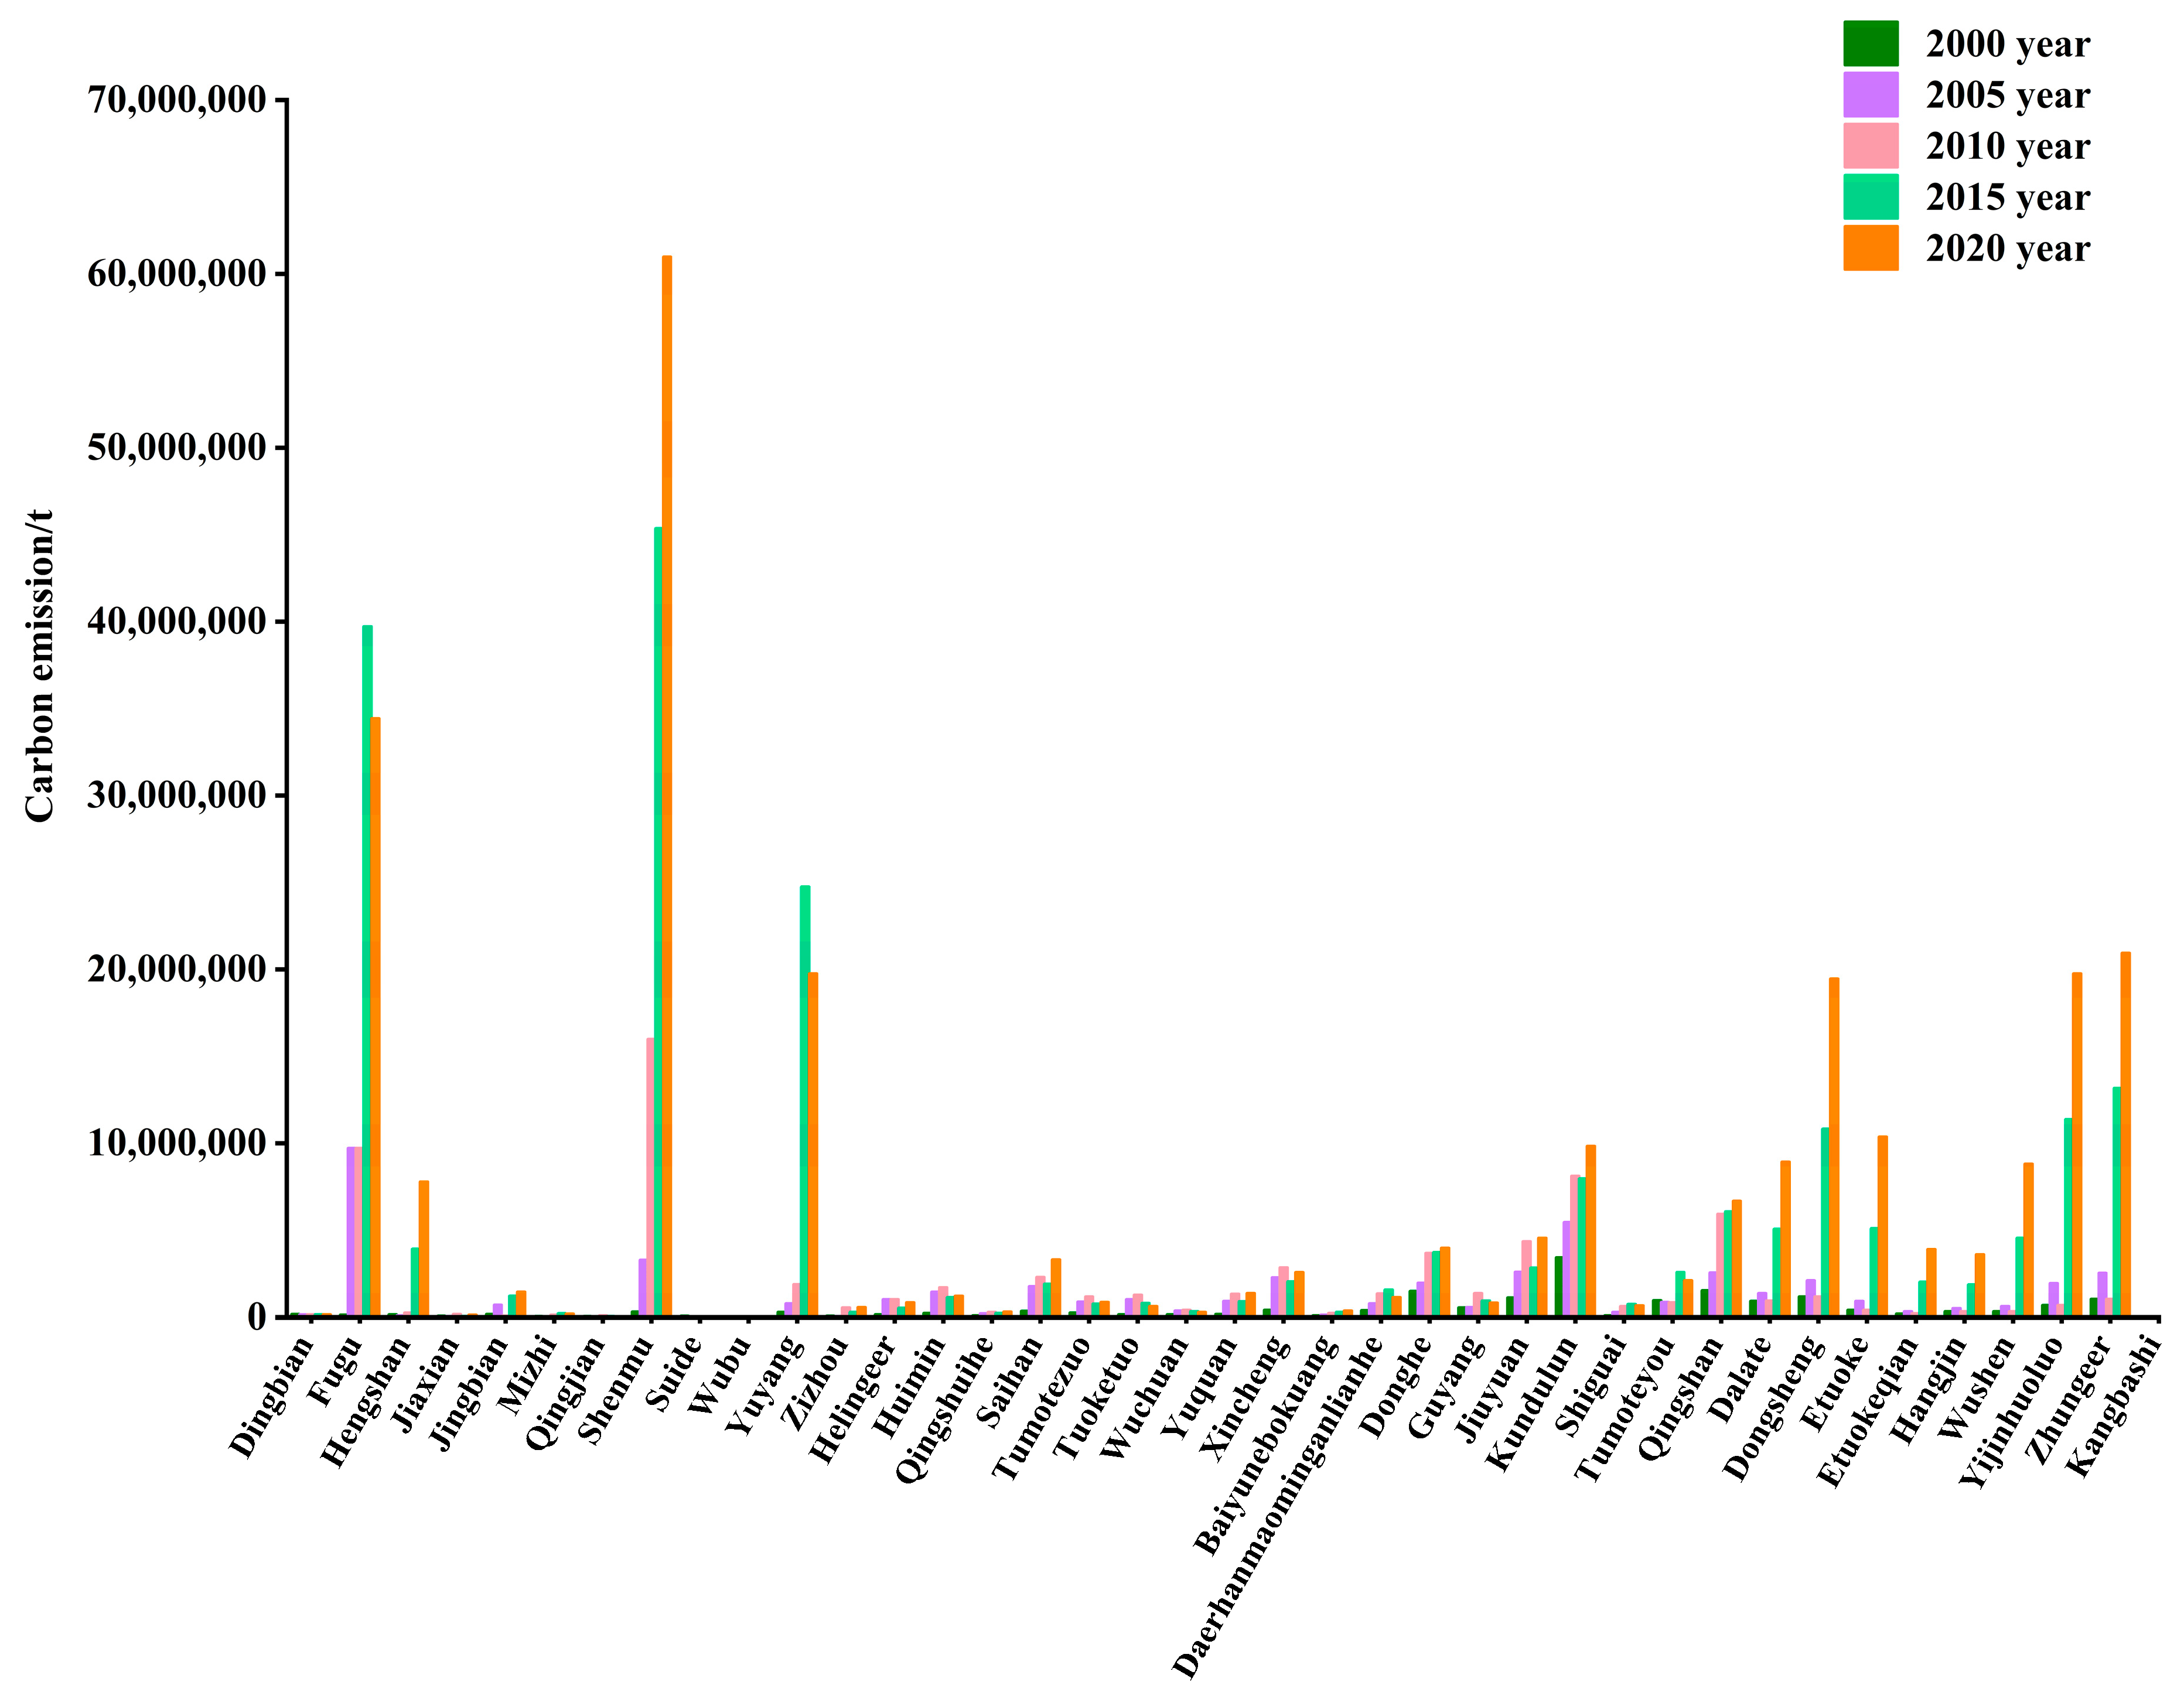
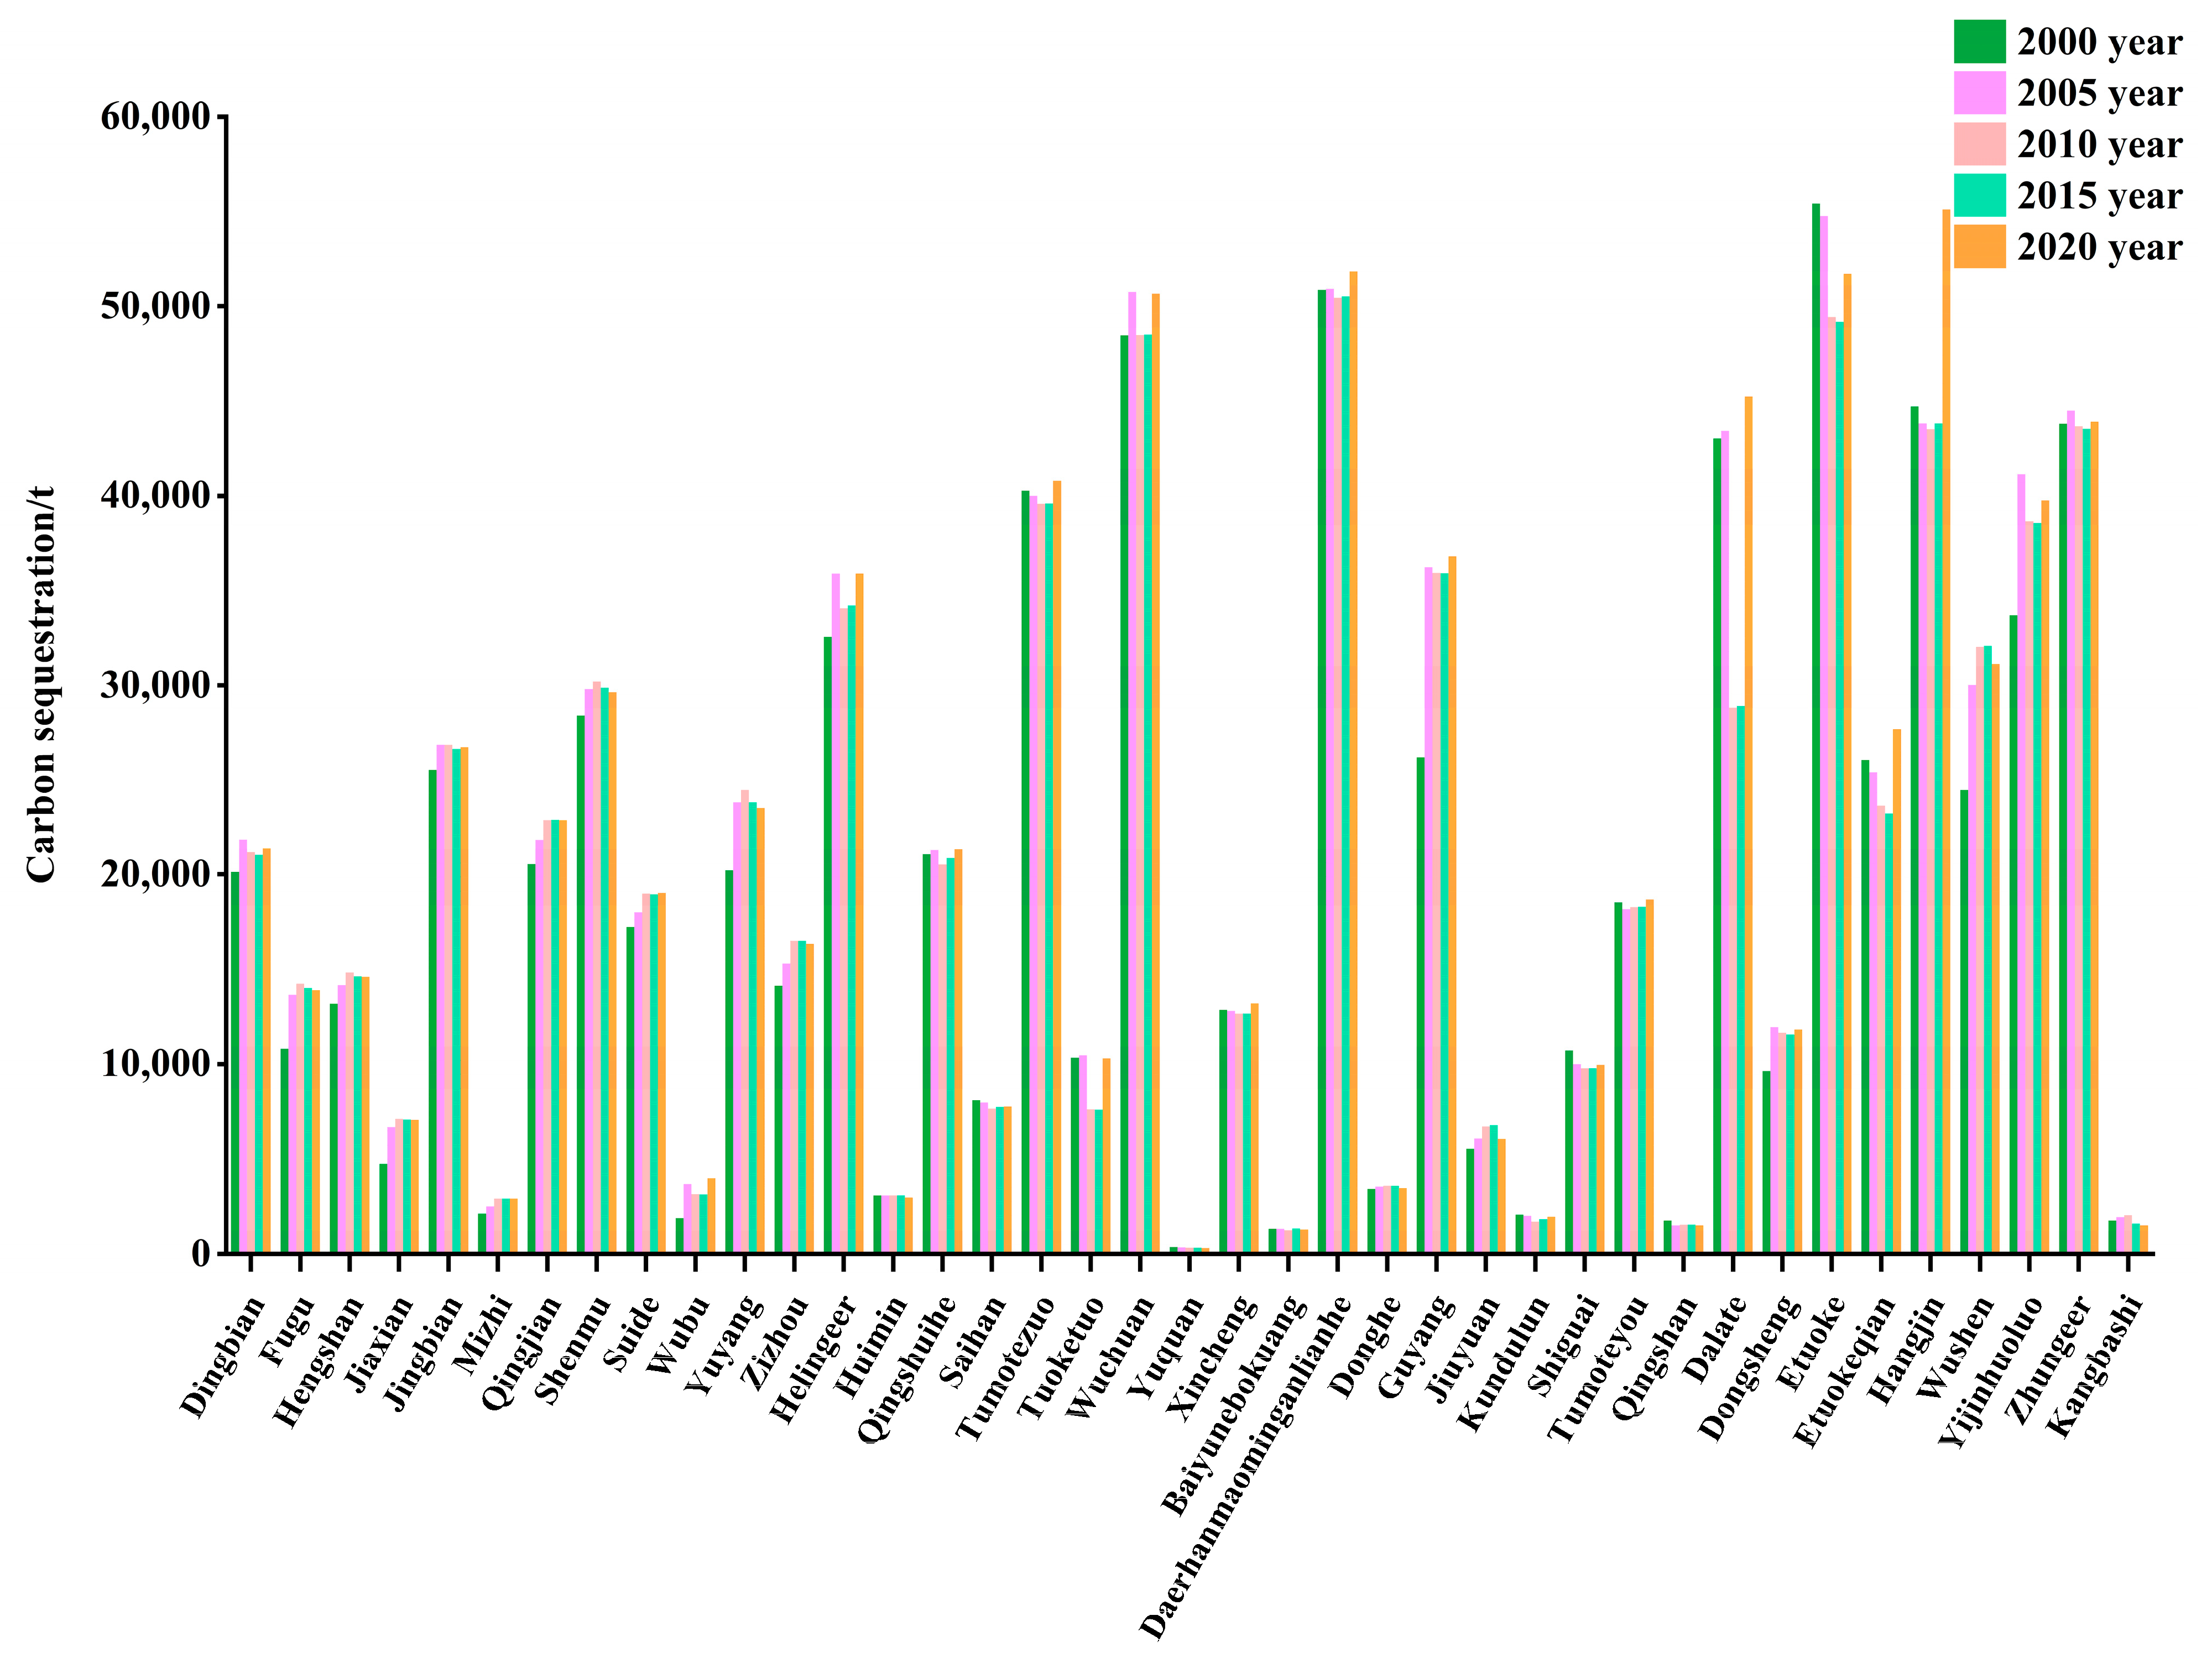
3.2.1. Analysis of Land Use Carbon Emissions from Different Land Use Types

The total net carbon emissions from land use in the Hubao-Eyu urban agglomeration were all positive over the period from 2000 to 2020. The carbon emissions reached 265,752,500 t in 2020, which is approximately 15 times that observed in 2000. The change trend of carbon sources is similar to that of net carbon emissions, whereas a slow and small upward trend is observed for carbon sinks. Built-up land is the major source of carbon emissions, with the increase from 17,028,600 t in 2000 to 265,141,000 t in 2020 indicating an average annual increase of 12,405,600 t over the study period. Carbon emissions from arable land as a whole show a slow downward trend, while the carbon emissions from arable land decreased by 655,000 t over the 20 years, mainly due to a decrease in the area of cultivated land. In terms of composition, forest land comprises the most significant carbon sink with a slow rising trend of 682,000 tons over the 20 years. Grass land showed a slow decreasing trend, and water and unused land remained basically unchanged (Table 3).

3.2.2. Land Use Carbon Transfer

The land area shift caused by land use change is consistent with the characteristics of carbon emission shifting. In terms of the carbon source land category shift, the shift from cultivated land to grassland led to a reduction of 22,968.22 t of carbon emissions. The shift from built-up land to carbon sink led to a reduction of 48,571.00 t of carbon emissions. However, the results also indicate a shift from carbon sink land types to built-up land with strong carbon source capacity, increasing the regional carbon emission level (Table 4).

3.2.3. Temporal Changes to Land Use Carbon Emissions and Absorption

Carbon emissions from land use in the Hubao-Eyu urban agglomeration increased during the period from 2000–2020, with the amount of carbon absorption increasing, decreasing, and increasing again. Carbon emissions were in a slow growth stage before 2010, as industrialization and urbanization were minimal during this period. The rapid growth in carbon emissions that was observed after 2010 was due to increased industrialization, which intensified energy consumption, with Fugu County, Shenmu City, Yuyang District, Yulin City, and the flag counties of the Inner Mongolia Autonomous Region, such as the Dongsheng District, YijinhuoLuo Banner, and the Jungar Banner—important growth points in which carbon emissions grew rapidly. The Hubao-Eyu urban agglomeration also experienced an increase in its carbon sinks between 2000 and 2005; however, the rapid expansion of construction land due to development led to the conversion of significant amounts of carbon sink land into built-up land between 2005 and 2015. Hubao-Eyu is located in the Mao Wusu Desert, where the fragile and damaged ecological environment reduces the capability of the land to form carbon absorption [42]. The number of carbon sinks thus decreased due to expansion of the “returning farmland to farmland” project over the period from 2015–2020, although the area of grassland and forest increased due to “returning cultivated land to grassland”, and the initial success of the Maowusu Desert management in enhancing the carbon sink capacity in the region increased the carbon absorption effect [43] (Figure 4).

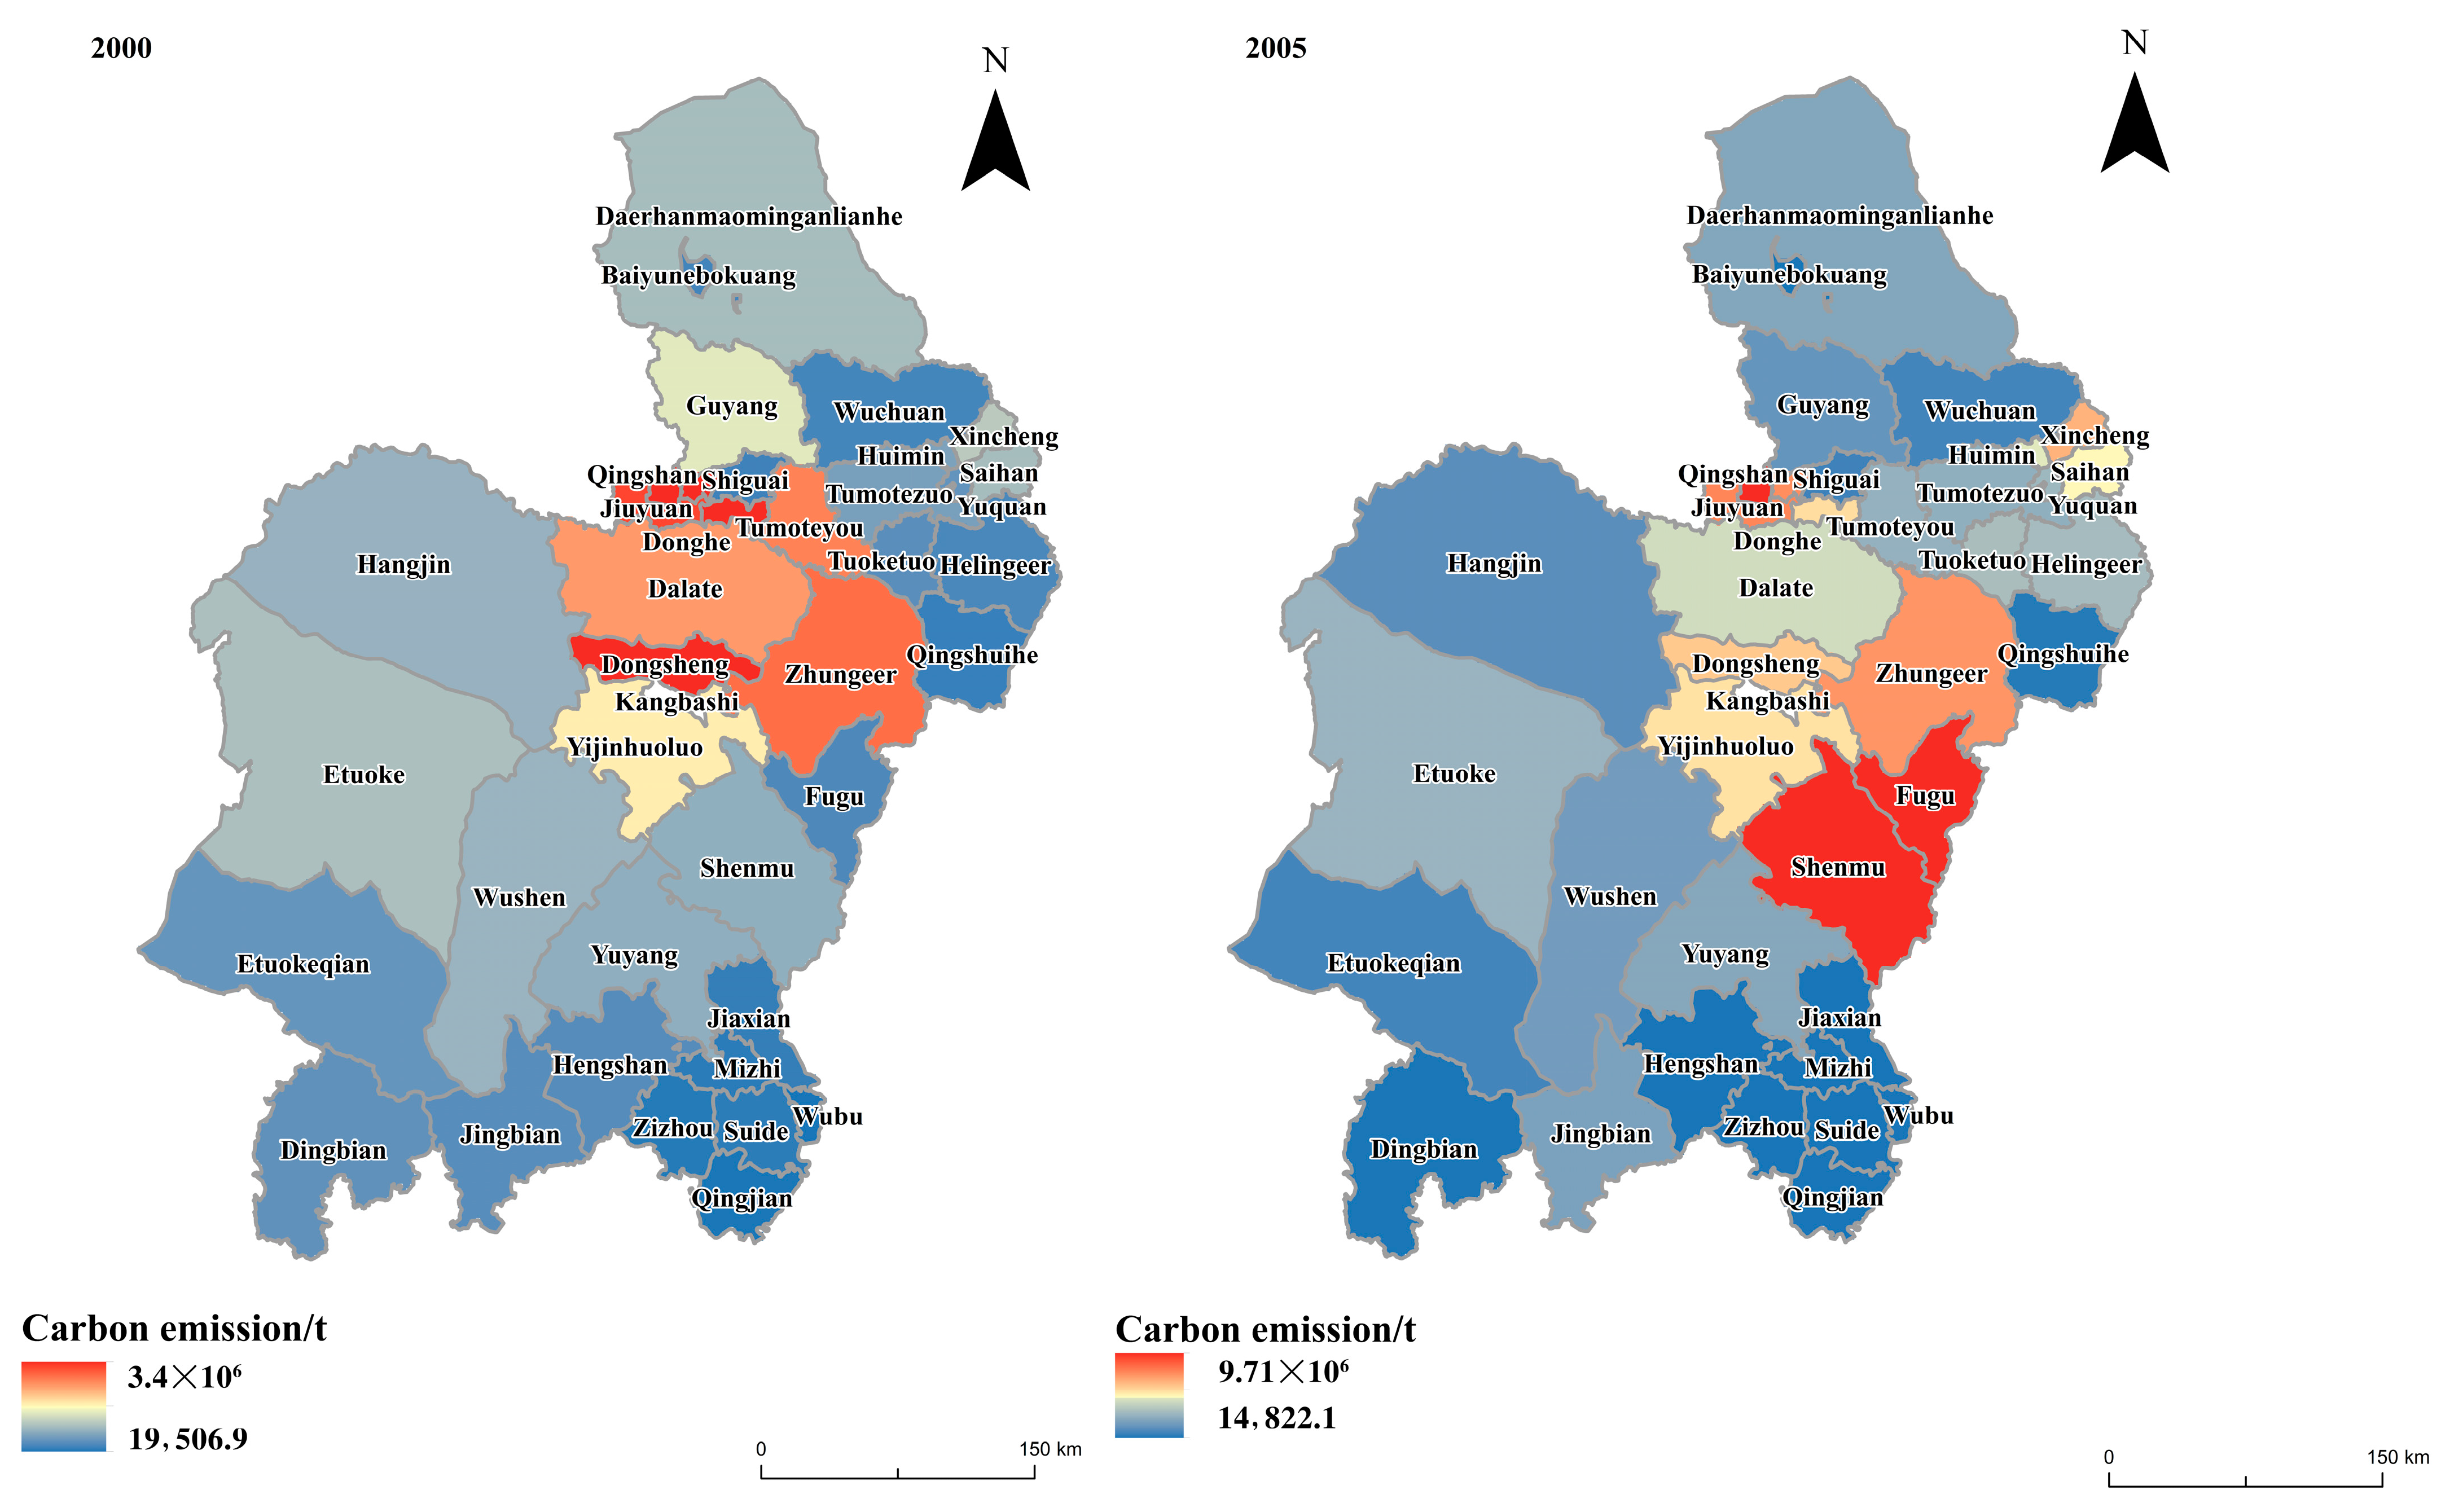
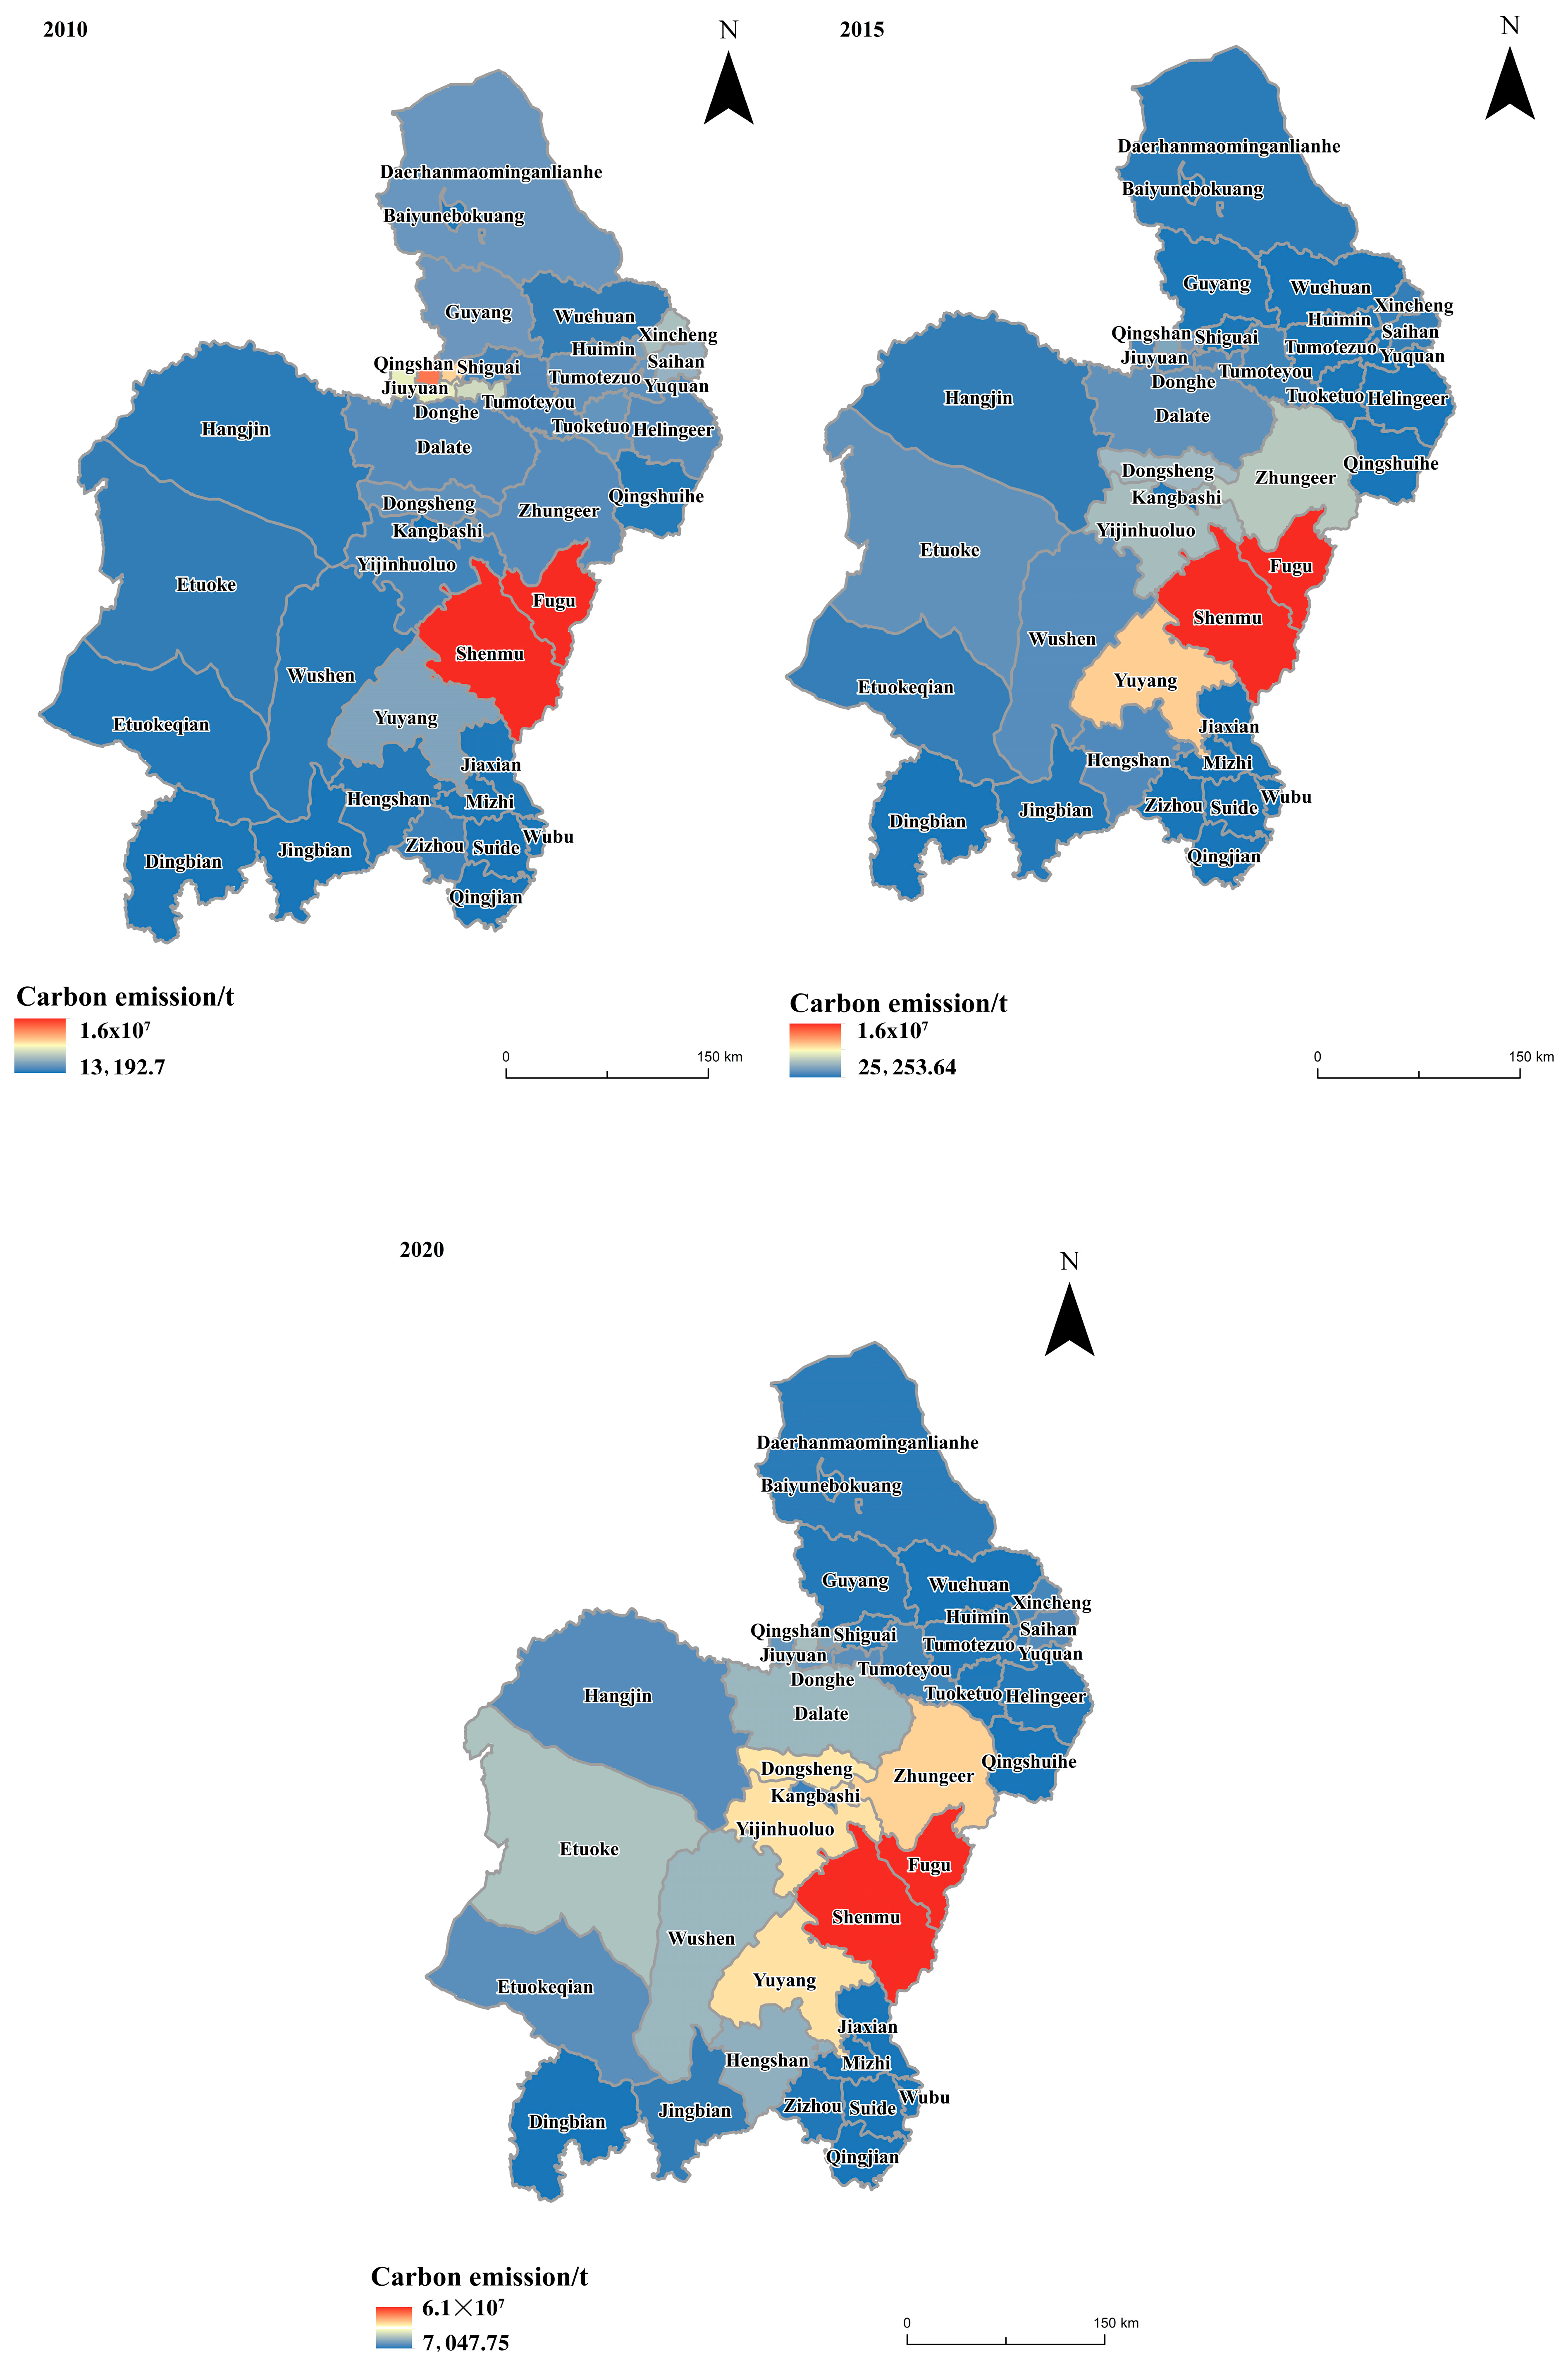
3.2.4. The Spatial Evolution of Carbon Emissions

(1)
Spatial distribution characteristics
Carbon emissions from land use in the Hubao-Eyu urban agglomeration generally show high distribution in the central and eastern parts of the city and low distribution in the surrounding areas. The carbon emission area is mainly distributed within the intensive energy consumption area in the middle and southeast, from which it radiates and spreads to the surrounding area, with Shenmu City and Fugu County as the center. The spatial distribution of carbon emissions is more stable in the southern six counties of Yulin City, the northern part of Baotou City, the northern part of Hohhot City, and the western part of Ordos, and the spatial distribution of carbon emissions in the districts and counties of Dongsheng, Fugu, Shenmu, and Yuyang expanded significantly, rendering these areas the main sources of carbon emissions [44]. For the Hubao-Eyu urban agglomeration, the main areas of carbon emission growth in 2000 were Donghe District, Kundulun District and Qingshan District in Baotou City, where the development of the iron and steel industry, as traditional industries, led to the fastest growth in carbon emissions. The same regions showed the largest carbon emissions. However, in 2005, Shenmu City inYulin City also began to show an increasing trend in carbon emissions at this point due to the rich coal resources, which led to the development of the coal chemical industry at this point, resulting in carbon emission growth. Donghe District, Kundulun District, and Jiubuan District in Baotou City; Xincheng District in Hohhot City; and Shenmu City and Yulin City in Fugu Country showed the largest carbon emissions in 2010. Baotou City continues to grow in terms of carbon emissions owing to the continuous development and growth of major industries such as iron and steel, aluminum, and equipment manufacturing. The new city of Hohhot is in a unique geographical location and has superior transportation conditions; however, the continuous urbanization of this city means that carbon emissions are also growing. Shenmu City and Fugu County in Yulin City are located in the Shenfu Coal Field, and coal mining has led to the development of a coal chemical industry in the surrounding area, resulting in large amounts of carbon emissions. In addition to the districts and counties mentioned above, districts and counties with large carbon emissions in 2015 include Dongsheng District and Yijinholo Banner and Jungar Banner in Erdos City, which are located in the Jungar Coal Field, where the exploitation of coal has led to increased energy consumption and carbon emissions. These regions continued to be major carbon-emitting regions in 2020, with industrialization and population growth leading to the growing trend in carbon emissions [45] (Figure 5).
(2)
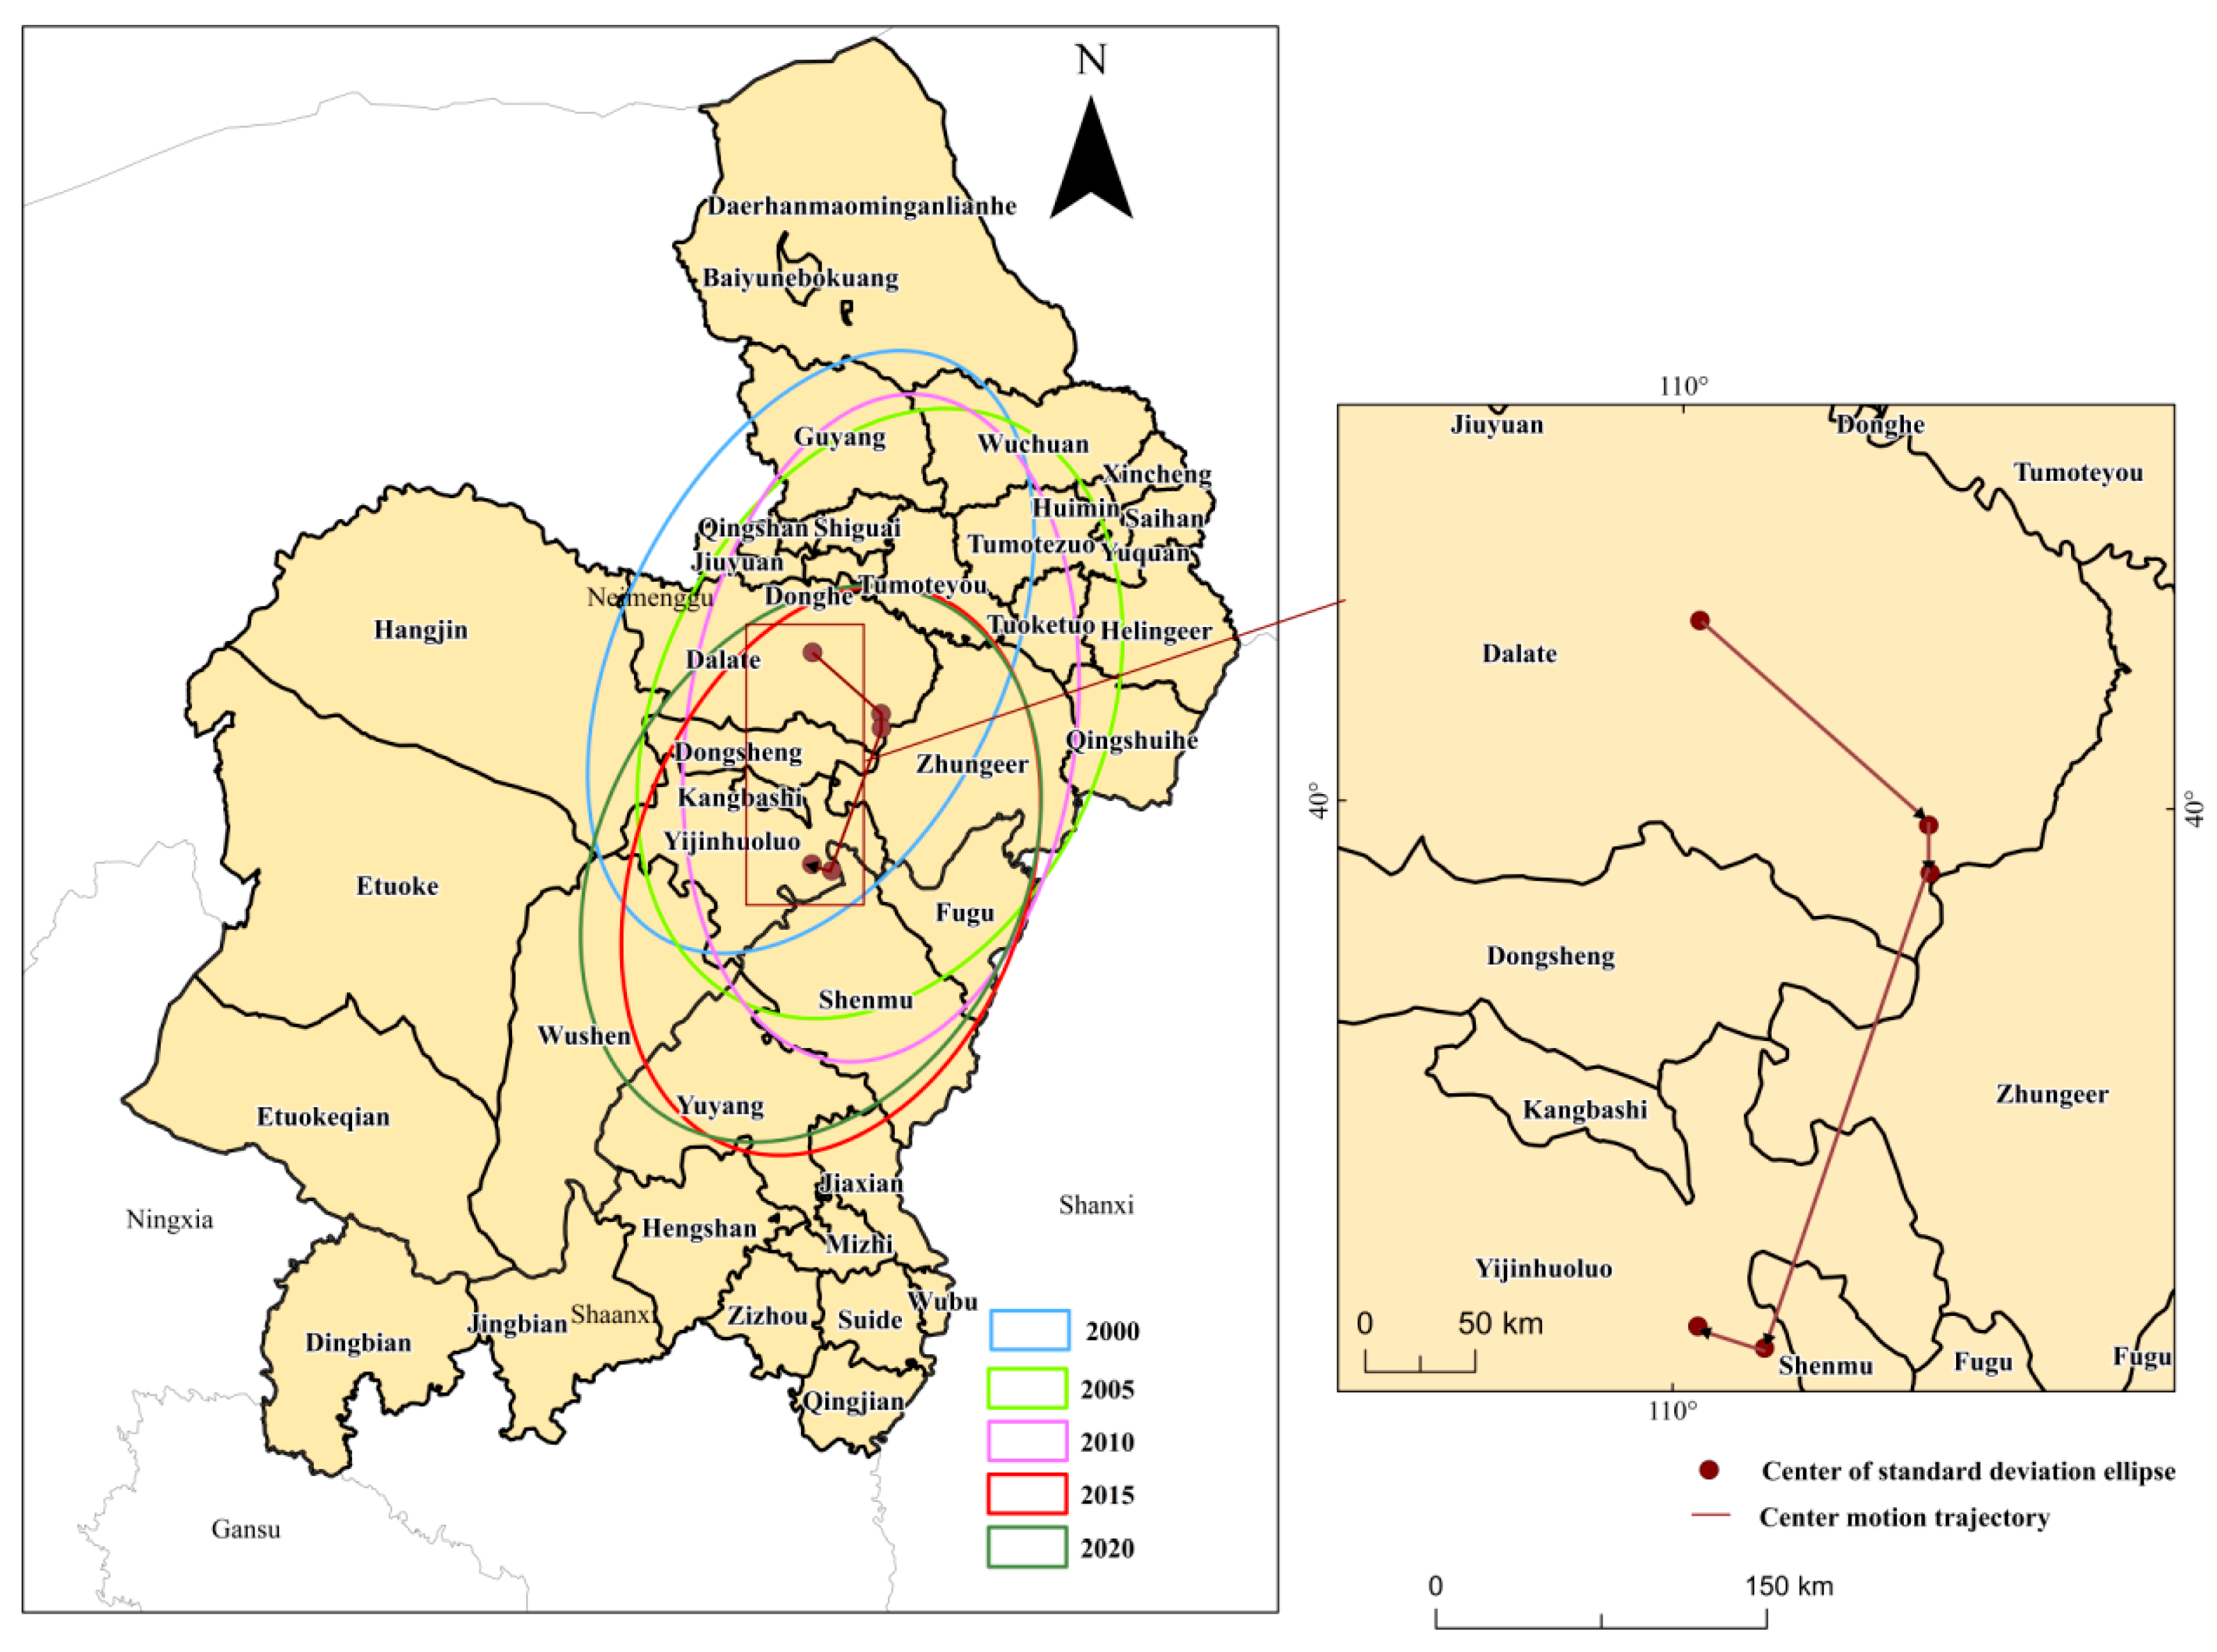
Standard deviational ellipse and gravity shift analysis of carbon emissions
From 2000 to 2020, the net carbon emission center of the Hubao-Eyu City Cluster was distributed in Ordos City, shifting over a total distance of 120.38 km from Dalat Banner in 2000 to the boundary of Yijinholo Banner in 2020. The center of gravity of carbon emissions in the city cluster moves to the southwest overall (with the center of the ellipse moving westward by 0.14 km and southward by 95.96 km), indicating that the intensity of carbon emissions in the southwest of the Hubao-Eyu city cluster has gradually increased. The azimuth of the standard deviation ellipse of net carbon emissions in the Hubao-Eyu city cluster showed a trend of decreasing and then increasing over the last 20 years, with an overall shift of −0.67°. Meanwhile, the long axis decreased from 146.26 km in 2000 to 132.33 km in 2020, while the short axis increased from 86.90 km to 96.33 km over the same period, with the 0.29% increase in the area and 2.9% decrease in the perimeter indicating that the spatial distribution pattern of the net carbon emissions in the Hubao-Eyu, and Elm urban agglomeration has moved in a “northeast–southwest” direction over the past 20 years (Table 5 and Table 6 and Figure 6).

3.3. Changes in the Pattern of Land Use Carbon Balance

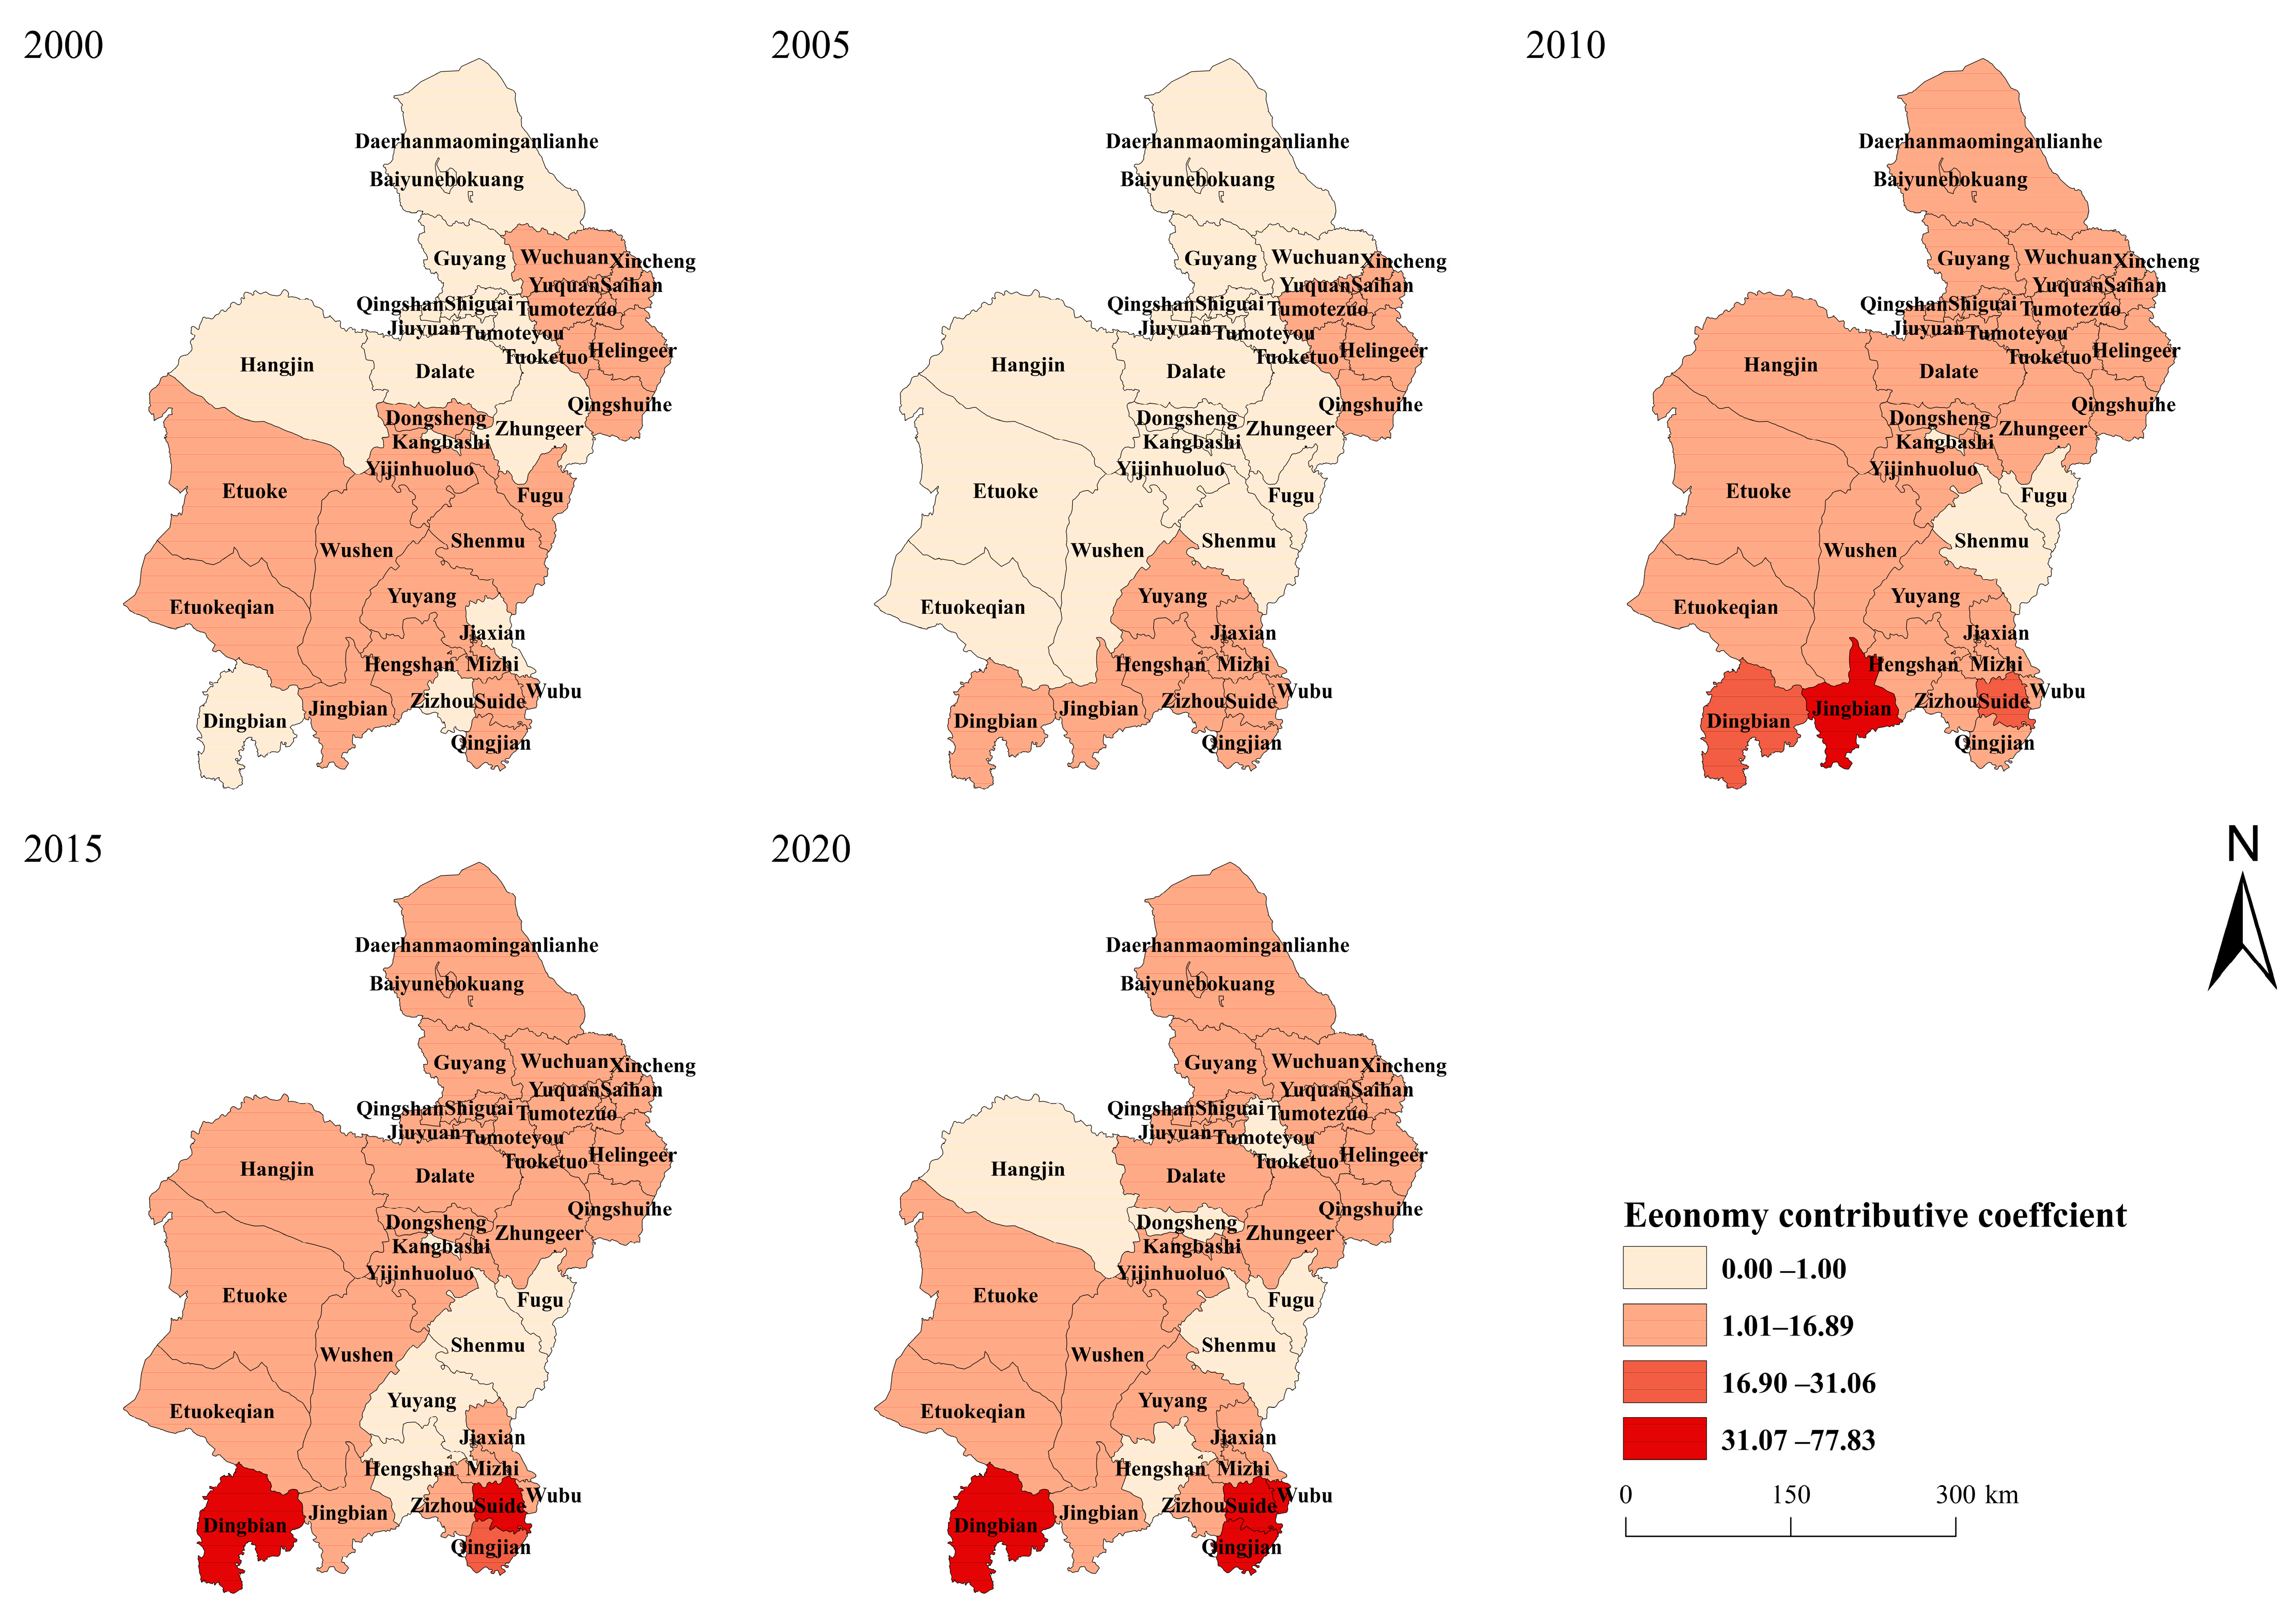
3.3.1. Spatial Distribution of Economy Contributive Coefficient

The economic contribution coefficients of the districts and counties in the Hubao-Eyu urban agglomeration vary considerably, indicating that the economic contribution rate and carbon emission contribution rate of the districts and counties are in an unbalanced state, with obvious regional differences. Except for Shenmu City and Fugu County, where the carbon productivity was <1, the carbon productivity of all other districts and counties was >1 in 2010, indicating that the economic development of Shenmu City and Fugu County was highly dependent on traditional industries with high energy consumption and emissions, resulting in low energy utilization efficiency. The highest economic contribution coefficient of 77.83 was observed in Jingbian County, which indicates that the economic contribution rate and the set of emission contribution rate of Jingbian County were in a balanced state at this time point. In 2015, districts and counties with low carbon productivity included Fugu County, Shenmu City, Yuyang District, and Hengshan District in Yulin City, while districts and counties with high carbon productivity included Dingbian County, Jiaxian County, Qingjian County, Suide County, and Wubao County in Yulin City, indicating considerable differences in the carbon productivity of the southern and northern districts and counties in Yulin City. A significant difference was also observed in the carbon productivity of the southern and northern districts and counties of Yulin. The northern districts and counties represented by Yulin District are rich in coal resources, with the single energy structure and huge energy consumption leading to an imbalance between the economic contribution and carbon emissions; however, the southern districts and counties represented by Suide County are poor in mineral resources, and their economic development relies mainly on the development of primary and tertiary industries, such as farming, which is well developed in this region. The creation of a tourism industry in the north of Shaanxi Province has gradually increased the carbon productivity in this region. In addition to Shenmu City, Fugu County, and Hengshan District, the carbon productivities of Dongsheng District, Hangjin Banner, and Tumet Right Banner were <1 in 2020. Economic development in Dongsheng District and Hangjin Banner relies on industrial energy, while Tumet Right Banner is located in the energy city of Baotou, where the development of the silicon and coal industries simultaneously promotes economic growth while generating a huge amount of carbon emissions (Figure 7).

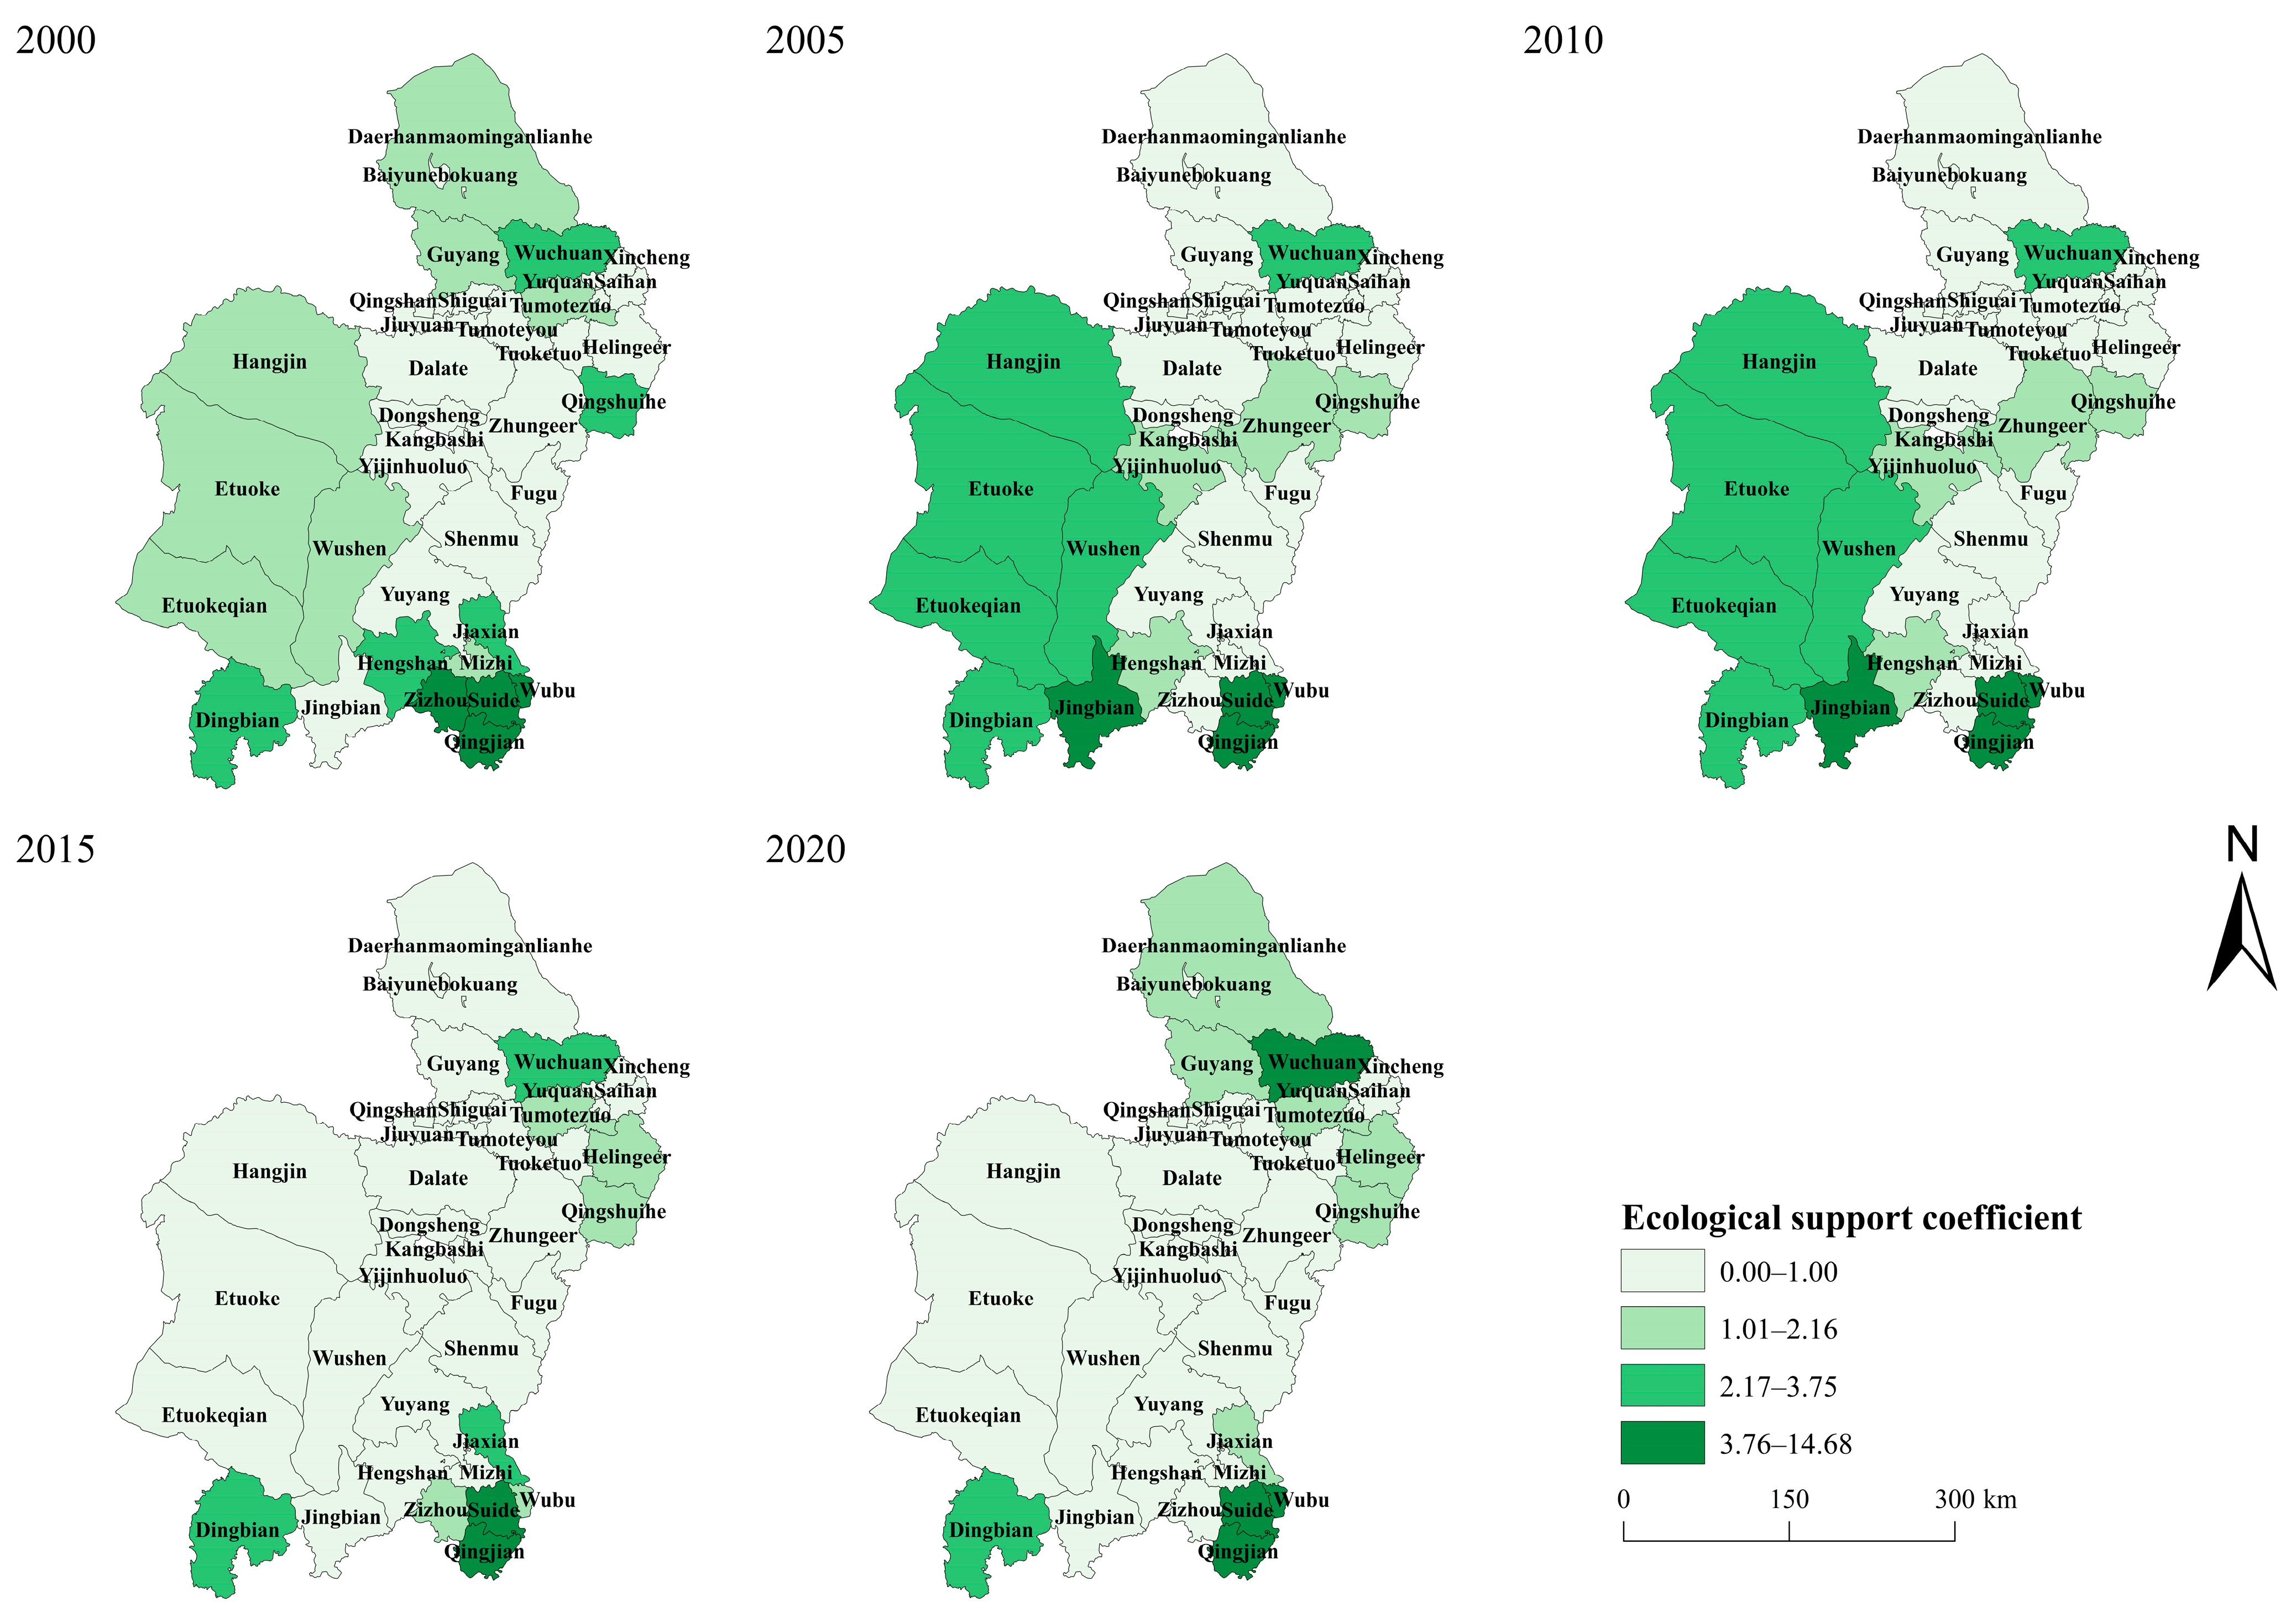
3.3.2. Spatial Distribution of Ecological Support Coefficients

The ecological carrying capacity of carbon sinks in each county of the Hubao-Eyu urban agglomeration was calculated using Formula (12). The results showed an overall decreasing trend in the ecological carrying capacity from 2000 to 2020, with significant regional differences in the ecological carrying coefficient of the different carbon sinks observed, as seen in Figure 8. Counties with higher ecological carrying coefficients of carbon sinks in 2000 included Qingjian County, Wuchuan County, and Helinger County, which are located in the northern foothills of the Yinshan Mountains and are rich in pasture and forest carbon sinks, positively affecting the carbon emission elimination over the entire region. Higher ecological carrying coefficients were observed in Suide County, Qingjian County, and Yulin City in Zizhou County in in 2005, and Jingbian County, Suide County, and Qingjian County from 2010 to 2020, during which time the ecological carrying coefficient of Suide County was >10, with the significant carbon sink capacity contributing significantly to the absorption of carbon emissions in the entire region. However, the carbon compensation rate gradually declined from 2000 to 2020, indicating a much lower growth rate for carbon sinks as compared to emissions, and showing the deteriorating state of the ecological environment (Figure 8).

3.4. Factor Decomposition of Land Use Related Carbon Emissions

3.4.1. Analysis of the Overall Carbon Emission Driving Factors in the Hubao-Eyu Urban Agglomeration

The LMDI factor decomposition model was used to calculate the contribution values and contribution rates of the different driving factors to carbon emissions, with land carbon emission intensity, land use structure, economic level, and population size all playing a contributing role in the land use carbon emissions of the Hubao, Ezhou, and Elm urban agglomeration from 2000 to 2020. Land use structure was found to be the main driving force followed by economic level, with contribution values of 155,827,700 and 140,345,100 t, or 167.75% and 151.06% respectively. The contribution rates of land carbon emission intensity and population size were relatively low during this period, with contribution values of 90,469,600 and 79,725,200 t with contribution rates of 97.25 and 85.06% respectively. Land use structure was the main driving force, followed by economic level, with contribution values of 155,827,700 and 140,345,100 t—167.75 and 151.06%, respectively, The contribution value of land use intensity per unit of GDP was the main negative inhibitory factor, with a contribution value of −2,200,777,200 t and high absolute contribution rate of 236.89%, indicating that this driver has far greater influence on land carbon emissions as compared to land use structure and economic level (Table 7).

3.4.2. Analysis of Carbon Emission Drivers by District and County

The land use carbon emissions varied in different years, with differences observed in the degree of influence of each driving factor. Land use structure is the main driving force of land use carbon emissions in the Hubao-Eyu urban agglomeration, and the contribution to carbon emissions is positive except for some negative values in individual districts or counties during some years. The largest land use contribution was observed during the period from 2015–2020; thus, the optimization of land use structure should be taken as an important long-term task and carbon sink areas such as forest, grassland, and watersheds, should be continuously increased. Economic level is a secondary factor that results in carbon emissions, with its contribution to carbon emissions showing a “strong–strong-strong-weak-strong” effect, with the strongest promotion effect in 2005–2010. The intensity of land carbon emissions was positively driven, with only a few years in which individual districts and counties played a negative inhibitory role, and the strongest pulling effect was observed during the period from 2010–2015. The contribution of population size to carbon emissions was relatively weak; however, its role should not be ignored. Land use intensity per unit of GDP has a significant inhibitory effect on carbon emissions (except for a few counties in 2015–2020), which is an important driver that is slowing the growth of regional carbon emissions (Figure 9).

4. Discussion

We found that the largest area share observed during the period from 2000–2020 was grassland, followed by cropland and unused land, with the sum of the three accounting for more than 90% of the total land use area, indicating that these were the main land use types in the Hubao-Eyu urban agglomeration at this time. The area share of the other land use types was smaller in all periods. the range of change is built-up land > forest land > water land. Another possible explanation for this is that the ecological protection increased in Hohhot Cilechuan, the Grand Canyon of the Yellow River National Geopark, Shenquan, Baotou Xiaobaihe Water Conservancy Facility, the construction of the Yanhunding Yanghuang Irrigation Project, the tourism development of the Yellow River Chinese Civilization in Hohhot, and the Hubao-Eyu urban agglomeration during the study period, increasing the area devoted to woodland and watersheds [46]. The area of arable land increased and then decreased, mainly because of the use of arable land for the expansion of construction land, forest land, and watershed. These results demonstrate the strong intensity of urban agglomeration over the past 20 years in the study region [47].
We also found that built-up land is the major source of carbon emissions. In terms of composition, forest comprises the most significant carbon sequestration, followed by grassland. the carbon sequestration potential of forest land. The possible explanation for this might be that forest land acts as a high-level carbon sink [48]. The high level of grassland carbon sinks is due to the fact that the Hubao-Eyu urban agglomeration belongs to the temperate continental monsoon climate, and the vegetation types are mainly grassland and shrubs, while the grassland area has always accounted for more than 50% of its total area. Thus, grassland carbon sinks are also much more numerous [49].
Spatial and temporal characterization analysis of carbon emissions. Overall, carbon emissions in the Hubao-Eyu urban agglomeration show a trend of consistent growth over the period from 2000 to 2020, which is consistent with the results of many studies on the carbon emissions that are associated with land use in urban agglomerations, such as the Wuhan and Hubao-Eyu urban agglomerations, both of which have the same trend of growing carbon emissions, mainly because the land use in these areas emphasizes economic development and neglects ecological protection, leading to the continuous and constant growth of carbon emissions [50]. This result is also consistent with a trend of growing carbon emissions in the YRD [51]; however, the driving factors for the high carbon emission regions of the two differ, with Shanghai producing the largest amount of carbon emissions in the Yangtze River Delta, and the reason for the growth in carbon emissions mainly being due to the high emissions associated with population growth and urbanization, whereas the regions in the Hubao-Eyu urban agglomeration that have high carbon emissions rely on the energy-based economic development [52]. Therefore, the carbon emissions of Hubao-Eyu urban agglomeration in our study. We also obtained that the carbon emissions had a distribution characteristic of “northeast–southwest”. This result might be explained by the fact that clustering in energy resource-rich areas.
In general, carbon balance analysis, in terms of economic contribution coefficients, from 2000 to 2020 is increasing, indicating that the contribution rate of land use carbon emission is larger than the economic contribution rate, and the economic level of its carbon emission is relatively low. From the perspective of the ecological carrying capacity coefficient, the ecological carrying capacity coefficient from 2000 to 2020 has been decreasing, indicating that the ecological environment of the Hubao-Eyu urban agglomeration has been deteriorating. At the same time, the regions with lower ecological carrying coefficients are mainly concentrated in the central and eastern regions with high carbon emissions. Therefore, it is very important to adjust the energy structure, optimize the industrial structure and improve the efficiency of energy use, strengthen the ecological construction and management, change the land use structure, and enhance the carbon sequestration capacity of the ecosystem [53].
Analysis of the influencing factors found that population size in the Hubao-Eyu urban agglomeration at the beginning of the study inhibited carbon emissions, while the population growth after 2010 intensified the demand for construction land, and the associated increase in the production and living activities led indirectly to increased energy consumption, promoting the growth of carbon emissions. The level of economic development plays a driving role in the growth of carbon emissions in association with land use, and the dependence of Hubao-Eyu urban agglomeration on fossil energy sources such as coal and oil for its economic development has gradually increased its dependence on such sources, with its rapid economic development leading to a large increase in its greenhouse gas emissions [54] and enhancing the influence that economic development has on carbon emissions. The land use intensity per unit of GDP also plays an inhibitory role on the amount of carbon emitted due to land use, and the continuous improvement in the level of economic and scientific and technological development will improve the efficient use of resources and promote the improvement of land use efficiency, weakening the land use intensity per unit of GDP, leading to a gradual decline in the carbon emissions from production in units of GDP, and increasing the inhibitory role of the growth of carbon emissions [55]. The factors that are associated with the land use structure also play a driving role in the growth of carbon emissions from land use, with the contribution value continuing to increase. The urbanization of Hubao-Eyu advanced over the study period, with the construction land expanding in an uncontrolled manner and ecological land, such as forest or grassland, utilized for human requirements, meaning that the land use structure of Hubao-Eyu underwent a profound change, directly impacting the level of carbon emissions. From the point of view of land carbon emission intensity, the economic structure of Hubao-Eyu urban agglomeration is dominated by energy, resource-based, and heavy industries, with the proportion of heavy industries much higher than the national average and the economic growth more dependent on energy consumption. In 2014, the Inner Mongolia Autonomous Region issued the Notice on the Action Program for Energy Conservation, Emission Reduction, and Low-Carbon Development, which led to a decrease in energy consumption per unit of GDP. However, the economy of the Hubao-Eyu urban agglomeration grew after 2015, resulting in a decrease in the intensity of carbon emissions [56]. Unlike the Pearl River Delta urban agglomeration, the positive factor affecting carbon emissions in the studied agglomeration is the level of economic development. Energy efficiency and energy structure negatively influence the reduction of land use carbon emissions, and the contribution of energy structure to land use carbon emissions reduction far exceeds that of energy efficiency [57]. Our findings are consistent with existing studies that have concluded that per unit GDP is a major inhibitor of carbon emissions [58,59]. Some scholars have also assessed and analyzed carbon emissions from cultivated land and forest land only. Whereas in the analysis of factors affecting cultivated land, natural factors have a greater influence on carbon emissions. In contrast, our comparison with the ChangZhuTan urban agglomeration reveals that the economy had a negative effect on land use carbon emission, which indicates that the national policy of implementing a low-carbon economy has begun to take effect in the Chang-Zhu-Tan urban agglomeration, and the low-carbon economic growth mode had a significant effect on reducing carbon emissions and improving the environment. Therefore, Hubao-Eyu urban agglomeration should increase its efforts to implement the national low-carbon policy. In this study, based on the accounting results of land use carbon emissions during the last 20 years from 2000 to 2020, the LMDI model was used to analyze the influencing factors of land use carbon emissions, which were generally consistent with previous studies.
This study analyzed the influence of energy use efficiency factors on land use carbon emissions based on previous studies with ample scope for innovation; however, there are still limitations as follows: (1) From the standpoint of land use carbon emission accounting methods, this paper adopted the IPCC inventory method for land use carbon emission accounting, which is based on energy consumption, has a fixed formula, and is easy to calculate; (2) the factor decomposition model was used to analyze the influencing factors of carbon emissions. In reality, there are many driving factors affecting carbon emissions, and this study cannot decompose all the factors and only analyzes the main influencing factors, hoping that future studies can further analyze the influencing factors of land use carbon emissions in depth.

5. Conclusions

We carried out a study on the decoupling relationship between land use and carbon emission, with a view to providing a low-carbon development program for the western resource-based and agropastoral combined regions. In this study, land use and socio-economic data from 2000 to 2020 were used to ascertain the evolution of spatial and temporal patterns in land use carbon emissions, changes in carbon balance patterns, and the factors driving land use carbon emissions in the Hubao-Eyu urban agglomerations from the viewpoint of land use. The following conclusions were obtained: (1) Net carbon emissions from land use are generally increasing, with the transfer to construction land the main source of the rise in regional carbon emissions; (2) economy contributive coefficient is increasing, but ecological support coefficients are decreasing.; (3) the direction of the influence of each driving factor on the city cluster as a whole and individual districts and counties is basically the same. Land use structure, economic level, land carbon emission intensity, and population size all contribute to land carbon emissions, with contribution rates of 167.75, 151.00, 97.25, and 85.50%, respectively, whereas land use intensity per unit of GDP continued as a highly efficient inhibitor of carbon emissions, with a contribution rate of 237.00% in absolute terms.
Based on comprehensive research results, the following recommendations are made. To research results, we put forward the following suggestions: firstly, the districts and counties of Hubao-Eyu urban agglomeration should avoid the uncontrolled expansion of construction land, and continue to strictly control the conversion of grass land, forest land, and other land with carbon sinks into built-up land and unused land. Promote the construction of ecological projects to enhance the potential and capacity of regional carbon sinks.
Secondly, for districts and counties that rely heavily on coal resources and other energy sources, industrial transfer and upgrading should be promoted to improve energy utilization efficiency, and the following measures should be taken: increase the elimination of backward production capacity, strengthen the energy-saving management of key enterprises, and promote the energy consumption level of key industries to reach the advanced level of the industry, especially in the areas with high carbon emissions, such as Donghe District; Kundulun District and Qingshan District of Baotou City; Ejin Horo Banner and Kangbashi District of Ordos City; and Shenmu City, Fugu County, and Yuyang District of Yulin City. We should increase the efforts of the key industries in cleaner production, push forward the implementation of cleaner transformation and promote the emission reduction of pollutants. Especially in the primary and tertiary industries, the policy of “returning farmland to forests” and the development of tourism and other advantageous industries should be actively implemented.
Finally, the following measures should be taken to reduce the intensity of carbon emissions in key areas: Actively carry out work related to carbon emissions trading; promote regional synergistic innovation and green transformation of the economy; reduce the dependence of economic development on land expansion and effectively curb the growth of carbon emissions.

Author Contributions

Conceptualization, Y.C.; Software, Y.C.; Validation, C.Z.; Data curation, C.Z.; Writing—review & editing, C.Z. All authors have read and agreed to the published version of the manuscript.

Funding

This research received no external funding.

Institutional Review Board Statement

Not applicable.

Informed Consent Statement

Informed consent was obtained from all subjects involved in the study.

Data Availability Statement

Data are contained within the article.

Conflicts of Interest

The authors declare no conflict of interest.

References

  1. Chuai, X.; Huang, X.; Wang, W.; Zhao, R.; Zhang, M.; Wu, C. Land use, total carbon emissions change and low carbon land management in Coastal Jiangsu, China. J. Clean. Prod. 2015, 103, 77–86. [Google Scholar] [CrossRef]
  2. IPCC. Climate Change 2023 Synthesis Report. 2023. Available online: https://www.ipcc.ch/report/ar6/syr/downloads/report/IPCC_AR6_SYR_LongerReport (accessed on 28 August 2024).
  3. Li, L.; Huang, X.; Yang, H. Optimizing land use patterns to improve the contribution of land use planning to carbon neutrality target. Land Use Policy 2023, 135, 106959. [Google Scholar] [CrossRef]
  4. Liu, C.; Xu, R.; Xu, K.; Lin, Y.; Cao, Y. Carbon Emission Effects of Land Use in Chaobai River Region of Beijing–Tianjin–Hebei, China. Land 2023, 12, 1168. [Google Scholar] [CrossRef]
  5. Yang, F.; He, F.; Li, S.; Li, M.; Wu, P. A new estimation of carbon emissions from land use and land cover change in China over the past 300 years. Sci. Total Environ. 2023, 863, 160963. [Google Scholar] [CrossRef] [PubMed]
  6. Cui, Y.; Li, L.; Chen, L.; Zhang, Y.; Cheng, L.; Zhou, X.; Yang, X. Land-Use Carbon Emissions Estimation for the Yangtze River Delta Urban Agglomeration Using 1994–2016 Landsat Image Data. Remote. Sens. 2018, 10, 1334. [Google Scholar] [CrossRef]
  7. Zhang, Y.; Lin, W.; Ren, E.; Yu, Y. Evaluation of spatial distribution of carbon emissions from land use and environmental parameters: A case study in the Yangtze River Delta demonstration zone. Ecol. Indic. 2024, 158, 111496. [Google Scholar] [CrossRef]
  8. Zhang, C.Y.; Zhao, L.; Zhang, H.; Chen, M.N.; Fang, R.Y.; Yao, Y.; Wang, Q. Spatial-temporal characteristics of carbon emissions from land use change in Yellow River Delta region, China. Ecol. Indic. 2022, 136, 108623. [Google Scholar] [CrossRef]
  9. Rossi, F.S.; La Scala, N.; Capristo-Silva, G.F.; Della-Silva, J.L.; Teodoro, L.P.R.; Almeida, G.; Tiago, A.V.; Teodoro, P.E.; da Silva Junior, C.A. Implications of CO2 emissions on the main land and forest uses in the Brazilian Amazon. Environ. Res. 2023, 227, 115729. [Google Scholar] [CrossRef]
  10. Hung, L.Q.; Asaeda, T.; Thao, V.T.P. Carbon emissions in the field of land use, land use change, and forestry in the Vietnam mainland. Wetl. Ecol. Manag. 2021, 29, 315–329. [Google Scholar] [CrossRef]
  11. Rajbanshi, J.; Das, S. Changes in carbon stocks and its economic valuation under a changing land use pattern—A multitemporal study in Konar catchment, India. Land Degrad. Dev. 2021, 32, 3573–3587. [Google Scholar] [CrossRef]
  12. Zheng, S.; Huang, Y.; Sun, Y. Effects of urban form on carbon emissions in china: Implications for low-carbon urban planning. Land 2022, 11, 1343. [Google Scholar] [CrossRef]
  13. Kondo, M.; Ichii, K.; Patra, P.K.; Canadell, J.G.; Poulter, B.; Sitch, S.; Rödenbeck, C. Land use change and El Niño-Southern Oscillation drive decadal carbon balance shifts in Southeast Asia. Nat. Commun. 2018, 9, 1154. [Google Scholar] [CrossRef] [PubMed]
  14. Zhao, Y.; Ma, S.; Fan, J.; Cai, Y. Examining the effects of land use on carbon emissions: Evidence from Pearl River Delta. Int. J. Environ. Res. Public Health 2021, 18, 3623. [Google Scholar] [CrossRef] [PubMed]
  15. Tang, W.; Cui, L.; Zheng, S.; Hu, W. Multi-scenario simulation of land use carbon emissions from energy consumption in Shenzhen, China. Land 2022, 11, 1673. [Google Scholar] [CrossRef]
  16. Wei, B.; Kasimu, A.; Reheman, R.; Zhang, X.; Zhao, Y.; Aizizi, Y.; Liang, H. Spatiotemporal characteristics and prediction of carbon emissions/absorption from land use change in the urban agglomeration on the northern slope of the Tianshan Mountains. Ecol. Indic. 2023, 151, 110329. [Google Scholar] [CrossRef]
  17. Xia, C.; Zhang, J.; Zhao, J.; Xue, F.; Li, Q.; Fang, K.; Zhou, J. Exploring potential of urban land-use management on carbon emissions—A case of Hangzhou, China. Ecol. Indic. 2023, 146, 109902. [Google Scholar] [CrossRef]
  18. Yuan, Y.; Chuai, X.; Xiang, C.; Gao, R. Carbon emissions from land use in Jiangsu, China, and analysis of the regional interactions. Environ. Sci. Pollut. Res. 2022, 29, 44540. [Google Scholar] [CrossRef]
  19. Feng, Y.; Chen, S.; Tong, X.; Lei, Z.; Gao, C.; Wang, J. Modeling changes in China’s 2000–2030 carbon stock caused by land use change. J. Clean Prod. 2020, 252, 119659. [Google Scholar] [CrossRef]
  20. Meng, Q.; Zheng, Y.; Liu, Q.; Li, B.; Wei, H. Analysis of spatiotemporal variation and influencing factors of land-use carbon emissions in nine provinces of the yellow river basin based on the LMDI model. Land 2023, 12, 437. [Google Scholar] [CrossRef]
  21. Cui, X.; Wei, X.; Liu, W.; Zhang, F.; Li, Z. Spatial and temporal analysis of carbon sources and sinks through land use/cover changes in the Beijing-Tianjin-Hebei urban agglomeration region. Phys. Chem. Earth. Parts A/B/C 2019, 110, 61–70. [Google Scholar] [CrossRef]
  22. Wang, C.; Zhan, J.; Zhang, F.; Liu, W.; Twumasi-Ankrah, M.J. Analysis of urban carbon balance based on land use dynamics in the Beijing-Tianjin-Hebei region, China. J. Clean. Prod. 2021, 281, 125138. [Google Scholar] [CrossRef]
  23. Zhou, Y.; Chen, M.; Tang, Z.; Mei, Z. Urbanization, land use change, and carbon emissions: Quantitative assessments for city-level carbon emissions in Beijing-Tianjin-Hebei region. Sust. Cities Soc. 2021, 66, 102701. [Google Scholar] [CrossRef]
  24. Xu, Q.; Yang, R.; Dong, Y.X.; Liu, Y.X.; Qiu, L.R. The influence of rapid urbanization and land use changes on terrestrial carbon sources/sinks in Guangzhou, China. Ecol. Indic. 2016, 70, 304–316. [Google Scholar] [CrossRef]
  25. Guo, B.; Wu, H.; Pei, L.; Zhu, X.; Zhang, D.; Wang, Y.; Luo, P. Study on the spatiotemporal dynamic of ground-level ozone concentrations on multiple scales across China during the blue sky protection campaign. Environ. Int. 2022, 170, 107606. [Google Scholar] [CrossRef]
  26. Li, J.; Sun, Z.; Zhou, J.; Sow, Y.; Cui, X.; Chen, H.; Shen, Q. The impact of the digital economy on carbon emissions from cultivated land use. Land 2023, 12, 665. [Google Scholar] [CrossRef]
  27. Chen, Y.; Lu, H.; Li, J.; Xia, J. Effects of land use cover change on carbon emissions and ecosystem services in Chengyu urban agglomeration, China. Stoch. Environ. Res. Risk Assess. 2020, 34, 1197–1215. [Google Scholar] [CrossRef]
  28. Li, L.; Li, J.; Peng, L.; Wang, X.; Sun, S. Spatiotemporal evolution and influencing factors of land-use emissions in the Guangdong-Hong Kong-Macao Greater Bay Area using integrated nighttime light datasets. Sci. Total Environ. 2023, 893, 164723. [Google Scholar] [CrossRef] [PubMed]
  29. Fu, B.; Wu, M.; Che, Y.; Yang, K. Effects of land-use changes on city-level net carbon emissions based on a coupled model. Carbon Manag. 2017, 8, 245–262. [Google Scholar] [CrossRef]
  30. Jain, A.K.; Meiyappan, P.; Song, Y.; House, J.I. CO2 emissions from land-use change affected more by nitrogen cycle, than by the choice of land-cover data. Glob. Chang. Biol. 2013, 19, 2893–2906. [Google Scholar] [CrossRef]
  31. Fu, W.; Yang, S.; Hu, S.; Zhang, P. The impact of embodied land flow in interregional trade on carbon emissions in China. Appl. Geogr. 2023, 159, 103065. [Google Scholar] [CrossRef]
  32. Zhou, D.; Huang, Q.; Chong, Z. Analysis on the effect and mechanism of land misallocation on carbon emissions efficiency: Evidence from China. Land Use Policy 2022, 121, 106336. [Google Scholar] [CrossRef]
  33. Luo, H.; Li, Y.; Gao, X.; Meng, X.; Yang, X.; Yan, J. Carbon emission prediction model of prefecture-level administrative region: A land-use-based case study of Xi’an city, China. Appl. Energy 2023, 348, 121488. [Google Scholar] [CrossRef]
  34. Wu, S.; Hu, S.; Frazier, A.E. Spatiotemporal variation and driving factors of carbon emissions in three industrial land spaces in China from 1997 to 2016. Technol. Forecast. Soc. Chang. 2021, 169, 120837. [Google Scholar] [CrossRef]
  35. Yu, Z.; Lu, C.; Tian, H.; Canadell, J.G. Largely underestimated carbon emission from land use and land cover change in the conterminous United States. Glob. Chang. Biol. 2019, 25, 3741–3752. [Google Scholar] [CrossRef] [PubMed]
  36. Cai, C.; Fan, M.; Yao, J.; Zhou, L.; Wang, Y.; Liang, X.; Chen, S. Spatial-temporal characteristics of carbon emissions corrected by socio-economic driving factors under land use changes in Sichuan Province, southwestern China. Ecol. Inform. 2023, 77, 102164. [Google Scholar] [CrossRef]
  37. Kang, T.; Wang, H.; He, Z.; Liu, Z.; Ren, Y.; Zhao, P. The effects of urban land use on energy-related CO2 emissions in China. Sci. Total Environ. 2023, 870, 161873. [Google Scholar] [CrossRef]
  38. Gui, D.; He, H.; Liu, C.; Han, S. Spatio-temporal dynamic evolution of carbon emissions from land use change in Guangdong Province, China, 2000–2020. Ecol. Indic. 2023, 156, 111131. [Google Scholar] [CrossRef]
  39. Jones, C.D.; Ciais, P.; Davis, S.J.; Friedlingstein, P.; Gasser, T.; Peters, G.P.; Rogelj, J.; van Vuuren, D.P.; Canadell, J.G.; Cowie, A.; et al. Simulating the Earth system response to negative emissions. Environ. Res. Lett. 2016, 11, 095012. [Google Scholar] [CrossRef]
  40. Wang, X.; Zhao, X.; Zhang, S.; Shi, S.; Zhang, X. Decoupling Effect and Driving Factors of Land-Use Carbon Emissions in the Yellow River Basin Using Remote Sensing Data. Remote Sens. 2023, 15, 4446. [Google Scholar] [CrossRef]
  41. Dunn, J.B.; Mueller, S.; Kwon, H.Y.; Wang, M.Q. Land-use change and greenhouse gas emissions from corn and cellulosic ethanol. Biotechnol. Biofuels 2013, 6, 1–13. [Google Scholar] [CrossRef]
  42. Gong, J.; Shi, J.; Zhu, C.; Li, X.; Zhang, Z.; Zhang, W.; Hu, Y. Accounting for land use in an analysis of the spatial and temporal characteristics of ecosystem services supply and demand in a desert steppe of Inner Mongolia, China. Ecol. Indic. 2022, 144, 109567. [Google Scholar] [CrossRef]
  43. Yang, X.; Liu, X. Path analysis and mediating effects of influencing factors of land use carbon emissions in Chang-Zhu-Tan urban agglomeration. Technol. Forecast. Soc. Chang. 2023, 188, 122268. [Google Scholar] [CrossRef]
  44. Zhao, L.; Chen, M.-N.; Yang, C.-H.; Zhang, R.-Z.; Zhang, Q.-P.; Wang, Q. Characteristics of spatial and temporal carbon emissions from different land uses in Shanxi section of the Yellow River, China. Environ. Dev. Sustain. 2024, 26, 20869–20884. [Google Scholar] [CrossRef]
  45. Xia, J.; Wang, J.; Lai, Y. Development Strategy Based on Combination Typologies of Building Carbon Emissions and Urban Vibrancy—A Multi-Sourced Data-Driven Approach in Beijing, China. Land 2024, 13, 1062. [Google Scholar] [CrossRef]
  46. Zhang, W.; Wang, M.Y. Spatial-temporal characteristics and determinants of land urbanization quality in China: Evidence from 285 prefecture-level cities. Sustain. Cities Soc. 2018, 38, 70–79. [Google Scholar] [CrossRef]
  47. Simmons, C.T.; Matthews, H.D. Assessing the implications of human land-use change for the transient climate response to cumulative carbon emissions. Environ. Res. Lett. 2016, 11, 035001. [Google Scholar] [CrossRef]
  48. Pan, L.; Yu, J.; Lin, L. The temporal and spatial pattern evolution of land-use carbon emissions in China coastal regions and its response to green economic development. Front. Environ. Sci. 2022, 10, 1018372. [Google Scholar] [CrossRef]
  49. Cai, Y.; Li, K. Spatiotemporal dynamic evolution and influencing factors of land use carbon emissions: Evidence from Jiangsu Province, China. Front. Environ. Sci. 2024, 12, 1368205. [Google Scholar] [CrossRef]
  50. Xiong, C.; Yang, D.; Huo, J. Spatial-temporal characteristics and LMDI-based impact factor decomposition of agricultural carbon emissions in Hotan Prefecture, China. Sustainability 2016, 8, 262. [Google Scholar] [CrossRef]
  51. Chen, L.; Hang, Y.; Li, Q. Spatial-temporal characteristics and influencing factors of carbon emissions from land use and land cover in black soil region of Northeast China based on LMDI simulation. Sustainability 2023, 15, 9334. [Google Scholar] [CrossRef]
  52. Han, Y.; Ge, X. Spatial–Temporal Characteristics and Influencing Factors on Carbon Emissions from Land Use in Suzhou, the World’s Largest Industrial City in China. Sustainability 2023, 15, 13306. [Google Scholar] [CrossRef]
  53. Zhou, H.; Liu, Y.; Wang, C.; Yao, S.; Miao, Y.; Yu, S. Spatial Relationship between Land Use Efficiency and land expansion in China’s provincial cities: Based on the theory of Smart Growth. Areal Res. Dev. 2021, 40, 157–162. [Google Scholar]
  54. Kong, F.; Liu, X.; Zhou, H.; He, Q. Spatio-temporal evolution characteristics and influencing factors of the coupling coordination between new infrastructure construction and urban green development. Econ. Geogr. 2022, 42, 22–32. [Google Scholar]
  55. Wang, Q.; Xiao, Y. Has Urban Construction Land Achieved Low-Carbon Sustainable Development? A Case Study of North China Plain, China. Sustainability 2022, 14, 9434. [Google Scholar] [CrossRef]
  56. Zhang, R.; Zhang, X.; Yin, P. Spatial-temporal differentiation and driving factors identification of urban land resources carrying capacity in the Yangtze River Economic Belt. Econ. Geogr. 2022, 42, 185–192. [Google Scholar]
  57. Liu, Q.; Wang, H.; Wang, W.; Zhang, X.; Zhao, W.; Jia, Y. Establishment of environment and economic development quality assessment system and coupling coordination degree analysis in Sichuan Province. Environ. Protect. Sci. 2022, 48, 39–45. [Google Scholar]
  58. Sun, J.; Xue, Q. Has technological innovation improved the efficiency of carbon emissions? Ecol. Econ. 2022, 38, 22–28, 34. [Google Scholar]
  59. Zhu, E.; Deng, J.; Zhou, M.; Gan, M.; Jiang, R.; Wang, K.; Shahtahmassebi, A. Carbon emissions induced by land-use and land-cover change from 1970 to 2010 in Zhejiang, China. Sci. Total Environ. 2019, 646, 930–939. [Google Scholar] [CrossRef]
Figure 1. Study framework.
Sustainability 16 07565 g001
Figure 2. Diagram of the study area.
Sustainability 16 07565 g002
Figure 3. Characteristics of spatial distribution of land use change in Hubao-Eyu urban agglomeration from 2000 to 2020.
Sustainability 16 07565 g003
Figure 4. Changes to carbon sources and sinks in 39 prefecture-level cities in Hubao-Eyu urban agglomeration over the study period.
Sustainability 16 07565 g004aSustainability 16 07565 g004b
Figure 5. Spatial distribution of carbon emissions.
Sustainability 16 07565 g005aSustainability 16 07565 g005b
Figure 6. Standard deviation ellipse and center of gravity distribution of net carbon emissions in the Hubao-Eyu urban agglomeration from 2000 to 2020.
Sustainability 16 07565 g006
Figure 7. Spatial distribution of economy contributive coefficients associated with carbon emissions in the Hubao-Eyu urban agglomeration.
Sustainability 16 07565 g007
Figure 8. Spatial distribution of carbon ecological support coefficients in the Hubao-Eyu urban agglomeration.
Sustainability 16 07565 g008
Figure 9. Contribution of carbon emission drivers in Hubao-Eyu districts and counties, 2000–2020.
Sustainability 16 07565 g009
Table 1. Carbon emission factors for different land use types.
Land TypeCarbon Emission FactorsUnitReferences
Cultivated land0.4595t/hm2Guo et al. [25]
Forest land−0.6125t/hm2Li et al. [26]
Grass land−0.0215t/hm2Chen et al. [27]
Water land−0.2523t/hm2Li et al. [28]
Unused land−0.005t/hm2Fu et al. [29]
Table 2. Area proportions and dynamic degrees of different land use types from 2000 to 2020/%.
Land Use TypeArea ProportionAttitudes towards Land Use Change Dynamics
200020052010201520202000–20052005–20102010–20152015–2020
Cultivated land18.7118.3918.4018.3317.89−0.340.01−0.07−0.48
Forest land4.204.704.444.434.842.37−1.08−0.051.84
Grass land55.4154.5455.7455.6954.52−0.310.44−0.02−0.42
Water land1.951.901.821.801.96−0.50−0.90−0.131.75
Built-up land1.541.692.212.392.962.066.141.624.70
Unused land18.1918.7817.3917.3617.830.63−1.48−0.040.55
Table 3. Carbon emissions from land use in the Hubao-Eyu urban agglomeration by type, 2000–2020/104 t.
20002005201020152020
Cultivated land150.16147.62147.67147.13143.61
Forest land−44.96−50.24−47.54−47.43−51.78
Grass land−20.81−20.48−20.94−20.92−20.48
Water land−8.59−8.38−7.99−7.95−8.64
Built-up land1702.864022.857178.6620,522.0726,514.10
Unused land−1.59−1.64−1.52−1.52−1.56
Carbon emission 1853.024170.477326.3320,669.2026,657.71
Carbon credits−75.95−80.74−77.99−77.82−82.46
Net carbon emissions1777.074089.737248.3420,591.3826,575.25
Table 4. Changes in carbon emissions due to land use type shifts in the Hubao-Eyu urban agglomeration, 2000–2020/t.
20002020
Cultivated LandForest LandGrass LandWater LandBuilt-Up
Land
Unused
Land
Accumulation
Cultivated land_−7131.30−37,146.54−1631.7724,550.53−1609.15−22,968.23
Forest land7129.66_6133.74139.562766.47761.4216,930.85
Grass land37,587.57−6335.26_−916.8320,528.69550.8951,415.06
Water land1691.90−148.16−918.90_2086.43368.683079.95
Built-up land−22,497.47−2625.32−18,709.63−1905.24_−2833.34−48,571.00
Unused land1612.79−780.81−545.27−367.943032.17_2950.94
Accumulation25,524.45−17,020.85−51,186.60−4682.2252,964.29−2761.50_
Table 5. Shift of net carbon emission centers in the Hubao-Eyu urban agglomeration, 2000–2020.
Year2000–20052005–20102010–20152015–2020
Displacement/km42.526.6568.402.81
Table 6. Elliptic parameters of standard deviation of net carbon emissions of the Hubao-Eyu urban agglomeration, 2000–2020.
YearArea/km2Length/kmCenter X/(°)CenterY/(°)X StdDist/kmY StdDist/kmAzimuths AngleOblateness
200039,928.86744.41110.0340.2386.90146.2626.810.41
200546,074.99779.28110.4039.99101.23144.8824.840.31
201041,986.30768.03110.4039.9387.70152.398.000.42
201537,314.44705.43110.1439.3489.19133.1719.220.33
202040,044.06722.80110.0339.3796.33132.3326.140.27
Table 7. Contribution Value and Contribution Rate of Carbon Emission Drivers in the Hubao-Eyu urban agglomeration, 2000–2020.
IndexContribution Value/104 tonContribution/%
2000–20052005–20102010–20152015–20202000–20052005–20102010–20152015–2020
carbon
emissions intensity
1783.21−273.4010,203.16−2666.0176.78−11.77439.29−114.78
Land use structure539.443426.593140.238476.5123.22147.53135.20364.95
Land use intensity per unit of GDP−3416.70−6492.35−4943.79−7154.88−147.11−279.53−212.85−308.05
Economic levels2970.896721.52845.863496.24127.91289.3936.42150.53
Population size445.82−229.174097.933657.9419.19−9.87176.44157.49
Disclaimer/Publisher’s Note: The statements, opinions and data contained in all publications are solely those of the individual author(s) and contributor(s) and not of MDPI and/or the editor(s). MDPI and/or the editor(s) disclaim responsibility for any injury to people or property resulting from any ideas, methods, instructions or products referred to in the content.

