


Multi-Source Data-Based Investigation of Spatiotemporal Heterogeneity and Driving Mechanisms of Coupling and Coordination in Human Settlements in Urban Agglomeration in the Middle Reaches of the Yangtze River


Abstract
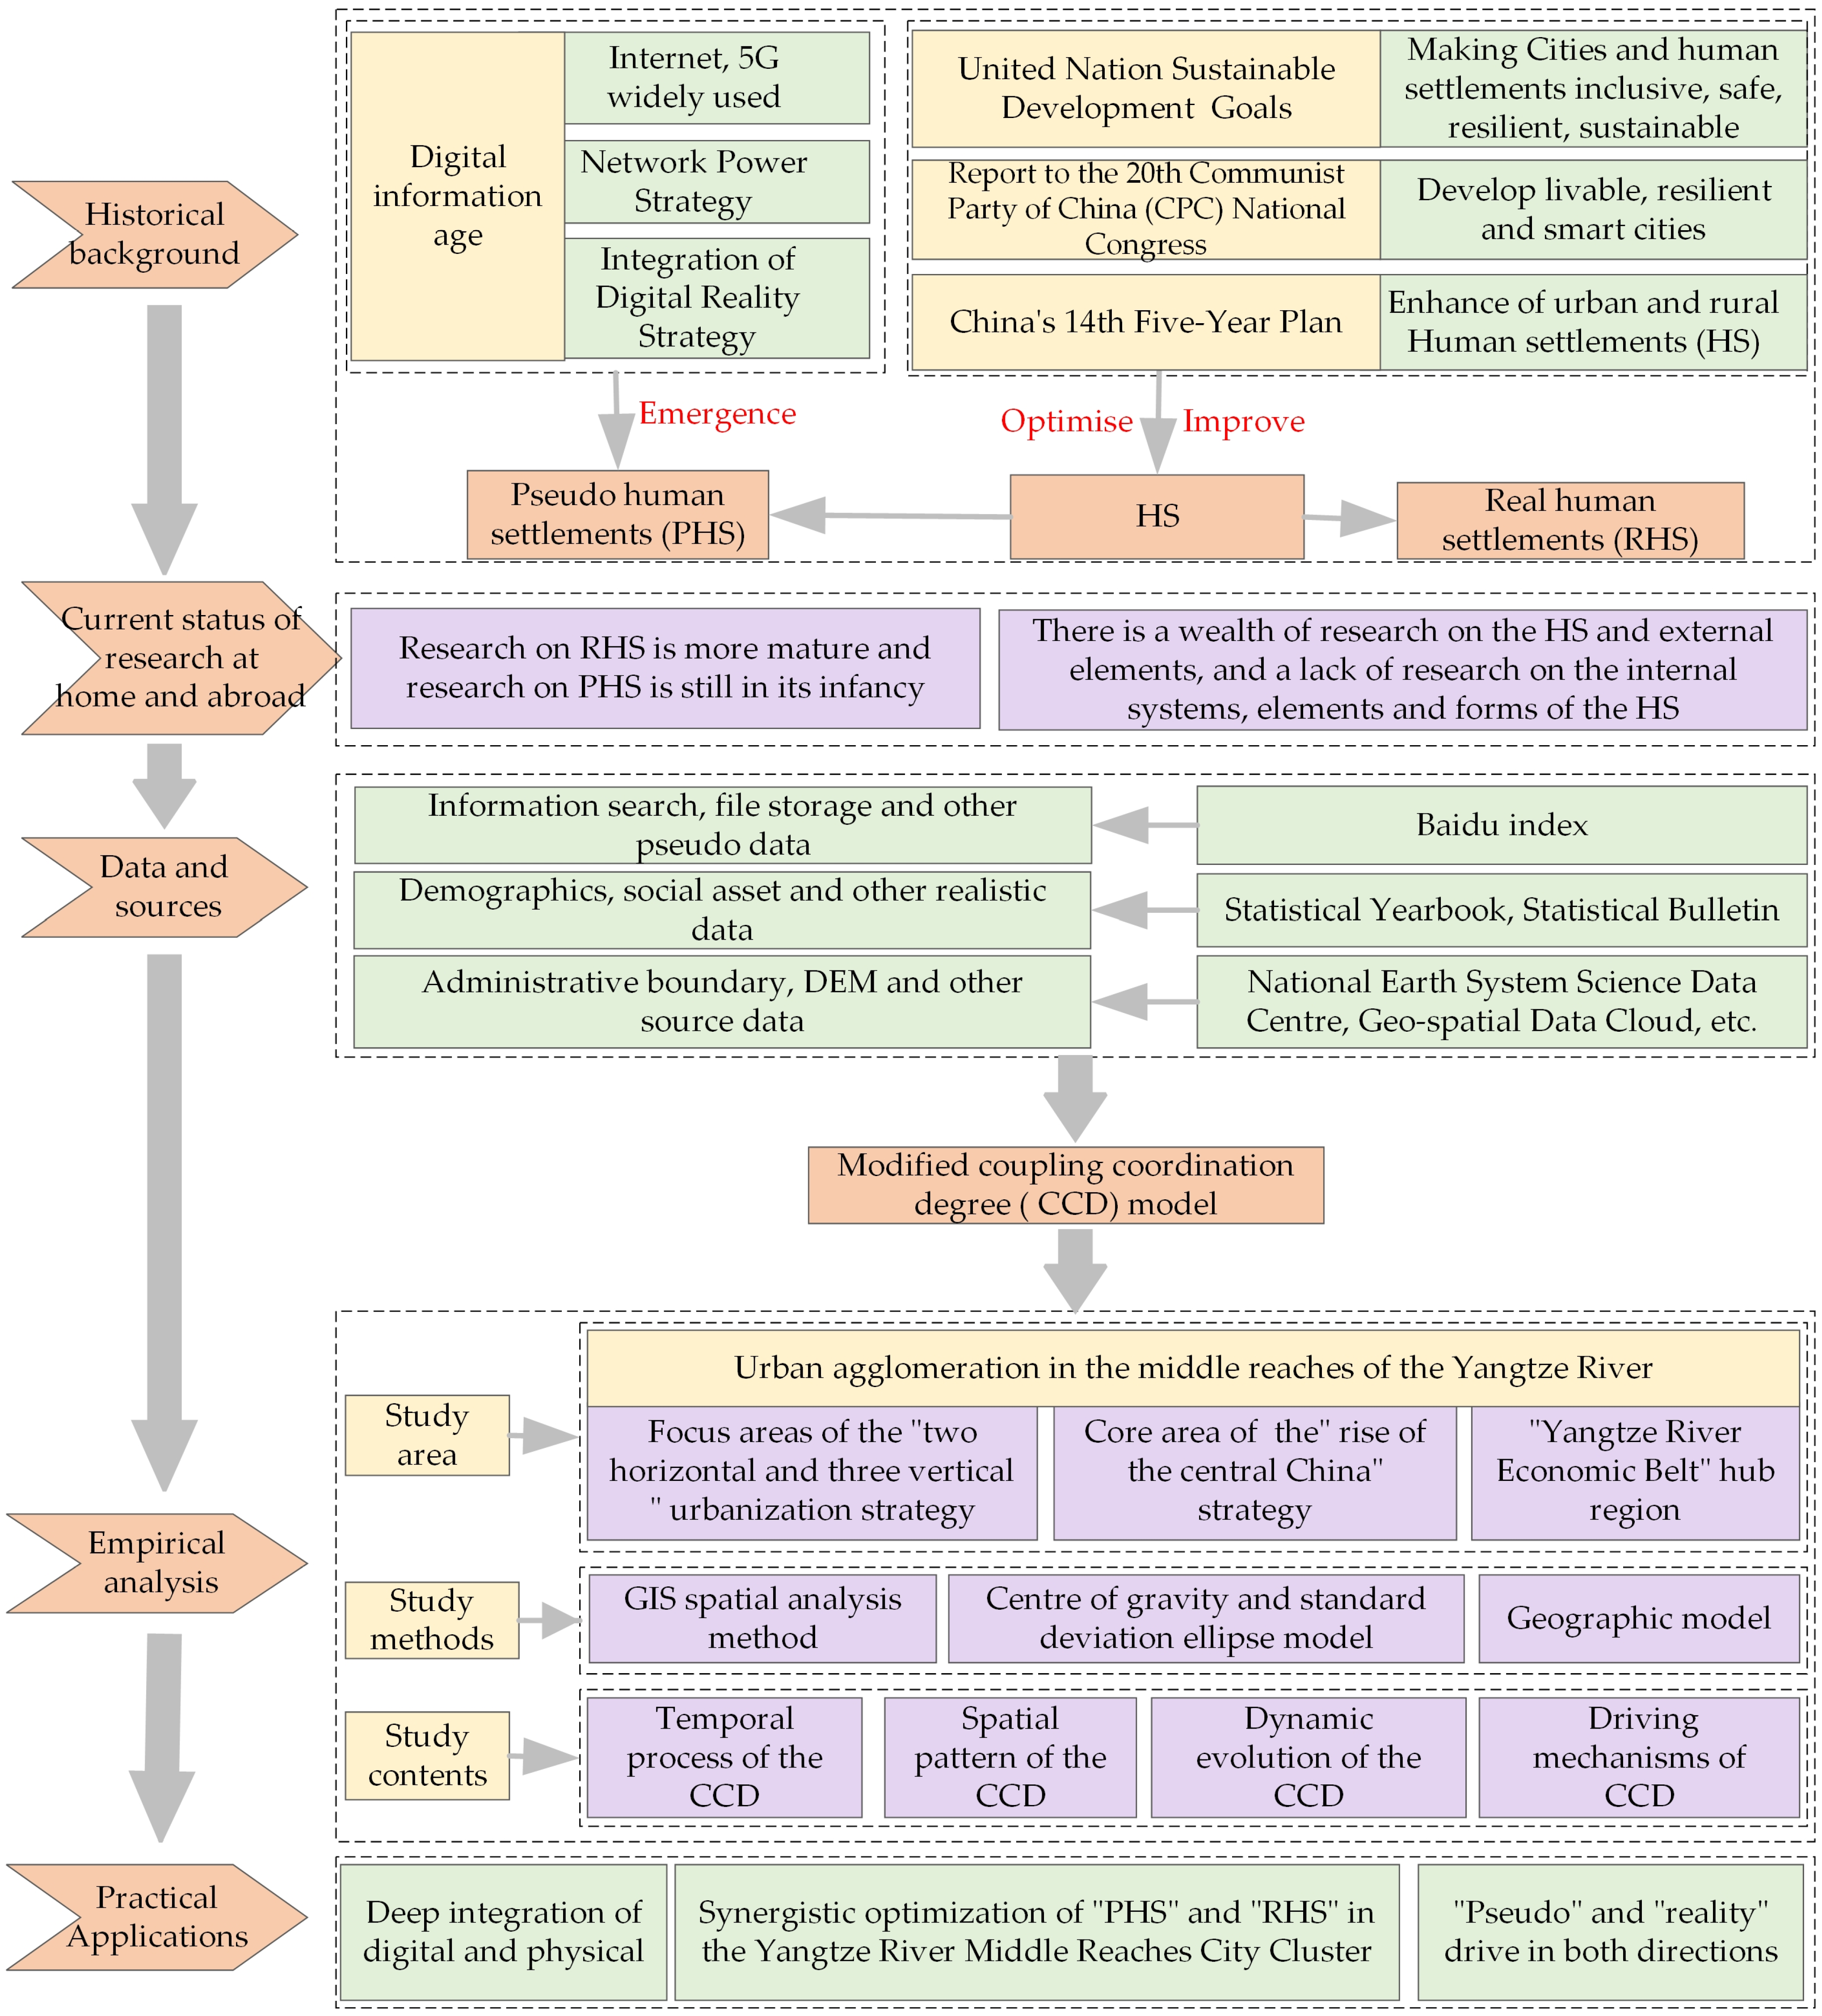
:1. Introduction
2. Research Methods and Data Sources
2.1. Study Area and Data Sources
2.1.1. Brief Description of the Study Area
2.1.2. Index System and Data Sources
2.2. Research Methods
2.2.1. Modified CCD Model
2.2.2. Trend Surface Analysis
2.2.3. Center of Gravity (CoG) and Standard Deviation Ellipse (SDE) Model
2.2.4. Geographical Detector Model
3. Results Analysis
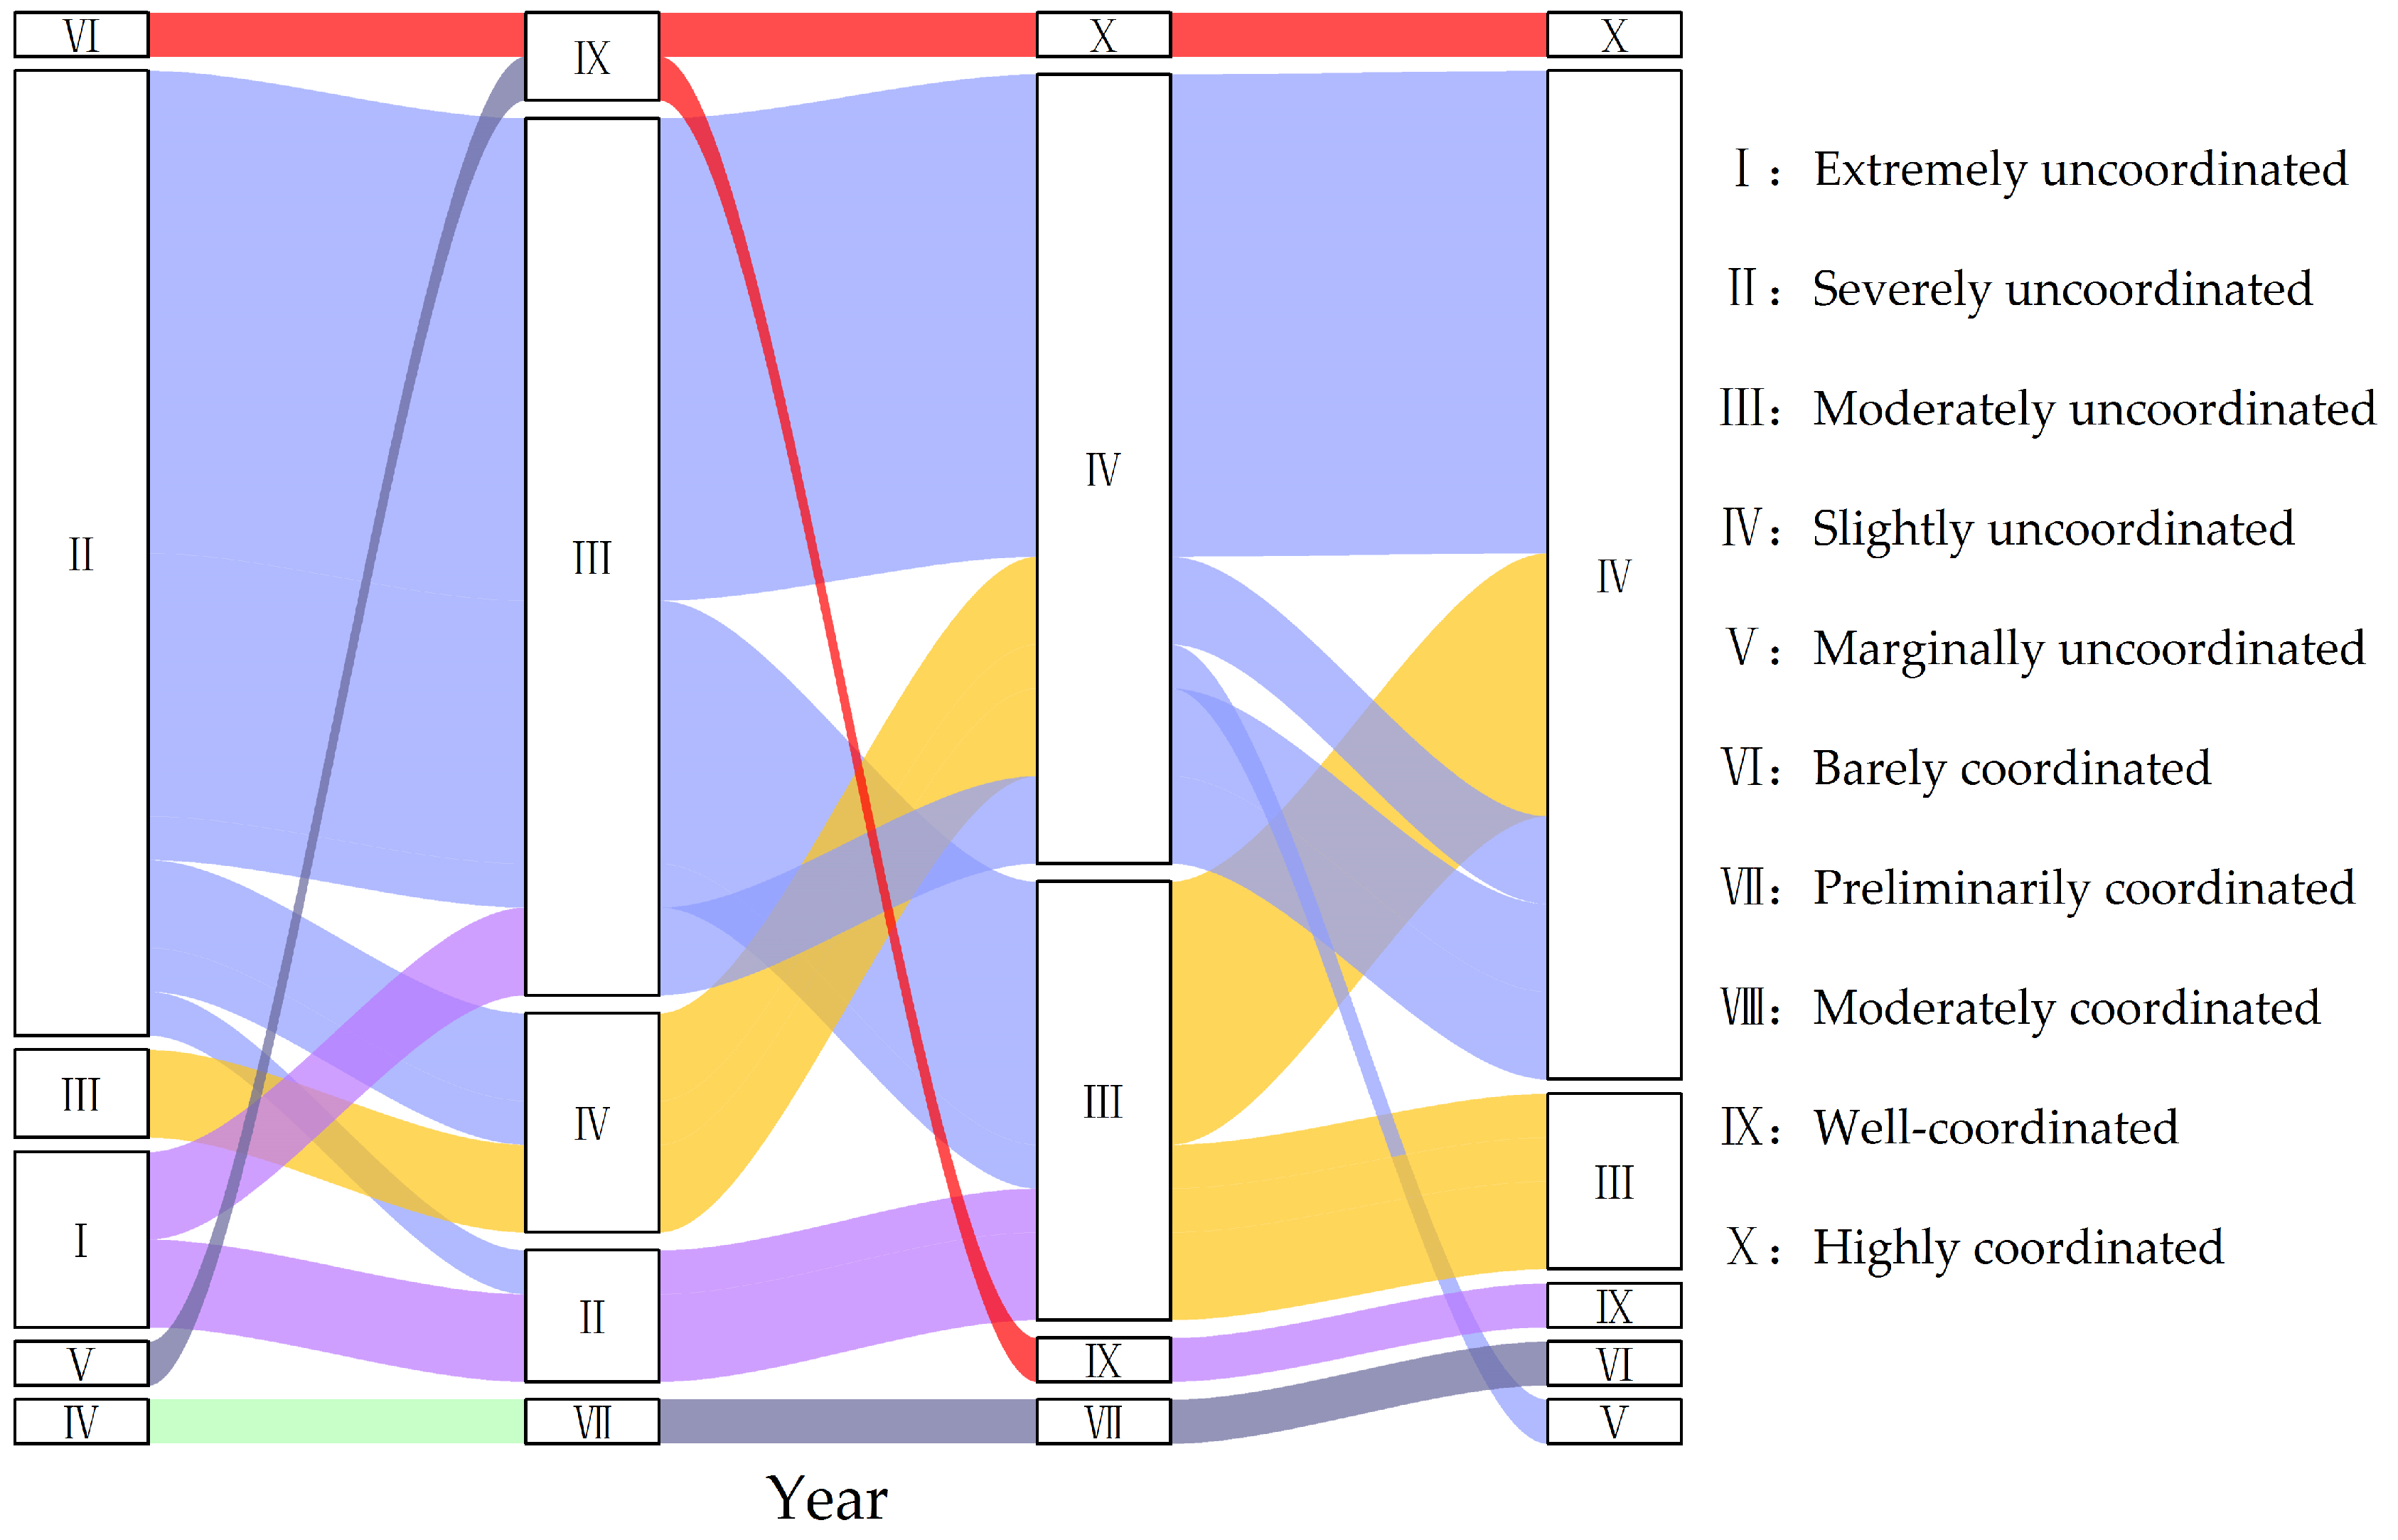
3.1. Temporal Evolution of the PHS–RHS CCD in UAMRYR
3.2. Spatial Pattern of the PHS–RHS CCD in the UAMRYR
3.2.1. Spatial Pattern
3.2.2. Analysis of Inter-Provincial Variations
3.3. Dynamic Evolution of the PHS–RHS CCD in the UAMRYR
3.3.1. CoG Migration Analysis
3.3.2. SDE Analysis
3.4. Driving Mechanisms of PHS–RHS Coupling and Coordination in the UAMRYR
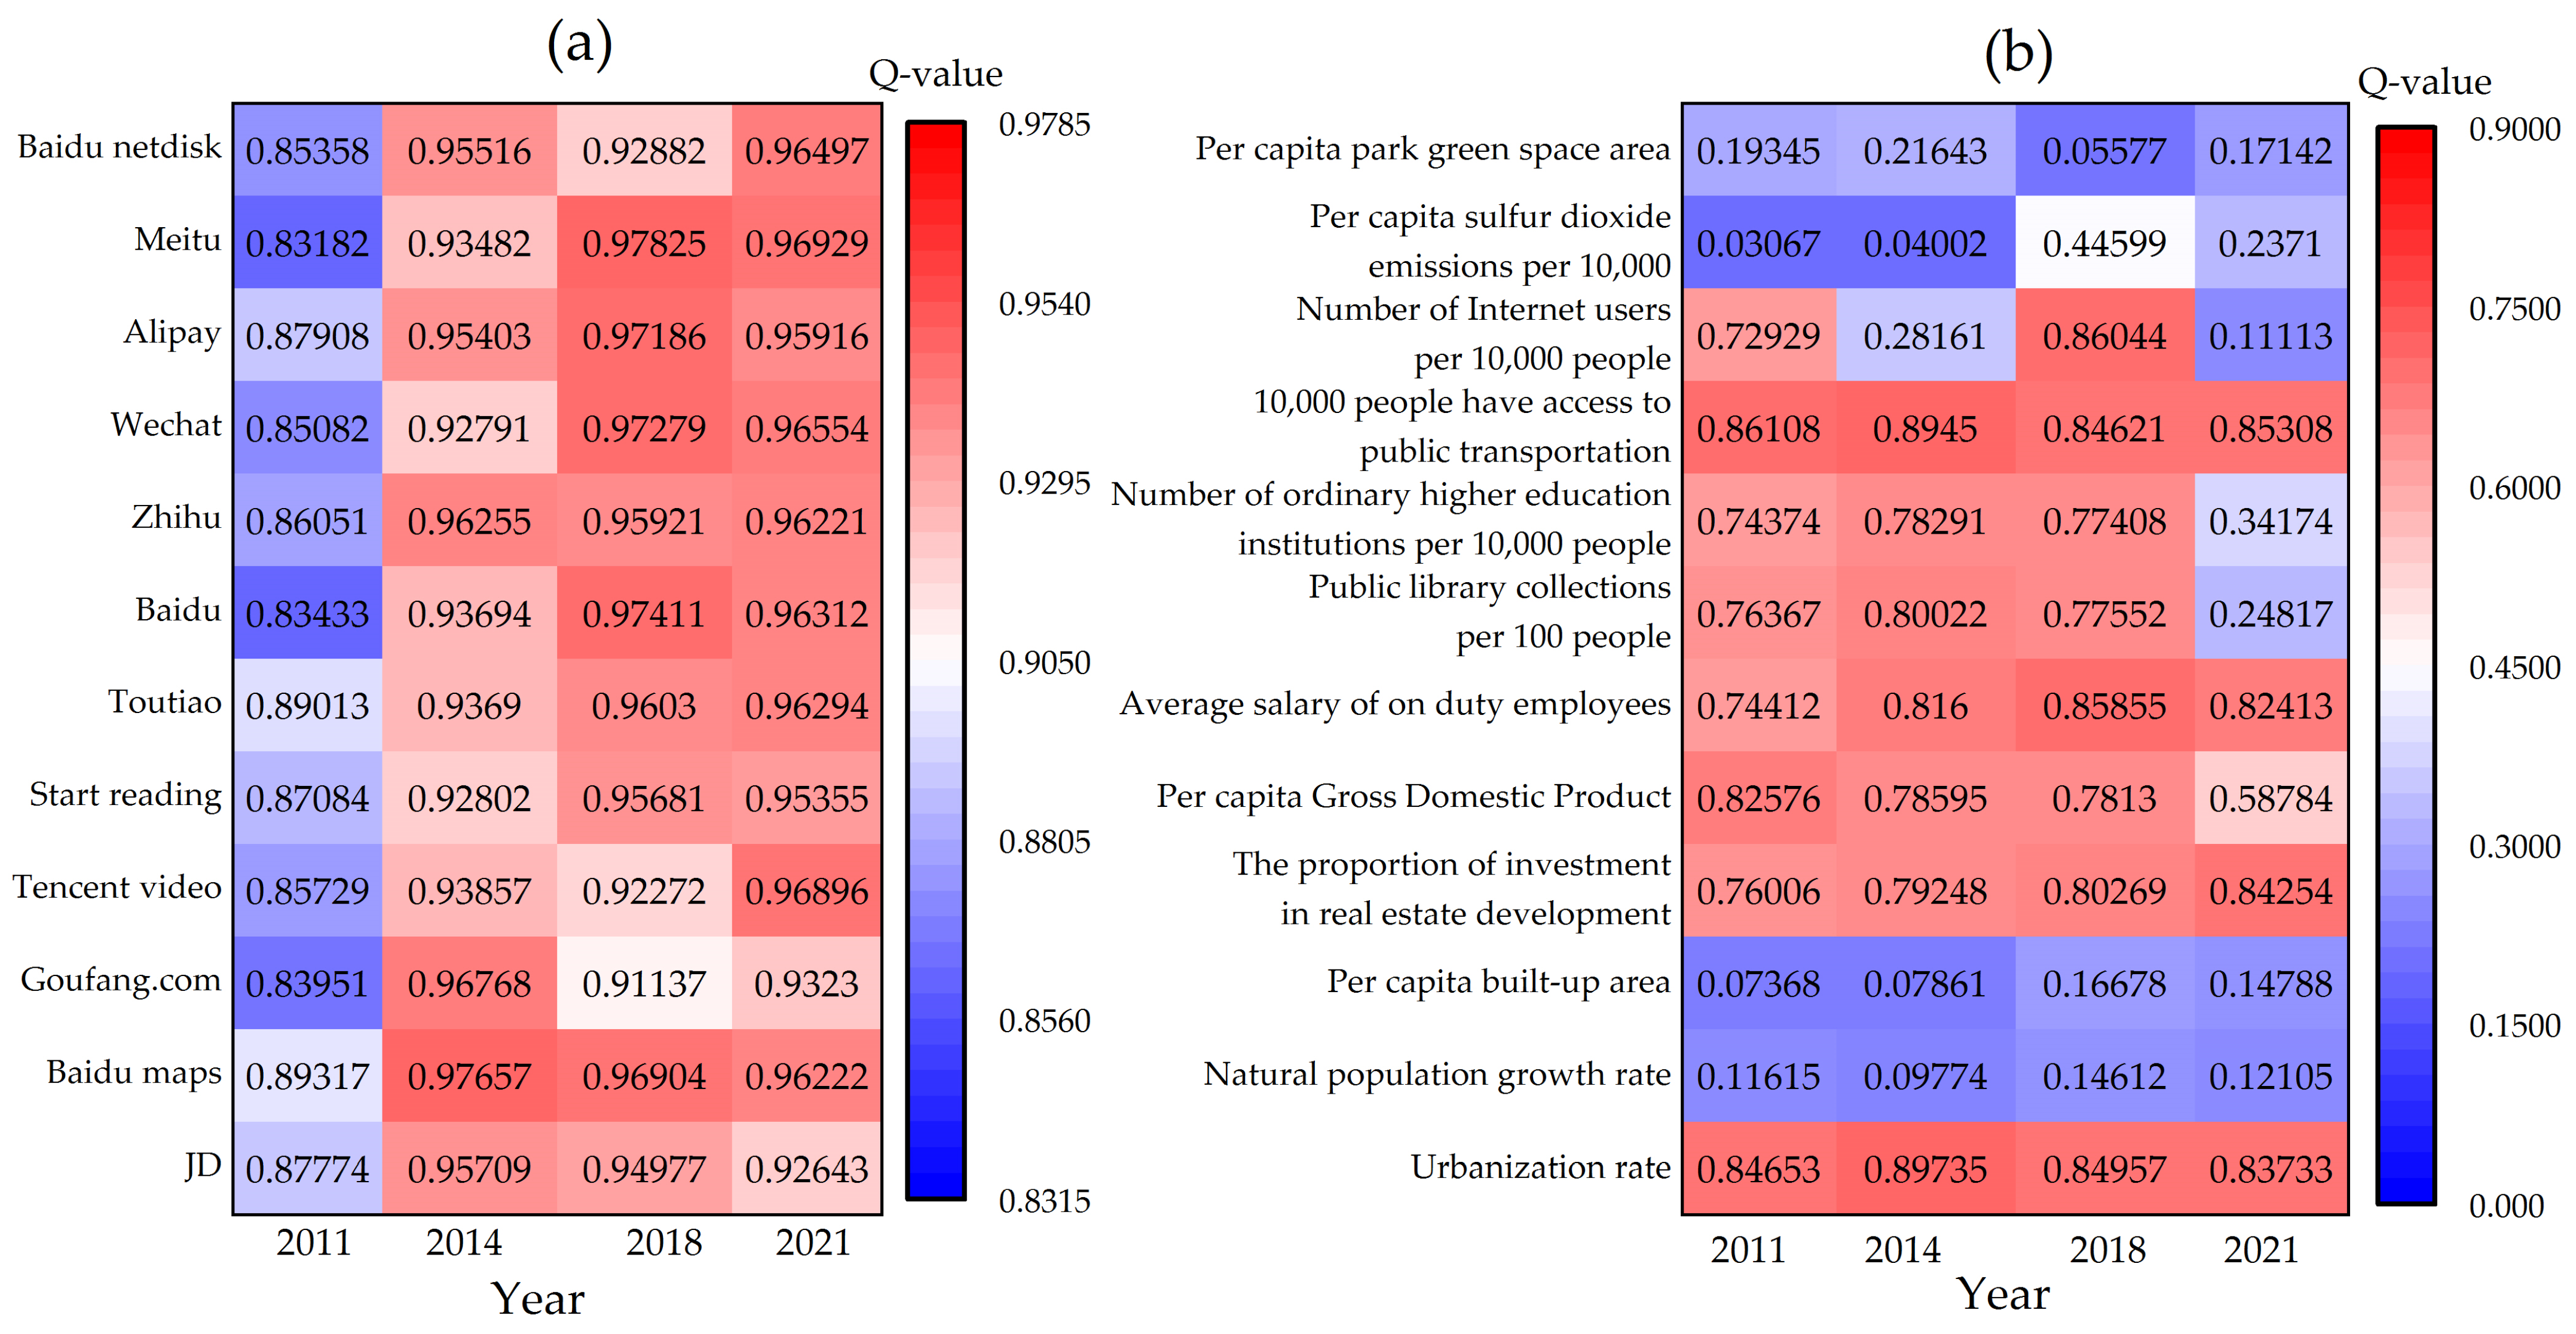
3.4.1. Factor Analysis
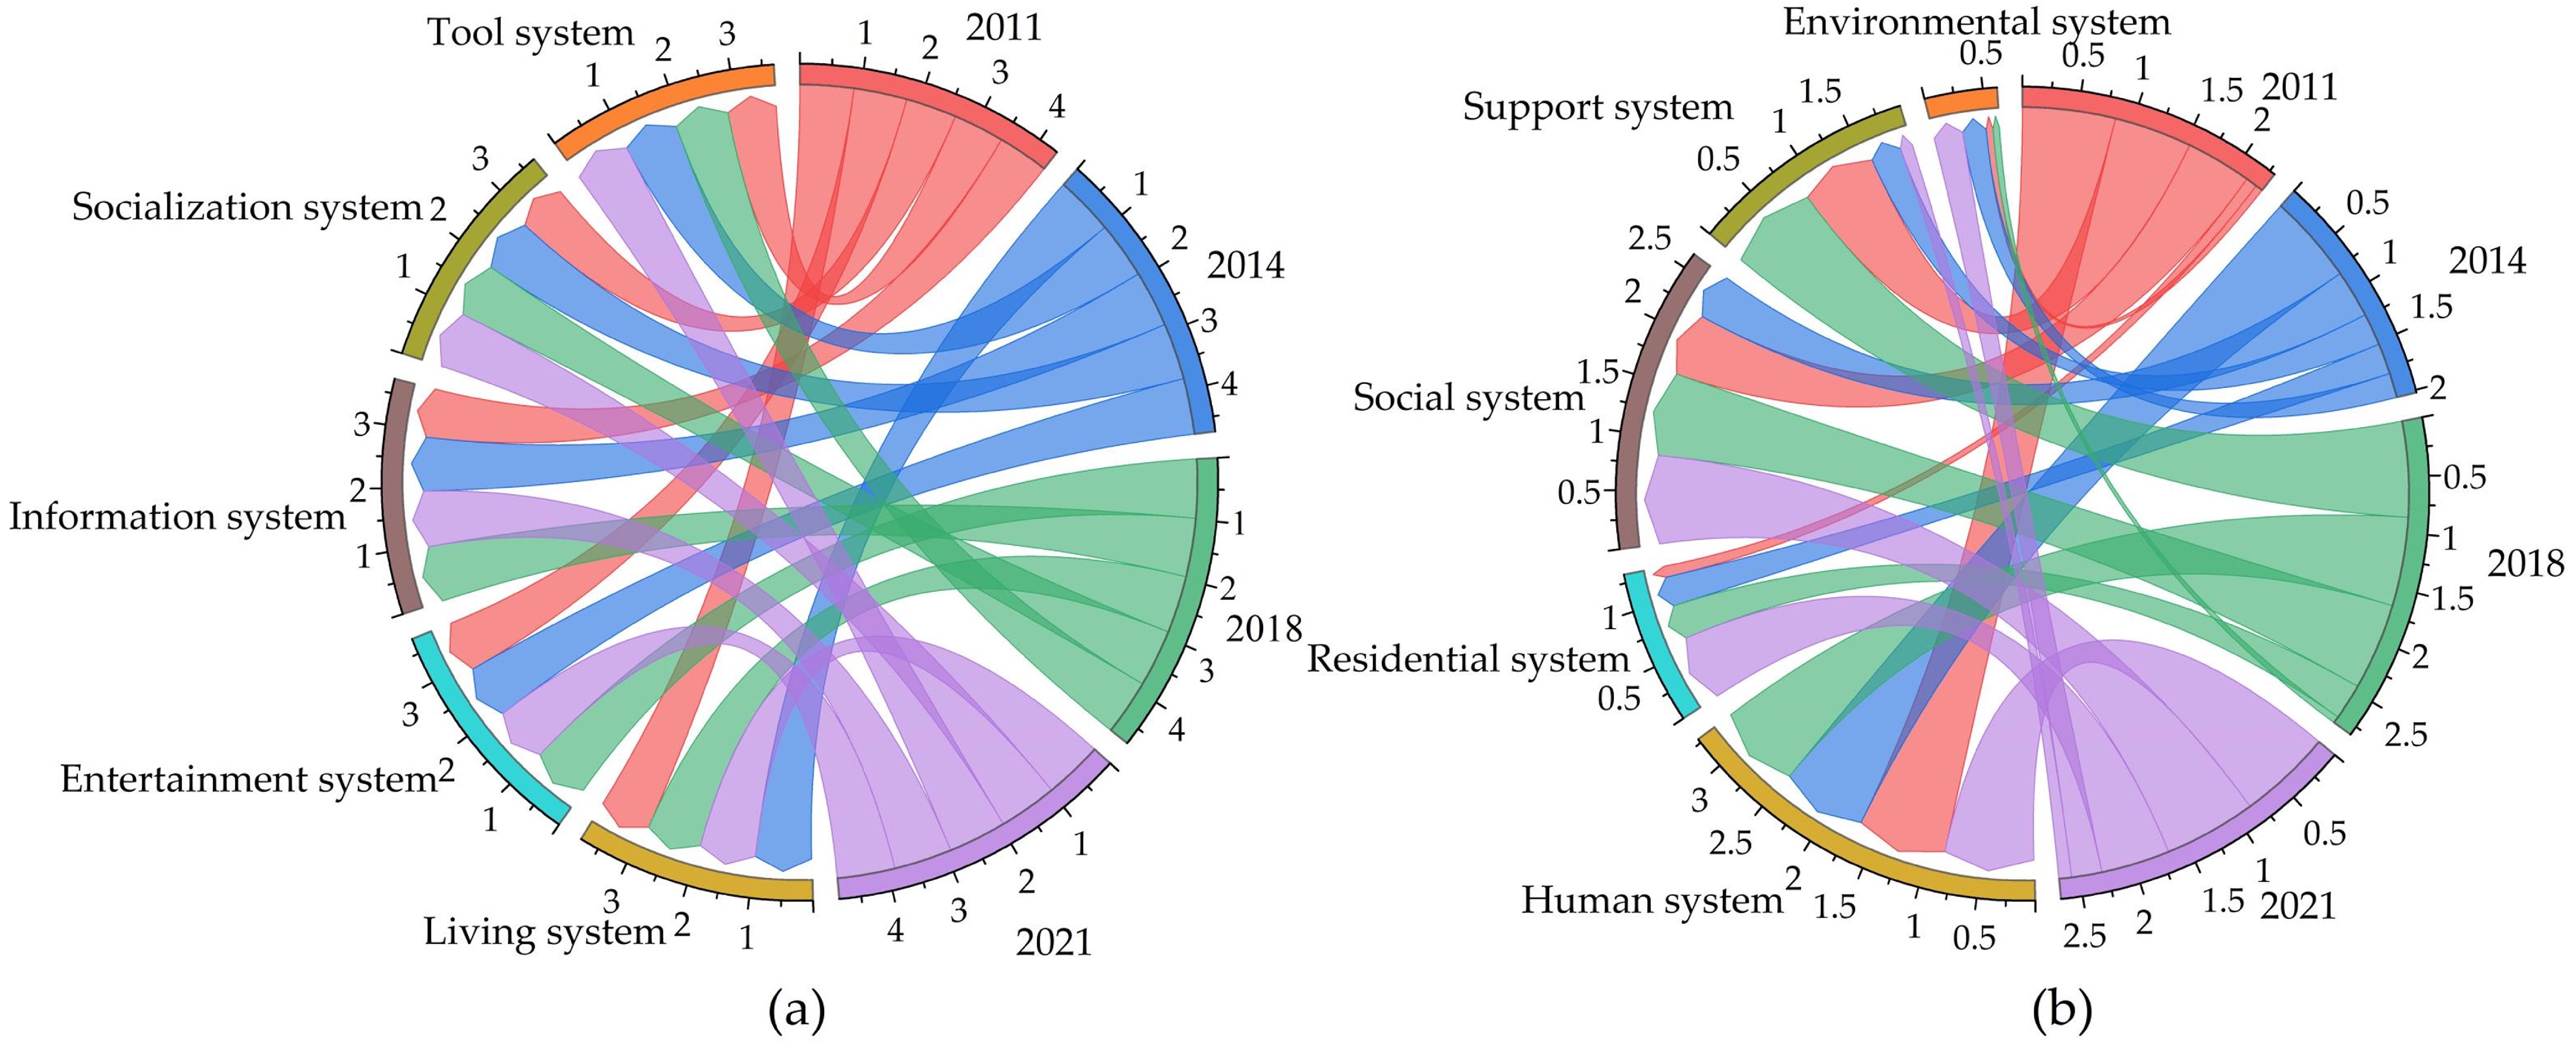
3.4.2. System Analysis
3.4.3. Morphological Analysis
3.4.4. Discussion of Mechanisms
4. Discussion
4.1. Spatiotemporal Characteristics of PHS–RHS Coupling and Coordination
4.2. Driving Mechanisms of PHS–RHS Coupling and Coordination
4.3. Policy Recommendations
4.4. Limitations and Future Work
5. Conclusions
Author Contributions
Funding
Institutional Review Board Statement
Informed Consent Statement
Data Availability Statement
Conflicts of Interest
References
- Wu, L. Introduction to Sciences of Human Settlements, 1st ed.; China Construction Industry Press: Beijing, China, 2001; pp. 222–228. [Google Scholar]
- Nilforoshan, H.; Looi, W.; Pierson, E.; Villanueva, B.; Fishman, N.; Chen, Y.; Sholar, J.; Redbird, B.; Grusky, D.; Leskovec, J. Human mobility networks reveal increased segregation in large cities. Nature 2023, 624, 586–592. [Google Scholar] [CrossRef] [PubMed]
- Hong, S.; Hyoung Kim, S.; Kim, Y.; Park, J. Big Data and government: Evidence of the role of Big Data for smart cities. Big Data Soc. 2019, 6, 2053951719842543. [Google Scholar] [CrossRef]
- Huang, J.; Levinson, D.; Wang, J.; Jin, H. Job-worker spatial dynamics in Beijing: Insights from Smart Card Data. Cities 2019, 86, 83–93. [Google Scholar] [CrossRef]
- Tian, S.; Li, X.; Yang, J.; Zhang, W.; Guo, J. Spatio-temporal coupling coordination and driving mechanism of urban pseudo and reality human settlements in the three provinces of Northeast China. Acta Geogr. Sin. 2021, 76, 781–798. [Google Scholar] [CrossRef]
- Xue, Q.; Yang, X.; Wu, F. A two-stage system analysis of real and pseudo urban human settlements in China. J. Clean. Prod. 2021, 293, 126272. [Google Scholar] [CrossRef]
- Yu, W.; Yang, J.; Wu, F.; He, B.; Xue, B.; Wang, S.; Yu, H.; Xiao, X.; Xia, J. Realistic characteristics and driving mechanisms of pseudo-human settlements in Chinese cities. Humanit. Soc. Sci. Commun. 2023, 10, 50. [Google Scholar] [CrossRef]
- Tian, S.; Yang, B.; Li, X.; Yang, J.; Liu, Z. A review and prospects of domestic and international human settlements from disciplinary knowledge to interdisciplinary integration. World Reg. Stud. 2023, 32, 134–147. [Google Scholar] [CrossRef]
- Yang, J.; You, H.; Zhang, Y.; Jin, C. Research progress on human settlements: From traditional data to big data+. Prog. Geogr. 2020, 39, 166–176. [Google Scholar] [CrossRef]
- Li, X.; Xu, L.; Tian, S.; Yang, J.; Liu, M.; Liu, H. Human settlements in China based on the geographical scale. Sci. Geogr. Sin. 2022, 42, 951–962. [Google Scholar] [CrossRef]
- Zhang, M.; Tan, S.; Zhang, C.; Chen, E. Machine learning in modelling the urban thermal field variance index and assessing the impacts of urban land expansion on seasonal thermal environment. Sustain. Cities Soc. 2024, 106, 105345. [Google Scholar] [CrossRef]
- Wicki, B.; Flückiger, B.; Vienneau, D.; de Hoogh, K.; Röösli, M.; Ragettli, M.S. Socio-environmental modifiers of heat-related mortality in eight Swiss cities: A case time series analysis. Environ. Res. 2024, 246, 118116. [Google Scholar] [CrossRef]
- Tuholske, C.; Caylor, K.; Funk, C.; Verdin, A.; Sweeney, S.; Grace, K.; Peterson, P.; Evans, T. Global urban population exposure to extreme heat. Proc. Natl. Acad. Sci. USA 2021, 118, e2024792118. [Google Scholar] [CrossRef] [PubMed]
- Ren, J.; Yang, J.; Zhang, Y.; Xiao, X.; Xia, J.C.; Li, X.; Wang, S. Exploring thermal comfort of urban buildings based on local climate zones. J. Clean. Prod. 2022, 340, 130744. [Google Scholar] [CrossRef]
- Liu, Y.; Zhang, W.; Liu, W.; Tan, Z.; Hu, S.; Ao, Z.; Li, J.; Xing, H. Exploring the seasonal effects of urban morphology on land surface temperature in urban functional zones. Sustain. Cities Soc. 2024, 103, 105268. [Google Scholar] [CrossRef]
- Feng, R.; Wang, F.; Zhou, M.; Liu, S.; Qi, W.; Li, L. Spatiotemporal effects of urban ecological land transitions to thermal environment change in mega-urban agglomeration. Sci. Total. Environ. 2022, 838, 156158. [Google Scholar] [CrossRef] [PubMed]
- Xu, L.; Bai, X.; Li, K.; Zhang, G.; Zhang, M.; Hu, M.; Huang, Y. Human exposure to ambient atmospheric microplastics in a megacity: Spatiotemporal variation and associated microorganism-related health risk. Environ. Sci. Technol. 2024, 58, 3702–3713. [Google Scholar] [CrossRef]
- Santiago, J.L.; Rivas, E.; Sanchez, B.; Buccolieri, R.; Vivanco, M.G.; Martilli, A.; Martín, F. Impact of single and combined local air pollution mitigation measures in an urban environment. Sci. Total. Environ. 2024, 924, 171441. [Google Scholar] [CrossRef]
- Luo, X.; Yang, J.; Sun, W.; He, B. Suitability of human settlements in mountainous areas from the perspective of ventilation: A case study of the main urban area of Chongqing. J. Clean. Prod. 2021, 310, 127467. [Google Scholar] [CrossRef]
- Guan, Y.; Li, X.; Yang, J.; Li, S.; Tian, S. Comprehensive suitability evaluation of urban human settlements based on GWR: A case study of Liaoning Province. Sci. Geogr. Sin. 2022, 42, 2097–2108. [Google Scholar] [CrossRef]
- Zhu, Y.; Zhou, X.; Luo, J.; Cui, J. Spatio-temporal evaluation of rural Human settlements quality and its differentiations in urban agglomeration in the middle reaches of the Yangtze River. Econ. Geogr. 2021, 41, 127–136. [Google Scholar] [CrossRef]
- Zhao, H.; Gu, T.; Sun, D.; Miao, C. Dynamic evolution and influencing mechanism of urban human settlements in the Yellow River Basin from the perspective of “production-living-ecological” function. Acta Geogr. Sin. 2023, 78, 2973–2999. [Google Scholar] [CrossRef]
- Peng, K.; Xu, C.; He, X. Spatiotemporal evolution characteristics of urban human settlement resilience in Yangtze River Delta. Econ. Geogr. 2023, 43, 74–84. [Google Scholar] [CrossRef]
- Anza-Ramirez, C.; Lazo, M.; Zafra-Tanaka, J.H.; Avila-Palencia, I.; Bilal, U.; Hernández-Vásquez, A.; Knoll, C.; Lopez-Olmedo, N.; Mazariegos, M.; Moore, K.; et al. The urban built environment and adult BMI, obesity, and diabetes in Latin American cities. Nat. Commun. 2022, 13, 7977. [Google Scholar] [CrossRef]
- Liu, X.; Lara, R.; Dufresne, M.; Wu, L.; Zhang, X.; Wang, T.; Monge, M.; Reche, C.; Di Leo, A.; Lanzani, G.; et al. Variability of ambient air ammonia in urban Europe (Finland, France, Italy, Spain, and the UK). Environ. Int. 2024, 185, 108519. [Google Scholar] [CrossRef] [PubMed]
- Li, X.; Lu, Z.; Hou, Y.; Zhao, G.; Zhang, L. The coupling coordination degree between urbanization and air environment in the Beijing(Jing)-Tianjin(Jin)-Hebei(Ji) urban agglomeration. Ecol. Indic. 2022, 137, 108787. [Google Scholar] [CrossRef]
- Li, Z.; Yu, K.; Zhong, J.; Yang, J.; Zhang, D.; Zhu, J. Spatial correlation network characteristics and influencing factors of water environmental efficiency in three major urban agglomerations in the Yangtze River Basin, China. Sustain. Cities Soc. 2024, 104, 105311. [Google Scholar] [CrossRef]
- Li, X.; Guo, Y.; Tian, S.; Bai, Z.; Liu, H. The spatio-temporal pattern evolution and driving force of the coupling coordination degree of urban human settlements system in Liaoning province. Sci. Geogr. Sin. 2019, 39, 1208–1218. [Google Scholar] [CrossRef]
- Tian, S.; Jiang, J.; Li, H.; Li, X.; Yang, J.; Fang, C. Flow space reveals the urban network structure and development mode of cities in Liaoning, China. Hum. Soc. Sci. Commun. 2023, 10, 257. [Google Scholar] [CrossRef]
- Sarker, T.; Fan, P.; Messina, J.P.; Mujahid, N.; Aldrian, E.; Chen, J. Impact of Urban built-up volume on Urban environment: A Case of Jakarta. Sustain. Cities Soc. 2024, 105, 105346. [Google Scholar] [CrossRef]
- Tang, J.; Liu, Y. The evolutionary process and driving mechanism of human settlement environment in typical tourism cities based on living-production-ecological system: A case study of Zhangjiajie city. Geogr. Res. 2021, 40, 1803–1822. [Google Scholar] [CrossRef]
- Yuan, Z.; Zhou, L.; Huang, C.; Gao, F.; Wang, B.; Wang, P.; Li, X. Comprehensive evaluation of the suitability of a human settlement environment in a less-developed mountain city: A case study of Lincang, Yunnan Province. Adv. Earth Sci. 2022, 37, 1079–1087. [Google Scholar] [CrossRef]
- Yan, M.; Yu, B.; Guo, X.; Zhuo, R. Adaptability of rural human settlements construction based on subjective and objective comparison: A case study of Gong’an County on the Jianghan Plain. Prog. Geogr. 2021, 40, 1876–1887. [Google Scholar] [CrossRef]
- Wang, Y.; Yang, S.; Wu, L. Heterogeneity for urban human settlements demand from the perspective of multiple subjects: A case study of Kunshan economic and technological development zone. Sci. Geogr. Sin. 2018, 38, 1156–1164. [Google Scholar] [CrossRef]
- Foglia, C.; Parisi, M.L.; Pontarollo, N. Building (back) better cities for aged people in Europe. Cities 2023, 141, 104479. [Google Scholar] [CrossRef]
- Niculita-Hirzel, H.; Hirzel, A.H.; Wild, P. A GIS-based approach to assess the influence of the urban built environment on cardiac and respiratory outcomes in older adults. Build. Environ. 2024, 253, 111362. [Google Scholar] [CrossRef]
- Fernández-Barrés, S.; Robinson, O.; Fossati, S.; Márquez, S.; Basagaña, X.; de Bont, J.; de Castro, M.; Donaire-Gonzalez, D.; Maitre, L.; Nieuwenhuijsen, M.; et al. Urban environment and health behaviours in children from six European countries. Environ. Int. 2022, 165, 107319. [Google Scholar] [CrossRef]
- Shen, X.; Zheng, S.; Wang, R.; Li, Q.; Xu, Z.; Wang, X.; Wu, J. Disabled travel and urban environment: A literature review. Transp. Res. Part D Transp. Environ. 2023, 115, 103589. [Google Scholar] [CrossRef]
- Sadeghi, A.R.; Jangjoo, S. Women’s preferences and urban space: Relationship between built environment and women’s presence in urban public spaces in Iran. Cities 2022, 126, 103694. [Google Scholar] [CrossRef]
- Pang, R.; Hu, N.; Wei, Y. Evaluation of quality for human settlement in Xinjiang based on multi-source data. Sci. Geogr. Sin. 2021, 41, 2127–2137. [Google Scholar] [CrossRef]
- Tang, L.; Long, H.; Yang, J.; Pan, X. Obstacle diagnosis of rural human settlements and rural tourism development in the Dongting Lake Area and their coupling coordination. Econ. Geogr. 2023, 43, 211–221. [Google Scholar] [CrossRef]
- Qin, Y.; Wang, L.; Yu, M.; Meng, X.; Fan, Y.; Huang, Z.; Luo, E.; Pijanowski, B. The spatio-temporal evolution and transformation mode of human settlement quality from the perspective of “production-living-ecological” spaces—A case study of Jilin Province. Habitat Int. 2024, 145, 103021. [Google Scholar] [CrossRef]
- Walas, N.; Müller, N.F.; Parker, E.; Henderson, A.; Capone, D.; Brown, J.; Barker, T.; Graham, J.P. Application of phylodynamics to identify spread of antimicrobial-resistant Escherichia coli between humans and canines in an urban environment. Sci. Total. Environ. 2024, 916, 170139. [Google Scholar] [CrossRef]
- Zhou, C.; Feng, X.; Tang, R. Analysis and forecast of coupling coordination development among the regional economy-ecological environment-tourism industry—A case study of provinces along the Yangtze economic zone. Econ. Geogr. 2016, 36, 186–193. [Google Scholar] [CrossRef]
- Wang, X.; Wang, J.; Wang, B.; Burkhard, B.; Che, L.; Dai, C.; Zheng, L. The nature-based ecological engineering paradigm: Symbiosis, coupling, and coordination. Engineering 2022, 19, 14–21. [Google Scholar] [CrossRef]
- Liu, Q.; Yang, D.; Yang, Z.; Song, J.; Chen, D. Evaluation of coupling coordination and identification of obstacle factors of human ecosystem in Qinghai-Tibet Plateau National Park Cluster. Acta Geogr. Sin. 2023, 78, 1119–1135. [Google Scholar] [CrossRef]
- Li, S.; Hu, Y.; Zhang, L. Coupling coordination relationship of pumped storage power station and eco-environment system. J. Energy Storage 2022, 52, 105029. [Google Scholar] [CrossRef]
- Shi, Y.; Feng, C.; Yu, Q.; Han, R.; Guo, L. Contradiction or coordination? The spatiotemporal relationship between landscape ecological risks and urbanization from coupling perspectives in China. J. Clean. Prod. 2022, 363, 132557. [Google Scholar] [CrossRef]
- Li, W.; Wang, Y.; Xie, S.; Cheng, X. Coupling coordination analysis and spatiotemporal heterogeneity between urbanization and ecosystem health in Chongqing municipality, China. Sci. Total. Environ. 2021, 791, 148311. [Google Scholar] [CrossRef]
- Yang, C.; Zeng, W.; Yang, X. Coupling coordination evaluation and sustainable development pattern of geo-ecological environment and urbanization in Chongqing municipality, China. Sustain. Cities Soc. 2020, 61, 102271. [Google Scholar] [CrossRef]
- Sui, G.; Wang, H.; Cai, S.; Cui, W. Coupling coordination analysis of resources, economy, and ecology in the Yellow River Basin. Ecol. Indic. 2023, 156, 111133. [Google Scholar] [CrossRef]
- Zhang, Q.; Ye, B.; Shen, X.; Zhu, Y.; Su, B.; Yin, Q.; Zhou, S. Coupling coordination evaluation of ecology and economy and development optimization at town-scale. J. Clean. Prod. 2024, 447, 141581. [Google Scholar] [CrossRef]
- Dong, G.; Ge, Y.; Liu, J.; Kong, X.; Zhai, R. Evaluation of coupling relationship between urbanization and air quality based on improved coupling coordination degree model in Shandong Province, China. Ecol. Indic. 2023, 154, 110578. [Google Scholar] [CrossRef]
- Zou, C.; Zhu, J.; Lou, K.; Yang, L. Coupling coordination and spatiotemporal heterogeneity between urbanization and ecological environment in Shaanxi Province, China. Ecol. Indic. 2022, 141, 109152. [Google Scholar] [CrossRef]
- Lv, Y.; Li, Y.; Zhang, Z.; Luo, S.; Feng, X.; Chen, X. Spatio-temporal evolution pattern and obstacle factors of water-energy-food nexus coupling coordination in the Yangtze river economic belt. J. Clean. Prod. 2024, 444, 141229. [Google Scholar] [CrossRef]
- Song, S.; Chen, X.; Liu, T.; Zan, C.; Hu, Z.; Huang, S.; De Maeyer, P.; Wang, M.; Sun, Y. Indicator-based assessments of the coupling coordination degree and correlations of water-energy-food-ecology nexus in Uzbekistan. J. Environ. Manag. 2023, 345, 118674. [Google Scholar] [CrossRef]
- Han, S.; Wang, B.; Ao, Y.; Bahmani, H.; Chai, B. The coupling and coordination degree of urban resilience system: A case study of the Chengdu–Chongqing urban agglomeration. Environ. Impact Assess. Rev. 2023, 101, 107145. [Google Scholar] [CrossRef]
- Shan, Y.; Wei, S.; Yuan, W.; Miao, Y. Spatial-temporal differentiation and influencing factors of coupling coordination of “production-living-ecological” functions in Yangtze River Delta urban agglomeration. Acta Ecol. Sin. 2022, 42, 6644–6655. [Google Scholar] [CrossRef]
- Peng, C.; Chen, M.; Wang, Q.; Zhang, M.; Lin, Y. Spatio-temporal evolution and influencing factors of economic resilience of urban agglomeration in Middle Reaches of Yangtze River under short-cycle and long-cycle scenarios. Resour. Environ. Yangtze Basin 2024, 33, 14–26. [Google Scholar] [CrossRef]
- Li, S.; Su, X.; Fu, A. Impact of economic resilience on high-quality development of Urban Agglomerations in the Middle Reaches of the Yangtze River. Econ. Geogr. 2022, 42, 19–24. [Google Scholar] [CrossRef]
- Li, X.; Li, H. A study of the evaluation of the synergetic development level of digital economy industry in Urban Agglomeration in the Middle Reaches of the Yangtze River. Econ. Surv. 2022, 39, 88–97. [Google Scholar] [CrossRef]
- Lee, C.; Yan, J.; Li, T. Ecological resilience of city clusters in the middle reaches of Yangtze river. J. Clean. Prod. 2024, 443, 141082. [Google Scholar] [CrossRef]
- Zhang, X.; Fan, H.; Hou, H.; Xu, C.; Sun, L.; Li, Q.; Ren, J. Spatiotemporal evolution and multi-scale coupling effects of land-use carbon emissions and ecological environmental quality. Sci. Total. Environ. 2024, 922, 171149. [Google Scholar] [CrossRef] [PubMed]
- Zeng, X.; He, B.; Ma, Y.; Tong, Y. Spatial-temporal pattern and multi-dimensional dynamic evolution of county eco-efficiency of urban agglomerations in the middle reaches of the Yangtze River. Sci. Geogr. Sin. 2023, 43, 1088–1100. [Google Scholar] [CrossRef]
- Chen, W.; Zhao, X.; Zhong, M.; Li, J.; Zeng, J. Spatiotemporal evolution patterns of ecosystem health in the Middle Reaches of the Yangtze River Urban Agglomerations. Acta Ecol. Sin. 2022, 42, 138–149. [Google Scholar] [CrossRef]
- Zhang, M.; Tan, S.; Zhang, Y.; He, J.; Ni, Q. Does land transfer promote the development of new-type urbanization? New evidence from urban agglomerations in the middle reaches of the Yangtze River. Ecol. Indic. 2022, 136, 108705. [Google Scholar] [CrossRef]
- Zhang, Q.; Kong, Q.; Zhang, M.; Huang, H. New-type urbanization and ecological well-being performance: A coupling coordination analysis in the middle reaches of the Yangtze River urban agglomerations, China. Ecol. Indic. 2024, 159, 111678. [Google Scholar] [CrossRef]
- Shao, H.; Wang, Z. Spatial network structure of human settlement environment and its driving factors of urban agglomerations in Middle Reaches of Yangtze River. Resour. Environ. Yangtze Basin 2022, 31, 983–994. [Google Scholar] [CrossRef]
- Liu, H.; Zou, L.; Xia, J.; Chen, T.; Wang, F. Impact assessment of climate change and urbanization on the nonstationarity of extreme precipitation: A case study in an urban agglomeration in the middle reaches of the Yangtze river. Sustain. Cities Soc. 2022, 85, 104038. [Google Scholar] [CrossRef]
- Jiang, L.; Zhou, H.; Bai, L. Spatial differences in coupling degrees of economy, urbanization soclal and eco-environment in the Middle Reaches of Yangtze River. Resour. Environ. Yangtze Basin 2017, 26, 649–656. [Google Scholar] [CrossRef]
- Liu, M.; Xiong, Y.; Zhang, A. Multi-scale telecoupling effects of land use change on ecosystem services in urban agglomerations—A case study in the middle reaches of Yangtze River urban agglomerations. J. Clean. Prod. 2023, 415, 137878. [Google Scholar] [CrossRef]
- Kuang, C.; Li, W.; Huang, X. Spatial-temporal evolution and driving factors of coupling coordination between carbon emission intensity and high-quality economic development in urban agglomerations in the middle reaches of the Yangtze River. Econ. Geogr. 2022, 42, 30–40. [Google Scholar] [CrossRef]
- Tian, S.; Wu, W.; Li, X.; Wang, Y.; Yang, J.; Cong, X. Investigation on the coupling coordination of pseudo human settlements in the urban agglomerations in eastern China. Sci. Rep. 2024, 14, 17402. [Google Scholar] [CrossRef]
- Tian, S.; Yang, B.; Liu, Z.; Li, X.; Zhang, W. Coupling coordination of urban pseudo and reality human settlements. Land 2022, 11, 414. [Google Scholar] [CrossRef]
- Ma, H.; Lian, Q.; Han, Z.; Gong, Z.; Li, Z. Spatio-temporal evolution of coupling and coordinated development of basic public services-urbanization-regional economy. Econ. Geogr. 2020, 40, 19–28. [Google Scholar] [CrossRef]
- Wang, S.; Kong, W.; Ren, L.; Zhi, D.; Dai, B. Research on misuses and modification of coupling coordination degree model in China. J. Nat. Resour. 2021, 36, 793–810. [Google Scholar] [CrossRef]
- Li, H.; Li, X.; Tian, S.; Li, S.; Zhao, P. Temporal and spatial variation characteristics and mechanism of urban human settlements: Case study of Liaoning province. Geogr. Res. 2017, 36, 1323–1338. [Google Scholar] [CrossRef]
- Ma, M.; Tang, J. Coupling coordination and driving force of tourism urbanization and human settlements in the western China. Sci. Geogr. Sin. 2024, 44, 463–473. [Google Scholar] [CrossRef]
- Yang, H.; Zhang, X.; Li, L.; Li, X.; Wang, B. Changing spatial pattern and accessibility of primary and secondary schools in a poor mountainous county: A case study of Song County, Henan Province. Prog. Geogr. 2018, 37, 556–566. [Google Scholar] [CrossRef]
- Zhang, Y.; Zhang, H.; Zhao, X. The spatial differentiation pattern and influencing factors of Chinese urban residents’ perceptions of living conditions. Acta Geogr. Sin. 2023, 78, 2574–2590. [Google Scholar] [CrossRef]
- Gai, M.; Qin, B.; Zheng, X. The evolution of the spatiotemporal pattern of the coupling and coordination between economic growth kinetic energy conversion and green development. Geogr. Res. 2021, 40, 2572–2590. [Google Scholar] [CrossRef]
- Sun, J.; Cui, Y.; Zhang, H. Spatio-temporal pattern and mechanism analysis of coupling between ecological protection and economic development of urban agglomerations in the Yellow River Basin. J. Nat. Resour. 2022, 37, 1673–1690. [Google Scholar] [CrossRef]
- Li, X.; Liu, K.; Tian, S.; Guan, Y.; Liu, H. Evaluation of urban human settlements resilience based on DPSIR model: A case study of the Yangtze River Delta urban systems. Hum. Geogr. 2022, 37, 54–62. [Google Scholar] [CrossRef]
- Li, G.; Liu, M. The promotion path of pseudo and real human settlements environment coupling coordination in resource-based cities. Sustainability 2023, 15, 3851. [Google Scholar] [CrossRef]
- Yin, J.; Hu, J.; Huang, Y. Spatial-temporal evolution characteristics and dynamic prediction of urban resilience in urban agglomeration in middle reaches of Yangtze River. Resour. Environ. Yangtze Basin 2023, 32, 2312–2325. [Google Scholar]
- Jiang, X.; Lu, X. Temporal and spatial characteristics of coupling and coordination degree between urbanization and human settlement of urban agglomerations in the middle reaches of the Yangtze River. China Land Sci. 2020, 34, 25–33. [Google Scholar] [CrossRef]
- Tian, S.; Qi, A.; Li, Z.; Pan, X.; Liu, Y.; Li, X. Urban “three states” human settlements high-quality coordinated development. Buildings 2022, 12, 178. [Google Scholar] [CrossRef]


| Criterion Layer | Intermediate Layer | Indicator Layer |
|---|---|---|
| Living system | Online shopping | Dianping 0.0176; Dangdang 0.0127; Gome 0.0111; JD 0.0238; Taobao 0.0226; VIPshop0.0174 |
| Travel | Baidu maps 0.0222; Amap 0.0159; Trip 0.0176; 12306 railway 0.0119 | |
| Life service | Anjuke 0.0209; Lianjia 0.0251; Sofang.com 0.0203; Goufang.com 0.0275; 58.com 0.0220; Meituan 0.0182; Elema 0.0177 | |
| Entertainment system | Music | QQ music 0.0144; Kugou music 0.0139; Kuwo music 0.0079; Netease cloudmusic 0.0171; Himalaya 0.0128 |
| Video | Iqiyi 0.0151; Tencent video 0.0227; Youku 0.0188; Mango TV 0.0123 | |
| Read | QQ reading 0.0072; Start reading 0.0207 | |
| Play | Fun fest 0.0145; League of legends 0.0142 | |
| Information system | News browsing | Sina news 0.0086; Sohu news 0.0100; Tencent news 0.0128; Toutiao 0.0170; Netease news 0.0085 |
| Weather forecast | Moweather 0.0083; 2345 weather 0.0103 | |
| Information search | UC browser 0.0142; QQ browser 0.0103; Quark 0.0251; Baidu 0.0254 | |
| Socialization system | Internet socialization | Micro blog 0.0225; Zhihu 0.0258; Kwai 0.0145; Bilibili 0.0207 |
| Instant messaging | QQ 0.0162; Wechat 0.0173; China unicom 0.0130; China mobile 0.0171; China telecom 0.0101 | |
| Tool system | Work-study | Microsoft office 0.0092; Youdao 0.0118; WPS office 0.0143 |
| Financial management | China construction bank 0.0126; Agricultural bank of china 0.0102; Alipay 0.0184 | |
| Network security | 360 security 0.0088; Tencent mobile manager 0.0086 | |
| Face-lifting photo | Meitu 0.0144; Beautycam 0.0124; Photoshop 0.0083 | |
| File storage | Baidu netdisk 0.0164; Thunder 0.0163; Tencent cloud 0.0145 |
| Criterion Layer | Intermediate Layer | Indicator Layer |
|---|---|---|
| Human system | Population situation | Urbanization rate 0.0287;Natural population growth rate 0.0038; Gender ratio 0.0171; Ratio of permanent population to registered residence population 0.0198 |
| Employment status | Urban registered unemployment rate 0.0274; The proportion of population in the tertiary industry 0.0191; Per capita built-up area 0.0280; Average price of newly built housing 0.0040 | |
| Residential system | Land resource | Population density in urban areas 0.0180; The proportion of urban construction land to built-up area 0.0079; Per capita built-up area 0.0280; Average price of newly built housing 0.0040 |
| Residential status | Urban per capita housing construction area 0.0178; The proportion of investment in real estate development 0.0383; Per capita income to housing price ratio 0.0172 | |
| Social system | Enterprise status | Per capita liabilities of industrial enterprises above designated size 0.0059 |
| Social assets | Per capita Gross Domestic Product 0.0449; Gross Domestic Product Index 0.0055; Per capita social fixed assets investment 0.0289 | |
| Financial budget | The proportion of social security and employment expenditure to local public finance expenditure 0.0198 | |
| People’s Lives | Average salary of on duty employees 0.0379; Average annual disposable income per capita for urban residents 0.0337; Consumer Price Index for Residents 0.0098 | |
| Social security | The proportion of urban basic pension insurance participants 0.0338 | |
| Support system | Science, education, culture and health | Public library collections per 100 people 0.0596; Number of beds in medical institutions per thousand population 0.0227; Number of practicing (assistant) physicians per thousand population 0.0217; Teacher–student ratio in higher education institutions 0.0547; Number of ordinary higher education institutions per 10,000 people 0.0962; Primary and secondary school full-time teachers bear the burden of student numbers 0.0144 |
| Public utilities | Per capita urban road area 0.0344; Urban water usage penetration rate 0.0014; Urban gas penetration rate 0.0039; Urban sewage centralized treatment rate 0.0043; Harmless treatment rate of household waste 0.0012; 10,000 people have access to public transportation 0.0729; Number of internet users per 10,000 people 0.0508; Number of road lights per kilometer 0.0390 | |
| Environmental system | Environmental pollution | Per capita total industrial wastewater discharge 0.0059; Per capita sulfur dioxide emissions per 10,000 people 0.0069; Dust emissions per 10,000 people 0.0028 |
| Environmental feedback | Per capita park green space area 0.0213; Green coverage rate in built-up areas 0.0077; Air quality excellence rate 0.0111 |
| CCD | Class | CCD | Class |
|---|---|---|---|
| 0.00–0.10 | Extremely uncoordinated | 0.50–0.60 | Barely coordinated |
| 0.10–0.20 | Severely uncoordinated | 0.60–0.70 | Preliminarily coordinated |
| 0.20–0.30 | Moderately uncoordinated | 0.70–0.80 | Moderately coordinated |
| 0.30–0.40 | Slightly uncoordinated | 0.80–0.90 | Well-coordinated |
| 0.40–0.50 | Marginally uncoordinated | 0.90–1.00 | Highly coordinated |
Disclaimer/Publisher’s Note: The statements, opinions and data contained in all publications are solely those of the individual author(s) and contributor(s) and not of MDPI and/or the editor(s). MDPI and/or the editor(s) disclaim responsibility for any injury to people or property resulting from any ideas, methods, instructions or products referred to in the content. |
© 2024 by the authors. Licensee MDPI, Basel, Switzerland. This article is an open access article distributed under the terms and conditions of the Creative Commons Attribution (CC BY) license (https://creativecommons.org/licenses/by/4.0/).
Share and Cite
Wu, W.; Tian, S.; Li, H.; Li, X.; Wang, Y. Multi-Source Data-Based Investigation of Spatiotemporal Heterogeneity and Driving Mechanisms of Coupling and Coordination in Human Settlements in Urban Agglomeration in the Middle Reaches of the Yangtze River. Sustainability 2024, 16, 7583. https://doi.org/10.3390/su16177583
Wu W, Tian S, Li H, Li X, Wang Y. Multi-Source Data-Based Investigation of Spatiotemporal Heterogeneity and Driving Mechanisms of Coupling and Coordination in Human Settlements in Urban Agglomeration in the Middle Reaches of the Yangtze River. Sustainability. 2024; 16(17):7583. https://doi.org/10.3390/su16177583
Chicago/Turabian StyleWu, Wenmei, Shenzhen Tian, Hang Li, Xueming Li, and Yadan Wang. 2024. "Multi-Source Data-Based Investigation of Spatiotemporal Heterogeneity and Driving Mechanisms of Coupling and Coordination in Human Settlements in Urban Agglomeration in the Middle Reaches of the Yangtze River" Sustainability 16, no. 17: 7583. https://doi.org/10.3390/su16177583
APA StyleWu, W., Tian, S., Li, H., Li, X., & Wang, Y. (2024). Multi-Source Data-Based Investigation of Spatiotemporal Heterogeneity and Driving Mechanisms of Coupling and Coordination in Human Settlements in Urban Agglomeration in the Middle Reaches of the Yangtze River. Sustainability, 16(17), 7583. https://doi.org/10.3390/su16177583