Abstract
The exploitation and utilization of coal resources are closely related to sustainable social and economic development. To uncover the deformation and seepage patterns of coal on the mining process, this study devised a new stress program with simultaneous changes in axial and confining pressures, then performed coal seepage experiments at various gas pressures. The results show that the residual deformation exhibited a stepwise change, the relative residual deformation at the same level decreased gradually, and the increase in gas pressure led to a reduction in residual deformation. In each stress grade, the absolute permeability damage rate increased gradually, while the relative permeability damage rate decreased with the number of cycles, and the growth of gas pressure could decrease the permeability damage rate. The higher gas pressure led to a lower average energy dissipation ratio at each stress level and increased the rate of growth of elastic energy before destruction of the specimens. A higher gas pressure led to a quicker rate of change in damage variables at high stress levels. The findings have implications for the effective mining and sustainable development of coal resources.
1. Introduction
Coal is the main energy source in China and an important resource for economic development. The realization of the efficient utilization and recovery rate of coal resources through rational exploitation is related to the sustainable development of the national economy and society [1]. The deep coal resource mining process takes place in harsh environments and it is also accompanied by complex periodic mining stress disturbances [2,3]. Complex stress conditions and osmotic pressure can affect the mechanical performance of coal rock and the sequence of distortion and destabilization in coal rock is essentially the result of energy release and dissipation [4]. At present, China’s coal seams are still being mined at increasing depths, and coal rocks face severe extraction stress perturbations. This leads to more frequent dynamic disasters related to the destabilization and failure of rocks [5,6]. Meanwhile, high ground stress and pore pressure can change the porosities and fracture structures within the coal rock body, consequently modifying the permeability and affecting the extraction efficiency of coalbed methane [7].
In recent years, many specialists have conducted extensive research on the mechanical and seepage behavior of coal rock under various stress scenarios [8,9,10]. Chen et al. [11] and Zhao et al. [12] examined the rheological characteristics of rock permeability with time under conditions of constant deviatoric stress and load and unload confining pressure only. Scholars [13,14] have found that the volume of gas flow grows nonlinearly with higher gas pressure. Also, the relationship curve satisfies the power function relationship. Browning John et al. [15] investigated the evolution of crack damage under cyclically varying stresses on cubic samples of dry sandstone using independently controlled stress paths. Bai et al. [16] verified the established permeability model of damaged coal rock under the condition that only the axial pressure loaded and the confining pressure remained constant.
Most of the aforementioned studies focused on tests conducted under monotonic loading and unloading paths. Given that the surrounding rock stress field will experience repeated loading and unloading during the mining process, many scholars have conducted extensive experimental studies on coal bodies under cyclic loading conditions. Stress paths are mainly divided into two modes: equal amplitude loading (unloading) and variable amplitude loading (unloading) [17,18,19,20,21,22,23]. Geranmayeh et al. [24] explored the deformation and strength response of two mineralogically and microstructurally different rocks, sandstone and granodiorite, by conducting multistage uniaxial cyclic compression loading tests. Li et al. [25] conducted gas seepage trials on raw coal under step-incremental cycling and cross-cycling paths, and Wang et al. [26] performed triaxial alternating unloading and damage control cyclic loading tests on deep rocks. It was found that the damage from the pre-cyclic loading affects the damage evolutionary processes and failure mode of the rock, and the damage extension after the high stress cyclic damage is the most serious. Daoud et al. [27] investigated thermal crack damage evolution based on temperature cycling experiments on specimens. Scholars also conducted experimental studies on the seepage properties, acoustic emission characteristics, and energy dissipation of coal seams under axial pressure graded cyclic stress pathways with different confining pressures, and defined the permeability recovery rate, damping ratio to describe the process, and established new equations for the coal damage variables with dissipated energy [28,29,30,31,32]. Palmer and Mansoori [33] constructed a permeability evolution model based on the relationship between permeability and porosity. Duan et al. [34] and Xin et al. [35] investigated the effects of cyclic loading and unloading conditions with variable confining pressure amplitudes on the pore properties of coal; it turns out that the effective porosity and permeability of specimens obeyed the power function relation. Geng et al. [36] used their self-developed three-axis seepage system to study the seepage patterns in different phases in coal rock under simulated loop situations. Zou et al. [37] designed a stress scheme under the composite effect of a linear loading path and cyclic loading mode, and investigated the mechanical properties and damage progressions of sandstone under slope loading and unloading stress paths. Wang et al. [38] designed the stress paths of graded cyclic loading and unloading of deviated stress and cyclic loading and unloading with variable lower limits, and realized that the elastic energy, dissipated energy, and total energy of rocks were positively correlated with cycle times, and the rock damage was more serious in the case of cyclic loading with a variable lower limit.
In terms of gas pressure, many scholars conducted triaxial compression tests on coal under various confining pressures and pore pressures to analyze the mechanical deformation properties and gas permeability characteristics of coal samples during deformation and failure. They discovered that the disparity between the permeability at the final point of failure and the initial permeability tended to rise with increasing confining pressure and gas pressure [39,40]. Yang et al. [41] investigated the deformation and seepage characteristics of raw coal under cyclic loads at various gas pressures and found that as effective stress increased, permeability declined exponentially, whereas coal and rock volume expansion rates increased with growing gas pressure. Xue et al. [42] found that the initial permeability of coal samples maintains a good linear growth process with an increasing gas pressure. Sampath et al. [43] demonstrated that mining disturbance leads to the formation of fractures within the coal body, accelerating coal degradation, which in turn destabilizes and ruptures the coal body. Jia et al. [44] conducted confining equal amplitude cycling plus unloading seepage tests on raw coal and coal of a specific type. They discovered the fracture compression coefficients of both samples decreased as the number of cycles increased but increased with the rise in gas pressure. Zheng et al. [45] and Guo et al. [46] revealed the energy changes and damage mechanisms of coal at various gas pressures, and developed a seepage model based on compressibility and adsorption. The results showed that the gas pressure caused initial damage to the interior of the coal body, leading to nonlinear deformation and strength deterioration.
Most investigations have focused on cyclic axial or cyclic confining pressure separately. Few investigations have examined the combined effect of cyclic axial and confining pressure simultaneously, and there is currently a lack of research on how gas pressure affects coal during cyclic loading and unloading. In this paper, a stress path with simultaneous changes in axial stress and confining pressure is designed, and tests of coal under different gas pressures are conducted to investigate the deformation, seepage characteristics, and energy evolution of coal under complex stress paths, and the influence of gas pressure on the process is analyzed. This study’s findings offer a priceless resource for the secure exploitation of deep coal reserves as well as the avoidance and management of power disasters. In the long run, it also promotes fast and healthy economic development and the sustainable development of energy resource development and utilization.
2. Test Device and Scheme
2.1. Test Device and Test Procedure
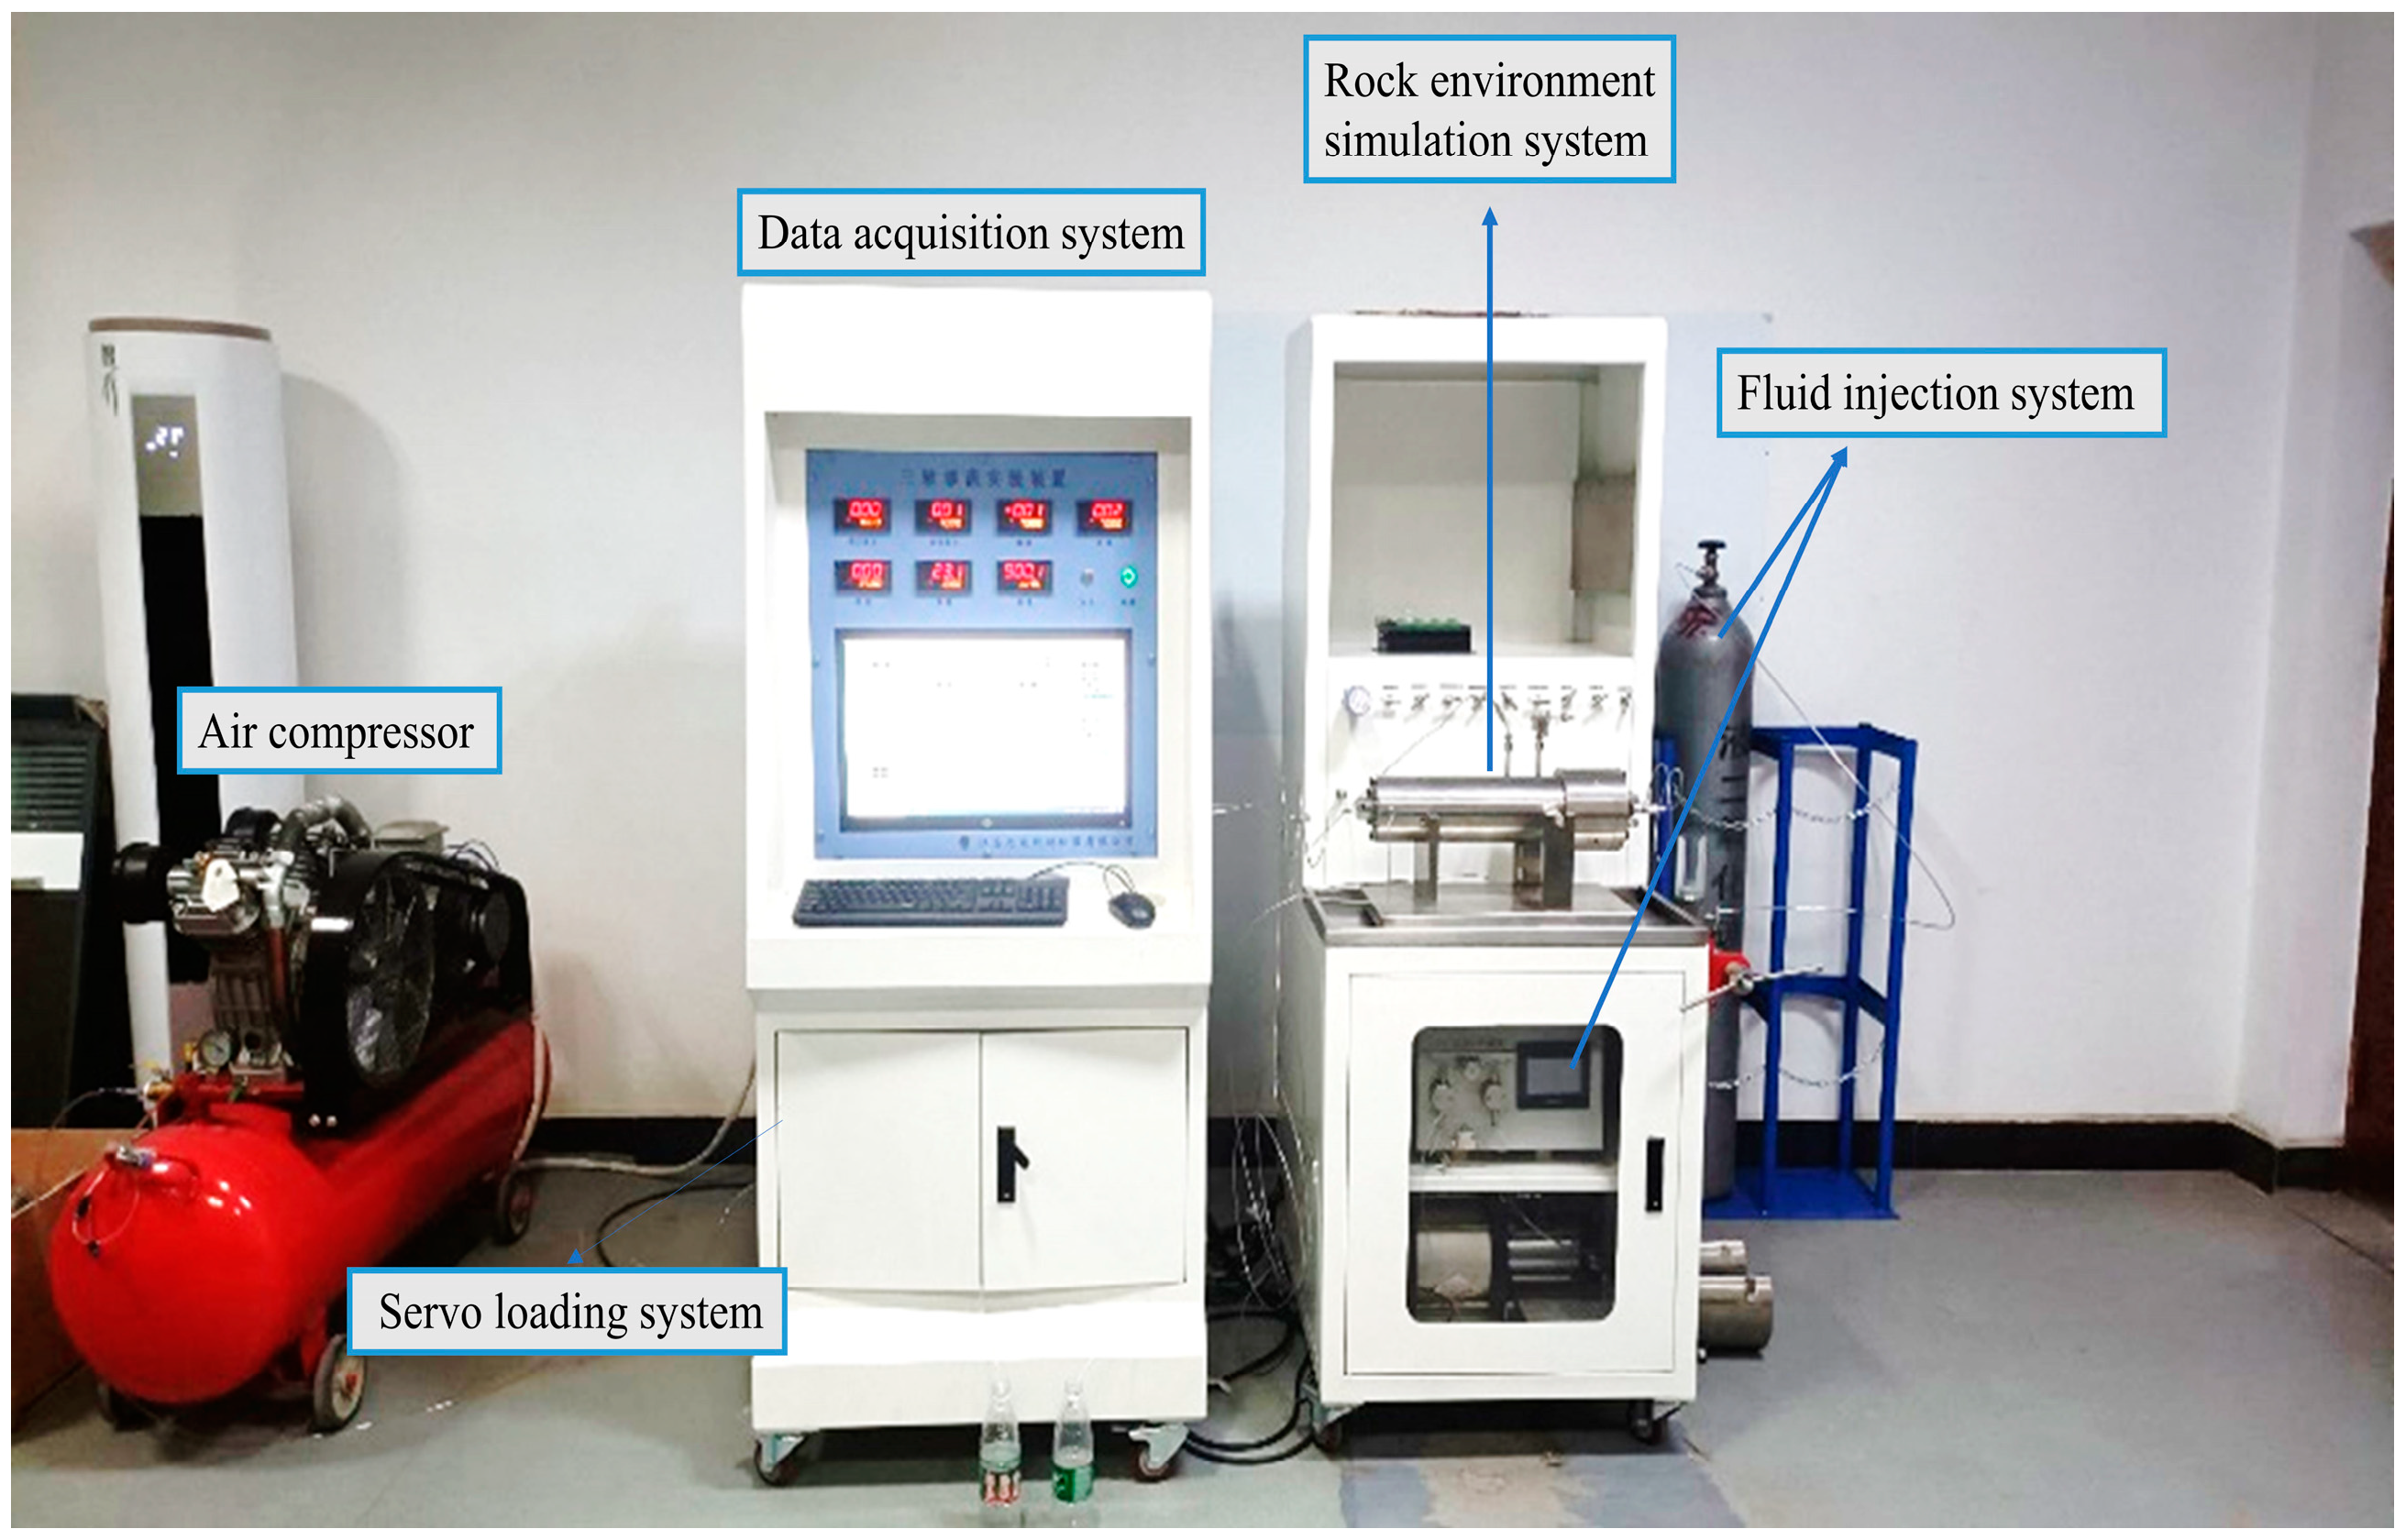
This experiment was conducted by operating the self-developed triaxial seepage test system KDSZS-II. As shown in Figure 1, the test system mainly consists of four parts: a servo loading system, reservoir environment simulation system, fluid injection system, and data acquisition system. The system can be loaded with a maximum stress value of 80 MPa and a maximum gas pressure of 8 MPa.
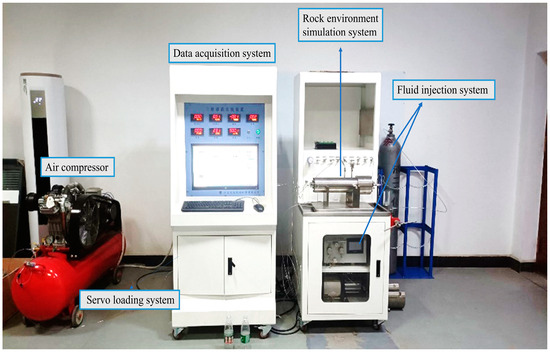
Figure 1.
KDSZS-II complex stress triaxial seepage test system.
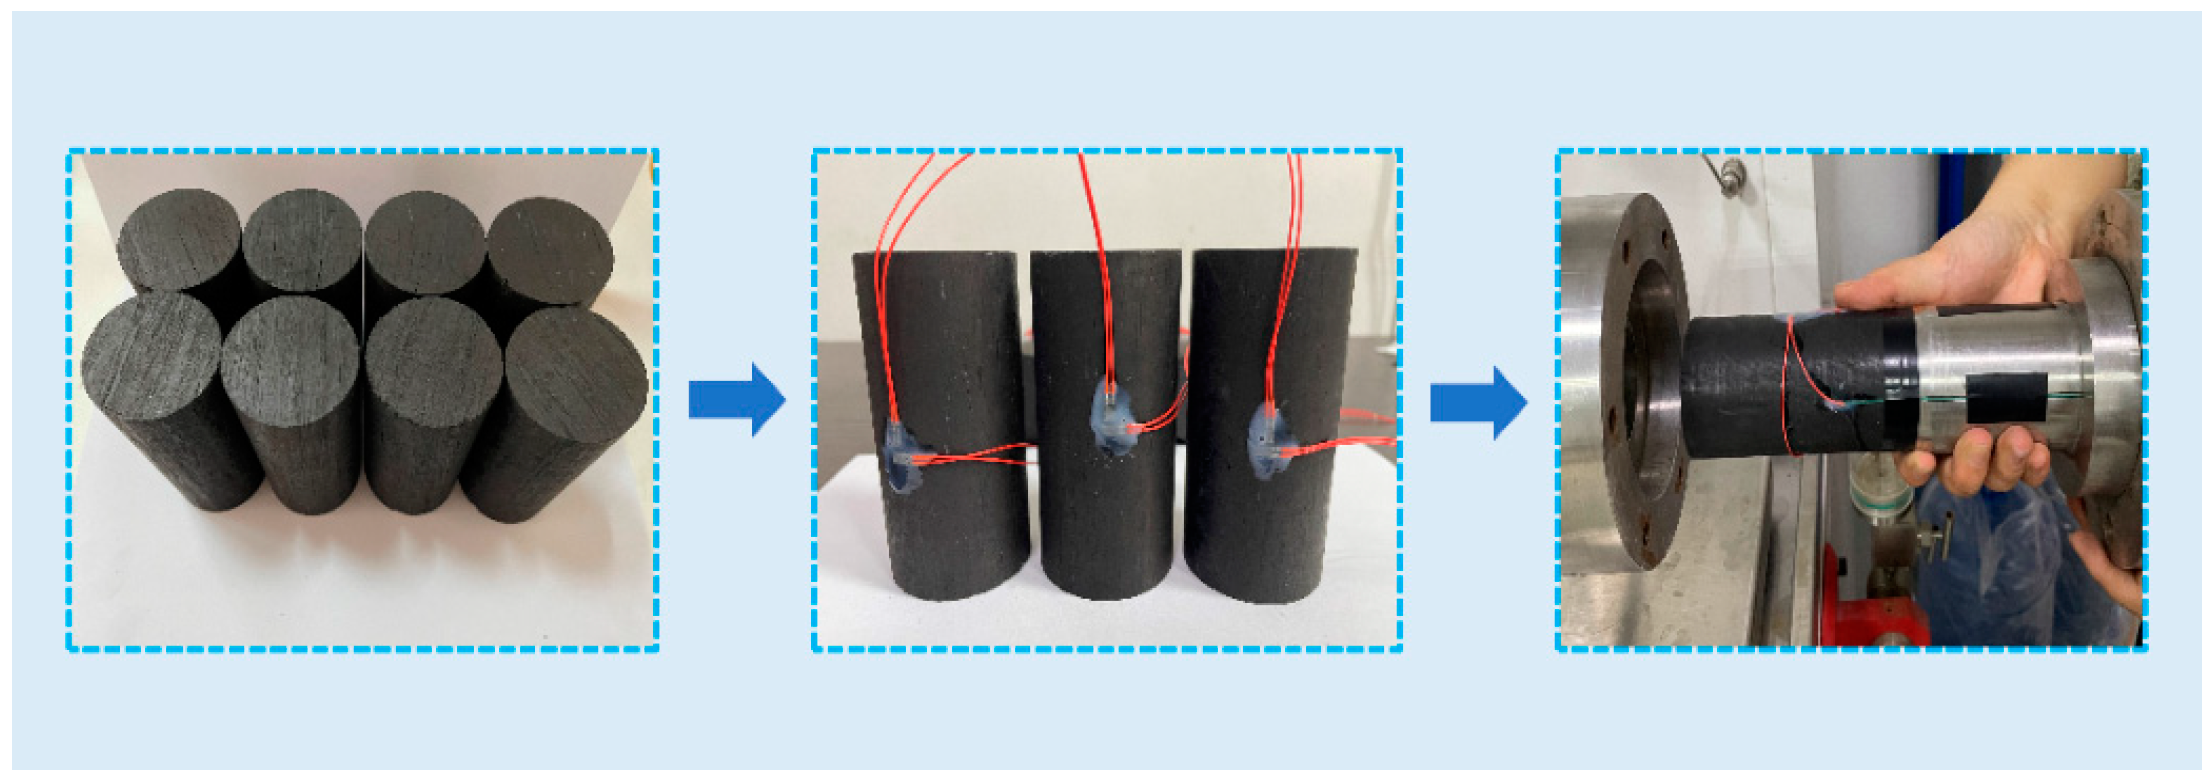
The tested coal samples were obtained from the Shenmu coal mine in Yulin City, Shaanxi Province. They were machined into standardized test pieces of Ф50 × 100 mm for testing. Figure 2 displays the procedures of the experiment.

Figure 2.
Experimental procedure.
2.2. Experimental Scheme
To maintain laboratory safety, carbon dioxide, as a substitute, was used instead of methane during the trials. The cyclic loading and unloading studies used gas pressures of 1, 2, and 3 MPa. The simulated depth of the test is 800 m, the vertical stress gradient is assumed to be 25 kP/m, and the hydrostatic pressure is 20 MPa. The specific stress scheme is presented in Figure 3. To prevent gas spillage, when the lower limit of confining pressure reaches 4 MPa and no longer continues to fall, the cycling loading and unloading is continued to end of the experiment, until the sample breaks. The coal samples are replaced in the following experiment.
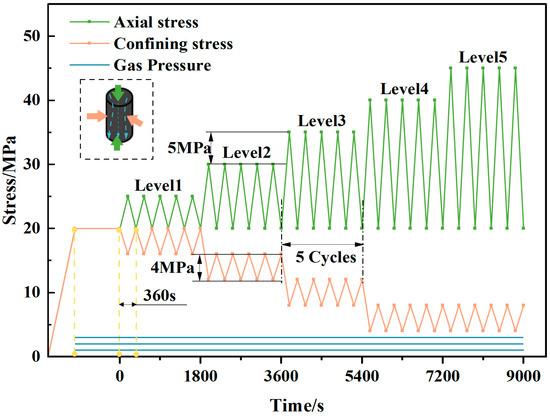
Figure 3.
Designed stress path program.
3. Deformation Behavior
3.1. Stress–Strain Curves
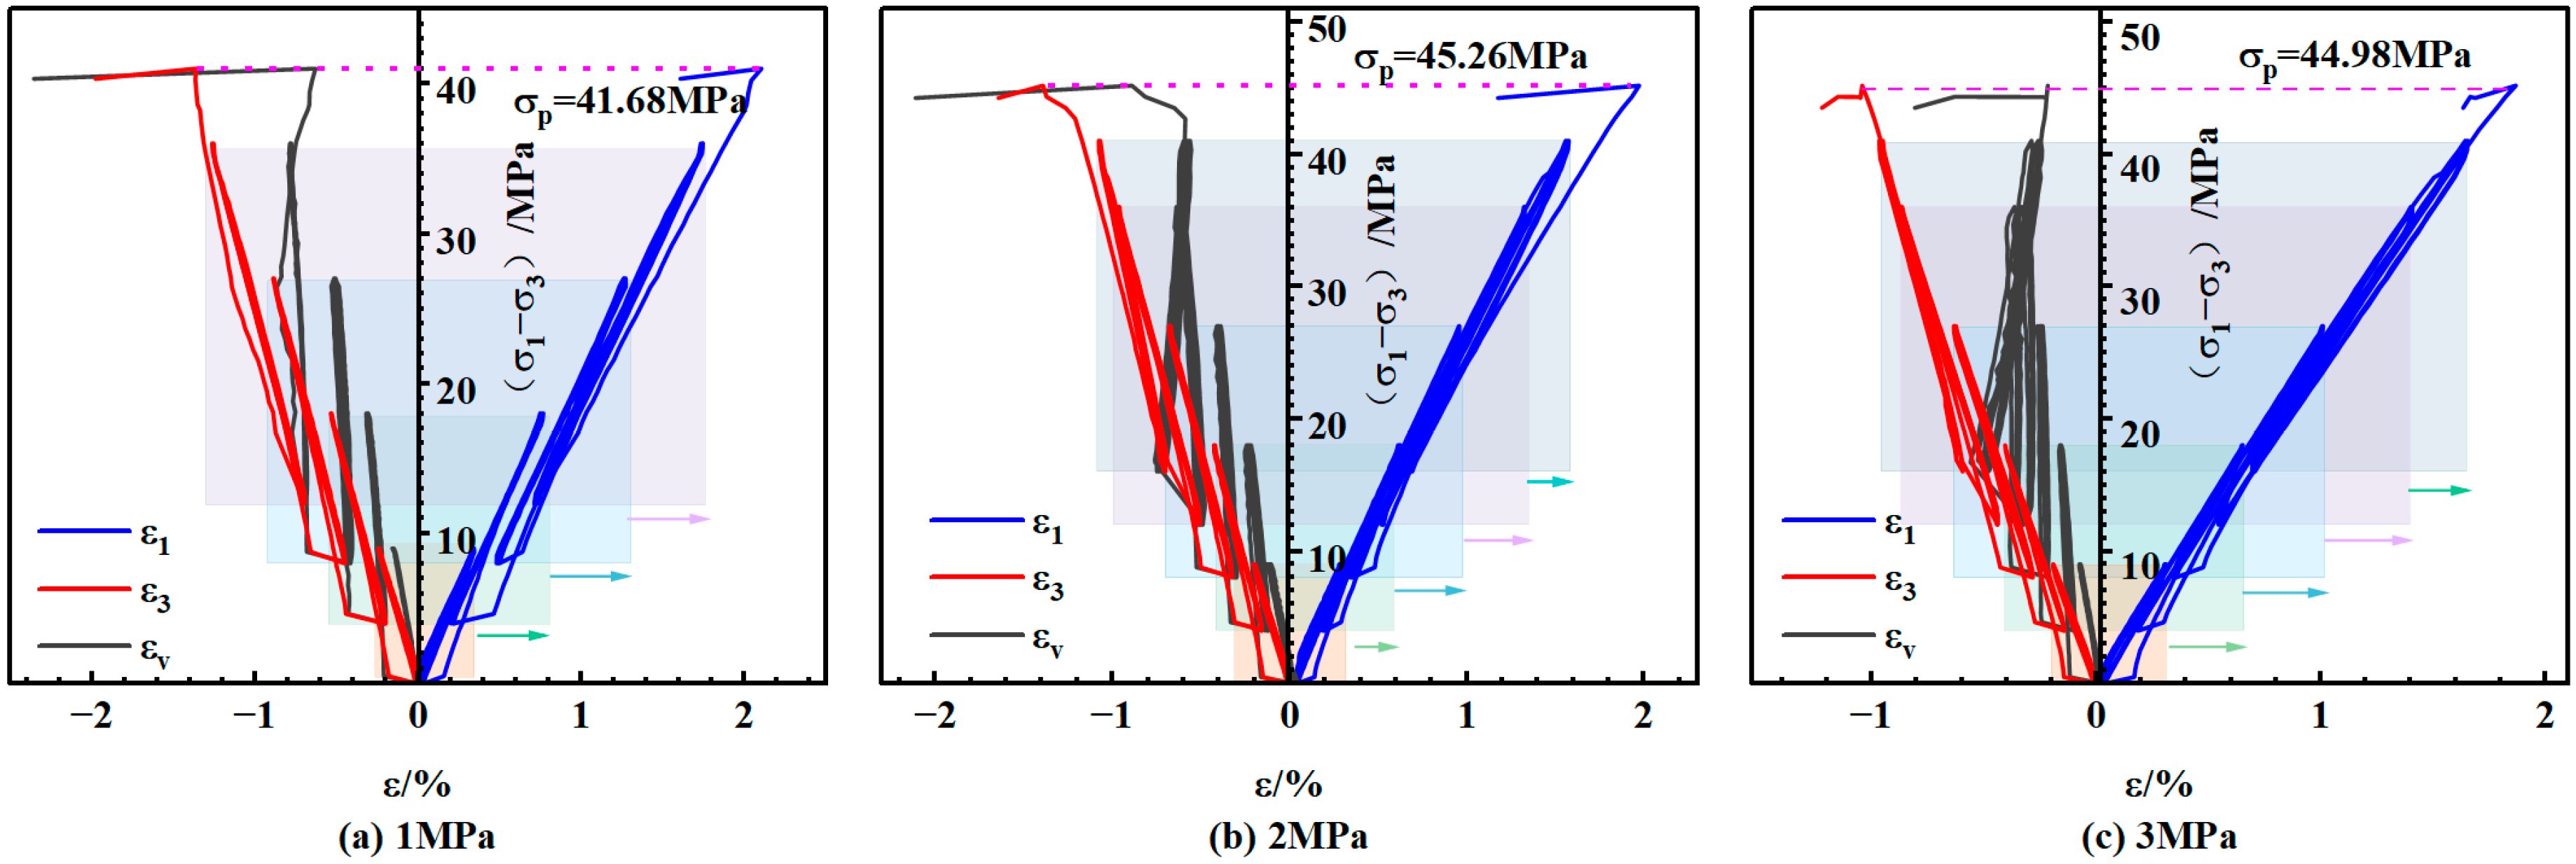
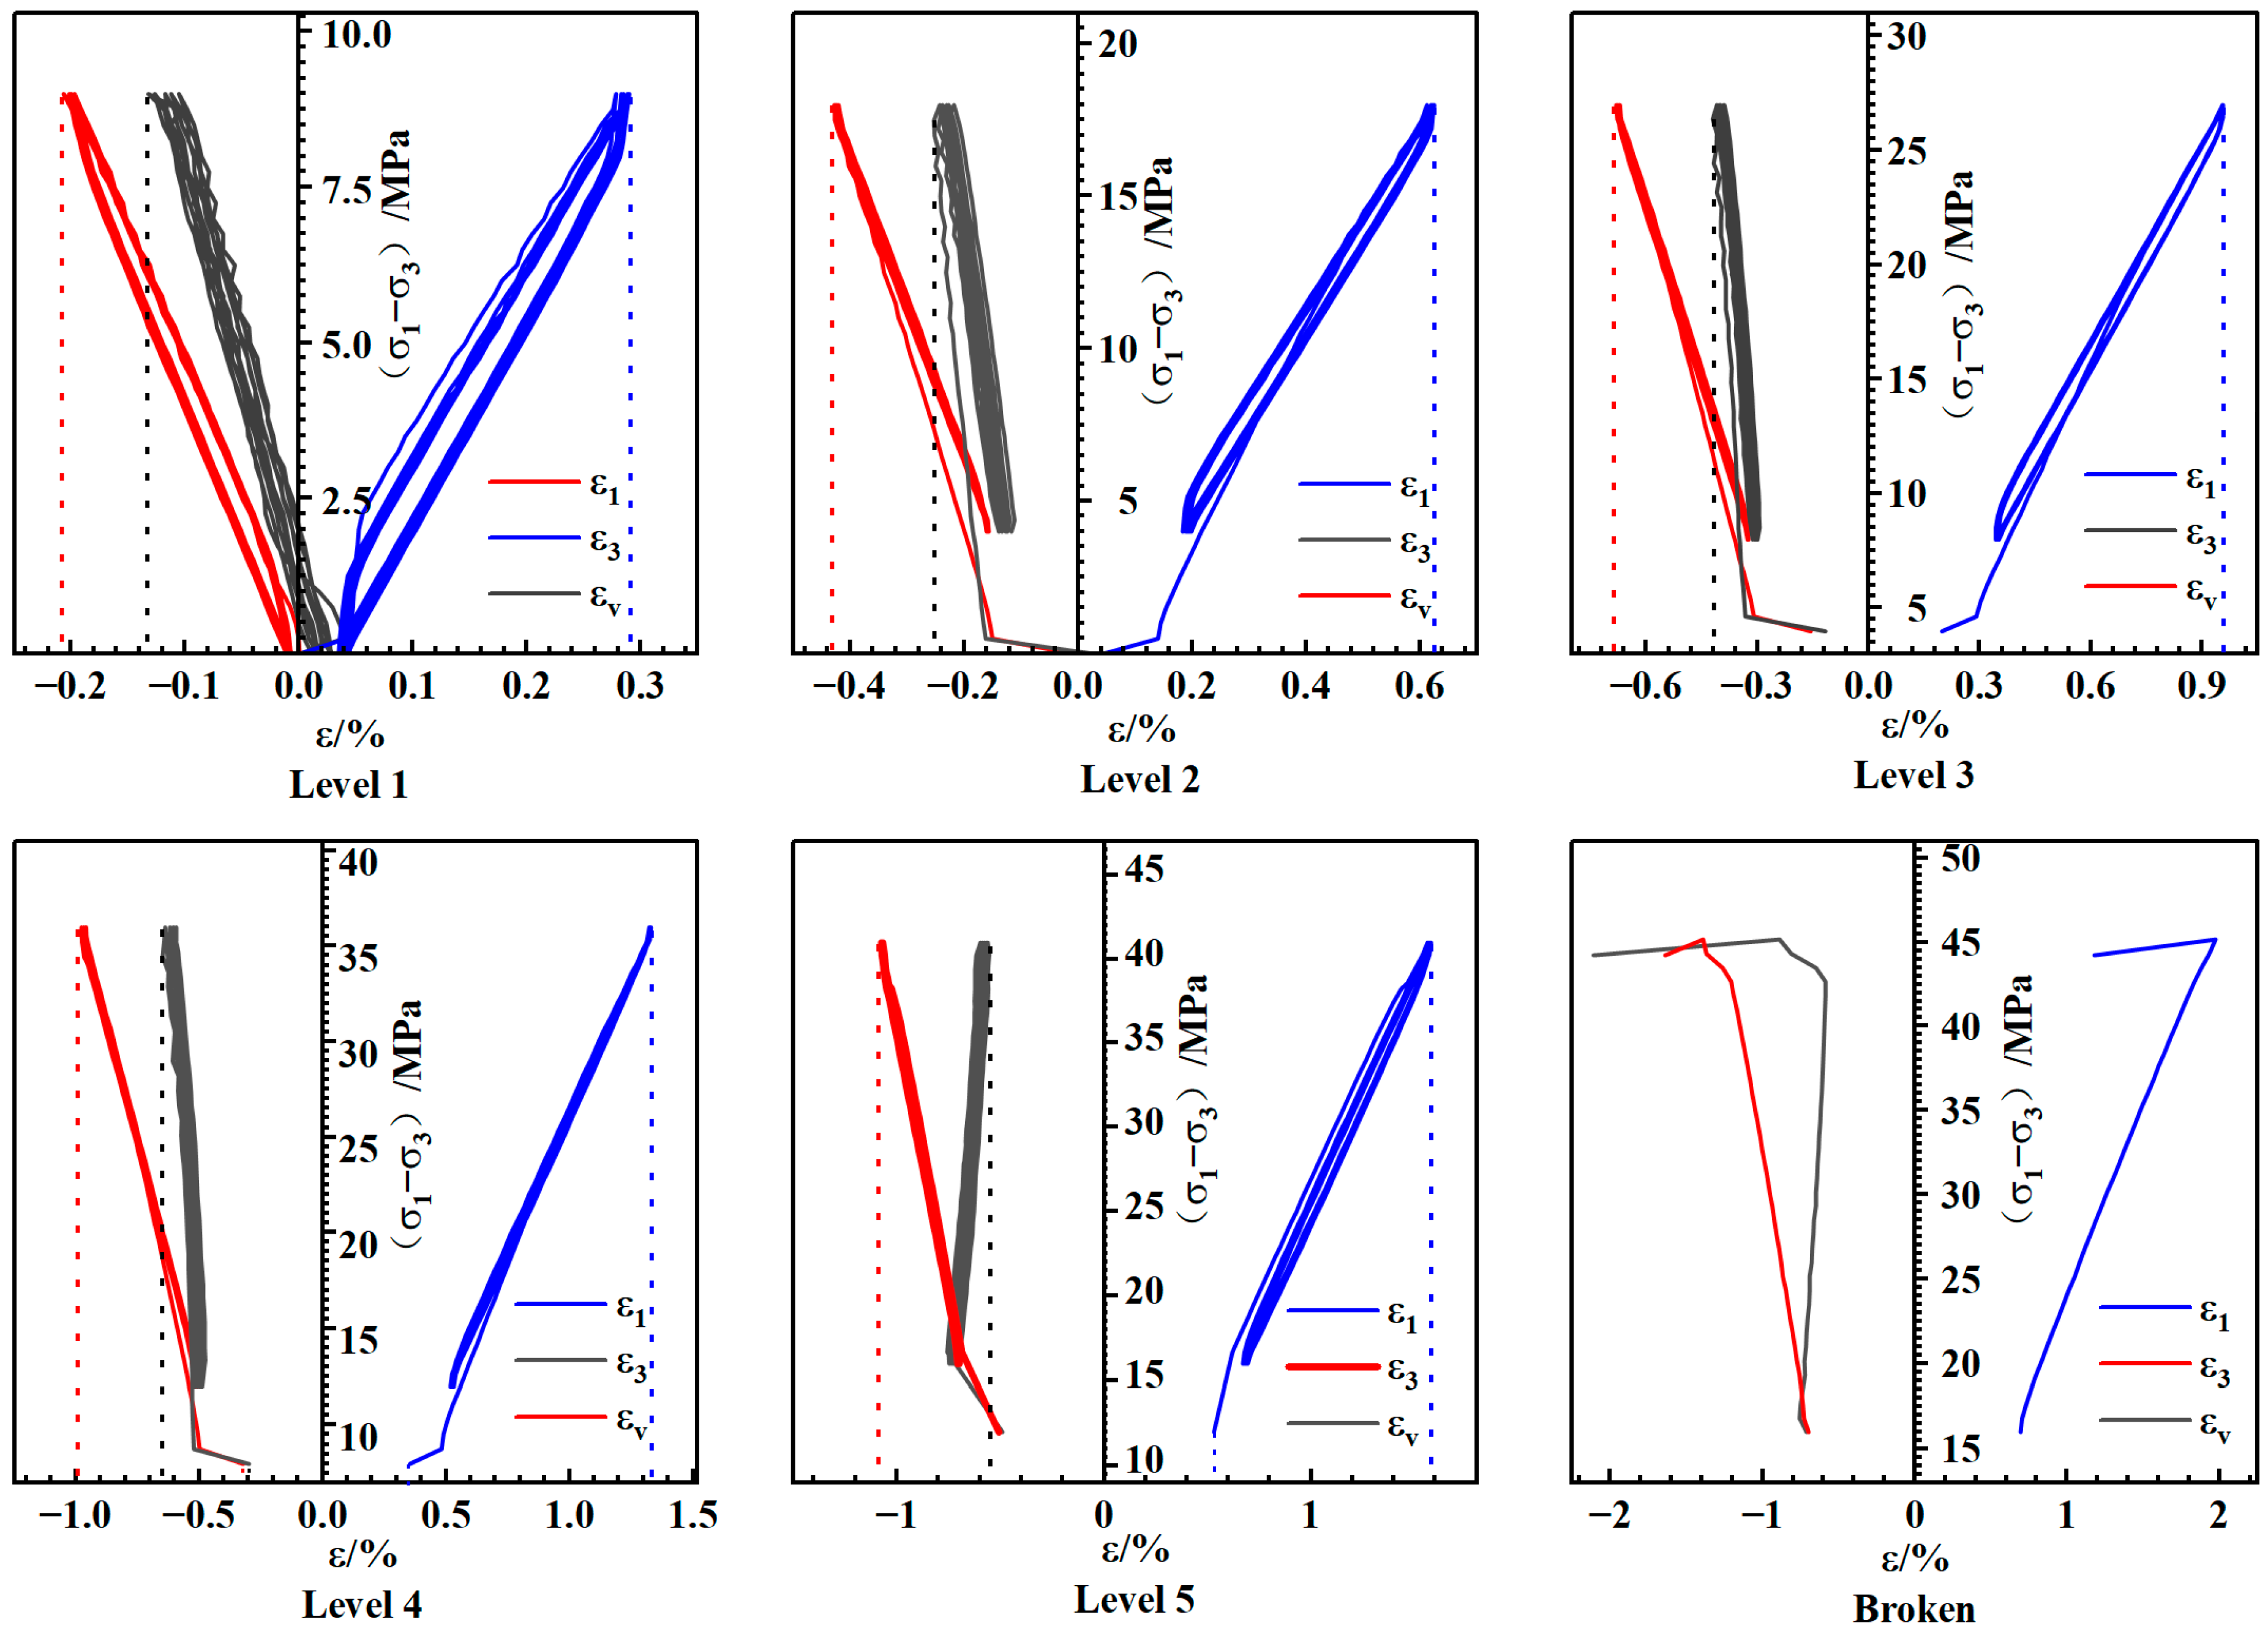
The stress–strain curves of the specimens throughout the operation at various gas pressures are depicted in Figure 4. As stress levels grow, axial strain rises and radial strain falls. The axial stress–strain curve slopes down incrementally, while the radial stress–strain curve slopes up gradually. This indicates that there may be a gradual intensification of the rate of axial strain increase and radial strain decrease. For instance, the ranges of axial strain fluctuations with increasing stress levels at a gas pressure of 1 MPa are 0.3421%, 0.5516%, 0.7684%, and 1.0421%. Meanwhile, the ranges of radial strain variations are −0.2488%, −0.3241%, −0.4336%, and −0.5586%. These variations are attributed to the increasing amplitude and upper limit of the deviatoric stresses. The axial and radial strains progressively rise with the number of cycles at the same stress level. The coal samples are continuously compacted, which lowers the rate of increase. It is demonstrated that with repeated loading and unloading, the coal samples cause irrecoverable deformations.
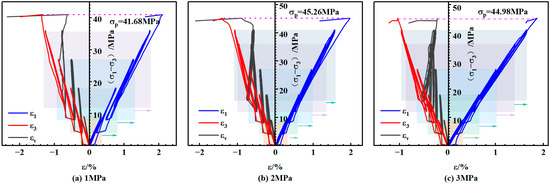
Figure 4.
Stress–strain curve variation over the whole process.
Under a gas pressure of 2 MPa, the stress–strain curves at each stress level are enlarged (Figure 5). Overall, the stress–strain hysteresis loops throughout the entire process exhibit a “sparse–dense–sparse” trend, which is attributed to a significant number of primary pore cracks in the coal sample. Initially, pore fissures gradually compress, and these compacted pore cracks cannot fully recover after unloading. During the elastic stage, coal samples can recover most of their distortion, and the area of the hysteresis ring decreases, approaching overlap. The sample enters the yield stage before destruction, and internal micro-cracks start to form and expand. The deformation of the coal sample is increased and cannot be restored, causing the hysteresis ring to expand once more. In the same stress level, except for the first cycle, the area of the hysteresis loop shrinks with increasing cycle count, indicating a “sparse–dense” trend, which is also attributed to the compaction effect.
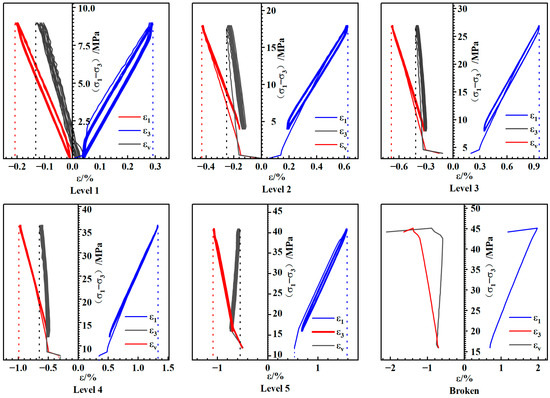
Figure 5.
Curves of stress–strain at 2 MPa gas pressure.
3.2. Residual Deformation
Residual deformation is the change between the deformation that occurs at the end of each cycle and at the start of the first cycle. Relative residual deformation refers to the gap between the deformation at the end and beginning of a cycle [47]. The calculation of residual deformation is as follows:
where and refer to axial and radial relative residual deformation, respectively, refers to the axial (radial) strain at the end of the i cycle, refers to the axial (radial) strain at the start of the i cycle, represents the axial (radial) residual deformation at the end of the i cycle, refers to the axial (radial) strain when the first cycle occurs, and refers to the total number of cycles.
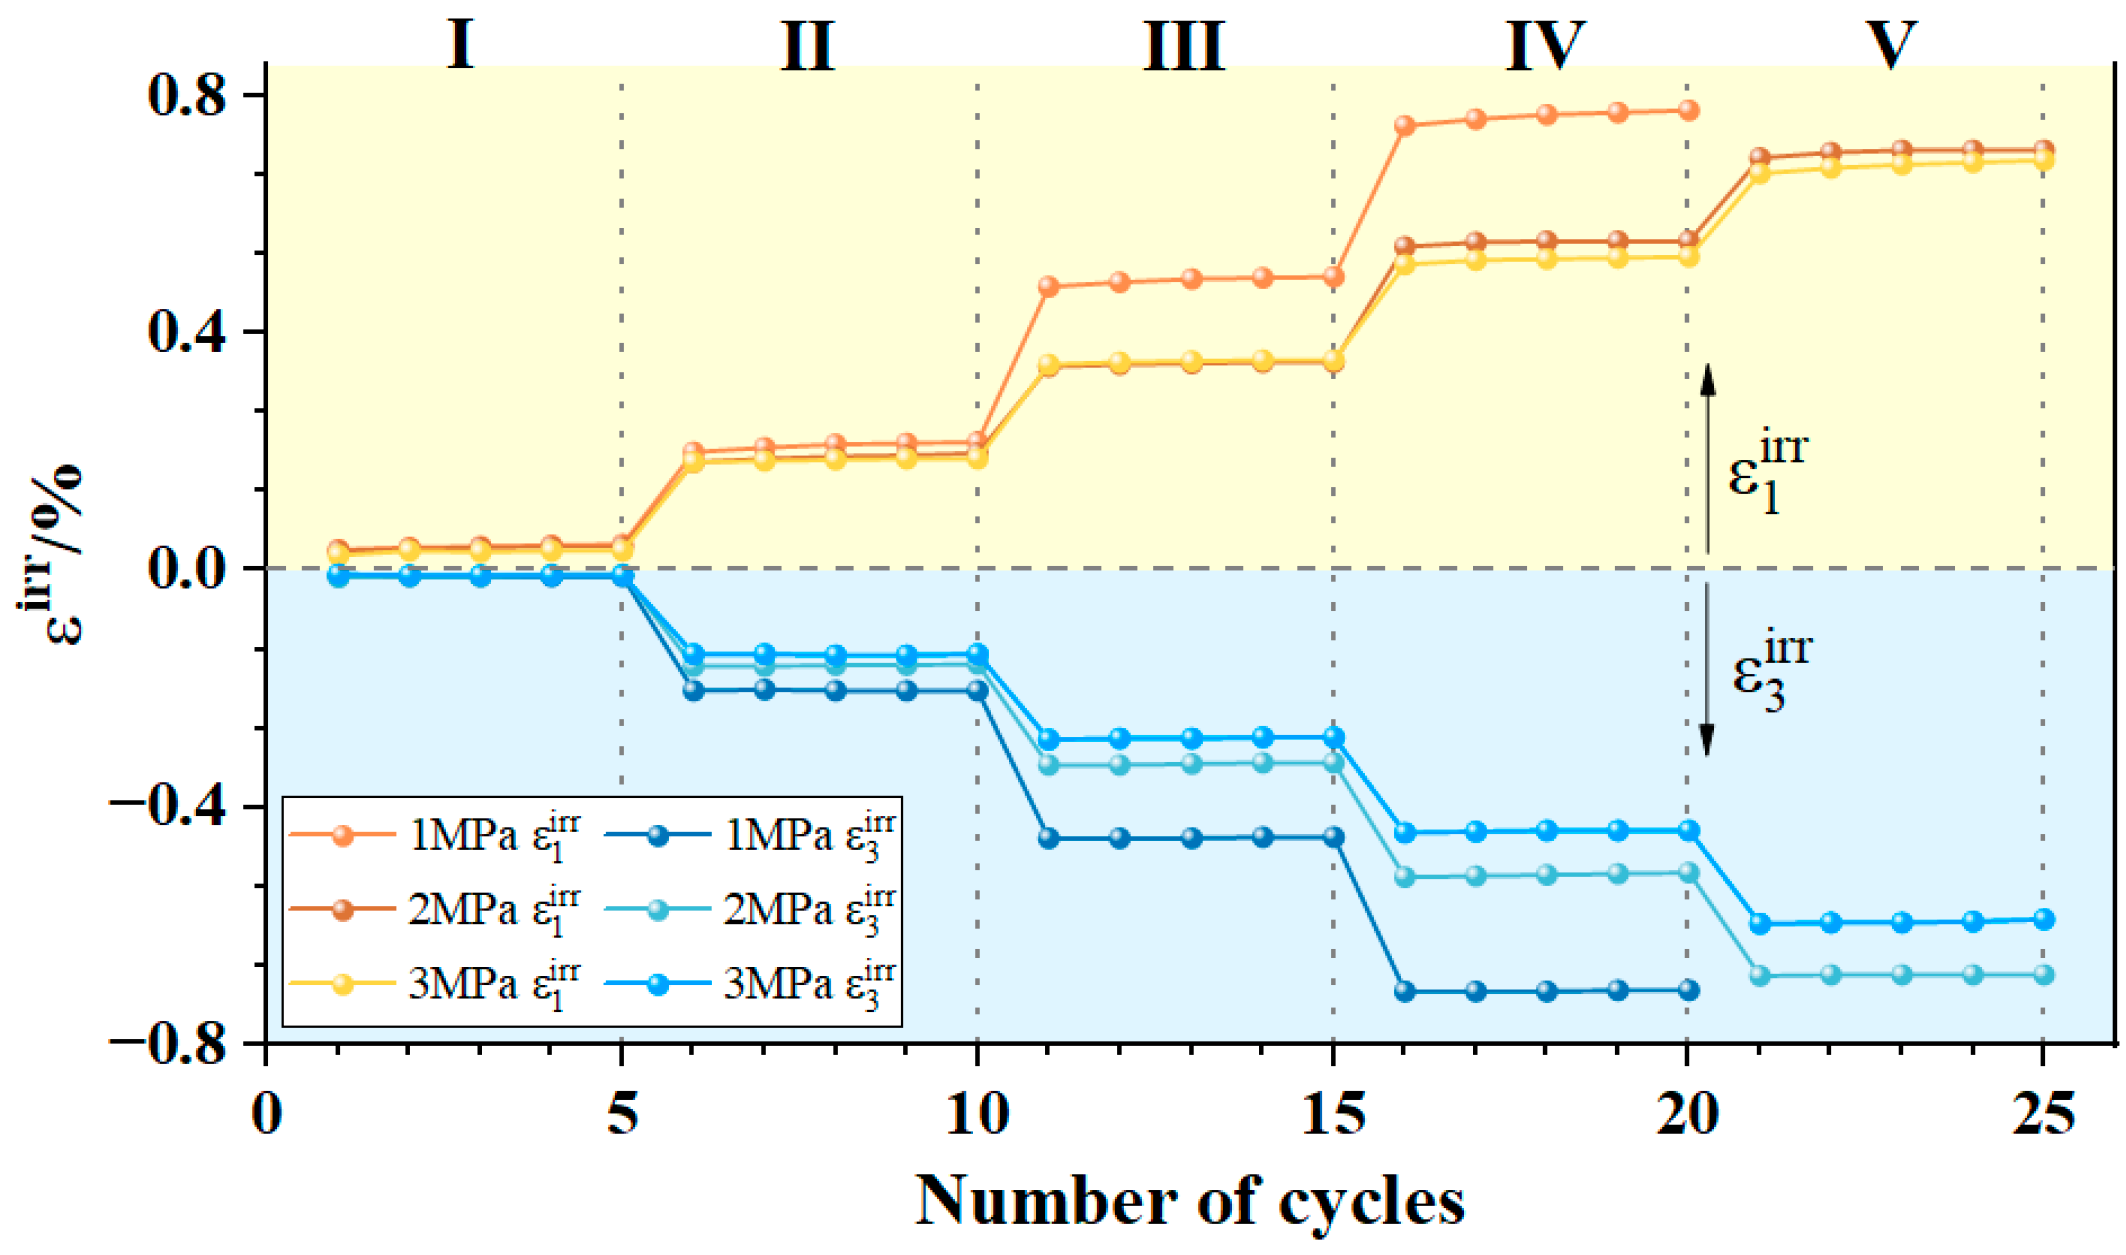
Figure 6 shows the link between the number of cycles and residual deformation. Overall, there was a high consistency in the relationship between the number of cycles under various gas pressures and the residual deformation of coal samples. As the degree of stress increases, the axial residual deformation increases incrementally, while the radial residual deformation decreases incrementally. When entering the next stress level, the residual deformation undergoes a sudden change, and the variation amplitude keeps increasing. For example, at 1 MPa gas pressure, the increase percentages are 0.1561%, 0.2577%, and 0.2585%. The decreases are by 0.1922%, 0.2486%, and 0.2597%. This is because the coal sample’s axial compression impact is amplified when the upper limit of axial tension is increased, while the lateral constraint effect is lessened as the upper and lower bounds of confining stress are decreased. The combined effect of these two factors ultimately leads to the observed phenomenon. Under the same stress level, compared to the subsequent cycles, the initial cycle’s relative residual deformation is substantially greater. Subsequently, the relative residual deformation gradually decreases to a relatively stable level; as the number of cycles grows, the residual deformation correspondingly increases at a decreasing rate. This experimental phenomenon shows that coal samples consistently exhibit significant plastic deformation in the initial cycle. Following compaction, the mechanical characteristics of the coal samples improve with repeated exposure to the same stress level, while their plastic deformation capacity diminishes.
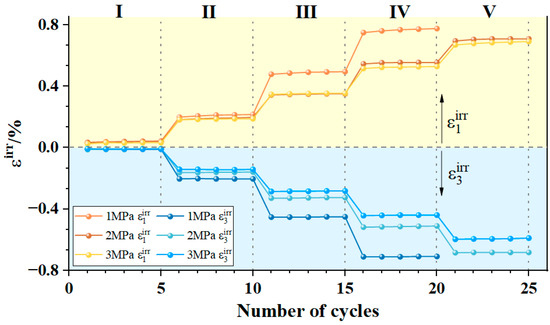
Figure 6.
The evolution of axial and radial residual deformations.
3.3. Impact of Gas Pressure on Deformation Properties
From Figure 4, it is evident that as gas pressure rises, so does the strain on coal samples subjected to the same stress cycle. For instance, at stress level 1, the axial strains under 1, 2, and 3 MPa gas pressures are 0.3335%, 0.3009%, and 0.2778%, respectively. Similarly, the radial strain variations are 0.2429%, 0.1977%, and 0.1898%, respectively. For residual deformation, Figure 6 shows that when the gas pressure rises to 1, 2, and 3 MPa, the axial residual deformation reduces. Conversely, as gas pressure rises, the radial residual deformation increases. The maximum axial residual deformations at 1, 2, and 3 MPa gas pressure are 0.7344%, 0.7079%, and 0.6903%, respectively. The maximum radial residual deformations are, in that order, −0.7083%, −0.6824%, and −0.5892%. The residual deformation is analyzed with respect to the maximum deviatoric stress (Figure 7) for each stress level, and only the deviatoric stress range commonly experienced by the coal samples are discussed here. It can be observed that within the deviatoric stress range of 9 to 36 MPa, the axial residual deformation decreases under 1, 2, and 3 MPa gas pressures as the gas pressure rises. Conversely, the radial residual deformation increases with the rise in gas pressure. In the range of deviatoric stress of 9~18 MPa, the residual deformation difference between different pressures is small and falls within the range of deviatoric stress. Between 18 and 41 MPa, there is a greater variation in residual deformation at different pressures. In particular, the difference in residual deformation from 1 MPa to 2 MPa is significantly greater than that from 2 MPa to 3 MPa. For instance, where 27 MPa is the deviatoric stress, the radial residual deformation under 1 MPa gas pressure is −0.4505%. The radial residual deformations under 2 MPa and 3 MPa gas pressures increase by 27.7438% and 44.0412%, respectively, relative to 1 MPa. This is due to the fact that there are two basic ways in which the mechanical deformation properties of coal rock are impacted by an increase in gas pressure. One way that higher gas pressure can lessen the deformation effect on coal samples is by lowering the effective stress. For another aspect, the rise in gas pressure impedes the closure of cracks to some extent and may possibly facilitate the creation and growth of fissures inside the specimen at the end of each cycle, leading to a reduction in residual deformation.
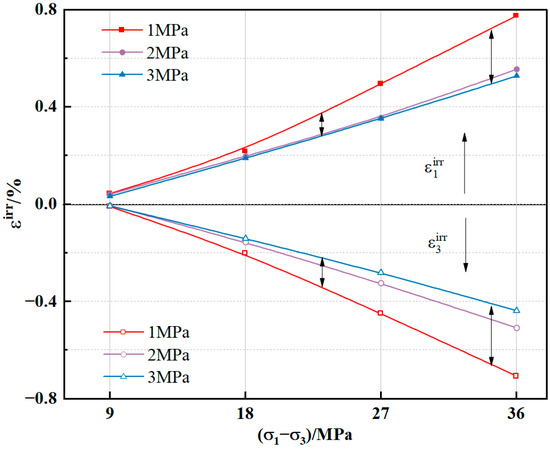
Figure 7.
The correlation between deviatoric stress and residual deformation.
4. Evolution of Seepage
4.1. Stress–Strain–Permeability Curves
Given the assumption that the gas movement within the coal sample is a process with constant temperature and adheres to Darcy’s law, the formula for calculating the permeability can be determined as follows [48]:
where is the gas permeability (), is the gas flow rate (), is the gas kinematic viscosity (), is the coal sample cross-sectional area (), and is the coal sample length (). is the standard atmospheric pressure (), the coal sample inlet gas pressure is represented by (), and the outlet gas pressure by (). In this experiment, the outlet pressure is the standard atmospheric pressure.
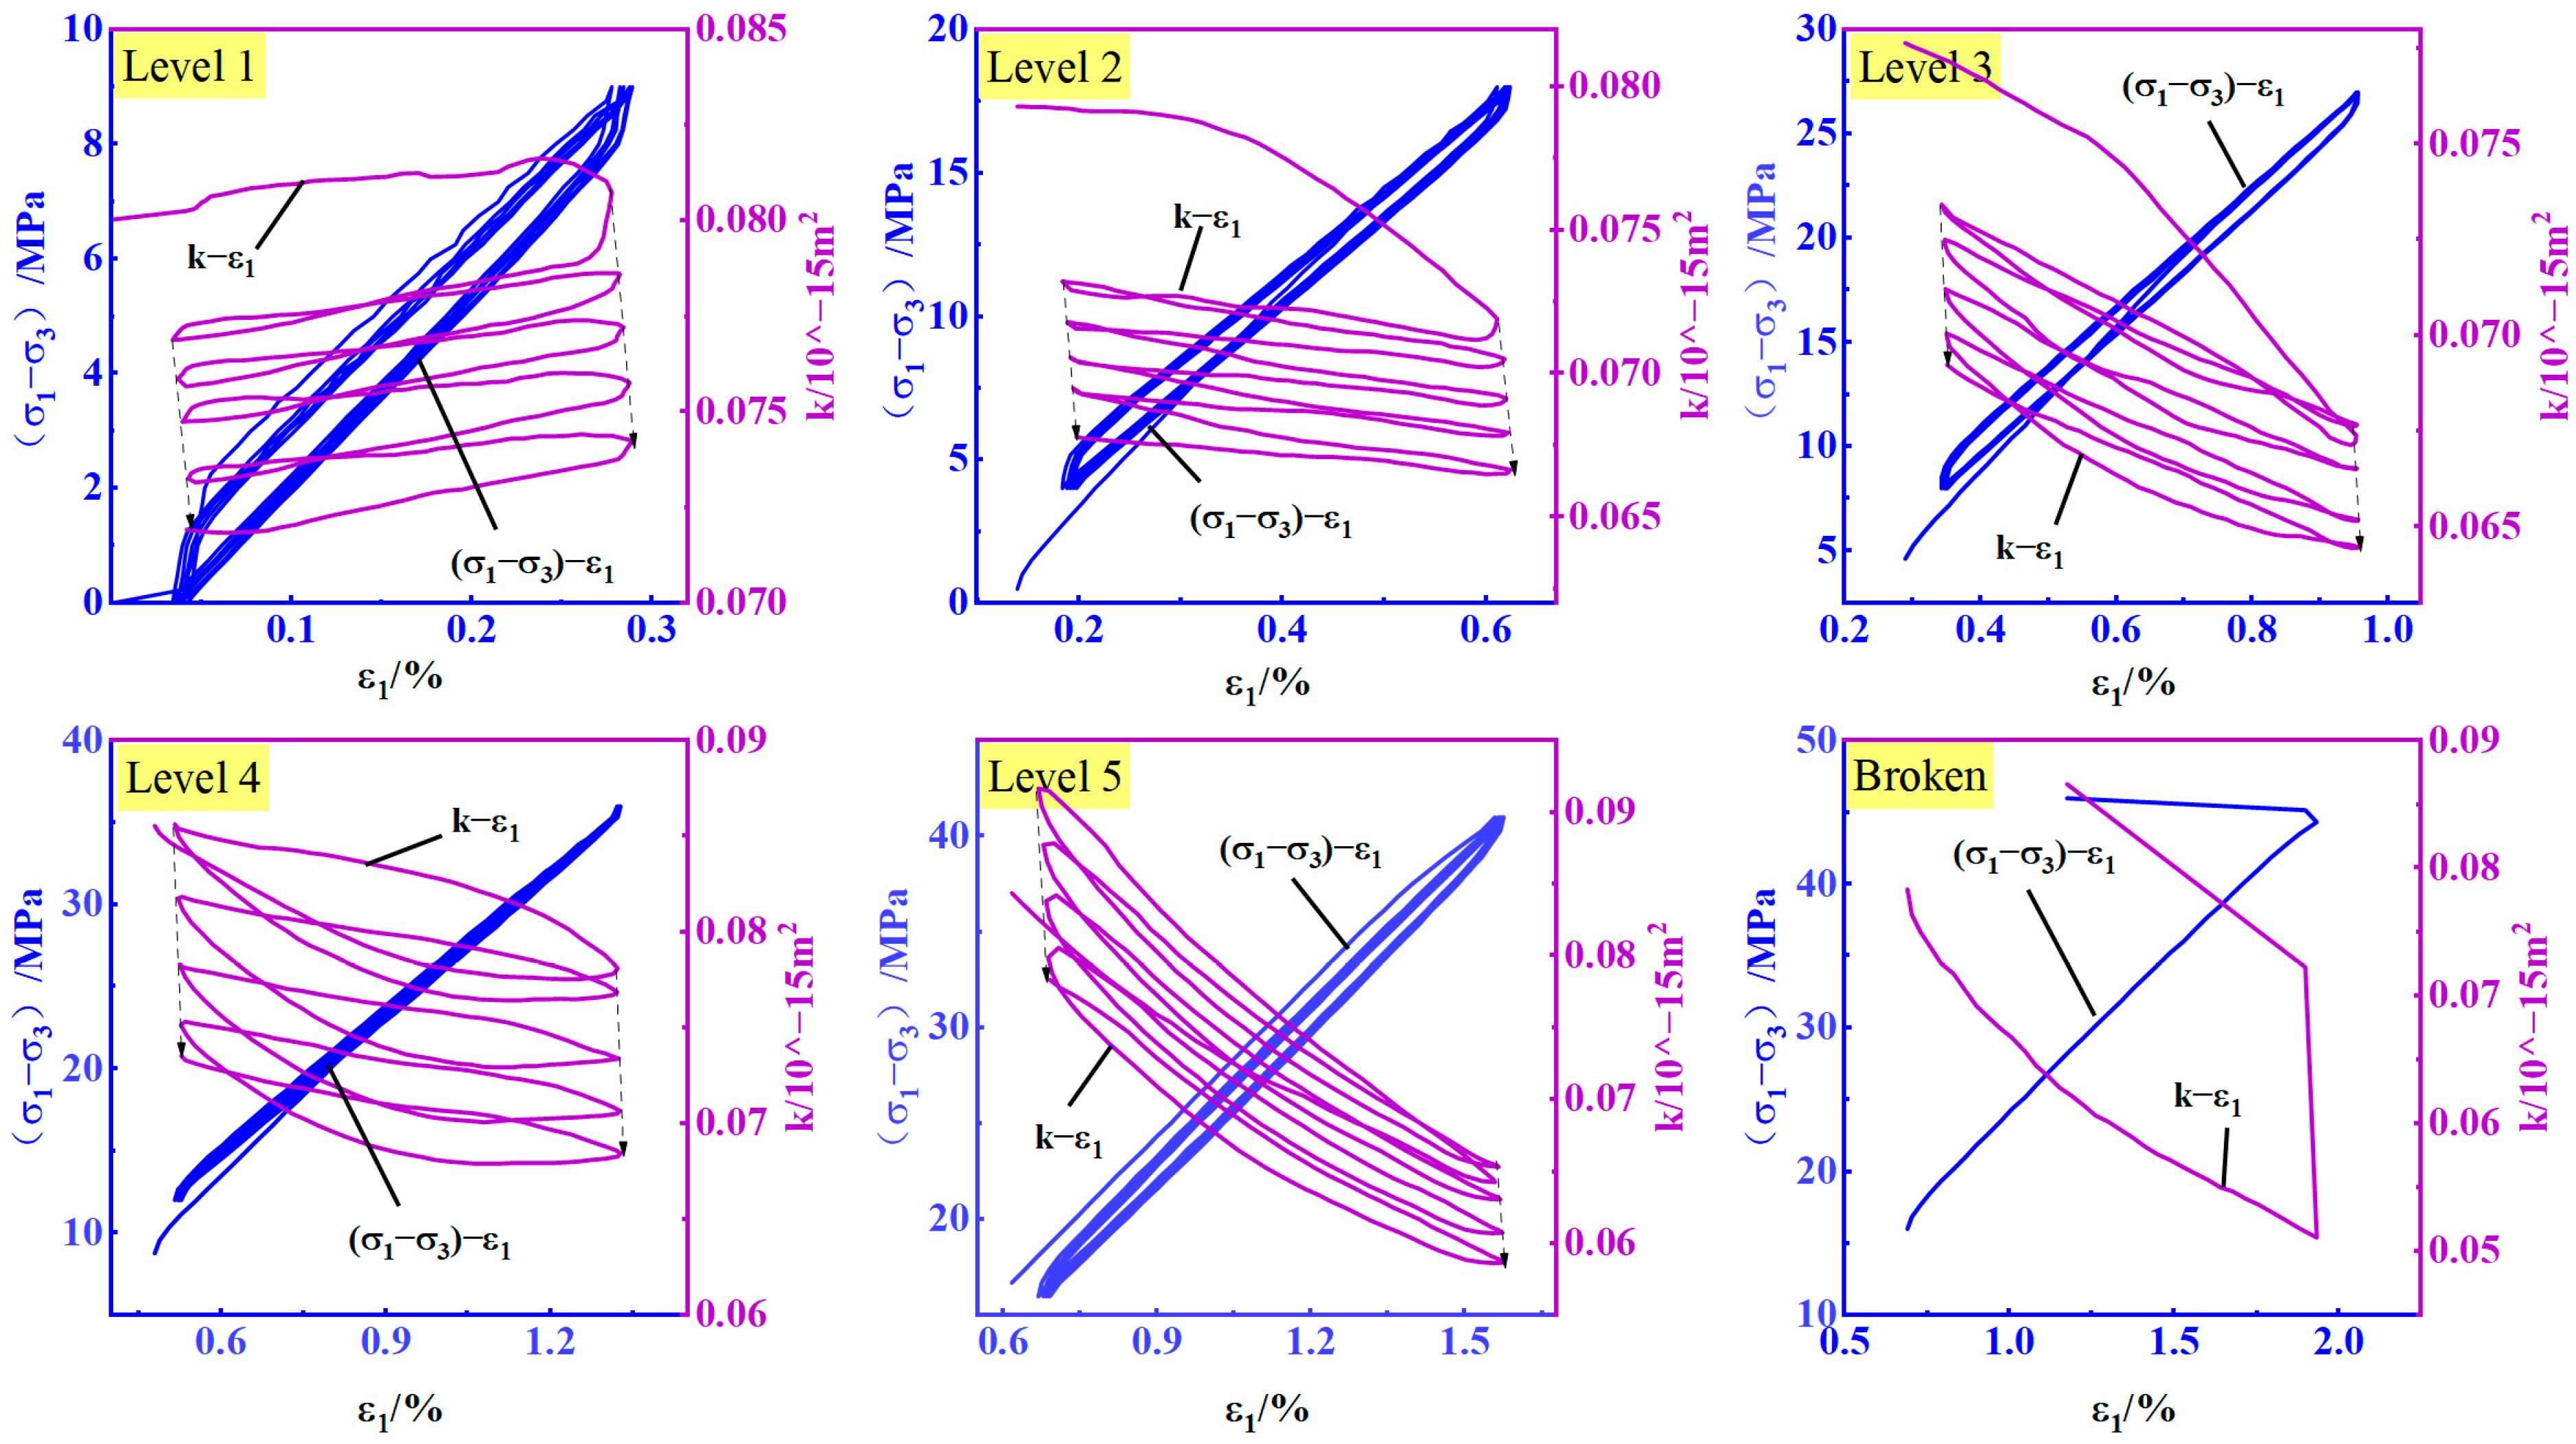
Figure 8 shows the curves depicting the changes in permeability and deviatoric stress with axial strain at each stress level under 2 MPa gas pressure. When the stress level increases, the permeability will slightly rise sharply, and the amplitude of the increase will also rise with the stress level. This is due to the confining pressure’s lower and upper bounds gradually decreasing, which lessens the pressure’s ability to compress the coal sample and confine it. Meanwhile, the percentage of internal damage-related tiny fractures in the coal samples rises in tandem with the increase in deviatoric stress amplitude, thereby creating more channels for gas flow. At each stress level, the permeability curves decreased in a spiral shape, with the largest fluctuation in permeability occurring in the first cycle. Subsequent cycles showed a gradual decrease in permeability fluctuation. This can be attributed to the fact that most of the cracks in the coal sample are compressed in the first cycle, and the compression effect gradually weakens with the increasing number of cycles. Consequently, there is a gradual decrease trend in the sensitivity of permeability to stress range. At stress level 1, permeability increases as axial strain increases. This is caused by primary cracks that run parallel or subparallel to the axial stress direction. When axial stress increases and confining stress decreases, these cracks expand, creating seepage channels and causing permeability to increase. Conversely, when the stress conditions are reversed, permeability decreases. At the subsequent stress levels, the permeability curves and axial strain curves exhibit an “X” shape. During the second cycle of stress level 3, the permeability curves for loading and unloading intersect. Interestingly, the permeability of the unloading section appears to be partially greater than that of the loading section for the first time. This suggests that the nascent crack in this cycle may reopen under gas pressure after the stress is released, leading to an increase in permeability channels. At stress levels 4 and 5, the permeability curve of the loading section during the first cycle is entirely below the permeability curve of the unloading section. In most cases, the permeability curves for unloading exceed those for loading in the subsequent cycles. A minor portion of the curves intersect with the permeability curves of the loading section, indicating a lower permeability, with the point of intersection gradually shifting to the left. This is because the increase in deviatoric stress causes micro cracks that result in the promotion of permeability and eventually outweighs the compaction impact on the coal itself.
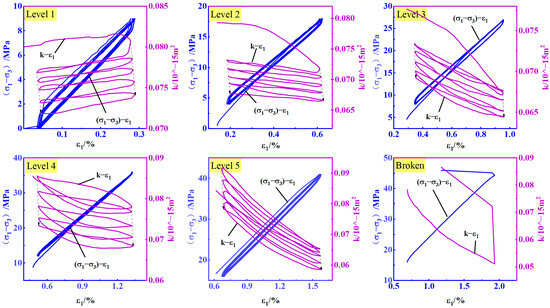
Figure 8.
Curves of permeability and deviatoric stress with axial strain at 2 MPa gas pressure.
4.2. Permeability Damage Rate
The expressions for absolute permeability damage rate and relative permeability damage rate are as follows [49]:
where refers to the permeability at the end of the th cycle and is the permeability at the beginning.
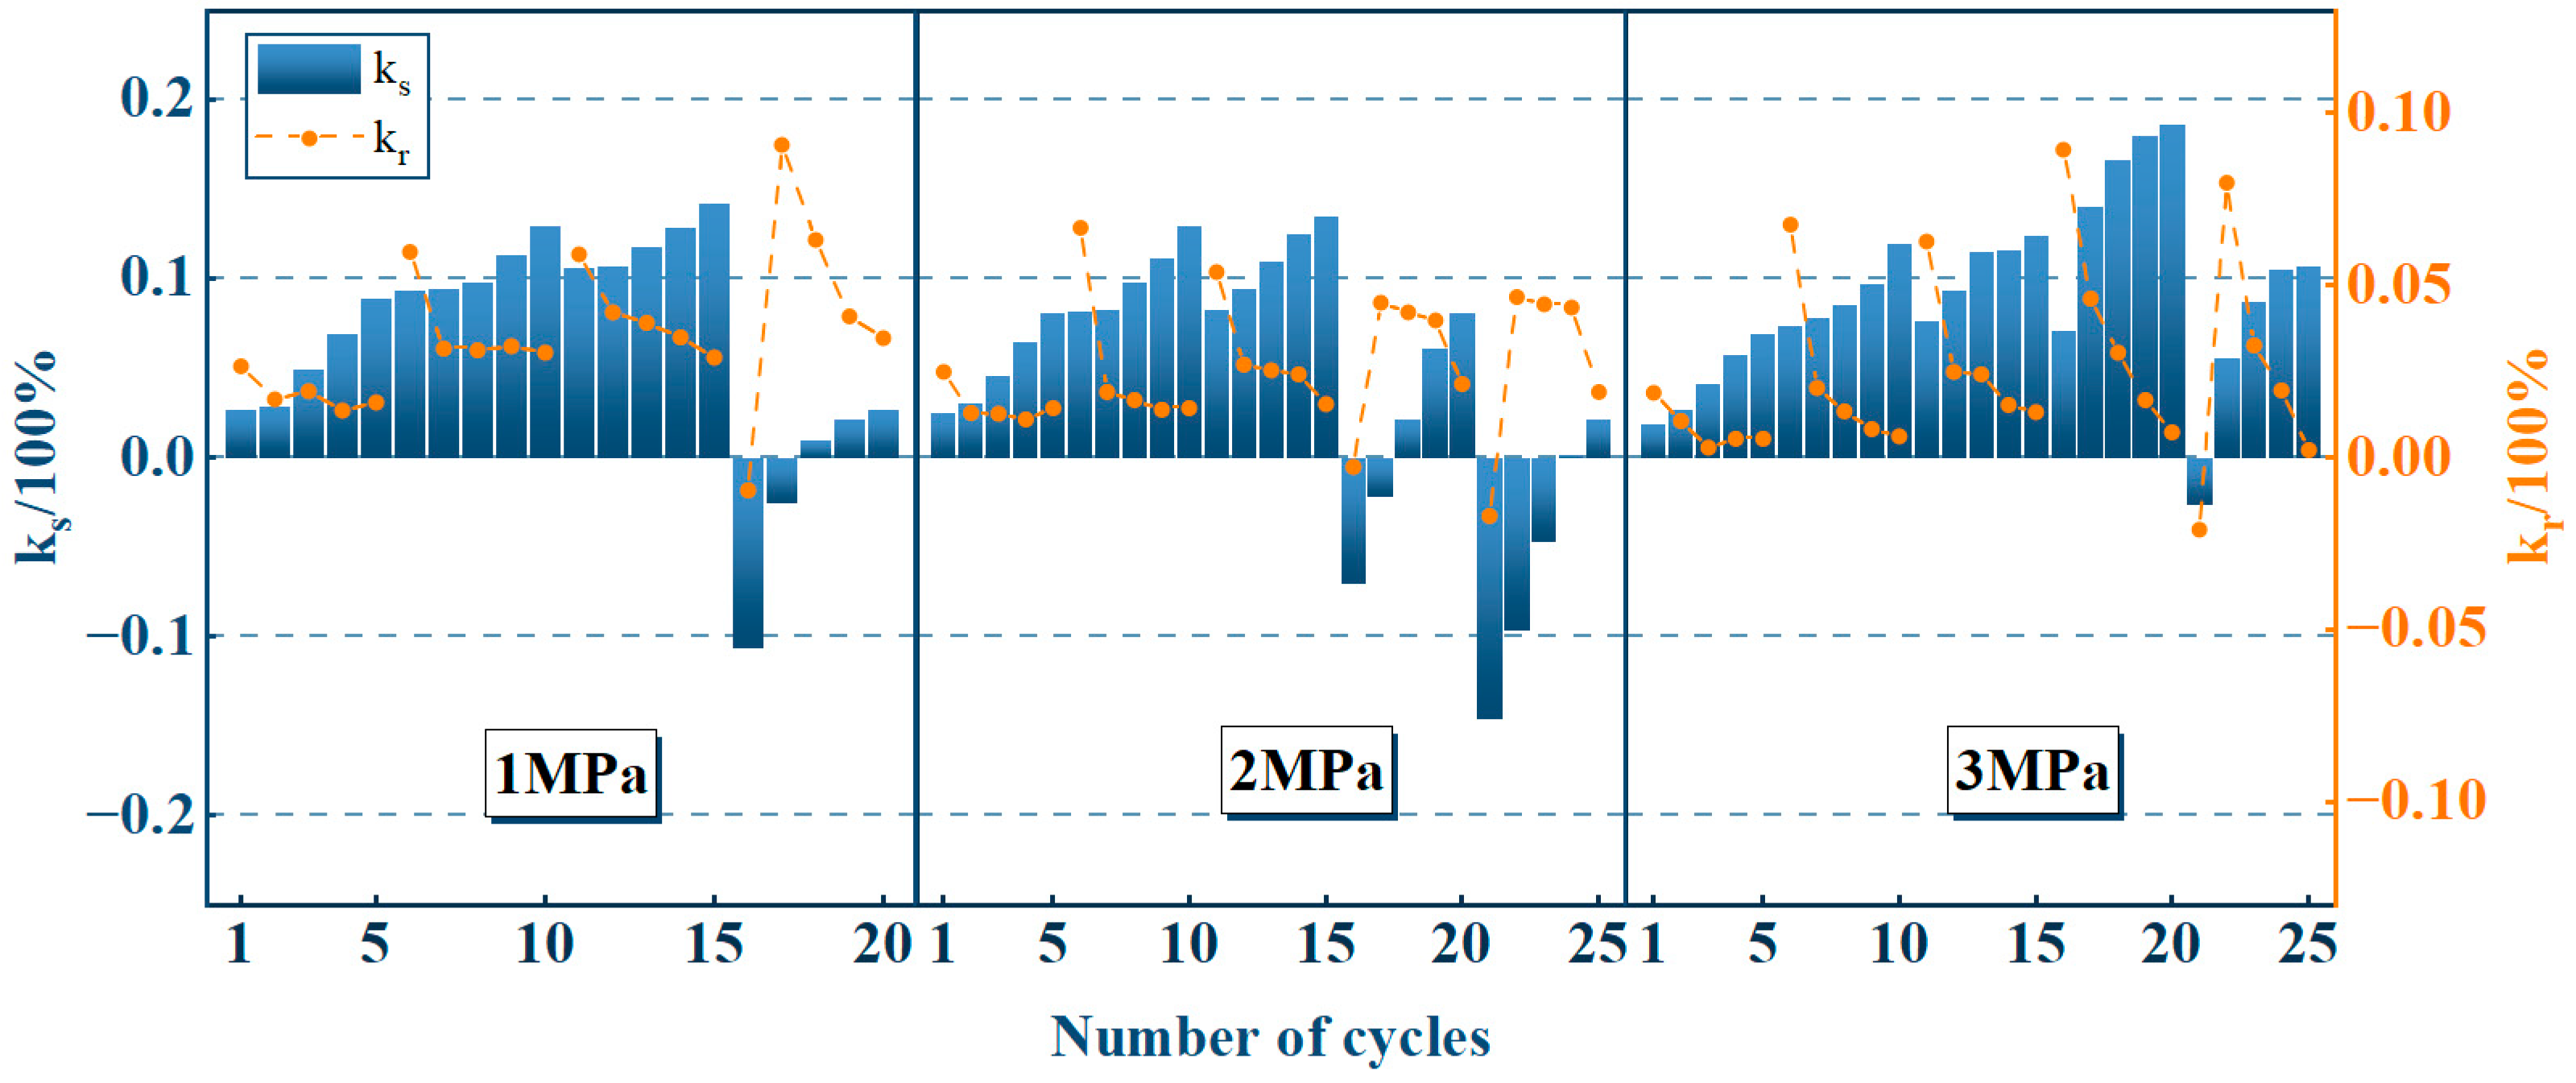
Figure 9 illustrates the relationship between and at various gas pressures and cycle counts. It can be seen that starts to show negative values at one or two stress levels before the coal samples are crushed; the situation in which the permeability at the end of the cycle exceeds the initial permeability happens inversely. In the stage without negative values, indicates a general increasing tendency when the stress level increases. This is due to the fact that the early stage of cyclic loading has a stronger compaction effect on coal samples than the extent of crack generation. Meanwhile, this effect is exacerbated by higher levels of deviatoric stress. In the later stage, the deviatoric stress continues to increase, and secondary cracks within the samples increase significantly, forming new effective seepage channels. At the same stress level, increases with the number of cycles, and the values of at stress level 1 at 1 MPa gas pressure are 0.0269, 0.0291, 0.0491, 0.0695, and 0.0892, which indicates that the final permeability of each cycle somewhat returns to its initial value to a lesser extent but roughly always recovers to about 91~97% of the initial permeability. In the stage where , at each level exhibits a steep decline followed by a slow trend, while in the stage where is negative, at each level shows a steep increase accompanied by a declining trend. In addition, shows an overall upward trend when stress levels rise. The phenomenon above indicates that the degree of permeability reduction at the end of the cycle is increased by the elevated stress levels. Within the same stress level, the first cycle results in the greatest amount of permeability loss; the subsequent series of cycles is followed by a gradual drop in permeability. This is attributed to the reduced compressibility of the pore cleavage inside the coal samples.
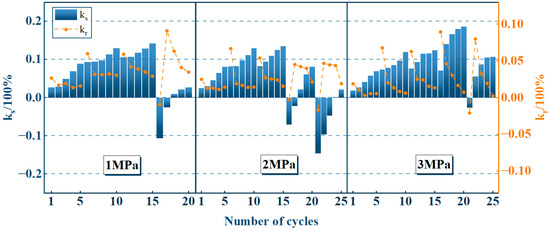
Figure 9.
Absolute and relative permeability damage rate.
4.3. Impact of Gas Pressure on Seepage Characteristics
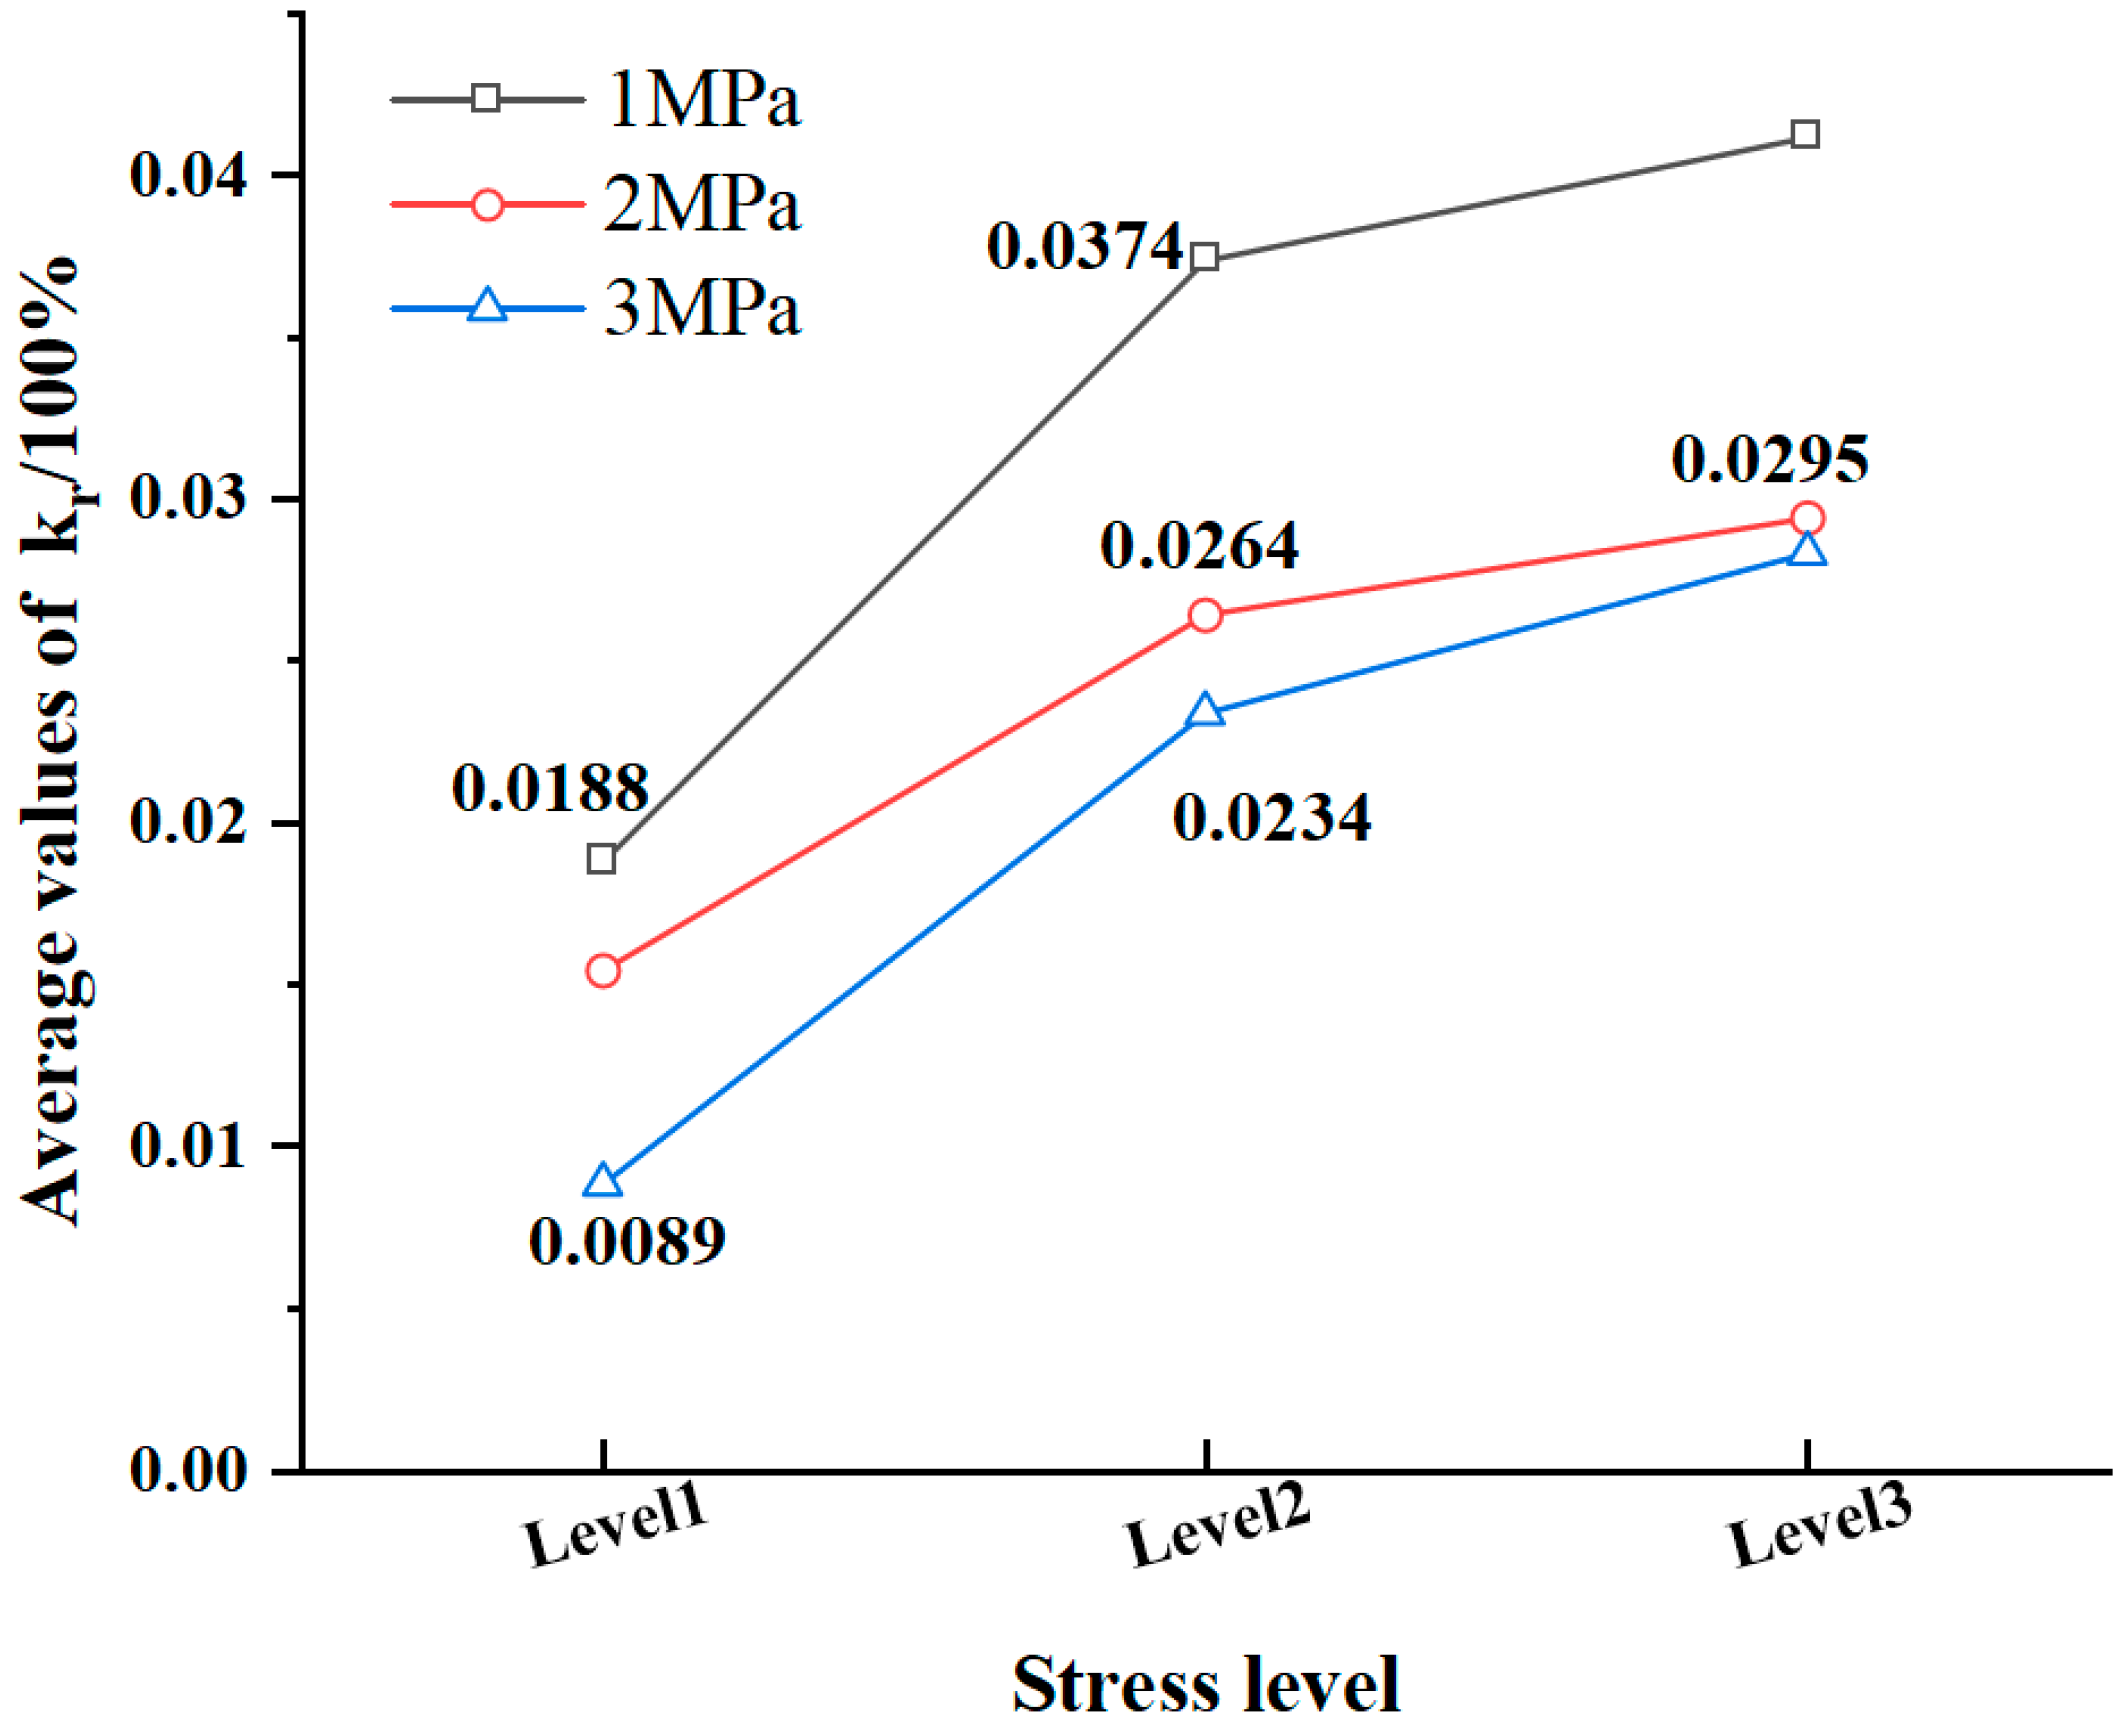
The fluctuation of the internal pore cleavage affects the coal samples’ permeability. Due to the complex and discrete developmental states of different specimens after crack extension, only the first three stress levels of the coal samples with a more stable internal structure are analyzed here. As the gas pressure increases, Figure 9 illustrates that the value of drops, e.g., in the first cycle, the values of are 0.0269, 0.0251, and 0.0192 for 1, 2, and 3 MPa, respectively. The results show a decreasing trend of with increasing gas pressure. The average values of at different stress levels were analyzed and are shown in Figure 10. It was found that the average values at all levels decreased gradually with the increase in gas pressure, and at stress level 1, the average values at 1, 2, and 3 MPa gas pressures were 0.0188, 0.0155, and 0.0089, respectively, with a decrease of 17.56% and 52.66% in the average values at 2 and 3 MPa, respectively, with respect to 1 MPa. The above phenomena indicate that an increase in gas pressure reduces permeability loss and decreases the rate of permeability loss. A rise in gas pressure reduces the actual effective stress, weakens the plastic deformation within the coal under the same mining stress scenario, and reduces the corresponding permeability damage rate. Simultaneously, the extent of the seepage channels decreases as a result of the increased gas pressure, which encourages fracture expansion.
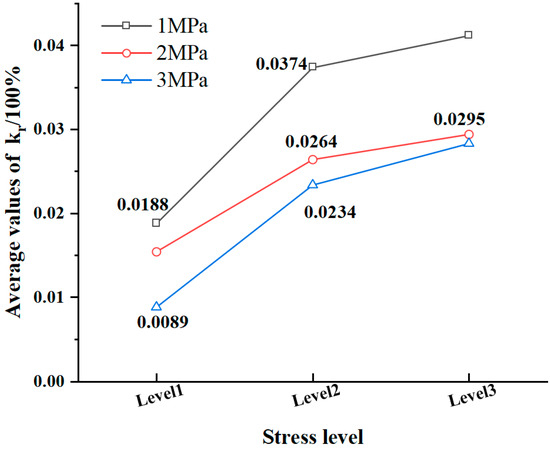
Figure 10.
Average for each stress level.
5. Energy Evolution and Damage Characterization
5.1. Energy Evolution
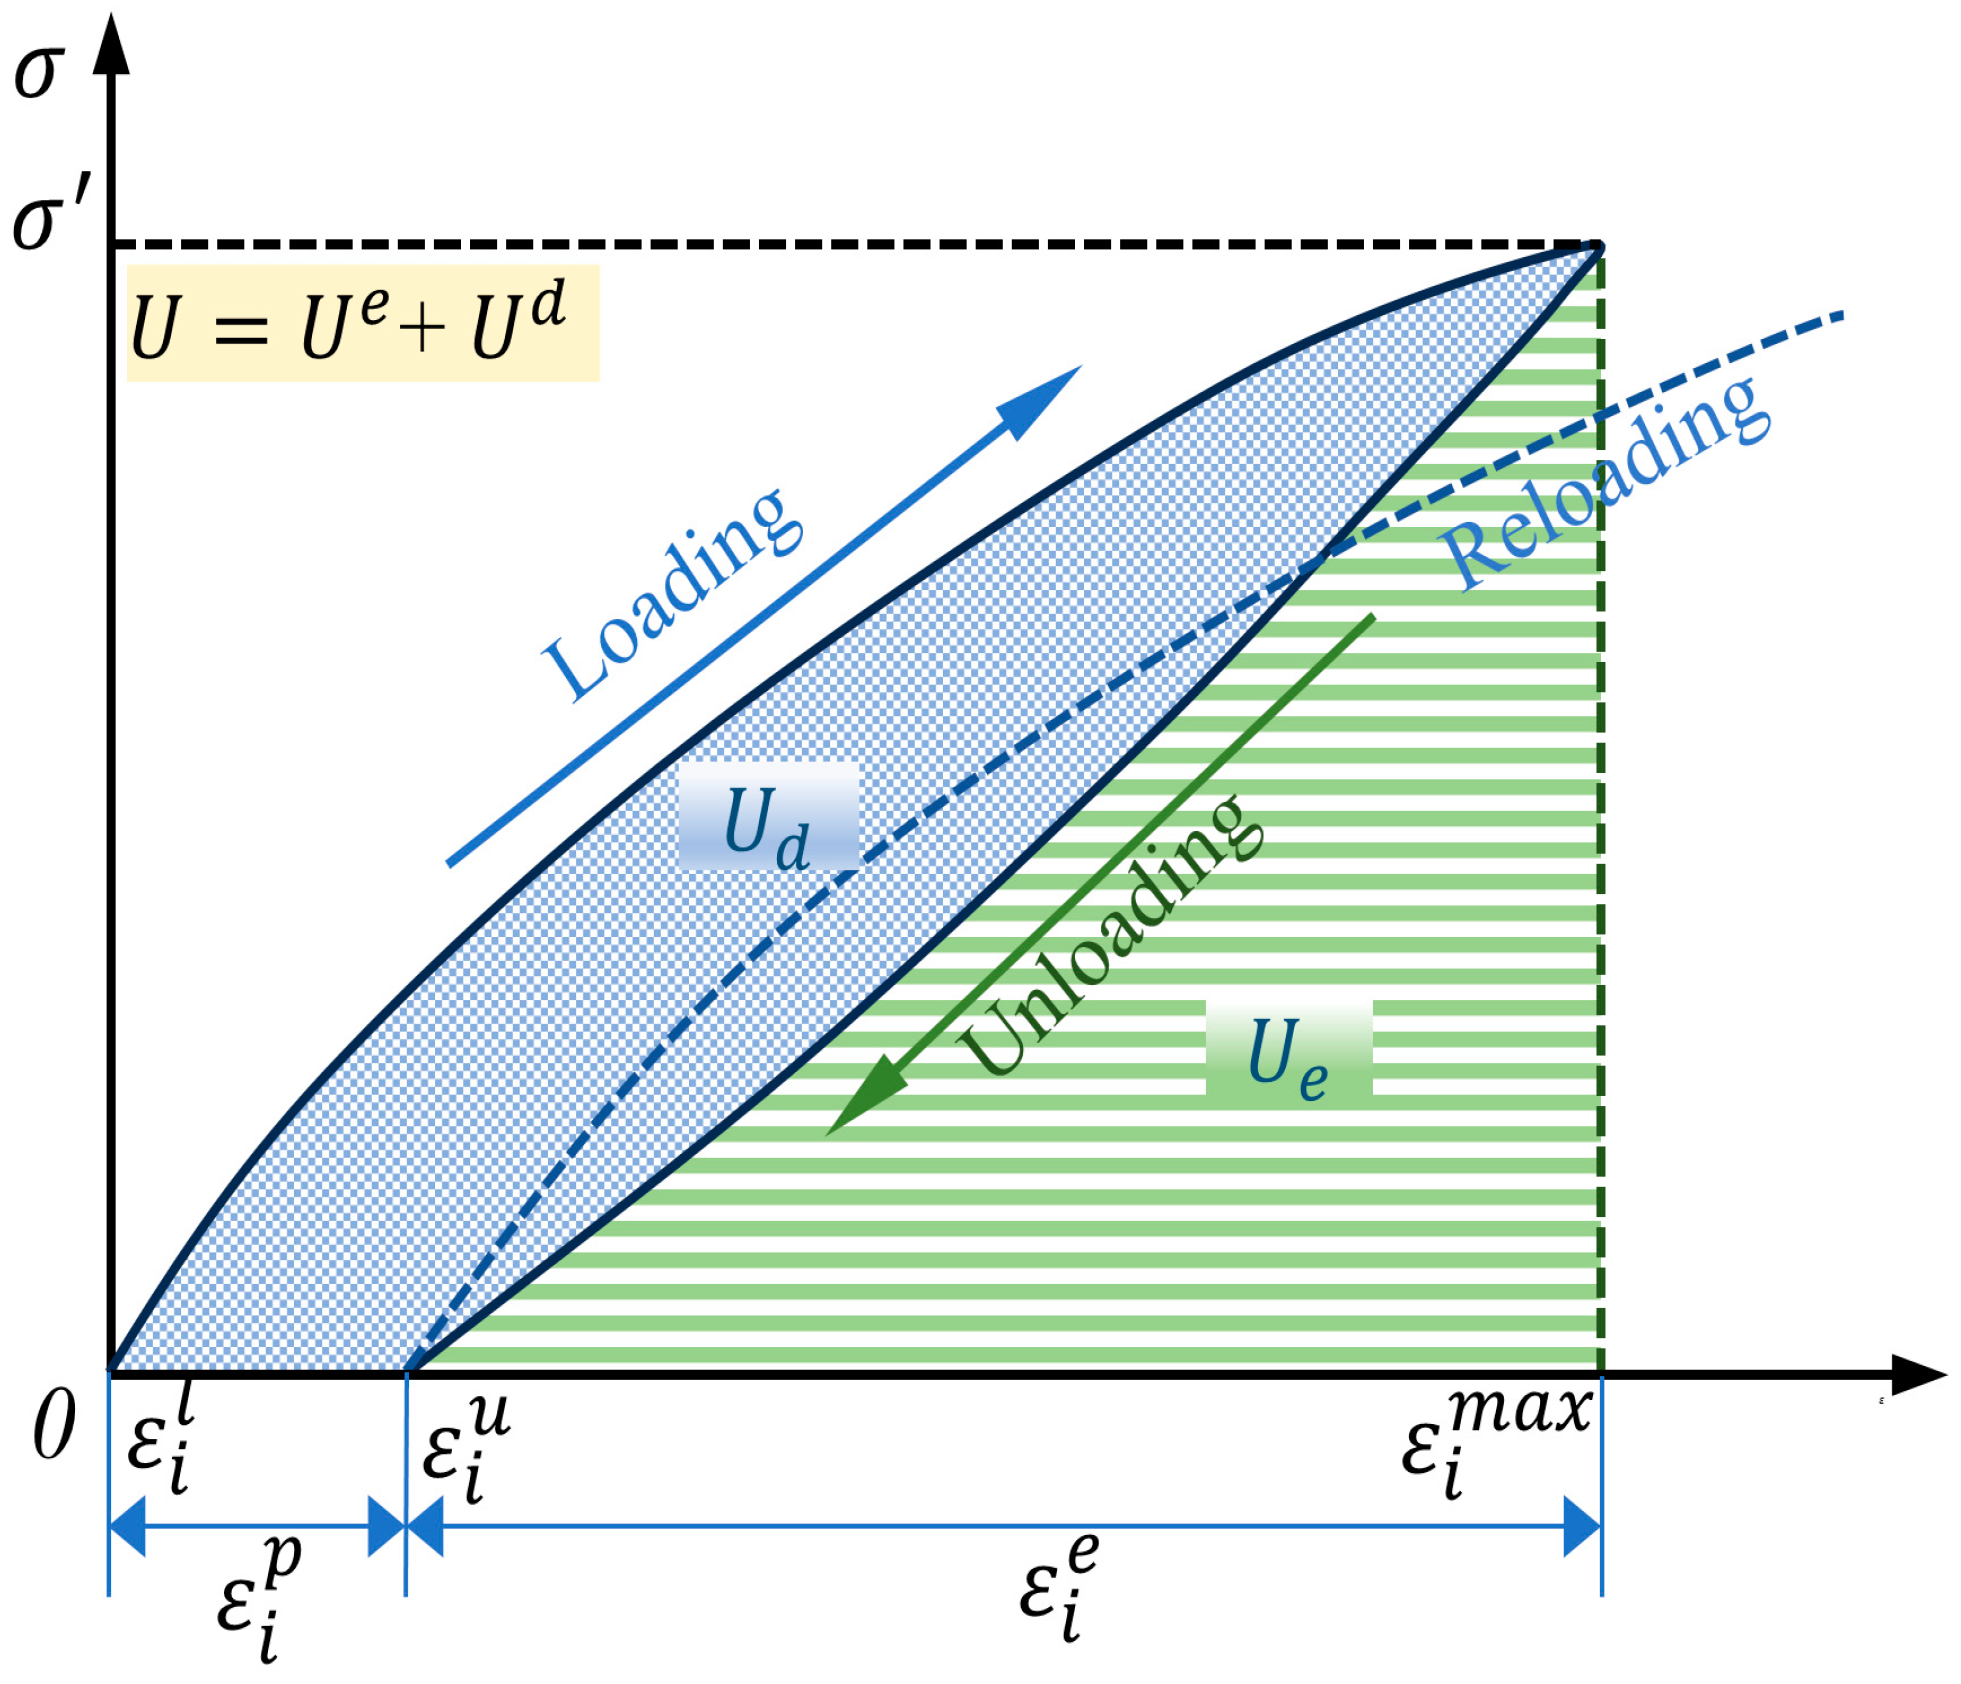
The majority of mechanical energy input to the coal sample is transformed into elastic strain energy stored in the rock and liberated upon unloading, and a small portion of the energy is dissipated as plastic deformation of the coal rock, internal friction, and other forms of energy required, as shown in Figure 11.

Figure 11.
An example of a cyclic loading path energy calculation strategy.
According to the first law of thermodynamics, the following can be obtained:
The impact of gas pressure must be taken into account when calculating the energy of each component of the gas-bearing coal. The following formula can be used to determine the actual role in the coal sample to be worked on for the axial effective stress and the radial effective stress :
The following formula can be used to determine the specimen’s energy:
where , , , and are the total work done and elastic energy released by the axial effective stress and radial effective stress, respectively, , , , and are the values of stress and strain at each point on the axial stress–strain curves, , , , and are the values of stress and strain at each point on the radial stress–strain curves.
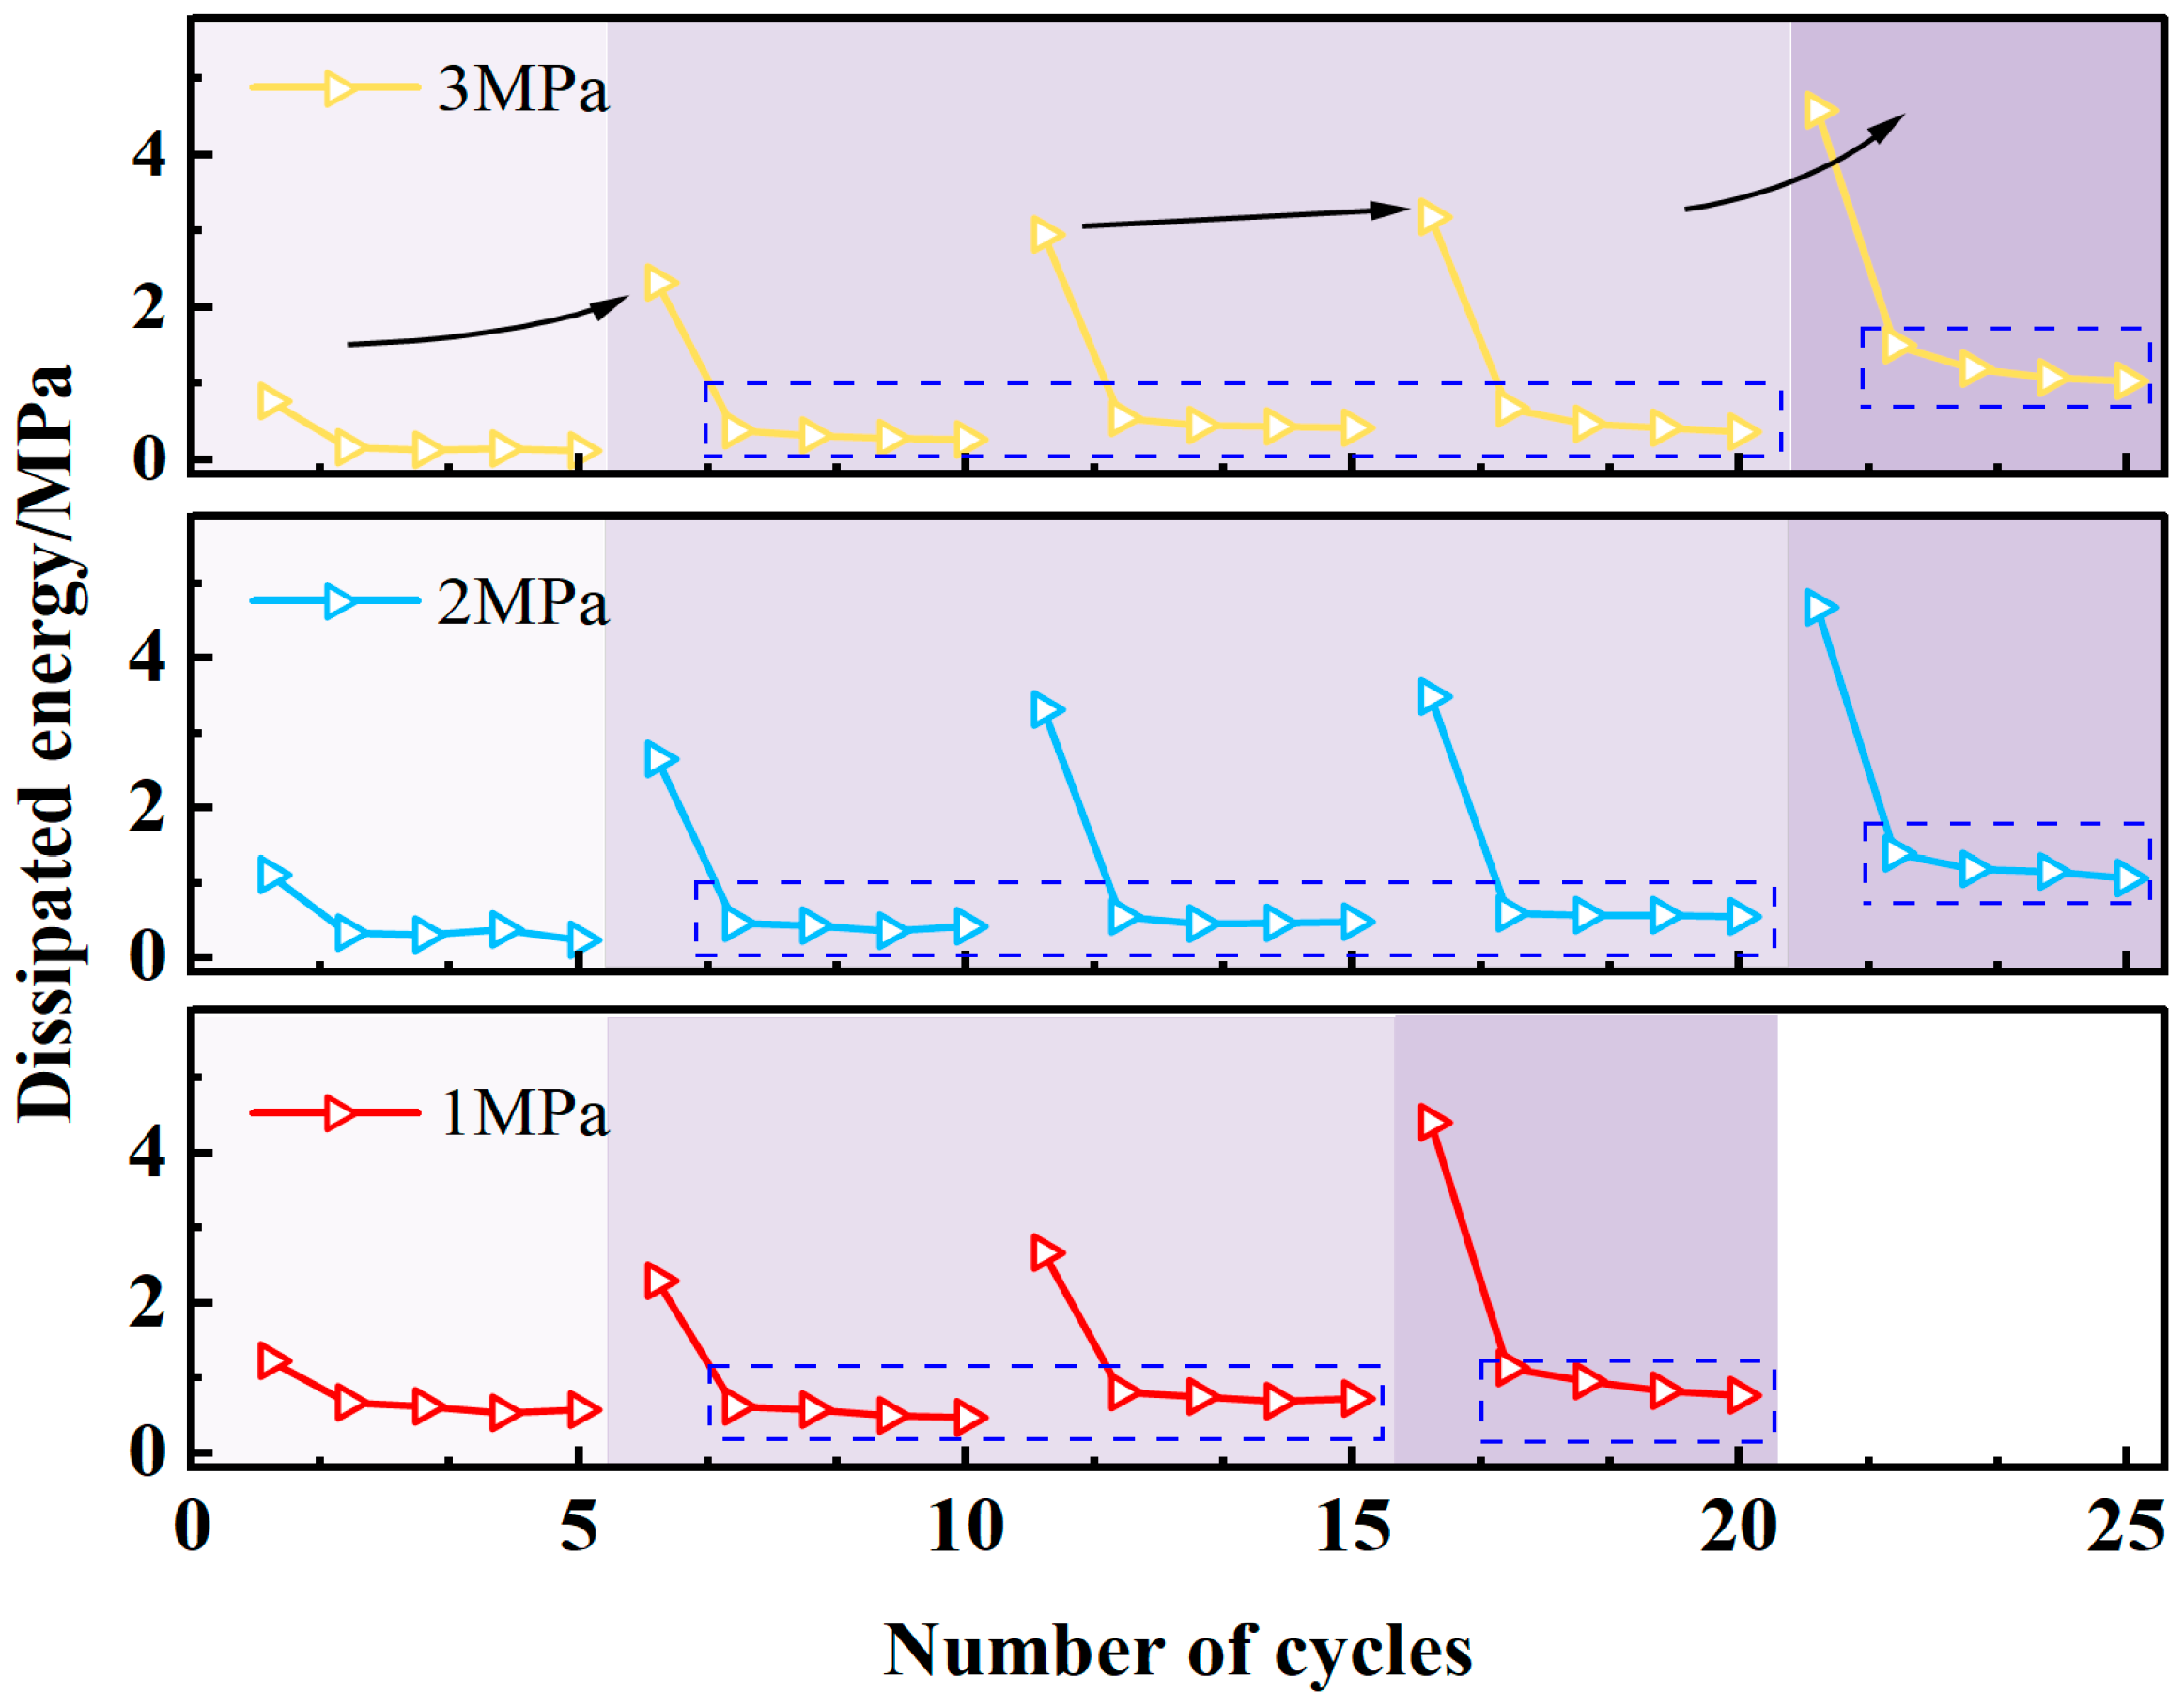
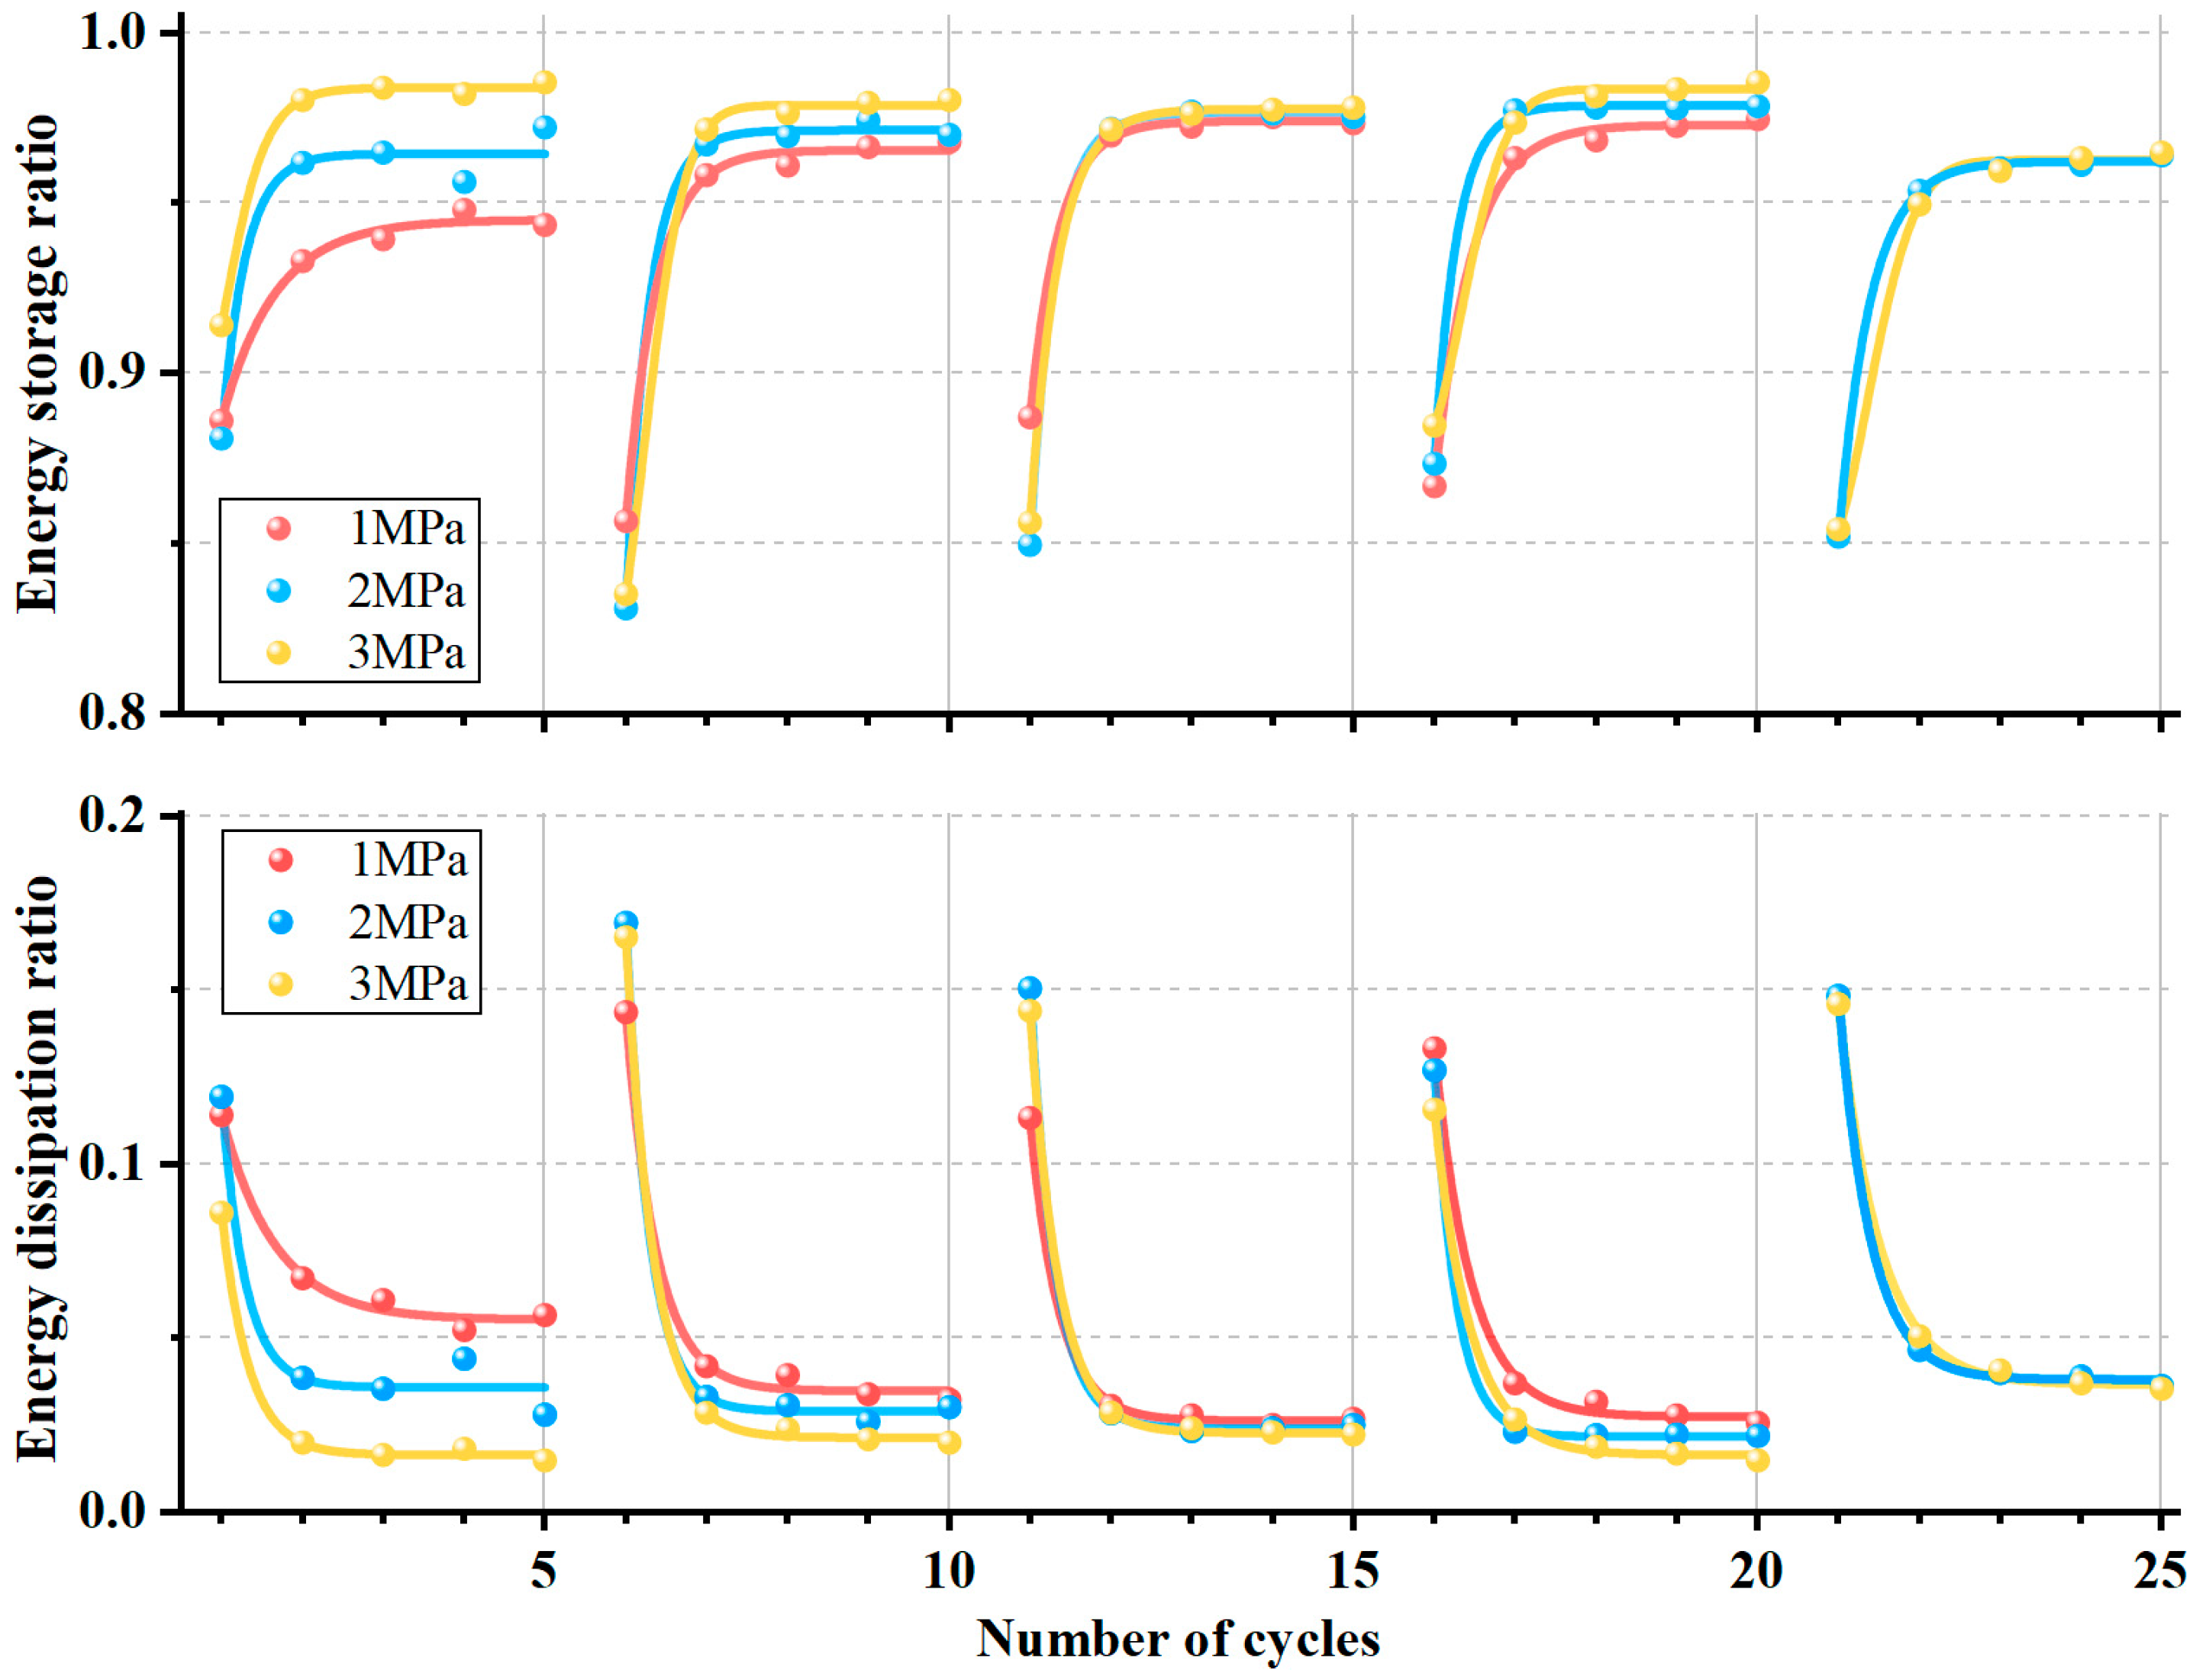
Figure 12 demonstrates how the dissipated energy progressively rises as the stress level does. Moreover, an increased number of cycles causes the dissipated energy to rapidly decrease at the same stress level, followed by a slower decrease. The dissipated energy growth rate allows for the division of the changing process into “initial growth–relatively stable growth–accelerated growth” stages, which are indicated by different depths of colors in Figure 12. The single energy storage ratio is defined as the ratio of elastic energy to total input energy during a single cycle in order to further examine the energy distribution of dissipated energy and elastic energy in a single cycle. The single energy dissipation ratio, as seen in Figure 13, is the ratio of dissipated energy to total input energy.
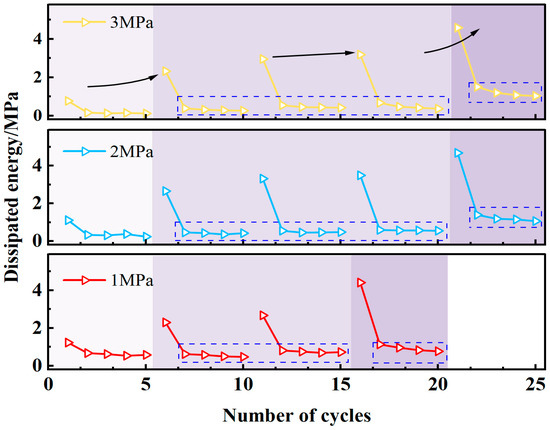
Figure 12.
Relationship between dissipated energy and the number of cycles.
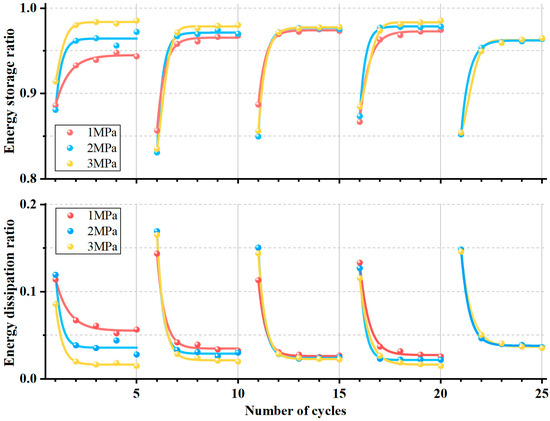
Figure 13.
Connection between the number of cycles and the energy dissipation (storage) ratio.
From Figure 13, it can be seen that, at the same stress level, the single energy dissipation ratio is distributed in an “L” shape, while the corresponding single energy storage ratio is distributed in a “Γ” shape. Apart from the first cycle of each level where the single energy dissipation ratio is higher, the energy dissipation ratios of the subsequent cycles show minimal variation. The single energy storage ratios range from 0.8 to 1.0, while the energy dissipation ratios are in the range of 0~0.2. This indicates that more than 80% of the total energy input is used for the elastic deformation of the specimen as elastic strain energy stored in the rock samples in each cycle. About 20% is used for the dissipated energy for the compression and densification of the original cracks, the occurrence of secondary cracks, and the enlargement of existing ones. For every cycle, the ratio of dissipated energy to elastic energy is between 0 and 0.25, indicating that the energy utilized for dissipation in each cycle only represents 25% or less of the elastic strain energy.
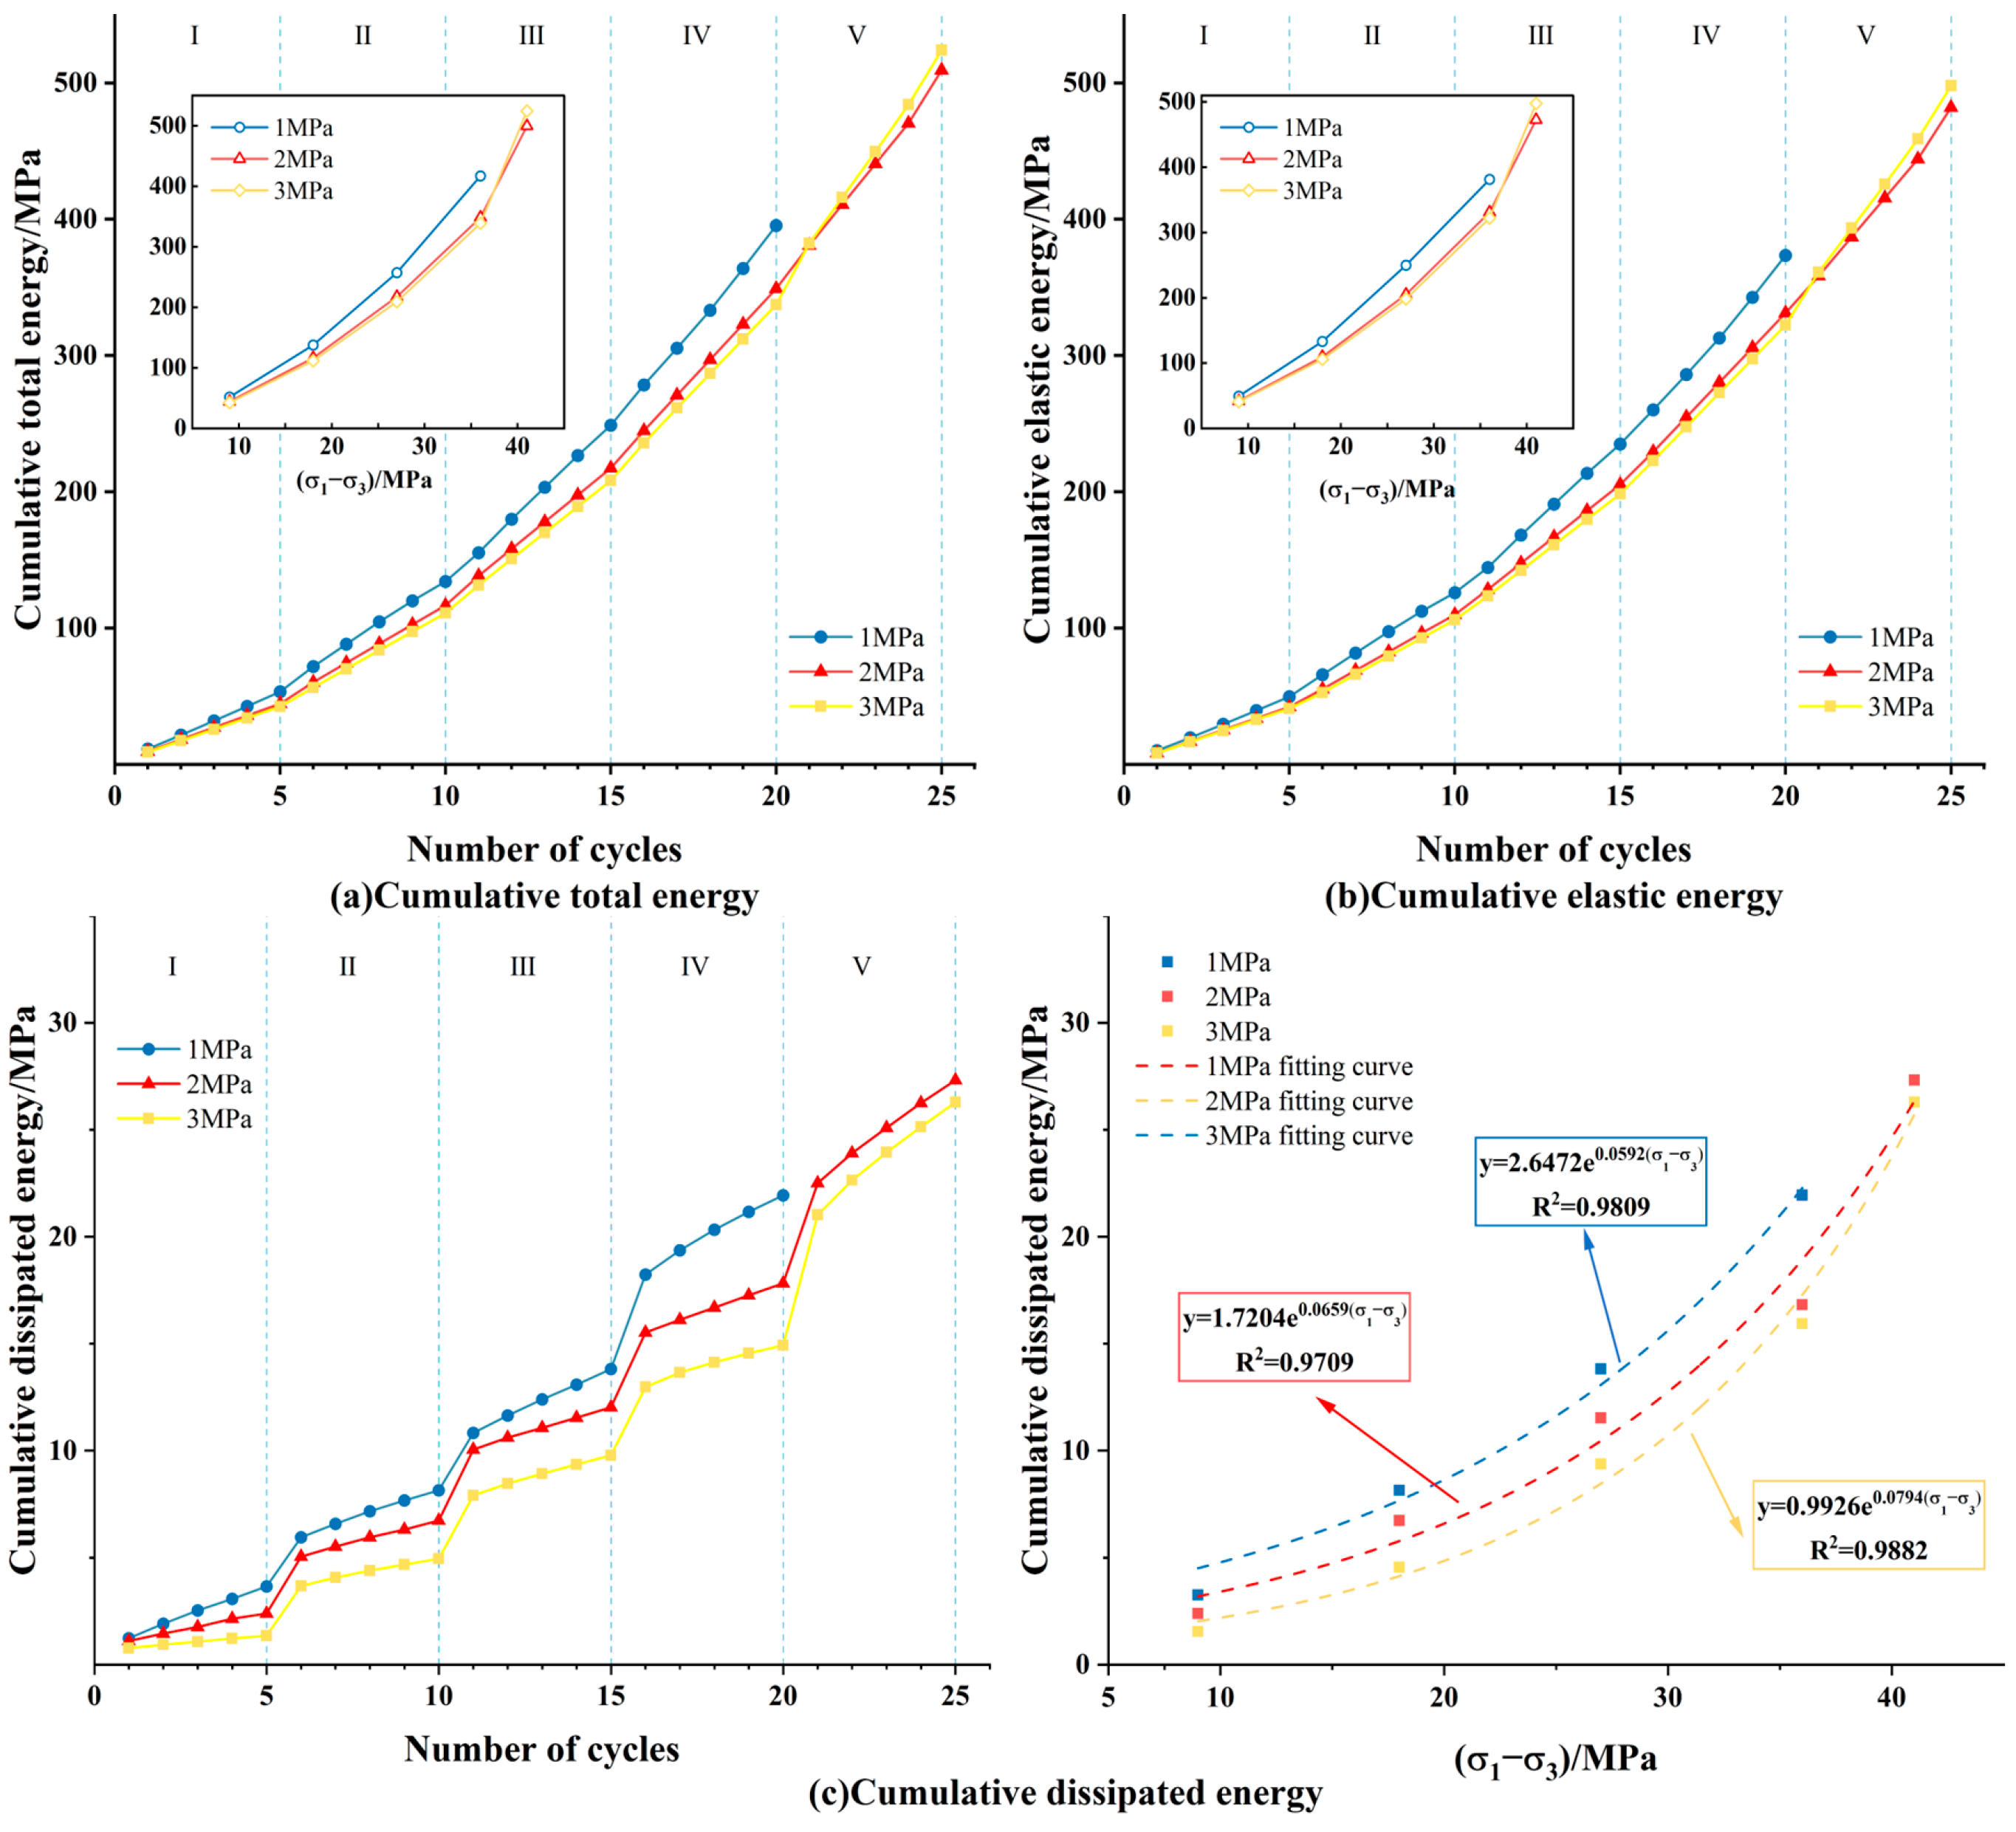
The cumulative energy is obtained by superimposing the energy of each cycle. Figure 14 shows the connection between the total energy, the number of cycles, and the maximum deviatoric stress. It can be seen that the cumulative total energy and cumulative elastic energy progressively rise with the number of cycles and the deviatoric stress in the following concave trend. The curves of the cumulative dissipated energy versus the number of cycles showed a gradual slope growth pattern. the distribution law of the logarithmic function can describe the relationship between the cumulative dissipated energy and the number of cycles under various stress levels. The first stage can be considered as the initial growth stage of the cumulative dissipated energy. This stage is primarily utilized for the original pore-crack compaction of the specimen and the friction between the particles under low stresses. The second stage can be considered as the phase of continuous growth of cumulative dissipated energy. During this stage, the slope of the curve representing cumulative dissipated energy against deviatoric stress remains relatively constant. However, the input energy is predominantly stored as elastic energy because of the increased stress. There is considerable similarity between the cumulative dissipated energy rate coefficients and the number of cycles, suggesting that the rise in the upper limit of deviatoric stress does not significantly impact the dissipated energy. In the final stage, the cumulative dissipated energy is strengthened as the stress level approaches peak strength. The fatigue damage resistance of the specimen decreases compared to the previous stage, leading to the accelerated expansion of cracks within the rock due to the accumulation of previous damage. The slope of the cumulative dissipated energy versus the number of cycles changes from gradual to steep as a result of this large increase in dissipated energy.

Figure 14.
The specimens’ cumulative total energy, cumulative elastic energy, and cumulative dissipation energy.
5.2. Characterization of Damage Evolution Based on Dissipated Energy
Peng et al. [50] proposed a function for the damage variable of coal in order to define the level of damage:
where is the corresponding cumulative dissipated energy increment and is the bias stress increment.
In Figure 14, an exponential function can be used to express the relationship between the deviatoric stress and the cumulative dissipated energy as:
Substituting Equation (14) into Equation (13) yields the formula for the damage variable for continuous stress:
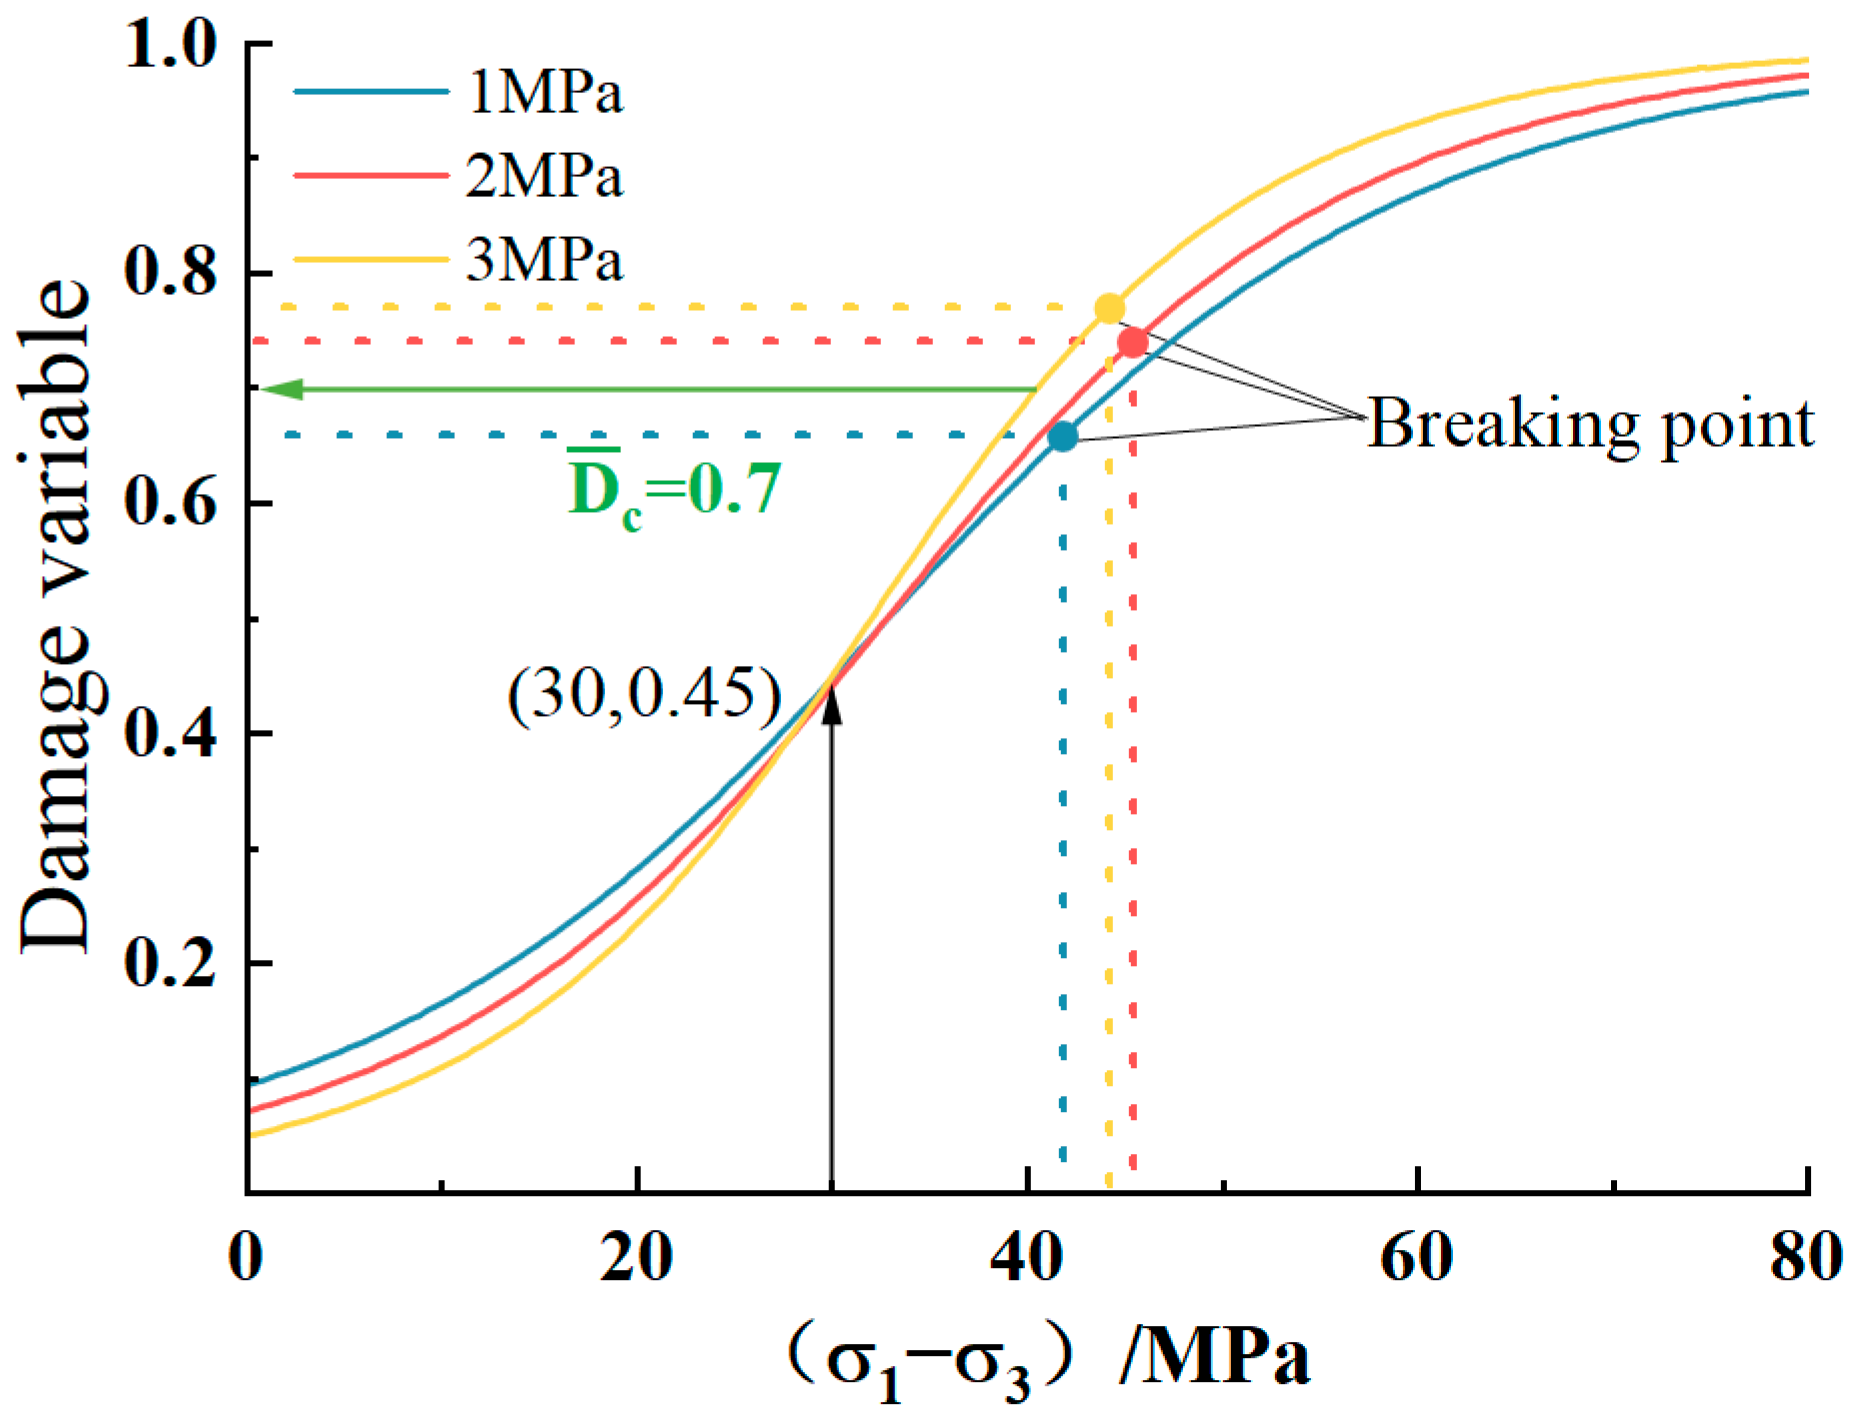
The damage variable function curves for the coal samples can be calculated using Equation (15) and are shown in Figure 15. The outcome of the experiment demonstrates that, the value of the damage variable for the coal samples rises rapidly after an initial increase for the incremental deviatoric stress, leading to a more pronounced level of damage in the coal samples. The damage variable values under 1, 2, and 3 MPa gas pressures that match to the coal samples’ damage points are 0.66, 0.74, and 0.77, respectively, which are very close to each other, and the mean value of damage variable .
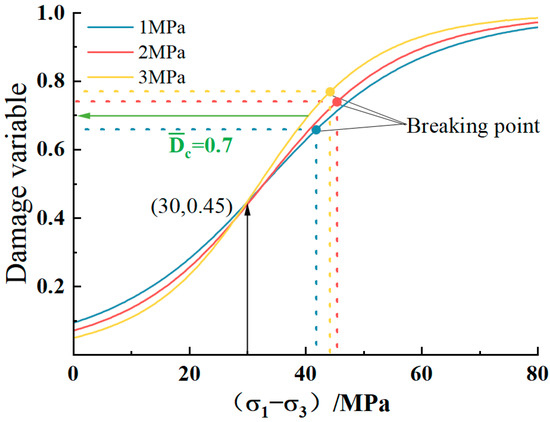
Figure 15.
Evolution curves of damage variables.
5.3. Impact of Gas Pressure on Energy Consumption and Damage Characteristics
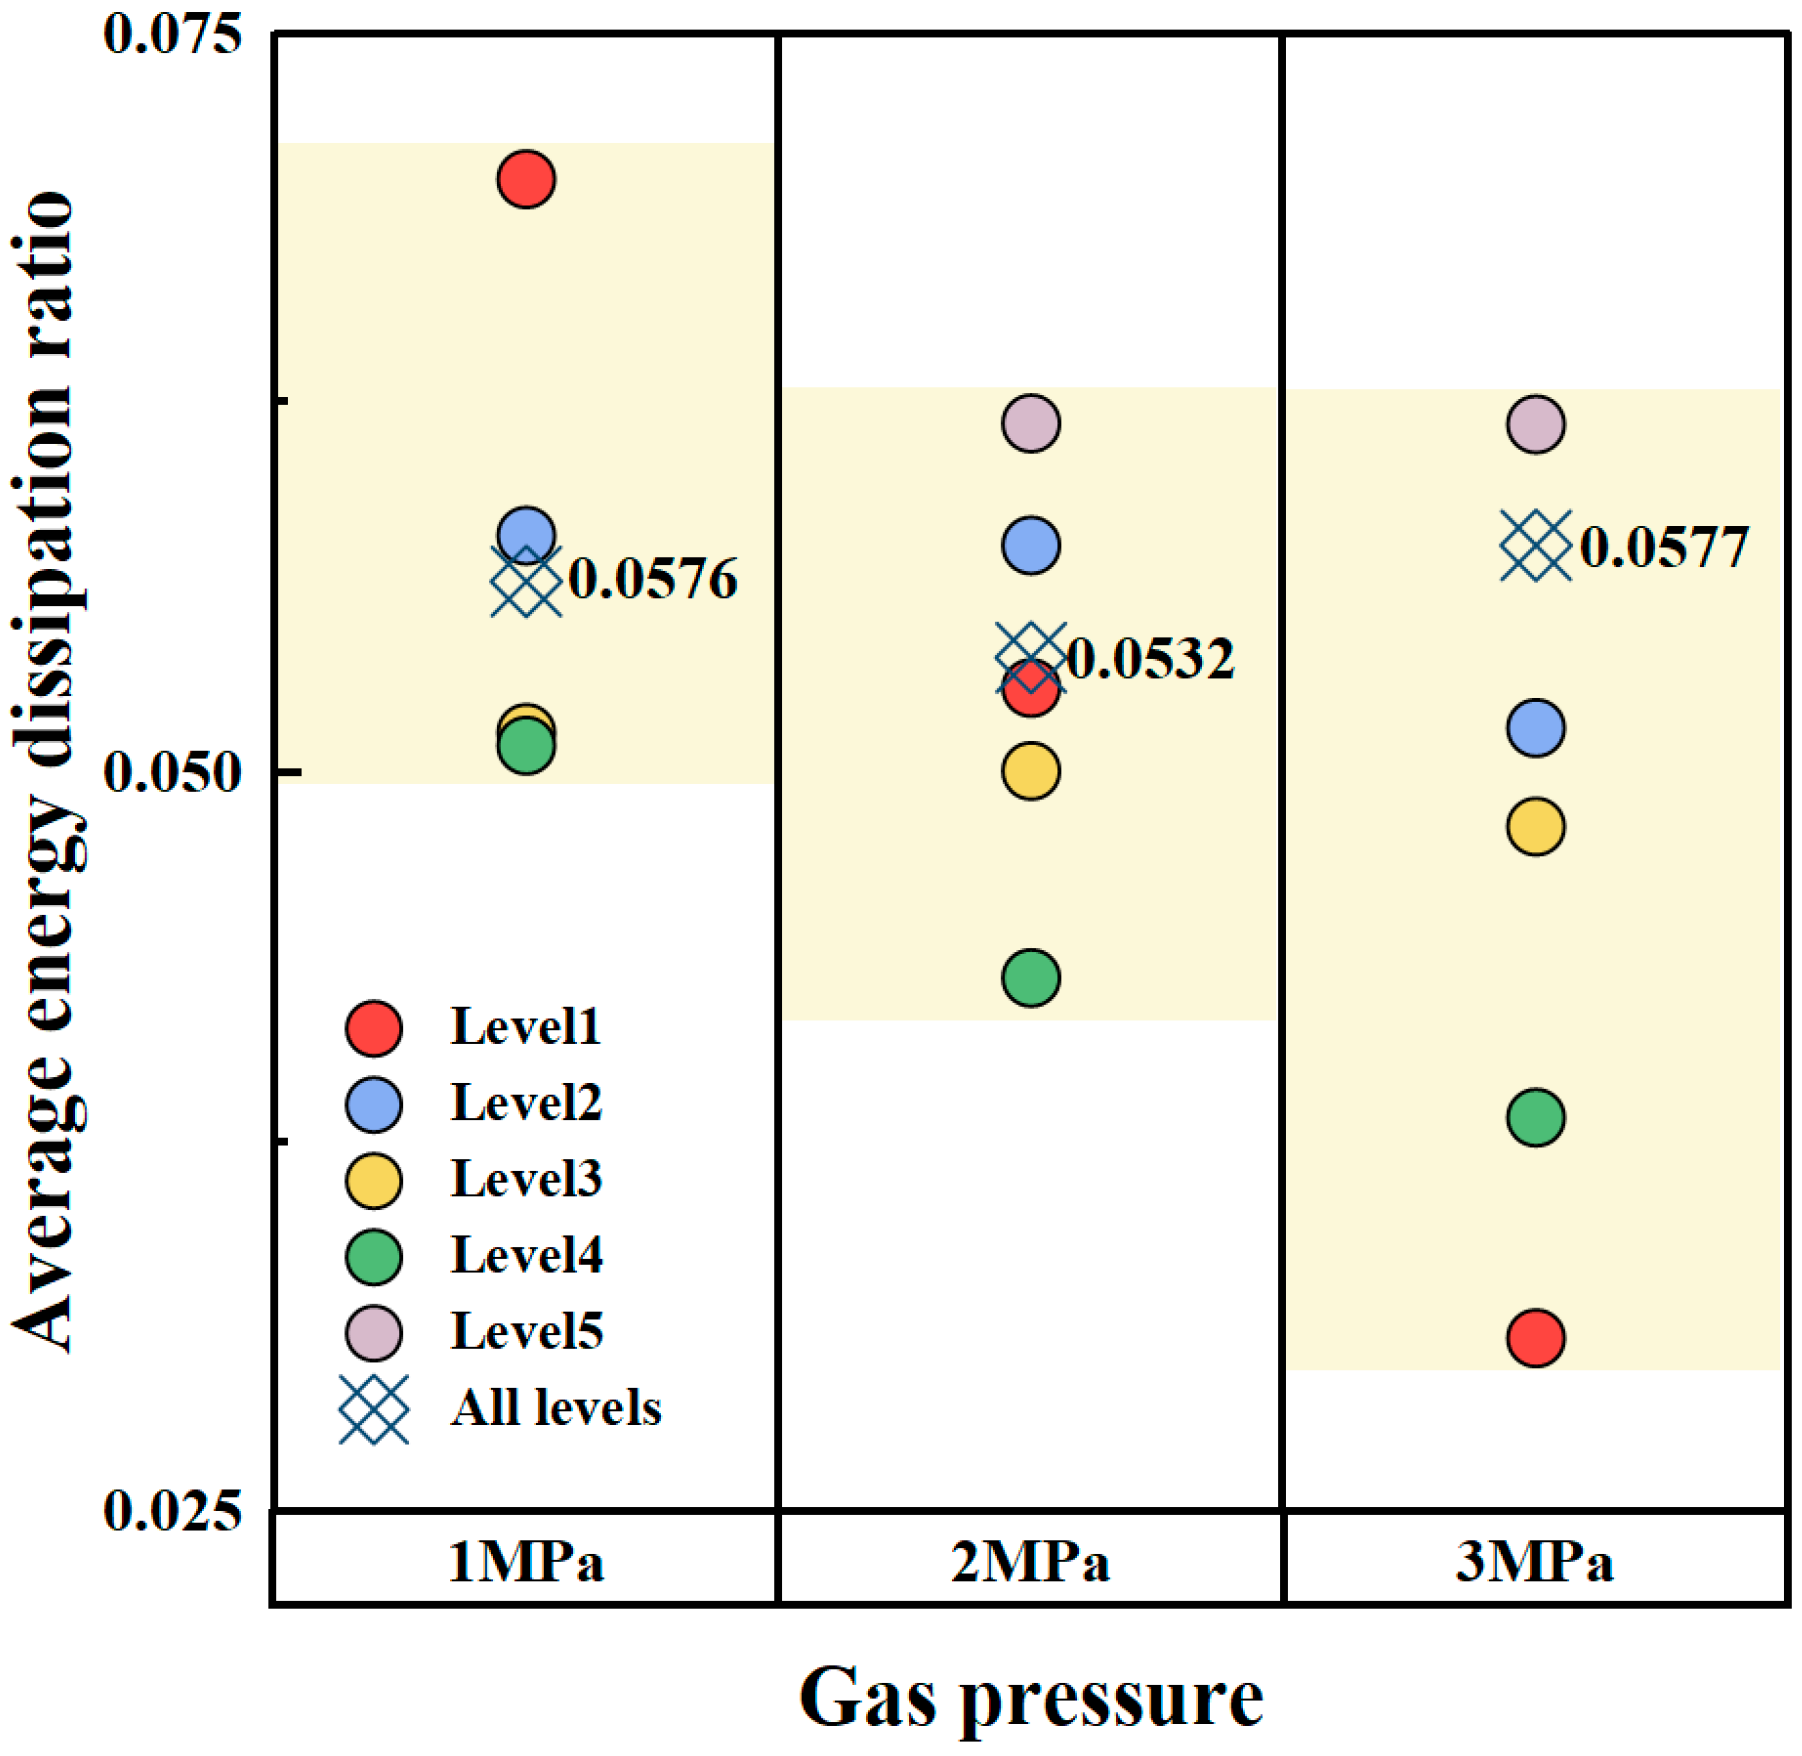
The average energy dissipation ratio decreases as gas pressure increases at the same stress level from Figure 16. As the gas pressure increases, the average energy dissipation ratio decreases sequentially by 24.5436% and 55.9174% at stress level 1, by 0.57% and 11.18% at stress level 2, by 2.51% and 6.17% t stress level 3, and by 15.4216% and 24.6748% at stress level 4. In addition, the average energy dissipation ratio’s upper and lower bounds fall with the increase in gas pressure. According to the aforementioned findings, more energy is retained as elastic energy inside the coal samples and less energy is lost throughout the cyclic procedure when gas pressure rises. This phenomenon may occur due to the increased gas pressure, which enhances the adsorption of gas on coal samples. The surface tension and bonding force between coal particles are weakened by the adsorption of gas on coal. Additionally, the presence of free gas in the pores and cracks of the coal body weakens the friction force on the shear surface.
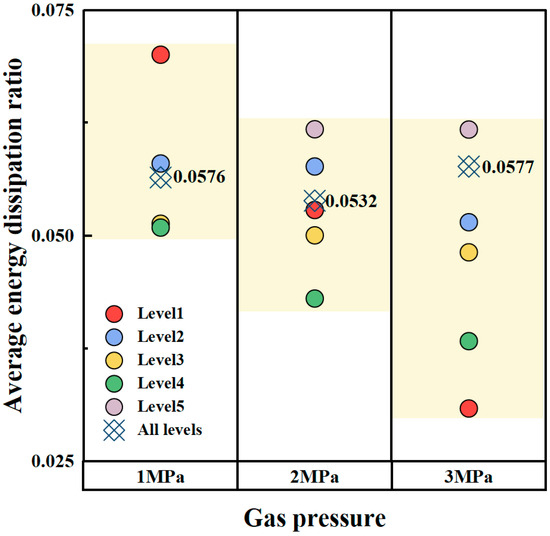
Figure 16.
Average energy dissipation ratios at each stress level at different air pressures.
Regarding the elastic energy, a linear function can fit the relationship between the number of cycles and the total elastic energy of the specimen’s last stress level prior to breaking, as indicated in Table 1. The slopes are 28.3409, 30.4681, and 33.8776 at 1, 2, and 3 MPa gas pressures, respectively. The maximum cumulative elastic energy at 1 MPa gas pressure is 373.46 MPa. Additionally, in comparison to 1 MPa, the maximum cumulative elastic energy rose by 22.6241% and 25.1582% at 2 MPa and 3 MPa gas pressures, respectively. Before the coal rock is about to be destroyed, the growth rate of cumulative elastic energy increases as gas pressure rises under the same level of stress conditions. The cumulative elastic energy accumulated before the destruction becomes larger, indicating that more energy is released when the coal sample is destabilized, leading to more severe impact accidents.

Table 1.
Fitting formulas of cumulative elastic energy to the number of cycles.
From Figure 16, it can be observed that when the deviatoric stress is in the range of 0~30 MPa, the rate of increase in the value corresponding to the damage variable curve is greater with lower gas pressure. Conversely, when the deviatoric stress level exceeds 30 MPa, higher gas pressure causes the damage variable value to increase at a faster rate. This may be due to the fact that in the early stage of the experiment (the stage when the deviatoric stress is within 30 MPa), the internal damage of the coal samples has just begun to accumulate. The effective stress rises as a result of the gas pressure dropping, and the damage brought on by repeatedly loading the coal samples also gets worse. When the coal samples’ internal damage builds up to a certain moment in the latter stage, the increase in deviatoric stress triggers more cracks to sprout and develop. At this point, the rise in gas pressure further stimulates the expansion of the cracks and hinders crack closure, thereby exacerbating their internal damage. Until the destruction, the values of damage variables corresponding to 2 and 3 MPa gas pressure increased by 12.1216% and 16.6737%, respectively, compared with 1 MPa gas pressure. This suggests that when the gas pressure increases during crushing, the internal structure of the coal samples sustains more damage.
6. Conclusions
In this paper, graded multiple cyclic loading tests with simultaneous loading (unloading) of axial stress and unloading (loading) of confining stress under different gas pressures were conducted to investigate the deformation, seepage characteristics, and energy evolution laws of coal. The main results are as follows:
- (1)
- The deformation rate of the coal body increases as the stress level increases. The residual deformation exhibits a stepwise distribution, and as the number of cycles at the same stress level rises, the relative residual deformation decreases. The coal samples’ residual deformation and strain are both decreased by the increase in gas pressure.
- (2)
- As the stress level rose, the coal samples’ overall and likewise tended to increase. The permeability curves decreased in a spiral manner in all stress levels. The value of increased with the number of cycles; conversely, as the number of cycles increased, the value of declined. The increase in gas pressure reduced the rate of decrease in permeability damage.
- (3)
- The total energy, elastic energy, and dissipated energy of the coal samples increased with the increase in stress level. The dissipation energy of the first cycle was significantly larger than that of the succeeding cycles at the same stress level. The single energy dissipation ratio exhibited an “L” distribution with the number of cycles, and the average energy dissipation ratio decreased with the increase in gas pressure. Increased gas pressure leads to a faster increase in cumulative elastic energy at the previous stress level of specimen destruction, and the total elastic energy accumulated near destruction increases with the rise in gas pressure.
- (4)
- Based on dissipated energy, the damage variable curves for coal samples at various gas pressures were determined. When the deviatoric stress was in the range of 9–30 MPa, the growth rate of the damage variable decreased with increasing gas pressure. Subsequently, as the deviatoric stress increased, the growth rate of the damage variable also increased with the rise in gas pressure. Consequently, the damage variable of the specimen increased with the escalating gas pressure.
Author Contributions
Conceptualization, D.Z. and J.G.; methodology, Z.G.; software, Z.G.; validation, X.M. and Z.G.; formal analysis, X.M.; investigation, D.Z.; resources, J.G.; data curation, X.M.; writing—original draft preparation, X.M.; writing—review and editing, D.Z.; visualization, J.G.; supervision, D.Z.; project administration, J.G.; funding acquisition, J.G. All authors have read and agreed to the published version of the manuscript.
Funding
This work was supported by the National Natural Science Foundation of China (No. 52064016), Jiangxi Provincial Thousand Talents Plan Project (No. jxsq2019102082), Natural Science Foundation of Jiangxi Province (No. 20232BAB214035). These sources of support are gratefully acknowledged.
Institutional Review Board Statement
Not applicable.
Informed Consent Statement
Not applicable.
Data Availability Statement
Some or all data that support the findings of this study are available from the corresponding author upon reasonable request.
Conflicts of Interest
The authors declare no conflicts of interest.
References
- Flores, R.M. Coalbed methane: From hazard to resource. Int. J. Coal Geol. 1998, 35, 3–26. [Google Scholar] [CrossRef]
- Mark, C. Coal bursts that occur during development: A rock mechanics enigma. Int. J. Min. Sci. Technol. 2018, 28, 35–42. [Google Scholar] [CrossRef]
- He, M. Research progress of deep shaft construction mechanics. J. China Coal Soc. 2021, 46, 726–746. [Google Scholar]
- Wang, C.; Cheng, Y. Role of coal deformation energy in coal and gas outburst: A review. Fuel 2023, 332, 126019. [Google Scholar] [CrossRef]
- Wang, K.; Du, F. Coal-gas compound dynamic disasters in China: A review. Process Saf. Environ. Prot. 2020, 133, 1–17. [Google Scholar] [CrossRef]
- Tan, T.; Wang, E.; Wang, X.; Ma, L.; Yao, W. Resistivity and damage of coal under cyclic loading and unloading. Eng. Geol. 2023, 323, 107234. [Google Scholar]
- Warmuzinski, K. Harnessing methane emissions from coal mining. Process Saf. Environ. Prot. 2008, 86, 315–320. [Google Scholar] [CrossRef]
- Xu, J.; Li, B.-B.; Zhou, T.; Liu, D.; Cheng, L.-C.; Cao, J. Experimental study of coal deformation and permeability characteristics under loading-unloading conditions. J. China Coal Soc. 2012, 37, 1493–1498. [Google Scholar]
- Jones, A.; Bell, G.; Schraufnagel, R. Review of the Physical and Mechanical Properties of Coal. Rocky Mt. Assoc. Geol. 1988, 22, 169–187. [Google Scholar]
- Yin, G.; Li, W.; Li, M.; Jiang, C.; Qin, H.; Wang, M. Experimental study of mechanical properties of coal containing methane under different loading-unloading conditions. Chin. J. Rock Mech. Eng. 2013, 32, 891–901. [Google Scholar]
- Chen, H.; Cheng, Y.; Ren, T.; Zhou, H.; Liu, Q. Permeability distribution characteristics of protected coal seams during unloading of the coal body. Int. J. Rock Mech. Min. Sci. 2014, 71, 105–116. [Google Scholar] [CrossRef]
- Zhao, G.; Dai, B.; Dong, L.; Yang, C. Energy conversion of rocks in process of unloading confining pressure under different unloading paths. Trans. Nonferrous Met. Soc. China 2015, 25, 1626–1632. [Google Scholar] [CrossRef]
- Ju, Y.; Zhang, Q.; Zheng, J.; Wang, J.; Chang, C.; Gao, F. Experimental study on CH 4 permeability and its dependence on interior fracture networks of fractured coal under different excavation stress paths. Fuel 2017, 202, 483–493. [Google Scholar] [CrossRef]
- Zhang, M.; Lin, M.; Zhu, H.; Zhou, D.; Wang, L. An experimental study of the damage characteristics of gas-containing coal under the conditions of different loading and unloading rates. J. Loss Prev. Process Ind. 2018, 55, 338–346. [Google Scholar] [CrossRef]
- Browning, J.; Meredith, P.G.; Stuart, C.; Harland, S.; Healy, D.; Mitchell, T.M. A Directional Crack Damage Memory Effect in Sandstone under True Triaxial Loading. Geophys. Res. Lett. 2018, 45, 6878–6886. [Google Scholar] [CrossRef]
- Bai, X.; Wang, Y.; He, G.; Zhou, Z.; Wang, D.; Zhang, D. Research on a permeability model of coal damaged under triaxial loading and unloading. Fuel 2023, 354, 129375. [Google Scholar] [CrossRef]
- Zhao, K.; Ma, H.; Li, Y.; Li, P.; Dong, Z.; Liu, X.; Yin, H.; Yang, C.; Chen, X. Deformation and damage evolution of rock salt under multilevel cyclic loading with constant stress intervals. Eng. Fract. Mech. 2022, 260, 108191. [Google Scholar] [CrossRef]
- Liang, Y.; Ran, Q.; Zou, Q.; Zhang, B.; Hong, Y. Experimental Study of Mechanical Behaviors and Failure Characteristics of Coal Under True Triaxial Cyclic Loading and Unloading and Stress Rotation. Nat. Resour. Res. 2022, 31, 971–991. [Google Scholar] [CrossRef]
- Li, Z.; Xie, S.; Song, Q.; Wang, P.; Liu, D.; Zhao, B.; Huang, W.; Ma, D. Energy Dissipation and Damage Evolution Characteristics of Shale under Triaxial Cyclic Loading and Unloading. Adv. Mater. Sci. Eng. 2022, 2022, 1–13. [Google Scholar] [CrossRef]
- Liu, Y.; Dai, F. A review of experimental and theoretical research on the deformation and failure behavior of rocks subjected to cyclic loading. J. Rock Mech. Geotech. Eng. 2021, 13, 1203–1230. [Google Scholar] [CrossRef]
- Lyakhovsky, V.; Panteleev, I.; Shalev, E.; Browning, J.; Mitchell, T.M.; Healy, D.; Meredith, P.G. A new anisotropic poroelasticity model to describe damage accumulation during cyclic triaxial loading of rock. Geophys. J. Int. 2022, 230, 179–201. [Google Scholar] [CrossRef]
- Zhu, J.; Wang, Q.; Tang, J.; Chen, J.; JIang, Y.; Tang, D.; Lan, T. Evolution characteristics of strain and permeability of coal samples under loading and unloading conditions. J. China Coal Soc. 2021, 46, 1203–1210. [Google Scholar]
- Liu, H.; Bie, P.; LI, X.; Wei, Y.; Wang, M. Mechanical properties and energy dissipation characteristics of phyllite under triaxial multi-stage cyclic loading and unloading conditions. Rock Soil Mech. 2022, 43, 266–277. [Google Scholar]
- Geranmayeh Vaneghi, R.; Thoeni, K.; Dyskin, A.V.; Sharifzadeh, M.; Sarmadivaleh, M. Strength and Damage Response of Sandstone and Granodiorite under Different Loading Conditions of Multistage Uniaxial Cyclic Compression. Int. J. Geomech. 2020, 20, 04020159. [Google Scholar] [CrossRef]
- Li, Q.; Liang, Y.; Zou, Q. Seepage and Damage Evolution Characteristics of Gas-Bearing Coal under Different Cyclic Loading–Unloading Stress Paths. Processes 2018, 6, 190. [Google Scholar] [CrossRef]
- Wang, Y.; Han, J.; Li, P.; Cai, M. Effect of prior cyclic damage on rock failure exposed to triaxial multistage unloading confining pressure and cyclic loads. Fatigue Fract. Eng. Mater. Struct. 2022, 46, 1140–1158. [Google Scholar] [CrossRef]
- Daoud, A.; Browning, J.; Meredith, P.G.; Mitchell, T.M. Microstructural Controls on Thermal Crack Damage and the Presence of a Temperature-Memory Effect During Cyclic Thermal Stressing of Rocks. Geophys. Res. Lett. 2020, 47, e2020GL088693. [Google Scholar] [CrossRef]
- Liu, E.; He, S. Effects of cyclic dynamic loading on the mechanical properties of intact rock samples under confining pressure conditions. Eng. Geol. 2012, 125, 81–91. [Google Scholar] [CrossRef]
- Jiang, C.; Duan, M.; Yin, G.; Wang, J.G.; Lu, T.; Xu, J.; Zhang, D.; Huang, G. Experimental study on seepage properties, AE characteristics and energy dissipation of coal under tiered cyclic loading. Eng. Geol. 2017, 221, 114–123. [Google Scholar] [CrossRef]
- Peng, K.; Shi, S.; Zou, Q.; Wen, Z.; Wang, Y.; Jiang, Z.; Zheng, C. Quantitative Characteristics of Energy Evolution of Gas-Bearing Coal Under Cyclic Loading and its Action Mechanisms on Coal and Gas Outburst. Rock Mech. Rock Eng. 2021, 54, 3115–3133. [Google Scholar] [CrossRef]
- Gray, I. Reservoir engineering in coal seams: Part 1 the physical process of gas storage and movement in coal seams. SPE Reserv. Eng. 1987, 2, 28–34. [Google Scholar] [CrossRef]
- Seidle, J.; Jeansonne, M.; Erickson, D. In Application of matchstick geometry to stress dependent permeability in coals. In Proceedings of the SPE Rocky Mountain Petroleum Technology Conference/Low-Permeability Reservoirs Symposium, Casper, WY, USA, 18–21 May 1992; p. SPE-24361-MS. [Google Scholar]
- Palmer, I.; Mansoori, J. In How Permeability Depends on Stress and Pore Pressure in Coalbeds: A New Model, SPE 36737. In Proceedings of the Annual Technical Conference and Exhibition, Denver, CO, USA, 6–9 October 1996. [Google Scholar]
- Duan, M.; Jiang, C.; Gan, Q.; Li, M.; Peng, K.; Zhang, W. Experimental investigation on the permeability, acoustic emission and energy dissipation of coal under tiered cyclic unloading. J. Nat. Gas Sci. Eng. 2020, 73, 103054. [Google Scholar] [CrossRef]
- Xin, T.; Liang, B.; Wang, J.; Sun, W.; Yashengnan, S. Experimental Study on the Evolution Trend of the Pore Structure and the Permeability of Coal under Cyclic Loading and Unloading. ACS Omega 2021, 6, 35830–35843. [Google Scholar] [CrossRef]
- Geng, J.; Zeng, G.; Liu, C.; Li, X.; Zhang, D. Development and application of triaxial seepage test system for gas-water two-phase in coal rock. Energy 2023, 277, 127439. [Google Scholar] [CrossRef]
- Zou, Q.; Ning, Y.; Zhang, B.; Tian, S.; Jiang, Z.; An, Y. Mechanical properties and failure characteristics of sandstone under ramp loading paths. Geomech. Geophys. Geo-Energy Geo-Resour. 2023, 9, 39–56. [Google Scholar] [CrossRef]
- Wang, Z.; Yang, Y.; Xu, Y.; Xin, C.; Liang, P.; Guo, N. Analysis of Energy Evolution and Acoustic Emission Characteristics of Rocks under Cyclic Loading and Unloading. Appl. Sci. 2023, 13, 10453. [Google Scholar] [CrossRef]
- Wu, X.; Li, B.; Gao, Z.; Xu, J.; Fu, J. Influence mechanism of gas pressure reduction on coal deformation and seepage. China Saf. Sci. J. 2022, 32, 129–134. [Google Scholar]
- Ding, K.; Wang, L.; Wang, W.; Li, Z.; Jiang, C.; Ren, B.; Wang, S. Experimental Study on Gas Seepage Characteristics of Axially Unloaded Coal under Different Confining Pressures and Gas Pressures. Processes 2022, 10, 1055. [Google Scholar] [CrossRef]
- Yang, Y.; Zhang, D.; Dong, Y.; Zhang, J.; Li, X.; Zhang, C.; Wu, J. Deformation and seepage properties of raw coal during the simultaneous loading and unloading of axial stress and confining pressure. Phys. Fluids 2022, 34, 1–14. [Google Scholar] [CrossRef]
- Xue, J.; Li, K.; Shi, Y. Study on Permeability Characteristics of Gas Bearing Coal under Cyclic Load. Sustainability 2022, 14, 11483. [Google Scholar] [CrossRef]
- Sampath, K.H.S.M.; Perera, M.S.A.; Li, D.-Y.; Ranjith, P.G.; Matthai, S.K. Evaluation of the mechanical behaviour of brine+CO2 saturated brown coal under mono-cyclic uni-axial compression. Eng. Geol. 2019, 263, 105312. [Google Scholar] [CrossRef]
- Jia, H.; Wang, K.; Wang, Y. Permeability characteristics of gas-bearing coal specimens under cyclic loading-unloading of confining pressure. J. China Coal Soc. 2020, 45, 1710–1718. [Google Scholar]
- Zheng, W.; Gao, F.; Xing, Y.; Zhou, C.; Ming, L. Experimental and numerical investigation on effects of gas adsorption pressures on damage behaviors, failure characteristics, and energy evolution of coals. Phys. Fluids 2024, 36, 1–15. [Google Scholar] [CrossRef]
- Guo, Y.; Wang, K.; Du, F.; Guo, H.; Li, K.; Wang, Y. Mechanical-permeability characteristics of composite coal rock under different gas pressures and damage prediction model. Phys. Fluids 2024, 36, 1–12. [Google Scholar] [CrossRef]
- Liu, Z.; Dong, X.; Zhang, X. Experimental study on mechanical properties of bedding coal and rock under graded cyclic loading. Chin. J. Rock Mech. Eng. 2021, 7, 2593–2602. [Google Scholar]
- Yang, Y.; Zhang, B. Deformation Failure and Gas Seepage of Raw Coal in Alternate Loading and Unloading by Stages. Geotech. Geol. Eng. 2021, 40, 751–764. [Google Scholar] [CrossRef]
- Zhang, L.; Kan, Z.; Xue, J.; Li, M.; Zhang, C. Study on permeability law of intact and fractured coals under cyclic loading and unloading. Chin. J. Rock Mech. Eng. 2021, 40, 2487–2499. [Google Scholar]
- Peng, R.; Ju, Y.; Gao, F.; Xie, H.-P. Energy analysis on damage of coal under cyclical triaxial loading and unloading conditions. J. China Coal Soc. 2014, 39, 245–252. [Google Scholar]


Disclaimer/Publisher’s Note: The statements, opinions and data contained in all publications are solely those of the individual author(s) and contributor(s) and not of MDPI and/or the editor(s). MDPI and/or the editor(s) disclaim responsibility for any injury to people or property resulting from any ideas, methods, instructions or products referred to in the content. |
© 2024 by the authors. Licensee MDPI, Basel, Switzerland. This article is an open access article distributed under the terms and conditions of the Creative Commons Attribution (CC BY) license (https://creativecommons.org/licenses/by/4.0/).