Article

Smarter and Cleaner? The Carbon Reduction Effect of Smart Cities: A Perspective on Green Technology Progress

School of Labor Economy, Capital University of Economics and Business, Beijing 100071, China
*
Authors to whom correspondence should be addressed.
Sustainability 2024, 16(18), 8048; https://doi.org/10.3390/su16188048
Submission received: 17 July 2024 / Revised: 8 September 2024 / Accepted: 12 September 2024 / Published: 14 September 2024

Abstract

:
In the context of the global climate change problem intensifying due to a dramatic increase in carbon emissions, smart cities, as a topical application of digitalization and intelligence, have become a new urban governance mode for countries, which helps to achieve sustainable development. This research studies the relationship between smart city construction (SCC) and carbon dioxide emissions based on the differences-in-differences model (DID) and propensity score matching (PSM) to promote China to achieve dual carbon goals and high-quality development. The findings are as follows: (a) SCC could promote carbon emission reduction by reducing urban carbon dioxide emissions by an average of 11.4%, which also has significant long-term dynamic effects. Specifically, SCC has more obvious emission reduction effects on activities, such as industrial production and waste treatment. (b) Mechanism verification shows that green technology progress is a significant booster for the carbon reduction effect in SCC. The pilot project can increase output of green patents, which helps transfer production mode and consumption patterns in an environmentally friendly manner. SCC could increase the total factor productivity (TFP) through the rational allocation and efficient use of resources, and thus reducing carbon emissions. (c) Research on city heterogeneity shows that a high level of human capital, material, and financial resources can provide support for smart cities to better achieve the carbon reduction effect. Among them, material resources have the best carbon reduction effect in the process of SCC, which could reduce carbon dioxide emissions by about 6.6–17.7%. This study is useful for policymakers to continuously and dynamically adjust urban development strategies in the future, to achieve a balance between socioeconomic prosperity and environmental sustainability.

1. Introduction

Massive emissions of greenhouse gases (GHGs), especially carbon dioxide, contribute to increased global warming, which forces people to be exposed to risks, such as resource shortages, frequent extreme weather, and rising sea levels [1]. The International Energy Agency reported that global carbon emissions exceeded 36 billion tons in 2021, achieving a record high [2]. Therefore, more and more scholars have focused on how to solve the problem of GHGs, especially carbon emissions. For instance, Acemoglu et al. and Lee et al. believe technological innovation, especially green technology innovation, plays an important role in carbon emission reduction [3,4]. Zhao et al. developed a multi-dimensional carbon emission policy framework to explore the role of national policies for low-carbon development [5]. He et al. argued that green finance could promote both carbon emission reduction and pollution reduction [6]. The increasing demand for resources and energy in the stage of rapid urbanization and industrialization puts China under great pressure of carbon emissions, which leads to a dilemma of balancing economic development with environmental protection [7,8]. Therefore, the traditional and extensive mode of development has forced China to explore new urban government and development strategies to control GHG emissions in the interests of both China and the world [9]. Among them, smart cities, in which current digitalization and intelligence are typically being applied using information technology, can not only increase the proportion of innovation factors in the mix of production factors and promote the rational allocation and efficient flow of resources but can also combat climate change through enterprise technology and equipment innovation, which helps in environmental governance and helps to achieve sustainable development of cities [10,11,12].
At present, this new social development mode aiming to improve residents’ quality of life has become a concrete practice and application of “Smart Earth” at the urban level. From the practice of countries around the world, with the wide application of information technology, smart city construction (SCC) as a governance mode of new cities has demonstrated a good effect in many aspects, such as reducing pollution, improving urban operation efficiency, and maintaining public safety [13]. Since the start of SCC in China, the number of pilot projects has continued to increase, and the development model has become increasingly diversified. Smart cities relying on cloud computing, the internet, and digital technologies will drive a new round of industrial transformation, bringing new opportunities for economic structural optimization and upgrading. It is evident that SCC has become a new driver of the modernization of urban governance, but some shortcomings are unavoidable. Some scholars criticize that smart cities are an empty and ambiguous concept, which remains at the discursive and imaginary level [14,15,16]. And some regions are still on the traditional path of urbanization development due to insufficient investment in information and digital construction, which gives the smart cities a false urban label. Hollands also criticizes and questions the idea that some cities currently use the concept of smart cities for self-promotion purposes by using complex information infrastructure, without truly considering the essence of “smart” [17]. Therefore, many scholars have carried out research on the social, economic, and environmental effects brought by SCC. For example, Giffinger et al. proposed a ranking model to assess smart city development in Europe, concluding that being a smart city significantly impacts urban competitiveness and the people’s quality of life [18]. Zhang et al. demonstrated that smart city development positively influences economic growth in China, highlighting the economic benefits brought by smart cities [19]. Yu et al. conducted a moderated mediation analysis and found that smart city technologies contribute to urban sustainability [20]. Chu et al. examined the impact of smart cities on ecological and environmental quality and found that the degree of urban intelligence can effectively reduce exhaust emissions [21]. In the context of climate change, some scholars have also begun to explore the positive effect of smart cities on carbon emission reduction. For instance, Zawieska et al. confirmed that smart city solutions have a positive impact on reducing transport emissions and achieving emission reduction targets; however, the realization path of transportation decarbonization was not considered [22]. Wu explored the effect of smart city policies on household daily consumption and carbon emissions in China based on the differences-in-differences model (DID), but the reliance of the approach regarding the assumption of parallel trends may lead to estimation errors, especially when pre-existing differences are present between the treated and control groups, which are not captured by the model [23]. Wu et al. combined DID with PSM to examine the effect of smart city policies on carbon TFP, which can enhance the precision of causal inference and reduce the endogeneity problem, the differential impact of pilot policies on carbon emissions of different activities was not well identified [24].
Although the academic circle has conducted multi-angle analysis and discussion on the research in the field of smart city and carbon emission, there are still limitations, which are as follows: First, the existing research rarely considers the time lag and long-term effect of the emission reduction effect brought by smart city construction. Second, as an effective means to solve environmental problems, few research analyzes the positive role of green technology progress between smart cities influencing carbon emissions in the same framework. Third, the existing research focuses more on the total amount of carbon emissions and less on the differential impact of carbon emissions in different fields.
Therefore, based on the differences-in-differences model and propensity score matching (PSM-DID), this research studies the relationship between SCC and carbon dioxide emission using the data cities in China. (1) While examining the current impact of SCC on carbon emissions, the lagged effect and the dynamic effect of this policy are also a point of focus, which has good significance with regards to policies and practicality for further promoting the development of emerging cities. (2) Green technology progress is regarded as an intermediary factor, emphasizing the positive role of total factor production and green innovation patents in the process of smart cities’ carbon reduction effect, which may provide a new perspective that is different from previous studies. (3) It is a unique perspective to discuss different fields of carbon emissions and conduct heterogeneity analysis around human capital, infrastructure, and financial development, which provides a more detailed experience for targeted policy intervention. The results are in favor of the continuous and dynamic adjustment of urban governance and development policy. In addition, the results provide enlightenment for other areas to achieve win-win socioeconomic development and environmental protection through intelligent and digital development modes.
The research has the following structure: the materials and methods are in Section 2; the results of the empirical test are presented in Section 3; further discussion of the empirical results is presented in the Section 4 (including the mediation effect and heterogeneity analysis); and we provide the conclusion and policy recommendations in Section 5. This research aims to investigate methods for reducing carbon emissions in the process of SCC to offer an experience for other regions aiming to transform urban governance models and achieve sustainable development.

2. Materials and Methods

2.1. The Problem Statement

IBM first proposed the strategy of “Smart Earth” in 2008 to deal with global challenges, such as energy crisis, environmental pollution and economic fluctuations, which can help build healthier, green, and sustainable cities. With the arrival of the wave of new scientific and technological revolutions, many countries and regions are actively carrying out the SCC around the world. Under the background of digitalization and informatization, SCC is gradually becoming an important path to promote the competitiveness and sustainable development of the region. For example, the EU launched the “living lab” organization to promote the development of smart city networks with the aim of improving the living quality of residents through information technology and mobile application services. South Korea attempted to build eco-smart cities through the “u-Korea” strategy by integrating public platforms based on the Internet. Singapore implemented the ‘Smart Nation 2025’ initiative, utilizing cutting-edge information technology to create a globally leading digital city. At the same time, Tokyo, Taipei, New York, and other cities have also formulated and implemented relevant strategies and programs, all of which have achieved satisfactory results and progress. With the rise of the global SCC wave, the mode of urban development generally changes along the path of informatization, digitalization and intelligence in China. In 2012, China promulgated relevant documents that integrated advanced concepts, such as wisdom, ecology, and intensive into urban governance and launched the first batch of national pilot smart cities to standardize the construction of smart cities, which involved 90 cities (districts and towns). Subsequently, different numbers of smart city pilot projects were launched in 2013 and 2014, reaching a total of 290, which indicates that the SCC would become an important force to promote all-round development in China (as shown in Figure 1).
Figure 2 shows the trend in the carbon dioxide emissions of pilot and non-pilot cities in China. In general, the carbon emissions in the two types of cities show a continuous growth trend, which is a major challenge for China to achieve dual carbon goals. However, the carbon emission level of pilot cities is lower than that of non-pilot cities. In the past, the trends in carbon emission levels in the two types of cities were similar, but with the implementation of SCC, the growth rate of carbon emissions in the pilot cities decreased.
However, as a top-down approach to environmental regulation led by the national government, the degree of influence and mechanism of SCC on carbon emission and environmental protection in China are still vague, which is worthy of in-depth research. Meanwhile, due to China’s unique development situation, the phenomenon of massive consumption and waste of resources is quite serious, which leads to the discrepancy between the understanding and practical focus of SCC compared to other countries. Therefore, exploring the causal relationship between SCC and carbon dioxide emissions is essential for constructing ideas and suggestions for new urban development models under scenarios with different characteristics.

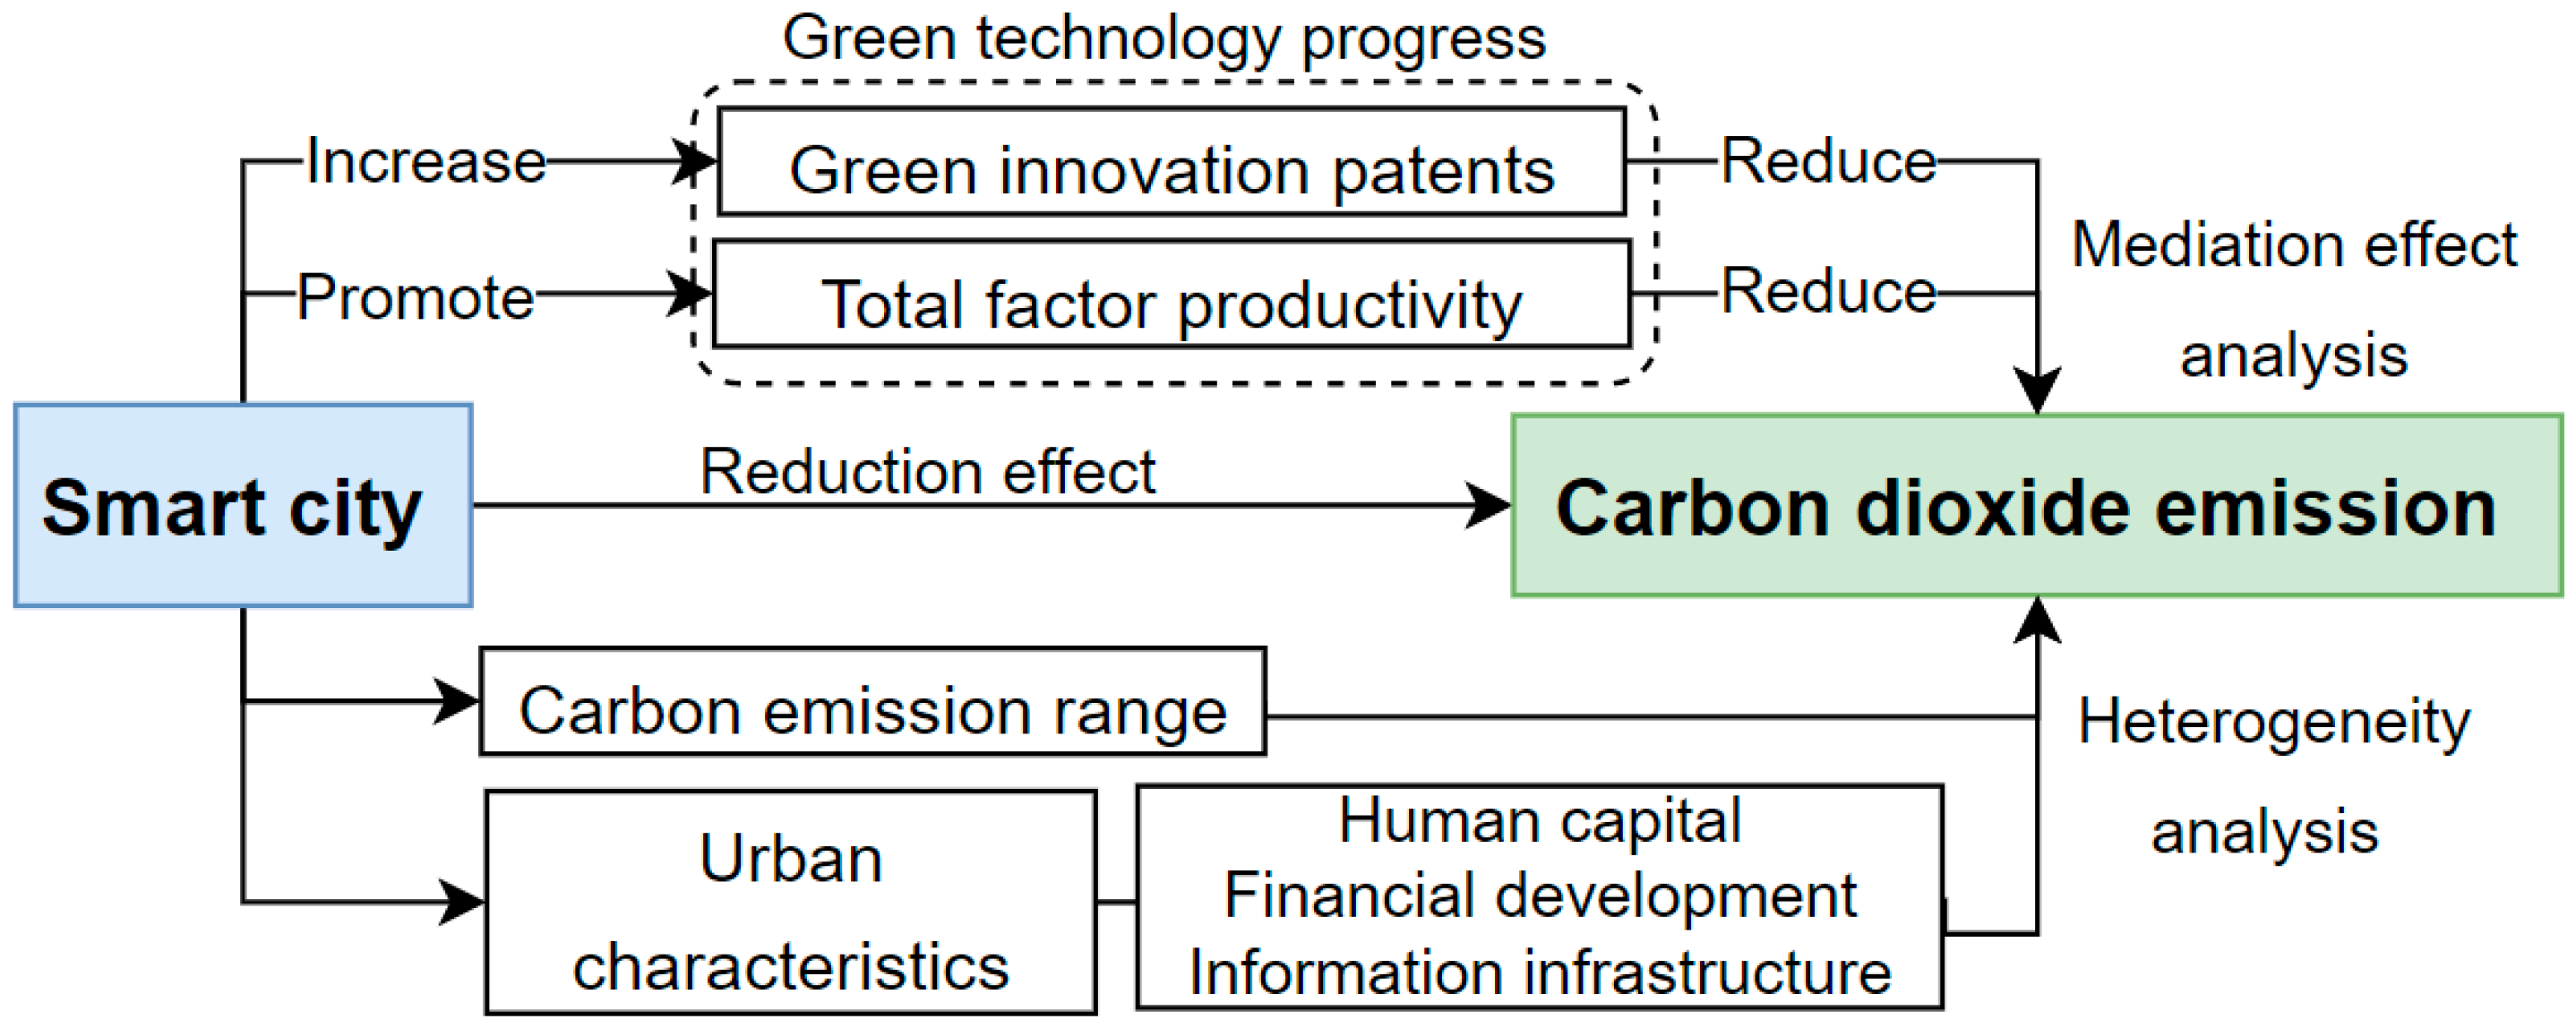
2.2. Research Framework and Mechanism Analysis

Since China began to implement the SCC project, the number of pilot cities has been increasing, and the development model has gradually diversified, which shows an overall trend of steady development. SCC will promote a new round of changes, which could bring new opportunities in the process of optimizing and upgrading industrial structure and improving environmental quality.
The research framework is shown in Figure 3: (1) A comprehensive framework of the causal relationship between SCC and carbon emissions based on the DID model combined with propensity score matching (PSM) is constructed to explore the carbon reduction effect brought by SCC in China. (2) Take green technology progress (including total factor productive and green innovation patents) as intermediary variables to explore the influence mechanism of SCC on carbon emission reduction levels. (3) The carbon reduction effect of SCC is discussed from different emission fields. Heterogeneity analysis is carried out from the different development levels of human capital, financial resources, and information infrastructure of cities.
By sorting out and summarizing relevant literature and official documents, this research analyzes the positive role of green technology progress in the process of SCC to play a carbon reduction effect including promoting total factor productivity (TFP) and increasing green innovation patents.

2.2.1. Total Factor Productivity (TFP)

As a typical application of digitalization and intelligence, smart cities promote the concentration of factor resources (e.g., labor, capital, and information) in more productive and innovative fields, which provides an impetus for efficient allocation and collaborative development among industries. The process of integration of digital technology and traditional industries can optimize the mode of resource allocation and gradually promote the withdrawal of high-pollution enterprises or industries from the market. On the other hand, it also helps to guide resources to gradually flow to emerging industries and explore new markets, which could come close to market demand with new organizational methods and business models and improve resource utilization efficiency. The demonstrative role and guiding effect of emerging industries can encourage traditional enterprises to promote the development of production and organization modes along the path of high-tech and low pollution, which could help to reduce the scale of carbon dioxide emissions. Thus, this research put forward Hypothesis 1 and Hypothesis 2 as follows:
H1: 
The construction of a smart city promotes carbon emission reduction in the district.
H2: 
The construction of a smart city could indirectly reduce the scale of carbon emissions by promoting TFP.

2.2.2. Green Innovation Patents

The new economic development of smart cities provides innovation space and policy support, which will accelerate the research and development and promotion of enterprises in emission reduction and environmental protection technologies. Furthermore, automatic management of equipment improves the efficiency of pollution supervision of environmental protection departments. The application of the green production technology provided by environmental protection products and technological innovation to the production system can essentially improve efficiency of resources and reduce resource consumption, which help to control the scale of carbon dioxide emissions from the source. Meanwhile, technological innovation would encourage market players to develop and utilize varieties that clean resources, to replace polluting energy, especially polluting industries and enterprises. Mainly by effectively improving energy utilization rates and changing energy use structures, SCC can give full play to the carbon reduction effect. Thus, this research puts forward Hypothesis 3 as follows:
H3: 
Smart city construction could increase green innovation patents to facilitate carbon emission reduction through technological effects.

2.3. Model Setting

We regard the implementation of SCC as a quasi-natural experiment to evaluate the impact of SCC on carbon emission reduction using the DID method. The cities included in the smart city list constitute the treated group, which is denoted by treat = 1. The rest of the cities not included in the list constitute the control group, which is represented by treat = 0. Furthermore, when period = 0, it means that the smart city pilot has not been set up in that year; when the period = 1, it refers to the time after the smart city pilot has been established. The model is established as follows:
Y i t = β 0 + β 1 D I D i t + α X i t + ε i t + γ t + μ i
where Y i t is the dependent variable, represented by carbon dioxide emission; i represents the i city; and t denotes the t year. D I D i t is the cross term between period and treat, and X i t represents various control variables, including the development level of regional industry, agglomeration of economies, population size, foreign direct investment, investment in fixed assets, government scale, and level of internet. ε i t represents the disturbance term. γ t denotes the time-fixed effect, and μ i denotes the city-fixed effect.

2.4. Data Source

The data come from the China Urban Statistical Yearbook. When analyzing the data samples, the following processing was performed: (1) If the pilot project was implemented in the county of a city, we excluded the data of the city to ensure that the results were closer to the truth. (2) Cities with serious data loss, such as Tibet, were excluded. This research ultimately obtained the balanced panel data of 215 cities from 2005 to 2020.

2.5. Variable Selection

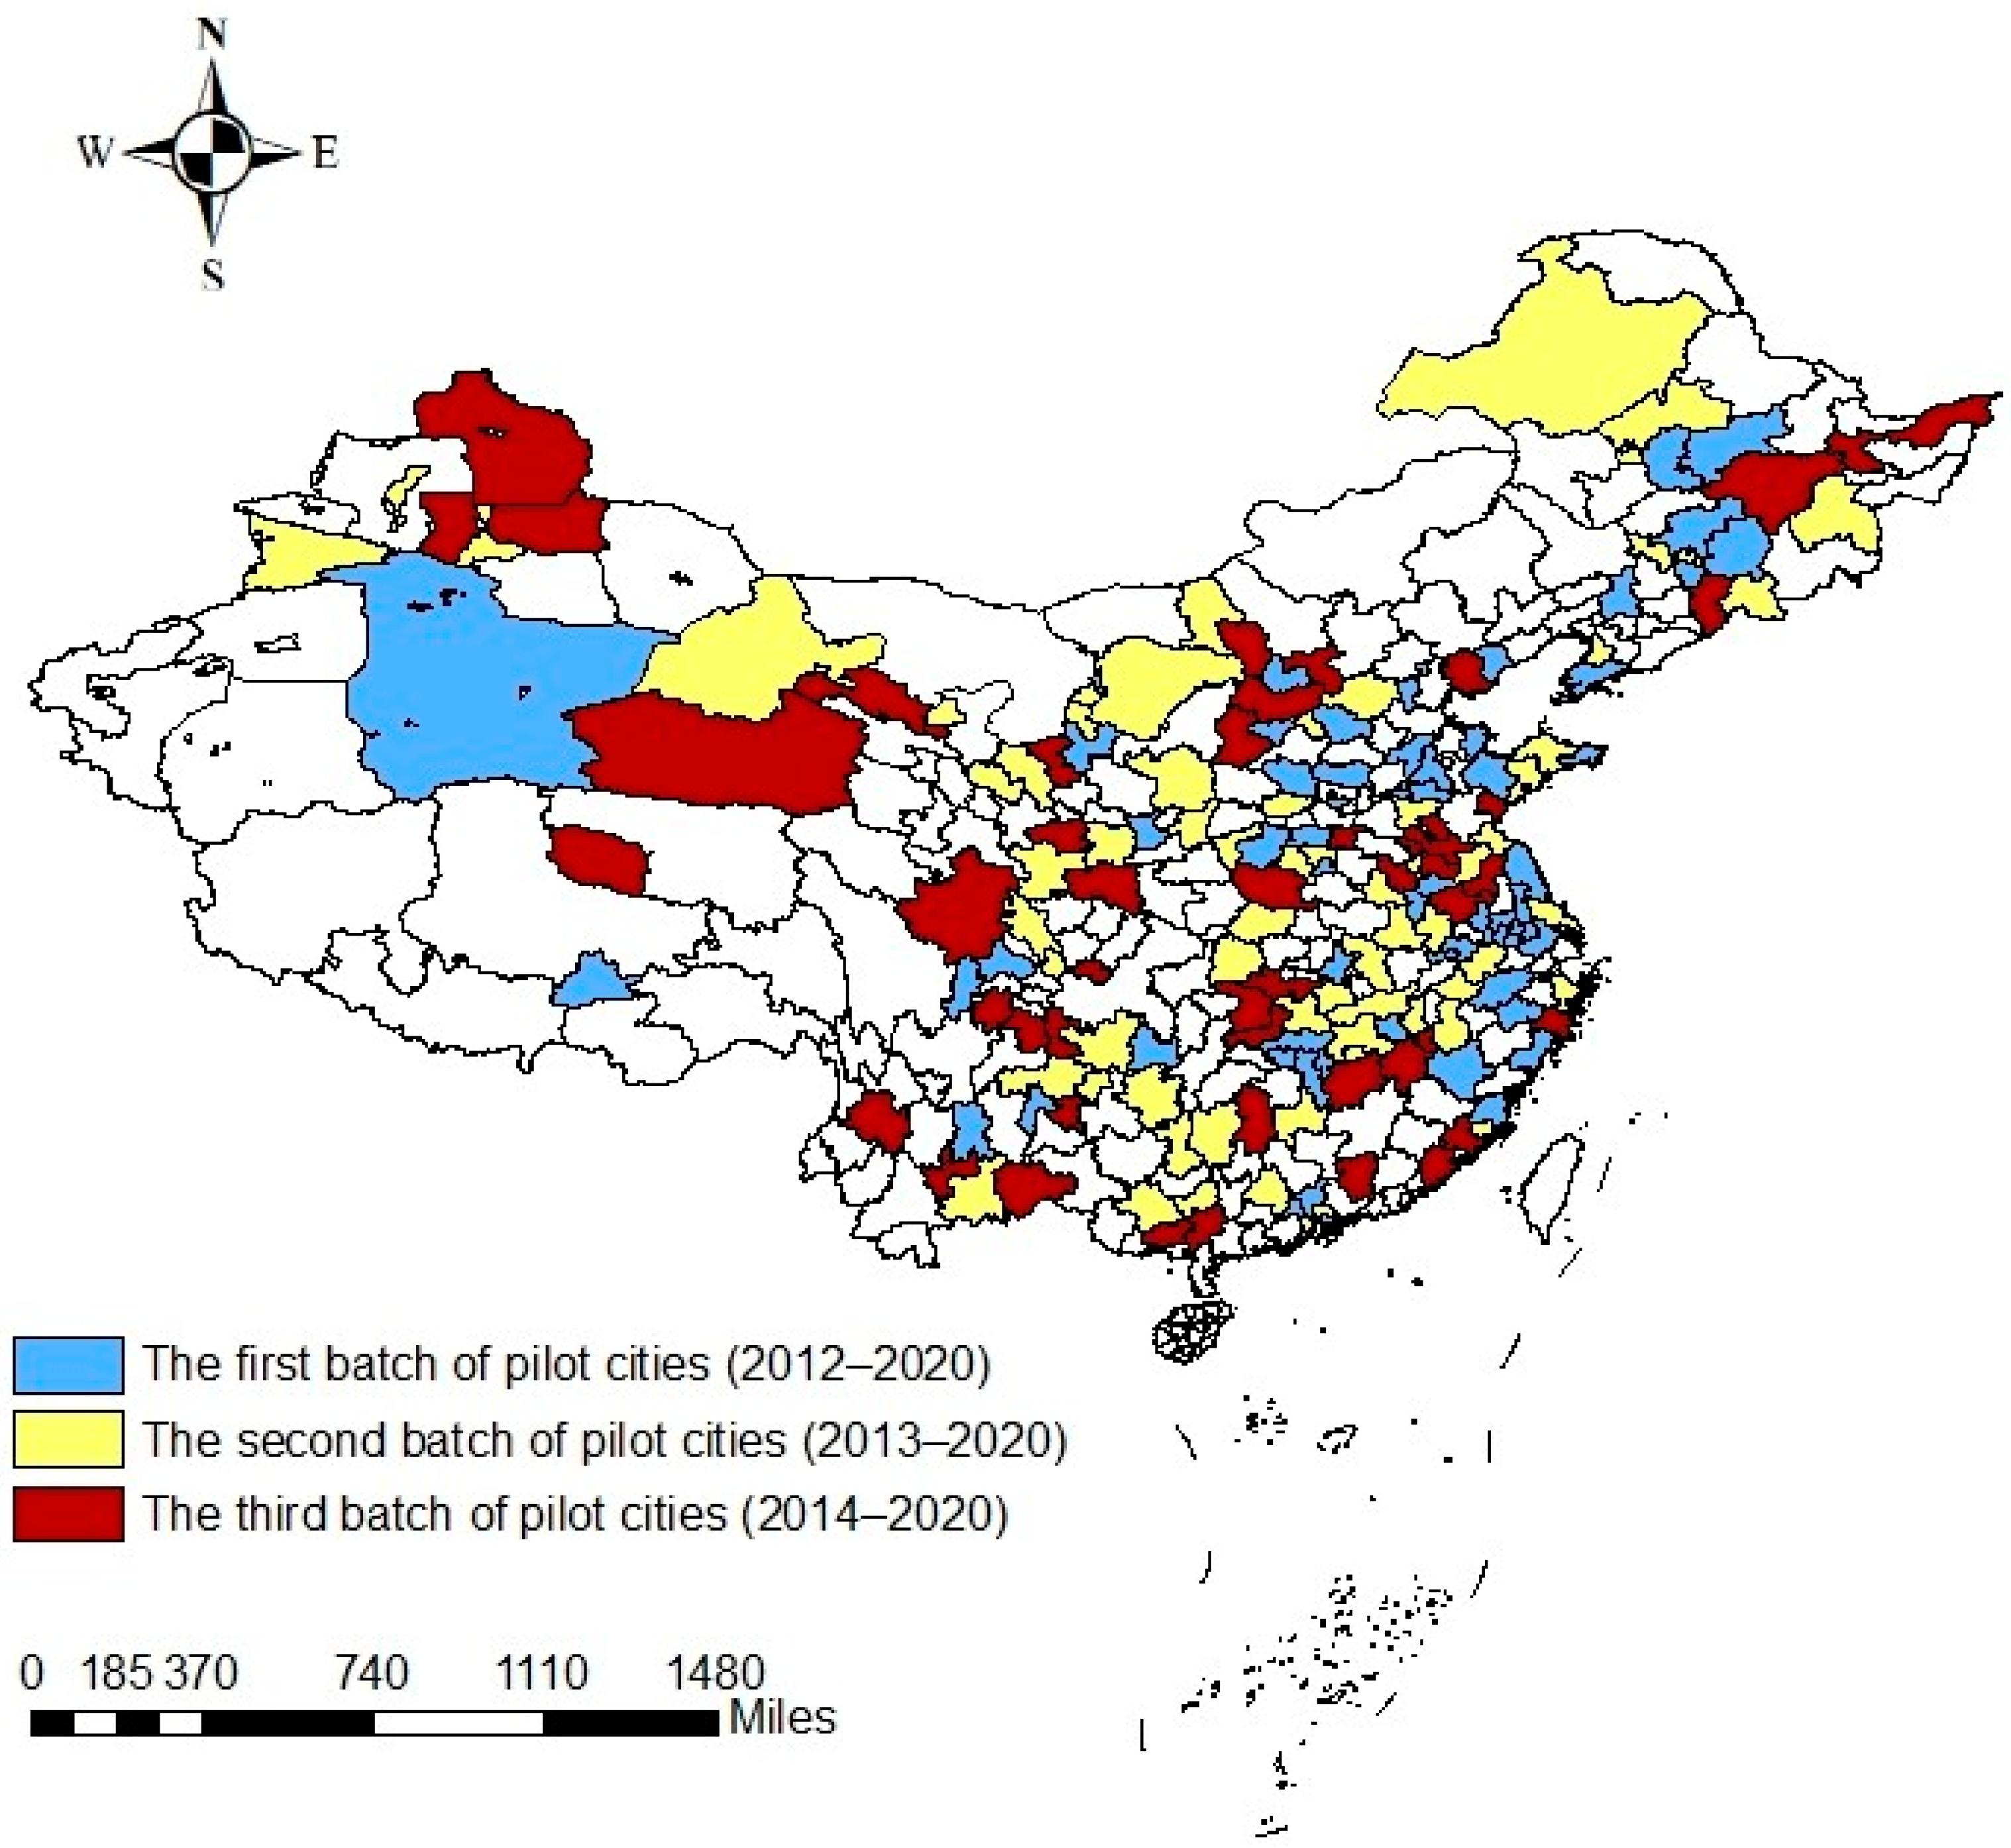
2.5.1. Independent Variable

Referring to previous literature, we used carbon dioxide emissions to measure the carbon emission level (CO2) [25,26].

2.5.2. Dependent Variable

Smart city construction (SCC) utilizes dummy variables, which are set according to the list of smart city construction, wherein this research assigns values to cities.

2.5.3. Control Variables

A number of control variables were selected in this research to reduce estimation errors [27,28,29]. The development level of the secondary industry (Sec) can be expressed by the ratio of the secondary industry output value to GDP, and agglomeration of economies (Ae) is measured by the location entropy of secondary and tertiary industries. The calculation method is as follows: (the number of employees in the secondary and tertiary industries/the total number of employees in the city)/(the number of employees in the secondary and tertiary industries/the total number of employees in the province); government size (Govs) is denoted by the ratio of government budget expenditure to GDP; population size (Pop) can be measured by the total population; the foreign direct investment (Fdi) is expressed by the ratio of FDI to real GDP, where the actual amount of FDI utilized (US $10,000) is converted by the exchange rate of RMB to US $ each year; and the investment scale (Inv) can be expressed by the ratio of the fixed investments to area under construction.
Descriptive statistics are presented in Table 1. The mean and P50 of unit carbon emissions in the treated group are both lower than those in the control group, which can indicate the role of SCC in carbon emission reduction. However, the credibility and magnitude of specific effects need to be further tested by more systematic empirical analysis.

3. Results

3.1. Preliminary Test of the Effect of SCC on Carbon Dioxide Emission

Table 2 displays the differentially estimated results of SCC and carbon dioxide emission. The coefficient remains significantly negative even after gradually adding control variables and time- and city-fixed effects. The results indicate that SCC can reduce the degree of carbon dioxide emissions regardless of whether other variables are controlled or not, which is consistent with the proposed Hypothesis 1, demonstrating that SCC does have a significant emission reduction effect.

3.2. Test Based on the PSM-DID Method

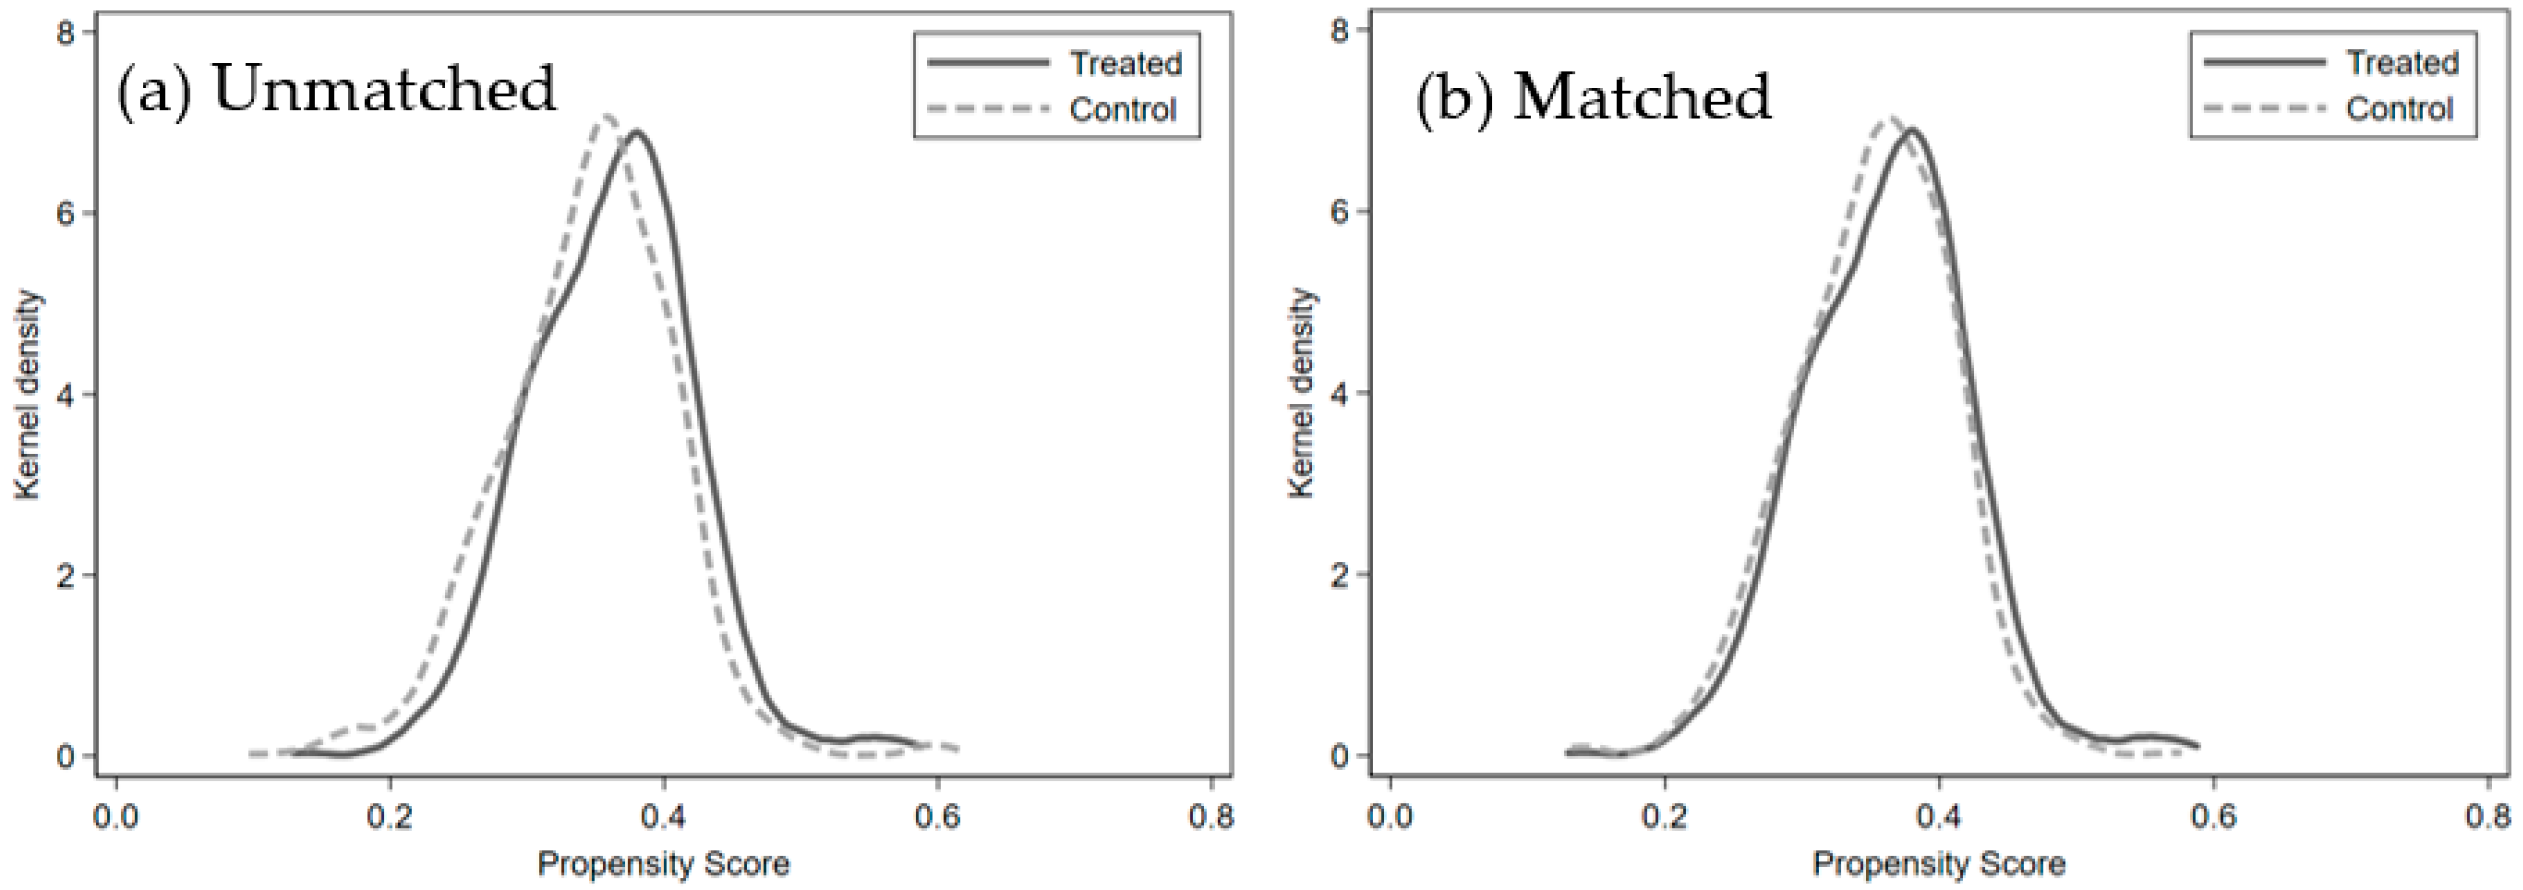
3.2.1. Balance Test and Co-Support Test

The PSM-DID method enhances the precision of causal inference by ensuring pre-intervention baseline comparability and controlling for time trends with DID, which could further reduce the interference of endogenous problems. Before estimating the PSM-DID, a balance test is needed to verify whether each control variable is balanced after matching. If the difference is not significant, the preconditions of the PSM-DID method are satisfied, which indicates the matching estimates are reliable. In this research, dummy variables are set according to whether a city has been established as a smart city, and the relevant control variables are estimated by Logit regression. The radius, kernel, and nearest neighbor matching methods were used to determine the weights, and the treated and control groups were matched according to the generated propensity score values. Table 3 shows the balance test results for kernel matching, revealing that no significant mean difference exists in any of the variables after matching. It can be seen from the standardization difference test that the standardization difference after matching is reduced when compared with that before matching, which indicates quality of matching is better.
At the same time, this research draws the probability distribution density function diagram of propensity score (Figure 4) to conduct the co-support test to ensure that the matched samples have better comparability and to increase the effectiveness of the estimation results. In the kernel density function graph before matching (as shown in Figure 4a), the common support area was small, indicating that the probability distribution between the two groups was significantly different. In the graph after matching, the distribution of the two groups of samples is larger than the coincidence area before matching, which indicates that the matching effect is good and two groups can be compared with each other. Thus, the method of using PSM-DID in this research is reasonable and feasible.

3.2.2. Test Results Based on PSM-DID

After ensuring that matched samples could meet the conditional independent distribution and co-supporting hypothesis relatively well, this research used PSM-DID to estimate the effect of SCC on carbon emission. Table 4 shows the results for various matching (including radius, kernel, and nearest neighbor) methods, which show that regardless of the matching method used, SCC promotes carbon emission reduction after matching. Robustness tests of PSM-DID align with previous differential estimation results, demonstrating the relative robustness and reliability of estimates.

3.3. Robustness Test

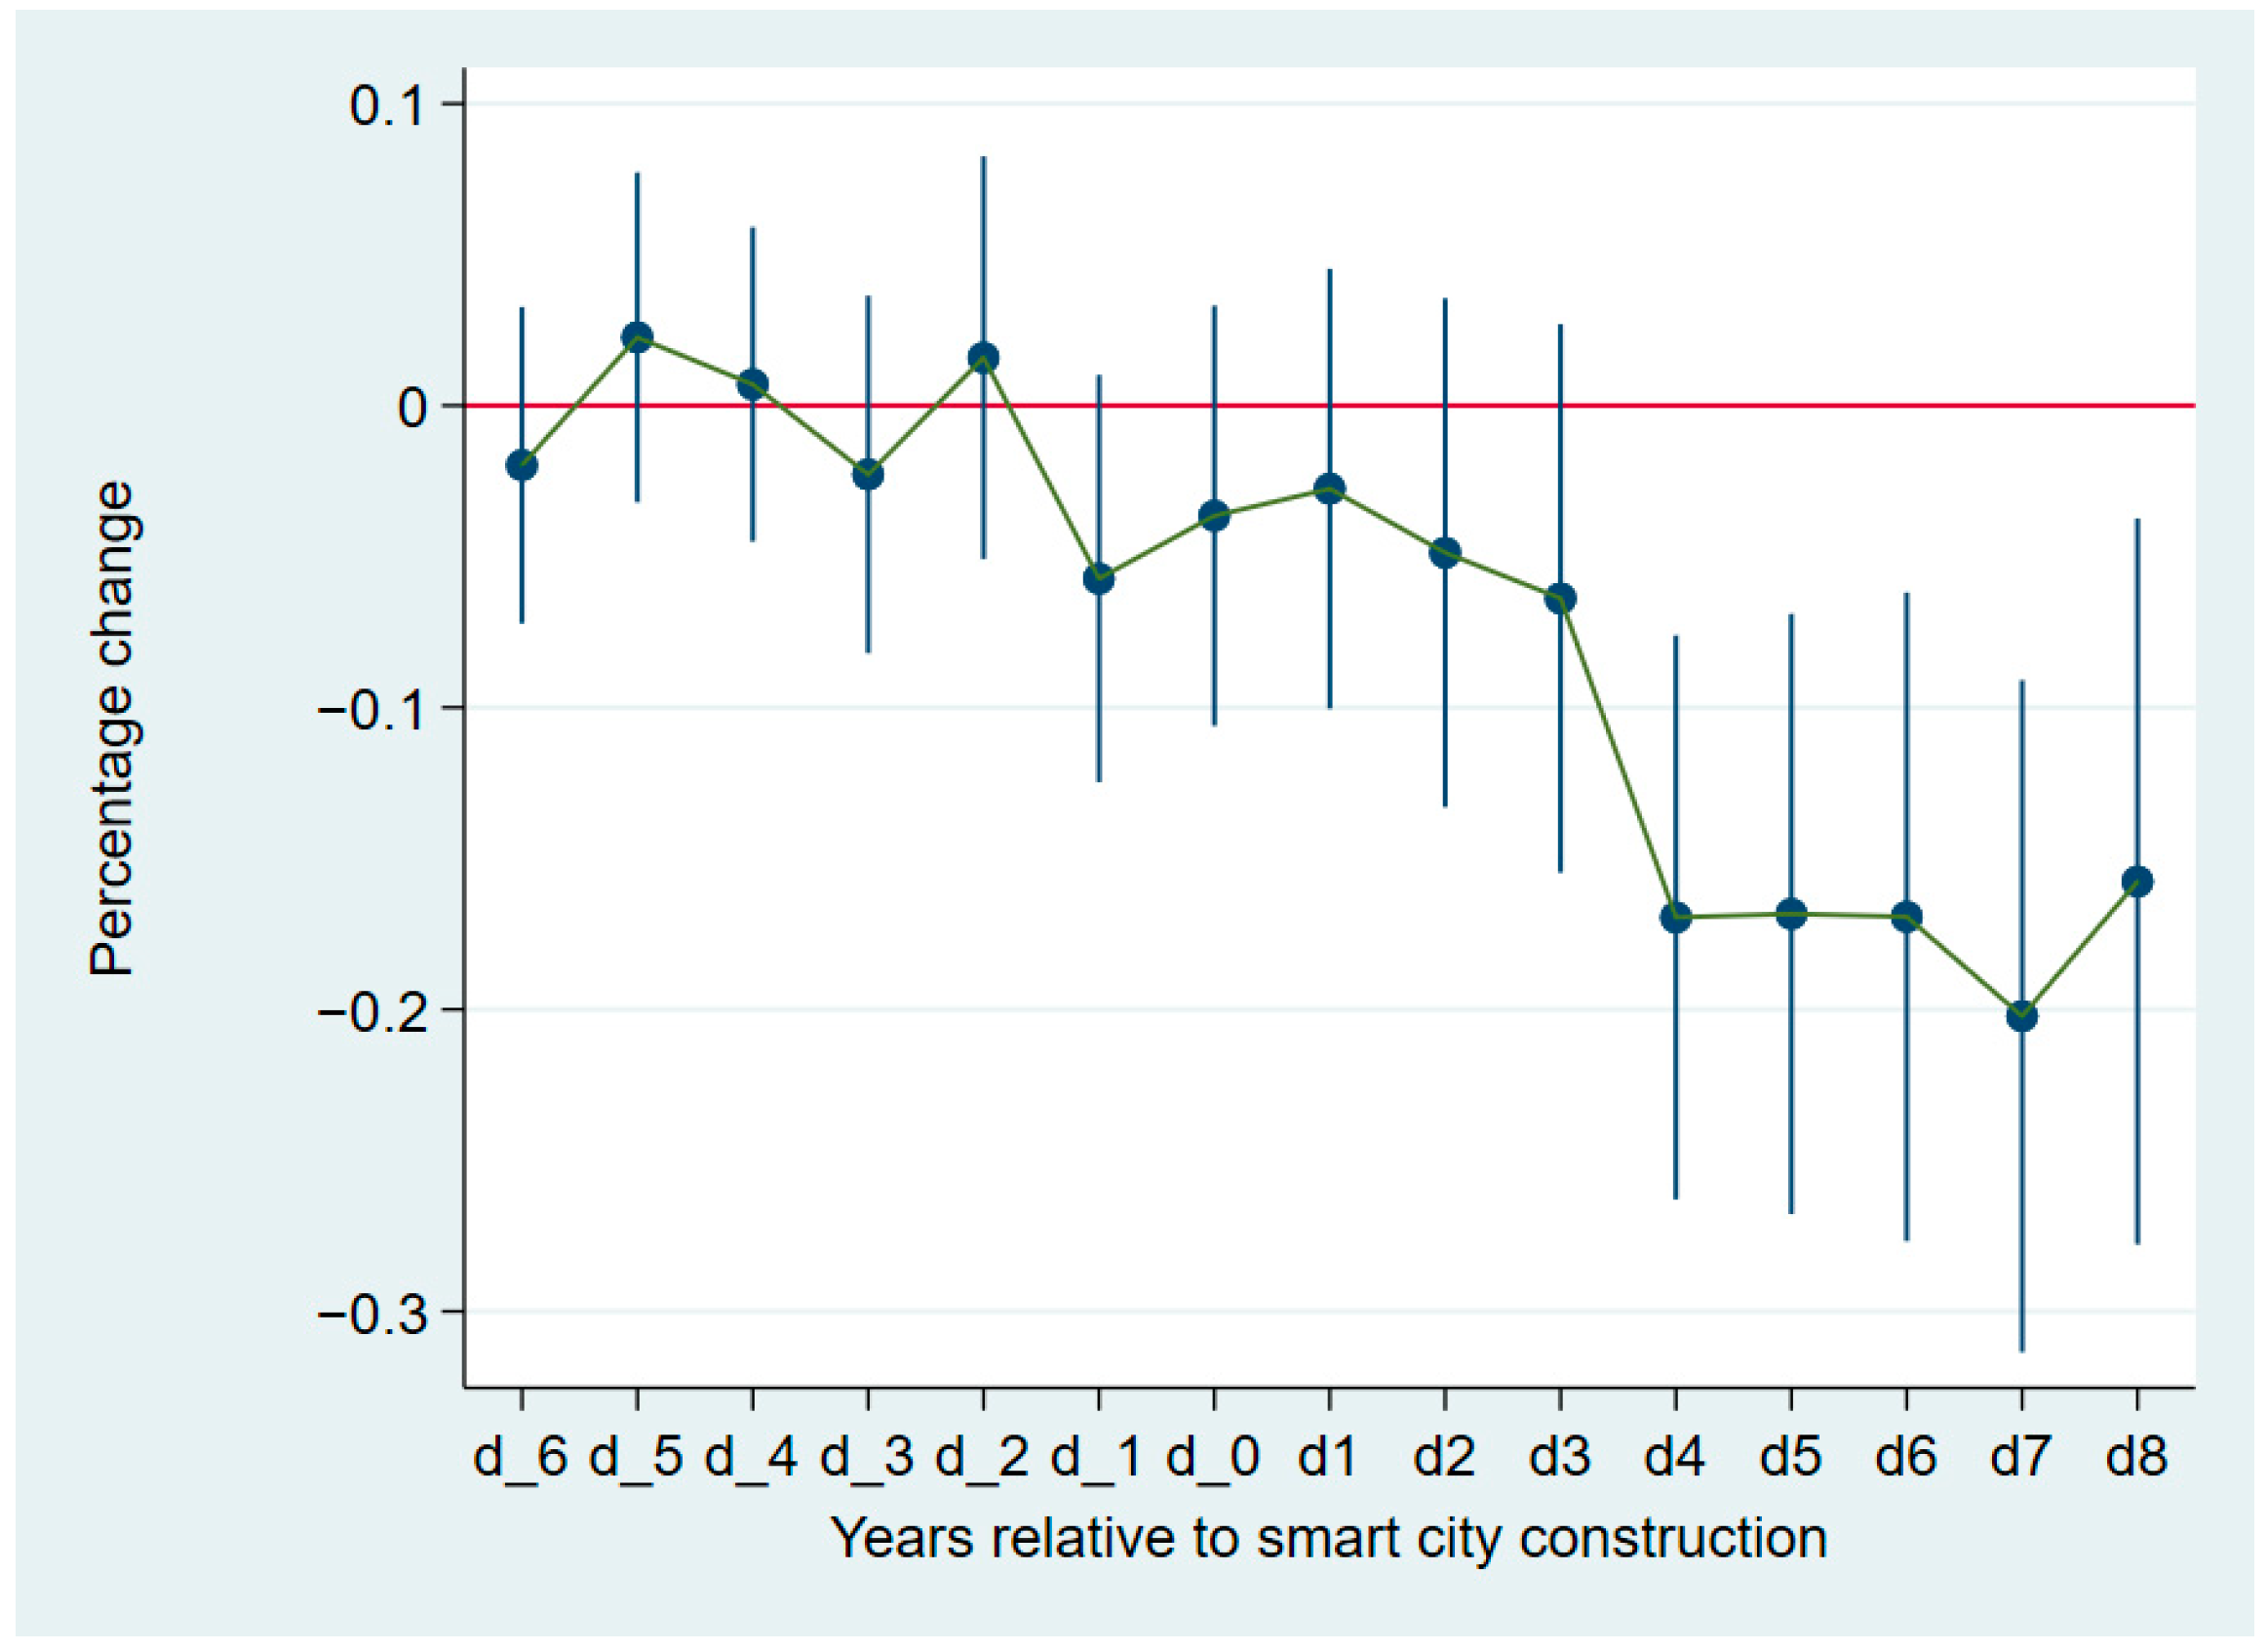
3.3.1. Dynamic Results of Equilibrium Trend Test
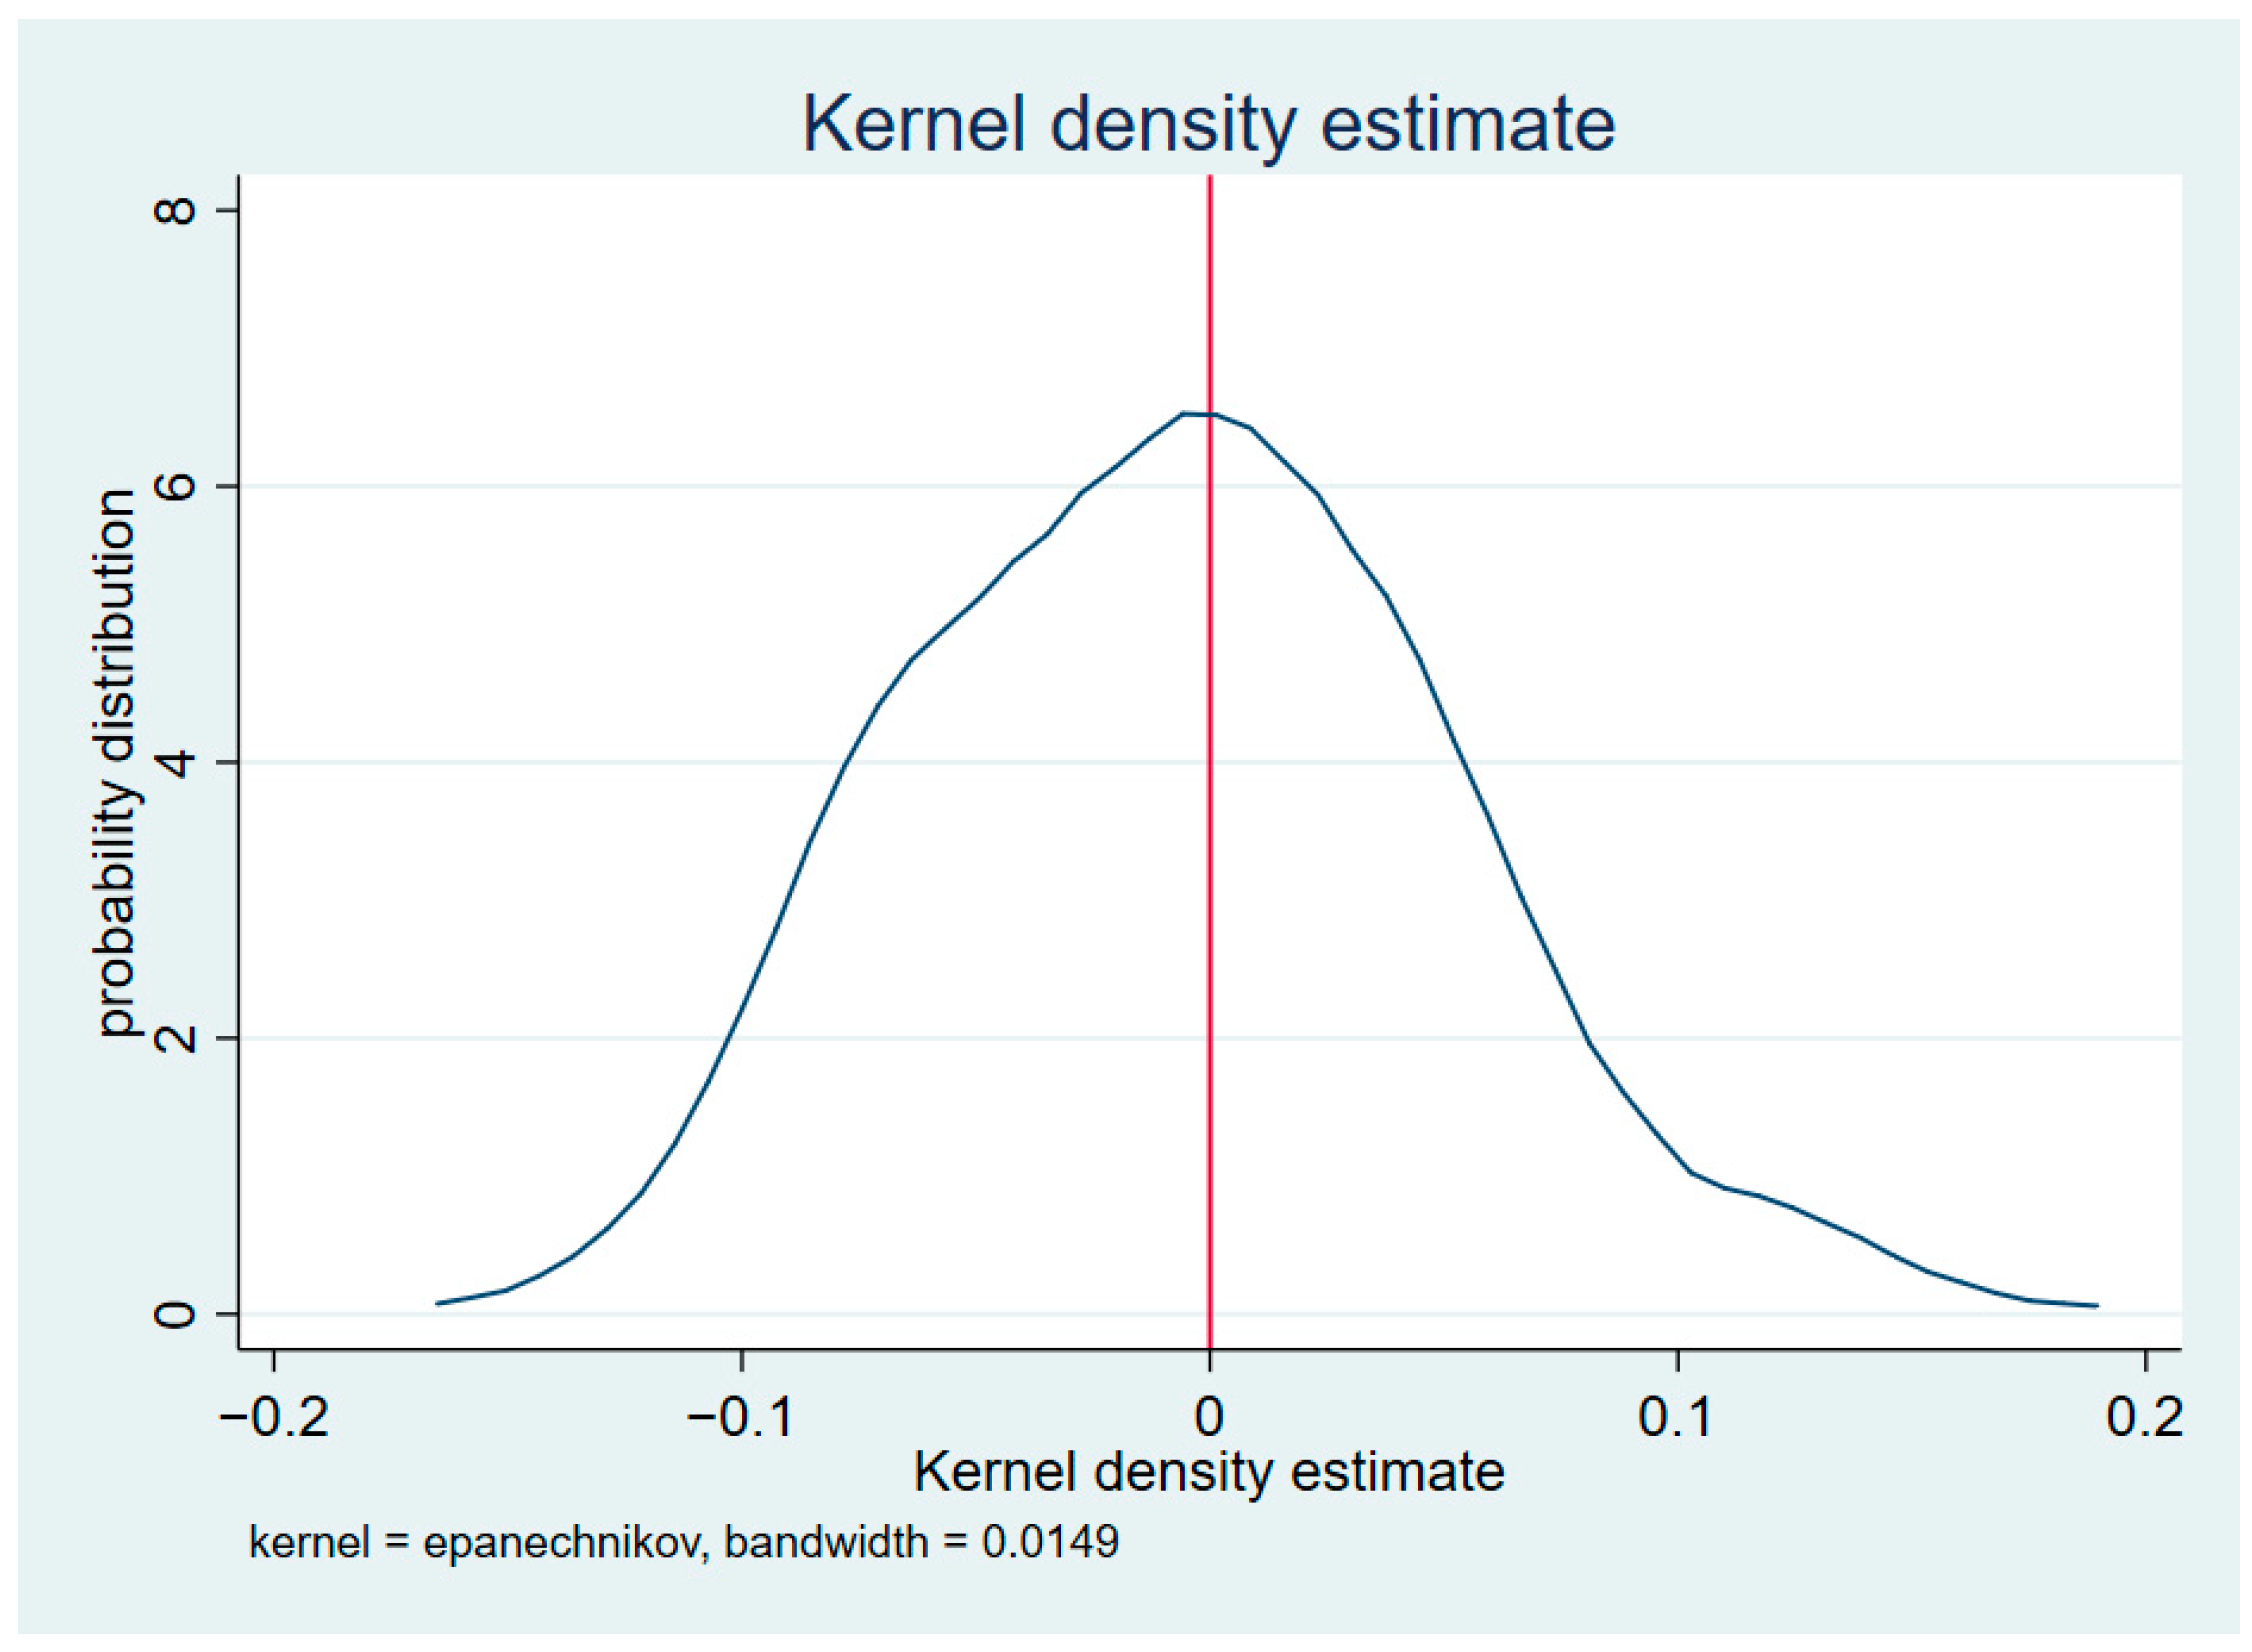
This research tests the presence of a parallel trend between the two groups before construction and studies the dynamic effect of the SCC (Figure 5). The estimated value before SCC was not significant, while the coefficient passed the significance test in the fourth year of implementation of the pilot project. The estimated results validate the parallel trend testing hypothesis and suggest a continuity effect of SCC. However, there is a lag in the implementation effect of the pilot policy, which indicates that SCC does not cause an immediate reduction in the total carbon emissions but instead gradually shows the effect in the following years.

3.3.2. Placebo Test

The research conducts a placebo test to exclude the effect of the non-observed omitted variables. The test was conducted by randomly selecting 91 cities from the sample as the treated group and then repeating the random selection process 1,000 times, enhancing the identification ability of the test. Figure 6 indicates that the randomly selected estimates are concentrated around zero, which proves that no other random factor interferes with the basic conclusion of this research.

3.3.3. Other Robustness Tests

Considering that the matching common support hypothesis may be affected by the tail of the propensity score distribution, this research uses a pruning strategy to verify that the estimated results are not dependent on the extreme samples that are distributed in the tail of the treated group. If the results obtained after construction are still essentially consistent with the results before construction, it shows that the results do not depend on the tail of the distribution, which can explain the reliability of the results. Thus, we attempt to remove 2%, 5%, and 10% samples from the tail of the distribution in the treated group (as shown in column (1) of Table 5). The average treatment effect obtained by different pruning levels has little difference from the estimated results above. Based on the robustness test above, the research further adopts the counterfactual method to test. The result in column (2) shows that the coefficients are not significant by artificially setting the time point and time window width, indicating that the estimated results in this research are reliable.

4. Discussion

4.1. Mediation Effect Analysis

This section further discusses the influence mechanism of the smart city carbon reduction effect to verify Hypotheses 2 and 3. Green technological progress has a positive effect on the process of reducing carbon effect in SCC, including improving TFP and increasing the output of green innovation patents. The following three equations represent the relationship between the variables:
Y i t = c D I D i t + e 1 ,
M i t = a D I D i t + e 2 ,
Y i t = c D I D i t + b M i t + e 3 .
Equation (2) is to examine the net effect of SCC (denoted as D I D i t ) on carbon dioxide emission (denoted as Y i t ). If the coefficient, c, is significant, it indicates that there is a mediation. Equation (3) is to test the effect of D I D i t on the mediating variable (denoted as M i t ). If both coefficients, a and b, are significant, it indicates that there is an indirect effect. Equation (4) is to test the effect of mediating variable M i t on Y i t after controlling the effect of D I D i t and the effect of D I D i t on Y i t after controlling the mediating variable M. If it is significant, it means that there is a direct effect. e 1 , e 2 and e 3 represent the disturbance term.
Table 6 (1) shows the total effect of the first step of the step-up method, and the coefficient significantly indicates that SCC has a significant negative effect on carbon dioxide emission, which indicates the existence of an intermediary effect. Columns (2) and (3) are the second step results of green technology progress, which indicate that SCC will improve the TFP and increase green innovation patents. Column (4) indicates that SCC can reduce the urban carbon dioxide emission problems through the above two mechanisms, which indicates that SCC can effectively enhance the efficiency of resource allocation and encourages market players to innovate and improve key technologies to achieve clean, low carbon and green development.

4.2. Analysis of Heterogeneity

4.2.1. Carbon Emission Range

This section discusses the difference in the impact of SCC on carbon dioxide emissions from various activities (including transportation and buildings, industrial production, agroforestry and land utilization, waste disposal, outsourced electricity, and heating or cooling to meet urban consumption). The coefficients in columns (1)–(4) of Table 7 are significantly negative, indicating that SCC has a more pronounced impact on direct carbon dioxide emissions within urban jurisdictions. SCC can effectively reduce the total carbon emissions from industrial production, waste treatment, transportation, and construction activities.

4.2.2. Urban Characteristics

SCC could create a cleaner environment through green technology progress, which needs support from many aspects, such as labor, capital, and facilities [30,31,32]. Therefore, this section focuses on the levels of human capital, financial, and material resources within the city to conduct heterogeneity analysis on the carbon emission reduction effect of SCC. The research uses the number of college students to represent human support, which is divided into two groups. Financial support can be measured as the ratio of deposits and loans of financial institutions to GDP. Furthermore, support of material resources can be measured by the number of internet broadband access users.
The results indicate that the impact of SCC on reducing carbon emissions is significantly negative in cities with different levels of human capital (as shown in Table 8). However, the carbon reduction effect is more obvious in cities with more adequate human capital, which shows that SCC needs the support of a labor force with a high education level or a highly skilled labor force to fully learn new knowledge and technologies related to low carbon and apply them in practice. At the same time, technological innovation work is easier to carry out in areas where highly skilled laborers are concentrated, which is more conducive to the emergence of clean technology. In terms of financial support, SCC has significantly reduced carbon emissions in cities with different financial development levels. However, the coefficient with better financial development group is larger, which indicates that economic support provided by the financial system can promote smart cities to play a better role in the reduction of carbon. In terms of material support, the effect of SCC on reducing carbon dioxide emissions is significantly negative in cities with varying levels of information infrastructure, which indicates that material resource has a strong supporting effect on the SCC.

5. Conclusions

The implementation of smart city projects is an important strategy to promote the construction of new cities in China, which still has significant potential for improvement. This research utilized the PSM-DID method to explore the effect of SCC on carbon emission reduction, which provides targeted empirical research for further optimizing and improving national smart city development. The conclusions are as follows: (a) SCC significantly promotes carbon emission reduction, resulting in an average reduction of urban carbon dioxide emission by 11.4% on average, which also has significant long-run effects. In particular, the reduction in CO2 emissions from industrial production, waste disposal, and other activities is relatively obvious. (b) Mechanism verification shows that SCC acts as a booster for carbon emission reduction mainly through green technology progress. The pilot project increased green technological innovation and improved TFP to promote the transformation of production and consumption modes to those that are environmentally friendly, which could reduce carbon emissions. (c) Studies on the heterogeneity of cities show that cities with a concentration of human (human capital), material (information infrastructure), and financial (financial development) resources have a stronger carbon reduction effect of SCC. Moreover, material resources play the greatest role when displaying carbon dioxide-emission-reducing effects. The results are in favor of continuous and dynamic adjustment of smart cities and a sustainable development policy, which could provide experience and enlightenment for other cities and countries to develop smart cities.
Given the role of SCC in promoting carbon emission reduction, some recommendations can be put forward as follows: (1) The experience of SCC could be applied to drive carbon emission reduction in cities and industries with high pollution and resource consumption, which could help constantly achieve new urban development across the country and achieve low-carbon, green, and sustainable modes of production and life. (2) It is important to grasp the correct direction of SCC and strategically plan the overall layout. Based on the experience of SCC, other regions should focus on the supporting role of human capital, financial resources, and information infrastructure construction in the carbon emission reduction of SCC. (3) It is urgent to continuously enhance urban technological innovation and TFP. Furthermore, the integrated development of environmental regulation and industrial structure is necessary, which helps to promote the flow of factors and improve the efficiency of utilization. Moreover, local governments should be encouraged to increase investment in innovation, build an innovation platform, and promote technology to the forefront, which help to achieve the goal of harmonious socioeconomic and environmental development. Although our research is based on pilot policies carried out in China, it provides a comprehensive and flexible framework that can be used to assess the effect of SCC on carbon emissions in other countries or regions. This effect may vary due to the unique economic, technological, and social environment of different countries, but we believe that the heterogeneity analysis of this study can enable other countries or regions to achieve more ideal results by constantly selecting and adjusting the level of human, material, and financial resources, which provides some more targeted suggestions for policy makers to better deal with the relationship between new urban development patterns and environmental protection.

Author Contributions

Conceptualization, X.Z. (Xueting Zeng) and X.Z. (Xinyu Zhang); methodology, X.A.; software, X.A.; validation, X.A. and X.Z. (Xueting Zeng); formal analysis, X.A.; investigation, X.Z. (Xinyu Zhang); resources, X.Z. (Xueting Zeng); data curation, X.A.; writing—original draft preparation, X.A.; writing—review and editing, X.Z. (Xinyu Zhang) and Y.Y.; visualization, X.A. and Y.Y.; supervision, X.Z. (Xueting Zeng); project administration, X.Z. (Xueting Zeng); funding acquisition, X.Z (Xueting Zeng). All authors have read and agreed to the published version of the manuscript.

Funding

This research was funded by the Beijing Social Science Foundation, grant number 23GLB026.

Institutional Review Board Statement

Not applicable.

Informed Consent Statement

Not applicable.

Data Availability Statement

The data that support the findings of this study are available upon request from the corresponding author.

Conflicts of Interest

The authors declare no conflicts of interest.

References

  1. Bai, C.; Du, K.; Yu, Y.; Feng, C. Understanding the Trend of Total Factor Carbon Productivity in the World: Insights from Convergence Analysis. Energy Econ. 2019, 81, 698–708. [Google Scholar] [CrossRef]
  2. Shu, Y.; Deng, N.; Wu, Y.; Bao, S.; Bie, A. Urban Governance and Sustainable Development: The Effect of Smart City on Carbon Emission in China. Technol. Forecast. Soc. Chang. 2023, 193, 122643. [Google Scholar] [CrossRef]
  3. Lee, K.H.; Min, B. Green R&D for Eco-innovation and Its Impact on Carbon Emissions and Firm Performance. J. Clean. Prod. 2015, 108, 534–542. [Google Scholar]
  4. Acemoglu, D.; Aghion, P.; Bursztyn, L.; Hemous, D. The Environment and Directed Technical Change. Am. Econ. Rev. 2012, 102, 131–166. [Google Scholar] [CrossRef] [PubMed]
  5. Zhao, Z.-Y.; Gao, L.; Zuo, J. How National Policies Facilitate Low Carbon City Development: A China Study. J. Clean. Prod. 2019, 234, 743–754. [Google Scholar] [CrossRef]
  6. He, N.; Zeng, S.; Jin, G. Achieving Synergy between Carbon Mitigation and Pollution Reduction: Does Green Finance Matter? J. Environ. Manag. 2023, 342, 118356. [Google Scholar] [CrossRef]
  7. Auffhammer, M.; Sun, W.; Wu, J.; Zheng, S. The Decomposition and Dynamics of Industrial Carbon Dioxide Emissions for 287 Chinese Cities in 1998–2009. J. Econ. Surv. 2016, 30, 460–481. [Google Scholar] [CrossRef]
  8. Shi, K.; Chen, Y.; Li, L.; Huang, C. Spatiotemporal Variations of Urban CO2 Emissions in China: A Multiscale Perspective. Appl. Energy 2018, 211, 218–229. [Google Scholar] [CrossRef]
  9. Yang, G. Can the Low-Carbon City Pilot Policy Promote Firms’ Low-Carbon Innovation: Evidence from China. PLoS ONE 2023, 18, e0277879. [Google Scholar] [CrossRef]
  10. Ferrara, R. The Smart City and the Green Economy in Europe: A Critical Approach. Energies 2015, 8, 4724–4734. [Google Scholar] [CrossRef]
  11. Albino, V.; Berardi, U.; Dangelico, R.M. Smart Cities: Definitions, Dimensions, Performance, and Initiatives. J. Urban Technol. 2015, 22, 3–21. [Google Scholar] [CrossRef]
  12. Ismagilova, E.; Hughes, L.; Dwivedi, Y.K.; Raman, K.R. Smart Cities: Advances in Research—An Information Systems Perspective. Int. J. Inf. Manag. 2019, 47, 88–100. [Google Scholar] [CrossRef]
  13. March, H.; Ribera-Fumaz, R. Smart Contradictions: The Politics of Making Barcelona a Self-Sufficient City. Eur. Urban Reg. Stud. 2016, 23, 816–830. [Google Scholar] [CrossRef]
  14. Pow, C.P.; Neo, H. Seeing Red Over Green: Contesting Urban Sustainabilities in China. Urban Stud. 2013, 50, 2256–2274. [Google Scholar] [CrossRef]
  15. Söderström, O.; Paasche, T.; Klauser, F. Smart Cities as Corporate Storytelling. City: Anal. Urban Trends 2014, 18, 906716. [Google Scholar] [CrossRef]
  16. Vanolo, A. Smartmentality: The Smart City as Disciplinary Strategy. Urban Stud. 2014, 51, 883–898. [Google Scholar] [CrossRef]
  17. Hollands, R.G. Will the Real Smart City Please Stand up?: Intelligent, Progressive or Entrepreneurial? City 2008, 12, 303–320. [Google Scholar] [CrossRef]
  18. Giffinger, R.; Fertner, C.; Kramar, H.; Kalasek, R.; Pichler-Milanovic, N.; Meijers, E. Smart Cities Ranking: An Effective Instrument for the Positioning of the Cities? Cent. Eur. Conf. Inf. Intell. Syst. 2010, 4, 7–26. [Google Scholar] [CrossRef]
  19. Zhang, X.; Zhao, P.; Wang, J. The Impact of Smart City on Economic Growth: Evidence from China. Sustainability 2019, 11, 4986. [Google Scholar]
  20. Yu, H.; Huang, H.; Zhu, X. The Impact of Smart City Initiatives on Urban Sustainability: A Moderating Mediation Analysis. Sustainability 2020, 12, 5207. [Google Scholar]
  21. Chu, Z.; Cheng, M.; Yu, N.N. A smart city is a less polluted city. Technol. Forecast. Soc. Chang. 2021, 172, 121037. [Google Scholar] [CrossRef]
  22. Zawieska, J.; Pieriegud, J. Smart city as a tool for sustainable mobility and transport decarbonisation. Transp. Policy 2018, 63, 39–50. [Google Scholar] [CrossRef]
  23. Wu, S. Smart cities and urban household carbon emissions: A perspective on smart city development policy in China. J. Clean. Prod. 2022, 373, 133877. [Google Scholar] [CrossRef]
  24. Wu, Z.; Wang, X. The impacts of smart city construction on carbon total factor productivity: Empirical evidence from China. Clean Technol. Environ. Policy 2024. [Google Scholar] [CrossRef]
  25. Xie, Q.; Fan, X. Carbon emission reduction effects of green finance reform and innovation pilot zones policy: Evidence from the prefecture-level city in China. Environ. Sci. Pollut. Res. 2023, 30, 102624–102640. [Google Scholar] [CrossRef]
  26. Li, X.; Zhao, C.; Huang, M. Reassessing the effect of low-carbon city policy in China: New evidence from the nighttime light data. Front. Energy Res. 2022, 9, 798448. [Google Scholar] [CrossRef]
  27. Chen, D.; Chen, S.; Jin, H. Industrial Agglomeration and CO2 Emissions: Evidence from 187 Chinese Prefecture-level Cities over 2005–2013. J. Clean. Prod. 2018, 172, 993–1003. [Google Scholar] [CrossRef]
  28. Xu, W.X.; Zhou, J.P.; Liu, C.J. The impact of digital economy on urban carbon emissions: Based on the analysis of spatial effects. Geogr. Res. 2022, 41, 111–129. [Google Scholar]
  29. Li, Z.; Shao, S.; Shi, X.; Sun, Y.P.; Zhang, X.L. Structural transformation of manufacturing, natural resource dependence, and carbon emissions reduction: Evidence of a threshold effect from China. J. Clean. Prod. 2019, 206, 920–927. [Google Scholar] [CrossRef]
  30. Xu, S.; Xiong, Y. Has the smart city construction reduced energy consumption? Evidence from China. Manag. Environ. Qual. 2024. ahead-of-print. [Google Scholar] [CrossRef]
  31. Batty, M.; Axhausen, K.W.; Giannotti, F.; Pozdnoukhov, A.; Bazzani, A.; Wachowicz, M.; Ouzounis, G.; Portugali, Y. Smart Cities of the Future. Eur. Phys. J. Spec. Top. 2012, 214, 481–518. [Google Scholar] [CrossRef]
  32. Francesco, P.A.; Marcos, L.; Sotirios, P. Understanding Smart Cities: Innovation ecosystems, technological advancements, and societal challenges. Technol. Forecast. Soc. Chang. 2019, 142, 1–14. [Google Scholar] [CrossRef]
Figure 1. The effective period of the smart city pilot policy.
Sustainability 16 08048 g001
Figure 2. The carbon emission trends in pilot and non-pilot cities.
Sustainability 16 08048 g002
Figure 3. The framework of the impact of SCC on carbon emission.
Sustainability 16 08048 g003
Figure 4. The propensity score probability distribution density function graph.
Sustainability 16 08048 g004
Figure 5. Parallel trend tests dynamic graph. Note: the vertical line represents the 90% confidence level of each point.
Sustainability 16 08048 g005
Figure 6. The placebo test.
Sustainability 16 08048 g006
Table 1. Descriptive statistics.
GroupVariableNMeanP50SdGroupVariableNMeanP50Sd
Control
Group
CO219842.852.930.93Treated
Group
CO214562.612.630.95
SCC1984000SCC14560.3800.49
Sec198446.564711.07Sec145649.9350.5311.62
Fdi19843.181.25.99Fdi14563.171.674.36
Govs198417.214.2922.32Gov145614.6712.6410.32
Ae198494.01100.0124.65Ae145696.26100.1259.73
Pop19841217.387.4534,742.82Pop1456158.47115.46152.82
Inv19846.036.822.77Inv14566.397.252.90
Table 2. The effect of SCC on carbon dioxide emission.
Variable(1)(2)(3)
Carbon Dioxide Emission
SCC−0.058 *−0.116 ***−0.114 ***
(0.033)(0.033)(0.033)
Sec−0.002 *−0.003 **−0.012 ***
(0.001)(0.001)(0.001)
Fdi−0.003 *−0.003 *−0.002
(0.002)(0.002)(0.001)
Govs0.0010.001 *0.007 **
(0.001)(0.001)(0.003)
Ae−0.000−0.000−0.000 **
(0.000)(0.000)(0.000)
Pop−0.002−0.002−0.187 ***
(0.024)(0.023)(0.066)
Inv−0.000−0.0000.001 ***
(0.000)(0.000)(0.000)
_cons2.240 ***1.923 ***−4.127 ***
(0.353)(0.348)(0.336)
Time-fixed effectsYESNOYES
City-fixed effectsNOYESYES
N344034403440
F163.763 122.597
R2_a0.720 0.787
The symbols *, **, and *** represent a significance level of 10%, 5%, and 1%, respectively.
Table 3. Balance test results.
VariableUnmatchedMeant Test (p Value)%Bias%Reduct
MatchedTreatedControl|Bias|
SecUM50.5947.597.22 (0.00)28.699.3
M50.6150.64−0.05 (0.96)−0.2
FdiUM3.333.41−0.34 (0.73)−1.475.8
M3.333.310.09 (0.93)0.3
GovsUM13.6715.37−4.89 (0.00)−19.084.0
M14.4513.72−1.04 (0.30)−3.0
AeUM951.87924.971.39 (0.17)5.293.2
M932.75934.58 −0.16 (0.87)−0.4
PopUM171.80146.574.09 (0.00)16.198.9
M169.81170.09−0.04 (0.97)−0.2
InvUM6.416.063.03 (0.00)11.994.1
M6.406.380.17 (0.87)0.7
Pseudo R2UM0.033
M0.001
Table 4. The effect of SCC on carbon emission reduction based on PSM-DID.
Variable(1)(2)(3)
Radius MatchingKernel MatchingNearest Neighbor Matching
SCC−0.112 ***−0.166 ***−0.166 ***
(0.034)(0.034)(0.033)
Time-fixed effectsYESYESYES
City-fixed effectsYESYESYES
Control variableYESYESYES
R20.94780.94700.9470
N344034403440
The symbol *** represent a significance level of 1%.
Table 5. The robustness tests of SCC on carbon emission reduction.
Variable(1)(2)
Level of TrimmingCounterfactual Test
2%5%10%
SCC−0.115 ***
(0.034)
−0.118 ***
(0.034)
−0.117 ***
(0.035)
−0.062
(0.148)
−0.0217
(0.024)
Time-fixed effectsYESYESYESYESYES
City-fixed effectsYESYESYESYESYES
Control variableYESYESYESYESYES
N28912803265526781215
The symbol *** represent a significance level of 1%.
Table 6. The intermediate effect result.
Variable(1)(2)(3)(4)
Carbon Dioxide EmissionTFPGreen Innovation PatentsCarbon Dioxide Emission
SCC−0.114 ***0.202 ***0.151 ***−0.109 ***
(0.033)(0.061)(0.043)(0.031)
TFP 0.232 ***
(0.082)
Green innovation patents 0.021 *
(0.012)
Time-fixed effectsYESYESYESYES
City-fixed effectsYESYESYESYES
Control variableYESYESYESYES
N3440344034403440
The symbols *, and *** represent a significance level of 10%, and 1%, respectively.
Table 7. The heterogeneity of the carbon emission range.
Variable(1)(2)(3)(4)(5)(6)
Transportation and ConstructionIndustrial Production ProcessesAgriculture, Forestry, and Land Use ChangeWaste Disposal ActivitiesOutsourced ElectricityHeating or Cooling
SCC−0.178 ***−0.239 **−0.108 *−0.145 *−0.010−0.095
(0.061)(0.105)(0.060)(0.086)(0.063)(0.064)
Time-fixed effectsYESYESYESYESYESYES
City-fixed effectsYESYESYESYESYESYES
Control variableYESYESYESYESYESYES
N344034403440344034403440
The symbols *, **, and *** represent a significance level of 10%, 5%, and 1%, respectively.
Table 8. The heterogeneity of urban cities.
Variable(1)(2)(3)(4)(5)(6)
Low Human CapitalHigh Human CapitalLow Financial DevelopmentHigh Financial DevelopmentLow Information InfrastructureHigh Information Infrastructure
SCC−0.072 **−0.168 ***−0.066 * −0.177 ***−0.082 **−0.139 ***
(0.04)(0.04)(0.04)(0.03)(0.04)(0.04)
Time-fixed effectsYESYESYESYESYESYES
City-fixed effectsYESYESYESYESYESYES
Control variableYESYESYESYESYESYES
N1877 159517491724 17351738
The symbols *, **, and *** represent a significance level of 10%, 5%, and 1%, respectively.
Disclaimer/Publisher’s Note: The statements, opinions and data contained in all publications are solely those of the individual author(s) and contributor(s) and not of MDPI and/or the editor(s). MDPI and/or the editor(s) disclaim responsibility for any injury to people or property resulting from any ideas, methods, instructions or products referred to in the content.

